
the Creative Commons Attribution 4.0 License.
the Creative Commons Attribution 4.0 License.
 | 07 Jul 2026
Tracking ionospheric changes during solar eclipses: Concepción historical data
Adán Y. Godoy
Benjamín A. Urra
Carlos A. Castillo-Rivera
Marayén R. Canales
Alberto J. Foppiano
Solar eclipses offer a unique natural experiment to probe ionospheric responses to sudden reductions in solar radiation. This study reports the recovery of historical ionogram records to analyze the ionospheric response to solar eclipses spanning several decades over Concepción (36.79° S, 73.03° W)/Chillán (36.64° S, 71.99° W). Out of 21 identified events between 1958 and 2024, data from 16 (76 %) cases were rescued, many originally on fragile or hazardous 35 mm film, emphasizing the scientific value of long-term datasets. Critical frequencies (foE, foF1, foF2) and virtual heights (h'E, h'F1, h'F/F2) were extracted from digitized and scaled ionograms to quantify eclipse-induced perturbations. Diurnal variations show typical dips in the E- and F1-layer critical frequencies, while F2-layer responses are more complex and variable. Regression analysis was performed exclusively on critical frequencies, revealing a nearly linear decrease of foE and foF1 while the maximum obscuration percentage of the eclipse is higher, whereas inconsistent behavior was observed on foF2. High-cadence observations, available for select events, provided a significantly clearer depiction of the response to the eclipses than 1 h resolution historical data. Only the 2 July 2019 and 14 December 2020 eclipse responses had been previously published. Predictions for the 6 February 2027 eclipse indicate an expected %ΔfoE decrease of ∼ 28 % and a %ΔfoF1 decrease of ∼ 24 % at Chillán, offering a timely opportunity to validate the regression models and assess predictive skill.
- Article
(4785 KB) - Full-text XML
- BibTeX
- EndNote


Solar eclipses offer unique opportunities to understand how the ionosphere reacts when solar radiation is interrupted during daylight conditions. A “small night” generated by a total solar eclipse produces disturbances in the ionosphere, both directly by the suppression of incident radiation or induced by chemical and transport processes. As solar radiation decreases, the electron concentration of the ionospheric layers E and F1, which mainly depend on the production and loss terms, decrease considerably or even disappear throughout the eclipse. Other layers, such as the F2 layer, for which the electron concentration depends significantly on plasma transport by neutral winds and electrodynamics, react with delays and are difficult to predict (Le et al., 2009; Hoque et al., 2016; Zhang et al., 2024). Furthermore, the ionosphere's response depends on regional conditions and external factors such as space weather and lower atmospheric coupling. Additionally, changes in the virtual and real heights of ionospheric layers, such as h'F1, h'F/F2, and hmF2, have been frequently reported, generally showing an upward motion followed by a post-maximum descent as the ionosphere recovers (Le et al., 2008; Chuo, 2013; Zhang et al., 2024).
Historically, from 1920 onward, studies of solar eclipses have progressively revealed how reduced solar radiation affects the ionosphere and its coupled electrodynamic processes (Mitra et al., 1933; Ratcliffe, 1956; Rishbeth, 1968). Early radio observations established solar radiation as the main ionization source and highlighted layer-specific density and plasma transport effects (Higgs, 1942; Evans, 1965a, b). These early eclipse experiments also contributed to the development of ionospheric recombination theories and to the identification of characteristic temporal delays in ionospheric recovery processes. From 1960–2015, hundreds of studies based on observations with instruments such as Very Low Frequency (VLF) receivers, Global Navigation Satellite System (GNSS) arrays, ionosondes, riometers, incoherent scatter radars and Doppler systems have determined eclipse-induced variations in Total Electron Content (TEC), critical frequency (foF2) and height of the maximum electron density of the F2 layer (hmF2), electron temperature, and ion velocities (Cheng et al., 1992; Afraimovich et al., 2002; Jakowski et al., 2008; Le et al., 2008; Momani et al., 2010; Kumar et al., 2013; Pezzopane et al., 2015). These studies have consistently shown that during eclipses there are delayed responses, latitude-dependent effects, and evidence of acoustic gravity waves (AGWs) and traveling ionospheric disturbances (TIDs) associated with eclipse conditions (Cheng et al., 1992; Jakowski et al., 2008; Kumar et al., 2013). In several cases, eclipse-induced perturbations were found to differ substantially between the E, F1, and F2 regions, reflecting the distinct chemical and dynamical processes governing each ionospheric layer. Major events like the 2017 Great American Eclipse provided unprecedented high-resolution data, allowing detailed modeling and confirmation of earlier findings (Huba and Drob, 2017; Reinisch et al., 2018; Lei et al., 2018; Aryal et al., 2019), while recent studies emphasize the role of geomagnetic activity and AGW generation in modulating post-eclipse ionospheric dynamics. Recent studies have also emphasized the importance of combining long-term ionosonde records with modern GNSS observations to better characterize regional ionospheric responses to eclipse forcing. A detailed review of these studies is compiled in Appendix A of Bravo et al. (2020).
Early days determination of ionospheric responses during solar eclipses were made mainly from ionosonde (vertically incidence HF radar) observations. There are long time series of these observations, allowing the study of ionospheric long-term trends. Early works are, for example, those of Smith and King (1981), Bremer (1992), Ortiz de Adler et al. (1997), Jarvis et al. (1998), Foppiano et al. (1999). Later work has been reviewed by Laštovicka et al. (2017), and references therein, and recent progress reported by Laštovička (2023). One of these long-term series also offers a unique dataset to analyze both short-term eclipse-induced ionospheric variations and broader temporal trends in the South American sector (Bravo et al., 2020).
A vast historical record of ionograms is preserved on physical media, the recovery of which is essential for constructing long-term time series. This information is key to conducting long-term trend studies that contribute to a better understanding of the behavior and evolution of the regional ionosphere. Therefore, this work aims to demonstrate the scientific value of rescuing this analog material by digitizing it and correctly extracting the relevant ionospheric parameters.
The purpose of this work is to characterize the response of the Concepción (36.79° S, 73.03° W)/Chillán (36.64° S, 71.99° W) ionosphere under solar eclipse conditions, so that its response can be associated with parameters such as the maximum obscuration level or time of day in order to predict the response for future eclipses.
2.1 Eclipse Event Selection and Station Characteristics
A comprehensive search was conducted to identify all solar eclipse events whose trajectory passed over the ionospheric observation stations in central Chile during the period 1957–2024.
Ionospheric characteristics during these events were selected from the long series of ionosonde records (ionogram) of ionospheric station j3o: Concepción (36.79° S, 73.03° W). The Concepción ionosonde was a C4 type (1–25 MHz range) and associated antennae (crossed deltas), installed in 1957 at the Universidad de Concepción, Andalien campus, by personnel from the National Bureau of Standards (NBS, USA) for the International Geophysical Year (Ramírez, 1963). Later, the ionosonde was moved to the nearby Bellavista campus (less than 2 km), the sweep range modified (0.25–20 MHz) and the antennae improved to make better use of the quiet electromagnetic environment (adjustable folded dipole 0.25 to 3 MHz and log-periodic 3 to 20 MHz). Maintenance difficulties of the antennae lead to a change during 1975 (cross deltas again). The C4 ionosonde operated till 1994 with a transmitted power of approximately 1–5 kW, and employed simple pulse transmissions without signal coding. Ionograms were recorded on 35 mm film. The interpretation and scaling required optical projection on a screen and visual determination of parameters using a manual overlay. The j3o station resumed operation in 1999. An IPS 42 type ionosonde (1–22 MHz) was installed using the existing antennae. Recording was changed from photographic to digital and routine observations were made until 2012, when it was relocated approximately 100 km northeast to Chillán (36.64° S, 71.99° W), renamed as j3p, as part of an instrumentation modernization program (Ovalle et al., 2017). For a short time interval a Canadian Advanced Digital Ionosonde (CADI) was also used. The ionosondes were operated by dedicated academics, supported by electronic engineers and technicians (Muzzioli, 1977; Bravo et al., 2011), providing continuous and high-quality measurements of ionospheric parameters (critical frequencies, virtual heights, etc.). The ionosonde and antennae changes do not preclude standard accuracy of critical frequencies and virtual heights since these parameters are not very system gain sensitive. Both locations share similar geomagnetic latitude characteristics, enabling the construction of a long-term ionospheric database representative of the mid-latitude South American sector.
From the initial catalog of eclipse events identified, we selected those with solar obscuration exceeding 15 % as observed from the station coordinates (21 events). This threshold was established to ensure detectable ionospheric perturbations while maintaining sufficient statistical samples for comparative analysis. Selected events span various phases of the solar cycle and include eclipses with obscuration levels ranging from partial to near-totality, providing a diverse dataset for investigating the relationship between eclipse magnitude and ionospheric response.
2.2 Historical Ionogram Database
Ionospheric observations analyzed in this study comprise a unique historical archive of vertical incidence ionograms recorded between 1958 and 2024. The sounding cadence varied throughout the operational period, with temporal resolutions of 1 h, 30 min, 15 min, 5 min and 1 min, depending on scientific objectives and operational constraints of each campaign period. Higher-cadence observations (1–5 min intervals) were typically implemented during special events, including eclipse campaigns and geomagnetic storm monitoring periods.
The archival records consist primarily of 35 mm photographic film containing ionogram traces acquired by: C4 ionosonde (1957–1994), IPS-42 system which delivered digital ionograms during an intermediate period (1999–2012), CADI for a few days only, and IPS 42 after that. A substantial portion of this historical dataset had not been previously scaled and interpreted or had undergone only partial manual scaling, representing a significant untapped scientific resource for long-term ionospheric studies.
2.3 Data Processing Pipeline
2.3.1 Digitization: SoCIo Software
Ionograms preserved on celluloid film were digitized using an Epson Perfection V600 Photo scanner at 1200 dpi resolution to ensure adequate capture of trace details and frequency-height grid specifications. The digitized images required geometric correction due to perspective distortion, film degradation, and variations in original recording formats across different ionosonde systems.
To address these challenges, we developed the Software de Corrección de Ionogramas (SoCIo; Urra, 2026), a MATLAB-based tool specifically designed for geometric correction and standardization of historical ionogram imagery. SoCIo applies perspective correction algorithms to compensate for scanning distortions, and standardizes image dimensions according to the specific ionosonde system that generated each record. The software includes modules for handling common film deterioration artifacts, including opaque regions, physical damage, and inconsistent image density. This preprocessing step was essential for ensuring accurate subsequent parameter extraction, as uncorrected geometric distortions can introduce systematic errors in frequency and height measurements.
2.3.2 Scaling: DISS Software Enhancement
Following geometric correction, ionospheric parameters were extracted using the Digitized Ionogram Scaling Software (DISS v. 3.0), previously employed in eclipse observation campaigns (Bravo et al., 2020). For the present study, DISS capabilities were substantially enhanced to accommodate the diversity and technical challenges of the historical dataset. Key improvements included: (1) implementation of interactive trace digitization tools enabling manual extraction of frequency-virtual height coordinates from user-drawn traces on the ionogram display, (2) development of selectable region-of-interest functionality to isolate specific ionospheric layers for detailed analysis, (3) incorporation of adjustable frequency and height calibration parameters to fine-tune the pixel-to-physical-unit conversion for each ionogram variant, and (4) integration of quality control modules to identify and flag problematic traces requiring manual review.
These enhancements enabled DISS to handle the heterogeneous characteristics of multi-decade ionosonde observations, including variations in frequency sweep ranges (typically 1–20 MHz with system-dependent upper limits), height display scales (100–500 km, later extended to 1000 km for topside observations), and trace characteristics influenced by film aging and storage conditions.
2.3.3 Parameter Extraction
From each scaled ionogram, we extracted the following standard ionospheric parameters: critical frequencies of the E, F1, and F2 layers (foE, foF1, foF2) and their corresponding virtual heights (h'E, h'F1, h'F/F2), according the rules given by Piggott and Rawer (1972).
2.4 Statistical Analysis and Eclipse Response Quantification
Eclipse-induced ionospheric perturbations were quantified by calculating both absolute and percentage deviations of critical frequencies relative to reference day values at corresponding local times. Absolute deviations were computed as:
where L represents the ionospheric layer (E, F1, F2). Percentage deviations were calculated as:
Reference day values were obtained from hourly monthly median parameters for each eclipse event, selecting the median value across multiple reference days to minimize day-to-day ionospheric variability. These hourly monthly medians had been previously scaled for the World Data Centre. When hourly monthly median values were unavailable, the previous day was used as the reference condition (3 November 1994, 11 September 2007, 13 November 2012, 30 April 2022 and 2 October 2024 solar eclipses). In two particular cases, neither the hourly monthly median values nor the previous day provided suitable reference conditions during the eclipse interval. In these cases, the International Reference Ionosphere (IRI) 2020 model (Bilitza et al., 2022) was used, specifically for foF1 during the 12 November 1966 solar eclipse and for foE during the 14 December 2020 solar eclipse.
When multiple measurements were available during the eclipse period (depending on the operational cadence: 1, 5, 15, 30, or 60 min), we selected the observation closest to the time of maximum obscuration for regression analysis. Linear regression analysis was performed using SciPy's linregress function from stats module (SciPy v1.17.1) to investigate the functional relationship between solar obscuration percentage (independent variable, x) and ionospheric parameter deviations (dependent variable, y). The regression model adopted was:
where m represents the sensitivity of the ionospheric parameter to eclipse magnitude (slope) and b the intercept. The goodness of fit was assessed using the coefficient of determination (r2), computed as:
where yi are observed values, are predicted values from the regression line, and is the mean of observed values. r2 quantifies the proportion of variance in ionospheric response explained by solar obscuration, with values ranging from 0 (no explanatory power) to 1 (perfect prediction). To evaluate the statistical significance of the regression, the p-value associated with the slope of the model will be used, considering a significance level of α=0.05 to reject the null hypothesis of absence of linear dependence.
From the initial catalog of 21 eclipse events identified over the period 1957–2024 (see Table 1), ionosonde records were available for only 16 events (76 %). Among these, we selected events exhibiting clear ionospheric signatures and sufficient data coverage during the eclipse period. Both absolute (MHz) and percentage (%) deviations were analyzed to assess whether normalization by baseline values improved the linearity of the response to the eclipse. The heterogeneous nature of the dataset – comprising observations from three different ionosonde systems (C4, IPS-42, CADI) with varying temporal resolutions – introduces additional variability that may affect correlation strength, particularly for parameters sensitive to instrumental characteristics.
Using the established regression relationships, we computed predicted ionospheric responses for the upcoming 6 February 2027 solar eclipse, during which Chillán is expected to experience approximately 70 % solar obscuration (last row of Table 1). These predictions are indicated by orange star markers in all regression plots, providing quantitative forecasts to support observation campaign planning.
Table 1Timing of selected solar eclipses over Concepción/Chillán (Maximum obscuration >15 %) from 1958 to 2030, including start, maximum, and end times at ground level, according to Eclipse Calculator 2.0 (Masana, 2012). Local time (LT) corresponds to the 75° W meridian. Adjusted F10.7 solar flux values were obtained from the Space Weather Services at Collecte Localisation Satellites (CLS, https://spaceweather.cls.fr/, last access: 5 June 2026).
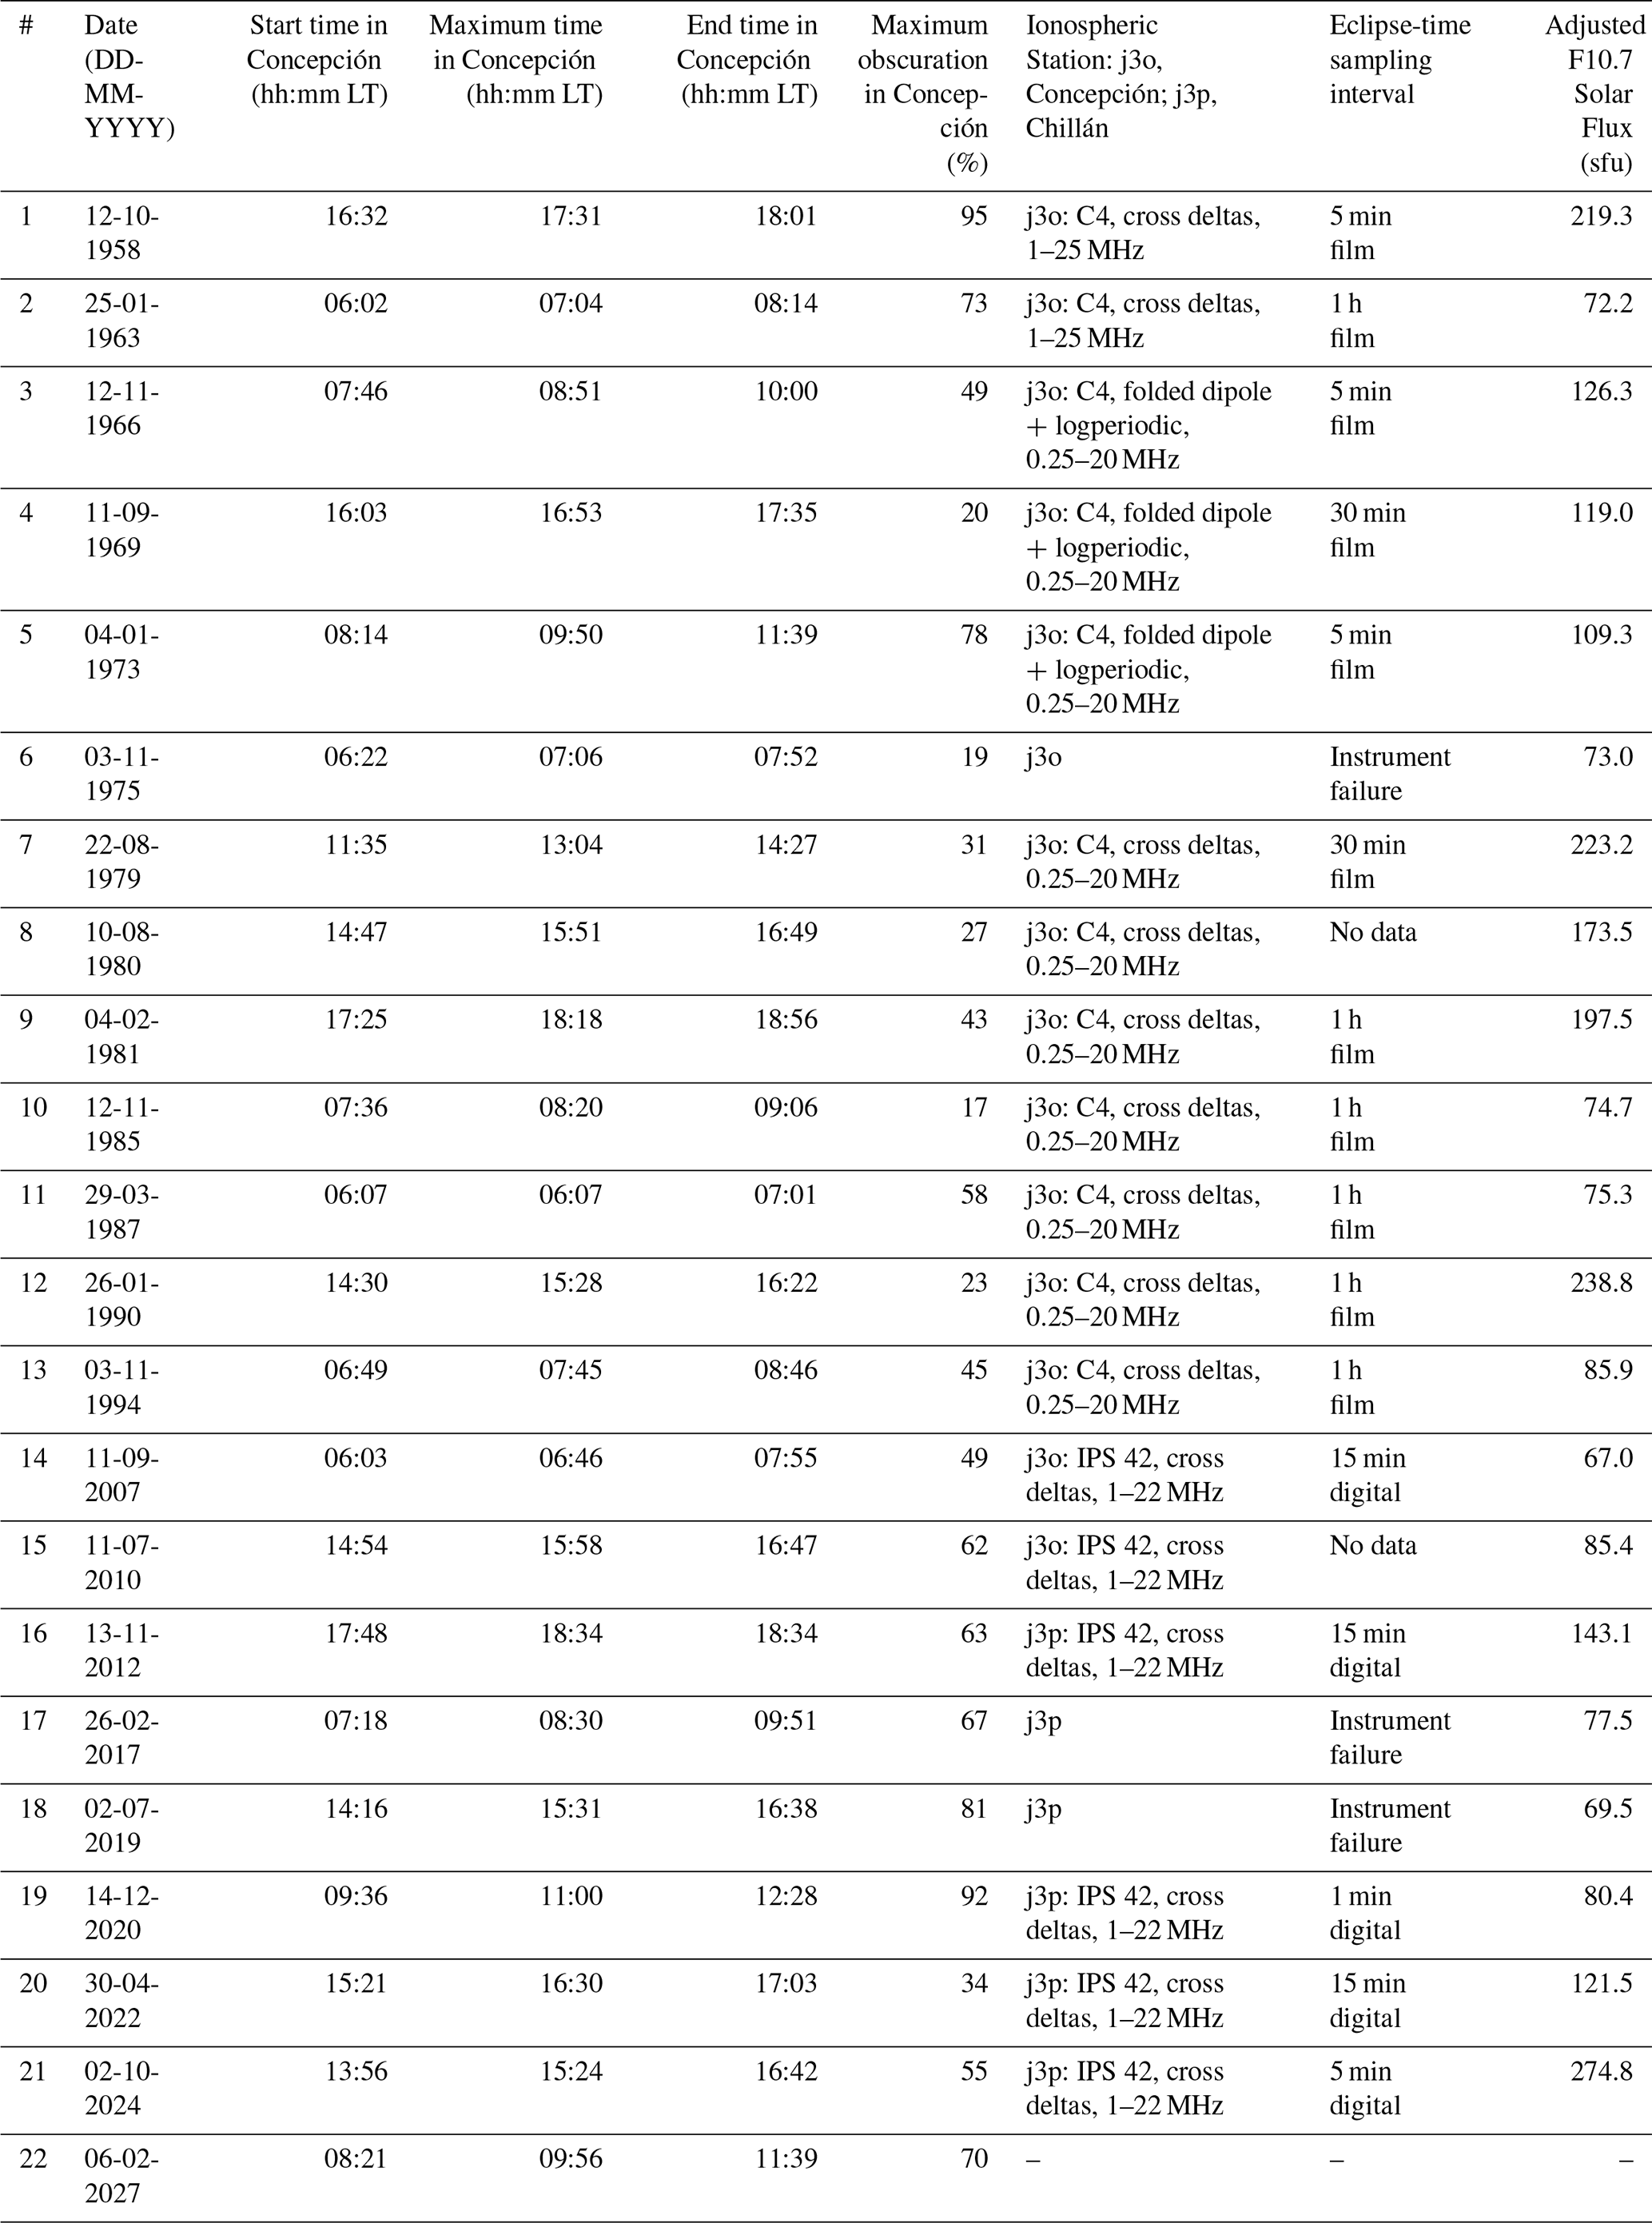
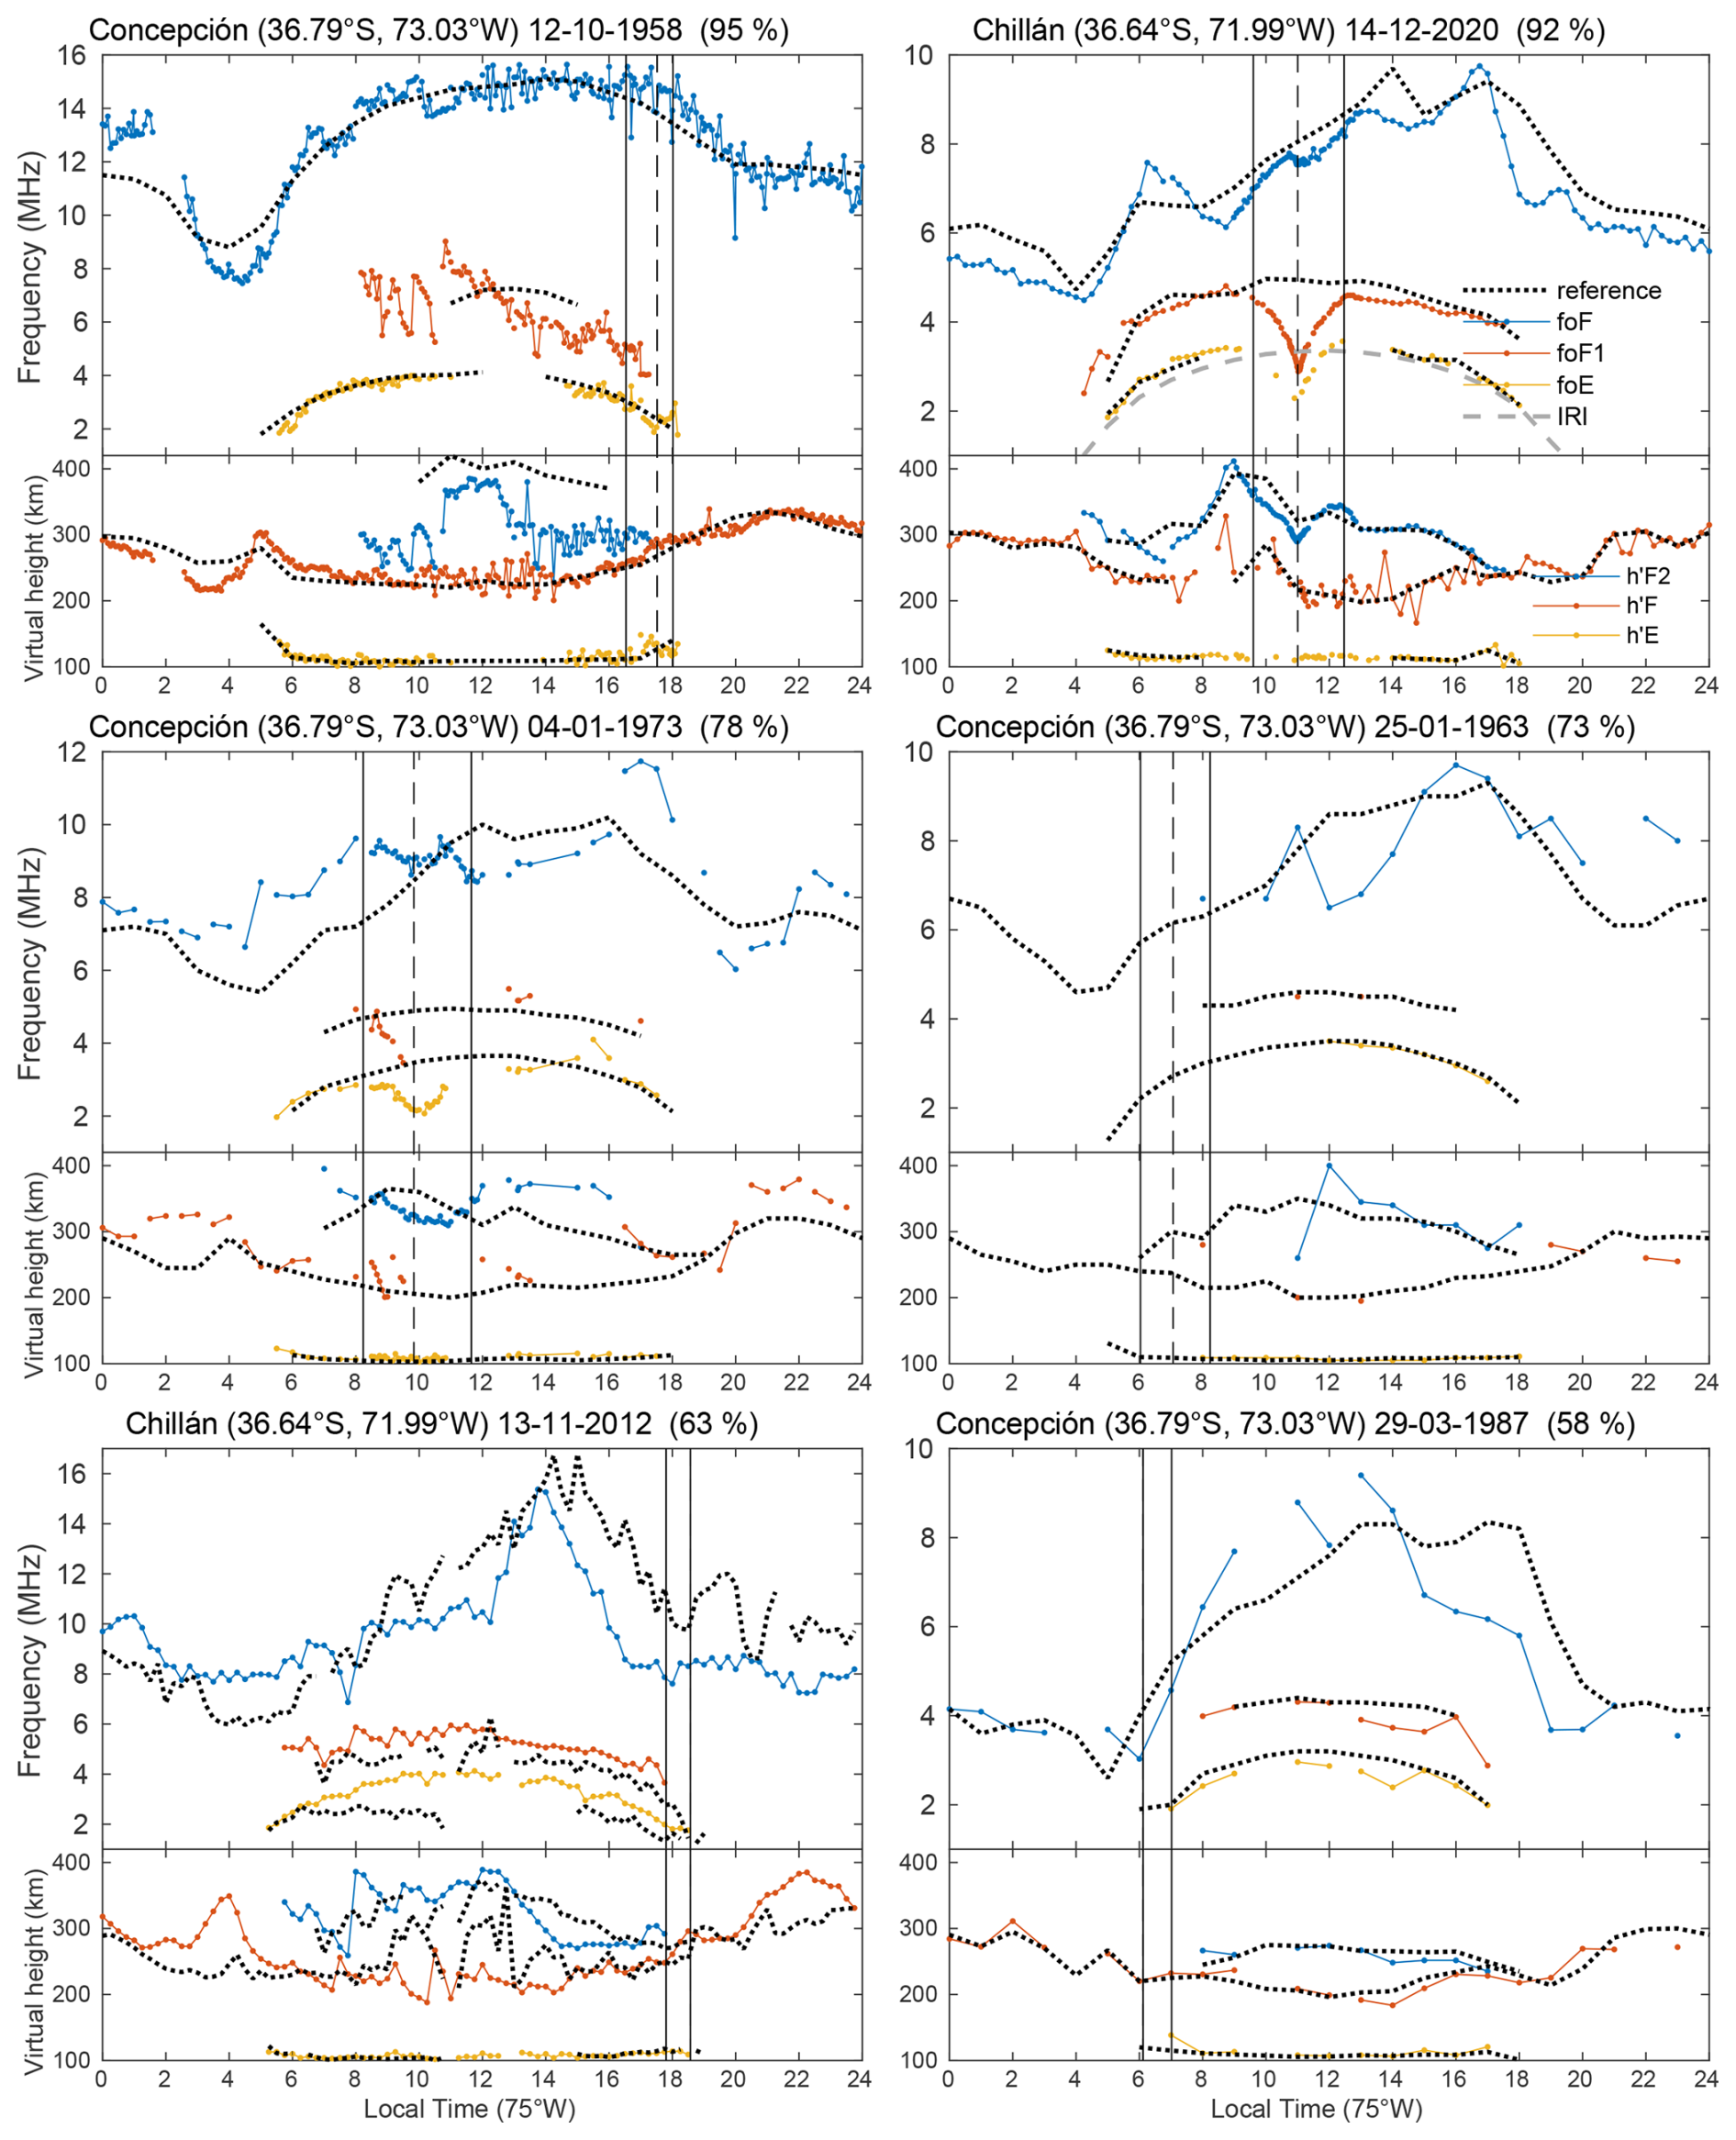
Figure 1Diurnal variation of observed critical frequencies and virtual height (dots) on days of various solar eclipses with obscuration levels greater than 55 % and corresponding monthly median values (dotted line). Dates are given in DD-MM-YYYY format and the maximum obscuration percentage is indicated in parentheses. Continuous vertical lines indicate onset and end of eclipse. The slash vertical line indicates the time of maximum darkness. Note that for eclipses occurring near sunrise (sunset), the time of maximum obscuration may coincide with the beginning (end) of the partial solar eclipse.
The diurnal variations of critical frequencies and virtual heights observed during the days in which the 16 selected eclipses occur are shown in Figs. 1 to 3. Reference curves are also shown for comparison. As already indicated, observed values are given at different time intervals as appropriate to the available ionograms for the different eclipses. Diurnal variations are arranged according to the obscuration level, regardless of the time-of-day, month, year or solar activity epoch.
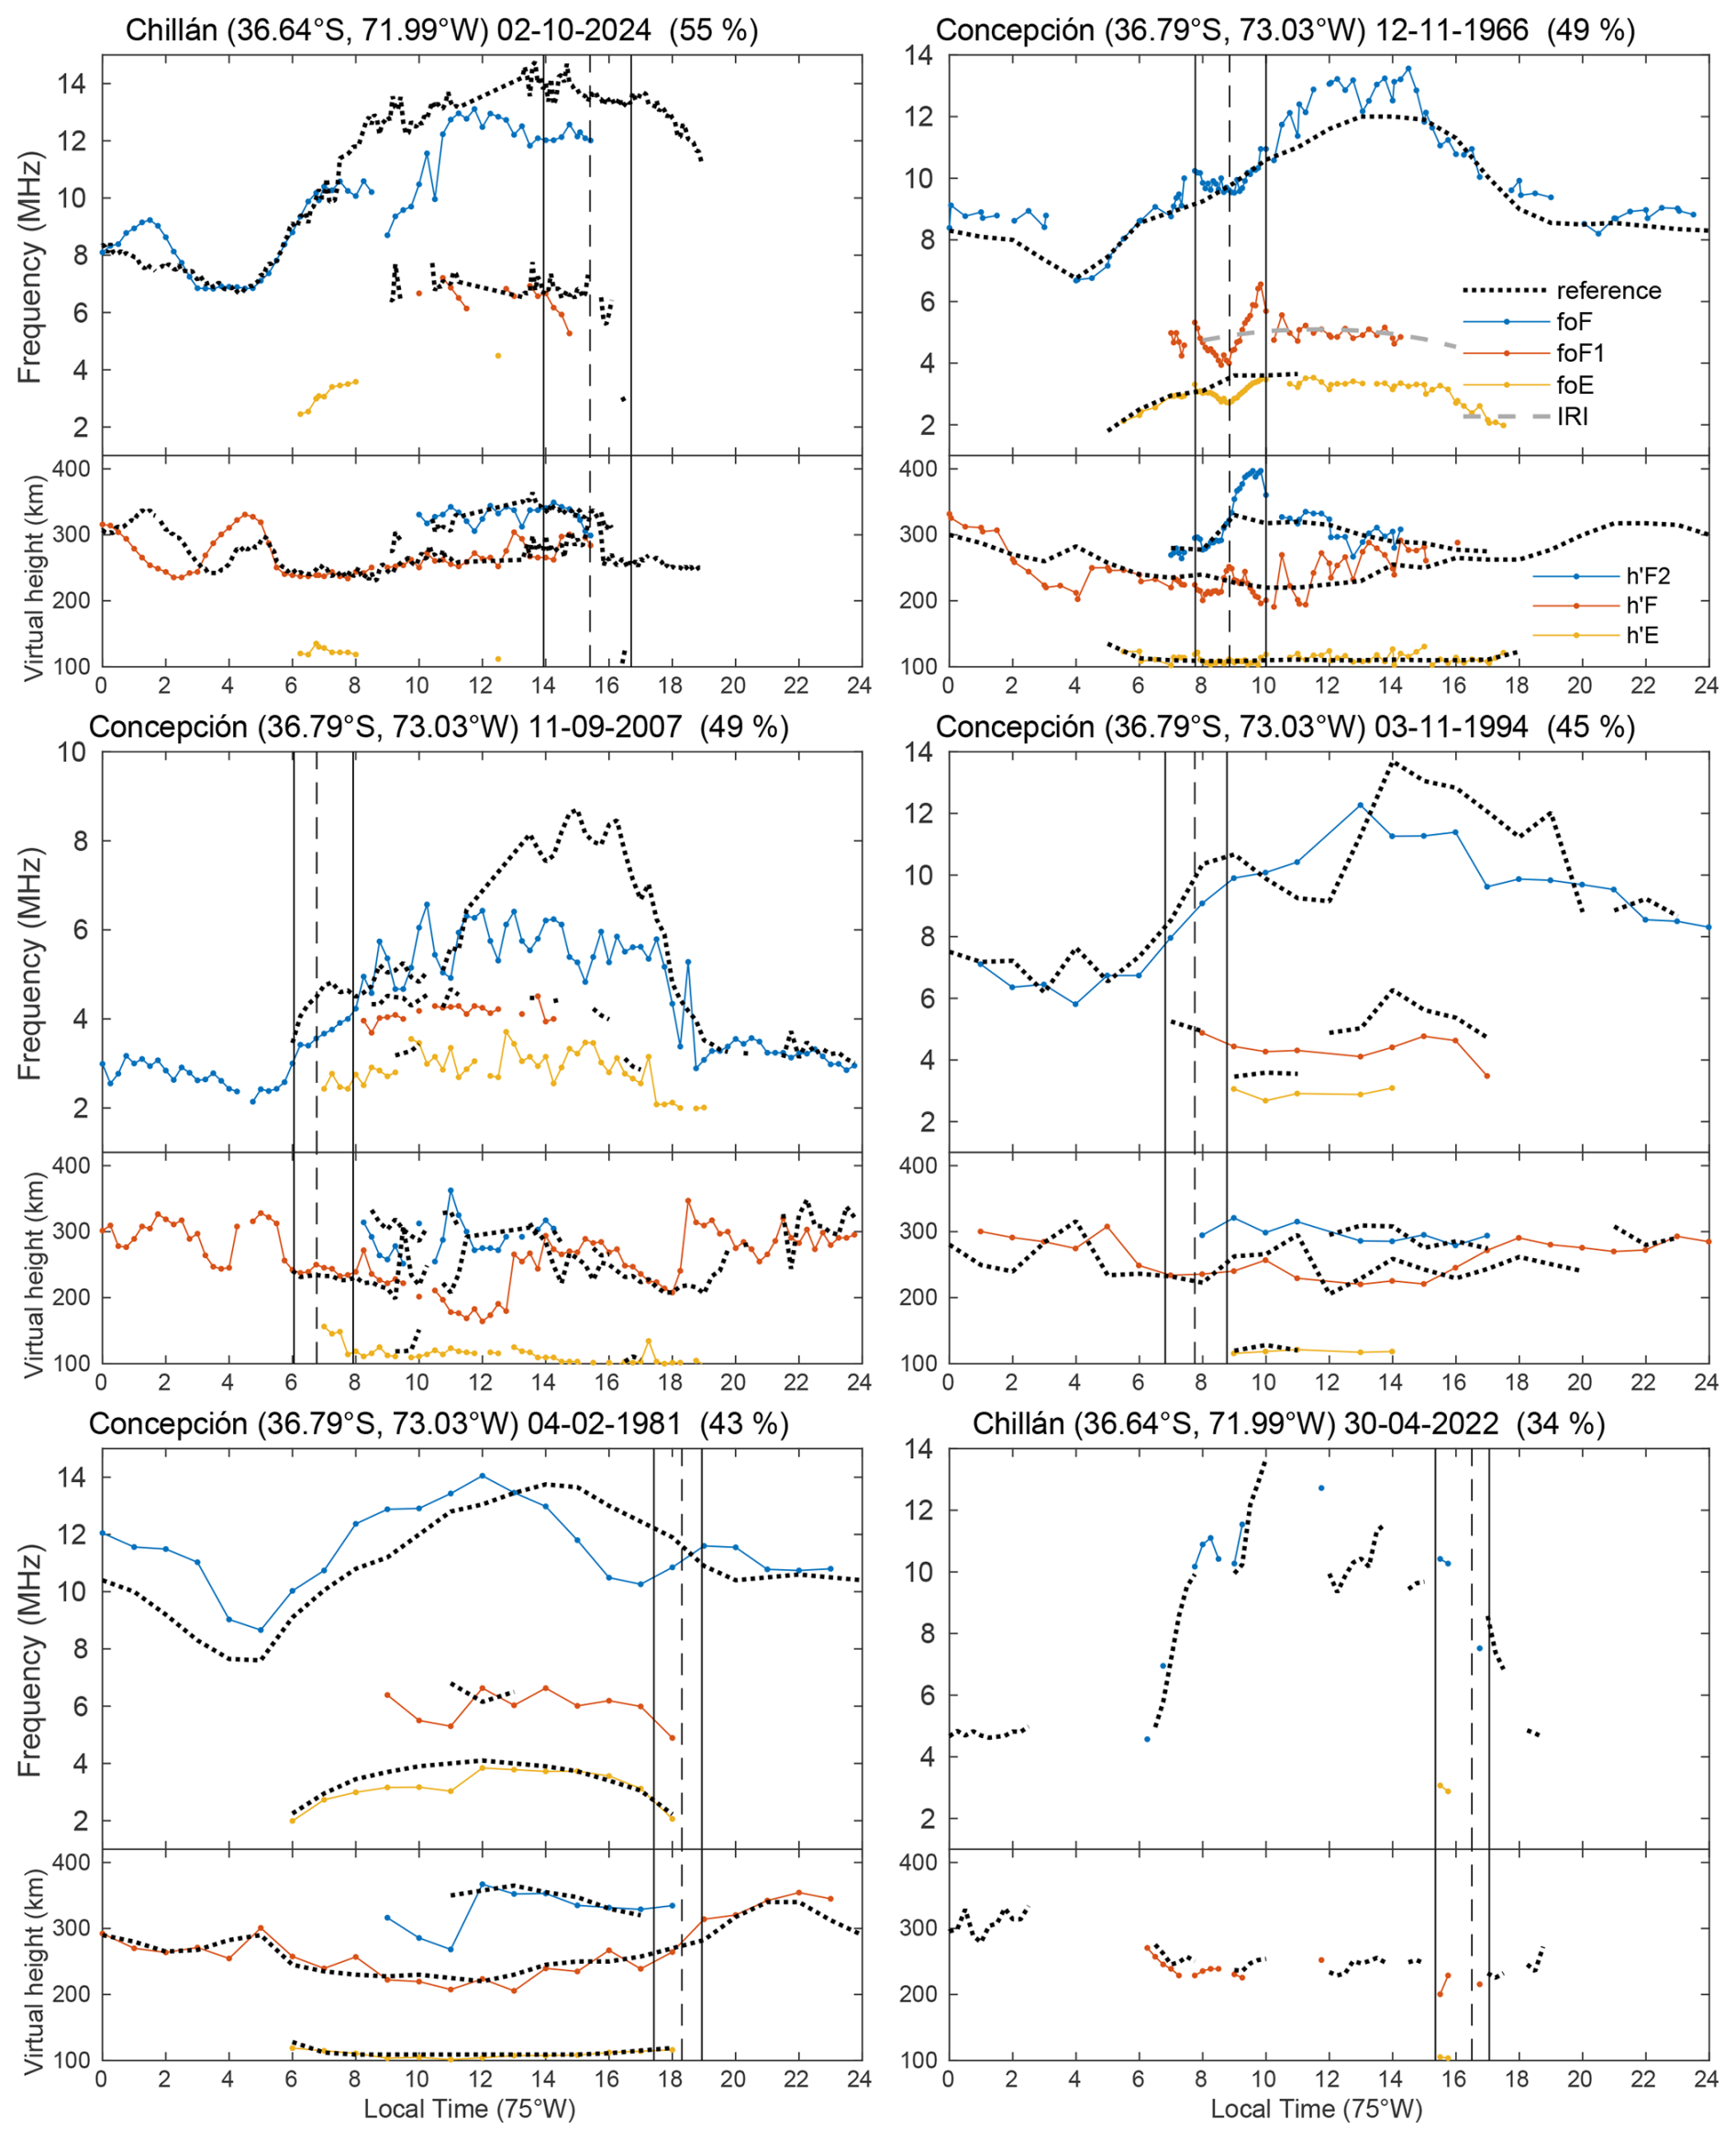
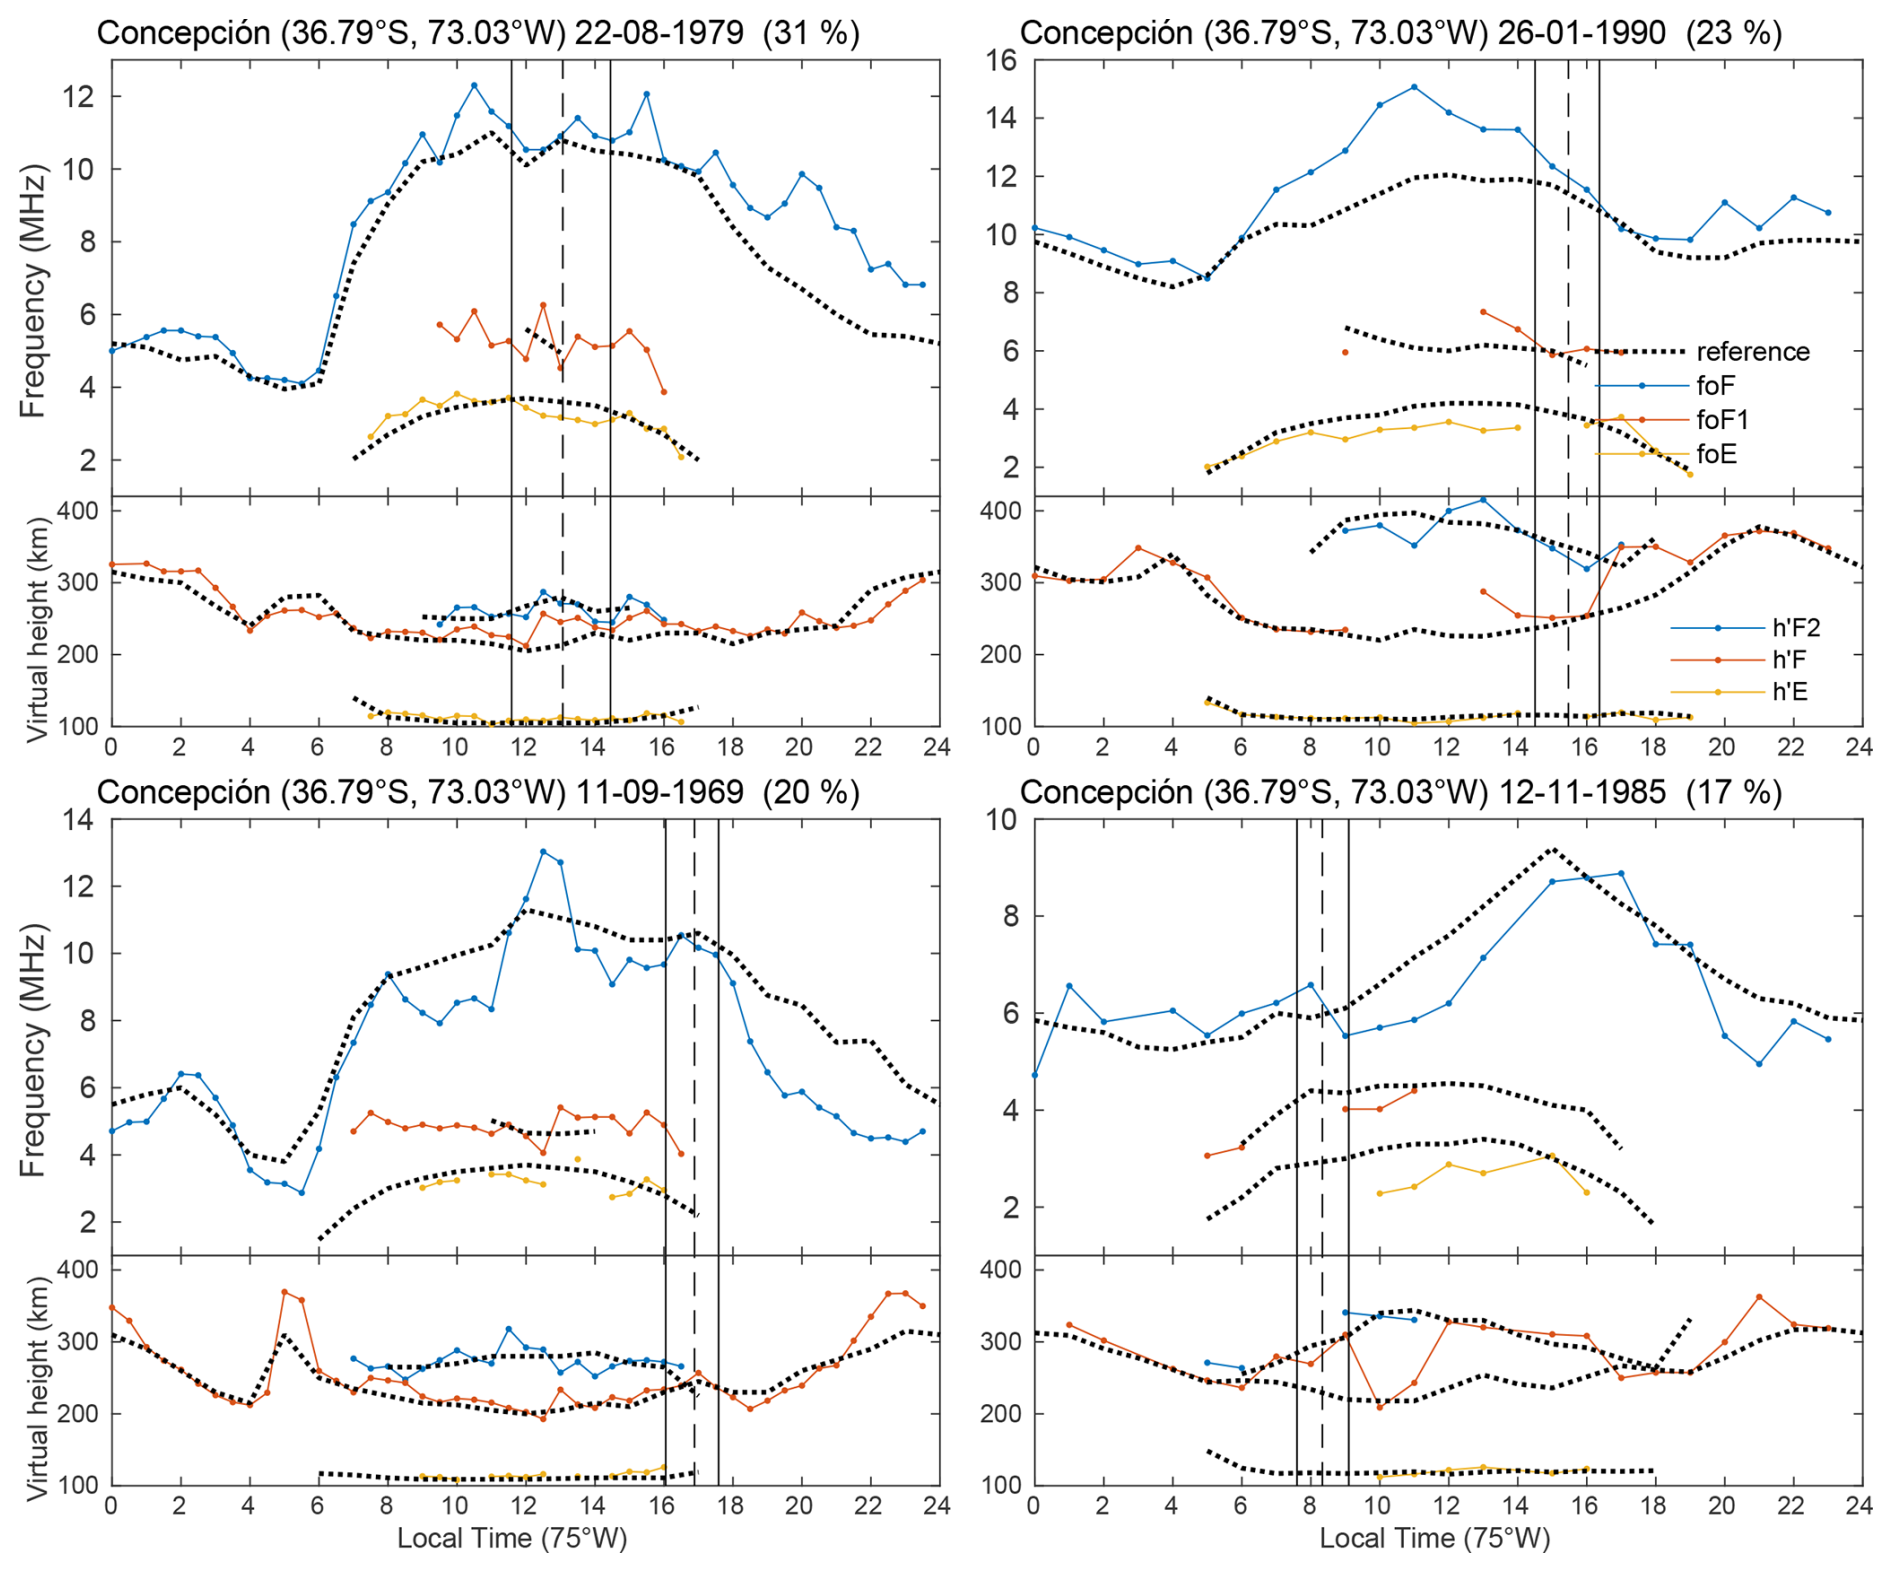
The clearer ionospheric effects of eclipses are seen, as expected, during eclipses occurring just before or around local noon. The maximum level of obscuration ranges from 31 % to 92 % for these eclipses, thus allowing to determine a fairly dependence of ionospheric effects on darkness level. The critical frequencies of the F1 and E layers show a typical dip variation, while the critical frequency of the F2 layer has more complex variations, probably showing two different stages, before and after the maximum darkness level, somehow following the variations of h'F/F2. The E layer virtual height does not seem to significantly change during these eclipses.
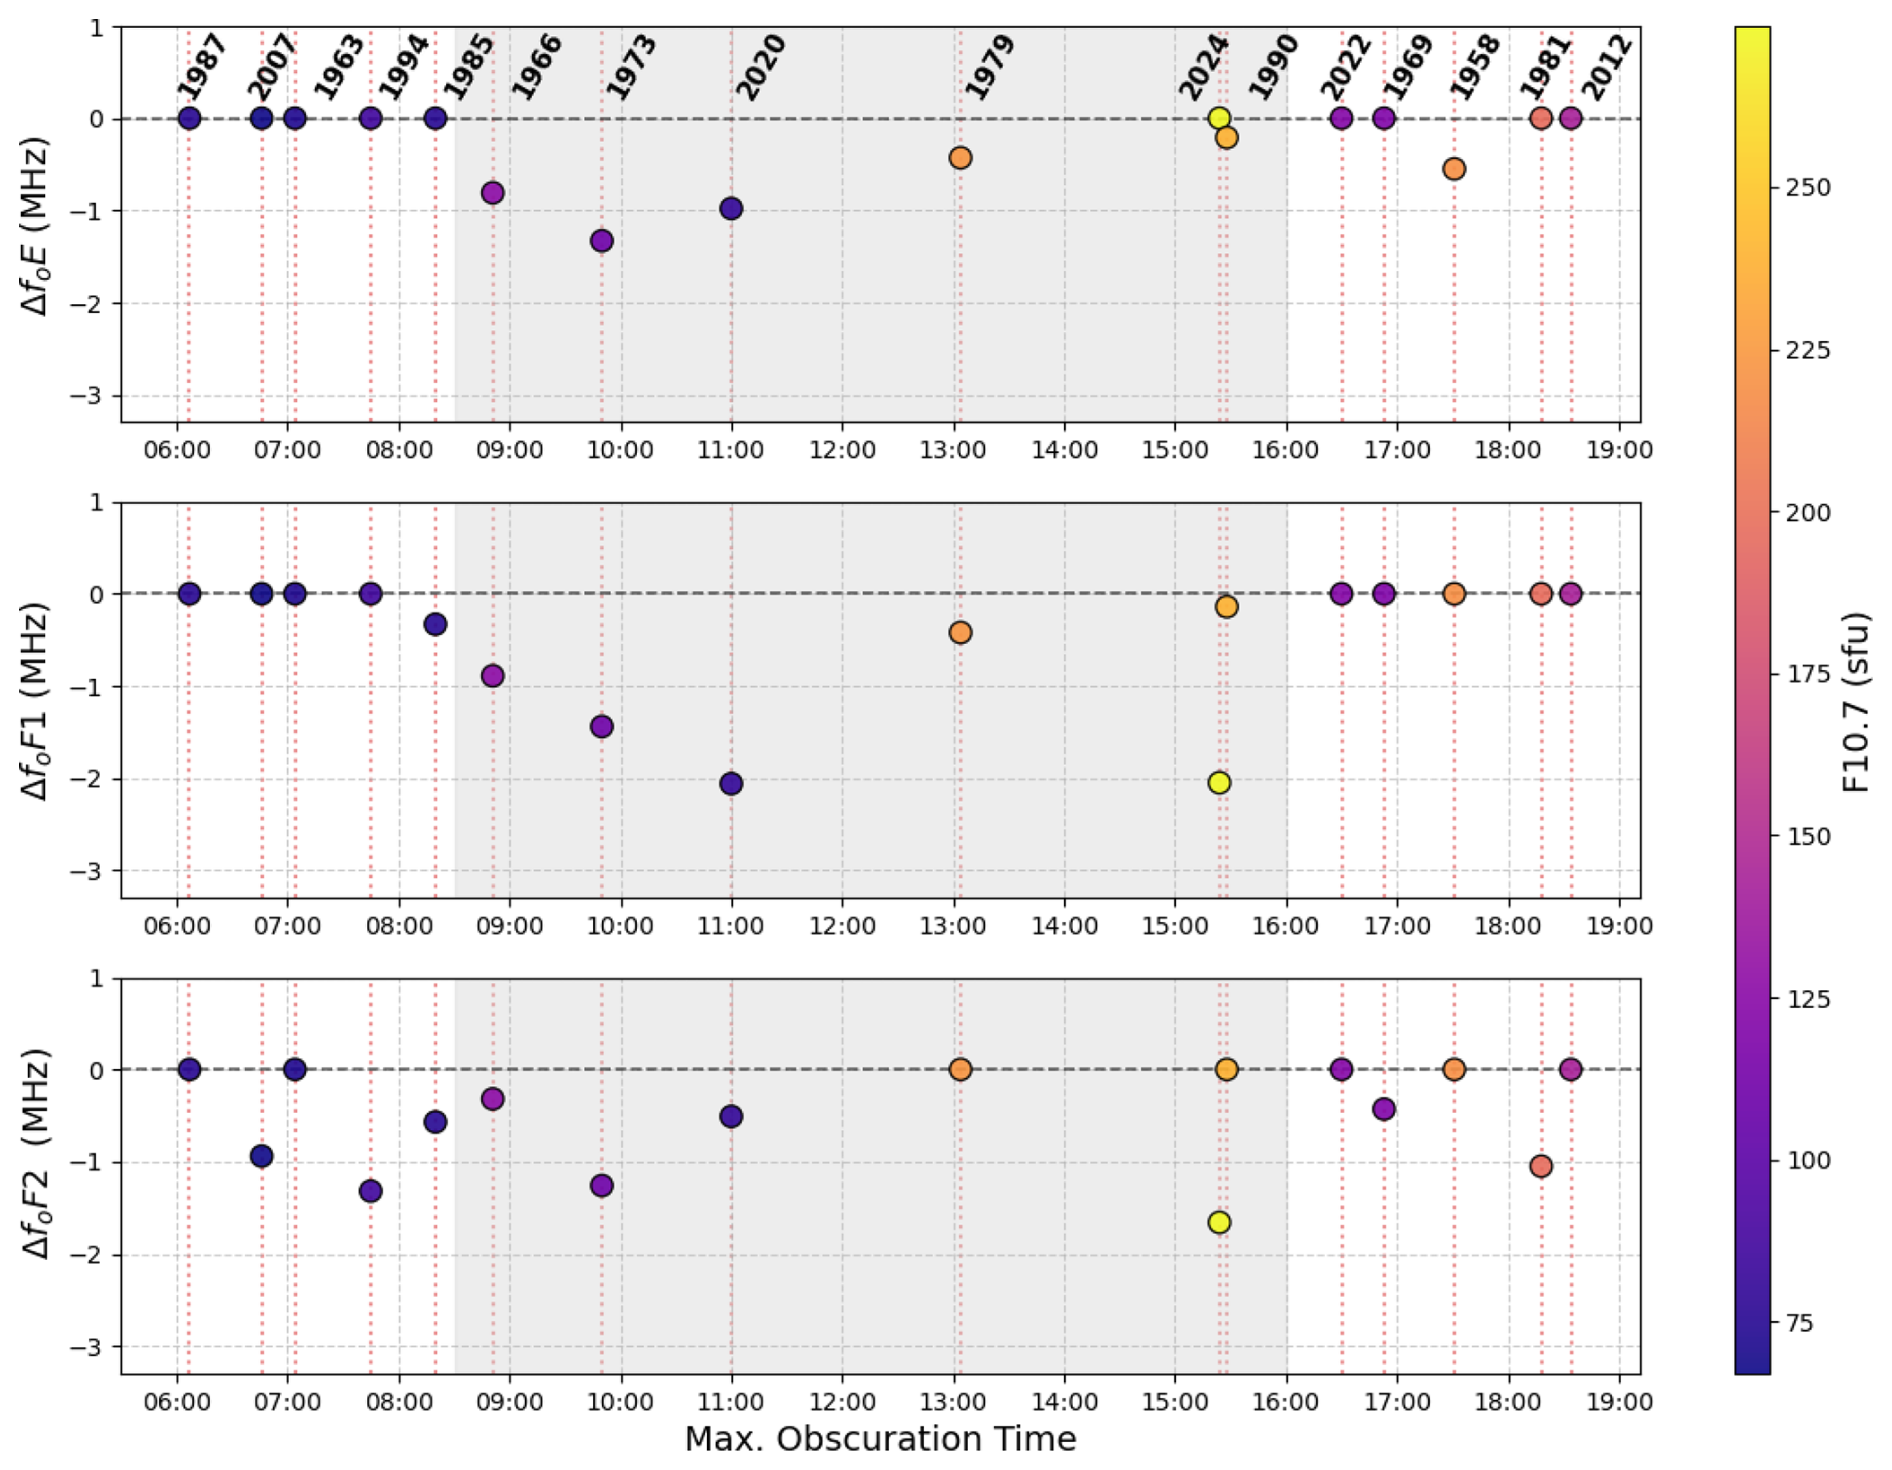
Figure 4foE, foF1, and foF2 deviations at the time of maximum obscuration for the 16 selected events. The shaded (gray) area indicates the time interval in which the selected events are found (08:30–16:00 LT). Colors indicate the adjusted F10.7 solar flux.
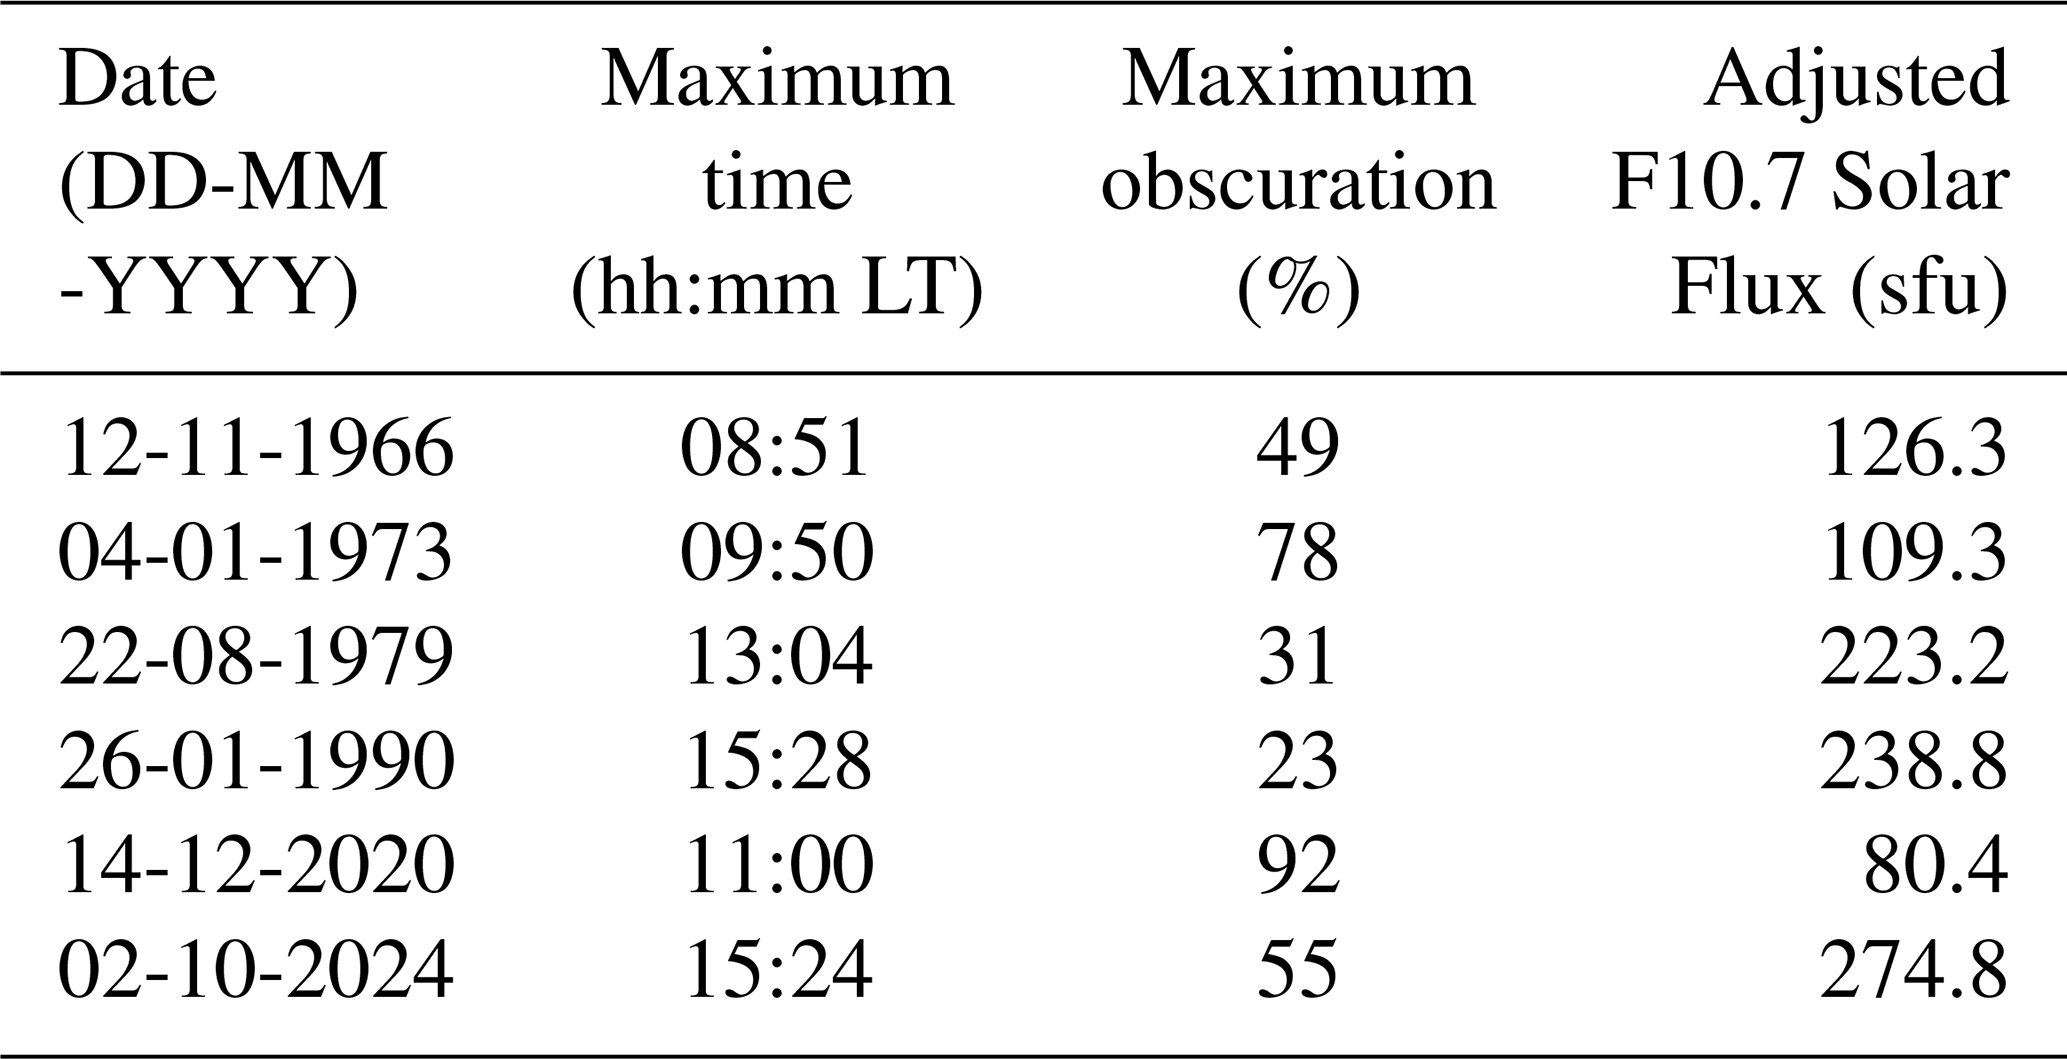
Figure 4 presents the foE, foF1, and foF2 deviations, calculated as the difference between the minimum value observed during the eclipse interval and the corresponding reference value. The adjusted F10.7 solar flux corresponding to each event is indicated by the color scale shown in the right-hand bar. Clearer variations can be identified for foE and foF1 during specific daytime intervals, whereas the foF2 response appears less well defined. To obtain the most suitable set of differences for the linear regression analysis, only eclipse events with maximum obscuration occurring between 08:30 and 16:00 LT (75° W) were selected. These correspond to six events, listed in Table 2. When no differences are observed between the reference curve and the day of the eclipse, or due to a lack of data or other reasons mentioned below, a zero value is recorded for the frequency deviations
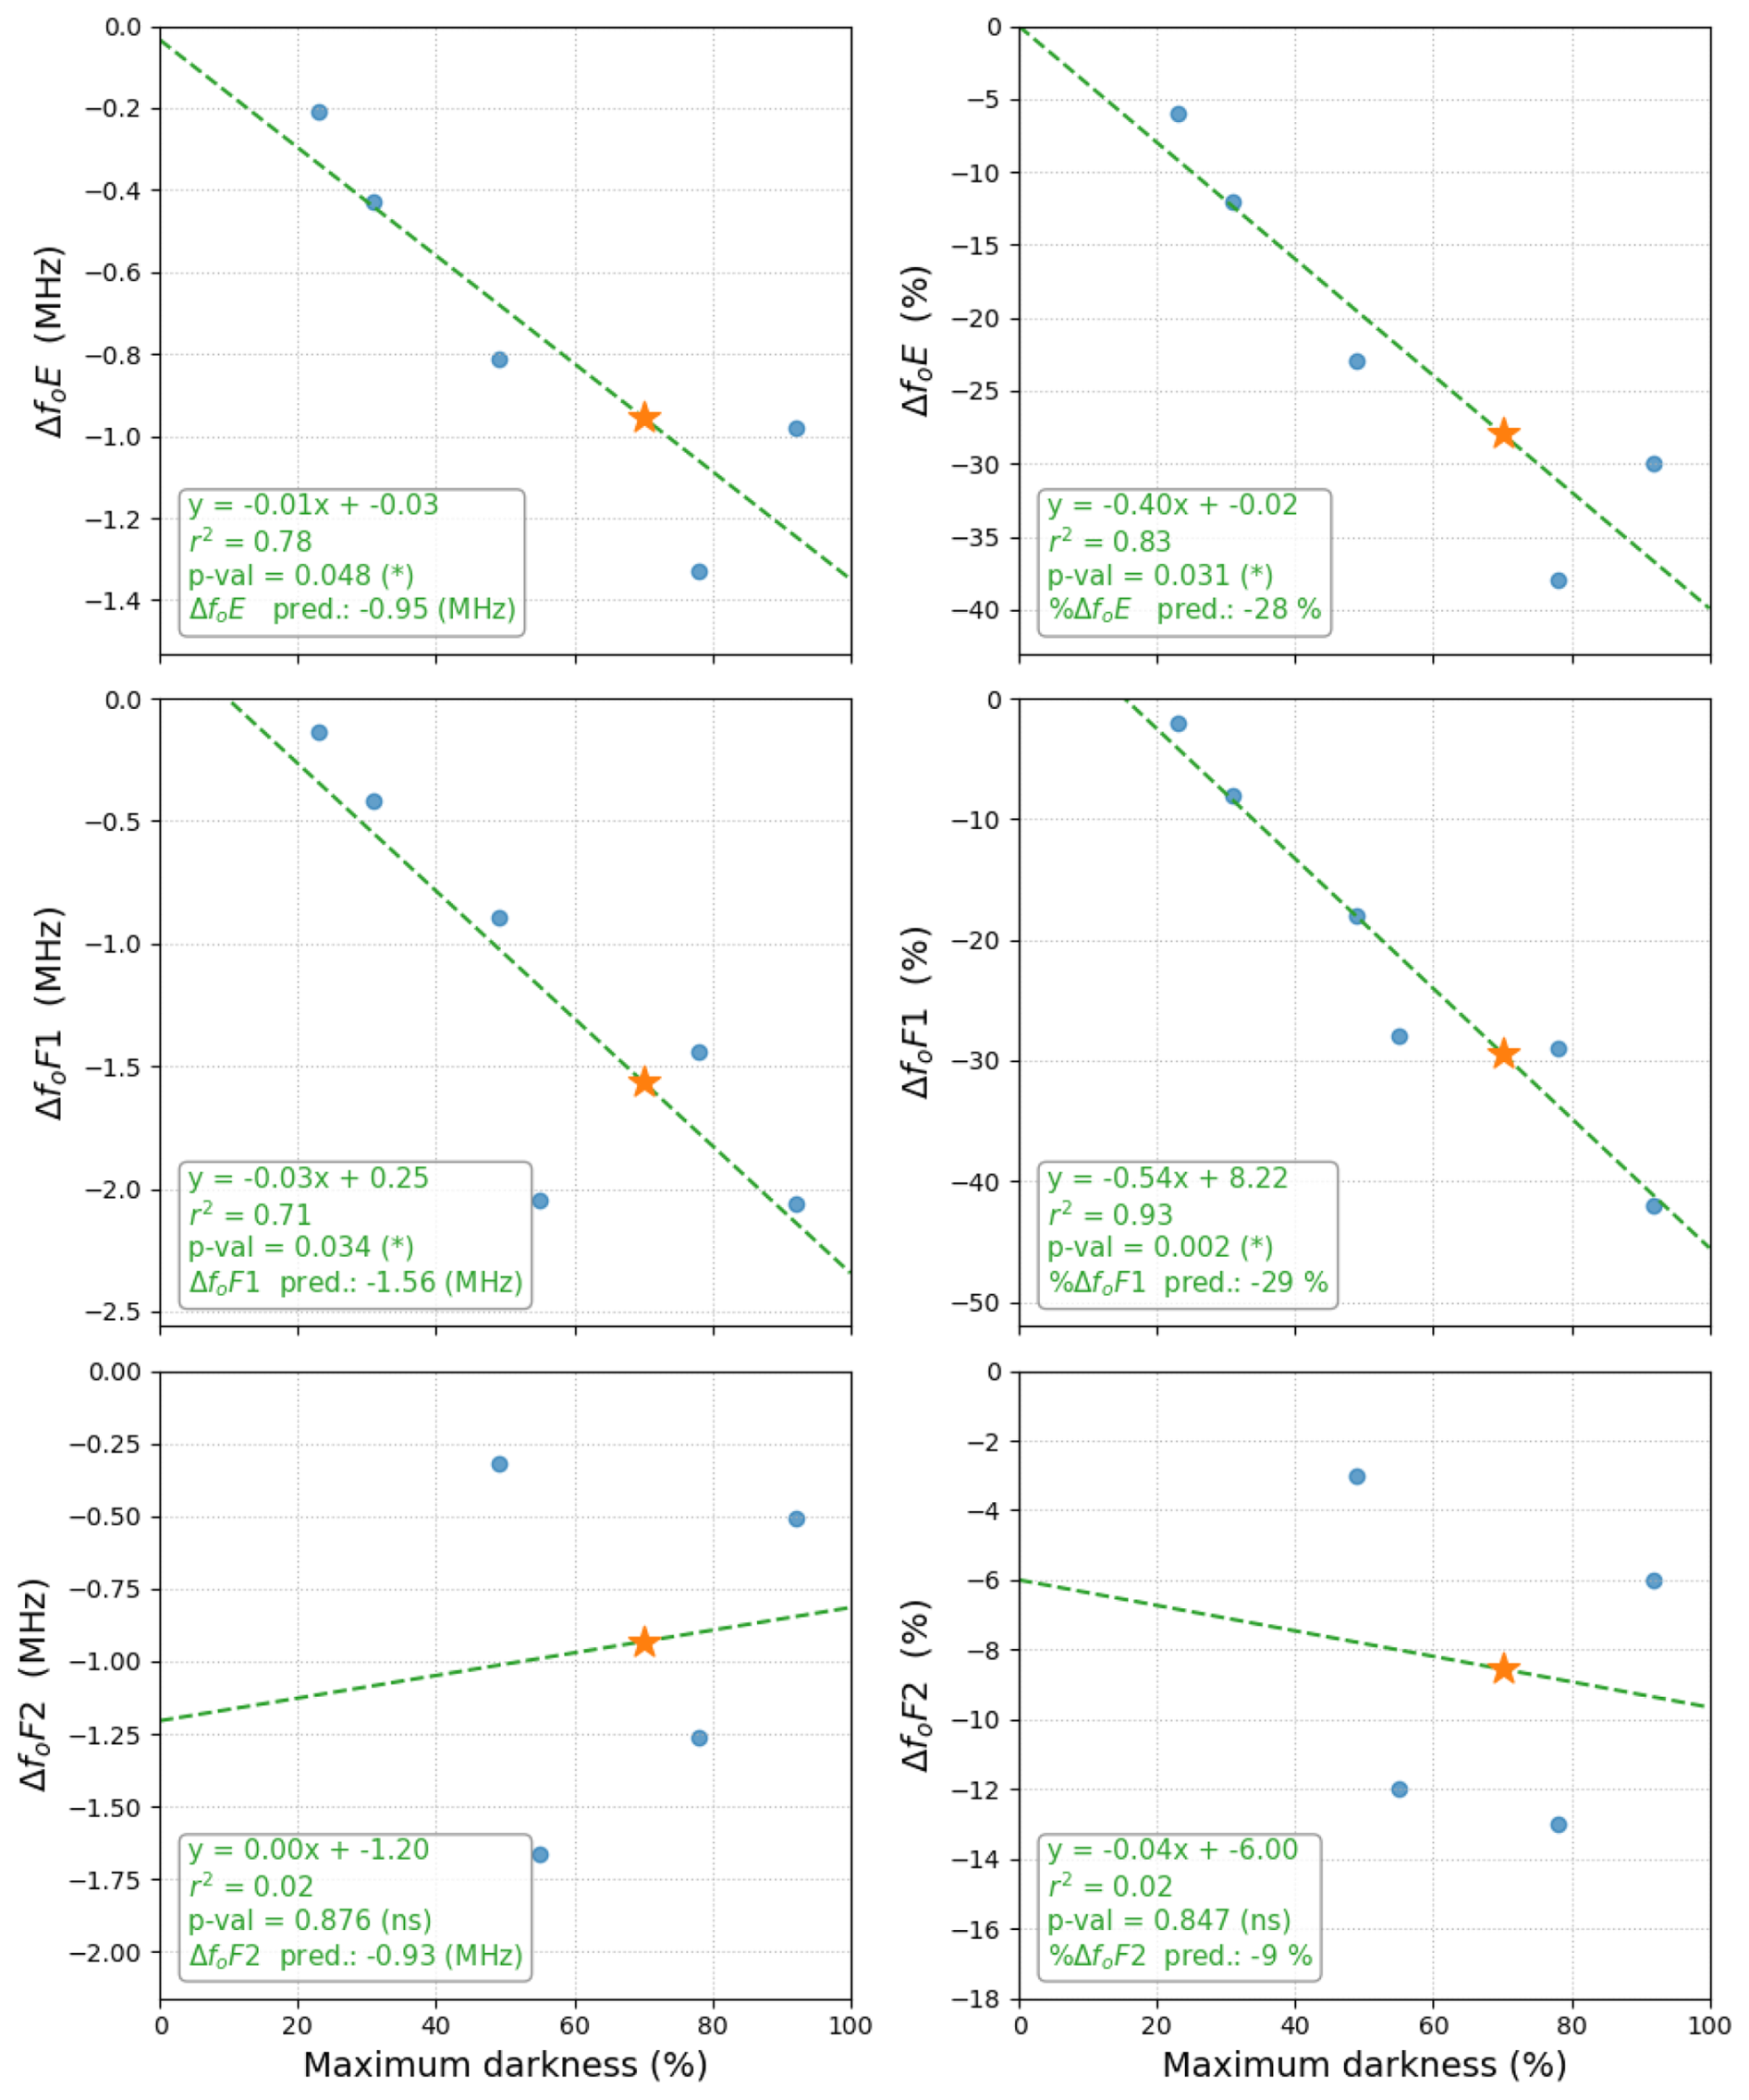
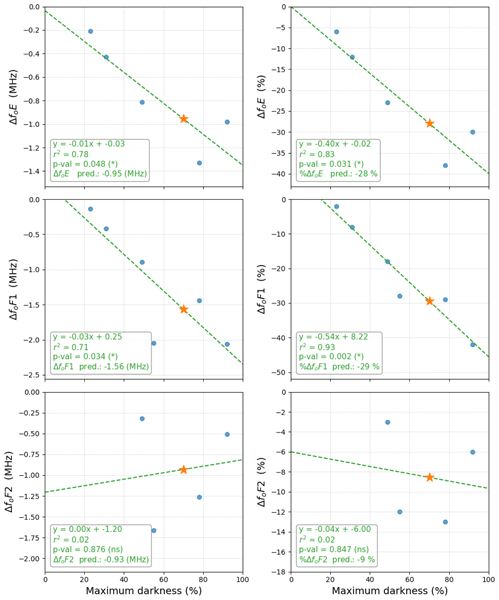
Figure 5Linear regression analysis of ionospheric parameter deviations versus solar obscuration percentage during six eclipse events (1957–2024, blue circles). Left column: absolute frequency deviations (MHz). Right column: percentage deviations (%). Green dashed lines represent least-squares linear fits with equations, r2, p-value and predicted values shown. Orange stars indicate predicted responses for the 6 February 2027 eclipse (70 % obscuration at Chillán).
These six selected events (29 %) exhibited clear ionospheric signatures and sufficient data coverage during the eclipse period for the regression analysis (Fig. 5). The remaining 10 events (48 %) were not considered due to one or more of the following limitations: (1) missing observations during critical eclipse phases (particularly around maximum obscuration), (2) eclipse occurrence near sunrise or sunset when ionospheric conditions are rapidly changing, making it difficult to isolate eclipse effects from diurnal variations, (3) severe film degradation preventing reliable parameter extraction despite multiple scaling attempts, or (4) obscuration levels below the detection threshold for significant ionospheric perturbations. It should be noted that the regression analysis was performed only on critical frequencies and not on virtual heights. Changes in virtual heights (h'E, h'F1, h'F/F2) were observed to be inconsistent – sometimes increasing, sometimes decreasing – making prediction difficult. These variations are likely influenced by additional factors such as neutral winds, plasma transport, and other dynamical processes, which complicate their response to eclipse conditions.
Table 2Selected solar eclipses over Concepción/Chillán used for the linear regression analysis, including maximum obscuration at ground level, according to Eclipse Calculator 2.0 (Masana, 2012). Local time (LT) corresponds to the 75° W meridian. Adjusted F10.7 solar flux values were obtained from the Space Weather Services at Collecte Localisation Satellites (CLS, https://spaceweather.cls.fr/, last access: 5 June 2026).
Analyzing Fig. 5, the E-layer critical frequency (foE) exhibited a robust linear response to solar obscuration, with absolute deviations showing the strongest correlation among all analyzed parameters (r2=0.78, n=5 events, upper left panel). The regression yielded a slope −0.01 of MHz per percent obscuration and an intercept of −0.03 MHz, indicating that foE decreases nearly proportionally to eclipse magnitude. This relationship implies that a hypothetical total eclipse (100 % obscuration) would reduce foE by approximately 1.0 MHz relative to unperturbed reference conditions. The p-value =0.05 is in the limit of the conventional significance threshold (α=0.05), indicating that the relationship is statistically significant (*). In relative terms (%), the relationship is even stronger (r2=0.83, p=0.03).
The high proportion of explained variance (r2=0.78) reflects the rapid photochemical equilibrium characteristic of the E-region, where recombination timescales (20–40 min) are comparable to or shorter than typical eclipse durations. Consequently, E-layer ionization density responds almost instantaneously to variations in solar EUV flux, with minimal influence from dynamic processes such as neutral winds or plasma diffusion that complicate interpretation of higher-altitude layers.
When analysing foF1 response, in MHz values, the fit is linearly significant (r2=0.71, p=0.034), demonstrating a direct dependence on solar obscuration. However, when normalizing the data as a percentage (%), the linear relationship becomes outstanding and exhibits the most robust coupling in the entire study (r2=0.93, p=0.002). This remarkable improvement when using relative values suggests that normalization successfully eliminates the variability of the baseline (seasonal and solar cycle) conditions for each eclipse, revealing that the behavior of the F1 layer is governed almost purely by photochemical control proportional to the radiation loss.
Regarding the response of the F2 layer, there is no evidence of a linear dependence on the darkening. The r2 values are practically zero (0.02) and the p values are extremely high (0.88 and 0.85). This leads to accepting (not rejecting) the null hypothesis: the variation of ΔfoF2 during the analyzed eclipses appears to be dominated by external dynamic factors, such as thermospheric winds or plasma transport, rather than by instantaneous local photoionization.
An additional source of complexity in the observed ionospheric response arises from the varying trajectories of the analyzed solar eclipses. Specifically, eclipse paths that intersect the Equatorial Ionization Anomaly (EIA) region can significantly alter regional electrodynamics rather than just local photochemistry. Obscuration over low latitudes reduces the E-region conductivity, which subsequently weakens the equatorial E × B vertical drift and modulates the equatorial fountain effect (e.g., Bravo et al., 2020). Consequently, this disruption in the poleward plasma transport introduces further variability in the observed foF2 measurements over mid-latitude stations like Concepción/Chillán. For such events, the ionospheric depletion is a complex superimposition of local photochemical loss and altered remote dynamical transport, which may explain the high dispersion observed in the F2-layer data points across different eclipses.
Based on the established relationship, the 6 February 2027 eclipse (70 % obscuration at Chillán) is predicted to induce a foE reduction of 0.95 MHz (orange star, Fig. 5, upper left panel). This forecast will enable direct validation of the regression model and assessment of its predictive skill.
Several campaigns were conducted historically to obtain ionograms at higher temporal resolution during eclipses, with observations every 5 min for significant events. However, most of these high-cadence data were never published. We noted that cases with higher temporal resolution provided a significantly clearer depiction of the ionospheric response to the lunar shadow, whereas 1 h cadence datasets typically captured only one or two measurements during the obscuration period. This difference in temporal resolution may affect the regression analysis, as the exact moment of maximum obscuration is not always captured by the low-cadence measurements.
For the 2 July 2019 solar eclipse, there was a unique opportunity to measure the ionospheric response at two locations in Chile: Chillán (36.64° S, 71.99° W) and La Serena (29.9° S, 71.3° W). However, the ionosonde in Chillán failed during the event, so only the response at La Serena was published (Bravo et al., 2020). One of the analyzed events corresponds to the 14 December 2020 solar eclipse over Chillán, for which ionospheric responses were also studied by de Haro Barbás et al. (2022). Their results included calculations of the alpha and beta recombination coefficients, which were found to be consistent with values reported by previous authors, confirming the reliability of the ionospheric observations in this region. Furthermore, prior to the 2020 eclipse, a prediction of the ionospheric response over the Chillán station had been performed using the SUPIM-INPE model, estimating the expected variations in the different ionospheric layers during the event (Martínez-Ledesma et al., 2020). This prediction was later validated using the observed ionospheric data, as reported in Bravo et al. (2022), showing good agreement between the modeled and measured responses.
It is important to highlight the dedicated effort of ionosonde operators and technicians, particularly during the 1958–1994 period, who ensured continuous monitoring and undertook the considerable effort of recording frequent ionograms during eclipses. Recovering historical data from analog ionograms stored unprocessed for decades presents a significant methodological and technical challenge. The first obstacle lies in the state of preservation of the physical medium (typically film reels), whose natural degradation necessitates an extremely rigorous scanning process to preserve information and capture optimal contrast without damaging the medium. Subsequently, the workflow requires digital clipping to extract and isolate each ionogram from the continuous record, a task that involves meticulously correcting optical and non-linear distortions along the frequency and virtual height axes. Finally, parameter extraction is extremely complex: although scaling systems (such as DISS software) are used, internal imperfections in the old recording – such as high background noise, physical rays on the film, and diffuse traces – severely limit the effectiveness of modern pattern recognition algorithms. Consequently, the software often requires constant and thorough manual intervention by an expert operator to validate, correct, or redraw the traces, making the recovery of these time series a highly labor-intensive task.
The present study relied on a historical dataset that represents a significant rescue of scientific heritage. Many records were on obsolete 35 mm film, degraded, or even potentially flammable, and have now been digitized and standardized for analysis. Similar conditions exist at other older ionospheric stations, emphasizing the importance of preserving long-term ionospheric observations and fully exploiting their scientific value.
This work analyzed the response of the Concepción/Chillán ionosphere to six selected solar eclipses, out of a total of 21 identified events (29 %) over the period 1958–2024, using a long-term historical ionogram dataset. Critical frequencies and virtual heights were extracted from scaled ionograms, and regression analysis was performed to quantify the relationship between solar obscuration and ionospheric parameter deviations. The study demonstrates that the E and F1 layers respond nearly linearly to eclipse-induced reductions in solar radiation, while higher layers, particularly the F2 layer, exhibit more complex and variable behavior due to additional dynamical processes. High-resolution observations, when available, provided insights into short-term responses and enabled predictions for future eclipses.
Regression analysis focused exclusively on critical frequencies, as virtual heights often exhibited inconsistent behavior, reflecting the influence of neutral winds, plasma transport, and other dynamical factors that complicate their interpretation. It is important to note that only the ionospheric responses measured at Chillán during the 2 July 2019 and 14 December 2020 eclipses were published; no data from the remaining eclipse events have been published. The success of this study relied heavily on the dedication of ionosonde operators and technicians, particularly during the 1958–1994 period, who ensured frequent and reliable observations during solar eclipses. Moreover, this work represents a significant rescue of scientific heritage, digitizing and standardizing records that were previously on fragile or potentially hazardous 35 mm film. Recovering decades-old analog ionogram data presents major technical challenges across three stages: (1) carefully scanning fragile, degrading film reels; (2) digitally clipping and correcting non-linear distortions on the axes; and (3) scaling the parameters, where heavy background noise and film damage severely limit semi-automatic software (like DISS), requiring constant, labor-intensive manual corrections by experts. Preserving and exploiting these long-term datasets is crucial for advancing the understanding of ionospheric dynamics.
Predictions for the upcoming 6 February 2027 eclipse, with an expected 70 % obscuration at Chillán, indicate a foE and foF1 decrease of 0.95 MHz (%ΔfoE =28 %) and 1.56 MHz (%ΔfoF1 =29 %), respectively, providing a clear opportunity to validate the regression models and assess their predictive skill across different solar cycle conditions.
Adjusted F10.7 solar flux values were obtained from the Space Weather Services at Collecte Localisation Satellites (CLS, https://spaceweather.cls.fr/, last access: 5 June 2026). The SoCIo code is available at https://github.com/BenjaUP-coding/SoCIo. The Eclipse Calculator 2.0 application (Masana, 2012) can be found at https://serviastro.ub.edu/en/materials/apps/eclipsi-20 (last access: 5 June 2026). Historical scaled ionospheric data during solar eclipse events are currently available at https://l1nk.dev/hklvhci (last access: 19 June 2026).
AYG: writing (original draft preparation) and data curation; MAB: Conceptualization, writing (original draft preparation) and formal analysis; CAC-R: data curation; MRC: data curation; BAU: methodology and data curation; AJF: supervision and validation.
At least one of the (co-)authors is a guest member of the editorial board of Annales Geophysicae for the special issue “Atmospheric responses to total and annular solar eclipses”. The peer-review process was guided by an independent editor, and the authors also have no other competing interests to declare.
Publisher's note: Copernicus Publications remains neutral with regard to jurisdictional claims made in the text, published maps, institutional affiliations, or any other geographical representation in this paper. The authors bear the ultimate responsibility for providing appropriate place names. Views expressed in the text are those of the authors and do not necessarily reflect the views of the publisher.
This article is part of the special issue “Atmospheric responses to total and annular solar eclipses”. It is not associated with a conference.
We are indebted to the engineers and technicians who operated the C4 and IPSS-42 ionosondes from 1957 onwards; without their work, this report would not have been possible. In particular, we thank Carlos Figueroa, Herwing Herrera, José Rivera, Avelino Sáez, and others. The authors acknowledge the assistance of Sider.ai in the translation and preliminary review of the manuscript draft, with the subsequent and exhaustive manual scientific validation.
This work was supported by the Universidad Adventista de Chile, regular projects PI-175 and PI-204. Manuel A. Bravo and Benjamín A. Urra acknowledge the ANID/SUBDIRECCIÓN DE INVESTIGACIÓN APLICADA ID25I10556. Manuel A. Bravo also acknowledge the ANID/FONDECYT Iniciación 11261653.
This paper was edited by Geeta Vichare and reviewed by two anonymous referees.
Afraimovich, E. L., Kosogorov, E. A., and Lesyuta, O. S.: Effects of the August 11, 1999 total solar eclipse as deduced from total electron content measurements at the GPS network, J. Atmos. Sol.-Terr. Phy., 64, 1933–1941, https://doi.org/10.1016/s1364-6826(02)00221-3, 2002.
Aryal, S., Geddes, G., Fin, S. C., Mrak, S., Galkin, I., Cnossen, I., Cook, T., and Chakrabarti, S.: Multi-spectral and multi instrument observation of TIDs following the Total Solar Eclipse of August 21, J. Geophys. Res.-Space, 124, 3761–3774, https://doi.org/10.1029/2018JA026333, 2019.
Bilitza, D., Pezzopane, M., Truhlik, V., Altadill, D., Reinisch, B. W., and Pignalberi, A.: The International Reference Ionosphere model: A review and description of an ionospheric benchmark, Rev. Geophys., 60, e2022RG000792, https://doi.org/10.1029/2022RG000792, 2022.
Bravo, M. A., Foppiano, A. J., and Abarca del Río, R.: Long-Term Dependencies of Annual and Semiannual Components of NmF2 Over Concepción, Open Atmospheric Science Journal, 5, 2–8, https://doi.org/10.2174/1874282301105010002, 2011.
Bravo, M., Martínez-Ledesma, M., Foppiano, A., Urra, B., Ovalle, E., Villalobos, C., Souza, J., Carrasco, E., Muñoz, P., Tamblay, L., Vega-Jorquera, P., Marín, J., Pacheco, R., Rojo, E., Leiva, R., and Stepanova, M.: First report of an eclipse from Chilean ionosonde observations: comparison with total electron content estimations and the modeled maximum electron concentration and its height, J. Geophys. Res.-Space, 125, e2020JA027923, https://doi.org/10.1029/2020JA027923, 2020.
Bravo, M. A., Molina, M. G., Martínez-Ledesma, M., de Haro Barbás, B., Urra, B., Elías, A., Souza, J., Villalobos, C., Namour, J. H., Ovalle, E., Venchiarutti, J. V., Blunier, S., Valdés-Abreu, J. C., Guillermo, E., Rojo, E., de Pasquale, L., Carrasco, E., Leiva, R., Castillo Rivera, C., Foppiano, A., Milla, M., Muñoz, P. R., Stepanova, M., Valdivia, J. A., and Cabrera, M.: Ionospheric response modeling under eclipse conditions: Evaluation of 14 December 2020, total solar eclipse prediction over the South American sector, Front. Astron. Space Sci., 9, https://doi.org/10.3389/fspas.2022.1021910, 2022.
Bremer, J.: Ionospheric trends in mid-latitudes as a possible indicator of the atmospheric greenhouse effect, J. Atmos. Terr. Phys., 54, 1505–1511, 1992.
Cheng, K. H., Huang, Y. N., and Chen, S. W.: Ionospheric effects of the solar eclipse of September 23, 1987, around the equatorial anomaly crest region, J. Geophys. Res., 97, 103–111, https://doi.org/10.1029/91JA02409, 1992.
Chuo, Y. J.: Ionospheric effects on the F region during the sunrise for the annular solar eclipse over Taiwan on 21 May 2012, Ann. Geophys., 31, 1891–1898, https://doi.org/10.5194/angeo-31-1891-2013, 2013.
de Haro Barbás, B. F., Bravo, M., Elias, A. G., Martínez-Ledesma, M., Molina, G., Urra, B., Venchiarutti, J. V., Villalobos, C., Namour, J. H., Ovalle, E., Guillermo, E. D., Carrasco, E., de Pasquale, G., Rojo, E., and Leiva, R.: Longitudinal variations of ionospheric parameters near totality during the eclipse of December 14, 2020, Adv. Space Res., https://doi.org/10.1016/j.asr.2021.12.026, 2022.
Evans, J. V.: An F-region eclipse, J. Geophys. Res., 70, 131–142, https://doi.org/10.1029/JZ070i001p00131, 1965a.
Evans, J. V.: On the behavior of foF2 during solar eclipses, J. Geophys. Res., 70, 733–738, https://doi.org/10.1029/JZ070i003p00733, 1965b.
Foppiano, A. J., Cid, L., and Jara, V.:, Ionospheric long-term trends in South American mid-latitudes, J. Atmos. Sol.-Terr. Phy., 61, 717–723, 1999.
Higgs, A. J.: Ionospheric measurements made during the total solar eclipse of 1940 October 1, Mon. Not. R. Astron. Soc., 102, 24–34, https://doi.org/10.1093/mnras/102.1.24, 1942.
Hoque, M. M., Wenzel, D., Jakowski, N., Gerzen, T., Berdermann, J., Wilken, V., Kriegel, M., Sato, H., Borries, C., and Minkwitz, D.: Ionospheric response over Europe during the solar eclipse of March 20, 2015, J. Space Weather Space Clim., 6, A36, https://doi.org/10.1051/swsc/2016032, 2016.
Huba, J. D. and Drob, D.: SAMI3 prediction of the impact of the 21 August 2017 total solar eclipse on the ionosphere/plasmasphere system, Geophys. Res. Lett., 44, 5928–5935, https://doi.org/10.1002/2017GL073549, 2017.
Jakowski, N., Stankov, S. M., Wilken, V., Borries, C., Altadill, D., Chum, J., Buresova, D., Boska, J., Sauli, P., Hruska, F., and Cander, Lj.R.: Ionospheric behavior over Europe during the solar eclipse of 3 October 2005, J. Atmos. Sol.-Terr. Phy., 70, 836–853, https://doi.org/10.1016/j.jastp.2007.02.016, 2008.
Jarvis, M. J., Jenkins, B., and Rodgers, G. A.: Southern hemisphere observations of long-term decrease in F-region altitude and thermospheric wind providing possible evidence for global thermospheric cooling, J. Geophys. Res., 103, 20774–20787, 1998.
Kumar, S., Singh, A. K., and Singh, R. P.: Ionospheric response to total solar eclipse of 22 July 2009 in different Indian regions, Ann. Geophys., 31, 1549–1558, https://doi.org/10.5194/angeo-31-1549-2013, 2013.
Laštovička, J.: Progress in investigating long-term trends in the mesosphere, thermosphere, and ionosphere, Atmos. Chem. Phys., 23, 5783–5800, https://doi.org/10.5194/acp-23-5783-2023, 2023.
Laštovicka, J., Solomon, S. C., and Qian, L.: Trends in the Neutral and Ionized Upper Atmosphere, Space Sci. Rev., https://doi.org/10.1007/s11214-011-9799-3, 2017.
Le, H., Liu, L., Yue, X., and Wan, W.: The ionospheric responses to the 11 August 1999 solar eclipse: observations and modeling, Ann. Geophys., 26, 107–116, https://doi.org/10.5194/angeo-26-107-2008, 2008.
Le, H., Liu, L., Yue, X., Wan, W., and Ning, B.: Latitudinal dependence of the ionospheric response to solar eclipses, J. Geophys. Res., 114, A07308, https://doi.org/10.1029/2009JA014072, 2009.
Lei, J., Dang, T., Wang, W., Burns, A., Zhang, B., and Le, H.: Long-lasting response of the global thermosphere and ionosphere to the 21 August 2017 solar eclipse, J. Geophys. Res.-Space, 123, 4309–4316, https://doi.org/10.1029/2018JA025460, 2018.
Martínez-Ledesma, M., Bravo, M., Urra, B., Souza, J., and Foppiano, A.: Prediction of the ionospheric response to the 14 December 2020 total solar eclipse using SUPIM-INPE, J. Geophys. Res.-Space, 125, e2020JA028625, https://doi.org/10.1029/2020JA028625, 2020.
Masana, E.: Eclipsi 2.0 (Eclipse Calculator 2.0), ServiAstro – Universitat de Barcelona, https://serviastro.ub.edu/en/materials/apps/eclipsi-20 (last access: 5 June 2026), 2012.
Mitra, S. K., Rakshit, H., Syam, P., and Ghose, B. N.: Effect of the solar eclipse on the ionosphere, Nature, 132, 442–443, https://doi.org/10.1038/132442a0, 1933.
Momani, M. A., Yatim, B., and Mohd Ali, M. A.: Ionospheric and geomagnetic response to the total solar eclipse on 1 August 2008 over Northern Hemisphere, J. Geophys. Res., 115, A08321, https://doi.org/10.1029/2009JA014999, 2010.
Muzzioli, L.: La Estación de la Ionósfera, Atenea No. 435, 1er Semestre, 179–191, https://doi.org/10.29393/At435-13EILM10013, 1977.
Ortiz de Adler, N., Elías, A. G., and Manzano, J. R.: Solar cycle length variations: its relation with ionospheric parameters, J. Atmos. Terr. Phys., 59, 159–162, 1997.
Ovalle, E. M., Villalobos, C. U., Agüero, L. A., Leiva, R. E., and Foppiano, A. J.: A new ionospheric station for Chile, Bulletin No 74, Ionospheric Network Advisory Group, Union Radio Scientific Internationale, 2017.
Pezzopane, M., Pietrella, M., Pignalberi, A., and Tozzia, R.: 20 March 2015 solar eclipse influence on sporadic E layer, Adv. Space Res., 56, 2064–2072, https://doi.org/10.1016/j.asr.2015.08.001, 2015.
Piggott, W. R. and Rawer, K.: U.R.S.I. Handbook of Ionogram Interpretation and Reduction, U.S. Department of Commerce National Oceanic and Atmospheric Administration-Environmental Data Service, Asheville, North Carolina, USA, 326 pp., 1972.
Ramírez, P. M.: Física de la ionósfera e interpretación de los ionogramas obtenidos en la Estación Concepción, como colaboración al Año Geofísico Internacional, Facultad de Ingeniería, Universidad de Concepción, 1963.
Ratcliffe, J. A.: A survey of solar eclipses and the ionosphere, in: Solar eclipses and the ionosphere, edited by: Beynon, W. J. G. and Brown, G. M., 1–13, Oxford, Pergamon Press, 1956.
Reinisch, B. W., Dandenault, P. B., Galkin, I. A., Hamel, R., and Richards, P. G.: Investigation of the electron density variation during the 21 August 2017 solar eclipse, Geophys. Res. Lett., 45, 1253–1261, https://doi.org/10.1002/2017GL076572, 2018.
Rishbeth, H.: Solar eclipses and ionospheric theory, Space Sci. Rev., 8, 543–554, https://doi.org/10.1007/BF00175006, 1968.
Smith, P. A. and King, J. W.: Long-term relationships between sunspots, solar faculae and the ionosphere, J. Atmos. Terr. Phys., 43, 1057–1063, 1981.
Urra, B.: SoCIo, Software de Corrección de Ionogramas, https://github.com/BenjaUP-coding/SoCIo, last access: 18 June 2026.
Zhang, H., Zhang, T., Zhang, X., Yuan, Y., Wang, Y., and Ma, Y.: Multi-Instrument Observations of the Ionospheric Response Caused by the 8 April 2024 Total Solar Eclipse, Remote Sens., 16, 2451, https://doi.org/10.3390/rs16132451, 2024.