the Creative Commons Attribution 4.0 License.
the Creative Commons Attribution 4.0 License.
 | 27 Aug 2021
Heavy rainfall, floods, and flash floods influenced by high-speed solar wind coupling to the magnetosphere–ionosphere–atmosphere system
Vojto Rušin
Emil A. Prikryl
Pavel Šťastný
Maroš Turňa
Martina Zeleňáková
Heavy rainfall events causing floods and flash floods are examined in the context of solar wind coupling to the magnetosphere–ionosphere–atmosphere system. The superposed epoch (SPE) analyses of solar wind variables have shown the tendency of severe weather to follow arrivals of high-speed streams from solar coronal holes. Precipitation data sets based on rain gauge and satellite sensor measurements are used to examine the relationship between the solar wind high-speed streams and daily precipitation rates over several midlatitude regions. The SPE analysis results show an increase in the occurrence of high precipitation rates following arrivals of high-speed streams, including recurrence with a solar rotation period of 27 d. The cross-correlation analysis applied to the SPE averages of the green (Fe XIV; 530.3 nm) corona intensity observed by ground-based coronagraphs, solar wind parameters, and daily precipitation rates show correlation peaks at lags spaced by solar rotation period. When the SPE analysis is limited to years around the solar minimum (2008–2009), which was dominated by recurrent coronal holes separated by ∼ 120∘ in heliographic longitude, significant cross-correlation peaks are found at lags spaced by 9 d. These results are further demonstrated by cases of heavy rainfall, floods and flash floods in Europe, Japan, and the USA, highlighting the role of solar wind coupling to the magnetosphere–ionosphere–atmosphere system in severe weather, mediated by aurorally excited atmospheric gravity waves.
- Article
(14443 KB) - Full-text XML
- BibTeX
- EndNote


Extreme rainfall and flash floods have major societal and economic impacts, thus posing significant natural hazards (Gaume et al., 2009) that increasingly require careful flood risk assessment, mitigation strategies, and recovery management (National Academies of Sciences, 2019). Although our knowledge and understanding of the multitude of processes that can result in heavy precipitation has advanced (Schumacher, 2019), prediction of extreme precipitation events continues to present difficult challenges in operational forecasting (Fritsch and Carbone, 2004; Villarini et al., 2010; Gourley et al., 2012; Schroeder et al., 2016). Recent climate change has caused an increase in extreme precipitation and flash floods (Groisman et al., 2005; Gutowski et al., 2008; Esposito et al., 2018; Schumacher, 2019). While there are many factors affecting heavy precipitation across a variety of atmospheric scales, the difficulty of predicting flash floods stems partly from the fact that they often occur on small spatial scales. Schumacher (2019) summarized some of the aspects of extreme precipitation and research areas aiming at improved understanding and prediction, which, among other things, will require interdisciplinary research collaborations in addition to basic research.
While it is well known that the Sun is the major source of energy, primarily via the electromagnetic radiation heating the Earth's atmosphere and driving weather processes, the interaction of the solar wind with the Earth's magnetic field deposits significant energy into the upper portion of the Earth's atmosphere, particularly at high latitudes. A possible link between solar magnetic sector structure and tropospheric vorticity was shown in the 1970s by Wilcox et al. (1973, 1974) who used the upper-level tropospheric vorticity area index (VAI), which is a proxy for extratropical storminess. They observed a statistically significant variation of VAI about the time of the Earth crossing the magnetic sector boundary and, specifically, a minimum in VAI about 1 d later. Sector boundaries, later identified as the heliospheric current sheet (HCS; Smith et al., 1978; Hoeksema et al., 1983), often precede arrivals of high-speed stream (HSS) interfaces by about 1 d, unless the two coincide. The observations by Wilcox et al. (1973) prompted a search for possible physical mechanisms to explain the “Wilcox effect” and other observations indicating Sun–weather links, such as the global electric circuit model and changes in relativistic electron flux (Tinsley, 2000, 2008), and energetic solar proton events correlated with intensifications of cyclonic activity (Veretenenko and Thejll, 2004), which, in turn, would affect cloud microphysics (Tinsley, 2012). The dawn–dusk (BY) component of the interplanetary magnetic field (IMF) and the atmospheric electric circuit influences on the ground-level atmospheric pressure have been shown (Burns et al., 2007, 2008; Lam et al., 2013, 2014), and Lam and Tinsley (2016) reviewed the solar wind–atmospheric electricity–cloud microphysics connections to weather and climate. External factors, including galactic cosmic rays (GCRs) varying with the heliospheric magnetic field, are further discussed by Owens et al. (2014), who considered the polarity of the magnetic field modulating lightning in the UK. Scott et al. (2014) observed solar wind modulation of lightning, an increase in lightning rates, and thunder days coinciding with an increased flux of lower energy solar protons following arrival of solar wind high-speed streams.
HSSs emanating from coronal holes (Krieger et al., 1973) are anchored in the large-scale solar magnetic field structure that is extended into the interplanetary space by the solar wind. HSSs from polar coronal holes have an approximately constant speed of ∼ 750 to 800 km/s (Phillips et al., 1994, 1995; Tsurutani et al., 2006a). The coronal holes that affect the Earth by HSSs are either extensions of polar coronal holes (Phillips et al., 1994) to low latitudes or self-contained coronal holes forming at low heliographic latitudes (de Toma, 2011). HSSs cause co-rotating interaction regions (CIRs; Smith and Wolfe, 1976) at the leading edge of HSSs from mid- to low-latitude coronal holes, which is an interface between the fast and slow solar wind (Richardson, 2006; Tsurutani et al., 2006b). The high-density HCS plasma sheet ahead of CIRs leads to magnetic field compression (Tsurutani et al., 1995). The high-density plasma sheet impinging onto the magnetosphere results in the precipitation of magnetospheric relativistic electrons (Tsurutani et al., 2016), which these authors stated could be relevant to the Wilcox effect. Tsurutani et al. (2016) also considered importance of the energy deposited in the mesosphere and middle atmosphere possibly driving planetary waves or atmospheric gravity waves. The geo-effectiveness of HSSs/CIRs has been well established (Tsurutani et al., 2006a, b) and associated with high-intensity, long-duration, continuous auroral electrojet activity (HILDCAA) that includes auroral substorms (Tsurutani and Gonzalez, 1987; Tsurutani et al., 1990, 1995). HILDCAAs are caused by trains of solar wind Alfvén waves (Belcher and Davis, 1971) that couple to the magnetosphere–ionosphere system (Dungey, 1961, 1995). For a further review of relevant references on solar wind coupling to the magnetosphere–ionosphere–atmosphere (MIA) system, see, e.g., Prikryl et al. (2019).
Prikryl et al. (2009a) observed the Wilcox effect in both the Northern and Southern hemispheres' winters. Severe weather, including severe winter storms, windstorms, snowstorms, heavy rain events, and explosively developing extratropical cyclones have been examined by Prikryl et al. (2018) in the context of solar wind coupling to the MIA system. They observed a tendency of significant weather events to follow arrivals of high-speed solar wind streams. The statistical results (Prikryl et al., 2009a, 2016, 2018) and a proposed physical mechanism of Prikryl et al. (2009b) were supported by cases of severe weather events, including two flash floods that occurred in Slovakia on 16 and 24 July 2001 (Prikryl et al., 2018; their Fig. 10). Both flash floods closely followed arrivals of solar wind high-speed streams from coronal holes, and a series of convective supercells were associated with atmospheric gravity waves (AGWs) from sources in the high-latitude lower thermosphere that could have reached the midlatitude troposphere. The authors suggested that the AGWs played a role in triggering moist instabilities (Bennetts and Hoskins, 1979; Schultz and Schumacher, 1999), thus initiating the convection.
In this paper, we examine the occurrence of heavy rainfall events leading to floods and flash floods in the geophysical context of the solar wind MIA coupling. The goal is to demonstrate the statistical link between the solar wind and the occurrence of heavy rainfall and to identify the high-latitude sources of AGWs that may play a role in triggering the convection leading to heavy rainfall, floods, and flash floods.
Prikryl et al. (2018) have described in detail the solar wind data obtained from the National Space Science Data Center (NSSDC) OMNIWeb http://omniweb.gsfc.nasa.gov (last access: 11 August 2021) (King and Papitashvili, 2005). The data include measurements of solar wind velocity, V, the interplanetary magnetic field (IMF) magnitude, B, the standard deviation, , of the z component of the IMF Bz, and proton density, np, upstream from Earth. These solar wind parameters are used to identify HSS/CIRs and the observed HSS velocity maxima, Vmax.
Measurements of the green coronal emission line (Fe XIV; 530.3 nm) by ground-based coronagraphs from 1939 to 2008 have been merged into a homogeneous coronal data set (Rybanský, 1975; Rybanský et al., 2001, 2005 https://ngdc.noaa.gov/stp/solar/solar-indices.html, last access: 11 August 2021). The intensity of the emission line at 28.4 nm (Fe XV) observed by the SOHO Extreme ultraviolet Imaging Telescope (EIT) instrument was found to be closely correlated with intensity of the green corona obtained by ground-based coronagraphs (Dorotovič et al., 2014). The coronal intensities are expressed in absolute coronal units (ACUs) representing the intensity of the continuous spectrum from the center of the solar disk with a width of 1Å at the same wavelength as the observational spectral line (1 ACU = 3.89 W m−2 sr−1 at 530.3 nm). The intensity depletions, called coronal holes, are sources of high-speed solar wind streams. While they are most prominent during solar minimum in polar regions (polar coronal holes), they can extend to low heliographic latitudes as depleted corona intensity and are observed at the limb, sometimes even during total solar eclipses (Rušin et al., 2020). The green corona intensity synoptic charts at the solar central meridian are produced by averaging the intensities measured at the east and west limbs 14 d apart.
The radars of the Super Dual Auroral Radar Network (SuperDARN; Chisham et al., 2007) map ionospheric convection in both the Northern and Southern hemispheres (http://vt.superdarn.org/tiki-index.php, last access: 11 August 2021). Ground-based magnetometers from the Geophysical Institute Magnetometer Array (GIMA; https://www.gi.alaska.edu/monitors/magnetometer/archive, last access: 11 August 2021), International Monitor for Auroral Geomagnetic Effects (IMAGE; https://space.fmi.fi/image/www/index.php?, last access: 11 August 2021), Geomagnetic Laboratory of the Natural Resources Canada (NRCan; https://www.spaceweather.ca/, last access: 11 August 2021), and the Canadian Array for Realtime Investigations of Magnetic Activity (CARISMA; http://www.carisma.ca/, last access: 11 August 2021) are used to identify ionospheric currents as sources of AGWs. The magnetometer data were also accessed through SuperMAG (https://supermag.jhuapl.edu/mag/, last access: 11 August 2021; Gjerloev, 2012) and INTERMAGNET (https://www.intermagnet.org/, last access: 11 August 2021).
Detrended GPS total electron content (TEC) maps are used to identify traveling ionospheric disturbances (TIDs; Tsugawa et al., 2007). The Dense Regional And Worldwide INternational Global Navigation Satellite System (GNSS)-TEC observation (DRAWING-TEC) project of the National Institute of Information and Communications Technology has developed the dense TEC mapping technique and shared the standardized GNSS-TEC data (https://aer-nc-web.nict.go.jp/GPS/DRAWING-TEC/, last access: 11 August 2021).
Meteorological data were accessed online at web pages provided by various institutions, including Environment Canada, the Japan Meteorological Agency (JMA), the Australian Government Bureau of Meteorology, the Slovak Hydrometeorological Institute (SHMU), the University of Wisconsin–Madison Space Science and Engineering Center, and the University of Washington's Department of Atmospheric Sciences. Copernicus (https://www.copernicus.eu/en, last access: 11 August 2021), previously known as GMES (Global Monitoring for Environment and Security), is the European program for the establishment of a European capacity for Earth Observation. It funds the project FloodList, a European system for monitoring and reporting floods and flooding news since 2013 (https://floodlist.com/, last access: 11 August 2021). An earlier database of European flash flood data (Gaume et al., 2009) is provided at the Hydrate Project web page (https://cordis.europa.eu/project/id/37024, last access: 11 August 2021). The rainfall data from SHMU stations across Slovakia and the SHMU annual flood reports (https://www.shmu.sk/sk/?page=128, last access: 11 August 2021) provided data on significant rainfall leading to floods. The Tropical Rainfall Measuring Mission (TRMM) Multi-Satellite Precipitation Analysis TMPA (3B42) Precipitation (version 7), using a grid for latitudes ± 50∘, was produced at the Goddard Earth Sciences Data and Information Services Center (GES DISC; Huffman et al., 2016; https://disc.gsfc.nasa.gov/datasets/TRMM_3B42_Daily_7/summary, last access: 11 August 2021).
Prikryl et al. (2009a, b, 2016, 2018, 2019) used the superposed epoch (SPE) analysis method to show a tendency of severe weather, explosive extratropical cyclones, and rapid intensification of tropical cyclones to follow arrivals of solar wind disturbances, including HSS/CIRs and possibly interplanetary coronal mass ejections (ICMEs) and their upstream sheaths (Burlaga et al., 1981; Tsurutani et al., 1988), indicating substantial energy input into the auroral zone ionosphere. In the present paper, we extend the analysis to examine the occurrence of heavy rainfall leading to floods and flash floods in the geophysical context.
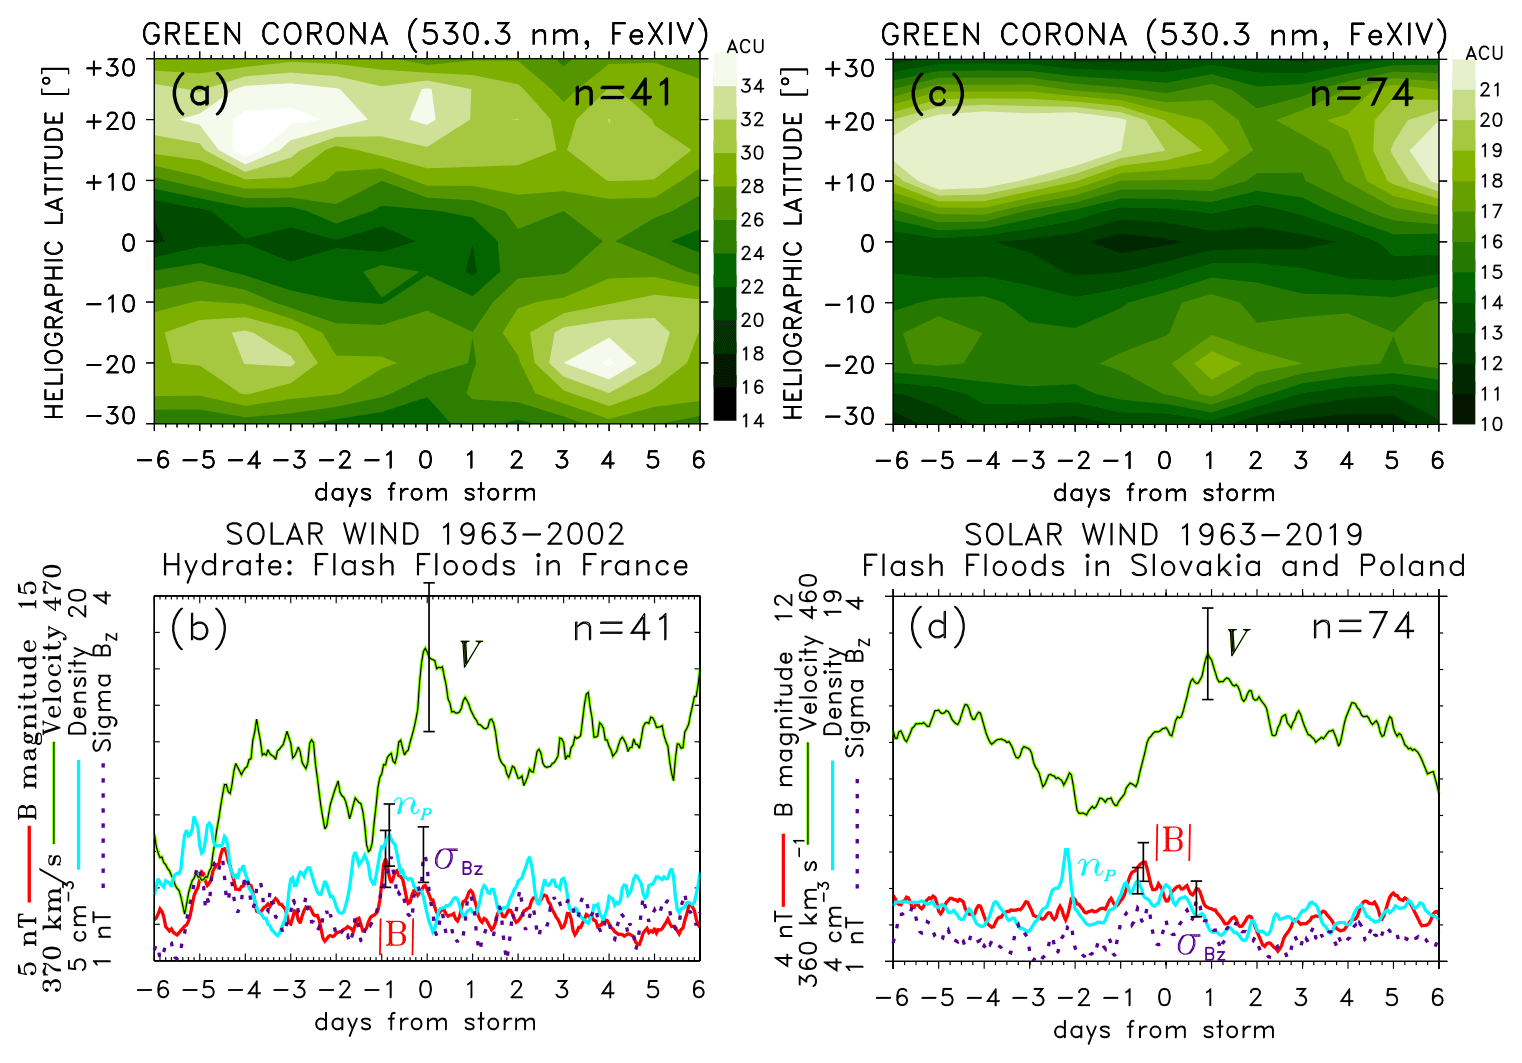
Figure 1The SPE analysis of the time series of (a, c) green corona intensity and (b, d) solar wind plasma parameters keyed to dates of flash floods in France and Slovakia, including the flash floods in the Tatra Mountains in Slovakia and Poland.
First, we use lists of flash floods in France from the Hydrate Project database, flash floods in Slovakia (SHMU annual flood reports) and Poland (Ballesteros-Cánovas et al., 2015; their Table 4), and flash floods in Europe and the USA archived by the FloodList project (http://floodlist.com/, last access: 11 August 2021). Figure 1 shows the results of the SPE analysis of the time series of green corona intensity and solar wind parameters keyed to the start dates of flash floods in France (left panels) and in Slovakia and on the northern slopes of the Tatra Mountains in Poland (right panels). In both cases, the results show an increase in the mean solar wind velocity V from a minimum before the key day to a maximum after the key day, with peaks in np, B, and about 1 d prior to the key time, which is a result of superposition of HSS/CIRs within the n intervals centered on the flash flood day. This is further supported by the SPE analysis of green corona intensity showing depletions of the mean intensity at low heliographic latitudes before the key time, which is the result of the superposition of coronal holes which are the sources of HSSs. These results indicate a tendency of flash floods to occur following the arrivals of HSS/CIRs from coronal holes.

Figure 2The SPE analysis of time series of (a, c) green corona intensity and (b, d) solar wind plasma parameters keyed to start date/time of heavy rainfall and/or flash floods in Europe and the USA.
Figure 2 shows the SPE analysis results for flood events in Europe (Fig. 2a, b) and the USA (Fig. 2c, d), with the key times defined by the approximate starting dates of heavy rainfall obtained from the FloodList archive (2013–2019), excluding events caused by tropical storms and rainfall persistent over many days. The results are similar to those in Fig. 1, showing patterns of increase in the mean solar wind velocity V from minimum to maximum and peaks in np, B, and near the key time. For each geographical sector, this reproducible pattern indicates a tendency of heavy rainfall/flood events to occur following arrivals of HSS/CIRs.
These results are further supported by a more comprehensive analysis using the SHMU precipitation database and the annual flood reports in Slovakia for a period of 2003–2019. Previously, Prikryl et al. (2018; their Fig. 7d, e, f) showed a tendency of significant weather events, including heavy rainfall, to follow arrivals of HSSs. Here we repeat the SPE analysis of solar wind parameters keyed to significant rainfall events of at least 30 mm per 24 h recorded at 10 or more stations in 2003–2019 (Fig. 3). The results show a pattern indicating a tendency of these rainfall events to have occurred about 2 d after arrivals of HSSs from coronal holes.
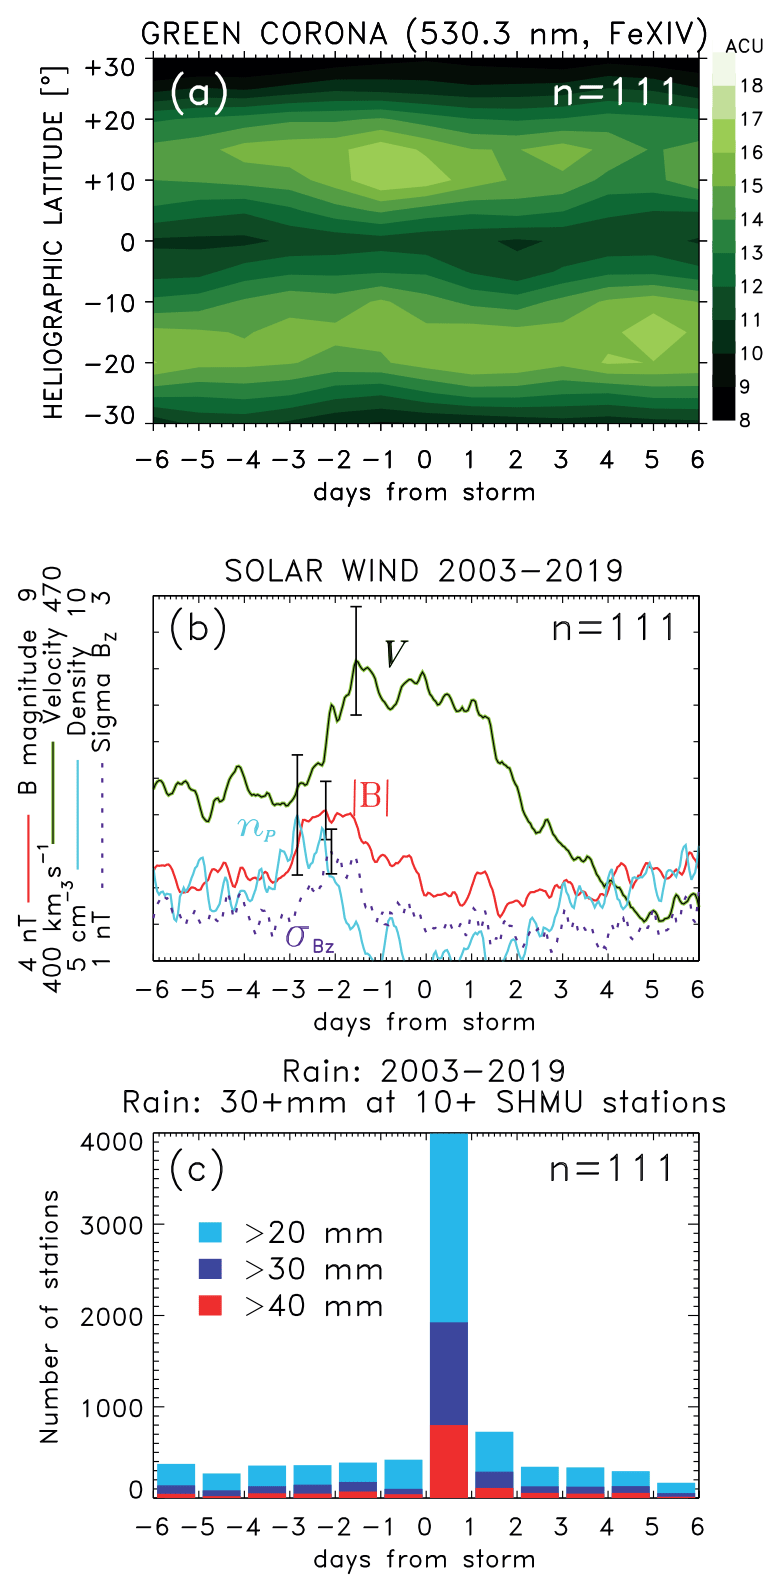
Figure 3The SPE analysis of time series of (a) green corona intensity and (b) solar wind plasma parameters keyed to the start date of heavy rainfall of at least 30 mm per 24 h recorded at 10 or more stations. (c) Total cumulative number of stations that recorded 24 h rainfall exceeding given thresholds in daily precipitation rates.
Heavy rainfall events used in Fig. 3 may or may not have resulted in floods. On the other hand, relatively moderate rainfall rates over a few days can also result in floods. To focus on floods, we compiled start dates of significant rainfall leading to floods, as documented in the SHMU annual flood reports. The SPE analysis of the green corona intensity and solar wind parameters keyed to these dates is shown in Fig. 4a and b, respectively. The histogram (Fig. 4c) shows a steep increase in the cumulative number of stations where the recorded 24 h rainfall exceeded a given threshold for each epoch day relative to the start of rainfall/flood events, regardless of the location of the SHMU stations. Of note, for some rivers, such as the Myjava and Dunaj (Danube), the rainfall that contributed to floods occurred in the Czech Republic, Austria, and Germany but was not necessarily recorded by SHMU stations. While the available information on rainfall measurements outside Slovakia is used to determine the key dates for some flood events in the SPE analysis (Fig. 4), the statistics of rainfall occurrence relative to the key date (Fig. 4c) only includes the SHMU stations. The SPE analysis of solar wind parameters (Fig. 4b) clearly indicates a tendency of the heavy rainfall/flood events to follow arrivals of solar wind HSS/CIRs, which is consistent with the results discussed above (Figs. 1 to 3).
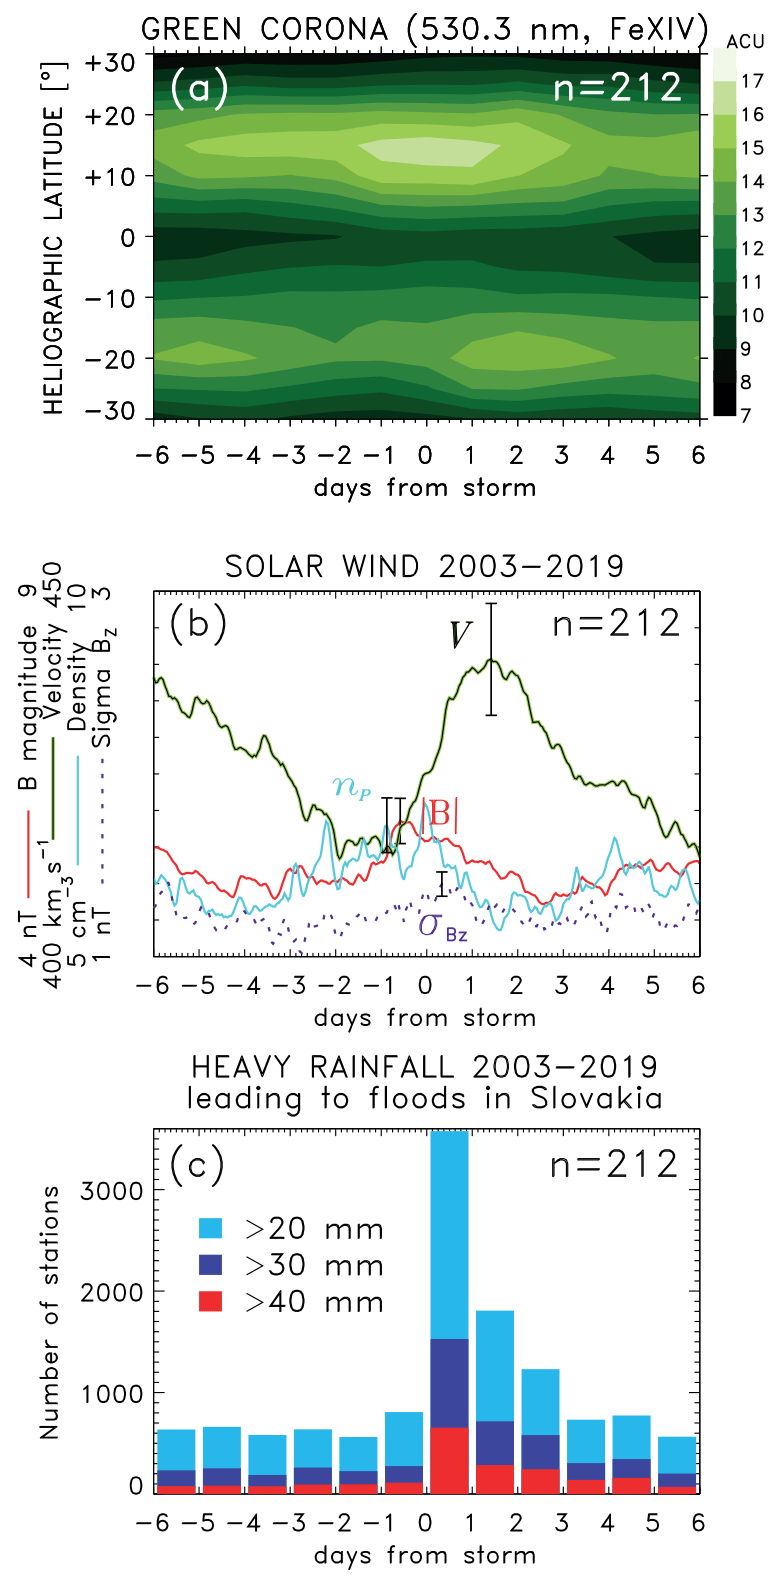
Figure 4The SPE analysis of time series of (a) green corona intensity and (b) solar wind plasma parameters keyed to start dates/times of significant rainfall leading to floods in Slovakia. (c) Total cumulative number of stations that recorded 24 h rainfall exceeding given thresholds in daily precipitation rates.
The above results of the SPE analysis of solar wind time series keyed by heavy rainfall leading to floods indicate a tendency of these events to follow arrivals of HSS/CIRs. Using the database of daily precipitation rates from rain gauges in Slovakia, we now show more direct evidence to support these conclusions. Also, we use the TRMM satellite-based data set of daily precipitation rates to provide further statistical evidence supporting these results.
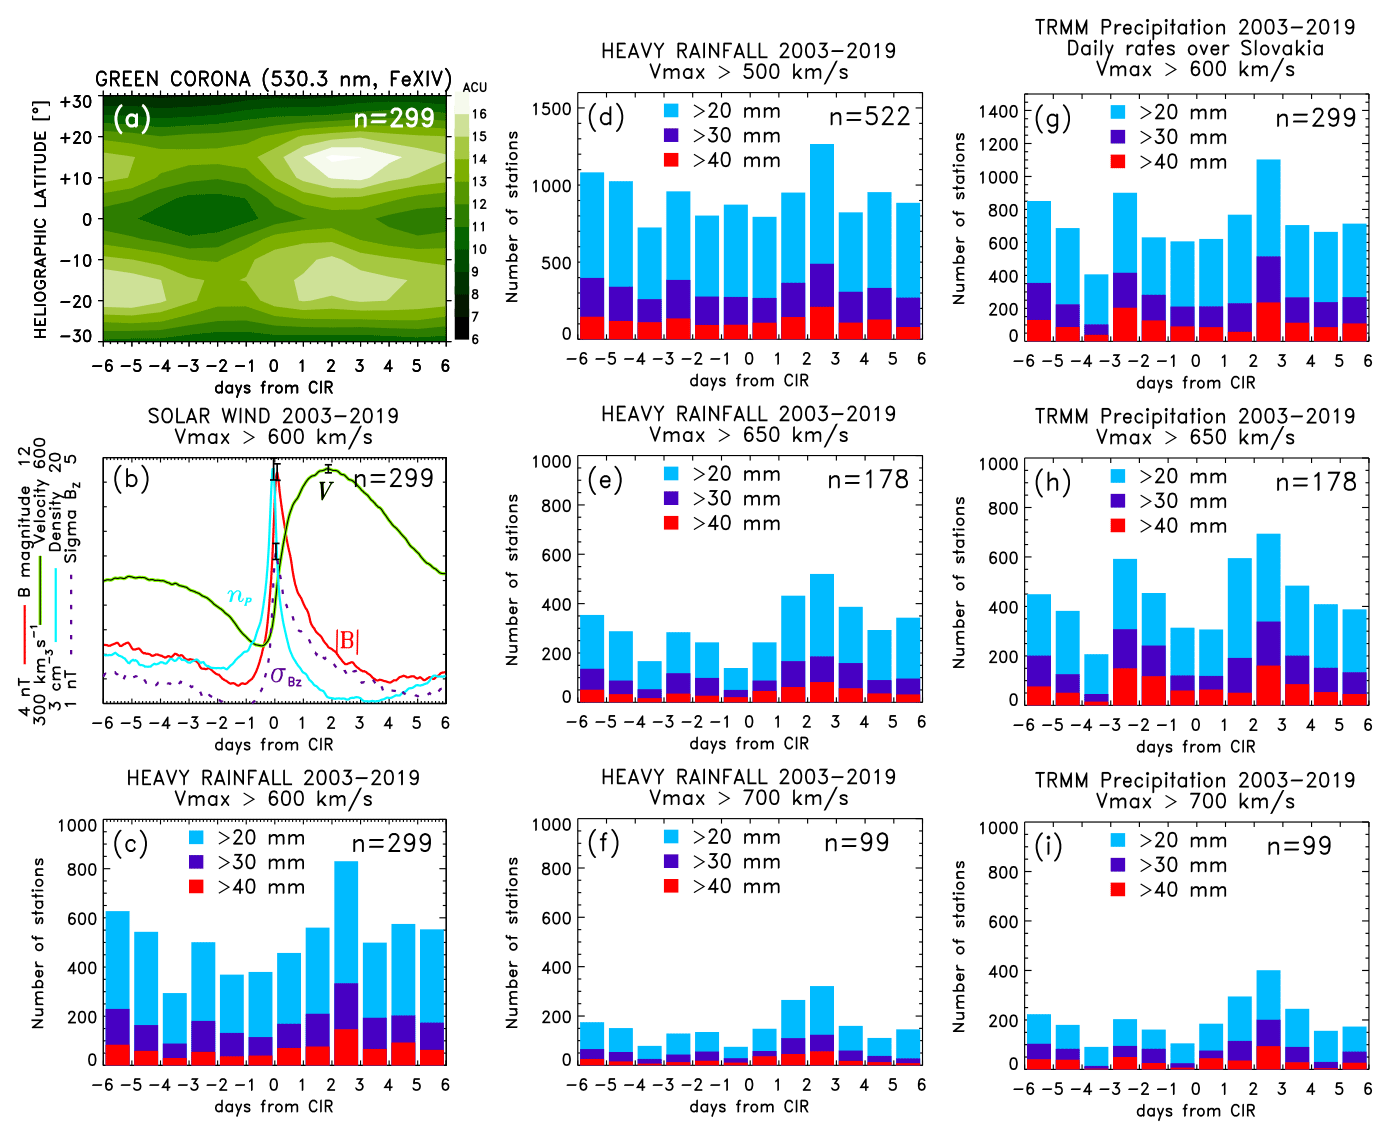
Figure 5The SPE analysis of time series of (a) green corona intensity and (b) solar wind plasma parameters keyed to the arrivals of HSS/CIRs for solar wind streams that exceeded a given maximum velocity. (c–f) Total cumulative number of rain gauge stations found in Slovakia, and (g–i) the number of TRMM grid cells over Slovakia that have above-threshold daily precipitation rates.
To examine statistically the occurrence of significant rainfall in Slovakia relative to arrivals of HSS/CIRs, the key time for the SPE analysis is now defined as the actual arrival time of major HSS/CIRs, and the total cumulative numbers of rain gauge stations with recorded daily rainfall rate exceeding given thresholds are summed up for each epoch day.
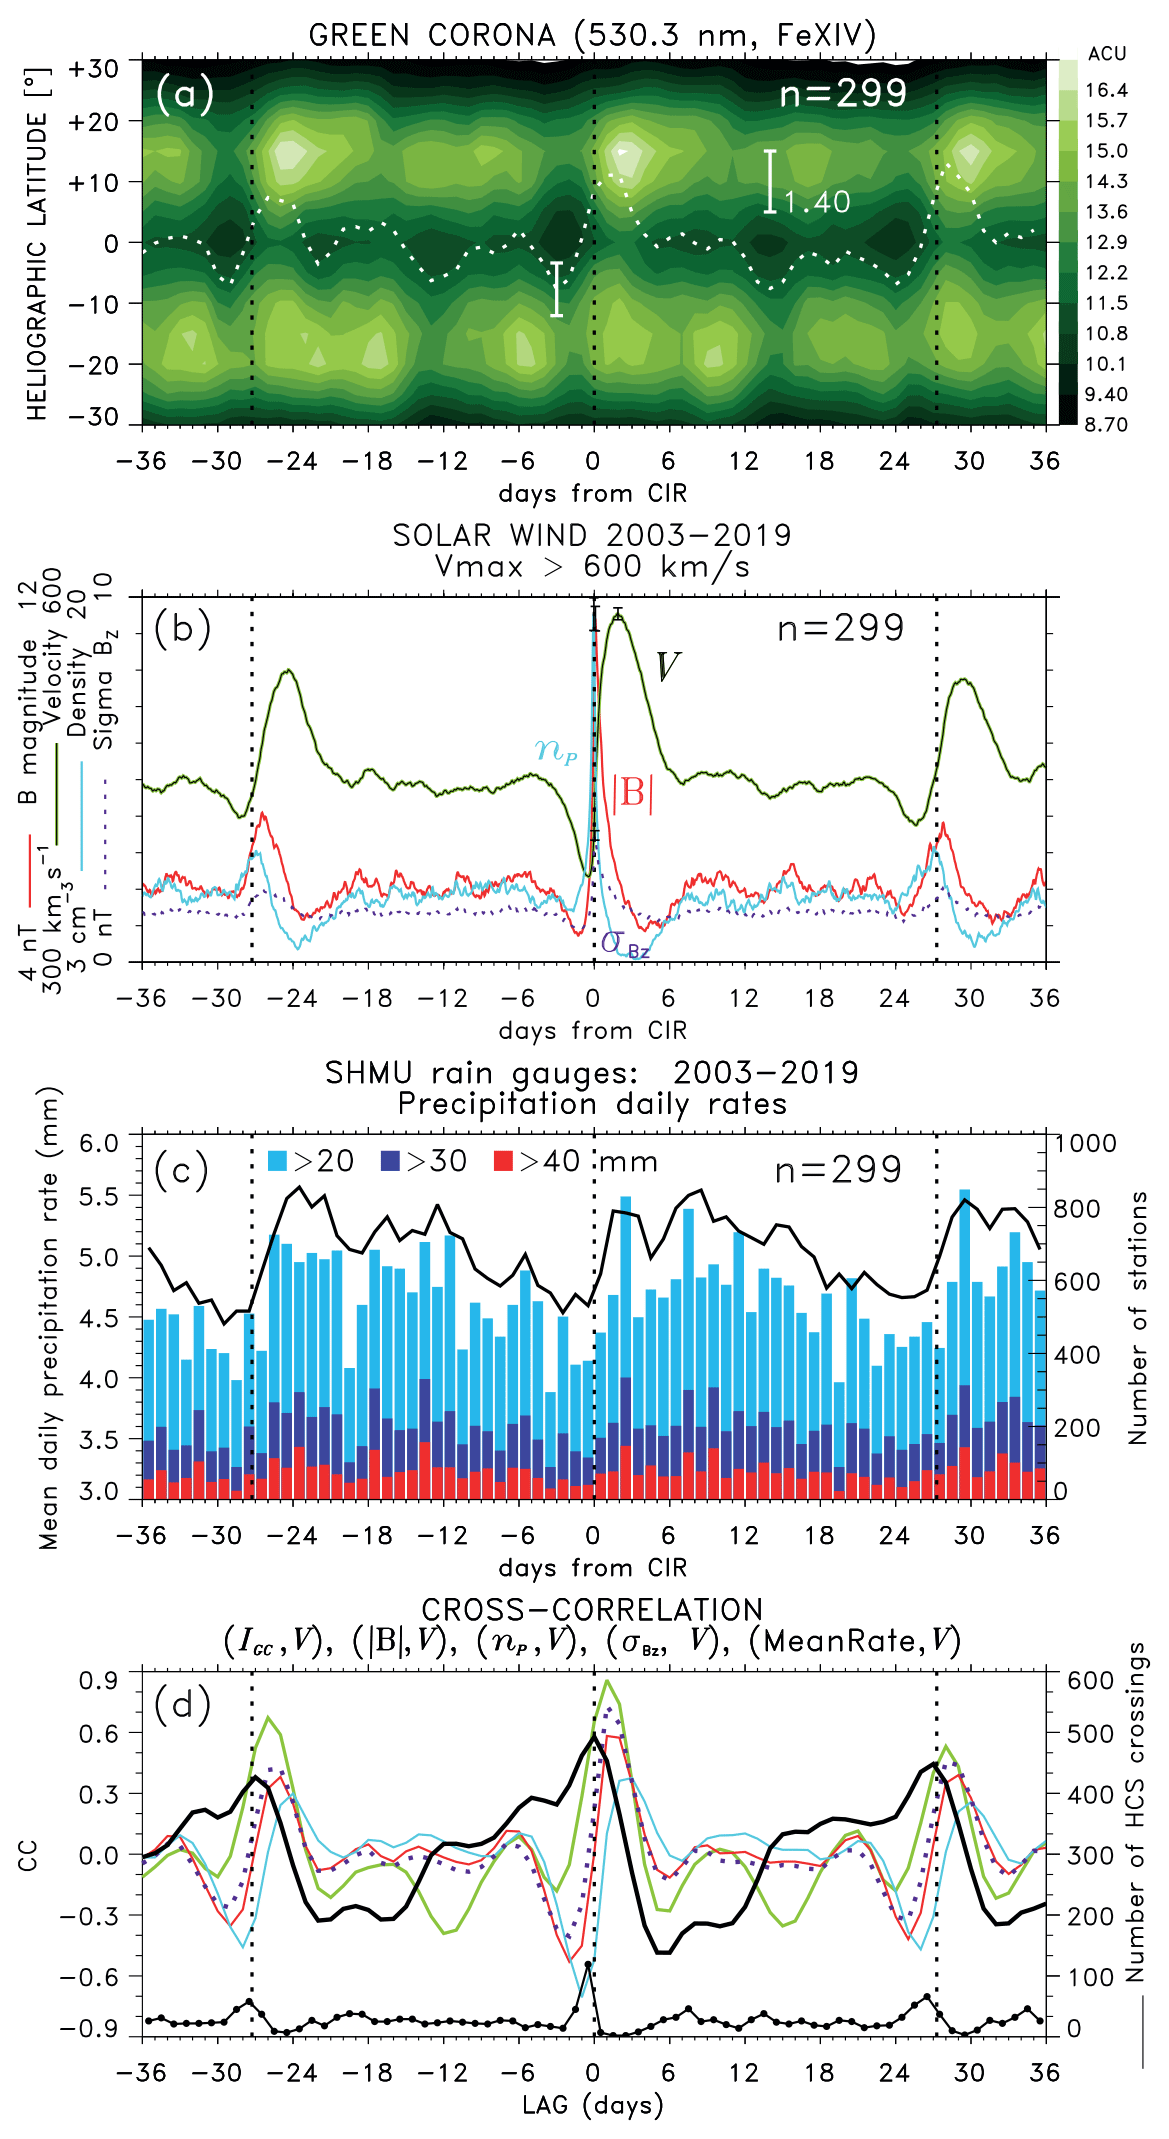
Figure 6The SPE analysis for the period from 2003 to 2019 of (a) green corona intensity and (b) solar wind plasma parameters keyed to the arrivals of major HSS/CIRs (Vmax>600 km/s) for periods of ±36 d relative the key time. (c) Mean daily precipitation rate and the total cumulative numbers of rain gauge stations in Slovakia that measured daily precipitation rates exceeding given thresholds. (d) The cross-correlation function computed for the solar wind velocity V paired with the rest of the variables, i.e., (IGC; V) in green, (np; V) in light blue, (B; V) in red, (; V) in purple, and (mean rate; V) in black. At the bottom, cumulative number of HCS crossings is shown by black dots.
For major HSSs reaching a maximum solar wind velocity of at least 600 km/s in the period of 2003–2019 (same as in Fig. 4), Fig. 5a and b show the expected SPE analysis results for the green corona intensity and solar wind parameters, respectively. The superposition of HSS/CIRs relative to the well-defined interface between the fast and slow solar wind shows peaks in the mean np, B, and near the key time while the mean solar wind velocity V is rising from a minimum before to a maximum after the key time (Fig. 5b). In Fig. 5c, for each epoch day relative to HSS/CIR arrivals, the cumulative number of stations with the 24 h rainfall exceeding given thresholds are shown. The number of stations with significant rain increases from a minimum before to a maximum after the HSS/CIR arrival. If more moderate HSS/CIRs (e.g., Vmax > 500 km/s) are included, the increase in the significant rainfall occurrence following the key day 0 is still observed (Fig. 5d), although the relative increase is smaller. Conversely, for faster solar wind streams (Fig. 5e and f), significant rainfall occurrence shows greater relative increases following the HSS/CIR arrivals. Independently of rain gauge observations, the same relationship between HSSs and the satellite-based daily precipitation rates over Slovakia extracted from the TRMM data set are shown in Fig. 5g, h and i. This is consistent with the results discussed in Sect. 3 and confirms the tendency of increased occurrence of heavy rainfall following the HSS/CIR arrivals, which becomes more pronounced for faster/stronger HSS/CIRs.
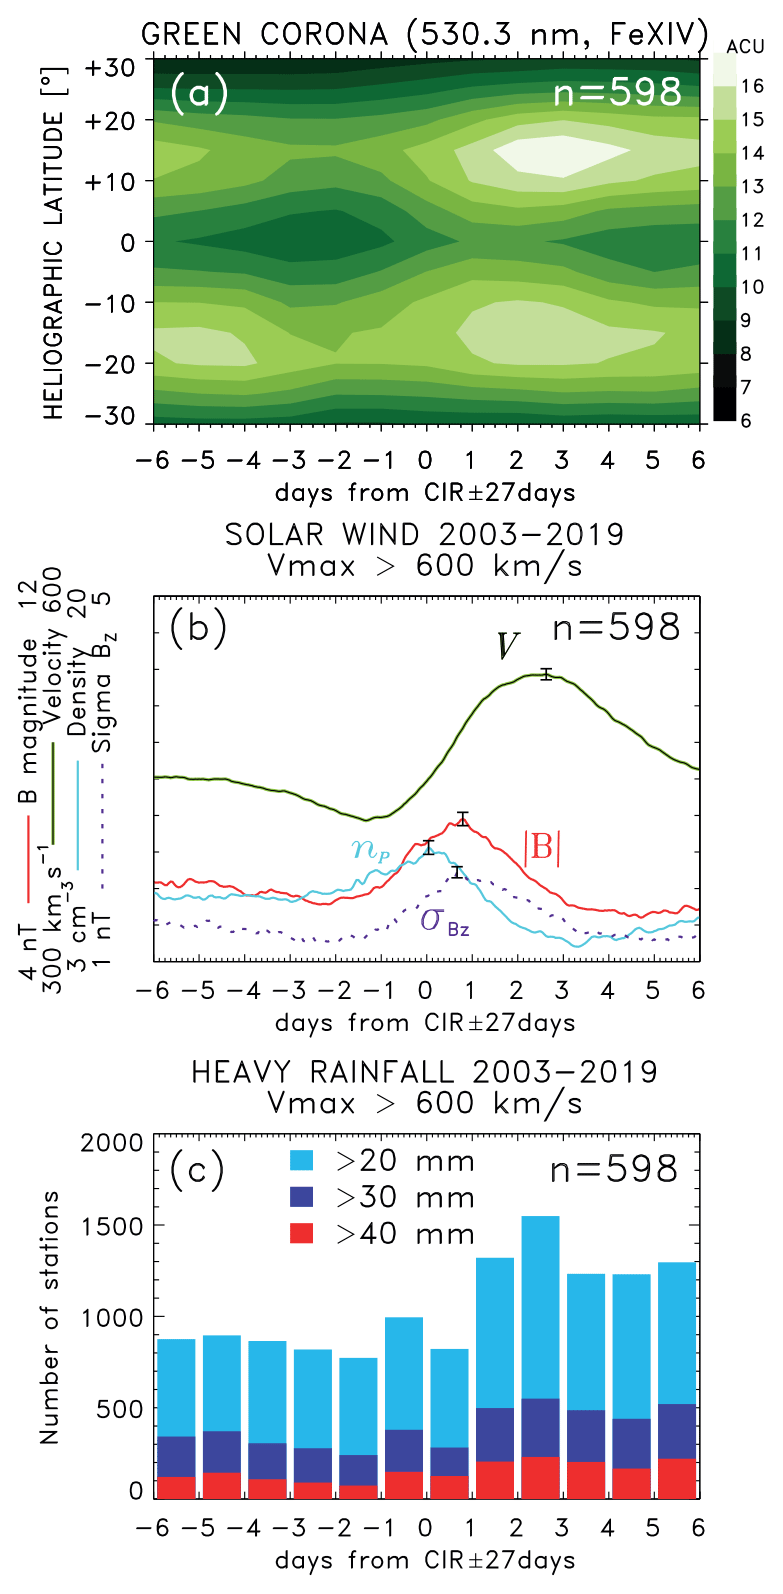
Figure 7The same as Fig. 5a–c except the SPE analysis is keyed to times lagged by ±27 d relative to arrivals of HSS/CIRs.
Polar coronal holes and their HSSs have been known to persist for years (Tsurutani et al., 1982, 1995) and appear as “rigid rotators” at the Sun's equatorial rotation period (27 d as observed from Earth). Coronal holes that extend to low latitudes often persist for many solar rotations, producing recurrent HSSs with a period of about 27 d. To show it, the SPE analysis is now extended to ± 36 d from a key time defined by arrivals of major HSSs reaching a maximum solar wind velocity of at least 600 km/s (Fig. 6). The vertical dotted lines are shown for key time ± 27.28 d (called Carrington or synodic rotation). The superposition of recurrent coronal holes, which include northern and southern coronal holes, results in depressions of the mean green corona intensity IGC (Fig. 6a) that are, in this case, centered at about zero heliographic latitude 3–4 epoch days before arrival times of recurrent HSSs. The white dotted line shows the mean IGC at zero latitude from the SPE analysis, with the mean over the period of 72 d subtracted. The standard error bar for one of the deviation minima and the ordinate scale bar corresponding to the color scale on the right are shown. Figure 6b shows the superposition of solar wind plasma parameters that includes recurrent HSS/CIRs. As in Fig. 5c, but now for ±36 d from the key time, Fig. 6c shows cumulative numbers of rain gauge stations in Slovakia with above-threshold daily precipitation rates, i.e., N20 mm, N30 mm, and N40 mm. The black bold line shows the precipitation rate averaged over all stations for each epoch day (smoothed by a three-point running window). The histograms show not only the clear increase in precipitation after the key time that is already shown in Fig. 5c but also similar increases one solar rotation before and after the key time, i.e., an increase in precipitation following the arrivals of recurrent streams. We now compare variations among six variables (V, IGC, np, B,σBz, and the mean daily precipitation rate). The cross-correlation function (CCF) is computed for the mean solar wind velocity V paired with the rest of the variables (Fig. 6d; shown in colors corresponding to those in Fig. 6b). The CCF (IGC; V) that is shown with a green line representing IGC has the maximum correlation coefficient at a lag of +1 d with secondary maxima at lags of −26 and +28 d, i.e., +1 d relative to the vertical dotted lines representing recurrent streams. The relative lags for the main and secondary peaks of CCF (B; V) and (; V) are 1 or 2 and 2 or 3 d for (np; V). Most importantly, the peaks of the CCF (mean rate; V) are at lags of −27, 0, and +27 d, with correlation coefficients that are comparable with those for the other solar wind variables. These quantitative results further support the qualitative observations discussed above by confirming the tendency of an increase in precipitation following the arrivals of HSS/CIRs, including recurrence with a periodicity of 27 d. The latter is demonstrated once more in another way in Fig. 7. It shows the SPE analysis of green corona intensity, solar wind parameters, and cumulative number of rain gauge stations in Slovakia with above-threshold daily precipitation rates, except that the key times are lagged by ±27 d relative to the actual arrival times of HSS/CIRs used in Fig. 5, thus doubling the number of superposed time series. Figure 7a and b show smaller amplitudes because of averaging “imperfectly” recurrent streams (coronal holes and streams evolve over one solar rotation, shifting in longitude and arrival times, respectively), but the amplitude of the increase in the numbers of stations Slovakia with high precipitation rates doubles because they are summed up for two returns of recurrent streams separated approximately by 54 d. If the SPE analysis is repeated for key times lagged by ±54 d, the results are very similar, even though now the recurrent streams are separated by approximately 108 d (not shown).
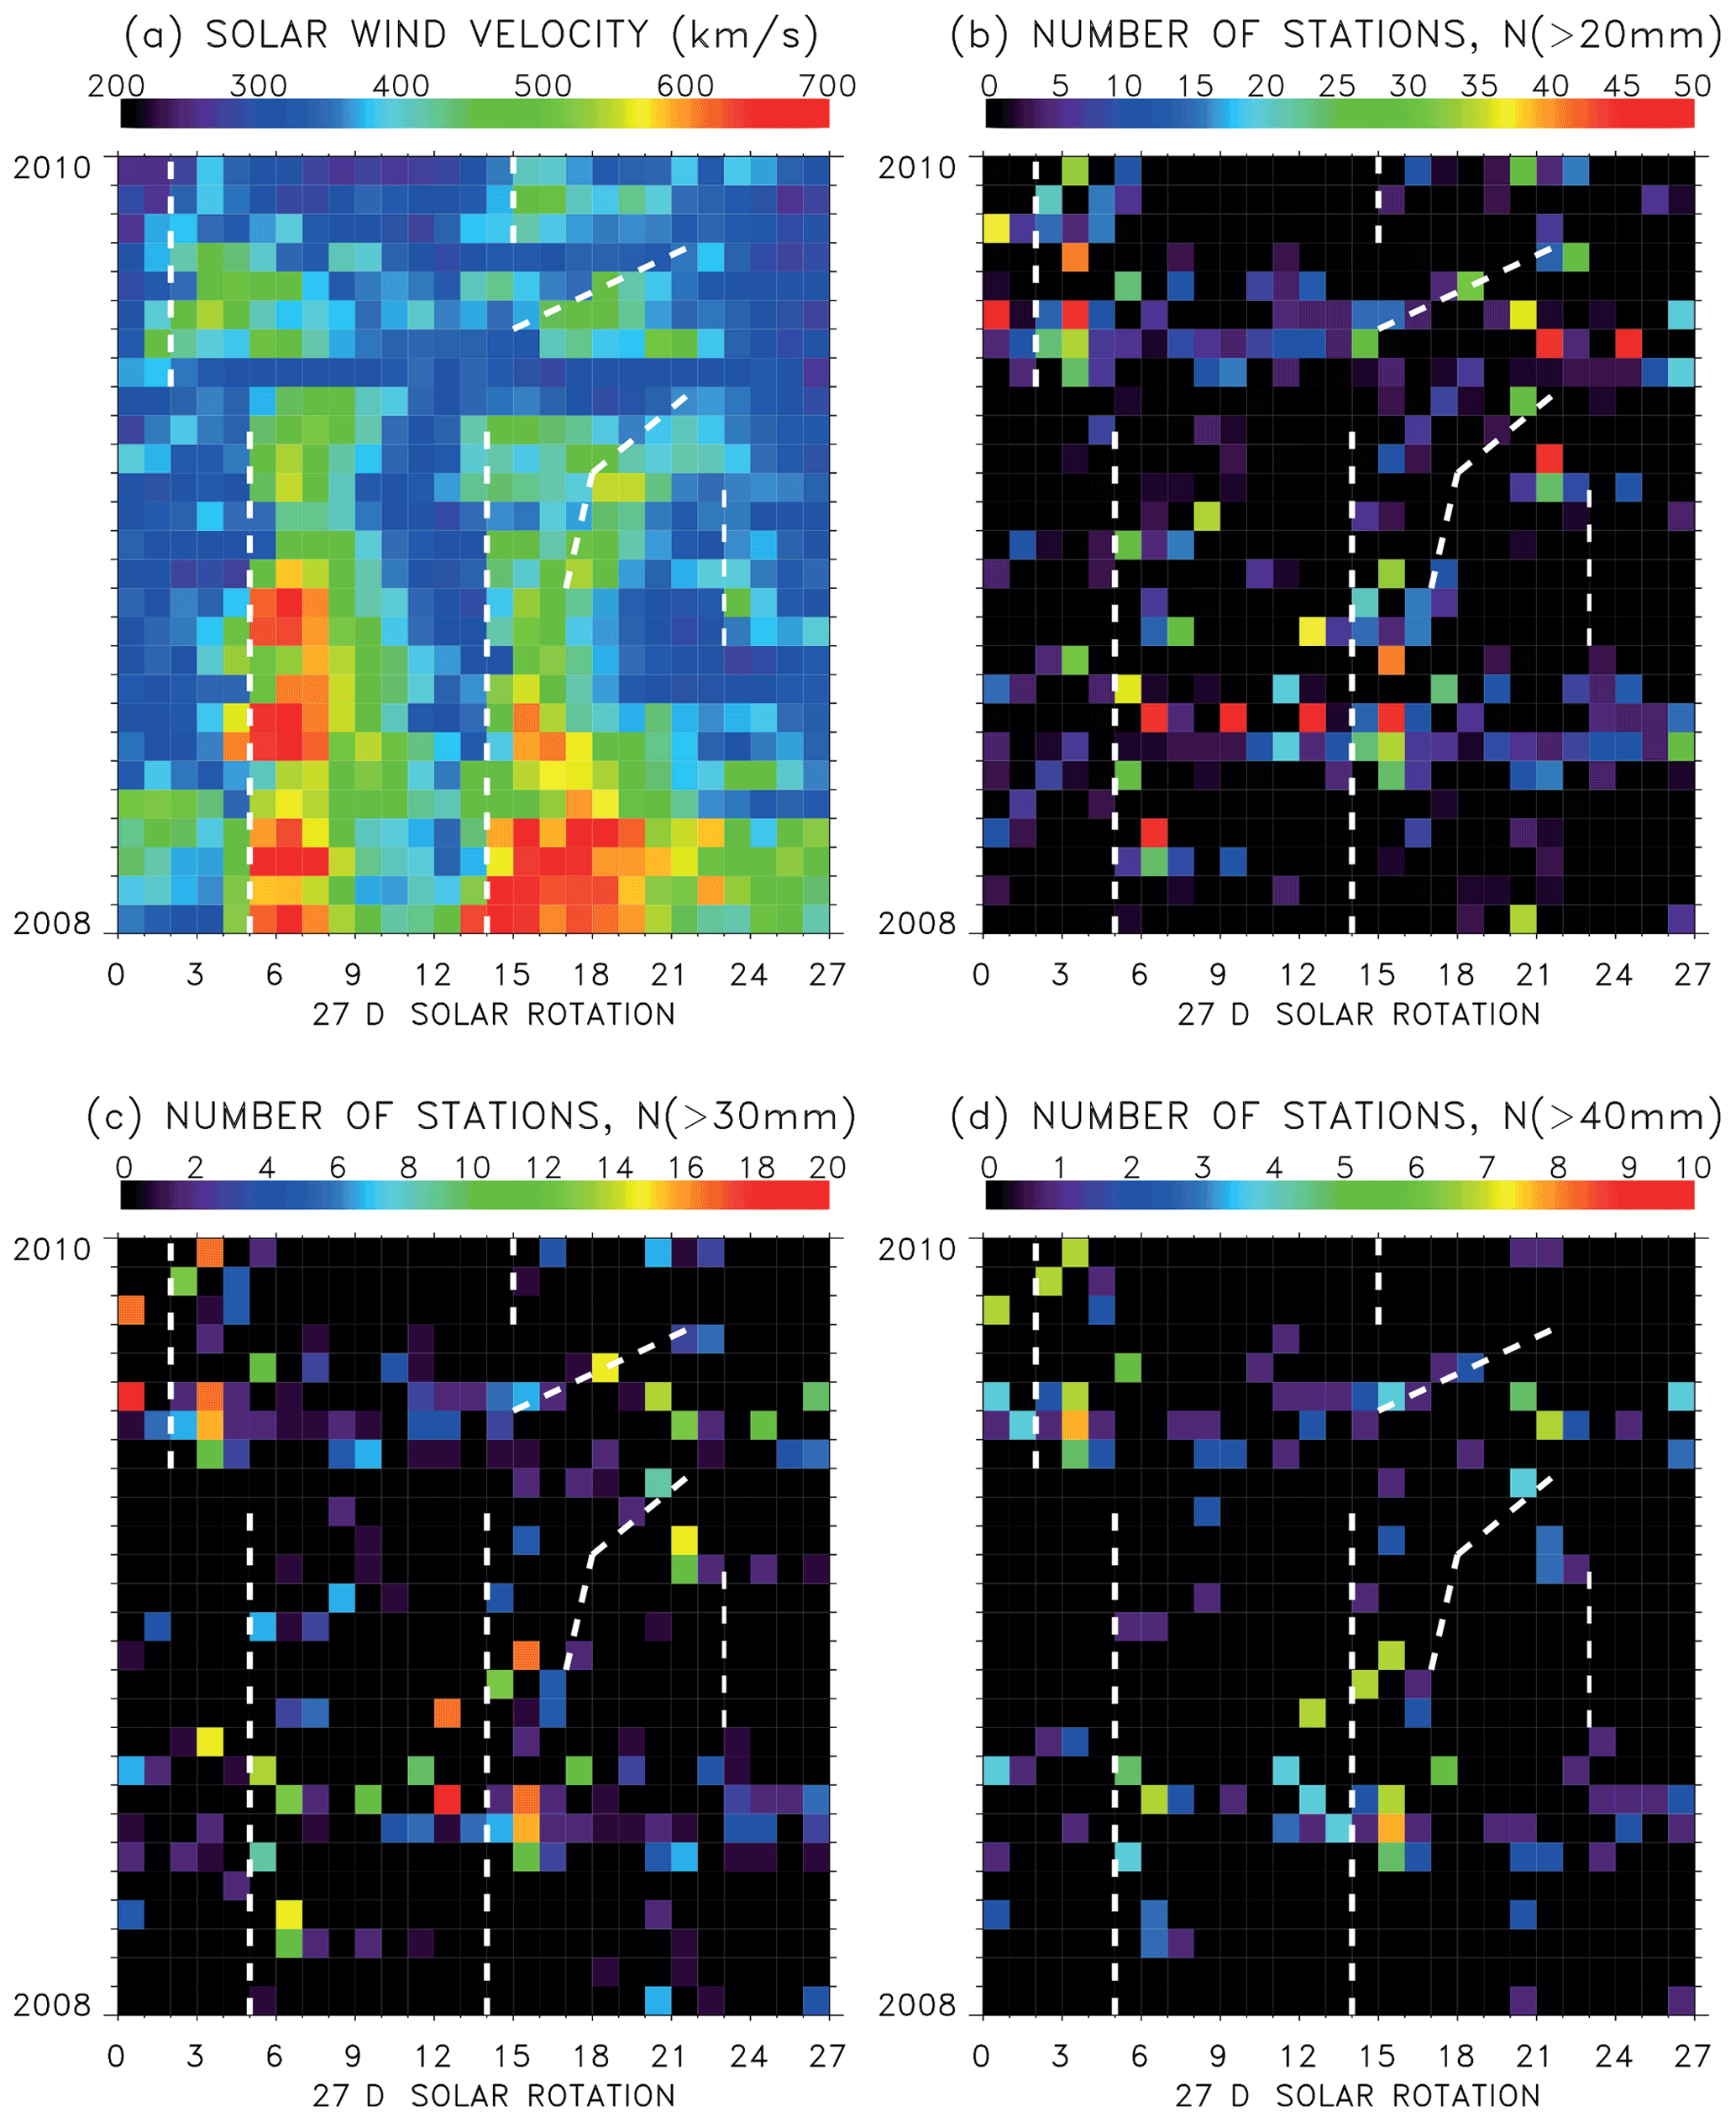
Figure 8Daily averages of (a) solar wind velocity and (b, c, d) the number of rain gauge stations in Slovakia that measured daily precipitation rates exceeding given thresholds ordered by 27 d solar rotation. Dashed lines mark approximate arrivals of recurrent solar wind streams.
Of course, HSS/CIRs and their sources, coronal holes, are more often spaced by less than 27 d, typically by ∼ 9 or 13.5 d, depending on how many coronal holes cross the solar meridian in one solar rotation. Because their spacing varies over a period of many years (Fig. 6), the SPE analysis averaging smears these intermediate variations. Recurrent coronal holes, which are generally regularly spaced in heliographic longitude, are often present during the descending phase of the solar cycle and around solar minima. De Toma (2011) analyzed coronal holes during the extended minimum between Cycles 23 and 24. Altogether, two or three low-latitude coronal holes per solar rotation were observed by SOHO/EIT in 2008 separated by about 110–120∘ in longitude (de Toma, 2011; see their Figs. 5 and 6) and produced recurrent HSSs (Tsurutani et al. 2011; see their Figs. 2 and 4). Figure 8 shows stack plots ordered by the solar rotation of daily averages of solar wind velocity and daily numbers of stations in Slovakia with above-threshold daily precipitation rates, N20 mm, N30 mm, and N40 mm, for the years 2008 and 2009 at the end of the solar cycle 23 that included the solar minimum. There were two recurrent major HSSs, and at times even a third weaker one, that were spaced by about 9 d on average and persisted for more than a year. They were later followed by two streams spaced by about 14 d. The dashed lines in Fig. 8a indicate approximate arrivals of HSS/CIRs. Because the coronal holes that produce the streams evolve over time, the arrival times of the HSS/CIRs can change from rotation to rotation, as indicated by the tilted dashed line. Figure 8b–d show time series N20 mm, N30 mm, and N40 mm, with approximate HSS/CIR times from Fig. 8a also shown. On average, the occurrence of heavy rainfall followed the arrivals of major HSSs. This is very similar to the effects on the ionosphere following major HSS/CIRs (Prikryl et al., 2012; see their Fig. 7).
The SPE analysis for this period shows quite regularly spaced, predominantly southern coronal holes (Fig. 9a), and corresponding recurrent streams, including CIRs (Fig. 9b). The mean IGC (white dotted line) is now shown for 10∘ S heliographic latitude. Figure 9c shows the cumulative numbers of stations, N20 mm, N30 mm, and N40 mm, along with the three-point running average of the mean daily rate, all displaying variations that are very similar to those of solar wind parameters (Fig. 9b). Figure 9d shows CCFs computed for V paired with IGC, np, B,σBz, and the mean precipitation rate, all displaying primary peaks separated by 27 d, and several secondary peaks spaced by 9 d. In particular, the CCFs (B; V), (; V), and (mean rate; V) are almost identical, with maximum correlation coefficients at lag +1 d of 0.71, 0.78, and 0.71, respectively. The CCF (mean rate, B; not shown) peaks at lag zero with a maximum correlation coefficient of 0.55. Of note is that is a measure of solar wind Alfvén wave amplitudes that are largest following arrivals of HSS/CIRs but continue to be relatively high inside the HSS, while B and np tail off faster (Fig. 9b), which is likely the reason why the peak of the CCF (; V) cross-correlation coefficient is highest.
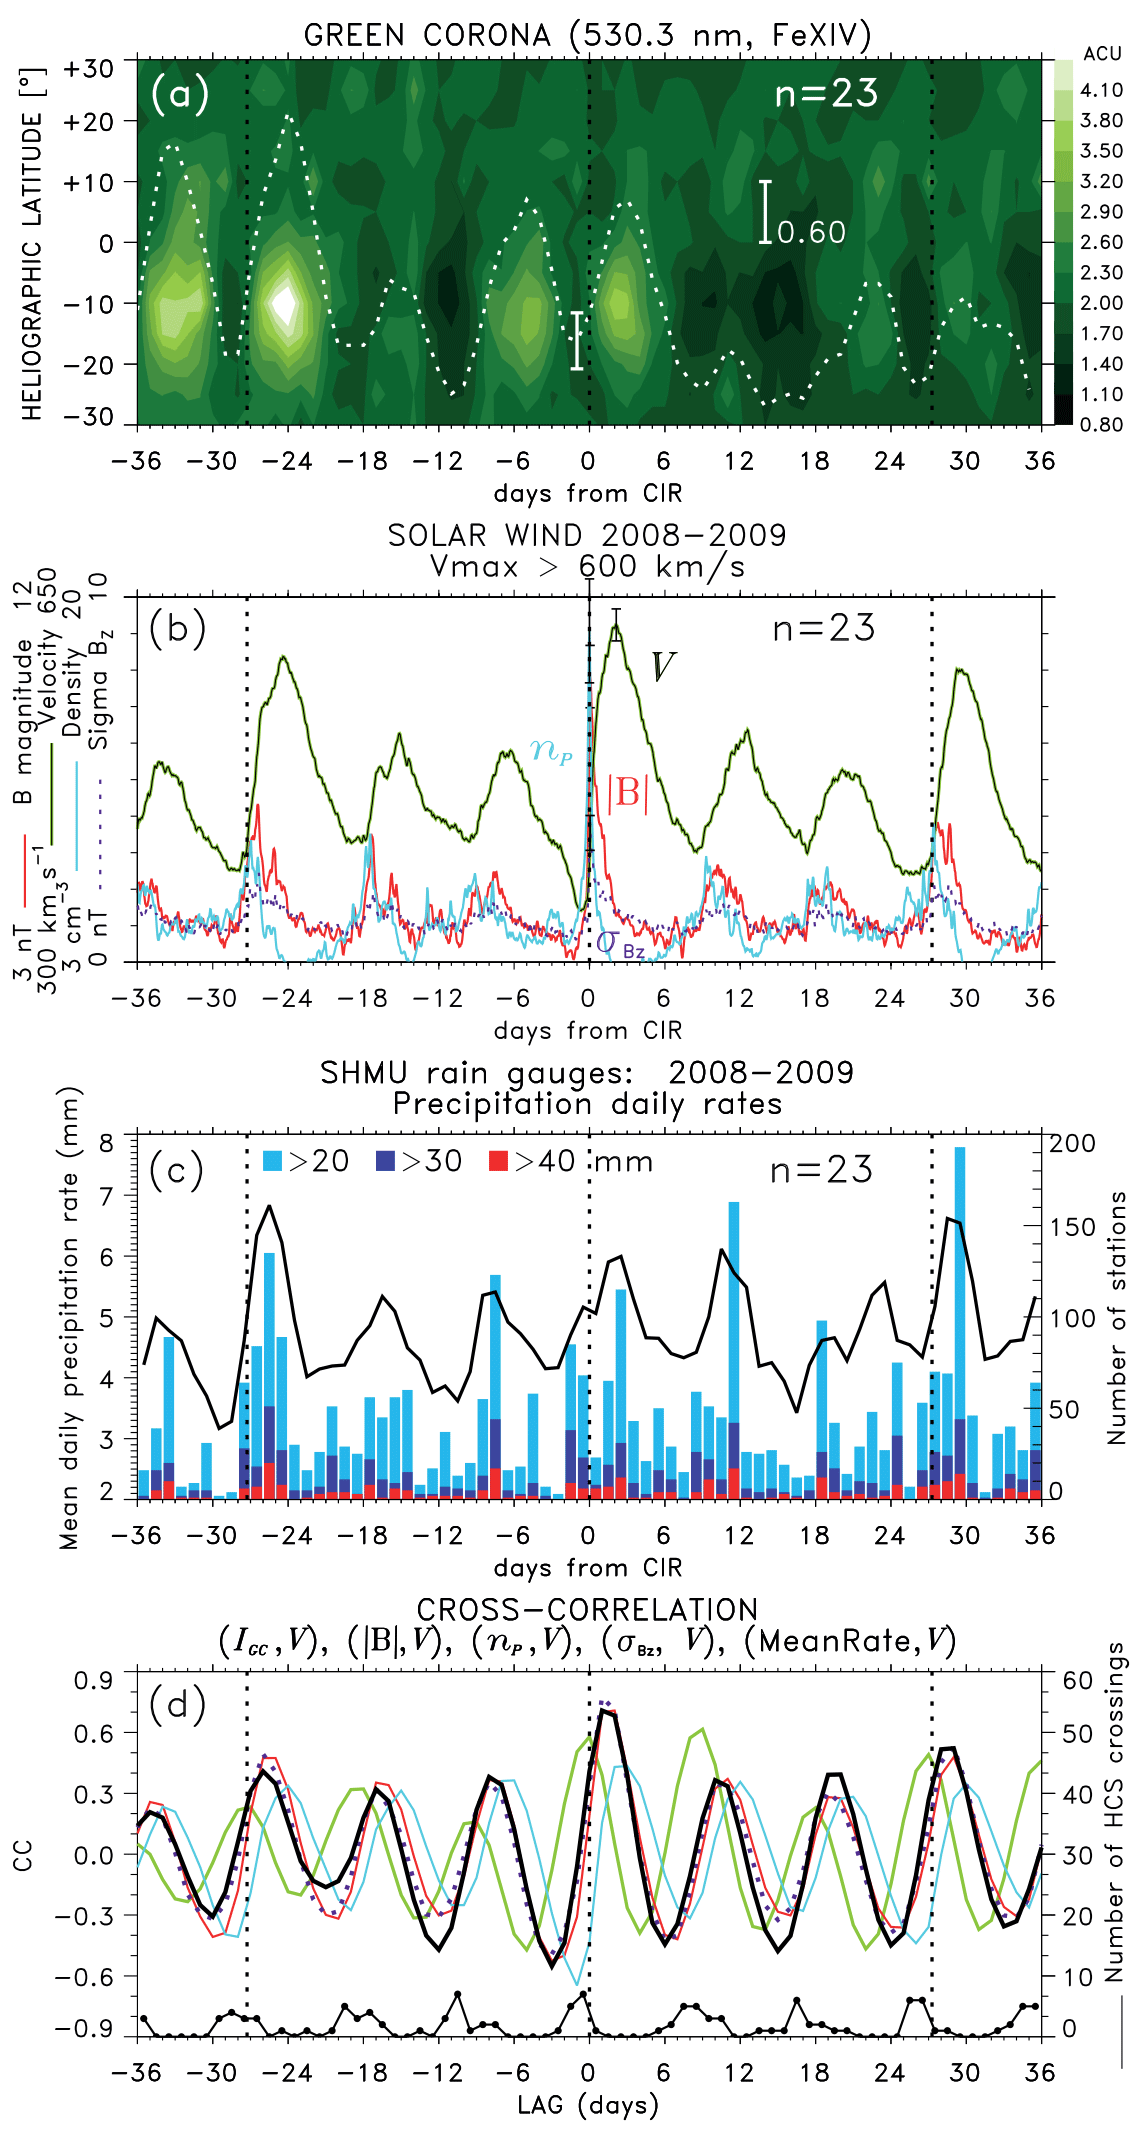
At the bottom of Figs. 6d and 9d, cumulative numbers of HCS crossings show a peak preceding the key time (CIRs) by 1 d or less and similar peaks for the recurrent HSS/CIRs at ±27 epoch days, as well as the intermediate HSS/CIRs in Fig. 9b. If the key time in the above SPE analysis is defined by HCS crossings instead of HSS/CIRs, results that are similar to those in Figs. 6 and 9 are obtained, but the patterns from the minima and maxima of precipitation rates are shifted by about 1 d (not shown). These results are similar to the Wilcox effect (Prikryl et al., 2009a; their Figs. 3 and 4) briefly discussed in the Introduction. As already mentioned, the Wilcox effect is concerned with the minimum in the VAI following the HCS crossing near epoch day + 1. Originally, there was no reference to the maximum in the VAI that followed a few days later. The VAI minimum was linked to a calm solar wind period characterized by a weak magnetic field and the absence of Alfvén waves (Prikryl et al., 2009a), referred to as the “calm before the storm” in CIR/magnetosphere interactions (Borovsky and Steinberg, 2006). The minimum in the occurrence of high-rate precipitation appears to correspond to the minimum in “storminess” characterized by the VAI, although it is noted that the latter was limited to winter months. Therefore, the similarity with the present results ends there.
In the Sects. 3 and 4, we showed statistical evidence of the relationship between the solar wind HSS/CIRs and the occurrence of significant rainfall, focusing on the period of 2003–2019 covered by the SHMU annual reports. We now discuss specific cases of extreme rainfall and flash floods in Slovakia, where the most affected region by floods is north-eastern Slovakia. Among the most vulnerable areas in recent years are the river basins of the Topl'a, Ondava, Hornád, Torysa, Laborec, and Poprad rivers. Under the influence of long-lasting and intense precipitation, numerous flood waves arise, which may not be adequately mitigated by manipulating hydraulic structures. The water levels in many profiles on watercourses reached historical maxima in the abovementioned regions. The regular occurrence of floods in eastern Slovakia is given primarily by a total land water regime, which is dominated by the very low absorptive power of heavy clayey soils of the Flysch zone (Azañón et al., 2010) and adverse conditions of forests in eastern Slovakia.
One locality that has been repeatedly affected by flash floods in Slovakia is the High Tatras mountain range (Tatra National Park). In general, mountainous regions are often associated with flash floods, likely because of the orographic enhancement of precipitation and the anchoring of convective events, as well as various aspects of topographic relief that promote rapid concentration of streamflow (Borga et al., 2011). The Tatra Mountains are the highest part of the Carpathians, and this alpine massif in northern Slovakia has the highest total annual precipitation. Similarly, the northern slopes of the Tatra Mountains in Poland are affected by flash floods that are included in the SPE analysis in Fig. 1.
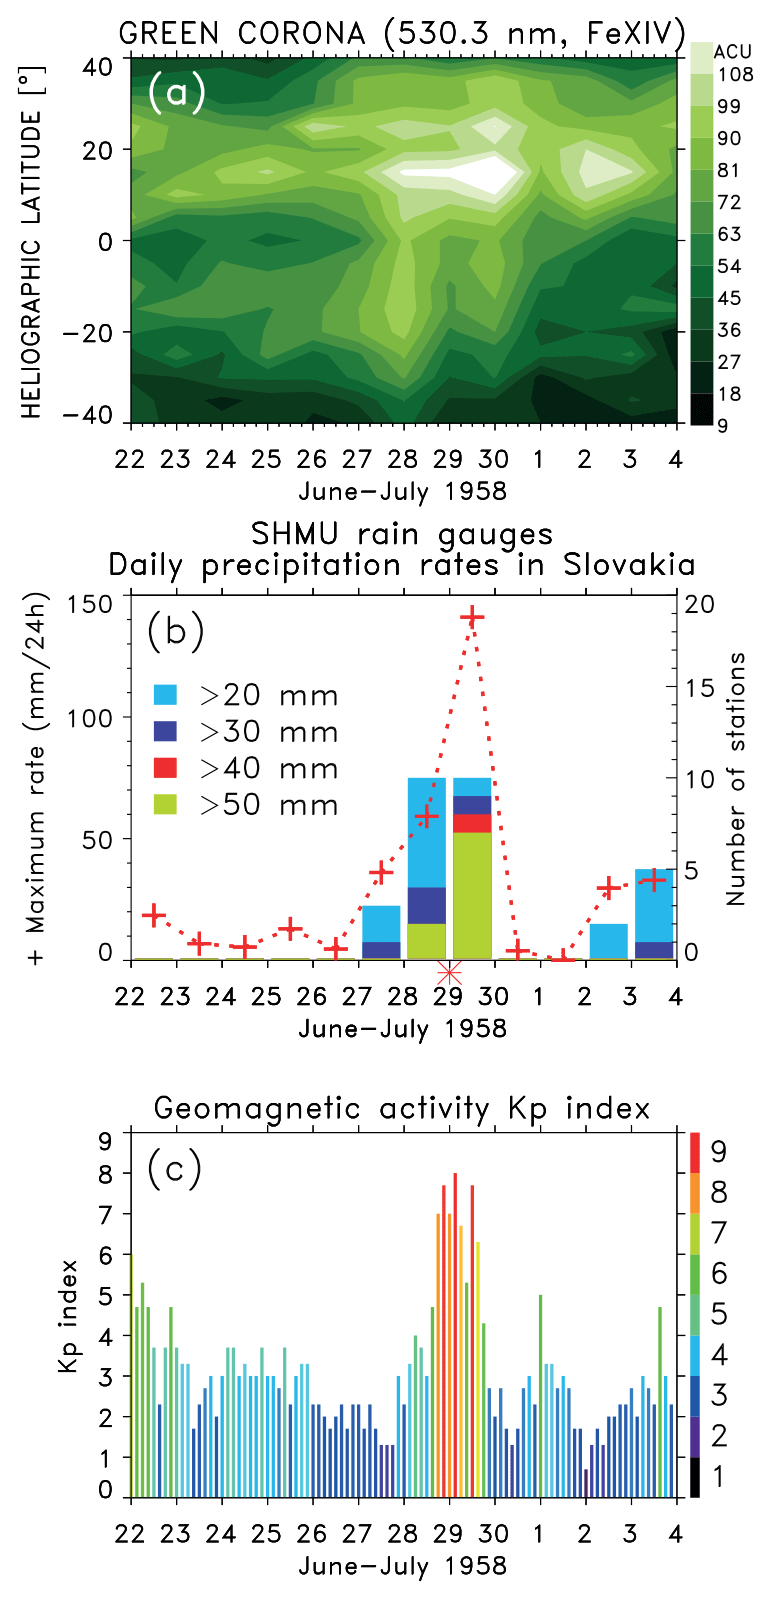
Figure 10Time series of (a) a green corona intensity, (b) maximum daily precipitation rate (red crosses) and cumulative number of stations that recorded daily rainfall exceeding given thresholds, and (c) Kp index of geomagnetic activity for the period that included the flash flood on 28–29 June 1958. The red asterisk marks the interplanetary magnetic sector boundary (Svalgaard, 1975).
The most extreme flash flood that affected the southern slopes of the massif occurred on 28–29 June 1958 (Pekárová et al., 2011). Several stations recorded daily precipitation rates exceeding 50 mm, with the maximum reaching 170 mm at Skalnaté pleso (1778 m a.s.l.; Šamaj et al., 1985). Although there were no spacecraft monitoring the solar wind at that time, coronal holes, the sources of HSSs, can be identified in synoptic maps of green corona intensity observed at high-altitude observatories. Furthermore, sector boundary crossings can be estimated from ground-based magnetograms (Svalgaard, 1975). Figure 10a shows the synoptic map of green corona intensity, indicating large southern coronal holes during this period. Here we are concerned with the coronal hole prior to 27 June, a source of HSS that impacted the Earth around 28–29 June (HCS is shown by an asterisk in Fig. 10b). There is also a possibility of an ICME from the bright coronal region on the Sun that may have arrived at about the same time, thus amplifying the intensity of the impact on the Earth's magnetosphere and making it more geo-effective. The 3 h Kp index of geomagnetic activity (https://www.swpc.noaa.gov/products/planetary-k-index, last access: 11 August 2021) reached very high values (Fig. 10c) during the strong geomagnetic storm with Dst index (Gonzalez et al., 1994), reaching −180 nT early on 29 June, which coincided with the heaviest rainfall.
Figure 11 shows another case of a severe flash flood that occurred on 29–30 June 1973. It followed the arrival of a very fast HSS (>750 km/s; Fig. 11b) from a large northern coronal hole (Fig. 11a). The asterisks show the stream interfaces of two CIRs, both causing a significant increase in geomagnetic activity (Fig. 11d) and triggering moderate geomagnetic storms on 23–24 and 28–29 June. Both geomagnetic storms coincided with heavy rainfall events. The second one, with a maximum daily rate of 102.5 mm at Skalnaté pleso (1778 m a.s.l.) on 30 June, caused a flash flood in the High Tatras.
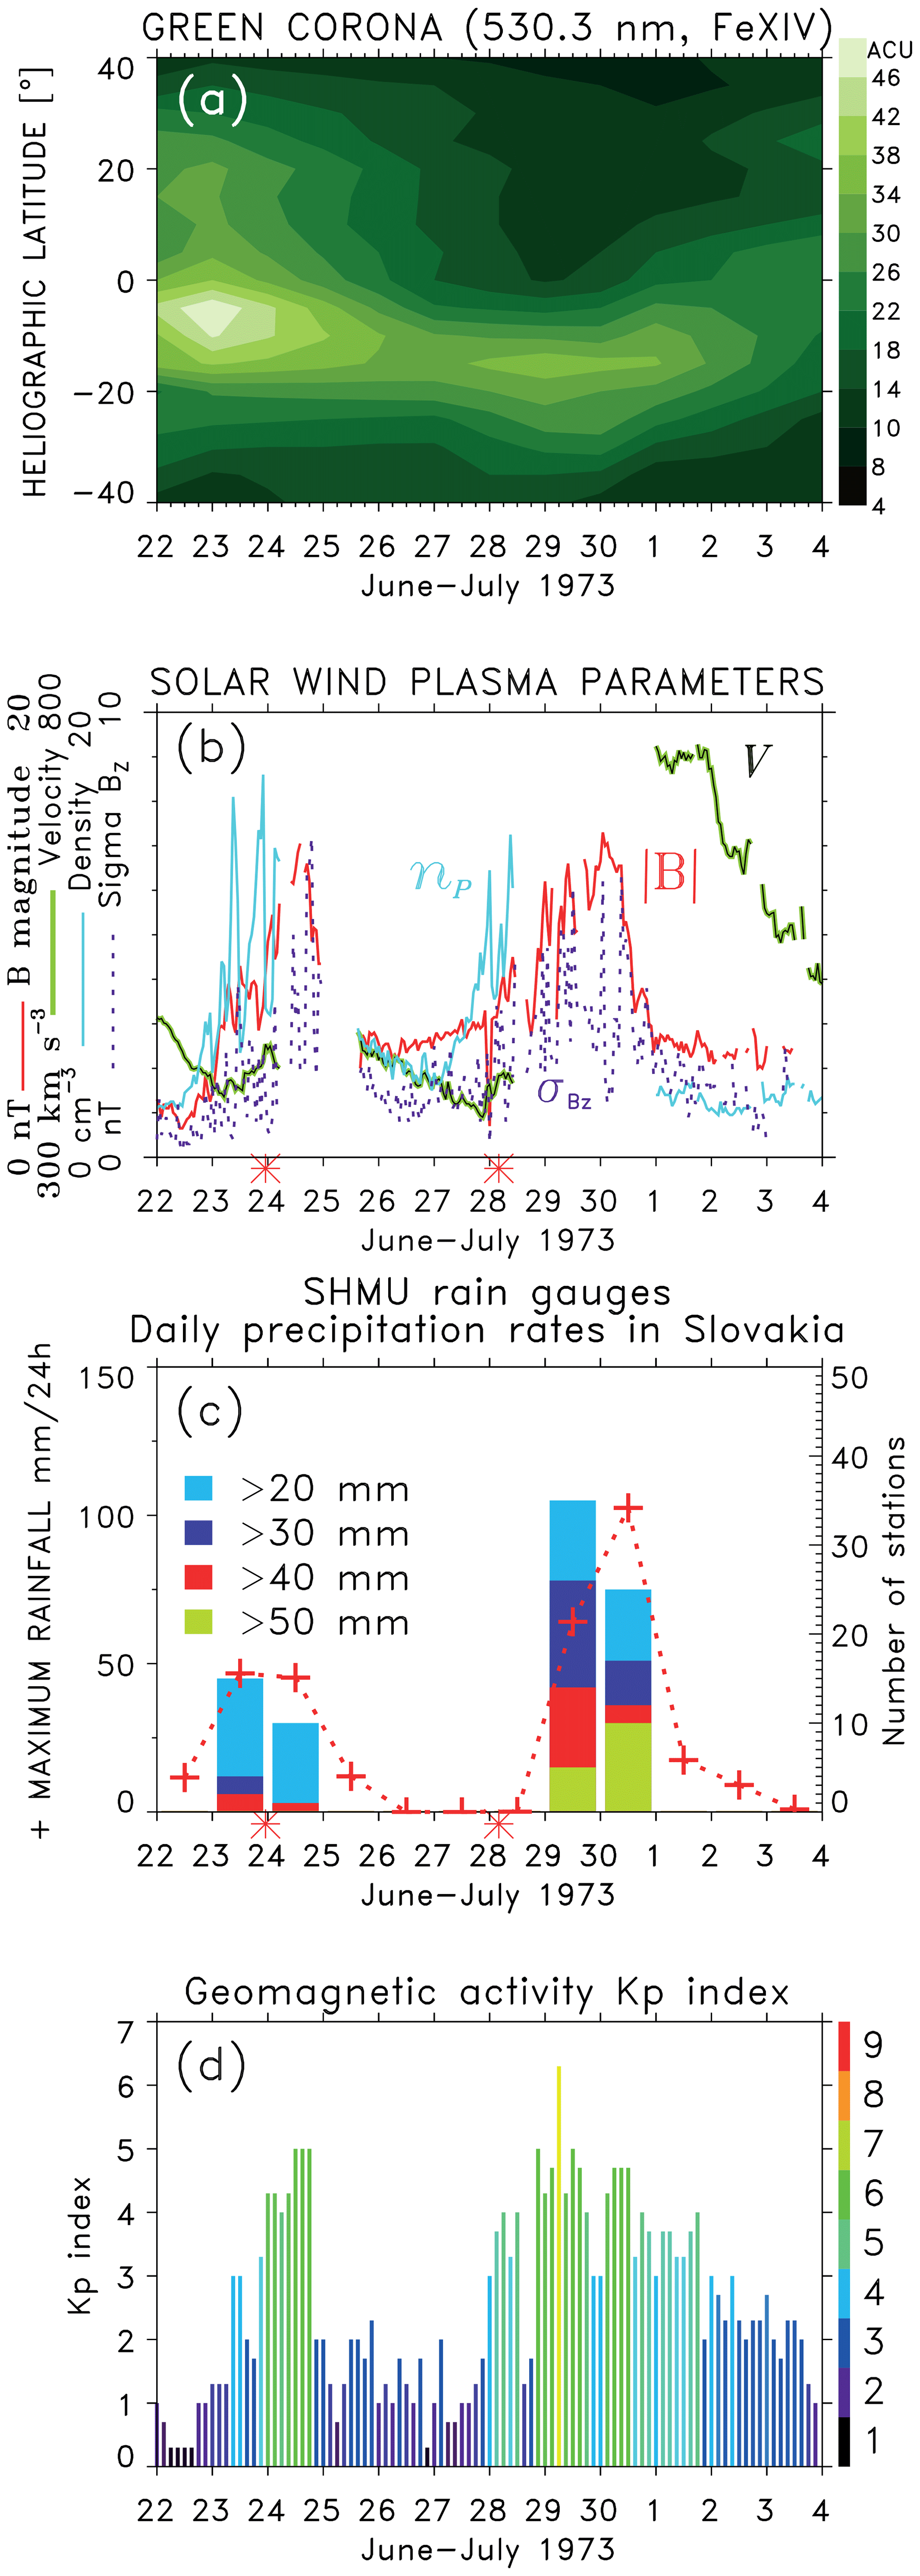
Figure 11Time series of (a) green corona intensity, (b) solar wind plasma parameters, (c) maximum daily precipitation rate and cumulative number of stations that recorded daily rainfall exceeding given thresholds, and (d) Kp index of geomagnetic activity for the period that included the flash flood on 29–30 June 1973. Red asterisks mark HSS interfaces (CIRs).

Figure 12The same as Fig. 11 but for the period that included the flash flood on 22–24 July 2008.
In July 2008, maximum precipitation (144.6 mm) was observed in Tatranská Javorina on 23 June, and the total between 20 and 24 July reached 260.2 mm, the largest recorded at this station. This was a year of solar minimum, and the green corona intensity was very low. However, a coronal hole can be identified (Fig. 12a), and a small, compact coronal hole was observed by SOHO in the extreme ultraviolet (EUV) images. The arrival of an HSS, reaching a maximum V of 650 km/s, and a broad/double CIR with two stream interfaces on 21 and 22 July (the first of them marked with asterisk in Fig. 12b) was followed by moderate geomagnetic activity (Fig. 13d). There were two spikes of intense rainfall recorded at many stations.
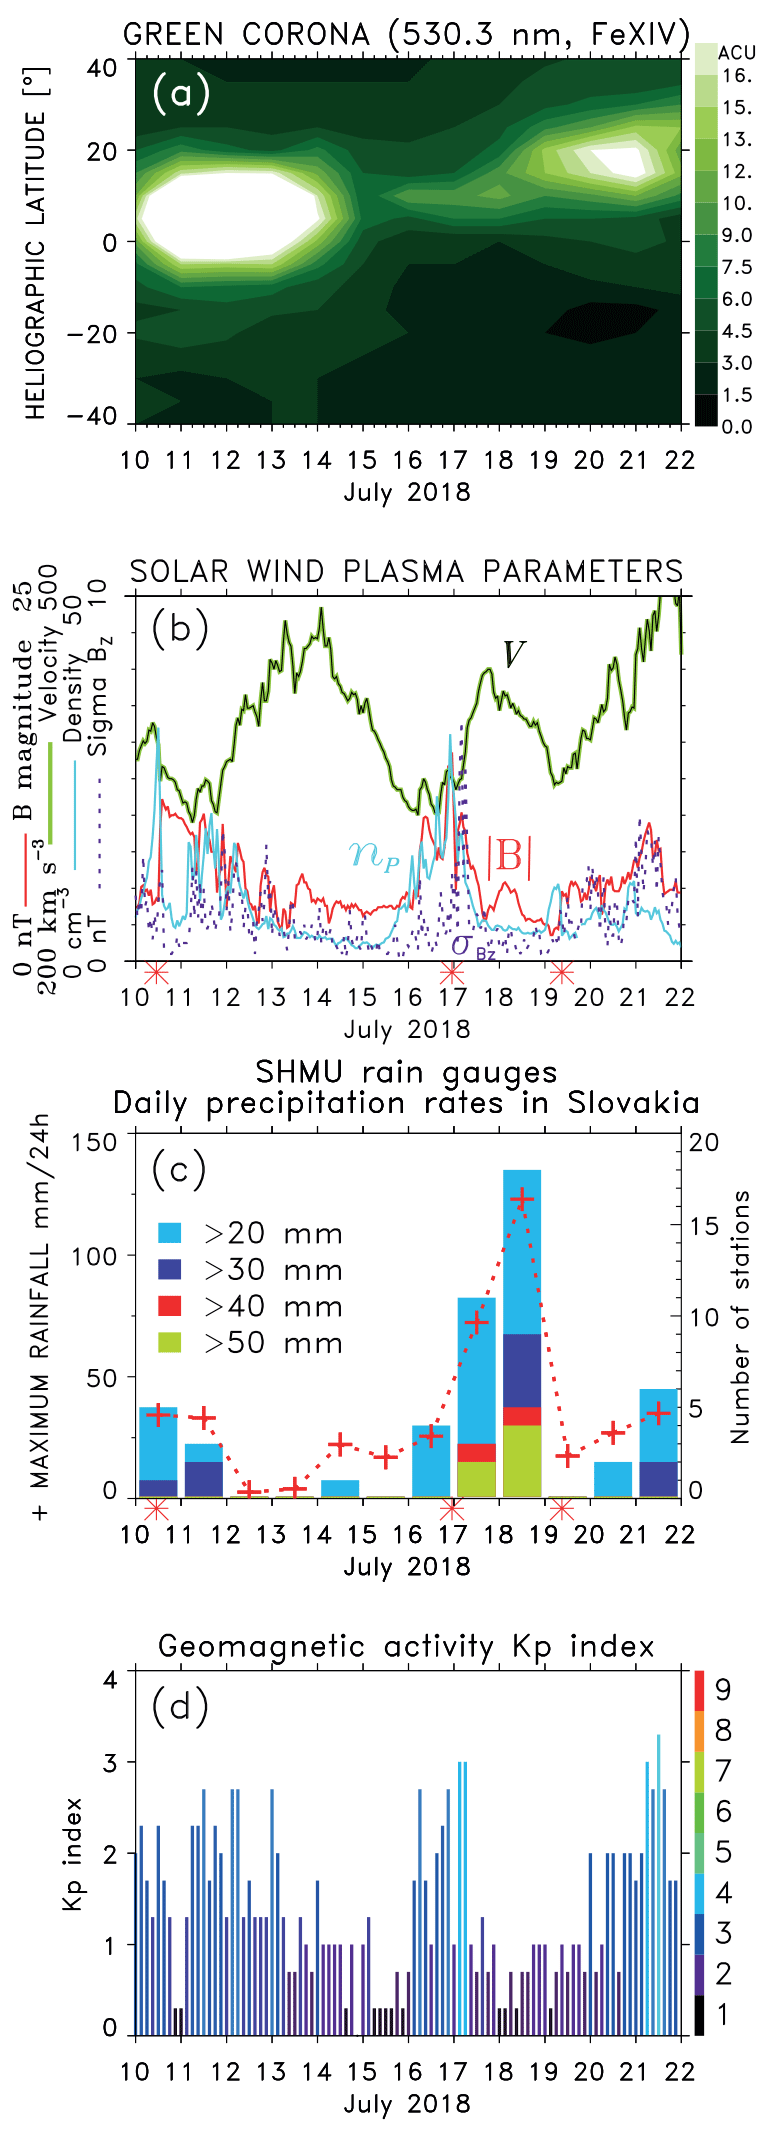
Figure 13The same as Fig. 11 but for the period that included the flash flood on 17–18 July 2018.
The last major flood in Tatra National Park was caused by heavy rainfall from 17 to 18 July (Fig. 13c), with the precipitation maximum of 123 mm on 18 July that closely followed the arrival of HSS/CIRs on 17 July (Fig. 13b) from a large and structured north–south coronal hole (Fig. 13a). While the planetary Kp index was relatively low (Fig. 13d), the strong CIR on 16–17 July produced by the stream that initially reached Vmax ≈ 440 km/s, but a few days later exceeded 500 km/s, triggered intense auroral substorm activity observed by the IMAGE magnetometers on 16 July (https://space.fmi.fi/image/, last access: 11 August 20121). The CIR was followed by large amplitude ultralow frequency (ULF) fluctuations of the ground magnetic field caused by ionospheric current fluctuations early on 17 July. These are the sources of AGWs discussed in the next section.
In this section, we discussed only some of the most severe flash floods on the southern slopes of the High Tatras mountain range in Slovakia. The two flash floods in July 2001 were already mentioned in the Introduction and have been discussed elsewhere (Prikryl et al., 2018). Flash floods on the Polish side of this mountain range and flash floods mentioned in the SHMU annual reports (2003–2019) also showed a tendency to follow arrivals of HSS/CIRs (Fig. 1c and d).
We now discuss cases of heavy rainfall, floods, and flash floods in the geophysical context of solar wind MIA coupling. The hourly solar wind OMNI data (V, B, np, and ) show a series of major HSS/CIRs (red asterisks) and ICMEs (orange triangles) in July 2017 and June–July 2018. The negative deflections of the Dst index (green line) show geomagnetic storms that were triggered by HSS/CIRs, with the most intense one being in conjunction with an ICME on 16 July. The black symbols mark the start days/times of heavy rainfall that caused floods in Europe (triangles), Japan (circles), and the USA (squares). Most of these events closely followed the arrivals of HSS/CIRs or ICMEs. Because the actual start times of heavy rainfall events were generally not available, most of the symbols are shown at 12:00 UT (universal time), except for cases when the actual start time is known.

Figure 14The OMNI solar wind V (solid black line), B (red), np (broken light blue line), and (dotted purple line) in (a) June 2017 and (b) June–July 2018, with the y axis scales shown on the left. The geomagnetic storm index Dst is shown in the middle (green line). Major HSS/CIRs are marked by red asterisks and ICMEs by orange triangles at the time axis. At the top, orange dots show daily rates of rain precipitation at stations in Slovakia, and the orange symbols (♢) mark the start days/times of significant rainfall that caused floods in Slovakia. Black symbols mark the start days/times of heavy rainfall/flash floods in (Δ) Europe, (□) the USA, and Japan (∘). In purple, maximum daily rates (solid line) and the number of grid cells with rainfall exceeding 30 mm (dotted line) are from the Deutscher Wetterdienst (DWD) REGNIE data set.
The orange symbols (◇) in Fig. 14 mark the start days of significant rainfall that caused floods in Slovakia (taken from the annual reports on floods). The orange dots at the top show daily precipitation rates measured at SHMU stations. The floods on the rivers Bodrog and Ondava that were caused by significant rainfall (1 and 10 July) closely followed the arrivals of major HSS/CIRs. The floods on the Hron river tributaries (24 July) occurred in the peak of a strong and structured HSS (Fig. 14a) from a wide and structured coronal hole.
In addition to floods and flash floods, Fig. 14 shows daily precipitation rates measured at SHMU stations in Slovakia (orange dots). Also shown (in purple) are maximum daily rates and number of grid cells with rainfall exceeding 30 mm, from the Deutscher Wetterdienst (DWD) REGNIE data set. These variables show significant increases following most of the HSS/CIRs.
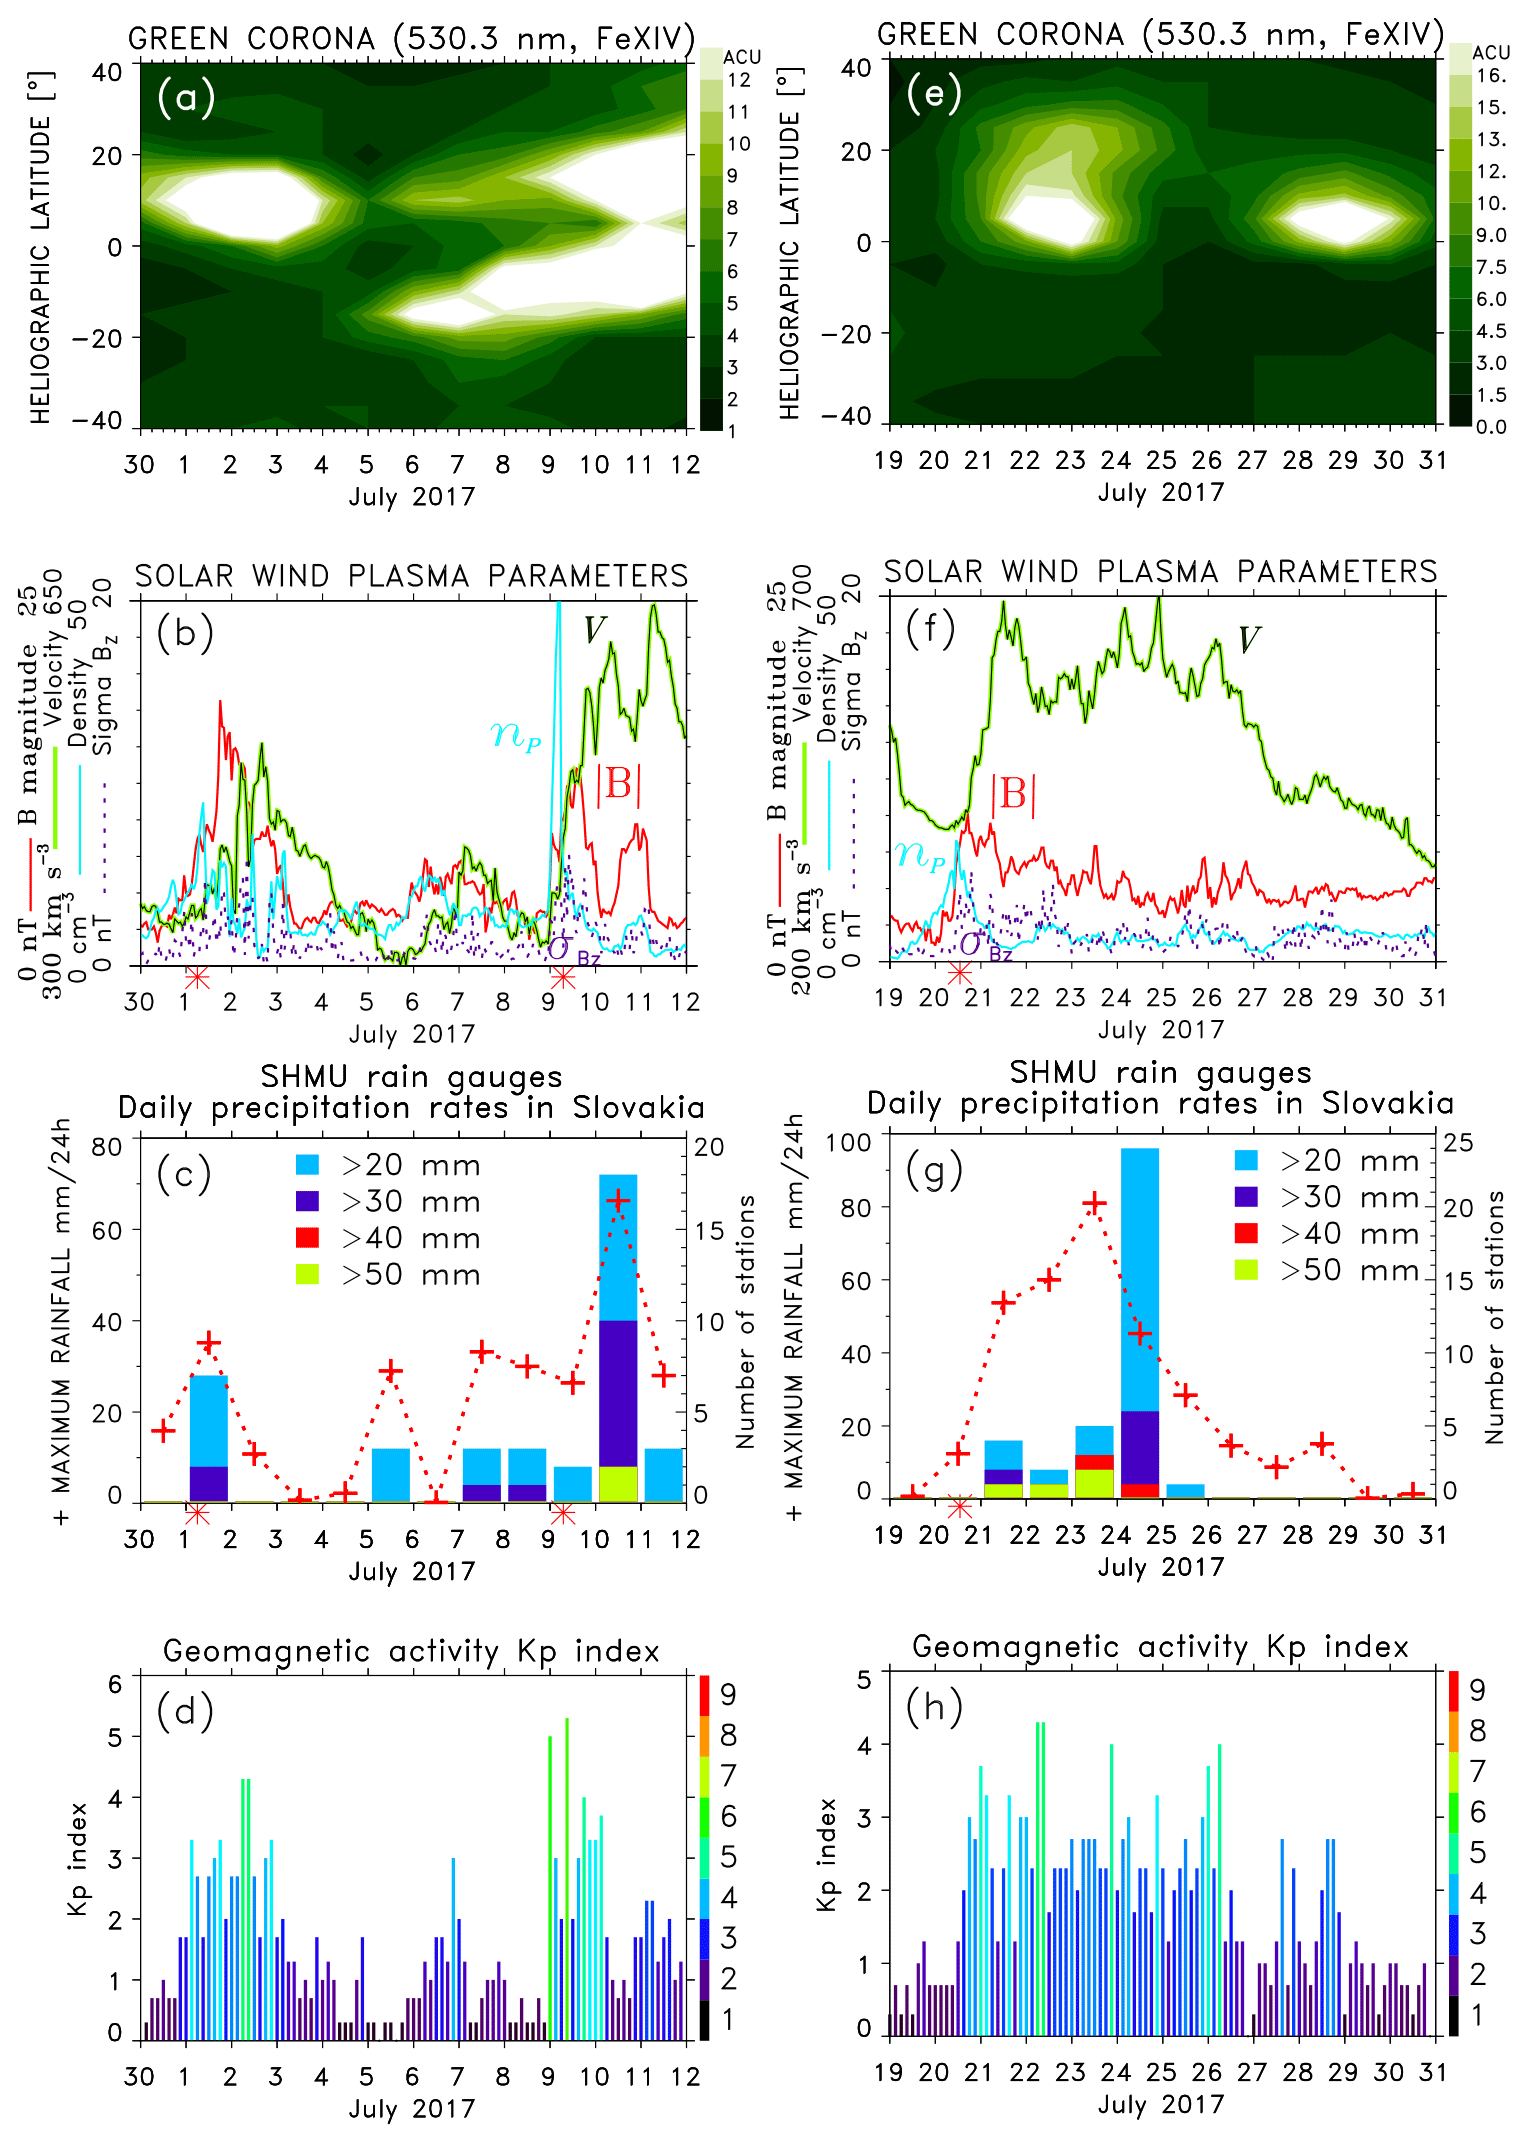
Figure 15The same as Fig. 11 but for the period that included floods on 1, 10, and 24 July 2017.
Figure 15a shows the synoptic map of green corona intensity, starting with a large southern coronal hole at the end of June and followed by a northern structured coronal hole that extended to low heliographic latitudes between 5 and 10 July. They produced two major HSSs that impacted the Earth with CIRs arrivals on 1 and 9 July and a minor HSS/CIR on 6 July (Fig. 15b), each causing an increase in geomagnetic activity (Fig. 15d). The arrivals of the two major HSS/CIRs were associated with maxima in daily precipitation, on 1 and 10 June, with the latter exceeding 60 mm (Fig. 1c).
The last HSS at the end of July 2017 is presented in Fig. 15e–h. Figure 15e shows two large north–south coronal holes joined into a wide structured coronal hole in southern latitudes that was a source of a strong and structured HSS (Fig. 15f). The arrival of this HSS/CIR on 20 July was followed by heavy precipitation in Slovakia that peaked on 23 July, exceeding 80 mm, followed by more rain and floods the next day (Fig. 15g). Furthermore, a flash flood caused by extreme rainfall exceeding 230 mm occurred in Kansas City on 22 July, and heavy rainfall exceeding 300 mm in many places in Japan was recorded on 22–24 July (Fig. 14a).
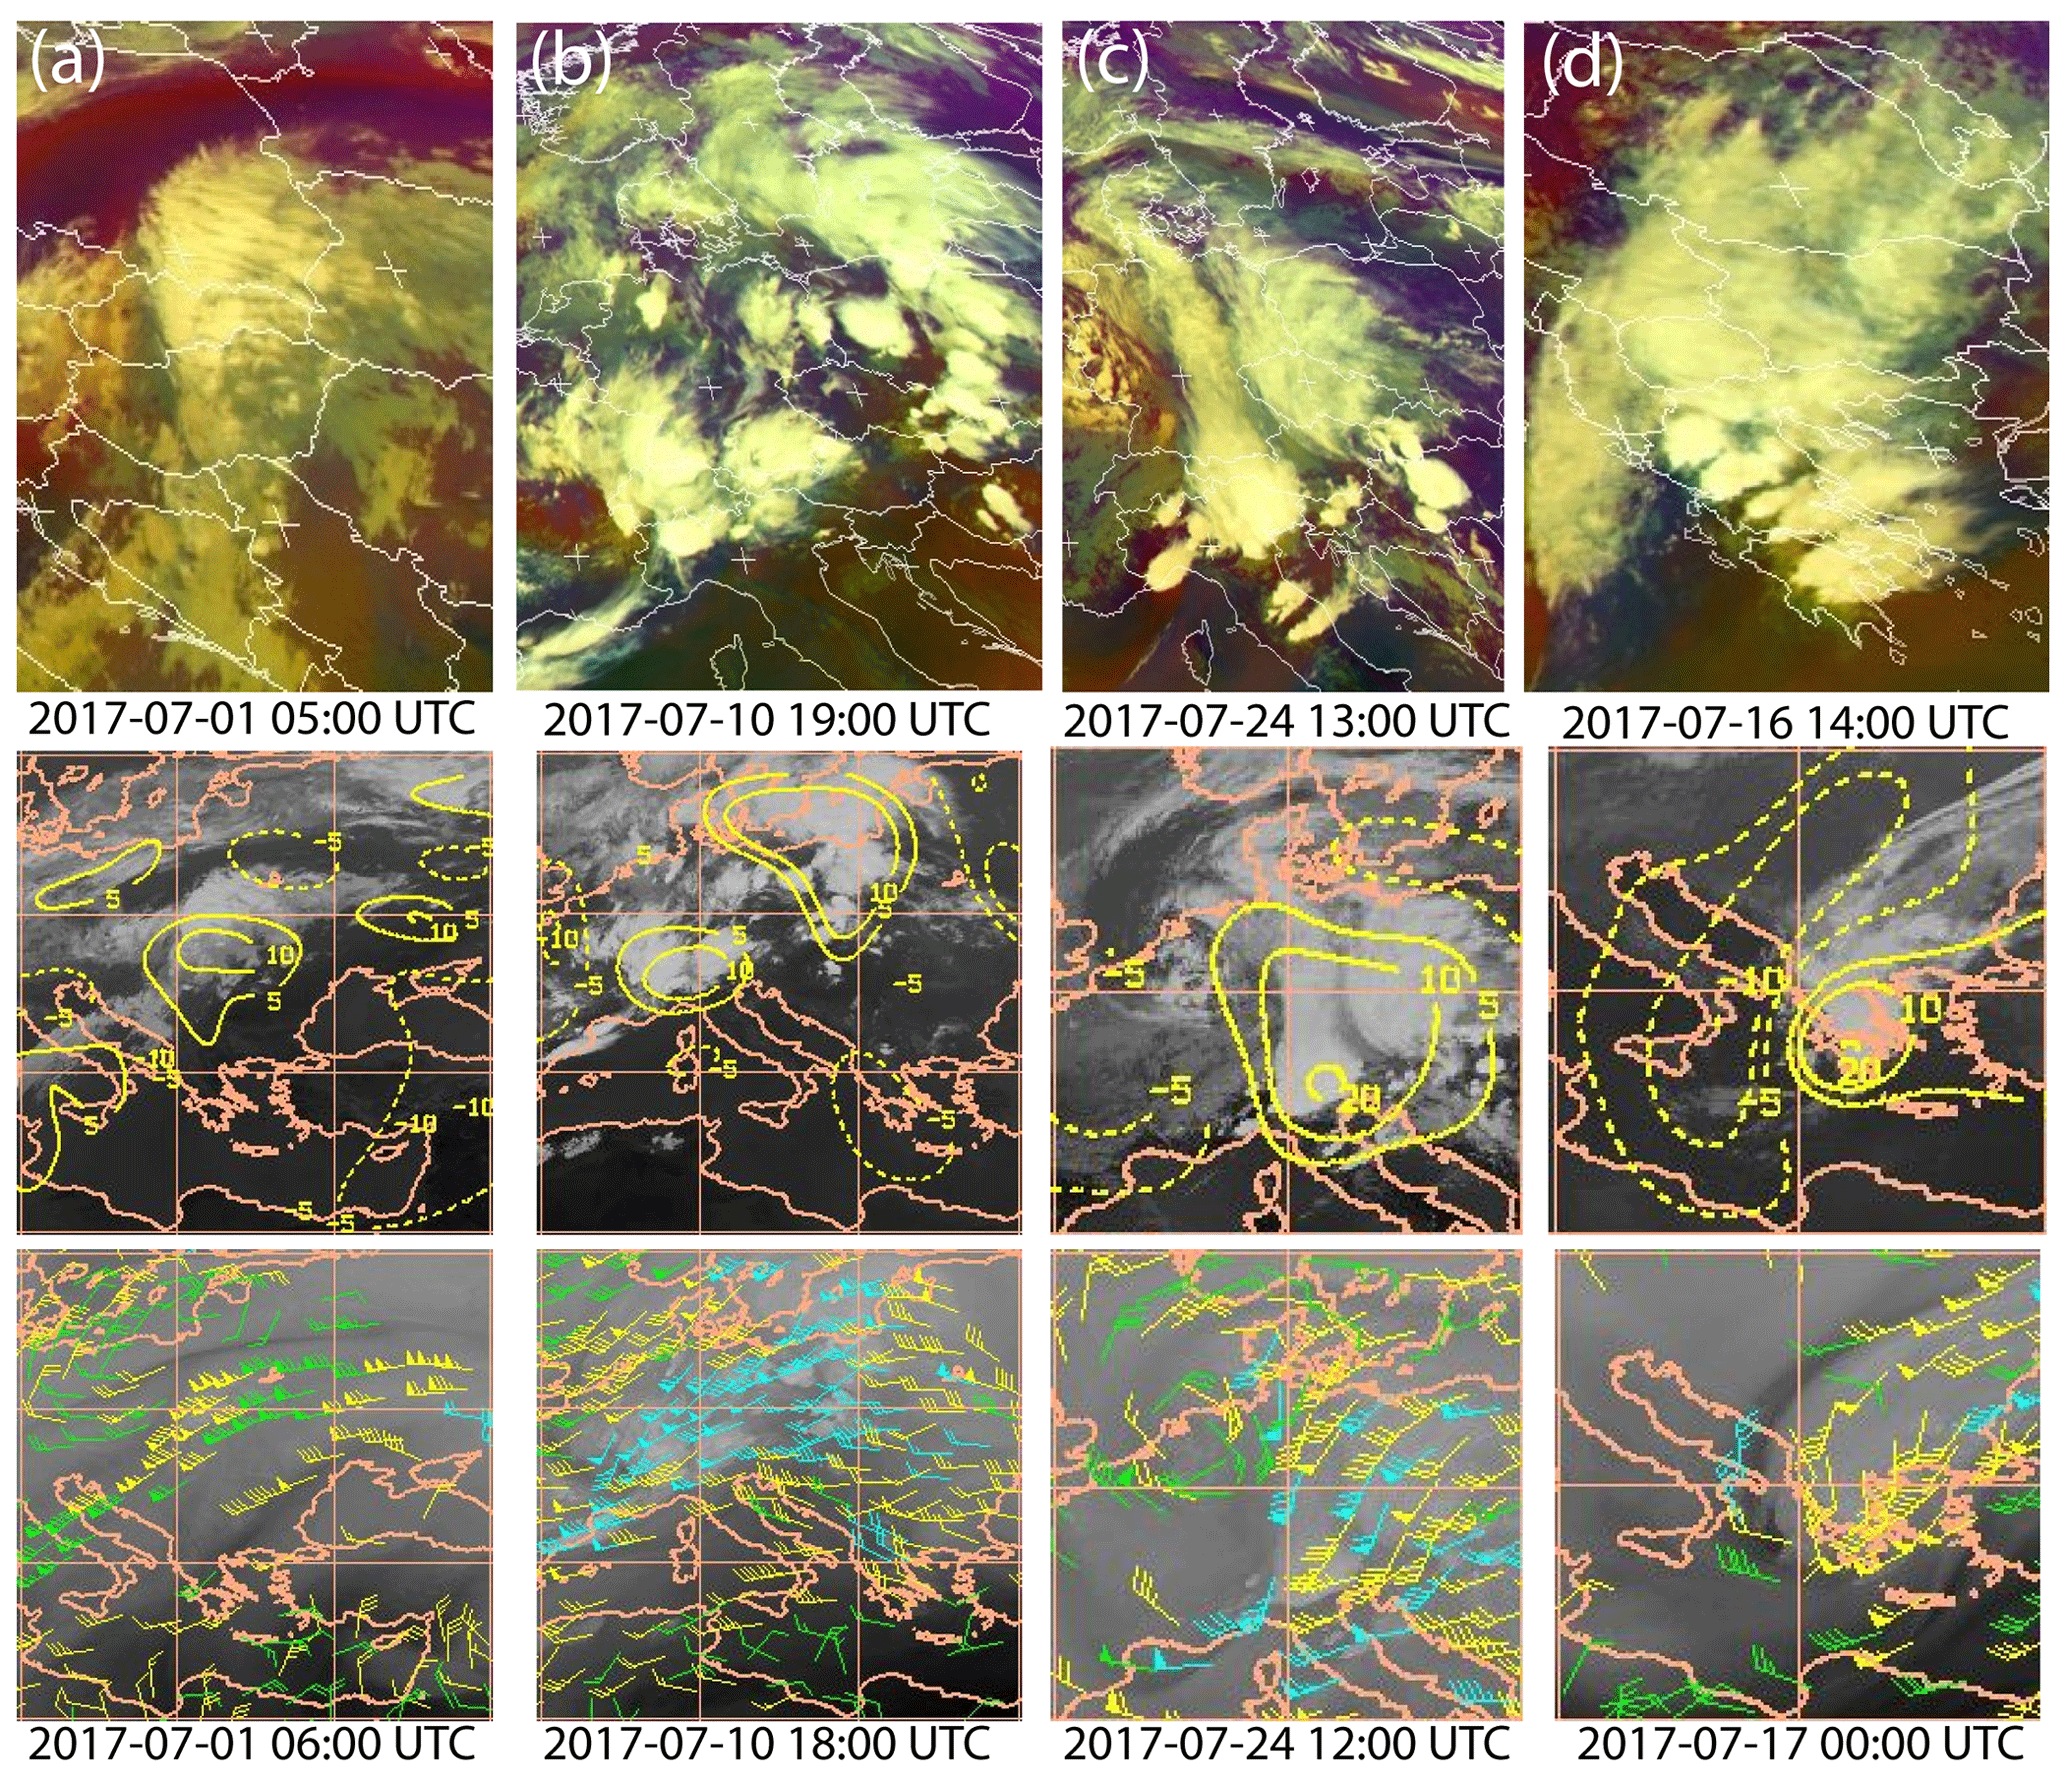
Figure 16The Meteosat RGB Composites Airmass images showing (a) a striated delta cloud in the warm frontal zone of an intensifying extratropical cyclone over Slovakia and Poland on 1 July, (b) a series of convective cells in the frontal zones of intensifying mesoscale systems on 10 July, (c) vigorous convective activity in frontal zones of mesoscale systems on 24 July, and (d) a string of convective cells in the intensifying severe weather system Medusa over Greece on 16 July 2017. (https://eumetview.eumetsat.int/static-images/MSG/RGB/AIRMASS/, last access: 11 August 2021). Overlain data products from the CIMSS tropical cyclones data archive of wind analysis (http://tropic.ssec.wisc.edu/archive/, last access: 11 August 2021) show the divergence between 150–300 mbar in the middle panels, and mid–upper level winds in the bottom panels, for approximately the same times as those of the images in the top panels.
Focusing on floods in Slovakia, a selection of the Meteosat RGB Composites Airmass images (composite based upon data from IR and WV channels) in Fig. 16 show intensifying mesoscale systems on 1, 10, and 24 July. Some of the convective cells/bands over Slovakia caused heavy rainfall leading to floods. On 1 July, starting at ∼ 02:00 UT a series of cloud/rain bands called striated delta cloud systems (Feren, 1995) developed in the warm frontal zone of an intensifying extratropical cyclone passing over eastern Slovakia and Poland (Fig. 16a).

Figure 17The line-of-sight (LoS) velocity observed by the SuperDARN Hankasalmi radar beam 11.
We now present relevant geophysical data collected by the SuperDARN radar in Hankasalmi, Finland, with beams pointing poleward over Svalbard measuring line-of-sight velocity Vlos of convection/flows in the ionosphere (Chisham et al., 2007). After 20:00 UT on 30 June, the radar observed a series of pulsed ionospheric flows (PIFs) with periods from 10 to 20 min between N70 and 75∘ latitudes (between the northern tip of Scandinavia and Svalbard). Figure 17 shows the median filtered line-of-sight velocity Vlos for radar beam 11 as a function of geographic latitude. Figure 18a shows a time series of Vlos for range gate 22 (75∘ latitude). The fast Fourier transform (FFT) power spectrum of the detrended time series (dotted line) shows a peak at 1.1 mHz (∼ 15 min). PIFs are sources of atmospheric gravity waves (Prikryl et al., 2005) that were likely launched several hours before the striated delta clouds developed on 1 July.
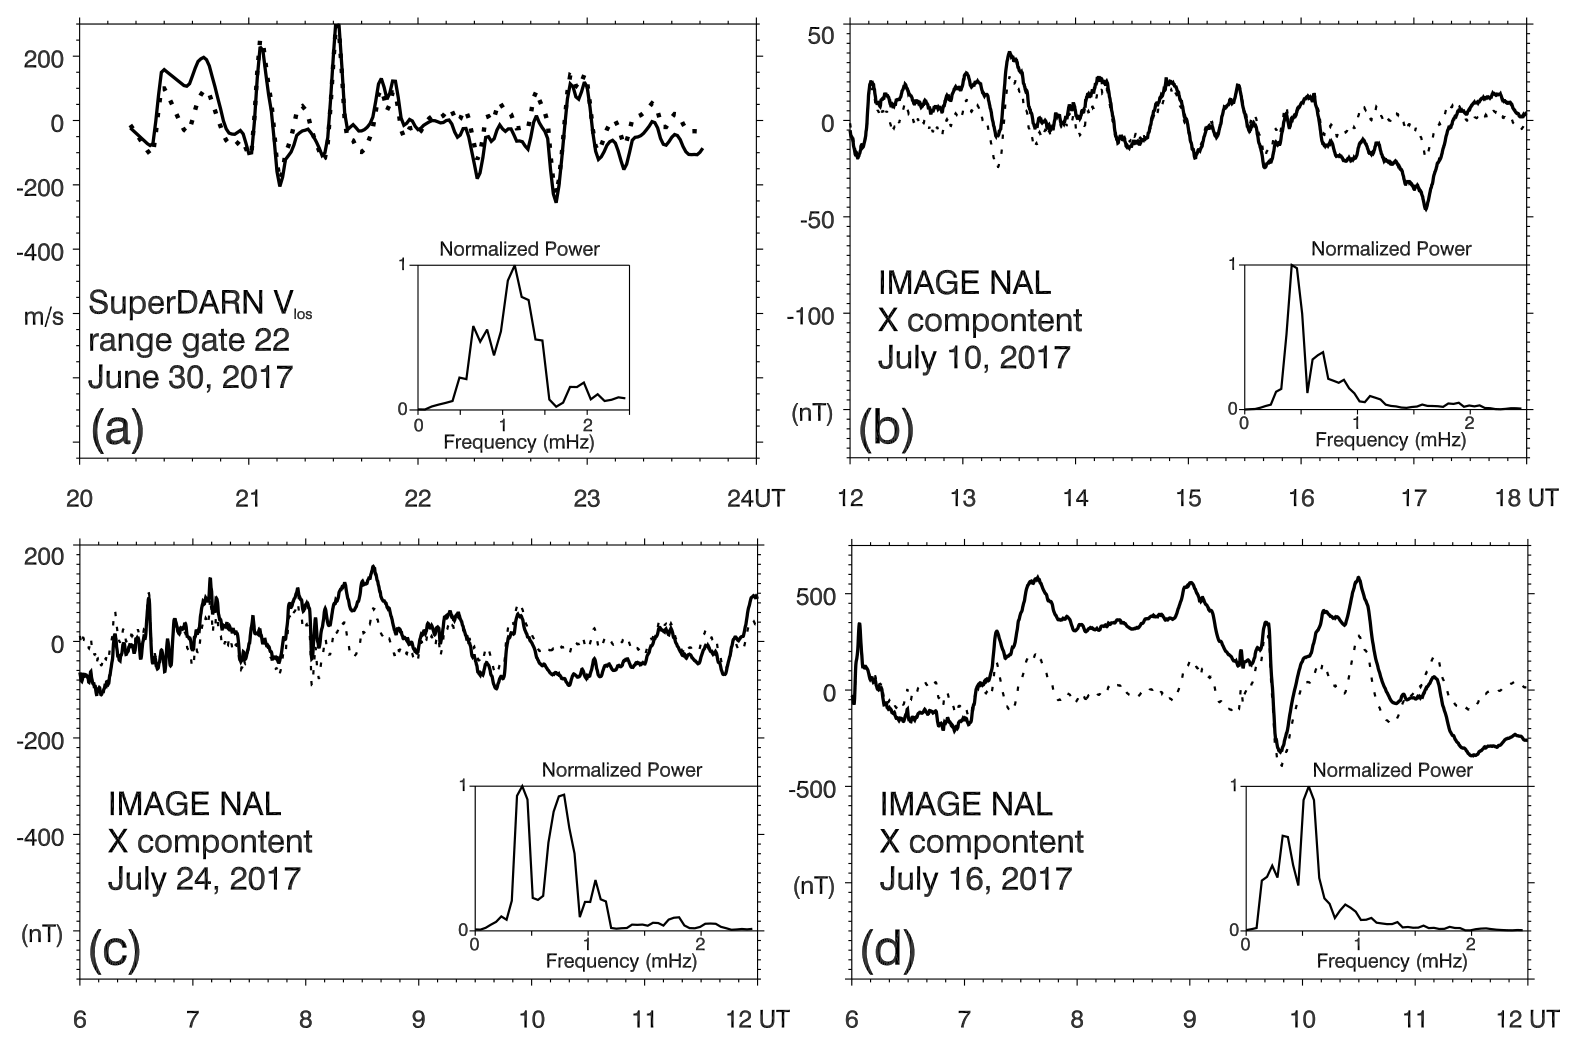
Figure 18The X components of magnetic field and the FFT spectrum of the detrended time series (dotted line) observed by magnetometers in Svalbard on (a) 30 June, (b) 10 July, (c) 24 July, and (d) 16 July 2017.
Before we discuss AGWs, their sources in the high-latitude lower thermosphere, and their propagation upward and downward, it should be noted that when the AGW group velocity is downward, the phase velocity is upward, and vice versa, with the two velocity vectors being perpendicular to each other. For clarity, we will refer to downward/upward group (wave energy) propagation as down- or up-going AGWs to distinguish from upward/downward AGW phase propagation.
The equatorward propagating down-going AGWs launched by PIFs (Fig. 17) would reach the troposphere. If ducted, similarly to the case shown in Prikryl et al. (2018; their Fig. 15), down-going AGWs could have reached the unstable warm frontal zone of the cyclone over Slovakia and initiated/triggered slantwise convection resulting in a series of cloud bands (Fig. 16a). Of note is that the number of cloud bands in this striated delta cloud was about the same as the number of PIFs (Figs. 17a and 18a). A tendency for striated delta clouds to develop following the arrivals of HSS/CIR has been shown previously (Prikryl et al., 2018; their Fig. 9), and the present case is consistent with these statistical results and the case study presented there.
The increased divergence between 150–300 mbar in the warm frontal zone associated with the striated delta cloud (Fig. 16a) suggests an unstable region, and the strong mid–upper level winds with the northward component indicate winds opposing the direction of the incoming/down-going AGWs. These conditions are conducive to the over-reflection of AGWs, with a possibility of amplification (Jones, 1968; Cowling et al., 1971; McKenzie, 1972; Eltayeb and McKenzie, 1975).
The warm frontal zone is known for moist symmetric instability (MSI; Schultz and Schumacher, 1999), where a slantwise convection can be readily initiated by even small (infinitesimal) displacements of moist air. It was suggested that MSI can be triggered by over-reflecting down-going AGWs that originate in the lower thermosphere at high (auroral) latitudes. Previously, cloud/rain bands were linked to possible sources of AGWs or observed traveling ionospheric disturbances (TIDs) in a few cases (see Prikryl et al., 2009b, 2018, including their Supplement).
On 10 July, a string of convective cells developed in the cold frontal zone passing over Slovakia and Poland (Fig. 16b), with one of them causing heavy rainfall (Fig. 15c) and floods (Fig. 14a) in Slovakia. We note the similarity with the heavy rainfall/flash flood event that involved a string of supercells (Prikryl et al., 2018; their Fig. 14) that were likely triggered by down-going aurorally generated AGWs reaching the troposphere, while the up-going AGWs were observed in the ionosphere. Unfortunately, this time, strong high frequency (HF) absorption wiped out most of the ionospheric radar backscatter, and no PIFs could be observed at high latitudes. Also, only weak radar ground scatter was observed, indicating TIDs between 12:00 and 20:00 UT (not shown). However, AGWs were likely launched by pulsing ionospheric currents observed over Svalbard on 10 July, several hours before the string of convective cells developed. Figure 18b shows the magnetic field X component observed by the IMAGE magnetometer at Ny-Ålesund (NAL). The FFT spectrum of the detrended time series shows a peak at 0.4 mHz (∼ 40 min). High divergence at the mid–upper level in the cold frontal zone indicates an unstable region where the convection occurred (Fig. 16b). Down-going AGWs over-reflecting in the unstable region could have triggered/initiated convection.
Figure 16c shows a similar instance of convective cells triggered over Hungary that subsequently moved over Slovakia and caused heavy rainfall and flooding on 24 July (Figs. 14 and 15g). Again, PIFs could not be observed by the radar, but pulses of ionospheric currents were observed over Svalbard several hours before these convective cells were initiated. Figure 18c shows the magnetic field X component pulsation observed by the IMAGE magnetometer NAL. The FFT spectrum of the detrended time series shows two prominent peaks at 0.4 mHz (∼ 40 min) and 0.75 mHz (∼ 20 min). These ionospheric currents likely launched down-going AGWs that could have triggered the convection cells in the unstable region of high divergence and strong northeasterly winds at the mid–upper level (Fig. 16c).
Figure 16d shows a string of convective cells in the intensifying mesoscale system Medusa that produced heavy rainfall/flash floods in Greece on 16 July 2017 (Fig. 14a). The overlain CIMSS data products are missing for this day, but the next day still shows strong divergence and southerly winds at the mid–upper level over Greece (Fig. 16d). Moist instabilities could have been released by AGWs launched by strong ionospheric current pulses that were observed over Svalbard several hours before convection developed on 16 July. Figure 18d shows the large-amplitude pulsation of the ground magnetic field X component observed by the IMAGE magnetometer NAL. The FFT spectrum of the detrended time series shows a peak at 0.55 mHz (∼ 30 min). Weak traces of TIDs caused by the up-going AGWs in the thermosphere were observed in the ground scatter by the Hankasalmi radar beam 13 (not shown).
The strings of convective cells in Fig. 16 are similar to certain types of mesoscale convective lines (Bluestein and Jain, 1985; their Fig. 1). These authors identified four distinct types of mesoscale convective lines of cells that form squall lines, namely, “broken line”, “back building”, “broken areal”, and “embedded areal” types. The squall lines form in a conditionally and convectively unstable atmosphere. The broken line forms typically along a cold front with multi-cells appearing at about the same time and transforming “into a solid line as the area of each existing cell expands and new cells develop” (Bluestein and Jain, 1985). This type could represent the cases shown in Fig. 16b and d. The back building type “consists of the periodic appearance of a new cell upstream, relative to cell motion” and can form along different types of surface boundaries. This type pertains to the case in Fig. 16c, and the cases discussed by Prikryl et al. (2018), where new cells appeared periodically. The other squall line types may include the warm frontal bands and wide cold frontal bands (for a detailed description of their characteristics, see Bluestein and Jain, 1985). Similarly to striated delta clouds (Prikryl et al., 2018; their Fig. 9), the SPE analysis of solar wind data keyed to dates from the list of cases (Bluestein and Jain, 1985; their Table 1) shows a tendency of these four types of squall lines to follow arrivals of HSS/CIRs/ICMEs (not shown).
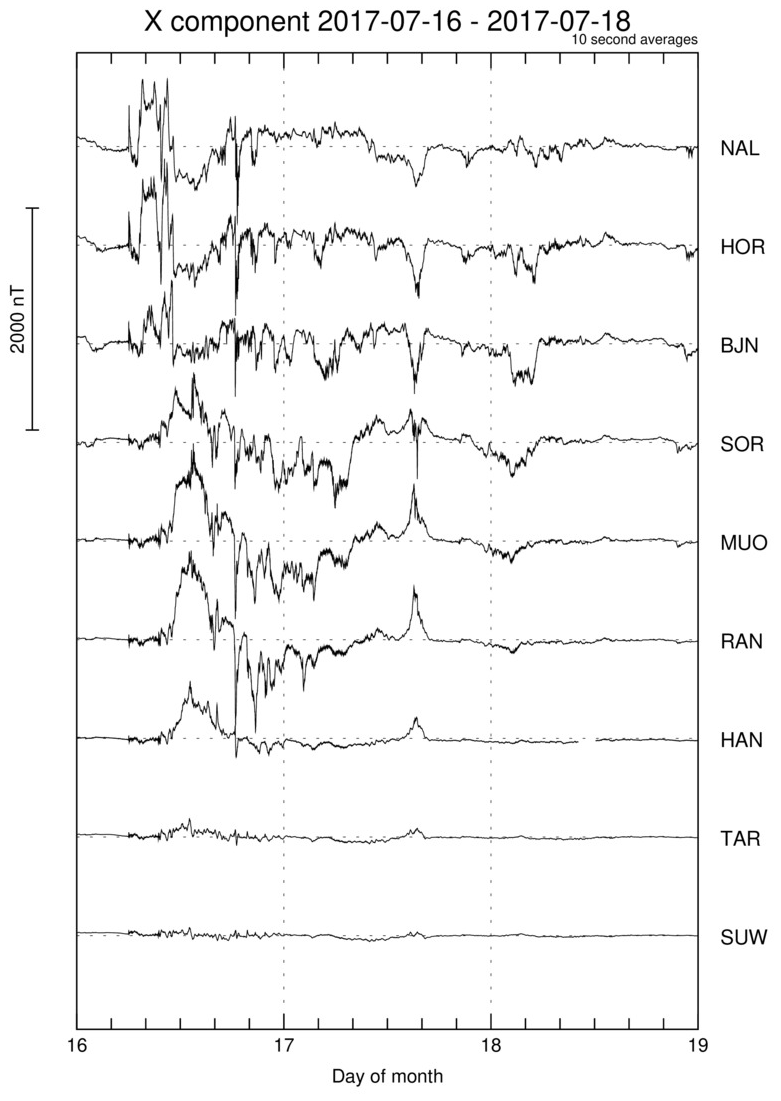
The HSS and a broad CIR, combined with an ICME on 16 July (Fig. 14a), caused a moderate geomagnetic storm ( nT), starting with the arrival of the interplanetary shock at about 06:00 UT. Figure 19 shows strong magnetic field perturbations (ionospheric currents) observed by the IMAGE array over a range of latitudes from Fennoscandia to Svalbard. The ionospheric current pulses launched large-amplitude AGWs that produced large- and medium-scale TIDs observed in maps of the GPS total electron content (TEC) over much of Europe and North America on 15 and 16 July (Fig. 20; https://aer-nc-web.nict.go.jp/GPS/EUROPE/MAP/2017/197/index.html, last access: 11 August 2021). During this time, in addition to the flash floods in Greece already discussed above, intensified mesoscale systems produced heavy rainfall and flash floods in Turkey and southern England. These events are marked by triangles in Fig. 14a. In the USA, deadly flash floods struck in Arizona, with thunderstorms and heavy rain affecting areas around Payson between 21:00 and 23:00 UT on 15 July. “The National Weather Service issued a flash flood warning for Gila County and estimated that up to 38 mm of rain fell over the area in an hour…. A further storm on 16 July caused flooding in the Phoenix area. Litchfield Park recorded 52 mm in 24 h 16 to 17 July 2017” (http://floodlist.com/america/usa/flash-floods-arizona-july-2017, last access: 11 August 2021). The observation here is that large-amplitude TIDs (Fig. 20e–g) were caused by up-going AGWs from sources in the high-latitude lower thermosphere. In turn, the down-going AGWs that can reach the troposphere could have triggered/released moist instabilities initiating convection.
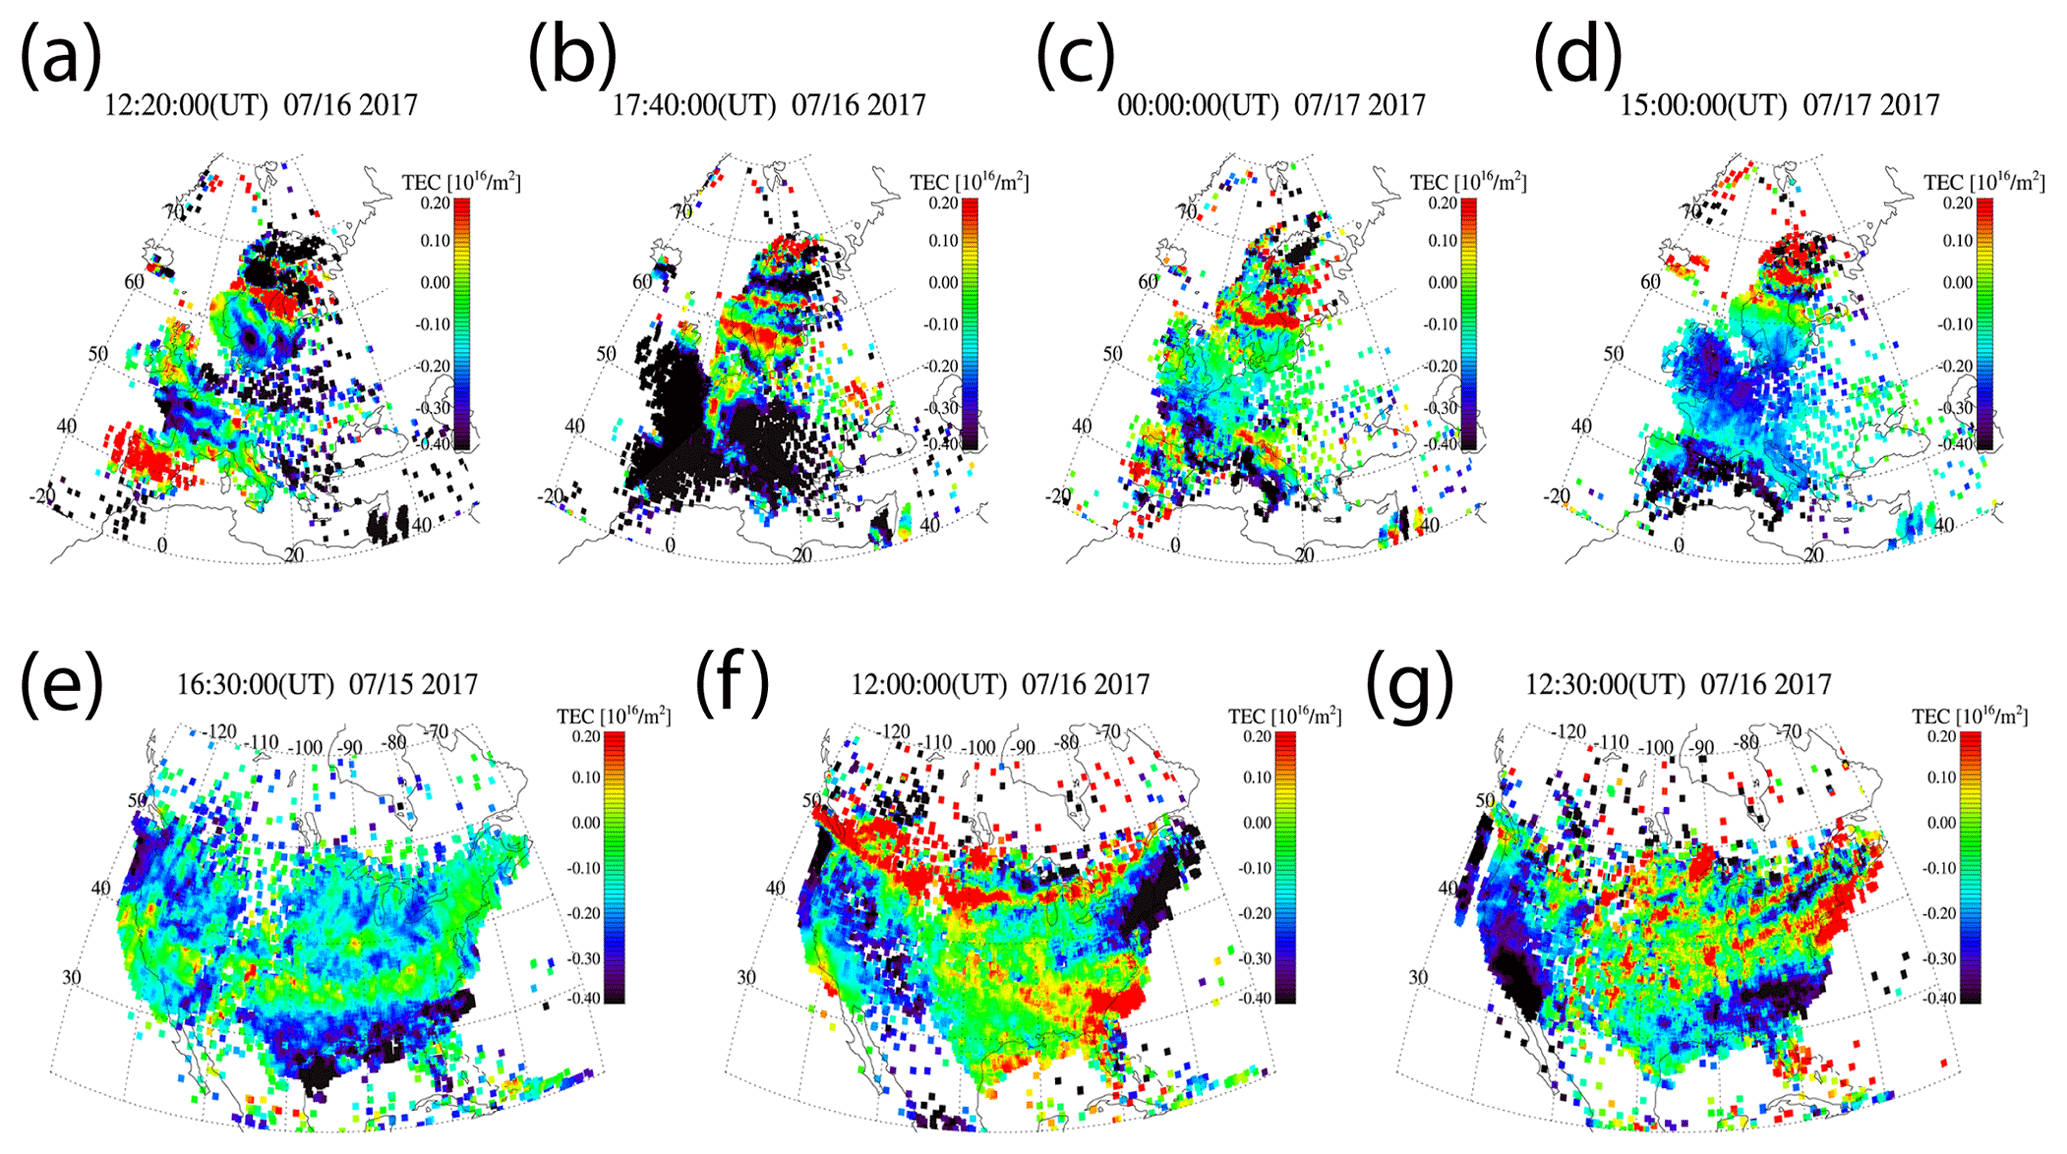
Figure 20Medium- to large-scale TIDs propagating equatorward over Europe and North America, as observed in the detrended TEC.
Finally, we briefly discuss the second period in June–July 2018 (Fig. 14b) that shows a series of six major HSS/CIRs. On 25 June, an ICME (orange triangle) triggered a moderate geomagnetic storm that was further intensified with the arrival of a strong HSS/CIR (26 June; red asterisk). As the Earth was exiting the HSS, another ICME caused a small solar wind disturbance on 30 June. Subsequent HSSs produced broad CIRs with a large density and magnetic field fluctuations that resulted in strong MIA coupling.
In this period, heavy rainfall events caused a large number of floods and flash floods in the USA, Europe, and Japan. All of them followed the arrivals of HSS/CIRs or ICMEs, and some of them occurred on different continents at about the same time. On 26–29 June, heavy rain caused floods in Greece, Bulgaria, Romania, and Slovakia. Following the ICME on 30 June, extreme rainfall that occurred in Iowa (24 h rate of 221 mm in Ankeny and 213 mm in Johnston) on 30 June to 1 July caused deadly flash floods. The next major HSS/CIR that arrived on 5 July was preceded by a minor but broad HSS/CIR on 3–4 July. Flash floods occurred in Italy and the USA (Minnesota, Houston, and Texas), and on 5 June, heavy rain exceeding 500 mm in 24 h caused flash floods and landslides in Japan. Following the HSS/CIR on 17–18 July, severe floods and flash floods occurred in the USA (Washington, D.C., and Massachusetts) and Slovakia (http://floodlist.com/europe/slovakia-floods-tatra-mountains-july-2018, last access: 11 August 2021; Fig. 13). On 21–22 July, in the peak of a structured HSS, flash floods occurred on the upper portion of river Váh in Slovakia.
Furthermore, daily precipitation rates measured at SHMU stations in Slovakia, and the maximum daily rates and the number of REGNIE grid cells with rainfall exceeding 30 mm in Germany (Fig. 14b), show increases following the HSS/CIRs, including the HSS/CIR on 10 July. The European Severe Weather Database (https://eswd.eu/cgi-bin/eswd.cgi, last access: 11 August 2021) includes confirmed reports of heavy rain causing floods in several countries from 10–12 July, including a large area of Poland that was affected by heavy rain and floods on 11 July. Of course, the information about flood events used in this paper is not complete and more data, including the NOAA Storm Events Database events in the USA (https://www.ncdc.noaa.gov/stormevents/, last access: 11 August 2021), will be examined in the future.
We have examined heavy rainfall leading to floods and flash floods in the context of solar wind, linking the occurrence of such weather events to arrivals of solar wind HSSs, which are dominated by Alfvén waves (Belcher and Davis, 1971) known to cause HILDCAAs and substantial energy deposition to auroral zone (Tsurutani and Gonzalez, 1987). Solar wind MIA coupling generates medium- to large-scale AGWs globally propagating from sources in the lower thermosphere at high latitudes, both upward and downward (Mayr et al., 1984a, b, 1990, 2013; Hocke and Schlegel, 1996). The coupling is most intense when the HSS/CIRs and/or interplanetary shocks at the leading edges of ICMEs arrive and generate large-amplitude AGWs originating in the lower thermosphere at high latitudes. Solar wind magneto-hydrodynamic waves, including Alfvén waves, modulate the high-latitude ionospheric currents that can generate globally propagating AGWs (Prikryl et al., 2005; see references therein).
Aurorally excited AGWs can reach the troposphere and can be ducted in the lower atmosphere over long distances, thus reaching low latitudes. At the reflection point in the troposphere, they can trigger moist instabilities to release latent heat, which, in turn, leads to the intensification of extratropical cyclones (Prikryl et al., 2009b; 2016, 2018) and tropical cyclones (Prikryl et al., 2019). These studies showed that explosive development of extratropical cyclones and rapid intensification of tropical cyclones tend to follow arrivals of solar wind HSSs and/or ICMEs.
Prikryl et al. (2009b) suggested that in the extratropical cyclone warm frontal zone, with warm air advection over the cool air mass ahead, the over-reflecting gravity-wave-induced vertical lift may trigger/release moist symmetric instability (MSI) at near-threshold conditions and, thus, initiate slantwise convection. Latent heat release associated with the mesoscale slantwise convection has been linked to explosive cyclogenesis (e.g., Kuo and Low-Nam, 1990). A commonly raised question about the possibility of strongly attenuated gravity waves, with amplitudes reduced by a factor of 103 to 104 in the troposphere, is why such gravity waves would be considered to trigger convection when there are many other sources of perturbations, including gravity waves generated in the troposphere itself, which have larger amplitudes. One reason is that the release of conditional symmetric instability, particularly in the warm frontal zone, has been known to initiate convection and result in frontal precipitation bands (Bennetts and Hoskins, 1979; Bluestein, 1993; Houze, 1993; Emanuel, 1994). Even an infinitesimally small displacement of the moist air parcel can initiate slantwise convection (Schultz and Schumacher, 1999). The warm frontal cloud bands, sometimes called striated delta clouds (Feren, 1995), in rapidly intensifying extratropical cyclones, were shown to follow arrival of HSSs (Prikryl et al., 2018). When down-going AGWs over-reflect in the warm frontal zone of extratropical cyclones, even the small additional lift they would provide to a moist air parcel that is already rising over the cold air ahead can initiate slantwise convection, thus forming a precipitation band. As already indicated above, it is also important to consider that the over-reflection of gravity waves can result in amplification. We are not aware of any reports of a specific type of tropospheric perturbation that reaches instability region, in this case the warm frontal zone, and triggers banded convection. Although stochastic fluctuations could trigger convection, they would neither explain the observed link to solar wind HSSs nor the coherent wave structure of the cloud.
Callaghan and Power (2016) described conditions, including vertical wind structure, that led to extreme rainfall and major flooding in southeast Australia. They found that most cases exhibited anticyclonic turning wind direction with increasing height and warm moist air advection. They observed “typically east northeasterly winds at 850 hPa turning anti-cyclonically with height to northerly winds by 500 hPa”. The downward-propagating AGWs, in this case from the lower thermosphere sources at high southern latitudes, may encounter opposing winds in the upper troposphere, a condition conducive to over-reflection, that could release the MSI and trigger convection. Major floods in southeast Australia (Callaghan and Power, 2016) appear to show a tendency to occur following HSS/CIRs, with results similar to Figs. 1 and 2, which will be discussed in a future publication.
Prikryl et al. (2018) discussed two flash floods in Slovakia that closely followed arrivals of two major HSS/CIRs in July 2001. They identified pulsing ionospheric currents as a source of AGWs that were observed in the ionosphere as TIDs. A few hours later, a series of convective cells that formed in sequence were observed in infrared satellite images. These observations suggested that down-going AGWs played a role in triggering instabilities and initiating convection in the troposphere. One of the supercells caused heavy rainfall and flash floods in Slovakia. Cases of striated delta clouds were also linked to possible auroral sources of AGWs (Prikryl et al., 2018; see their Appendix A).
Consistent with these previously published results, the statistical results presented in Sect. 3 show that heavy rainfall events leading to floods and flash floods tend to follow arrivals of HSS/CIRs. The SPE analysis of green corona intensity and solar wind parameters keyed to the onset of heavy rainfall taken from several databases/lists of events in Europe and the USA (Figs. 1 and 2) reproducibly show patterns that indicate this tendency, as discussed in Sect. 3. These conclusions are supported by the analysis of more comprehensive databases of daily precipitation rates and annual flood reports in Slovakia for a period of 2003–2019 using a twofold approach. First, the SPE analysis of green corona intensity and solar wind parameters is keyed to significant rainfall events of at least 30 mm/24 h recorded at 10 or more stations (Fig. 3). Focusing on floods in Slovakia, the SPE analysis of the green corona intensity and solar wind parameters keyed to dates of significant rainfall leading to floods clearly indicates a tendency of these flood events to follow arrivals of solar wind HSS/CIRs (Fig. 4). Second, with the key times defined by the arrival times of major HSS/CIRs (Sect. 4), the SPE analysis (Fig. 5) shows an increase in the cumulative number of stations that measured daily precipitation rates above given thresholds. Such a relationship between solar wind HSSs and daily precipitation rates is also found using the satellite-based daily precipitation data set TRMM. Finally, extending the SPE analysis to ±36 d about the key times defined by arrivals of major HSS/CIR reveals a similar response at epoch days ±27 due to recurrent streams. The cross-correlation between the SPE averages of the green corona intensity and solar wind parameters and mean daily precipitation rates quantitatively confirm the observed tendency of high precipitation occurrence following the HSS/CIRs.
In Sects. 5 and 6, the tendency of heavy rainfall and floods following arrivals of HSS/CIRs is shown in case studies (Figs. 10–15), with some supported by satellite images (Fig. 16) of intensifying mesoscale systems displaying striated delta clouds or strings of convective cells. Pulsed ionospheric currents (Figs. 17 to 19) are sources of AGWs that can be observed in the ionosphere (Fig. 20). Ray tracing of gravity waves (Prikryl et al., 2005, 2019) and simulations of gravity wave propagation using the transfer function model (Mayr et al., 1984a, 2013; Prikryl et al., 2016, 2018) showed that AGWs can reach the troposphere and play a role in triggering moist instabilities and initiating convection leading to heavy rainfall and floods.
Recently, Hagiwara and Tanaka (2020) performed a theoretical analysis of propagation of AGWs in the lower atmosphere using an expansion in three-dimensional normal mode functions. They showed that the waves can propagate downward to the troposphere as attenuating gravity waves and found that “the wave propagations and reflections at the surface create an anti-node of geopotential at the bottom of the atmosphere corresponding to the vertical width of the initial state of the impact. On the other hand, standing waves in temperature create a node at the ground surface”. They suggested that “due to the standing waves generated in the lower troposphere, the atmospheric stability is altered by the passage of the gravity waves in the meridional direction”, and that the change in the stability parameters can affect the development of cyclones. Further theoretical and computational research examining the dynamics of down-going AGWs and their influence in the troposphere is needed to complement the data-driven analysis of this phenomenon.
Heavy rainfall causing floods and flash floods tends to follow arrivals of solar wind high-speed streams from coronal holes. The superposed epoch (SPE) analysis results show an increase in precipitation rates following arrivals of high-speed streams, including recurrence with a periodicity of 27 d. The cross-correlation analysis applied to the SPE averages of green corona intensity, solar wind parameters and daily precipitation rates show correlation peaks at lags spaced by solar rotation period. When the SPE analysis is limited to years around solar minimum (2008–2009), correlation peaks at lags spaced by 9 d are also revealed, which is a result of high-speed streams from coronal holes spaced in heliographic longitude by approximately 120∘. These quantitative results confirm the tendency of an increase in precipitation following the arrivals of high-speed streams, which is further demonstrated by cases of heavy rainfall, floods, and flash floods in Europe, Japan, and the USA. The role of aurorally generated atmospheric gravity waves as the mechanism mediating the influence of the solar wind–magnetosphere–ionosphere–atmosphere coupling on the troposphere is suggested. Down-going gravity waves from sources in the lower thermosphere can over-reflect in the upper troposphere and trigger/release existing moist instabilities, initiating convection and latent heat release, with the energy leading to intensification of storms.
The solar wind data can be obtained from the NSSDC OMNIWeb http://omniweb.gsfc.nasa.gov (last access: 11 August 2021; King and Papitashvili, 2005). The Modified Homogeneous Data Set of Coronal Intensities can be obtained at https://www.suh.sk/online-data/modifikovany-homogenny-rad/category/35-denn-hodnoty-mhr (last access: 11 August 2021; Dorotovič et al., 2014). The SHMU, with contributions by the Slovak Water Management Enterprise (SWME), publish annual flood reports (http://www.shmu.sk/sk/?page=128, last access: 11 August 2021, SMHU, 2021) that provide data on floods and significant rainfall in Slovakia. The TRMM/TMPA (3B42) precipitation data set (Huffman et al., 2016) can be obtained at https://disc.gsfc.nasa.gov/datacollection/TRMM_3B42_Daily_7.html. Meteorological data were also accessed online at http://floodlist.com/ (FloodList, 2021, last access: 11 August 2021) and the HYDRATE project at https://cordis.europa.eu/project/id/37024 (Gaume et al., 2009). Other relevant geophysical data sets can be accessed at http://vt.superdarn.org/tiki-index.php, https://space.fmi.fi/image/www/index.php?, http://www.carisma.ca/, https://supermag.jhuapl.edu/mag/, https://www.intermagnet.org/, and https://aer-nc-web.nict.go.jp/GPS/DRAWING-TEC/ (last access: 11 August 2021).
PP conceptualized the project, led the formal analysis and investigation, developed the methodology, administered the project, acquired the resources, developed the software, supervised, validated, and visualized the project, wrote the original draft, and reviewed and edited the paper. VR contributed to the acquisition, validation, calibration, and processing of the green corona intensity data and to the preparation of the paper through acquiring resources and writing, reviewing, and editing the paper. EAP contributed to conceptualization of the project, assured the applicability of statistical, mathematical, and computational methods and reviewed and edited the paper. PŠ provided mentorship and supervision over the acquisition, validation, calibration, processing, and use of the rain gauge data and contributed to writing, reviewing, and editing the paper. MT executed the rain gauge data retrievals and provided the required data files and formats needed for the rain gauge data analysis. MZ contributed to the annual flood reports that included records of significant rainfall events and contributed to writing, reviewing, and editing the paper.
The authors declare that they have no conflict of interest.
Publisher's note: Copernicus Publications remains neutral with regard to jurisdictional claims in published maps and institutional affiliations.
This research was supported by the University of New Brunswick and the Public Safety Geosciences program of the Natural Resources Canada, Earth Sciences Sector, and by the VEGA project (grant no. 2/0048/20; Slovak Academy of Sciences). The rain gauge data were provided by the Slovak Hydrometeorological Institute (SHMU). The SHMU, with contributions from the Slovak Water Management Enterprise (SWME), publish annual flood reports (in Slovak) that provide data on floods and significant rainfall that have led to the floods in Slovakia since 2003. Also, this publication benefited from the project “Scientific support of climate change adaptation in agriculture and mitigation of soil degradation” (grant nos. ITMS2014+ and 313011W580) supported by the integrated infrastructure Operational Programme funded by the European Regional Development Fund (ERDF). Contributions by the ACE, Geotail, IMP 8, SOHO, and Wind spacecraft teams, the NSSDC OMNIWeb, and SuperDARN and IMAGE projects are acknowledged. SuperDARN is a collection of radars funded by national scientific funding agencies of Australia, Canada, China, France, Italy, Japan, Norway, South Africa, United Kingdom, and the USA. Meteorological data were accessed online at web pages provided by various institutions, including Environment Canada, the Japan Meteorological Agency (JMA), the Australian Government Bureau of Meteorology, the Slovak Hydrometeorological Institute (SHMU), the University of Wisconsin–Madison Space Science and Engineering Center, and the University of Washington's Department of Atmospheric Sciences. Copernicus, previously known as GMES (Global Monitoring for Environment and Security), is the European program for the establishment of a European capacity for Earth observation. It has funded FloodList, the European system for Earth monitoring and reporting floods and flooding news since 2008. An earlier database of European flash floods was collected by the HYDRATE project. The daily precipitation data set REGNIE is freely available from the Deutscher Wetterdienst (DWD) Climate Data Center (CDC). The Tropical Rainfall Measuring Mission (TRMM) Multi-Satellite Precipitation Analysis TMPA (3B42) Precipitation (version 7) was produced at the Goddard Earth Sciences Data and Information Services Center (GES DISC).
This research has been supported by the Slovak Academy of Sciences under the VEGA project (grant no. 2/0048/20).
This paper was edited by Petr Pisoft and reviewed by two anonymous referees.
Azañón, J. M., Azor, A., Yesares, J., Tsige, M., Mateos, R. M., Nieto, F., Delgado, J., López-Chicano, M., Martín, W., and Rodríguez-Fernández, J.: Regional-scale high-plasticity clay-bearing formation as controlling factor on landslides in Southeast Spain, Geomorphology, 120, 26–37, https://doi.org/10.1016/j.geomorph.2009.09.012, 2010.
Ballesteros-Cánovas, J. A., Czajka, B., Janecka, K., Lempa, M., Kaczka, R. J., and Stoffel, M.: Flash floods in the Tatra Mountain streams: Frequency and triggers, Sci. Total Environ., 511, 639–648, https://doi.org/10.1016/j.scitotenv.2014.12.081, 2015.
Belcher, J. W. and Davis Jr., L.: Large-amplitude Alfvén waves in the interplanetary medium, J. Geophys. Res., 76, 3534–3563, 1971.
Bennetts, D. A. and Hoskins, B. J.: Conditional symmetric instability – A possible explanation for frontal rainbands, Q. J. Roy. Meteor. Soc., 105, 945–962, https://doi.org/10.1002/qj.49710544615, 1979.
Bluestein, H. B.: Synoptic-Dynamic Meteorology in Midlatitudes, Vol. II. Observations and Theory of Weather systems, Oxford University Press, pp. 594, 1993.
Bluestein, H. B. and Jain, M. H.: The formation of mesoscale lines of precipitation: Severe squall lines in Oklahoma during the spring, J. Atmos. Sci., 42, 1711–1732, 1985.
Borga, M., Anagnostou, E. N., Bloschl, G., and Creutin, J.-D.: Flash flood forecasting, warning and risk management: the HYDRATE project, Environ. Sci. Pol., 14, 834–844, 2011.
Borovsky, J. E. and Steinberg, J. T.: The “calm before the storm” in CIR/magnetosphere interactions: Occurrence statistics, solar wind statistics, and magnetospheric preconditioning, J. Geophys. Res., 111, A07S10, https://doi.org/10.1029/2005JA011397, 2006.
Burlaga, L., Sittler, E., Mariani, F., and Schwenn, R.: Magnetic loop behind an interplanetary shock: Voyager, Helios, and IMP 8 observations, J. Geophys. Res., 86, 6673–6684, https://doi.org/10.1029/JA086iA08p06673, 1981.
Burns, G. B., Tinsley, B. A., Frank-Kamenetsky, A. V., and Bering, E. A.: Interplanetary magnetic field and atmospheric electric circuit influences on ground-level pressure at Vostok, J. Geophys. Res., 112, D04103, https://doi.org/10.1029/2006JD007246, 2007.
Burns, G. B., Tinsley, B. A., French, W. J. R., Troshichev, O. A., and Frank-Kamenetsky, A. V.: Atmospheric circuit influences on ground-level pressure in the Antarctic and Arctic, J. Geophys. Res., 113, D15112, https://doi.org/10.1029/2007JD009618, 2008.
Callaghan, J. and Power, S. B.: Major coastal flooding in southeastern Australia 1860–2012, associated deaths and weather systems, Aust. Met. Ocean. J., 64, 183–213, 2014.
Callaghan, J. and Power, S. B.: A vertical wind structure that leads to extreme rainfall and major flooding in southeast Australia, Journal of Southern Hemisphere Earth Systems Science, 66, 380–401, https://doi.org/10.22499/3.6604.002, 2016.
Chisham, G., Lester, M., Milan, S. E., Freeman, M. P., Bristow, W. A., Grocott, A., McWilliams, K. A., Ruohoniemi, J. M., Yeoman, T. K., Dyson, P. L., Greenwald, R. A., Kikuchi, T., Pinnock, M., Rash, J. P. S., Sato, N., Sofko, G. J., Villain, J. P., and Walker, A. D. M.: A decade of the Super Dual Auroral Radar Network (SuperDARN): Scientific achievements, new techniques and future directions, Surv. Geophys., 28, 33–109, 2007.
Cowling, D. H., Webb, H. D., and Yeh, K. C.: Group rays of internal gravity waves in a wind stratified atmosphere, J. Geophys. Res., 79, 213–220, 1971.
de Toma, G.: Evolution of Coronal Holes and Implications for High-Speed Solar Wind During the Minimum Between Cycles 23 and 24, Solar Phys., 274, 195–217, https://doi.org/10.1007/s11207-010-9677-2, 2011.
Dorotovič, I., Minarovjech, M., Lorenc, M., and Rybanský, M.: Modified Homogeneous Data Set of Coronal Intensities [data set], available at: https://www.suh.sk/online-data/modifikovany-homogenny-rad/category/35-denn-hodnoty-mhr (last access: 11 August 2021), 2014.
Dungey, J. W.: Interplanetary Magnetic Field and the Auroral Zones, Phys. Rev. Lett. 6, 47–48, 1961.
Dungey, J. W.: Origin of the concept of reconnection and its application to the magnetopause: A historical view, Physics of the Magnetopause, edited by: Song, P., Sonnerup, B. U. O., and Thomsen, M. F., AGU, Washington, D.C., Geophys. Monogr. Ser., 90, 17–19, 1995.
Eltayeb, I. A. and McKenzie, J. F.: Critical-level behaviour and wave amplification of a gravity wave incident upon a shear layer, J. Fluid Mech., 72, 661–671, https://doi.org/10.1017/S0022112075003217, 1975.
Emanuel, K. A.: Atmospheric Convection, Oxford University Press, 580 pp., 1994.
Esposito, G., Matano, F., and Scepi, G.: Analysis of Increasing Flash Flood Frequency in the Densely Urbanized Coastline of the Campi Flegrei Volcanic Area, Italy, Front. Earth Sci., 6, 63, https://doi.org/10.3389/feart.2018.00063, 2018.
Feren, G.: The “striated delta” cloud system – a satellite imagery precursor to major cyclogenesis in the eastern Australian – western Tasman Sea region, Weather Forecast, 10, 286–309, 1995.
FloodList: funded by Copernicus, Reporting floods and flooding news since 2008 [data set], availabe at: http://floodlist.com/, last access: 18 August 2021.
Fritsch, J. M. and Carbone, R. E.: Improving quantitative precipitation forecasts in the warm season: A USWRP research and development strategy, B. Am. Meteor. Soc., 85, 955–965, 2004.
Gaume, E., Bain, V., Bernardara, P., Newinger, O., Barbuc, M., Bateman, A., Blaškovičová, L., Blöschl, G., Borga, M., Dumitrescu, A., Daliakopoulos, I., Garcia, J., Irimescu, A., Kohnova, S., Koutroulis, A., Marchi, L., Matreata, S., Medina, V., Preciso, E., Sempere-Torres, D., Stancalie, G., Szolgay, J., Tsanis, I., Velasco, D., Viglione, A.: A compilation of data on European flash floods [data set], J. Hydrol., 367, 70–78, 2009.
Gjerloev, J. W.: The SuperMAG data processing technique, J. Geophys. Res., 117, A09213, https://doi.org/10.1029/2012JA017683, 2012.
Gonzalez, W. D., Joselyn, J. A., Kamide, Y., Kroehl, H. W., Rostoker, G., Tsurutani, B. T., and Vasyliunas, V. M.: What is a Geomagnetic Storm?, J. Geophys. Res., 99, 5771–5792, 1994.
Gourley, J. J., Erlingis, J. M., Hong, Y., and Wells, E. B.: Evaluation of Tools Used for Monitoring and Forecasting Flash Floods in the United States, Weather Forecast., 27, 158–173, https://doi.org/10.1175/WAF-D-10-05043.1, 2012.
Groisman, P. Y., Knight, R. W., Easterling, D. R., Karl, T. R., Hegerl, G. C., and Razuvaev, V. N.: Trends in intense precipitation in the climate record, J. Climate, 18, 1326–1350, 2005.
Gutowski, W., Hegerl, G., Holland, G., Knutson, T., Mearns, L., Stouffer, R., Webster, P. J., Wehner, M. F., Zwiers, F. W.: Causes of observed changes in extremes and projections of future changes, in: Weather and Climate Extremes in a Changing Climate, Regions of Focus: North America, Hawaii, edited by: Karl, T. R., Meehl, G. A., Miller, C. D., Hassol, S. J., Waple, A. M., and Murray, W. L., Caribbean and US Pacific Islands, U.S. Climate Change Science Program and the Subcommittee on Global Change Research, Washington, DC., 2008.
Hagiwara, M. and Tanaka, H. L.: A theoretical analysis of the atmospheric gravity wave that connects the thermosphere and the troposphere, Tsukuba Geoenvironm. Sci., 16, 1–14, 2020.
Hocke, K. and Schlegel, K.: A review of atmospheric gravity waves and traveling ionospheric disturbances: 1982–1995, Ann. Geophys., 14, 917–940, 1996.
Hoeksema, J. T., Wilcox, J. M., and Scherrer, P. H.: The structure of the heliospheric current sheet: 1978–1982, J. Geophys. Res., 88, 9910–9918, 1983.
Houze, R. A.: Mesoscale convective systems, Rev. Geophys., 42, RG4003, https://doi.org/10.1029/2004RG000150, 2004.
Huffman, G. J., Bolvin, D. T., Nelkin, E. J., and Adler, R. F.: TRMM (TMPA) Precipitation L3 1 day 0.25 degree x 0.25 degree V, edited by: Savtchenko, A., Goddard Earth Sciences Data and Information Services Center (GES DISC) [data set], available at: https://disc.gsfc.nasa.gov/datasets/TRMM_3B42_Daily_7/summary (last access: 11 August 2021), 2016.
Jones, W. L.: Reflexion and stability of waves in stable stratified fluids with shear flow: numerical study, J. Fluid Mech., 34, 609–624, 1968.
King, J. H. and Papitashvili, N. E.: Solar wind spatial scales in and comparisons of hourly Wind and ACE plasma and magnetic field data [data set], 110, A02104, doi:10.1029/2004JA010649, 2005.
Krieger, A. S.,Timothy, A. F., and Roelof, E. C.: A coronal hole and its identification as the source of a high velocity solar wind stream, Solar Phys., 29, 505–525, 1973.
Kuo, Y.-H. and Low-Nam, S.: Prediction of nine explosive cyclones over the western Atlantic Ocean with a regional model, Mon. Weather Rev., 18, 3–25, 1990.
Lam, M. M., Chisham, G., and Freeman, M. P.: The interplanetary magnetic field influences mid-latitude surface atmospheric pressure, Environ. Res. Lett. 8, 045001, https://doi.org/10.1088/1748-9326/8/4/045001, 2013.
Lam, M. M., Chisham, G., and Freeman, M. P.: Solar wind-driven geopotential height anomalies originate in the Antarctic lower troposphere, Geophys. Res. Lett., 41, 6509–6514, https://doi.org/10.1002/2014GL061421, 2014.
Lam, M. M. and Tinsley, B. A.: Solar wind-atmospheric electricity-cloud microphysics connections to weather and climate, J. Atmos. Sol.-Terr. Phys., 149, 277–290, https://doi.org/10.1016/j.jastp.2015.10.019, 2016.
Mayr, H. G., Harris, I., Varosi, F., and Herrero, F. A.: Global excitation of wave phenomena in a dissipative multiconstituent medium 1. Transfer function of the Earth's thermosphere, J. Geophys. Res., 89, 10929–10959, 1984a.
Mayr, H. G., Harris, I., Varosi, F., and Herrero, F. A.: Global excitation of wave phenomena in a dissipative multiconstituent medium 2. Impulsive perturbations in the Earth's thermosphere, J. Geophys. Res., 89, 10961–10986, 1984b.
Mayr, H. G., Harris, I., Herrero, F. A., Spencer, N. W., Varosi, F., and Pesnell, W. D.: Thermospheric gravity waves: Observations and interpretation using the transfer function model, Space Sci. Rev., 54, 297–375, 1990.
Mayr, H. G., Talaat, E. R., and Wolven, B. C.: Global propagation of gravity waves generated with the whole atmosphere transfer function model, J. Atmos. Sol.-Terr. Phys., 104, 7–17, 2013.
McKenzie, J. F.: Reflection and amplification of acoustic-gravity waves at a density and velocity discontinuity, J. Geophys. Res., 77, 2915–2926, 1972.
National Academies of Sciences, Engineering, and Medicine: Framing the Challenge of Urban Flooding in the United States, Washington, DC: The National Academies Press, https://doi.org/10.17226/25381, 2019.
Owens, M. J., Scott, C. J., Lockwood, M., Barnard, L., Harrison, R. G., Nicoll, K., Watt, C., and Bennett A. J.: Modulation of UK lightning by heliospheric magnetic field polarity, Environ. Res. Lett., 9, 115009, https://doi.org/10.1088/1748-9326/9/11/115009, 2014.
Pekárová, P., Škoda, P., Majerčáková, O., and Miklánek, P.: Important floods of the past on the territory of Slovakia [in Slovak], Acta Hydrol. Slov., 12, 65–73, 2011.
Phillips, J. L., Balogh, A., Bame, S. J., Goldstein, B. E., Gosling, J. T., Hoeksema, J. T., McComas, D. J., Neugebauer, M., Sheeley Jr., N. R., and Wang, Y.-M.: Ulysses at 50∘ south: constant immersion in the high-speed solar wind, Geophys. Res. Lett., 21, 1105-1108, https://doi.org/10.1029/94GL01065, 1994.
Phillips, J. L., Bame, S. J., Feldman, W. C., Gosling, J. T., Hammond, C. M., McComas, D. J., Goldstein, B. E., Neugebauer, M., Scime, E. E., and Suess, S. T.: Ulysses solar wind plasma observations at high southerly latitudes, Science, 268, 1030–1033, https://doi.org/10.1126/science.268.5213.1030, 1995.
Prikryl, P., Rušin, V., and Rybanský, M.: The influence of solar wind on extratropical cyclones – Part 1: Wilcox effect revisited, Ann. Geophys., 27, 1–30, https://doi.org/10.5194/angeo-27-1-2009, 2009a.
Prikryl, P., Muldrew, D. B., and Sofko, G. J.: The influence of solar wind on extratropical cyclones – Part 2: A link mediated by auroral atmospheric gravity waves?, Ann. Geophys., 27, 31–57, https://doi.org/10.5194/angeo-27-31-2009, 2009b.
Prikryl, P., Jayachandran, P. T., Mushini, S. C., and Richardson, I. G.: Toward the probabilistic forecasting of high-latitude GPS phase scintillation, Space Weather, 10, S08005, https://doi.org/10.1029/2012SW000800, 2012.
Prikryl, P., Iwao, K., Muldrew, D.B., Rušin, V., Rybanský, M., and Bruntz, R.: A link between high-speed solar wind streams and explosive extratropical cyclones, J. Atmos. Sol.-Terr. Phys., 149, 219–231, https://doi.org/10.1016/j.jastp.2016.04.002, 2016.
Prikryl, P. Bruntz, R., Tsukijihara, T., Iwao, K., Muldrew, D. B., Rušin, V., Rybanský, M., Turňa, M., and Šťastný, P.: Tropospheric weather influenced by solar wind through atmospheric vertical coupling downward control, J. Atmos. Sol.-Terr. Phys., 171, 94–110, https://doi.org/10.1016/j.jastp.2017.07.023, 2018.
Prikryl, P., Nikitina, L., and Rušin, V.: Rapid intensification of tropical cyclones in the context of the solar wind-magnetosphere-ionosphere-atmosphere coupling, J. Atmos. Sol.-Terr. Phys., 183, 36–60, https://doi.org/10.1016/j.jastp.2018.12.009, 2019.
Rušin, V., Prikryl, P., and Prikryl, E. A.: White-light corona structure observed by naked eye and processed images, Monthly Notices of the Royal Astronomical Society, 495, 2170–2178, https://doi.org/10.1093/mnras/staa1377, 2020.
Rybanský, M.: Coronal index of solar activity, Bull. Astron. Inst. Czechoslov., 28, 367–370, 1975.
Rybanský, M., Rušin, V., and Minarovijech, M.: Coronal index of solar activity, Space Sci. Rev., 95, 227–234, 2001.
Rybanský, M., Rušin, V., Minarovjech, M., Klocok, L., and Cliver, E. W.: Reexamination of the coronal index of solar activity, J. Geophys. Res., 110, A08106, https://doi.org/10.1029/2005JA011146, 2005.
Richardson, I. G.: The formation of CIRs at stream-stream interfaces and resultant geomagnetic activity, AGU Monograph, 167, 45–58, https://doi.org/10.1029/GM167, 2006.
Schroeder, A. J., Gourley, J. J., Hardy, J., Henderson, J. J., Parhi, P., Rahmani, V., Reed, K. A., Schumacher, R. S., Smith, B. K., and Taraldsen, M. J.: The development of a flash flood severity index, J. Hydrol., 541, 523–532, https://doi.org/10.1016/j.jhydrol.2016.04.005, 2016.
Schultz, D. M. and Schumacher, P. N.: The use and misuse of conditional symmetric instability, Mon. Weather Rev., 127, 2709–2732, 1999.
Schumacher, R. S.: Heavy Rainfall and Flash Flooding, Oxford Research Encyclopedia, Natural Hazard Science (oxfordre.com/naturalhazardscience), Oxford University Press USA, https://doi.org/10.1093/acrefore/9780199389407.013.132, 2019.
Scott, C. J., Harrison, R. G., Owens, M. J., Lockwood, M., and Barnard, L.: Evidence for solar wind modulation of lightning, Environ. Res. Lett., 9, 055004, https://doi.org/10.1088/1748-9326/9/5/055004, 2014.
Slovak Hydrometeorological Institute (SHMU): Annual flood reports [data set], available at: https://www.shmu.sk/sk/?page=128, last access: 18 August 2021.
Smith, E. J. and Wolfe, J. H.: Observations of interaction regions and corotating shocks between one and five AU: Pioneers 10 and 11, Geophys. Res. Lett., 3, 137, https://doi.org/10.1029/GL003i003p00137, 1976.
Smith, E. J., Tsurutani, B. T., and Rosenberg, R. L.: Observations of the interplanetary sector structure up to heliographic latitudes of 16∘: Pioneer 11, J. Geophys. Res., 83, 717–724, 1978.
Svalgaard, L.: On the use of Godhavn H component as an indicator of the interplanetary sector polarity, J. Geophys. Res., 80, 2717–2722, https://doi.org/10.1029/JA080i019p02717, 1975.
Šamaj, F., Valovič, Š., and Brázdil, R.: Daily precipitation totals with extraordinary abundance in the CSSR in the period 1901–1980, Slovak: Denné úhrny zrážok s mimoriadnou výdatnosťou v ČSSR v období 1901–1980, Zborník prác SHMÚ 24. Alfa. Bratislava, 9–113, 1985.
Tinsley, B. A.: Influence of solar wind on the global electric circuit, and inferred effects on cloud microphysics, temperature, and the dynamics in the troposphere, Space Sci. Rev., 94, 231–258, 2000.
Tinsley, B. A.: The global atmospheric electric circuit and its effects on cloud microphysics, Reports on Progress in Physics 71, 066801, https://doi.org/10.1088/0034-4885/71/6/066801, 2008.
Tinsley, B. A.: A working hypothesis for connections between electrically induced changes in cloud microphysics and storm vorticity, with possible effects on circulation, Adv. Space Res., 50, 791–805, 2012.
Tsugawa, T., Kotake, N., Otsuka, Y., and Saito, A.: Medium-scale traveling ionospheric disturbances observed by GPS receiver network in Japan: a short review, GPS Solut., 11, 139–144, https://doi.org/10.1007/s10291-006-0045-5, 2007.
Tsurutani, B. T., Smith, E. J., Pyle, K. R., and Simpson, J. A.: Energetic protons accelerated at corotating shocks: Pioneer 10 and 11 observations from 1 to 6 AU, J. Geophys. Res., 87, 7389–7404, https://doi.org/10.1029/JA087iA09p07389, 1982.
Tsurutani, B. T. and Gonzalez, W. D.: The cause of High-Intensity, Long-Duration Continuous AE Activity (HILDCAAs): Interplanetary Alfvén wave trains, Planet. Space Sci., 35, 405–412, https://doi.org/10.1016/0032-0633(87)90097-3, 1987.
Tsurutani, B. T., Gonzalez, W. D., Tang, F., Akasofu, S. I., and Smith, E. J.: Origin of interplanetary southward magnetic fields responsible for major magnetic storms near solar maximum (1978–1979), J. Geophys. Res., 93, 8519–8531, https://doi.org/10.1029/JA093iA08p08519, 1988.
Tsurutani, B. T., Gould, T., Goldstein, B. E., Gonzalez, W. D., and Sugiura, M.: Interplanetary Alfvén waves and auroral (substorm) activity: IMP-8, J. Geophys. Res., 95, 2241–2252, https://doi.org/10.1029/JA095iA03p02241, 1990.
Tsurutani, B. T., Gonzalez, W. D., Gonzalez, A. L. C., Tang, F., Arballo, J. K., and Okada, M: Interplanetary origin of geomagnetic activity in the declining phase of the solar cycle, J. Geophys. Res., 100, 21717–21733, https://doi.org/10.1029/95JA01476, 1995.
Tsurutani, B. T., Gonzalez, W. D., Gonzalez, A. L. C., Guarnieri, F. L., Gopalswamy, N., Grande, M., Kamide, Y., Kasahara, Y., Lu, G., Mann, I., McPherron, R., Soraas, F., and Vasyliunas, V.: Corotating solar wind streams and recurrent geomagnetic activity: A review, J. Geophys. Res., 111, A07S01, https://doi.org/10.1029/2005JA011273, 2006a.
Tsurutani, B. T., McPherron, R. L., Gonzalez, W. D., Lu, G., Gopalswamy, N., and Guarnieri, F. L.: Magnetic Storms Caused by Corotating Solar Wind Streams, in Recurrent Magnetic Storms: Corotating Solar Wind, AGU Monograph, 167, 1–17, https://doi.org/10.1029/GM167, 2006b.
Tsurutani, B. T., Echer, E., and Gonzalez, W. D.: The solar and interplanetary causes of the recent minimum in geomagnetic activity (MGA23): a combination of midlatitude small coronal holes, low IMF Bz variances, low solar wind speeds and low solar magnetic fields, Ann. Geophys., 29, 839–849, https://doi.org/10.5194/angeo-29-839-2011, 2011.
Tsurutani, B. T., Hajra, R., Tanimori, T., Takada, A., Remya, B., Mannucci, A. J., Lakhina, G. S., Kozyra, J. U., Shiokawa, K., Lee, L. C., Echer, E., Reddy, R. V., and Gonzalez, W. D.: Heliospheric plasma sheet (HPS) impingement onto the magnetosphere as a cause of relativistic electron dropouts (REDs) via coherent EMIC wave scattering with possible consequences for climate change mechanisms, J. Geophys. Res., 121, 10130–10156, https://doi.org/10.1002/2016JA022499, 2016.
Veretenenko, S. and Thejll, P.: Effects of energetic solar proton events on the cyclone development in the North Atlantic, J. Atmos. Sol.-Terr. Phys., 66, 393–405, 2004.
Villarini, G., Krajewski, W. F., Ntelekos, A. A., Georgakakos, K. P., and Smith, J. A.: Towards probabilistic forecasting of flash floods: The combined effects of uncertainty in radar-rainfall and flash flood guidance, J. Hydrol., 394, 275–284, 2010.
Wilcox, J. M., Scherrer, P. H., Svalgaard, L., Roberts, W. O., and Olson, R. H.: Solar magnetic sector structure: Relation to circulation of the earth's atmosphere, Science, 180, 185–186, 1973.
Wilcox, J. M., Scherrer, P. H., Svalgaard, L., Roberts, W. O., Olson, R. H., and Jenne, R. L.: Influence of solar magnetic sector structure on terrestrial atmospheric vorticity, J. Atmos. Sci., 31, 581–588, 1974.
- Abstract
- Introduction
- Data sources
- Superposed epoch analysis of green corona intensity and solar wind variables keyed to the onset of significant rainfall leading to floods and flash floods
- High daily precipitation rates relative to arrivals of major HSS/CIRs
- Cases of extreme rainfall and flash floods in Slovakia
- Cases of heavy rainfall leading to floods and flash floods in Europe, Japan, and the USA
- Discussion and summary
- Conclusions
- Data availability
- Author contributions
- Competing interests
- Disclaimer
- Acknowledgements
- Financial support
- Review statement
- References