the Creative Commons Attribution 4.0 License.
the Creative Commons Attribution 4.0 License.
 | 23 Aug 2019
Effects of solar flares on the ionosphere as shown by the dynamics of ionograms recorded in Europe and South Africa
Veronika Barta
Gabriella Sátori
Kitti Alexandra Berényi
Árpád Kis
Earle Williams
We have investigated the solar flare effects on ionospheric absorption with the systematic analysis of ionograms measured at midlatitude and low-latitude ionosonde stations under different solar zenith angles. The lowest recorded ionosonde echo, the minimum frequency (fmin, a qualitative proxy for the “nondeviative” radio wave absorption occurring in the D-layer), and the dfmin parameter (difference between the value of the fmin and the mean fmin for reference days) have been considered. Data were provided by meridionally distributed ionosonde stations in Europe and South Africa during eight X- and M-class solar flares in solar cycle 23. Total and partial radio fade-out was experienced at every ionospheric station during intense solar flares (> M6). The duration of the total radio fade-out varied between 15 and 150 min and it was highly dependent on the solar zenith angle of the ionospheric stations. Furthermore, a solar-zenith-angle-dependent enhancement of the fmin (2–9 MHz) and dfmin (1–8 MHz) parameters was observed at almost every station. The fmin and dfmin parameters show an increasing trend with the enhancement of the X-ray flux. Based on our results, the dfmin parameter is a good qualitative measure for the relative variation of the “nondeviative” absorption, especially in the case of the less intense solar flares, which do not cause total radio fade-out in the ionosphere (class < M6).
- Article
(3670 KB) - Full-text XML
- BibTeX
- EndNote


The most intense external impact on the ionosphere from above is related to solar flares. These events are giant explosions on the surface of the Sun that suddenly release large amounts of electromagnetic energy at a broad range of wavelengths, particularly in the bands of X-radiation and extreme ultraviolet (EUV), for a very short duration (∼30 min to ∼1 h, Tsurutani et al., 2009). Solar flares are classified as large (X), medium-size (M) and small (C) according to their peak flux (in watts per square meter, W m−2, –10−4, X>10−4 W m−2) of 0.1 to 0.8 nm X-rays near Earth, as measured on the GOES spacecraft. During solar flares, the suddenly increased radiation causes extra ionization of the neutral components in the sunlit hemisphere of the Earth's atmosphere over short time intervals (a few minutes to 1 h; Rishbeth and Garriot, 1969; Tsurutani et al., 2009; Zolesi and Cander, 2014). While hard X-rays (<1 nm) penetrate deeply into the ionosphere and could cause enhanced ionization in the D region during solar flares (Brasseur and Solomon, 1986; Rees, 1989; Hargreaves, 1992), the less energetic soft X-ray (1–10 nm) and far UV flux (80–102.6 nm) enhances the ionization in the E-region (Rishbeth and Garriot, 1969). In addition to electromagnetic radiation, solar flares are also accompanied by energetic particles (protons and electrons) with energies from some tens of kiloelectronvolts to some hundreds of megaelectronvolts. They reach the Earth's atmosphere between a half-hour and a few hours later and cause impact ionization (Rishbeth and Garriot, 1969; Bothmer and Daglis, 2007; Tsurutani et al., 2009). The approximate peak electron energy of a few kiloelectronvolts causes the largest ionization in the lower E-region, while during the so-called solar proton events (SPEs) high energy protons (up to more than 100 MeV) cause ionization much deeper, namely in the D-region (Reid, 1986; Rees, 1989; Bothmer and Daglis, 2007).
The significant enhancement of the electron density as a result of solar flares can create increased attenuation of electromagnetic waves propagating through the ionosphere. The physical background of the ionospheric radio wave absorption mechanism is that the electrons accelerated by the electric field of the propagating radio waves collide with the atmospheric constituents. The absorbed energy of the electrons would reradiate without the presence of the neutral atmosphere. However, the electrons lose their energy due to the collisions with neutral particles, which cause reduction of their reemitted signal. Since the atmospheric density, the collision frequency and the recombination rate also change with altitude, the efficiency of the radio wave absorption in the ionosphere strongly varies with altitude. The electron collision frequency is high in the D-region (2×10⁶ s−1) and the HF radio waves below 10 MHz can be strongly attenuated there (Zolesi and Cander, 2014). Therefore, total radio fade-out lasting for tens of minutes or hours can be caused by the enhancement of electron density induced by increased electromagnetic radiation or energetic particles.
The loss of HF communication as a result of the enhanced absorption affects navigation systems, especially in commercial aircraft operations. Therefore, describing, modeling and monitoring of the ionospheric absorption is an important issue from a practical point of view as well. The process of ionospheric absorption has been described more extensively by Davies (1990) and Sauer and Wilkinson (2008). Based on these studies the Space Weather Prediction Center (SWPC) has developed a model (D Region Absorption Prediction, D-RAP2, https://www.swpc.noaa.gov/products/d-region-absorption-predictions-d-rap, last access: 14 August 2019) to predict the ionospheric absorption in the D-region. The product provides graphical information about high-frequency (HF) radio propagation conditions around the globe. According to the model the highest affected frequency (HAF) is largest at the sub-solar point and it decreases with increasing solar zenith angle, χ (the frequencies taper off from the maximum as (cosχ)0.75).
Enhanced X-ray fluxes during solar flares are known to cause increased ionization in the Earth's lower ionosphere (mainly in the D-region). Sahai et al. (2007) have studied the 28 October 2003 solar flare event over the Brazilian sector using ionosonde data and detected a lack of echoes in the ionograms for a 1 h period during the flare onset. They suggested that the reason for complete or partial radio signal fade-out could be intense absorption. The minimum frequency of reflection in radio soundings by ionosondes (fmin, Fig. 1) is usually considered as a qualitative measure of the “nondeviative” radio wave absorption in the ionosphere (Risbeth and Gariott, 1969; Davies, 1990). The basis of the so-called “fmin method” is to use this parameter as an absorption index during periods of high absorption which occur, for example, at the time of solar X-ray flares and polar cap absorptions (see chap. 7 in Davies, 1990). Since the nondeviative absorption varies inversely as the square of the radio frequency, when the absorption changes are large there is a low-frequency cutoff on ionograms (fmin), which is roughly a function of ionospheric absorption for a given sounding system (Davies, 1990). However, the value of the absolute absorption occurring in the ionosphere cannot be quantitatively determined from the fmin parameter. It is regularly used to investigate the absorption variation of the D-region caused by geomagnetic storms (Oksman et al., 1981), by planetary waves (Schmitter et al., 2011) or by other effects (Kokourov, 2006). Sharma et al. (2010) reported on a connection between the solar flares and enhancement of fmin (> 100 %) in the ionosphere. Solar flare effects on the equatorial and low-latitude ionosphere have been described by Sripathi et al. (2013). They observed the lack of ionospheric traces in the ionograms during an X-class solar flare. The total radio fade-out in the ionograms was observed simultaneously with an amplified signal amplitude in ground-based VLF records. They suggested that the reason for the amplified VLF signals could be enhanced D-region ionization due to solar flares which could also cause the increased absorption of HF radio waves observed in the ionograms. Partial radio fade-out and a blanketing-type sporadic E-layer were also detected in ionograms measured close to the Equator in the Brazilian sector (Denardini et al., 2016). They determined a 42 %–146 % enhancement in the electron density of the E-layer after X-class solar flares with the observation of peaks in the fbEs (blanketing frequency of the sporadic E-layer) parameter. The attenuation of radio waves (below 5–8 MHz) caused by ionospheric absorption occurred some minutes before the abnormal changes in the E-region electron density and can be attributed to the additional X-ray ionization due to solar flares. Total radio blackout for about 70 min and increased values of the fmin parameter inferred from ionograms registered at two ionosonde stations in the equatorial region have been reported by Nogueira et al. (2015). The onset and recovery of the flare effect were observed with a consistent time difference at the two stations. Nogueira et al. (2015) stated that the reason for this time delay is the east–west separation of the observation sites. Zaalov et al. (2018) developed an empirical absorption model combining the Global Ionospheric Radio Observatory (GIRO, http://giro.uml.edu, last access: 14 August 2019) data and ionogram modeling. More reliable and accurate evaluation of minimum frequency is possible thanks to their proposed method.
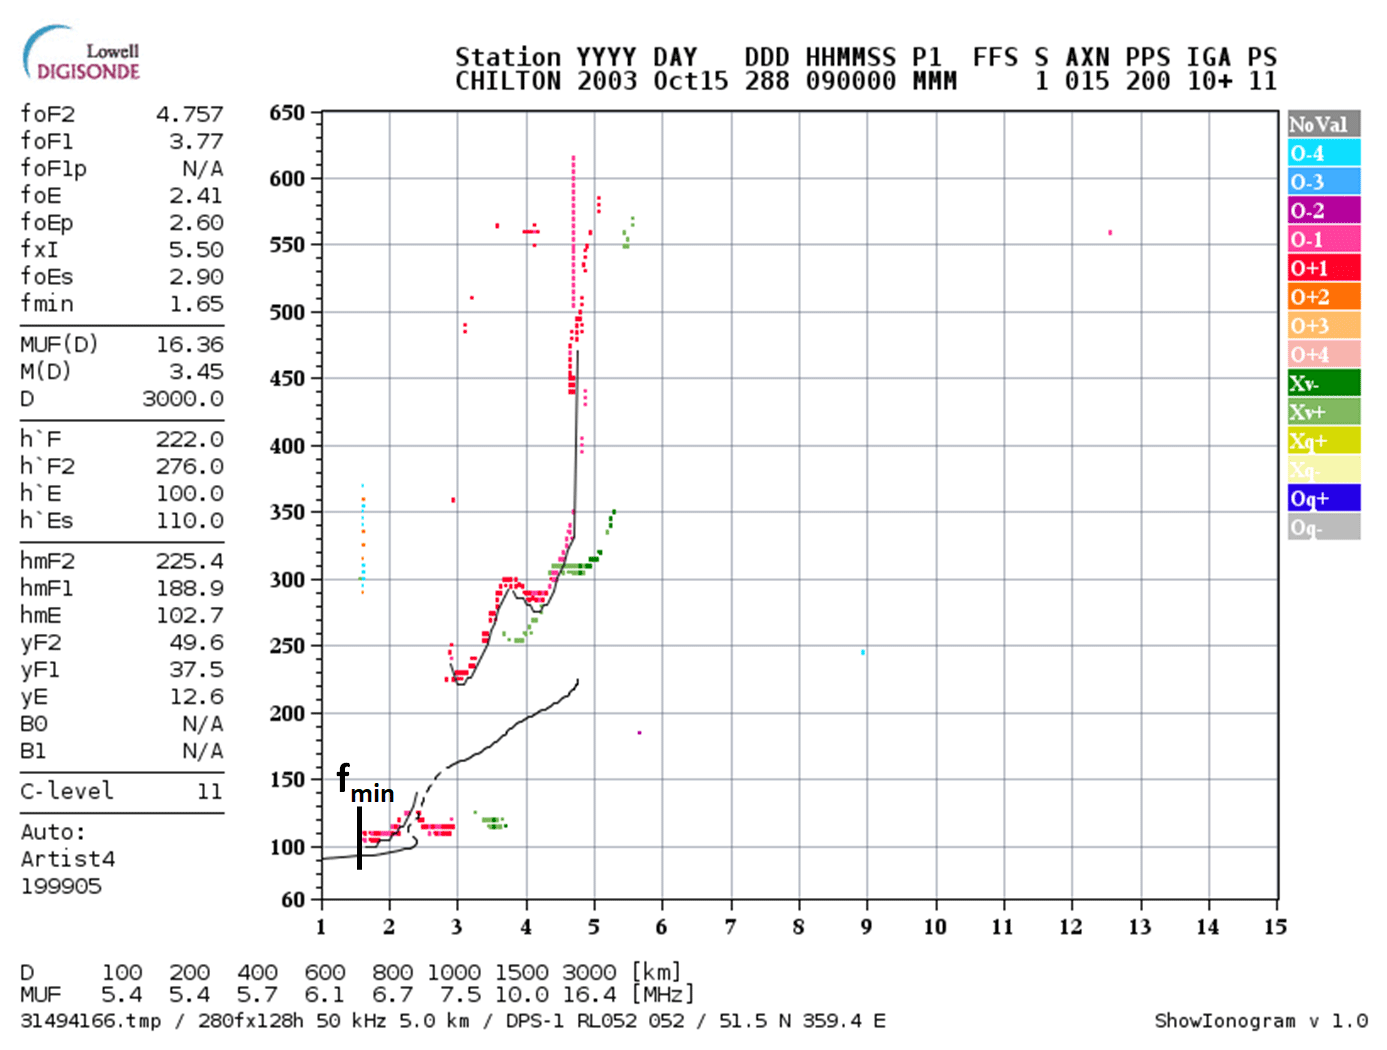
Figure 1A typical daytime ionogram recorded at Chilton at 09:00 UTC on 15 October 2003 with the fmin parameter used marked with a black line. (Source of the ionogram is the GIRO network: Global Ionospheric Radio Observatory (GIRO, http://giro.uml.edu, last access: 14 August 2019).)
The D-region electron density (Ne) response to solar flares was studied with a medium frequency (MF) radar at Kunming (25.6∘ N, 103.8∘ E) (Li et al., 2018). They found a strong and positive correlation between Ne and X-ray changes during 13 M-class flares. Based on the results the Ne changes also depended on the onset time and the duration of the flare. Moreover, the GNSS ground and satellite receivers offered further possibilities to study the solar flare effects on total electron content (TEC) at high time (∼30 s) and spatial resolution (Afraimovich, 2000; Zhang et al., 2002; Tsurutani et al., 2005, 2006). Nogueira et al. (2015) observed an abrupt increase in the TEC in the sunlit hemisphere due to a flare event. The plasma density perturbation seems larger and remains for longer time in the crest region of the equatorial ionization anomaly (EIA) than at the subsolar point. However, Sripathi et al. (2013) demonstrated a good correlation between the TEC enhancement caused by a solar flare and solar zenith angle. This result verifies the study of Zhang and Xiao (2005) who have shown that the ΔTEC varies with solar zenith angle. Tsurutani et al. (2009) summarized the “solar flare effects” on the ionosphere, and especially on TEC, in a comprehensive review paper.
The aim of the present study is to investigate the solar flare effects on ionospheric absorption at midlatitudes and low latitudes, taking into account the solar zenith angle with the systematic analysis of the ionospheric fmin parameter measured at different ionosonde stations. The fmin parameter represents the minimum frequency of the echo trace observed in the ionogram, and it is a rough measure of the “nondeviative” absorption (e.g., Davies, 1990). Following this introduction, the exact method and the data examined are described in Sect. 2. We will detail the results in Sect. 3. Finally, the results are discussed and the concluding remarks are written in Sect. 4.
We analyzed the time series of the fmin parameter inferred from ionograms during solar flares with different intensities occurring in solar cycle 23. The ionograms have been manually verified and evaluated before the analysis. Since the fmin parameter also depends on the radar characteristics and the radio-noise level, we used only data measured by Lowell-type digisondes (Global Ionospheric Radio Observatory data, 2019) for the analyses in order to minimize and compensate the instrumental errors. Furthermore, a dfmin parameter (difference between the value of the fmin and the mean fmin for reference days) has also been determined for the analysis. We chose at least 10 reference days before and after the selected flares based on the X-ray radiation (< ) and proton flux [0.8–4 MeV] (< 3×10³) measured by GOES satellites. The analysis has been repeated for ionospheric data recorded at meridionally distributed ionosonde stations (the selected stations with their geographical coordinates are found in Table 1).
Table 1The selected ionosonde stations and their geographical coordinates.
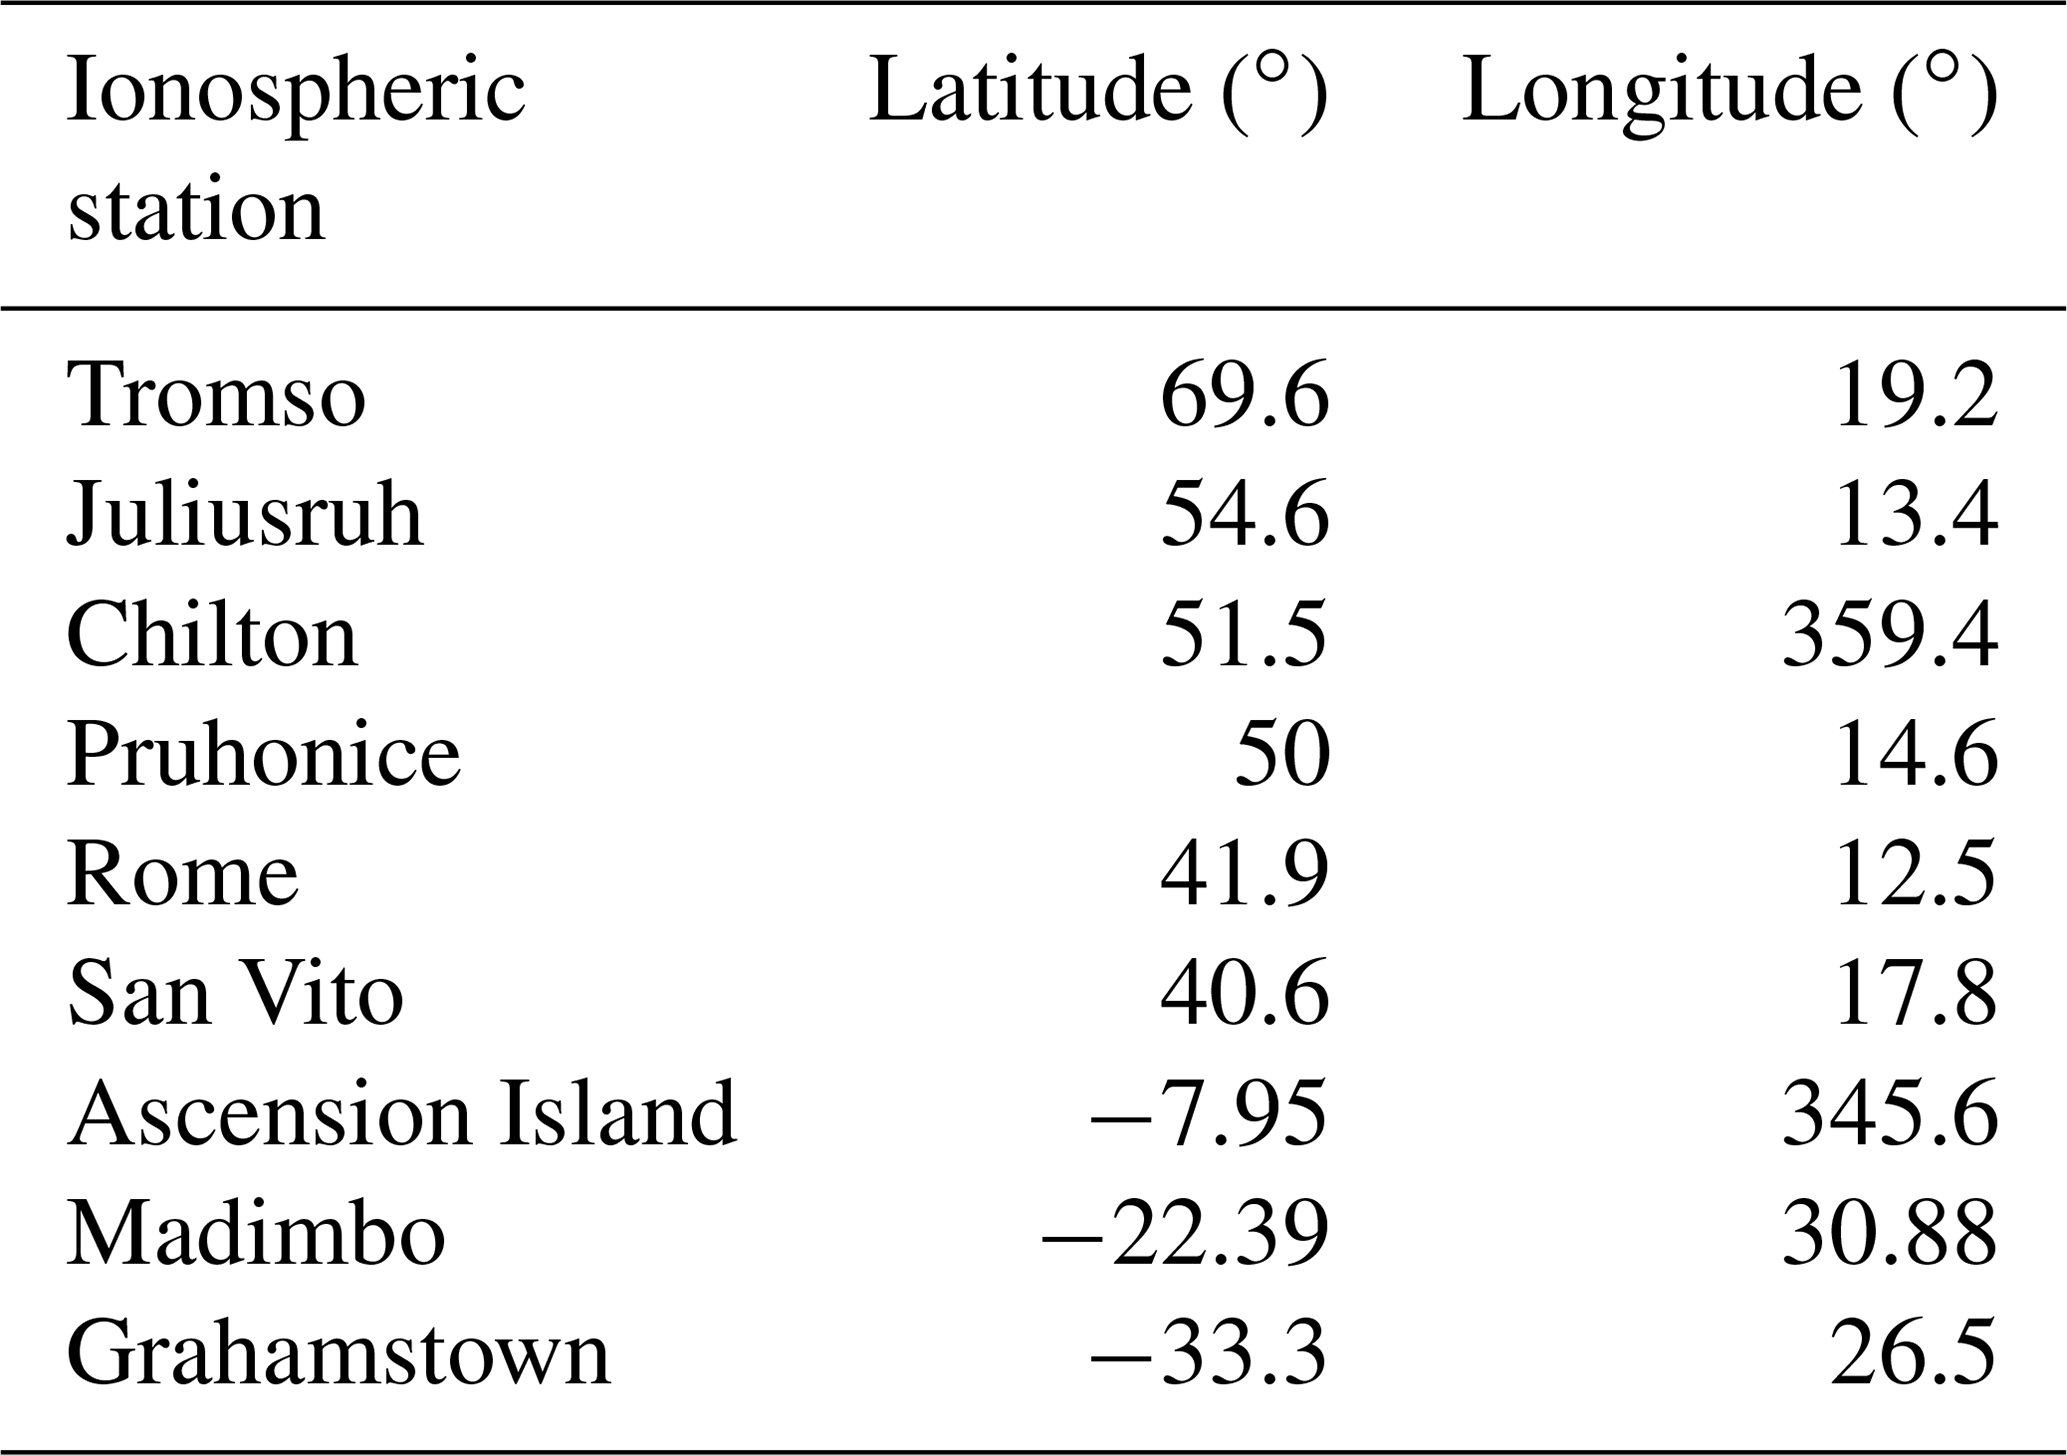
The solar zenith angle dependence of the ionospheric response has also been investigated. We determined the solar zenith angle of the ionospheric stations at the peak time of the selected flare events. Generally, the zenith angles of the observation sites were large in Europe and small in South Africa in the case of the same flare because there are no GIRO stations between these two regions. Firstly, we investigated how the duration of the total radio fade-out depended on solar zenith angle. Then the solar zenith angle dependence of the first measured value of the fmin and dfmin parameters after the fade-out was considered. In the case of the X-class solar flares the radio fade-out took 1–2 h, especially at stations with low solar zenith angle. Consequently, in the next step we compared the solar zenith angle dependence of the fmin and dfmin parameters at a certain time after the fade-out when there were measured data at most of the stations.
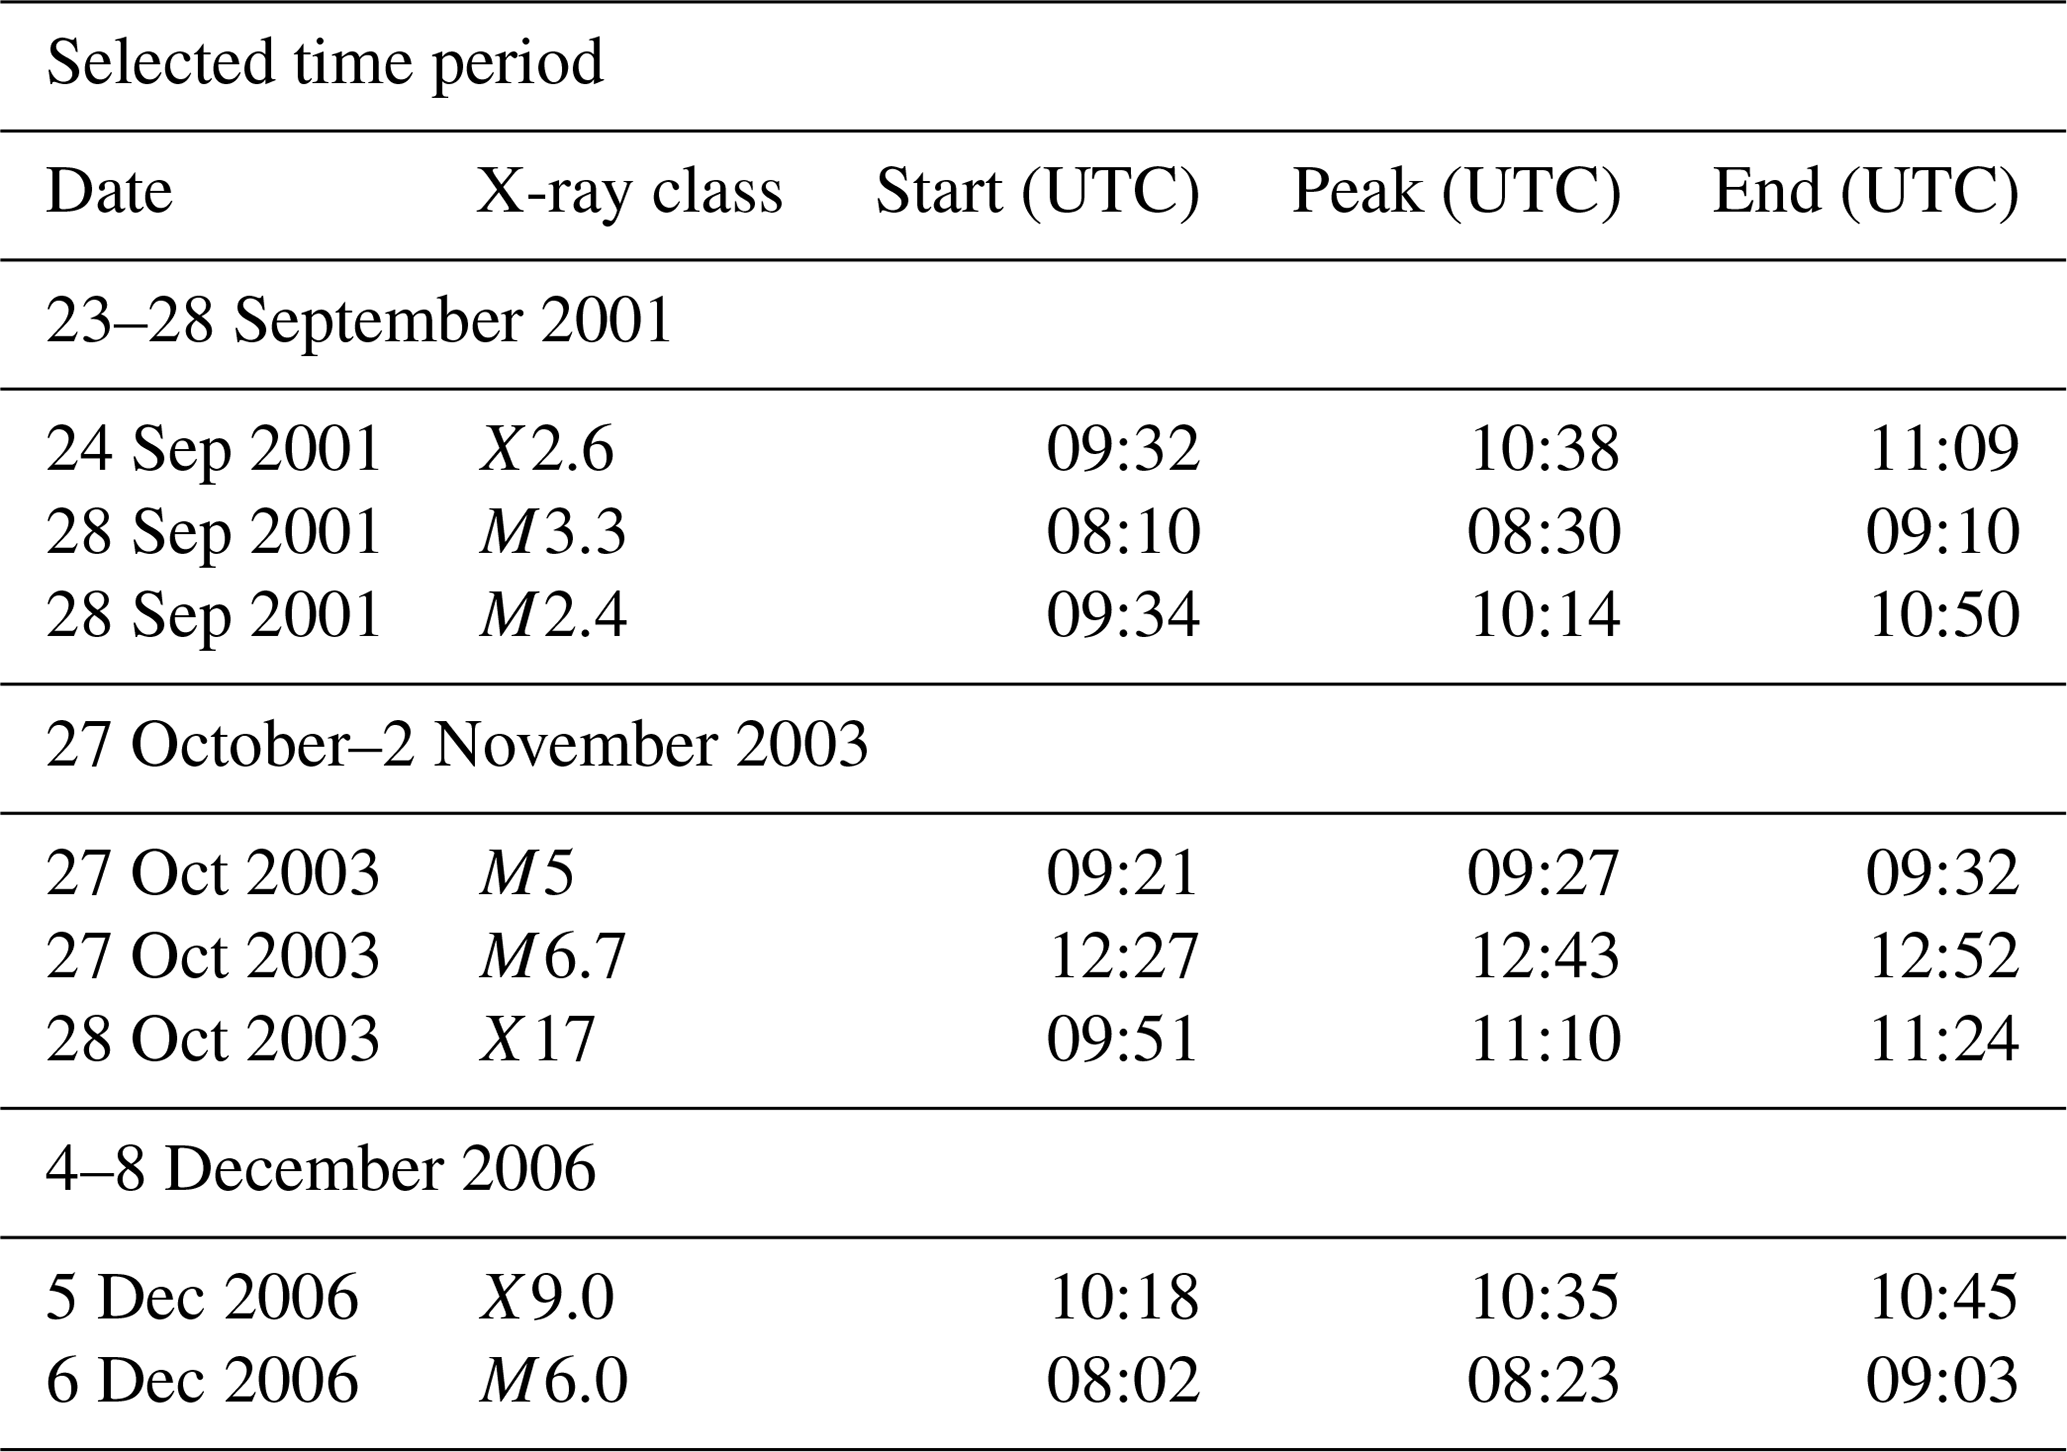
We chose three X-class and five M-class flares from three active periods for the investigation. We also ensured in the selection that the European and South African ionosonde stations be in the sunlit hemisphere during the flares. Therefore, the variation of absorption caused by the radiation could be determined using the fmin parameter measured at these stations. The selected solar flares are listed in Table 2. The ionograms used for the analysis were derived from the Global Ionospheric Radio Observatory network (GIRO, http://giro.uml.edu) and were processed by the SAO-X program. The data from the GOES 11 and 12 satellite used to investigate the X-ray and solar proton flux were available at the OMNIWeb database (https://omniweb.gsfc.nasa.gov/) and at the website of the NOAA (National Oceanic and Atmospheric Administration, https://satdat.ngdc.noaa.gov/sem/goes/data/avg/).
In the present study we investigated the response of ionospheric absorption to solar flares, with particular interest in the solar zenith angle dependence variation of it. We used ionograms measured at ionosonde stations under different solar zenith angles for the analysis. We calculated the solar zenith angles of the stations at the time of the peak of the eight flares for the analysis. We examined three parameters that can be determined from ionograms: duration of the total radio fade-out, the value of the fmin parameter and the value of the dfmin parameter. In the first step we analyzed how the duration of the fade-out during the flare event depended on the solar zenith angle (Sect. 3.1). Secondly the solar zenith angle dependence of the fmin and dfmin parameters measured just after the fade-out was investigated (Sect. 3.2). Then we repeated the analysis for the fmin and dfmin parameters measured at a certain time after the fade-out when we again recorded them at all the stations (Sect. 3.3). In the last step the impact of the intensity variation on the absorption has been considered (Sect. 3.4).
Here we demonstrate in detail the ionospheric response to an intense X17-class eruption that occurred on 28 October 2003. The European and South African ionosonde stations were located in the sunlit hemisphere during this flare event. Figure 2 shows a sequence of ionograms recorded close to the Equator (Ascension Island) and at midlatitude (San Vito) from 09:00 to 14:30 UTC on 28 October 2003. Ionograms measured every 15 min were available for the analysis; however, we show that the records with 30 min time resolution cover the whole time interval of the flare from the start until the end of decay. The upper panel of Fig. 3 shows the X-ray variation between 06:00 and 18:00 UTC recorded by the GOES12 satellite. In the X-ray flux we can clearly observe the flare event that started at 09:51 UTC, reached its peak at 11:10 UTC and ended at 11:24 UTC. The most directly observed ionospheric effect due to the X-class solar flare is the total and partial fade-out of the sounding HF waves on the ionograms (Fig. 2). The disappearance of the traces caused by the enhanced ionospheric absorption was recorded at both stations. However, the duration of the total fade-out measured at the two observation sites was different. We may notice that an increase in the fmin parameter (marked by the vertical black lines in Fig. 2) was first detected in the ionogram at 10:00 UTC over Ascension Island, close to the dip equator (fmin increased to 5.4 MHz). In contrast, at San Vito, located in southern Italy at midlatitude, the effect was weaker at this time (fmin ∼2.9 MHz). It indicates that the increased absorption, caused by the solar flare, has been detected earlier close to the Equator than at midlatitude. The total attenuation of the radio waves was first recorded at Ascension Island at 11:00 UTC. In the subsequent ionograms at 11:15 UTC (not shown here) and at 11:30 UTC the total blackout was observed at both stations, which coincided with the peak in the X-ray flux as it is shown at the upper panel in Fig. 3. Therefore, the ionospheric absorption caused by the flare event had a maximum during this period. The trace of the F-region appears on the ionogram at San Vito at 12:00 UTC, while the total radio fade-out remains at Ascension Island until 12:30 UTC. With the decay in the X-ray flux the blackout became partial at both stations. The fmin parameter returns to its regular daily value (∼2.3 MHz) at San Vito at 14:00 UTC. It shows the end of the high absorption period caused by the flare at midlatitude. The recovery over Ascension occurs later, and partial radio fade-out was still detected at 14:30 UTC, indicating that the impact of the ionospheric absorption is still detectable in the equatorial region. We believe that the different duration of the total radio fade-out recorded in the ionograms at the two stations can be explained by the different solar zenith angle at the two sites. Based on the theoretical description (Davies, 1990) and model (D-RAP2 model) the degree of the radio wave absorption in the ionosphere varies with the solar zenith angle. Therefore, the absorption variation caused by the solar flare is largest at the subsolar point (solar zenith angle = 0), and it decreases with increasing solar zenith angle. Thus, the period of the total radio fade-out caused by the increased absorption should be longer close to the Equator than at midlatitude (as it can be observed in Fig. 2). In order to investigate the solar zenith angle dependence of the ionospheric response we compared ionograms measured at stations under different solar zenith angles at the time of the flare.
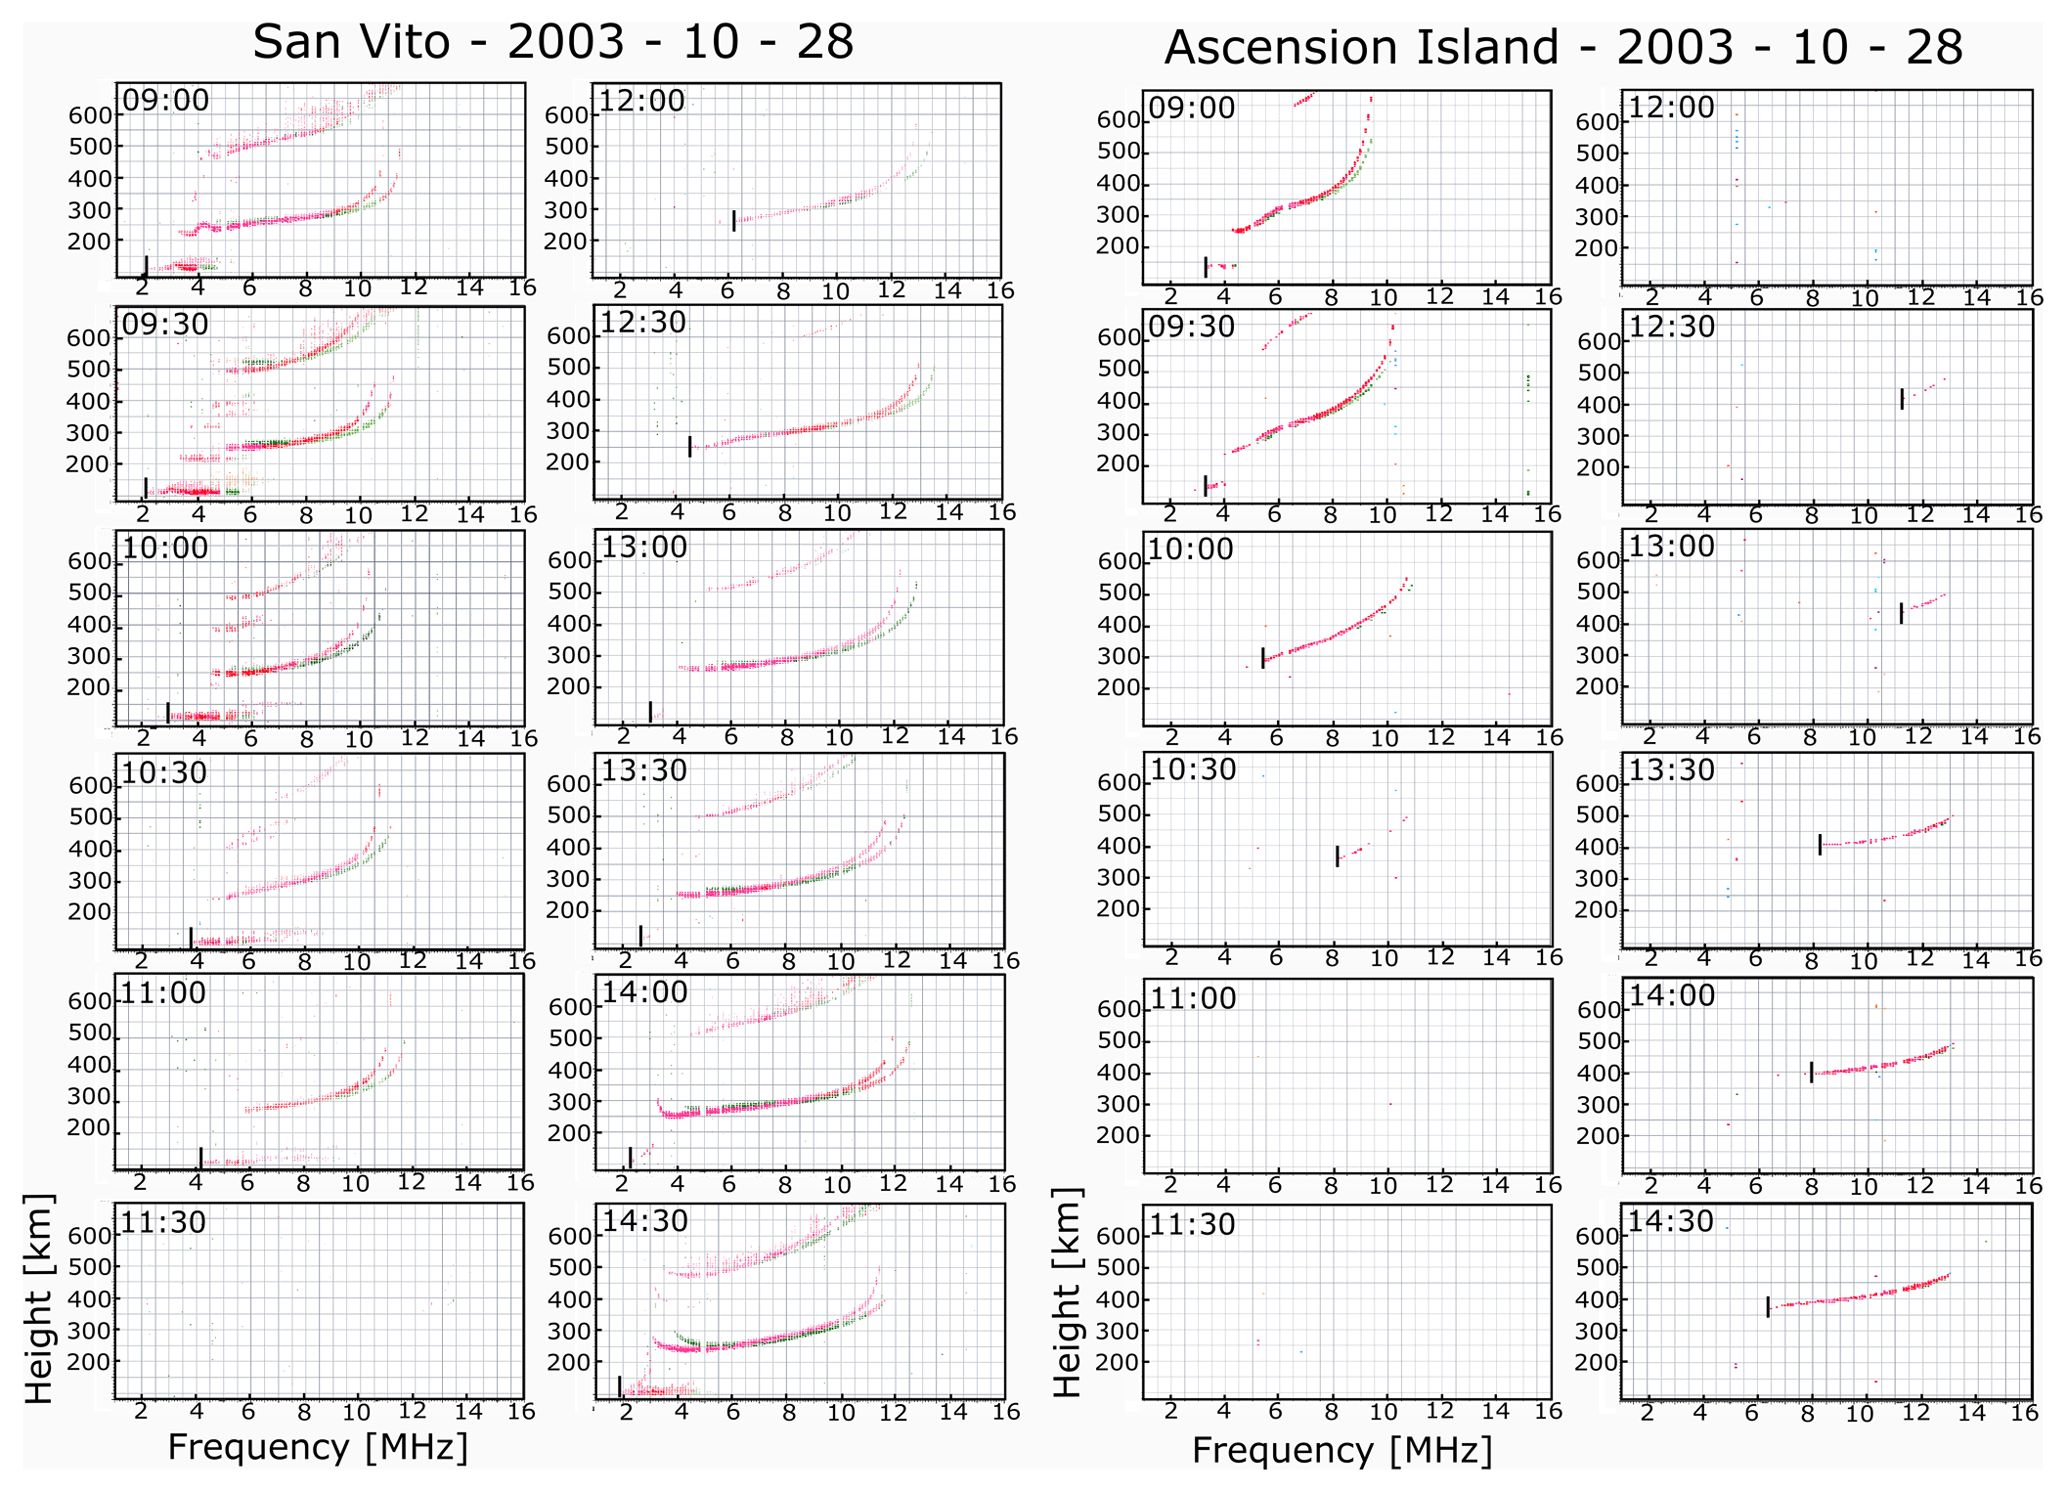
Figure 2Sequence of ionograms at 30 min intervals recorded at San Vito (lat 40.6, long 17.8) and at Ascension Island (lat −7.95, long 345.6) from 09:00 to 14:30 UTC on 28 October 2003. This period covers the start, peak, and decay (incomplete) of the flare X-ray flux variation. The total and partial fadeout of the sounding HF waves can be seen in the ionograms. The black vertical lines show the fmin parameter on the ionograms (like on the sample ionogram in Fig. 1). (Source of the ionograms is the GIRO network: Global Ionospheric Radio Observatory; GIRO, http://giro.uml.edu.)
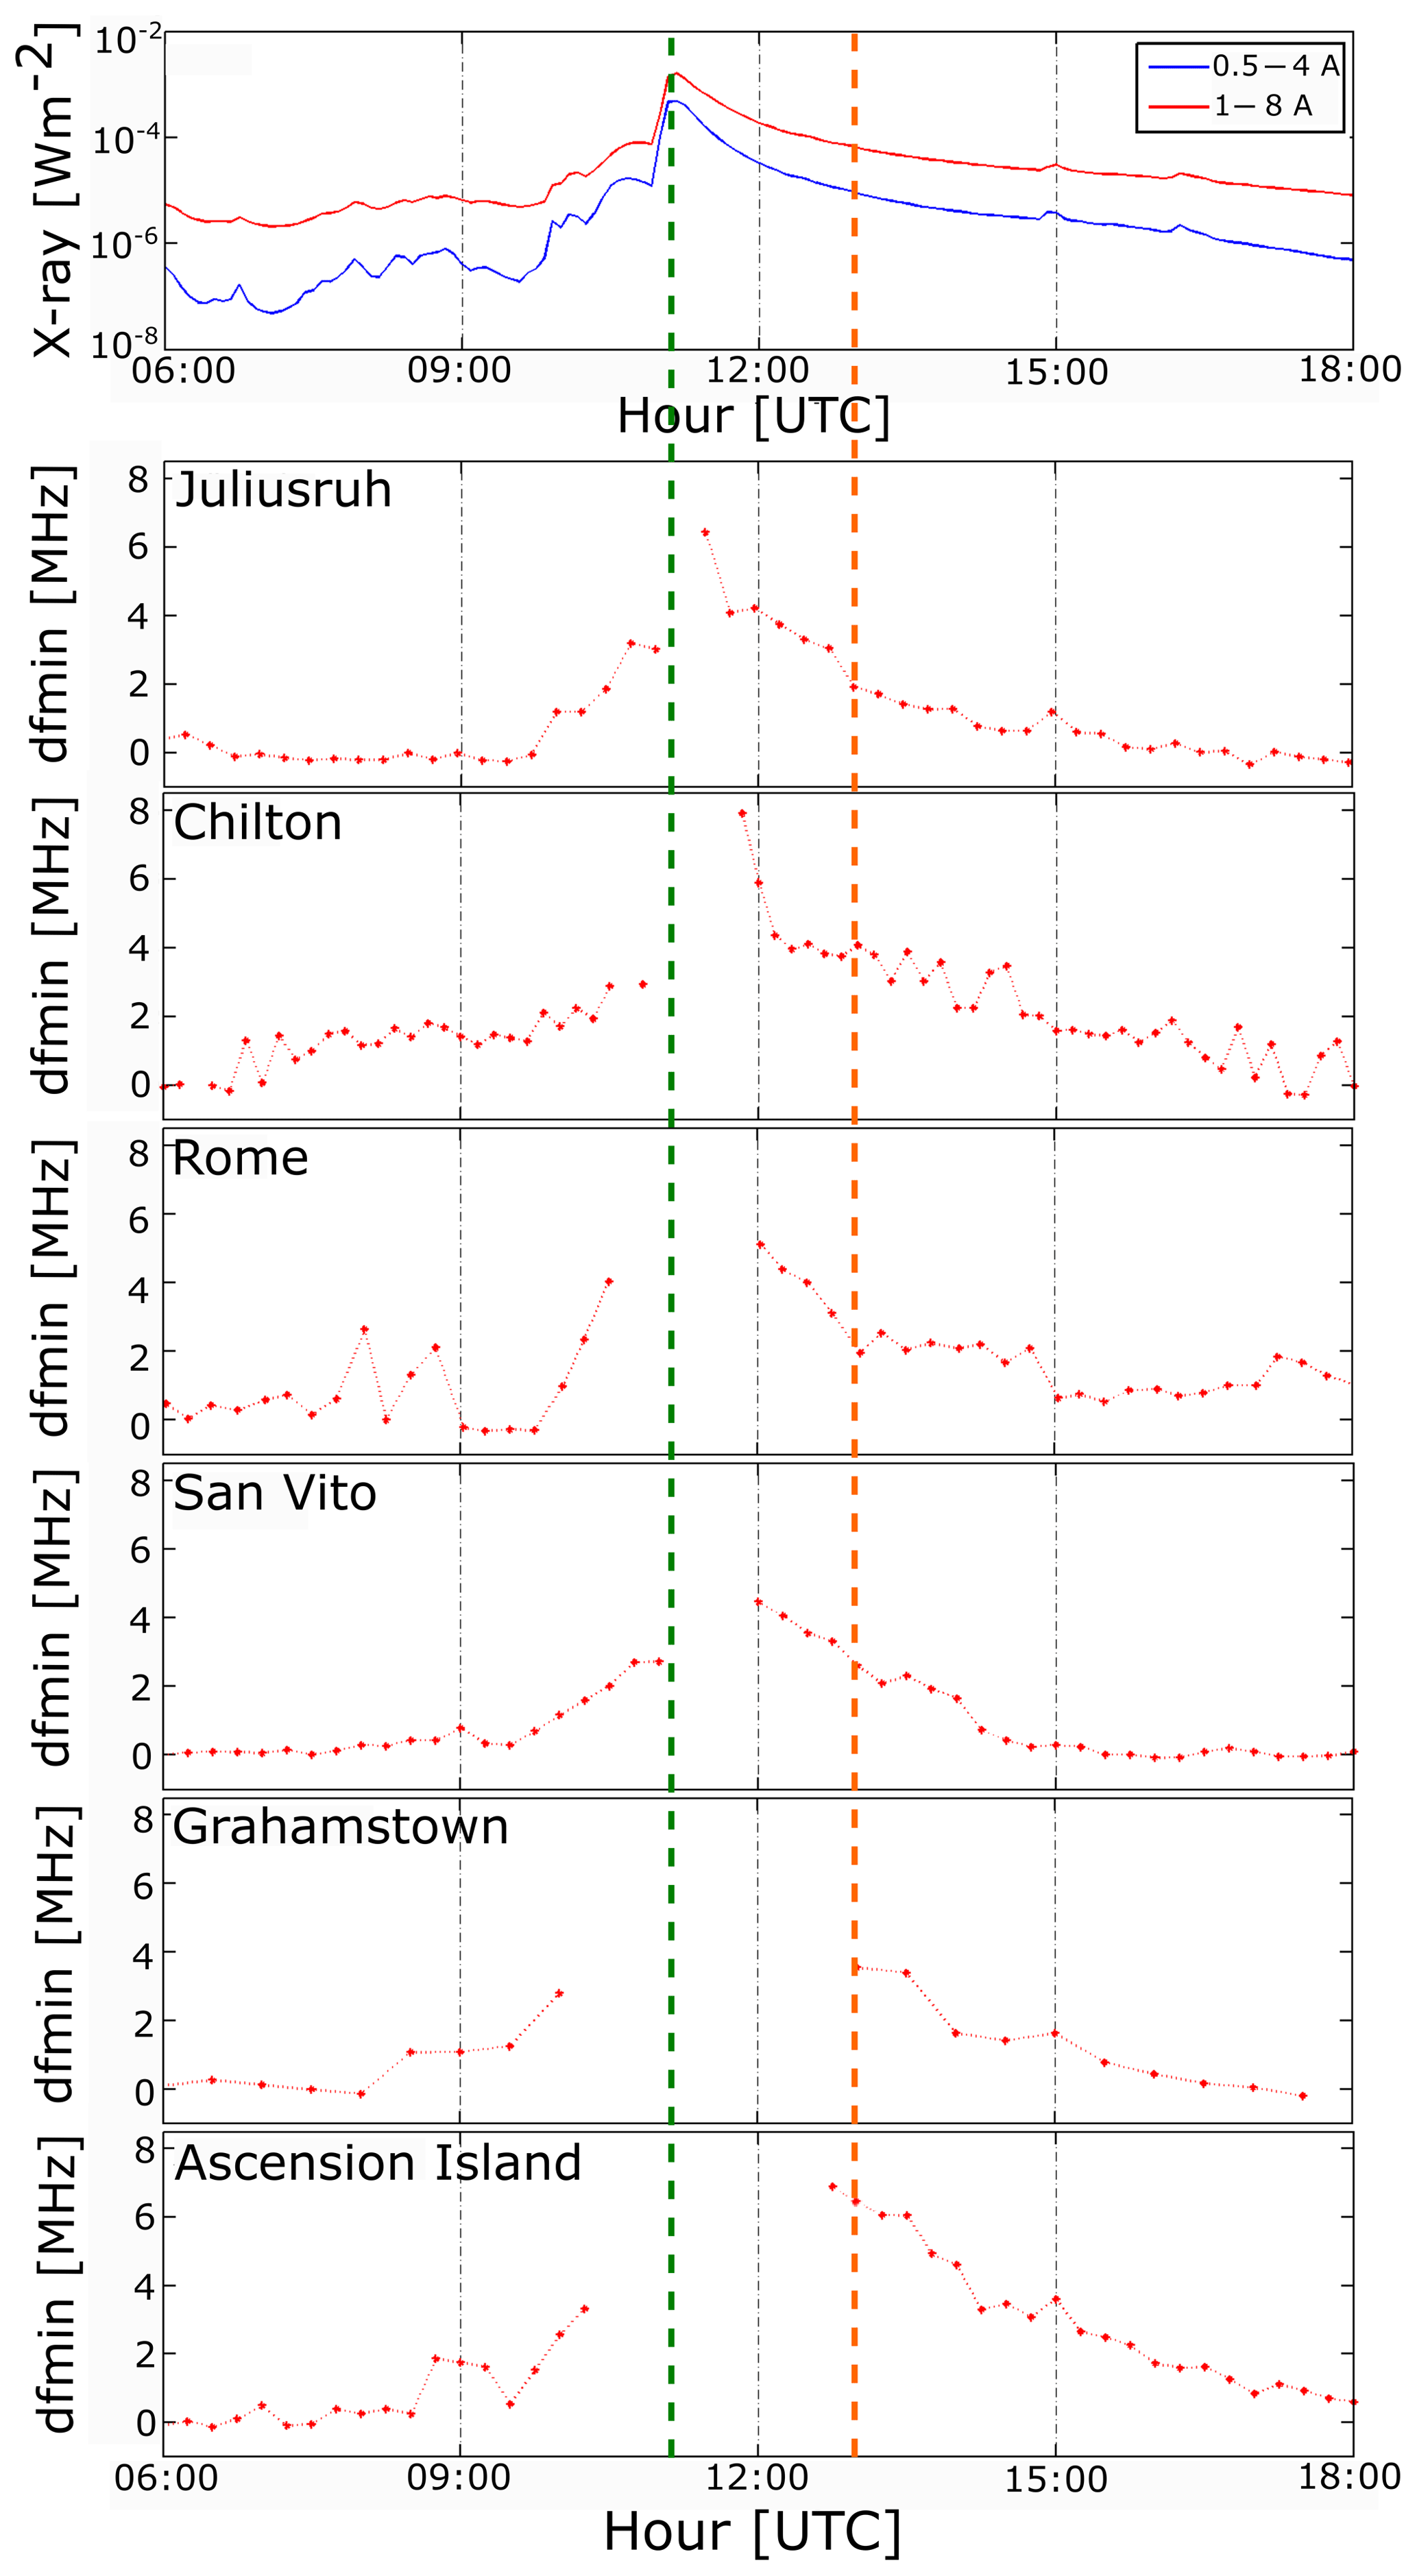
Figure 3The variation of the X-ray flux (upper panel) and the changes of the dfmin (red dots and red dashed line) parameter detected at different ionosonde stations with different zenith angle (from larger to smaller) on 28 October 2003 between 06:00 and 18:00 UTC. The vertical green dashed line shows the peak time of the X17 flare while the vertical orange dashed line shows the time used for the second comparison (13:30 UTC, in Sect. 3.3).
The X-ray flux changes and dfmin parameter measured at stations with different solar angles on 27 and 28 October 2003 are shown here (Figs. 3 and 4). We may notice in Fig. 3 that the duration of the total radio fade-out tends to show a solar zenith angle dependence. It goes from smaller to larger values at stations with larger to smaller zenith angles. Looking at the values of the dfmin parameter detected just after the fade-out at the stations on 28 October, it seems that they also follow this trend. However, this relation is not as unambiguous as in the previous case. We also compared the dfmin values recorded at a certain time after the total fade-out. We chose 13:00 UTC on 28 October 2003 for this comparison, when the fmin parameter was detectable at all stations. As seen in the upper plot the X-ray flux at 13:00 UTC was still enhanced in contrast with its values before the flare. The values of the dfmin parameter were ∼2–3 MHz at the midlatitude stations at 13:00 UTC while the detected record is ∼4 MHz at Grahamstown (low-latitude) and 6 MHz at Ascension Island (close to the Equator). We can conclude in this case as well that the smaller the solar zenith angle, the larger the detected value of the dfmin. A similar tendency of the dfmin parameter can be seen during the two M-class solar flares on 27 October 2003 (Fig. 4). We must note that these two M class solar flares did not cause total radio fade-out in the ionosphere except at Grahamstown. The echoes were not detected there between 08:00 UTC and 10:00 UTC. However, the solar zenith angle of the station was low (21.77∘) at the peak time (at 09:30 UTC) of the M5-class flare.
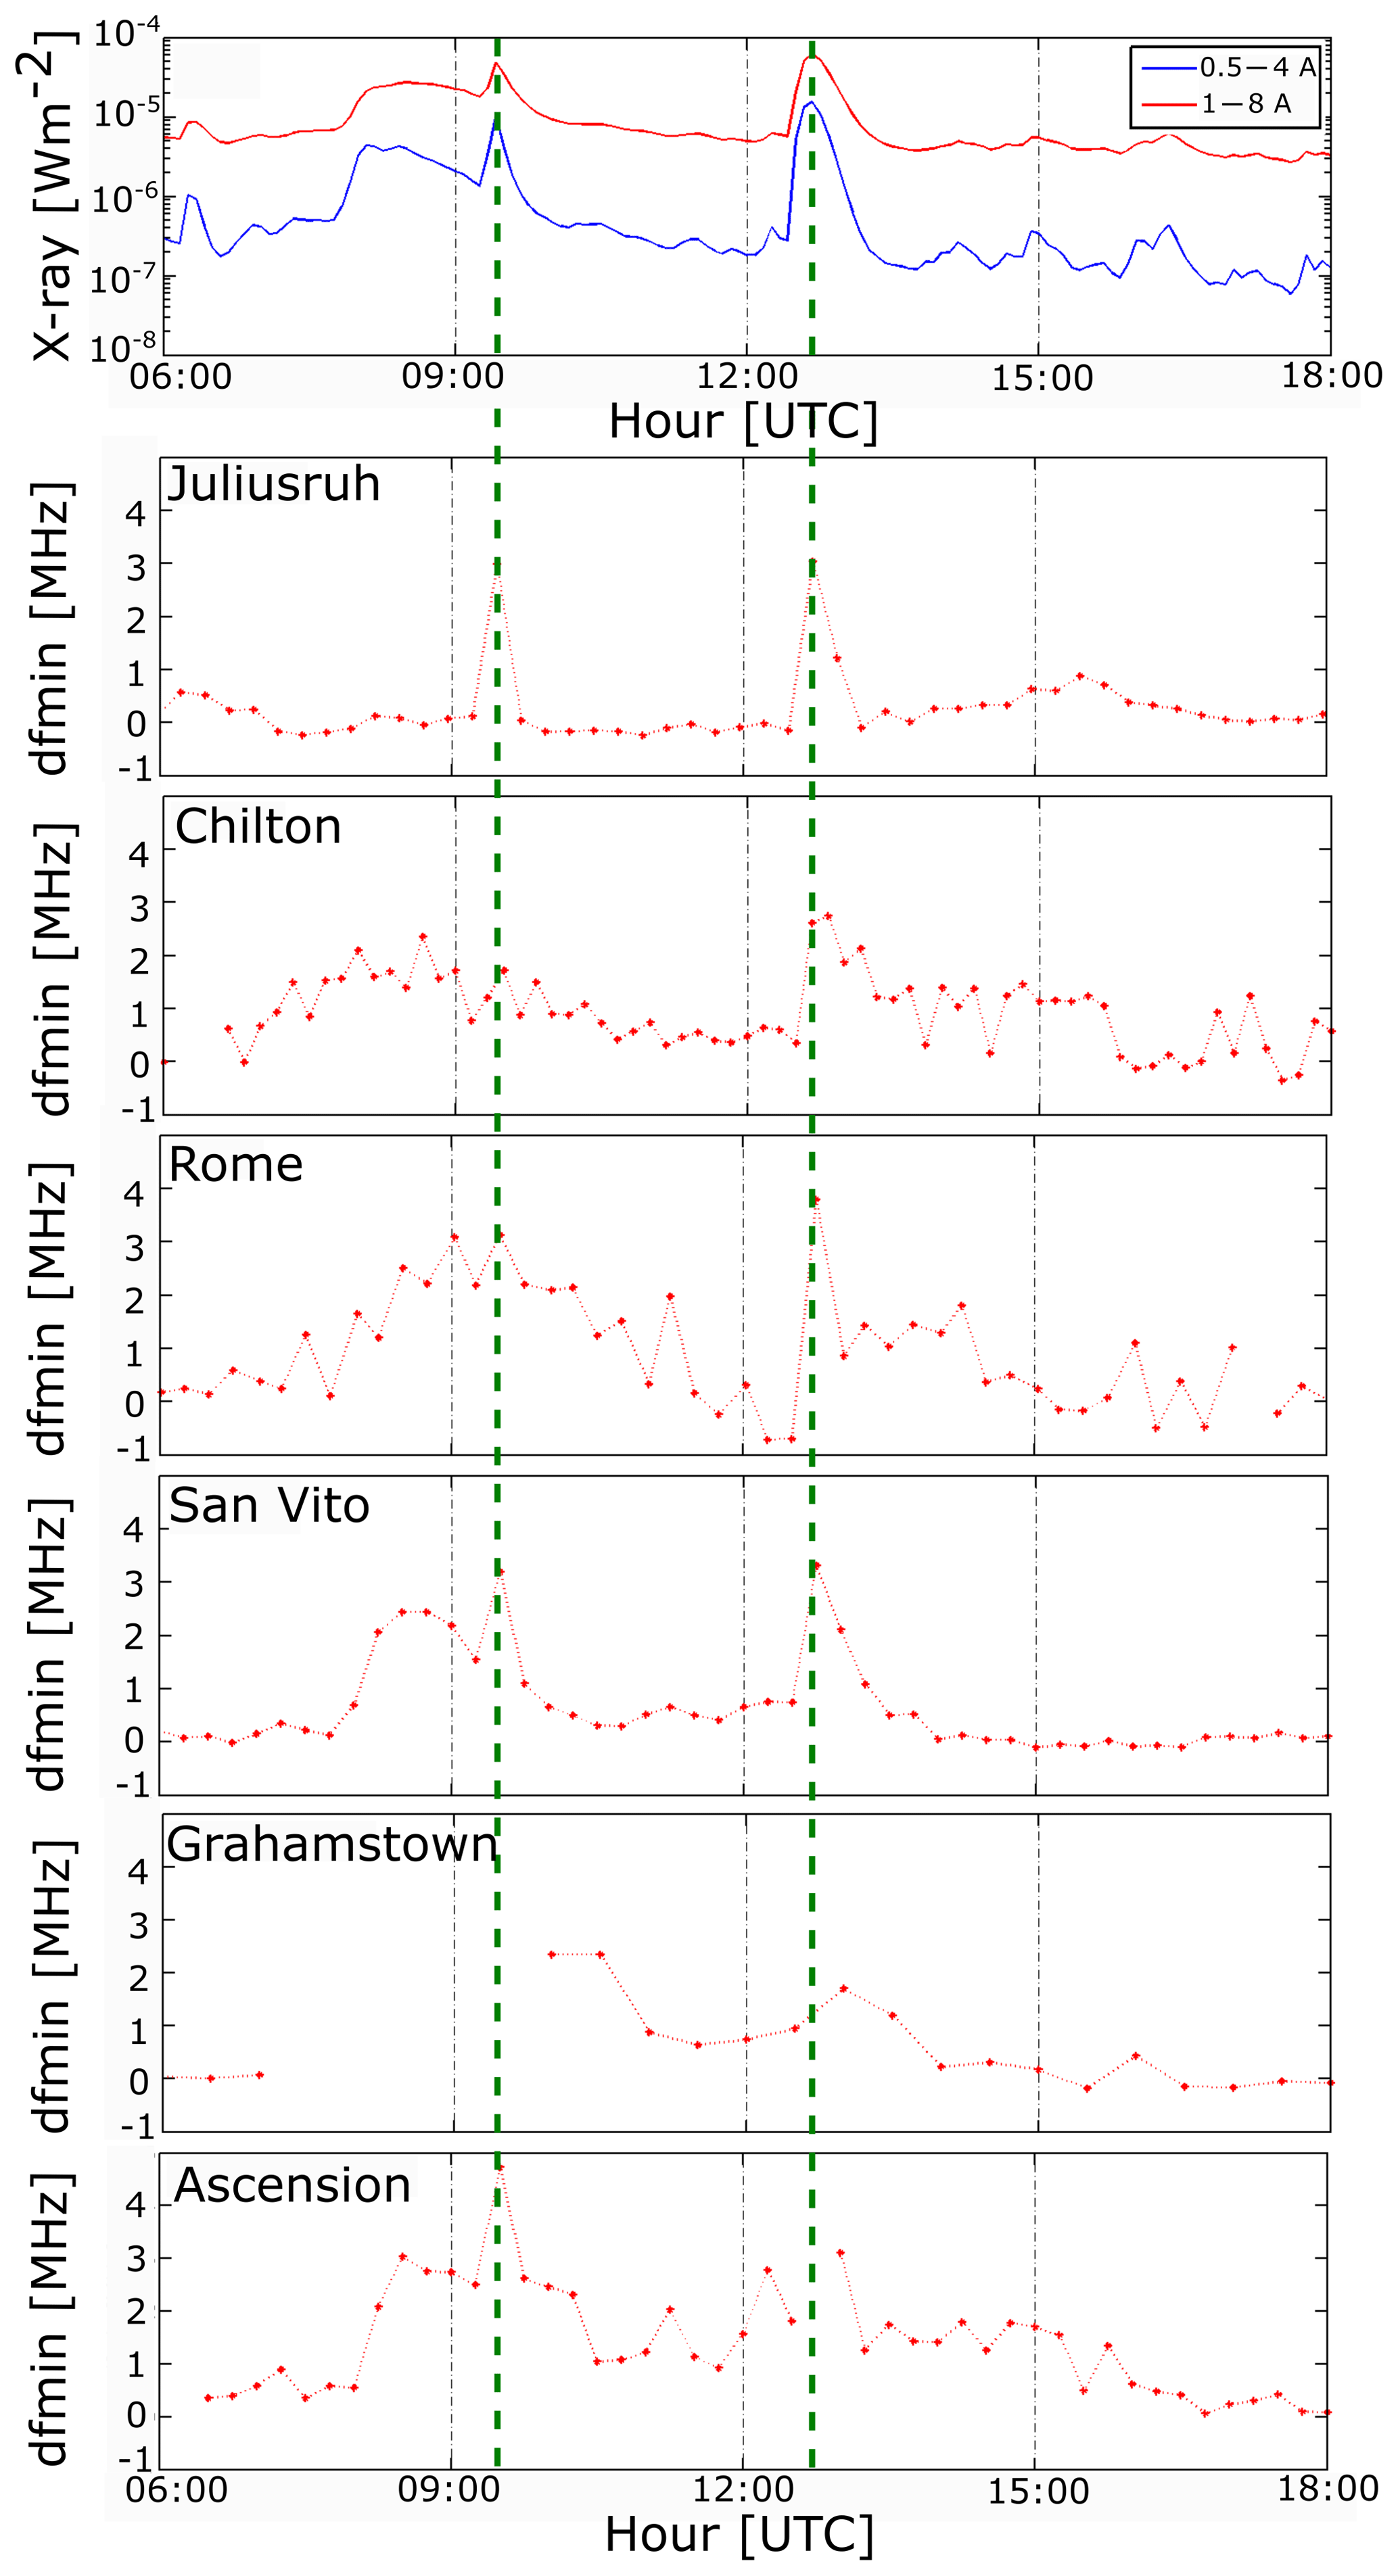
Figure 4The variation of the X-ray (upper panel) and the changes of the dfmin (red dots and red dashed line) parameter detected at different ionospheric stations with different zenith angle (from larger to smaller) on 27 October 2003 between 06:00 and 18:00 UTC. The vertical green dashed lines show the time of the M5 (peak at 9:27 UTC) and M6.7 (peak at 12:43 UTC) flares.
We investigated the solar zenith angle dependence of these parameters (total fade-out, fmin, dfmin) during the other five flares. The X-ray flux and dfmin changes are not detailed here in the other cases. Nevertheless, in the next sections we will show summary plots about the solar zenith angle dependence of the values. We must note here that generally the number of observations (N) is limited to say anything about statistical significance but the plots are illustrative.
3.1 Duration of the fade-out
Total and partial radio fade-out was experienced at every ionospheric station during and after the X-class solar flares (on 24 September 2001, 5 December 2005 and on 28 October 2003) and also in the case of some M-class flares (e.g., on 6 December 2006). The detected time periods of the total radio fade-out were between 15 and ∼150 min. The solar zenith angle dependence of the duration of the total fade-out has been investigated during these four events. The results are shown in Table 3 and in Fig. 5. The solar zenith angle dependence of the duration of the total radio fade-out can be clearly seen in Fig. 5, especially during the X17 flare on 28 October 2003 (Fig. 5a) and the X9 flare on 5 December 2006 (Fig. 5b). The duration of the fade-out tends to increase with decreasing solar zenith angle. The tendency is similar in the other two cases but is not that pronounced.
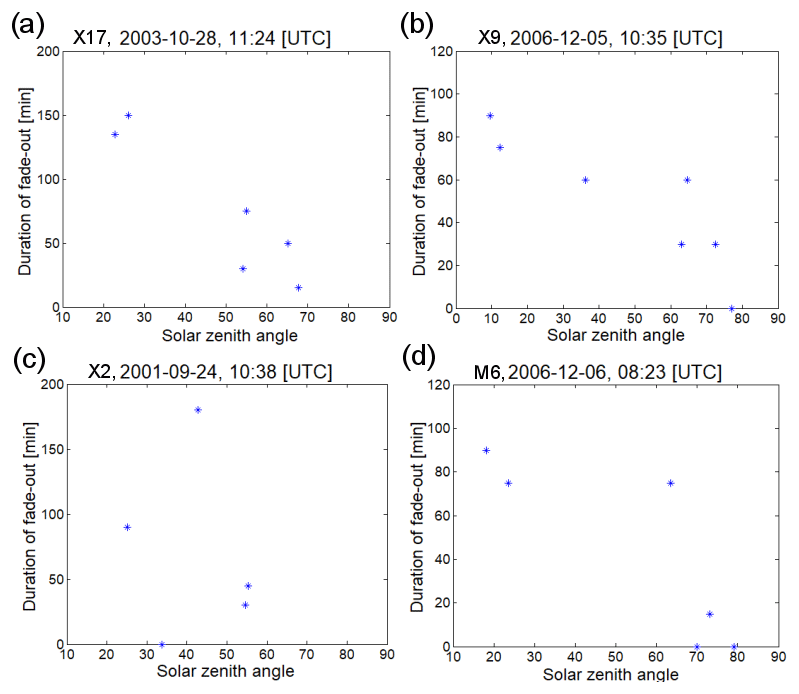
Figure 5The solar zenith angle of the ionosonde stations at the time of the peak versus the measured duration of the total radio fade-out in the case of flare events which occurred on 28 October 2003 (a), 5 December 2006 (b), 24 September 2001 (c), and 6 December 2006 (d).
Table 3The ionosonde stations (first column) with their solar zenith angle (second column) at the time of the peak of the selected solar flares. The durations of the total radio fade-out at the station appear in the third column. The tabulated fmin (4th column) and dfmin (5th column) values were measured at the peak time of the flares or directly after the fade-out.

3.2 Variation of the fmin and dfmin values just after the fade-out
The solar zenith angle dependence of the fmin and dfmin values measured at the peak time of the flares or immediately after the fade-out is analyzed in the next step. The results are shown in Table 3 and Figs. 6 and 7. Extreme increases in the fmin values (4–9 MHz) were observed at almost every station at the time of the X-class solar flares (on 24 September 2001, 5 December 2005 and on 28 October 2003; Fig. 6a, b and c). Furthermore, the variation of the fmin parameter was well pronounced (2–7 MHz) during the M class solar flares as well (e.g., on 28 September 2001, shown in Fig. 6d, and on 6 December 2006, Fig. 6e). The solar zenith angle dependence of the fmin and dfmin values can be seen in most cases. The fmin values are increasing with decreasing solar zenith angle. This increasing trend of the fmin parameter is especially pronounced in Fig. 6b, c and e in the case of the flares 5 December 2006, 9–24 September 2001 and 6 December 2006 respectively. The trend can be recognized in Fig. 6d., e, g and h, although points are more scattered. However, there is no observable trend in Fig. 6a in the case of the most intense flare of the Halloween event on 28 October 2003. Looking at the fmin values during the flares, the effect of the different flare intensities on the ionosphere are detectable as well. The fmin values in the case of the X-class flares in Fig. 6a (28 October 2003) and in Fig. 6c (24 September 2001) are larger (fmin > 5 MHz) than in the case of the M-class flares from the same periods (3<fmin<8 MHz in Fig. 6d, f, g and h). A seasonal dependence of the fmin parameter is also evident. The values are larger in September and October (3<fmin<11 MHz) than in December (2<fmin<7 MHz).
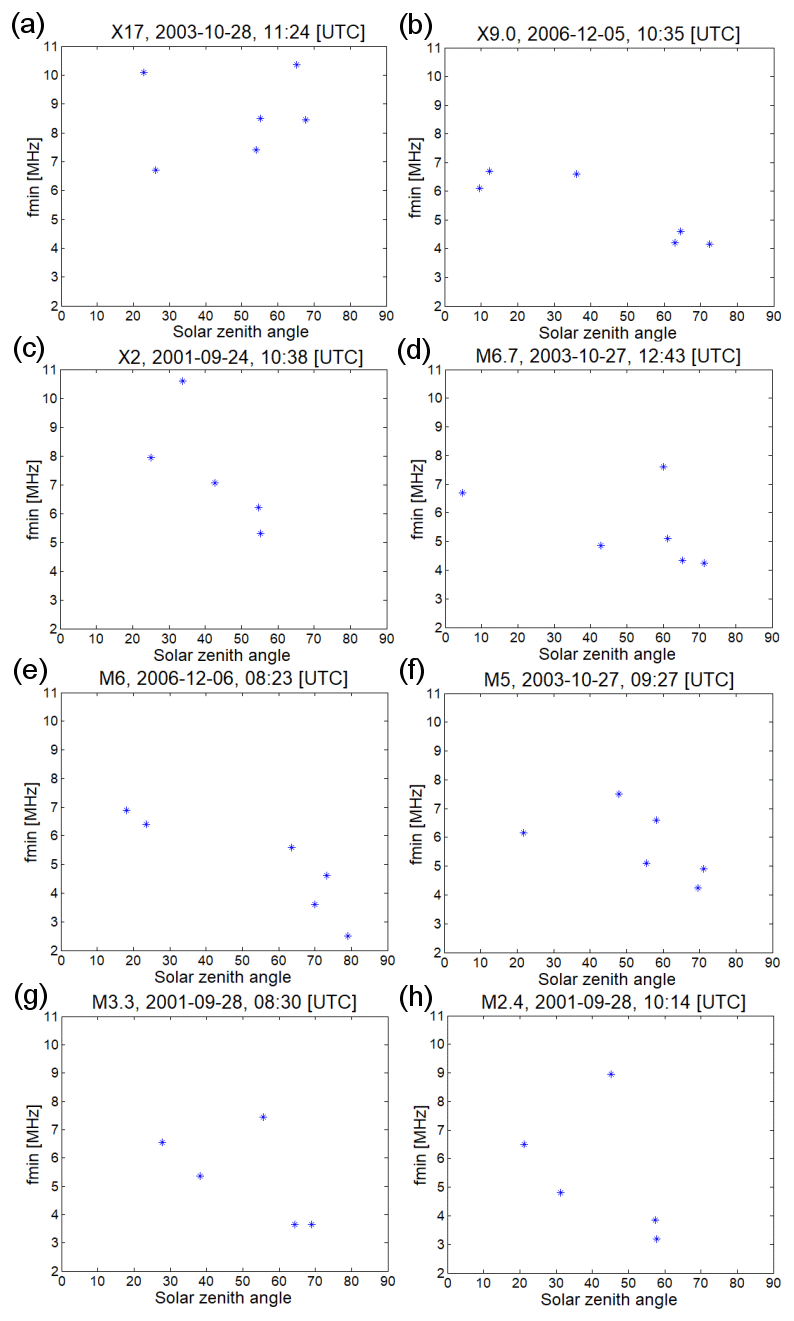
Figure 6The solar zenith angle of the ionosonde stations at the time of the peak versus the fmin value at the peak of the flare events or after the fade-out. The X-ray class and peak time of the solar flares are seen in the title of the different panels. The results related to different flares from high to lower intensities are shown from (a) to (h) panels, respectively.
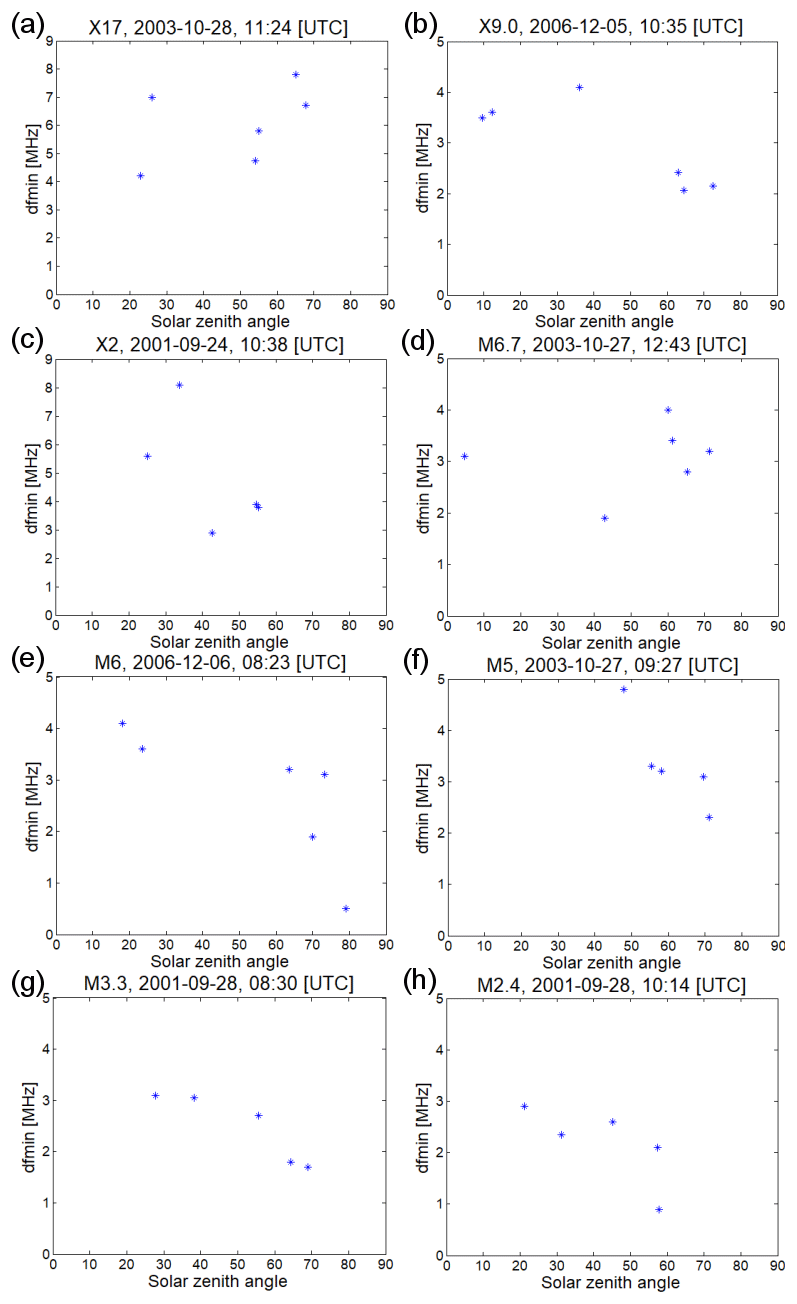
Figure 7The solar zenith angle of the ionosonde stations at the time of the peak versus the dfmin value at the peak of the flare events or after the fade-out. The X-ray class and peak time of the solar flares are seen in the title of the different panels. The results related to different flares from high to lower intensities are shown from panels (a) to (h), respectively.
The increasing trend with decreasing solar zenith angle is also detectable in the dfmin values. Moreover, the points are not that scattered in Fig. 7e, f, g and h, in the case of the M-class flares. Nevertheless, the increasing trend cannot be seen in Fig. 7a and d during the flares that occurred at 12:43 UTC on 27 and at 11:24 UTC on 28 October 2003. The lack of an increasing trend in these cases can be explained by the times of the fade-out being very different at the different ionospheric stations (see Fig. 5). Therefore, the first fmin and dfmin values just after the fade-out were measured at different times when the X-ray radiation of the flare was also different. In order to eliminate this possible cause for variability, we analyzed the fmin and dfmin parameters at a certain time after the peak of the flares when there were detectable values at the most stations.
Table 4The value of the X-ray radiation in watts per square meter (W m−2) and the date and exact time when the measurement occurred are shown in the header in every case. The ionosonde stations (first column) with their solar zenith angle (second column) at the time of the measurement after the peak of the flares are shown. The duration of the total radio fade-out at the station appear in the third column. Also included are the measured fmin (4th column) and dfmin (5th column) values at the time of the measurement after the peak of the flares.

3.3 Variation of the fmin and dfmin parameters at a certain time after the fade-out
Table 4 and Figs. 8 and 9 show the results in connection with the solar zenith angle dependence of the fmin and dfmin values measured at a certain time after the fade-out (we demonstrated on a sample previously in Fig. 3 in the case of the X17 flare occurred on 28 October 2003). The exact times of the fmin and dfmin parameter observations, considered in this analysis, are shown in the header of different cases in Table 4 and in Figs. 8 and 9. The solar zenith angle dependence of the fmin and dfmin values are more conspicuous than in the previous case. The fmin values are increasing with decreasing solar zenith angle in every case, also after the most intense flare of the Halloween event on 28 October 2003 (see Fig. 8a). The solar zenith angle dependence seems well defined in the dfmin values. The increasing trend appears in every case, and also after the flares that occurred at 12:43 UTC on 27 October and at 11:24 UTC on 28 October 2003 (Fig. 9a and d). Moreover, the points in Fig. 9 are less scattered than in the case of fmin, in Fig. 8.
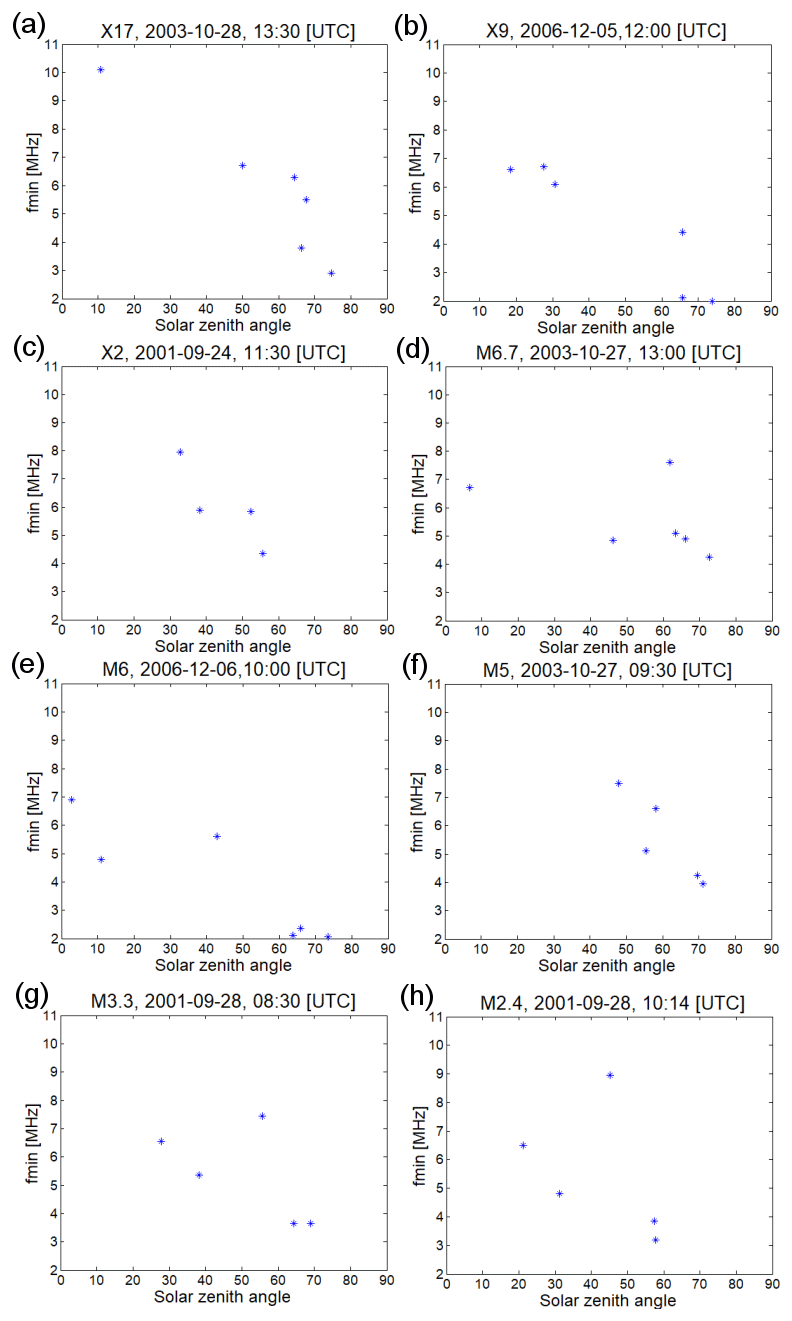
Figure 8The solar zenith angle of the ionosonde stations at a certain time after the peak of the flares versus the fmin value at that time. The X-ray class of the flares and the time when the measurement occurred are shown in the title of the different panels. The results related to different flares from high to lower intensities are shown from panels (a) to (h), respectively.
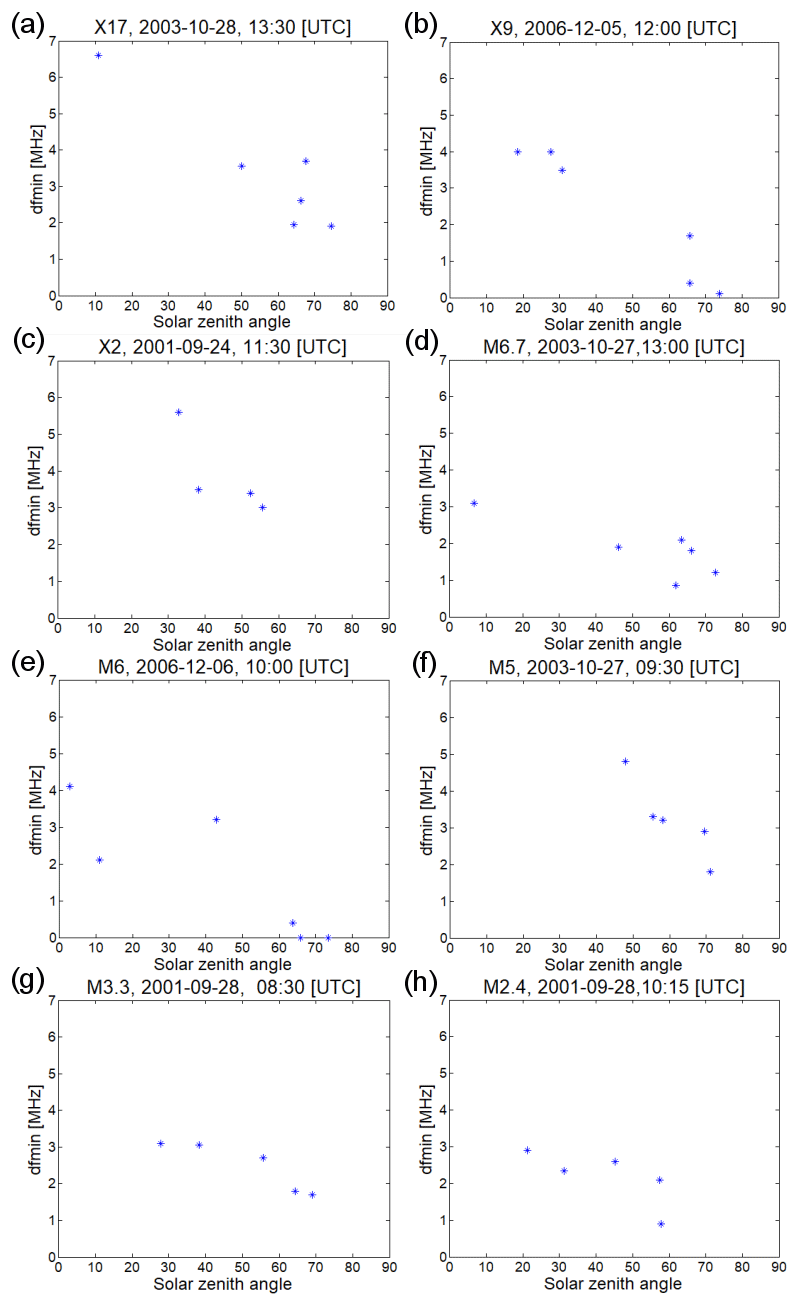
Figure 9The solar zenith angle of the ionosonde stations at a certain time after the peak of the flares versus the dfmin value at that time. The X-ray class of the flares and the time when the measurement occurred are shown in the title of the different panels. The results related to different flares from high to lower intensities are shown from panels (a) to (h), respectively.
3.4 Comprehensive investigation of the intensity of flares and the solar zenith angle dependence
The results showed that the ionospheric response also depended on the intensity of flare (changes in the X-ray flux). The value of the dfmin variation reached 6–9 MHz during and after the X17 (28 October 2003, Fig. 7a) and X2 (24 September 2001, Fig. 7c) flares, whereas the dfmin values varied between 1 and 3 MHz in the cases of the M3.3 and M2.4 flares on 28 September 2001 (Fig. 7g and h). Therefore, a comprehensive analysis, taking into account the solar zenith angle and the intensity together, has also been performed. The solar zenith angle and the X-ray radiation dependence of the fmin and dfmin parameters measured at the peak of the flare events or just after the fade-out are shown in Fig. 10a and b respectively. The results show that the value of the fmin and dfmin parameters depend on the intensity of the X-ray radiation, but they also depend on the solar zenith angle of the stations where they have been measured. The largest fmin (> 7 MHz) and dfmin (> 5 MHz) values have been detected during the X-class solar flares (X-ray radiation > W m−2) and at the stations with low (< 40∘) solar zenith angle. Since the exact times of the measurements were different (because of the different duration of the total radio fade-out), this analysis has been repeated for fmin and dfmin values measured at a certain time after the fade-out when the parameters were detectable at most of the stations. (The exact observation time and the detected X-ray intensity by GOES satellites at that time are shown in the header of different cases in Table 4.) The results of the analysis are shown in Fig. 11. The X-ray radiation dependence can be seen in the value of the fmin parameter in this case as well. However, it is much better defined in the case of the dfmin parameter. Larger dfmin values (> 4.5 MHz) are related to the measurements when the X-ray radiation exceeded W m−2. Moreover, the lowest fmin and dfmin values were measured when the X-ray radiation was weaker (< W m−2) and the solar zenith angle of the stations was above 35∘.
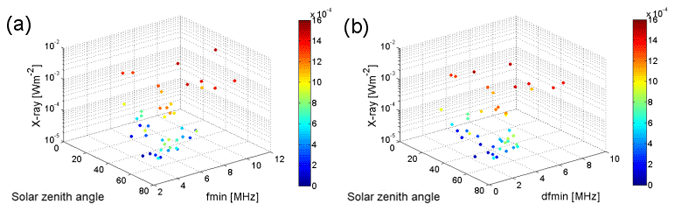
Figure 10The solar zenith angle of the ionosonde stations at the time of the peak, the X-ray radiation at the peak, and the value of the fmin (a) and dfmin (b) parameters at the peak of the flare events or after the fade-out. In order to represent the X-ray radiation dependence a color bar has been connected to the different measurements during the flares with different intensities. The color bar shows the X-ray radiation in watts per square meter (W m−2).
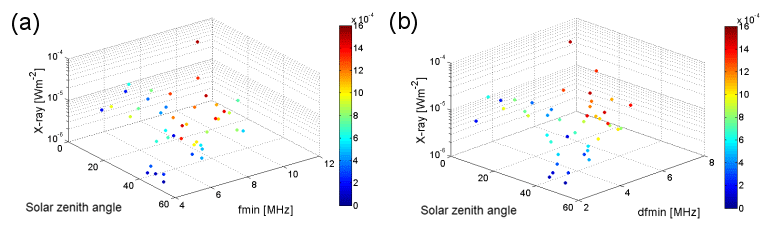
Figure 11The solar zenith angle of the ionosonde stations at the measurement time, the X-ray radiation at the measurement time, and the value of the fmin (a) and dfmin (b) parameters measured at a certain time after the peak of the flares (see text). In order to represent the X-ray radiation dependence a color bar has been assigned to the different measurements as in Fig. 10 in the previous case. The color bar shows the X-ray radiation in watts per square meter (W m−2).
The solar flare effects on ionospheric absorption at midlatitudes and low latitudes have been investigated with the systematic analysis of ionograms during eight X- and M-class flares. The solar zenith angle of the observation sites at the time of the selected flares has also been considered in the analysis.
The lowest recorded ionosonde echo, characterized by the minimum frequency (fmin), has been used as a qualitative measure of the so-called “nondeviative” radio wave absorption in recent decades (Lusignan, 1960; Oksman et al., 1981; Kokourov, 2006; Sharma et al., 2010; Schmitter et al., 2011). However, a systematic analysis of this parameter measured at different ionospheric stations during solar flares has not been previously investigated. To reduce the instrumental errors a dfmin parameter (the difference between the value of the fmin and the mean fmin for reference days) has also been determined for the analysis.
Total and partial radio fade-out were experienced at every ionospheric station during and after the X-class solar flares (on 24 September 2001, 28 October 2003, and on 5 December 2005) and also in the case of some M-class flares (e.g., on 6 December 2006). The observed time of the absence of the echoes was between 15 and 150 min, similar to the findings of Sahai et al. (2007) with ionosondes over the Brazilian sector on 28 October 2003. Similarly, Nogueira et al. (2015) found from a total to partial HF blackout for about 70 min in ionograms measured at the São Luís and Fortaleza equatorial stations as a result of an X2.8 solar flare. They observed a consistent time difference in the beginning and the end of the flare effect in the sequences of ionograms, and they explained this phenomenon by the east–west separation of the observing sites. We investigated the beginning and the end of the total radio fade-out measured at the eastern locations as compared to the western locations. For example, comparing the beginning and the end of the blackout at Chilton (west) with Juliusruh (east) or at Ascension Island (west) with Grahamstown (east) during the X17 flare occurring on 28 October 2003 (Fig. 3), we cannot detect a systematic delay. Based on our results there is no detected east–west separated consistent time difference of the flare effect, whereas examination of the duration of the total radio fade-out at the time of the same flare (28 October 2003; Fig. 3) seems to show dependence on the solar zenith angle. The smaller the zenith angle of the observation site (Grahamstown, Ascension Island), the longer the detected blackout of the HF waves. We observed a similar trend for the flares occurring on 5 and on 6 December 2006 (Fig. 5). The total radio fade-out during the time of intense solar flares (M>5) could be understood due to absorption of radio signals by enhanced D-region ionization. Previous studies reported that enhanced ionization of the D-region can lower the reflection height of the VLF radio waveguide and amplify the amplitude of the propagating signals (Thomson and Clilverd, 2001; Thomson et al., 2004; Kolarski and Grubor, 2014). Sripathi et al. (2013) observed a lack of ionospheric traces in the ionograms simultaneously with an amplified amplitude signal of ground-based VLF records during an X-class solar flare. Their results suggest there could be enhanced D-region ionization due to solar flares which also caused absorption of HF radio waves in the ionograms.
Extreme increases in the fmin (4–9 MHz during X-class and 2–7 MHz during M-class flares) and in the dfmin (4–8 MHz at the time of the X-class flares and 1–4 MHz at the time of the M-class flares) values were observed at almost every station at the time of the flare events. These enhancements of fmin during solar flares are in good agreement with the results reported by Sharma et al. (2010) and with the values measured in South America during X-class flares (Nogueira et al., 2015; Denardini et al., 2016). The analysis of the fmin and dfmin values measured at the peak time of the flares or just after the fade-out shows a solar zenith angle dependence as well. The fmin and dfmin values are increasing with decreasing solar zenith angle. However, this increasing trend is not clear in the case of the most intense (X2 and X17) solar flares when the detected durations of fade-out are very different at the various ionospheric stations. The explanation for that can be that the first fmin and dfmin values just after the fade-out were measured at different time points when the X-ray radiation of the flare was also different. Therefore, in the next step we analyzed the solar zenith angle dependence of the fmin and dfmin parameters at a certain time after the peak of the flares when there were detectable values at most stations. The solar zenith angle dependence of the fmin and dfmin parameters is more conspicuous than in the previous case. The fmin and dfmin values are increasing with decreasing solar zenith angle in every case.
Contradictory results have been reported in the literature about the solar zenith angle dependence of the ionospheric response to solar flares. Our results are in agreement with the D-RAP model (https://www.swpc.noaa.gov/products/d-region-absorption-predictions-d-rap/, last access: 14 August 2019) on the dependence of solar zenith angle. This model was developed based on the theoretical descriptions of the ionospheric absorption by Davies (1990) and Sauer and Wilkinson (2008). According to the model the highest affected frequency (HAF) is largest at the sub-solar point and it decreases with increasing solar zenith angle. Moreover, Zhang and Xiao (2005) and Sripathi et al. (2013) have demonstrated a good correlation between the TEC enhancement caused by solar flares and the solar zenith angle, too. However, Li et al. (2018) concluded that there is no strong relationship between the Ne variation of the D-region and the solar zenith angle. Furthermore, Nogueira et al. (2015) demonstrated an abrupt increase in the TEC. The observed anomaly seemed larger and remained for a longer time in the crest region of the equatorial ionization anomaly (EIA) than at the subsolar point. We also observed the largest and the longest-lasting perturbation of the ionospheric absorption in the equatorial region (at Ascension Island) in most of the cases. However, our results suggest that the solar zenith angle of the observation site plays an important role. For instance, at the peak time of the X9 flare (5 December 2006) the zenith angle of the ionosonde station at Ascension Island (geomagnetic latitude: −2.31∘) was 36.14∘ and the duration of the fade-out was 60 min, smaller than that measured at Grahamstown (geomagnetic latitude: −34.01∘; see Table 3). Even a larger difference was observed at the two stations during the M5-class flare at 09:27 UTC on 27 October 2003. The solar zenith angle of Ascension Island was 47.96∘ at the peak time and there was no detected total radio fade-out, while at Grahamstown, with a smaller solar zenith angle (21.77∘), the duration of the total attenuation of HF waves was 150 min (Table 3). Therefore, our observations confirm the results of Zhang and Xiao (2005), Sripathi et al. (2013) and the D-RAP model that the solar zenith angle plays an important role in the ionospheric response to solar flares.
According to the results of Li et al. (2018) there is a strong correlation between the flare-induced Ne enhancement in the D-layer and the X-ray flux intensity of the flare. In order to study the impact of the X-ray flux on the fmin and dfmin parameters a comprehensive analysis, taking into account the solar zenith angle and the intensity of the flare together, has also been performed. The results show that the values of the fmin and dfmin parameters is highly dependent on the X-ray radiation intensity, but it also depends on the solar zenith angle of the station where it has been measured.
Based on the results, the dfmin parameter is a good qualitative measure for the relative variation of the “nondeviative” absorption, especially in the case of less intense solar flares which do not cause total radio fade-out in the ionosphere (class <M6). However, further analysis of this ionosonde parameter and its comparison with other techniques to measure the ionospheric absorption are necessary to confirm its use as a reliable index.
The ionograms used for the analysis are available at the Global Ionospheric Radio Observatory network (GIRO, http://giro.uml.edu) and were processed by the SAO-X program. The proton data from the GOES 11 and 12 satellite were used as extracted from NASA/GSFC's OMNI data set through OMNIWeb (https://omniweb.gsfc.nasa.gov/). The X-ray data from the GOES 11 and 12 satellites are provided by the NOAA (National Oceanic and Atmospheric Administration) through https://satdat.ngdc.noaa.gov/sem/goes/data/avg/.
VB performed the DPS 4D ionogram data scaling and analysis with the help of KAB. VB drafted the manuscript with the help of AK, GS and EW. GS and EW provided constructive scientific advice.
The authors declare that they have no conflict of interest.
This article is part of the special issue “Vertical coupling in the atmosphere-ionosphere system”. It is a result of the 7th Vertical coupling workshop, Potsdam, Germany, 2–6 July 2018.
The authors are grateful to the University of Massachusetts Lowell Center for Atmospheric Research for the Digisonde data and SAO-X program for data processing. The authors would also like to thank the colleagues from the Department of Ionosphere and Aeronomy, Institute of Atmospheric Physics, CAS, for the valuable discussion in connection with ionosonde data in the framework of the NKM-55/2019 project. Data from the South African Ionosonde Network are made available through the South African National Space Agency (SANSA), who are acknowledged for facilitating and coordinating the continued availability of data. This paper uses data from the Juliusruh Ionosonde, which is owned by the Leibniz-Institute of Atmospheric Physics, Kuehlungsborn. The responsible operations manager is Jens Mielich. This paper uses ionospheric data from the USAF NEXION Digisonde network; the NEXION program manager is Mark Leahy. The authors wish to thank the OMNIWeb data center for providing web access to the solar data of the Geostationary Operational Environmental Satellites (GOES) satellites.
The contribution of Veronika Barta was supported by the Bureau of Educational and Cultural Affairs of the United States Department of State as part of a Fulbright Visiting Scholar Program to the Massachusetts Institute of Technology. Furthermore, her work was supported by the GINOP-2.3.2-15-2016-00003 project. The contribution of Gabriella Sátori was supported by the National Research, Development and Innovation Office (grant no. K115836).
This paper was edited by Christina Arras and reviewed by two anonymous referees.
Afraimovich, E. L.: GPS global detection of the ionospheric response to solar flares, Radio Sci., 35, 1417, https://doi.org/10.1029/2000RS002340, 2000.
Bothmer, V. and Daglis, I. A.: Space Weather, Physics and Effects, Springer, Springer Heidelberg New York Dordrecht London, 203–223, 2007.
Brasseur, G. and Solomon, S.: Aeronomy of the Middle Atmosphere, 2nd Edn., edited by: Reidel, D., Publishing Company, Dordrecht/Boston/Lancaster, 317-331, 1986.
Davies, K.: Ionospheric radio (No. 31), IET, 1990.
Denardini, C. M., Resende, L. C. A., Moro, J., and Chen, S. S.: Occurrence of the blanketing sporadic E layer during the recovery phase of the October 2003 superstorm, Earth Planet. Space, 68, 80, https://doi.org/10.1186/s40623-016-0456-7, 2016.
D-Region Absorption Prediction, D-RAP2 modell: https://www.swpc.noaa.gov/products/d-region-absorption-predictions-d-rap, last access: 14 August 2019.
GIRO: The Global Ionospheric Radio Observatory network, available at: http://giro.uml.edu, last access: 14 August 2019.
Hargreaves J. K.: The Solar-Terrestrial Environment, Cambridge University Press, Cambridge, 1992.
Kokourov, V. D., Vergasova, G. V., and Kazimirovsky, E. S.: Long-term variations of ionospheric parameters as a basis for the study of the upper-atmospheric climate, Phys. Chem. Earth, Parts A/B/C 31.1, 54–58, 2006.
Kolarski, A. and Grubor, D.: Sensing the Earth's low ionosphere during solar flares using VLF signals and GOES solar X-ray data, Adv. Space Res., 53, 1595–1602, 2014.
Li, N., Lei, J., Luan, X., Chen, J., Zhong, J., Wu, Q., Xu, Z., and Lin, L:. Responses of the D region ionosphere to solar flares revealed by MF radar measurements, J. Atmos. Sol.-Terr. Phys., 182, 211–216, 2018.
Lusignan, B.: Cosmic Noise Absorption Measurements at Stanford, California, and Pullman, Washington, J. Geophys. Res., 65, 3895–3902, 1960.
NOAA: The X-ray data from the GOES 11 and 12 satellites, available at: https://satdat.ngdc.noaa.gov/sem/goes/data/avg/, last access: 14 August 2019.
Nogueira, P. A. B., Souza, J. R., Abdu, M. A., Paes, R. R., Sousasantos, J., Marques, M. S., Bailey, G. J., Denardini, C. M., Batista, I. S., Takahashi, H., Cueva, R. Y. C., and Chen, S. S.: Modeling the equatorial and low-latitude ionospheric response to an intense X-class solar flare, J. Geophys. Res.-Space, 120, 3021–3032, 2015.
Oksman, J., Wagner, C. U., Kaila, K., and Lauter, A. E.: Post-storm mid-latitude green aurora and electron precipitation, Planet. Space Sci., 29, 405–413, 1981.
OMNIWeb data center: The proton data from the GOES 11 and 12 satellite, NASA/GSFC's OMNI data set, available at: https://omniweb.gsfc.nasa.gov/, last acces: 14 August 2019.
Rees, M. H.: Physics and Chemistry of the Upper Atmosphere, 1st Edn., Cambridge University Press, Cambridge, 1–40, 1989.
Reid, G. C.: Solar energetic particles and their effects on the terrestrial environment, in: Physics of the Sun, Vol. 3, Astrophysics and solar-terrestrial relations, edited by: Sturrock, P. A., Holzer, T. E., Mihalas, D. M., and Ulrich, R. D., Reidel Publishing Company, Dordrecht, 251–278, 1986.
Rishbeth, H. and Garriot, O. K., Introduction to Ionospheric Physics, Int. Geophys. Ser., Vol. 14, Academic Press, NY, 87–120, 1969.
Sahai, Y., Becker-Guedes, F., Fagundes, P. R., Lima, W. L. C., de Abreu, A. J., Guarnieri, F. L., Candido, C. M. N., and Pillat, V. G.: Unusual ionospheric effects observed during the intense 28 October 2003 solar flare in the Brazilian sector, Ann. Geophys., 25, 2497–2502, https://doi.org/10.5194/angeo-25-2497-2007, 2007.
Sauer, H. H. and Wilkinson, D. C.: Global mapping of ionospheric HF/VHF radio wave absorption due to solar energetic protons, Space Weather, 6, 12002, https://doi.org/10.1029/2008SW000399, 2008.
Schmitter, E. D.: Remote sensing planetary waves in the midlatitude mesosphere using low frequency transmitter signals, Ann. Geophys., 29, 1287–1293, https://doi.org/10.5194/angeo-29-1287-2011, 2011.
Sharma, S., Chandra, H., Vats, H. O., Pandya, N. Y., and Jain, R.: Ionospheric modulations due to solar flares over Ahmedabad, Indian J. Radio Space, 39, 296–301, 2010.
Sripathi, S., Balachandran, N., Veenadhari, B., Singh, R., and Emperumal, K.: Response of the equatorial and low-latitude ionosphere to an intense X-class solar flare (X7/2B) as observed on 09 August 2011, J. Geophys. Res.-Space, 118, 2648–2659, 2013.
Thomson, N. R. and Clilverd, M. A.: Solar flare induced ionospheric D-region enhancements from VLF amplitude observations, J. Atmos. Sol-Terr. Phy., 63, 1729–1737, 2001.
Thomson, N. R., Rodger, C. J., and Dowden, R. L.: Ionosphere gives size of greatest solar flare, Geophys. Res. Lett., 31, L06803, https://doi.org/10.1029/2003GL019345, 2004.
Tsurutani, B. T., Judge, D. L., Guarnieri, F. L., Gangopadhyay, P., Jones, A. R., Nuttall, J., Zambon, G. A., Didkovsky, L., Mannucci, A. J., Iijima, B., Meier, R. R., Immel, T. J., Woods, T. N., Prasad, S., Floyd, L., Huba, J., Solomon, S. C., Straus, P., and Viereck, R.: The October 28, 2003 extreme EUV solar flare and resultant extreme ionospheric effects: Comparison to other Halloween events and the Bastille Day event, Geophys. Res. Lett., 32, L03S09, https://doi.org/10.1029/2004GL021475, 2005.
Tsurutani, B. T., Guarnieri, F. L., Fuller-Rowell, T., Mannucci, A. J., Iijima, B., Gonzalez, W. D., and Verkhoglyadova, O. P.: Extreme solar EUV flares and ICMEs and resultant extreme ionospheric effects: Comparison of the Halloween 2003 and the Bastille Day events, Radio Sci., 41, 1–7, https://doi.org/10.1029/2005RS003331, 2006.
Tsurutani, B. T., Verkhoglyadova, O. P., Mannucci, A. J., Lakhina, G. S., Li, G., and Zank, G. P.: A brief review of “solar flare effects” on the ionosphere, Radio Sci., 44, 1–14, 2009.
Zaalov, N., Moskaleva, E. V., and Shekhovtsov, F. V.: Method of the HF wave absorption evaluation based on GIRO network data, Adv. Space Res., 63, 2075–2087, https://doi.org/10.1016/j.asr.2018.12.024, 2018.
Zhang, D. H., Xiao, Z., Igarashi, K., and Ma G. Y.: GPS derived ionospheric total electron content response to a solar flare that occurred on 14 July 2000, Radio Sci., 37, 1086, https://doi.org/10.1029/2001RS002542, 2002.
Zhang, D. H. and Xiao, Z.: Study of ionospheric response to the 4B flare on 28 October 2003 using International GPS Service network data, J. Geophys. Res., 110, A03307, https://doi.org/10.1029/2004JA010738, 2005.
Zolesi, B. and Cander, L.: Ionospheric Prediction and Forecasting, Springer Geophysics, Springer Heidelberg New York Dordrecht London, 33–43, https://doi.org/10.1007/978-3-642-38430-1, 2014.