
the Creative Commons Attribution 4.0 License.
the Creative Commons Attribution 4.0 License.
 | 03 Nov 2026
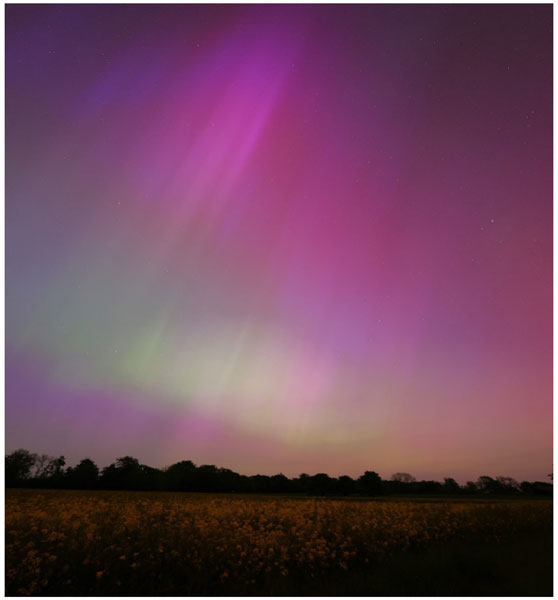
High temporal- and spatial-resolution photographs of the “Christmas” red-green auroras taken over Germany during a main phase of the 10–11 May 2024 superstorm
Bruce T. Tsurutani
Gurbax S. Lakhina
Rajkumar Hajra
Masatomi Iizawa
Yasuhito Narita

Richard B. Horne
Ingo von Borstel
Volker Bothmer
Karl-Heinz Glassmeier
Klaus Reinsch
Philipp Schulz
Sami K. Solanki
The 10–11 May 2024 superstorm had three main phase steps with peak intensities , −354 and −518 nT. During the second main phase red and green auroras occurred over Braunschweig and Göttingen, Germany. The Braunschweig and Göttingen red and green auroral images were taken during intense substorms within the storm second main phase. The high-altitude red aurora displayed brightness streaks/rays, which continued to lower-altitude green auroral brightness streaks/rays. Of the many postulated mechanisms for causing red auroras, it is concluded that high energy electron precipitation along the Earth's magnetic field lines was the main mechanism for both auroral streaks/rays. The plasmapause location estimated using the Dst index was L∼2.6, corresponding to the approximate L shell of Braunschweig and Göttingen.
- Article
(3866 KB) - Full-text XML
- BibTeX
- EndNote


One of the major long-standing mysteries in Space Weather and Space Physics is the physical cause or causes of red auroras. Red auroras occur at midlatitudes at altitudes of ∼200 to ∼800 km during magnetic storms (Barbier, 1958; Roach and Marovich, 1959) where direct physical measurements are extremely difficult to make. See an excellent review by Shiokawa et al. (2005) for red auroras over Japan and Kozyra et al. (1993) for red auroras in general. What are needed to determine the physical causes of red auroras are measurements of suprathermal electrons, suprathermal ions, energetic electrons, kinetic Alfvén waves and ion cyclotron waves to distinguish between the many theoretical hypotheses proposed for generating these types of auroras. Even though red auroras have been extensively studied since the 1960s, very few of the above measurements have been made to date. So, the science community has had to rely on theoretical arguments and any possible indirect information they can obtain. During the 10–11 May 2024 superstorm there were no direct measurements of the causes of red or red-like auroras. All reports were “citizen science” reports. This article will also be a citizen science report.
The recent superstorm on 10–11 May 2024 had a peak intensity on 10–11 May 2024 (Grandin et al., 2024; Hajra et al., 2024). Auroral viewings during this storm were reported from all over the world. Citizen-science auroral observations are from >30 countries, the aurora at geomagnetic latitudes ranging between 30 and 60° with a few observations from even lower latitudes (Grandin et al., 2024). The auroral emissions reported were dominatingly red and pink colors.
Lawrence et al. (2025) reported widespread auroral sightings across the United Kingdom, reaching below 54° N. Lawrence et al. (2025) did not mention color, so it is presumed that they were green auroras. Foster et al. (2024) reported a high-altitude red aurora with weaker green emission below at the Missouri Skies Observatory at 40° N. Gonzales-Esparza et al. (2024) reported citizen science observations of red auroral displays at 20 of 32 states of Mexico magnetic latitude (MLAT) ranging from 26 to 38°.
Kataoka et al. (2024a) reported citizen-science observations of a red aurora during a supersubstorm (SSS; Tsurutani et al., 2015) that was triggered by an interplanetary shock that occurred at 15:20 UT, 10 October 2024. The top height of red aurora in Japan extended to ∼950 km and the red aurora shifted toward lower latitudes (down to 35° N) with increasing storm intensity (decreasing SYM-H index). Kataoka et al. (2025) reported an earlier citizen scientist observation from northern Japan (36–38° MLAT) during a 1 December 2023 magnetic storm with a Dst value of only −107 nT (a minor magnetic storm). The auroral brightness was ∼5 kR, visible by eye. This occurred during an unusually high solar wind density of >50 cm−3 and a high ram pressure event.
Kataoka et al. (2024b) also reported “red (O) and blue (N) aurora at extreme altitudes” during the 10–11 May 2024 superstorm. They conclude that the “blue color is caused by resonant scattering of the upwelling molecular ions”. They have called this a Stable Auroral Red (SAR) arc and have noted that there are “ray-like structures that have appeared in many of the citizen science photos”.
Nanjo and Shiokawa (2024) reported two citizen scientist observations of “reddish purple or salmon pink” (instead of the usual red) auroras at ∼40° MLAT in Japan during the 10–11 May 2024 superstorm “recovery phase” (more will be stated about the storm “recovery phase” later). The auroras were reddish-purple up to ∼400 km altitude and occasionally blue up to at least ∼900 km. The blue dominant aurora had distinct longitudinal and field-aligned structures. Simultaneous photometric observations of the blue portion of the aurora indicated that it was due to a 4278 Å (427.8 nm) N line. The auroras occurred during a substorm (see Shiokawa et al., 1997) within the “recovery phase” of the storm. Nanjo and Shiokawa (2024) stated that the blue portion was not due to resonant scattering.
It is the purpose of this paper to report high temporal- and high spatial-resolution photographs taken over Braunschweig and Göttingen, Germany during the second main phase of the 10–11 May 2024 superstorm. Interesting features of the high time resolution of the auroral images lead us to specific conclusions concerning the generation mechanism(s) of the red-green auroras over Braunschweig and Göttingen, Germany.
Note that above simultaneous red and green auroras were noted by Foster et al. (2024). Red auroral streaks were mentioned by Kataoka et al. (2024b). We will report more concerning both of these citizen science observations.
2.1 Red and Green Auroras
Red auroral lines are caused by the decay of an oxygen atom meta-stable state (1D) to the 3P state. This meta-stable state is long lived with a lifetime of ∼110 s. The emissions occur at 6300 Å and lesser at 6364 Å (630.0 and 636.4 nm). The green aurora is also associated with the decay of a metastable state of oxygen atoms, from the 1S state into the 1D state. The mean lifetime of the 1S state is ∼0.74 s. The decay is the well-known green 5577 Å (557.7 nm) line. The auroral green line is typically the brightest line seen in auroras in the high latitude auroral zone (65 to 70° MLAT) during substorms and geomagnetic quiet intervals. The typical altitude of the green auroras is ∼130 to ∼85 km. The activation of these meta-stable states of oxygen is caused by electron collisions. The probability for the excitation into one of these states depends on the collision cross section σ. Above a few 100 eV is the so-called Bethe-regime with , where E is the electron energy. Typical values of σ are:
With these cross-section values we can determine the probability of an excitation per path length: where n is the density of atoms. For example, an electron with 20 eV kinetic energy has a . The oxygen atomic density at a height of 200 km is ∼1011 atom cm−3. Thus, a path length at this height would be ∼1 cm. These results (after some further considerations) are a probability of for an excitation of the oxygen 1D state. Thus, we need many electrons to get a suitable number of excited atoms to cause bright auroral activity. The low probability furthermore implies that a single keV electron can cause many excitations. However, it is noted from the above σ values that the values decrease with increasing electron energy.
2.2 Peviously Proposed Mechanisms for Red Auroras
An important process we need to consider is quenching or collisional deexcitation, the deactivation of the oxygen meta-stable state by collisions with other atoms and molecules, for example, nitrogen. Quenching implies that the oxygen atom returns to its ground state without emitting a photon. A typical quenching reaction is: . Thus, quenching strongly depends on the nitrogen molecular density. At heights above ∼200 km this density is low and quenching does not occur. This implies that the long-living O(1D) oxygen atoms have a high probability of emitting red photons. Below about 180 km the nitrogen density increases. Emission is no longer possible because of significant quenching of the O(1D) atom. This is the reason why red auroras are typically occurring at heights above ∼200 km. Oxygen atoms decaying from the 1S state have much shorter lifetimes. Thus, they are not as vulnerable to quenching as from O(1D). Within a lifetime of ∼0.74 s the chances of a stimulated oxygen atom to collide with a nitrogen molecule is low. Thus, metastable oxygen 1S states can survive in even denser atmospheric environments. This is the reason why green auroral emissions occur much lower in the atmosphere than the red emissions. Only below a height of ∼90 km are atmospheric densities high enough to cause quenching of the O(1S) state.
The physical mechanism for the excitation of high-altitude oxygen atoms for the creation of red auroras has been debated in literature. Cole (1965) suggested that the storm-time ring current electrons and ions transfer energy to neutral particles via Coulomb collisions to heat the thermal plasma to temperatures of ∼104 K. Heat conduction down the magnetic field lines of force were proposed to create the red aurora. Rees et al. (1967) and Rees (1989) suggested that precipitation of ∼1 to 4 keV electrons along geomagnetic field lines produce secondary non-ionizing electrons which excite oxygen atoms to a metastable state. Cornwall et al. (1970, 1971) suggested that during the magnetic storm recovery phases, the plasmasphere begins to physically enlarge itself from its shrunken storm-time state, bringing the high density thermal plasmaspheric plasma over the ring current energetic particles. This leads to an instability of the ring current ions and the growth of ion cyclotron waves. The ion cyclotron waves, then by Landau damping of the waves, accelerate thermal electrons to suprathermal energies. The suprathermal electrons excite the oxygen atoms to their metastable states. More recently, Kozyra et al. (1993) have proposed that it is energetic ring current oxygen ions which are the ultimate source for SAR arcs. Collisions between these energetic ions and thermal plasmaspheric electrons energize the electrons. The energized electrons in turn stimulate the oxygen atoms to their excited metastable states.
Figure 1 shows the complex interplanetary causes of the 10–11 May 2024 magnetic storm. The storm main phase occurred in three primary steps with peak intensities of , −354 and −518 nT, as previously mentioned. They were caused by southward interplanetary magnetic field (IMF) Bz with intensities −40, −43 and −71 nT (see detailed discussion in Hajra et al., 2024). The first storm main phase step was caused by interplanetary sheath southward Bz fields. The second storm main phase step was caused by magnetic cloud (MC) IMF Bz southward fields. The third step was presumably due to southward Bz fields in sheath plasma. The times of the three different Braunschweig and Göttingen red auroral sightings are indicated in Fig. 1g by black triangles.
Four MC intervals were identified examining the plasma-β and IMF variations together. The times of the four MCs are: ∼20:50 UT on 10 May to ∼00:23 UT on 11 May, ∼03:05 to ∼07:55 UT on 11 May, ∼08:15 to ∼10:07 UT on 11 May, and ∼11:53 to ∼17:26 UT on 11 May. The MC southward Bz created intense magnetic storms. Thus, it is possible that the Nanjo and Shiokawa (2024) red/purple and blue auroras detected during magnetic substorms also occurred during magnetic storm main phases. The storm “recovery phase” was not a pure recovery where the ring current particles were lost. Additional energetic particles were injected into the magnetosphere, indicated by the decreases in the SYM-H index.
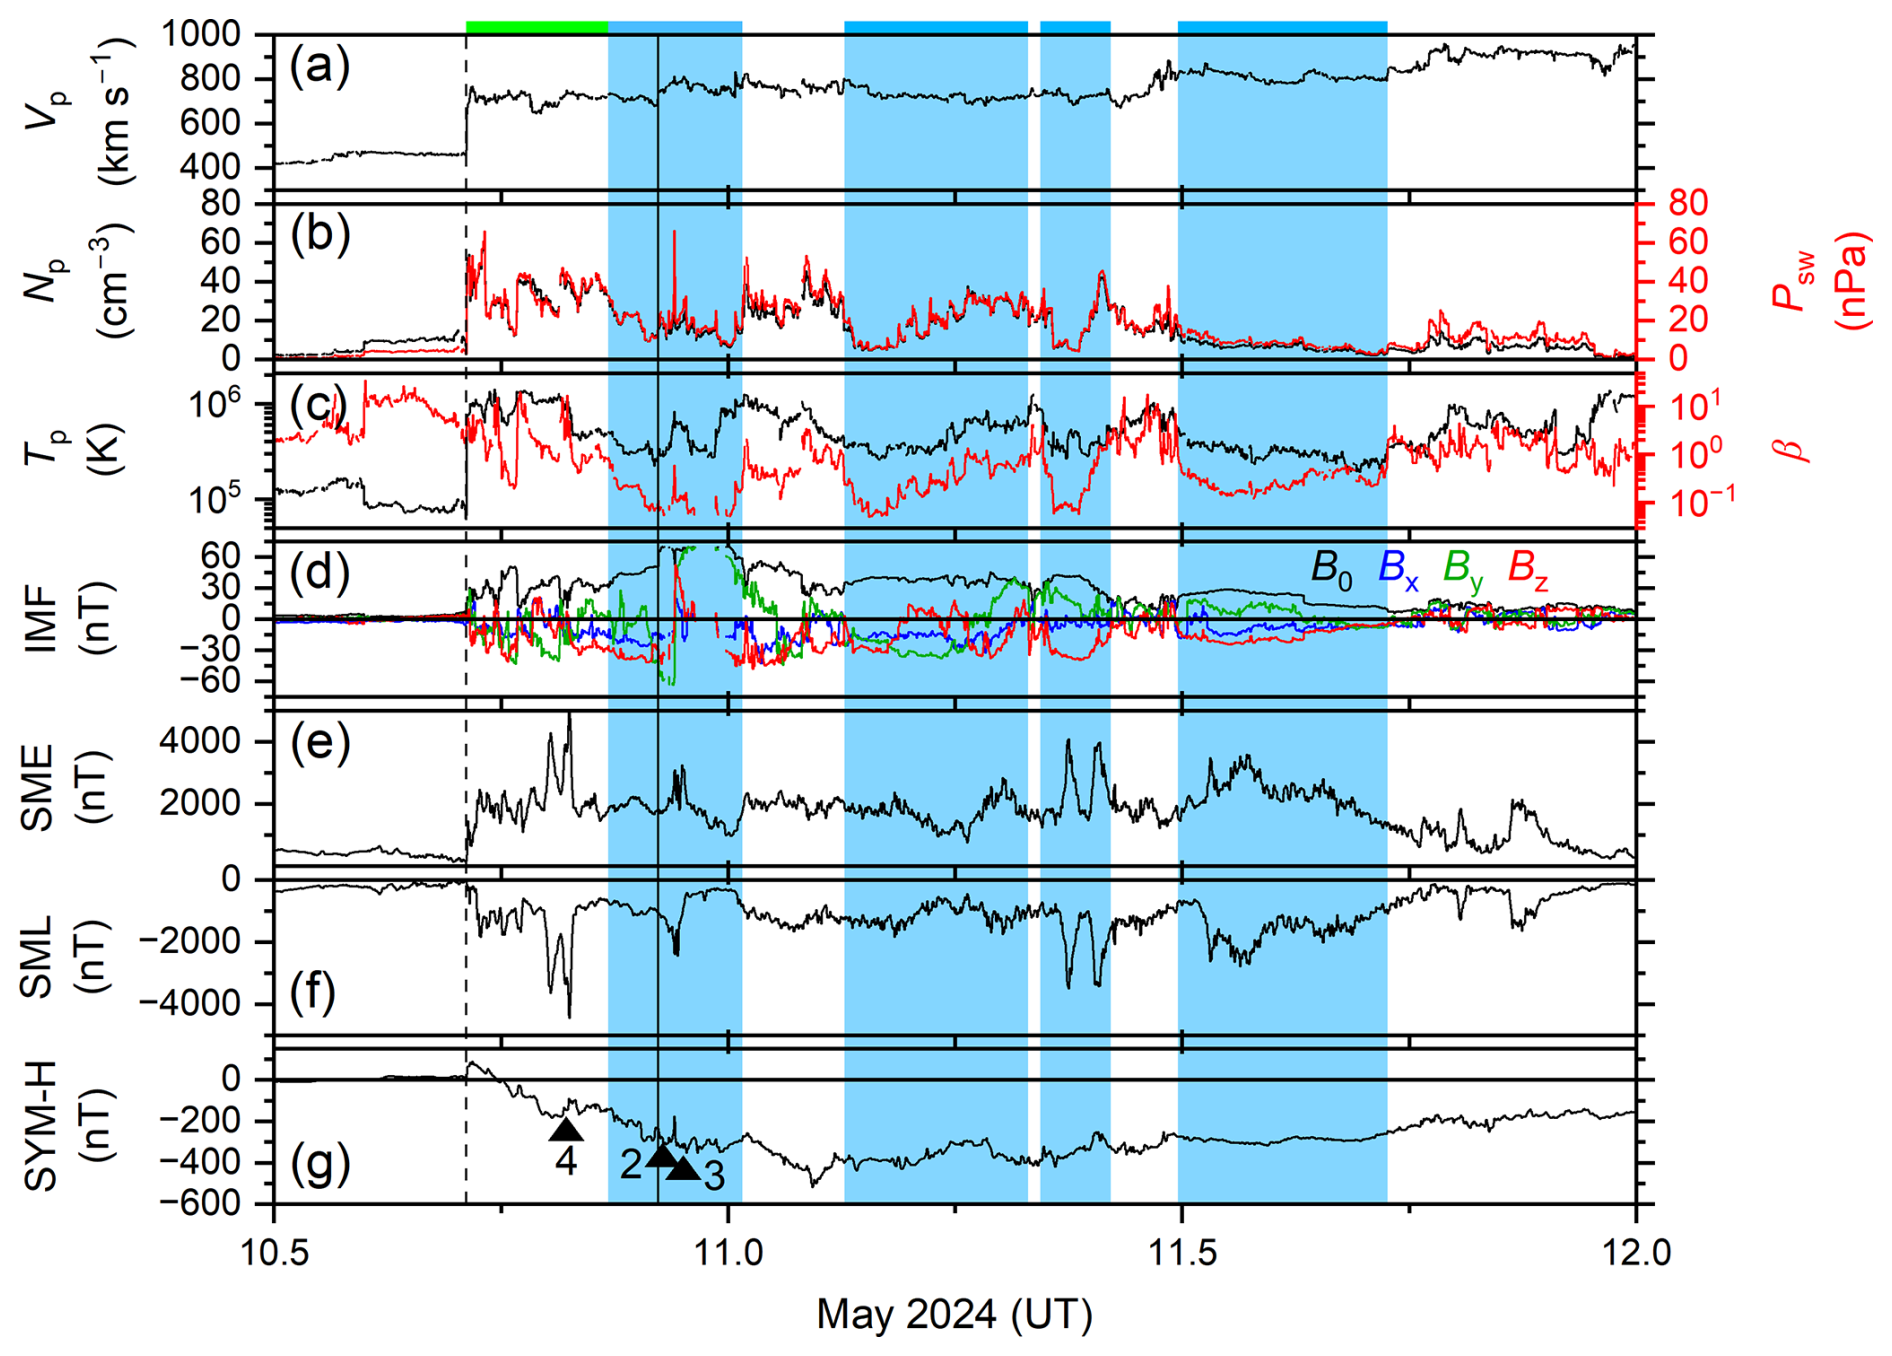
Figure 1Solar wind/interplanetary and geomagnetic conditions during the 10–11 May 2024 storm. From top to bottom, the panels are: (a) solar wind proton speed Vp, (b) proton density Np (black, legend on the left) and ram pressure Psw (red, legend on the right), (c) proton temperature Tp (black, legend on the left) and plasma-β (red, legend on the right), (d) interplanetary magnetic field (IMF) magnitude B0, and Bx, By, and Bz components, (e) auroral electrojet index SME, (f) auroral electrojet index westward component SML, and (g) symmetric ring current index SYM-H. The solar/interplanetary parameters (a–d) have time resolution of 1 h, and the geomagnetic indices (e–g) have time resolution of 1 min. Vertical lines indicate an interplanetary fast forward shock (dashed line) and a magnetosonic wave (not a shock; solid line) impingement times. An interplanetary sheath is marked by a green bar at the top. Four magnetic clouds (MCs) are marked by vertical blue shadings. Black triangles in the SYM-H panel indicate auroral image times. From left to right the triangles indicate red auroral images shown in Figs. 4, 2, and 3, which will be shown later. The figure is an adaptation of one in Hajra et al. (2024).
The photograph data to be shown soon occurred during substorms indicated by strong SME/SML indices. Image in Fig. 4 occurred during a SSS of intensity . Photographs in Figs. 2 and 3 occurred during a substorm of peak intensity .
Auroras were seen over Braunschweig and Göttingen, Germany between ∼ 19:00 and 24:00 UT on 10 May 2024. The image in Fig. 2 was taken at ∼ 22:16 UT. Braunschweig is at an MLAT of 52.2° and an L shell value of 2.69. The photo was taken by a Google Pixel 7 (6.81 mm), Ultra HDR, standard zoom, f-stop 1.85 and ISO 9338. The exposure time was 6 s. Notice the stars appear as points, consistent with the fast exposure times.
Several interesting features can be noted in this closeup of the aurora shown in the figure. The red portion of the aurora is not a featureless reddish display, but there are rays in the red auroras from the upper right downward slightly to the left. This has never been reported before in scientific articles, to our knowledge. The rays in the red aurora are continued into the green aurora. The rays are enhancements in brightness. In general, the green aurora is featureless other than the rays.
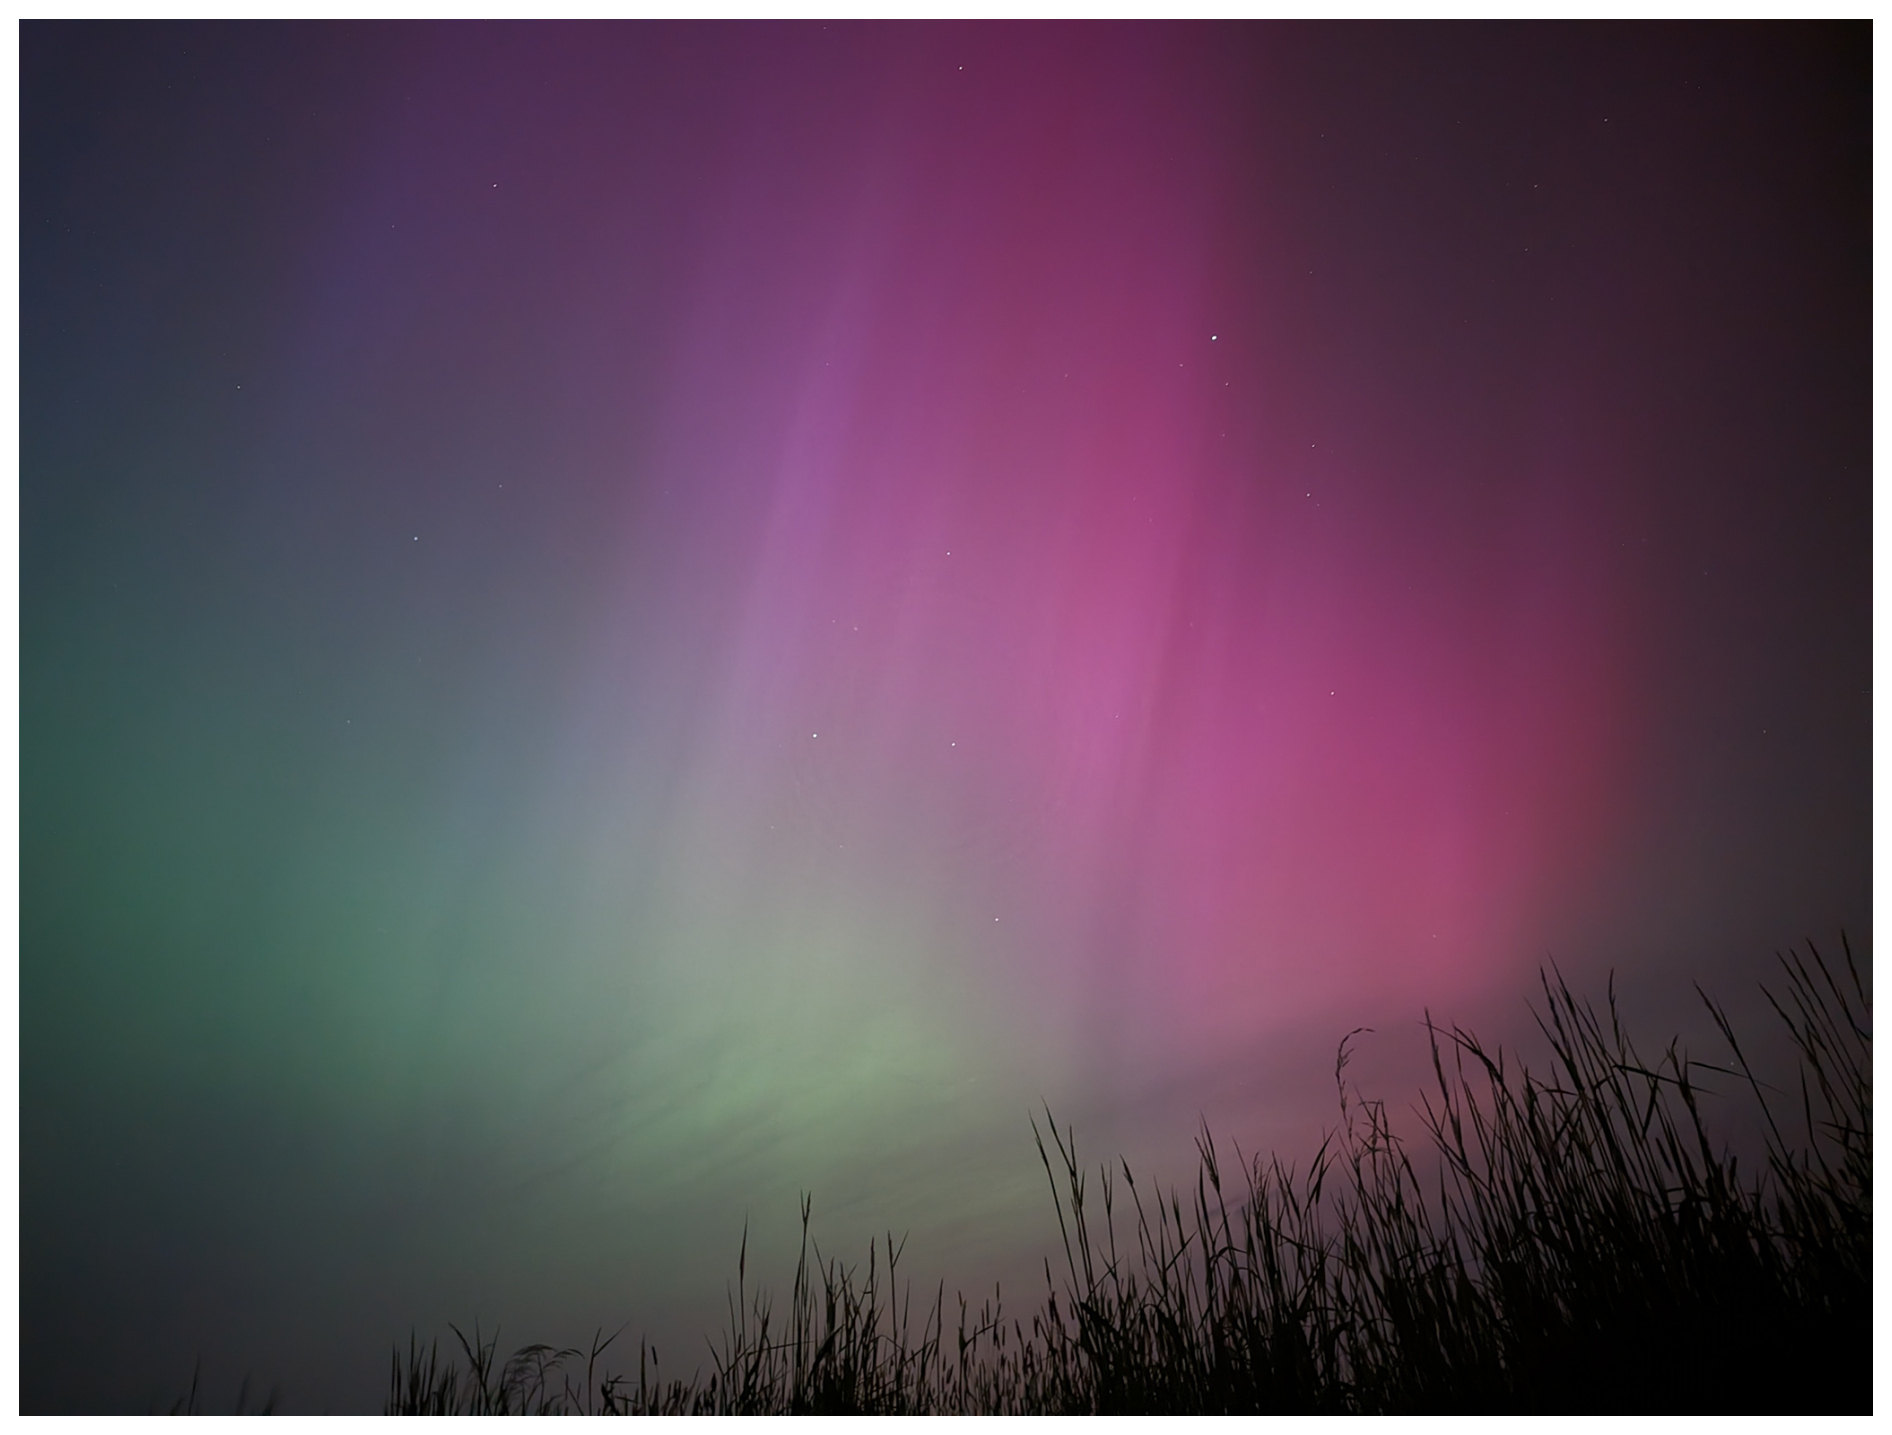
Figure 2Red and green aurora detected over Braunschweig, Germany (L shell of 2.69) on 10 May 2024. Notice the parallel rays in both the red and green auroras. The photo was taken by Philipp Schulz at 22:16 UT. The center of the photo is pointed in the east-northeast direction. Cygnus and Lyra constellations are visible. Other than the rays, the green aurora is “featureless” in that they do not have ∼1 km width arcs or ribbons like those that occur in auroral zone (65 to 70°) green auroras.
Figure 3 shows another interesting feature of the red and green aurora taken at 22:49 UT. The view is to the north-east direction. The picture was taken by a Canon R6 Mark II with a Canon L Zoom 14–35 mm lens. A tripod was used with the lens at 16 mm, an f-stop of 4 and a 6 s exposure. The ISO setting was 2500. Göttingen is at 51.6° MLAT and an L shell value of 2.61.
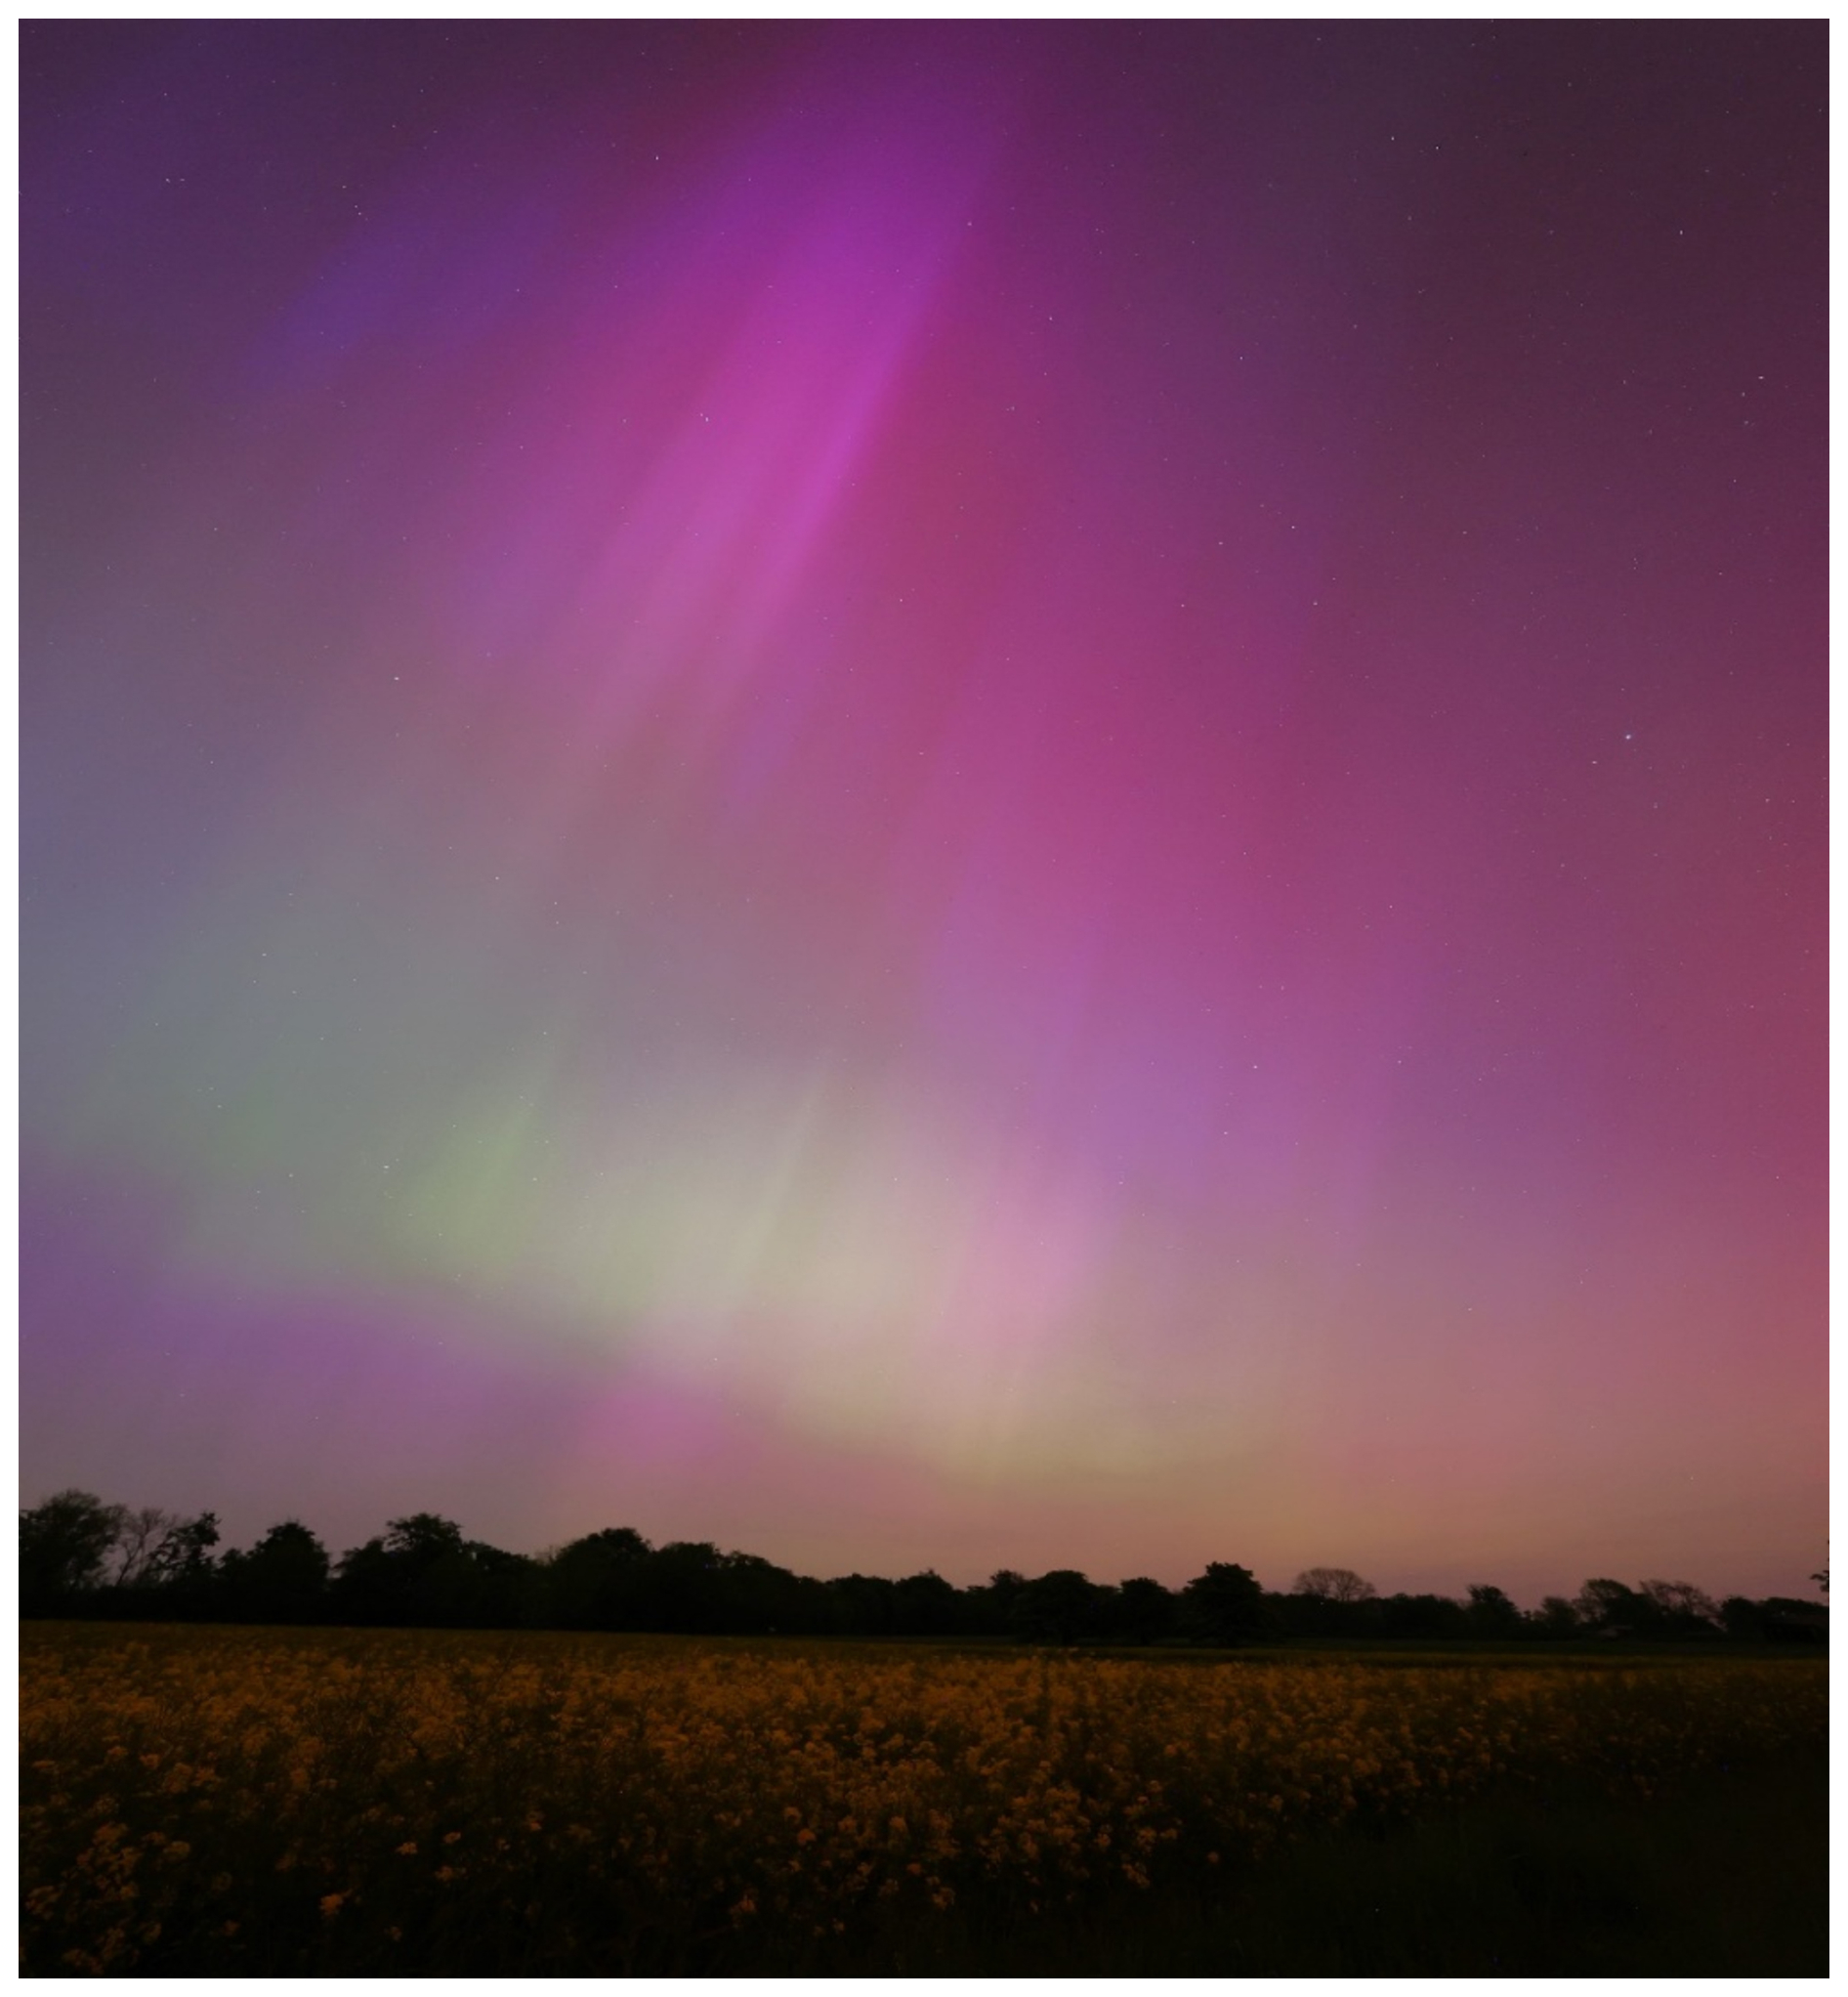
Figure 3A red and green aurora taken over Göttingen, Germany (L shell of 2.61). The photo was taken by Sami K. Solanki at 22:49 UT.
Figure 3 shows that both the red and green rays were again enhanced brightness regions. The red rays continue down to lower altitude green rays. There is an apparent gap between the red and green aurora. The rays from the red to green auroras are present, but there is a dimming in between.
The image in Fig. 4 was taken at 19:43 UT at Göttingen, Germany, some ∼2.5 to 3 h prior to the images of Figs. 2 and 3. At the time of Fig. 4, the magnetic storm main phase was less intense than during the prior figures. Figure 4 shows a different relationship between the red and green auroras. The two types of auroras are separate. There is no green aurora visible beneath the red aurora, there is no red aurora above the green aurora. Rays are not visible in either green aurora or red aurora. One possible interpretation is that both the green aurora or red aurora are distant features making the viewing of rays difficult. A possible explanation of the separation of the green aurora or red aurora is that the red aurora is on magnetic field lines within the plasmasphere and the green aurora is on magnetic field lines just outside of the plasmasphere.
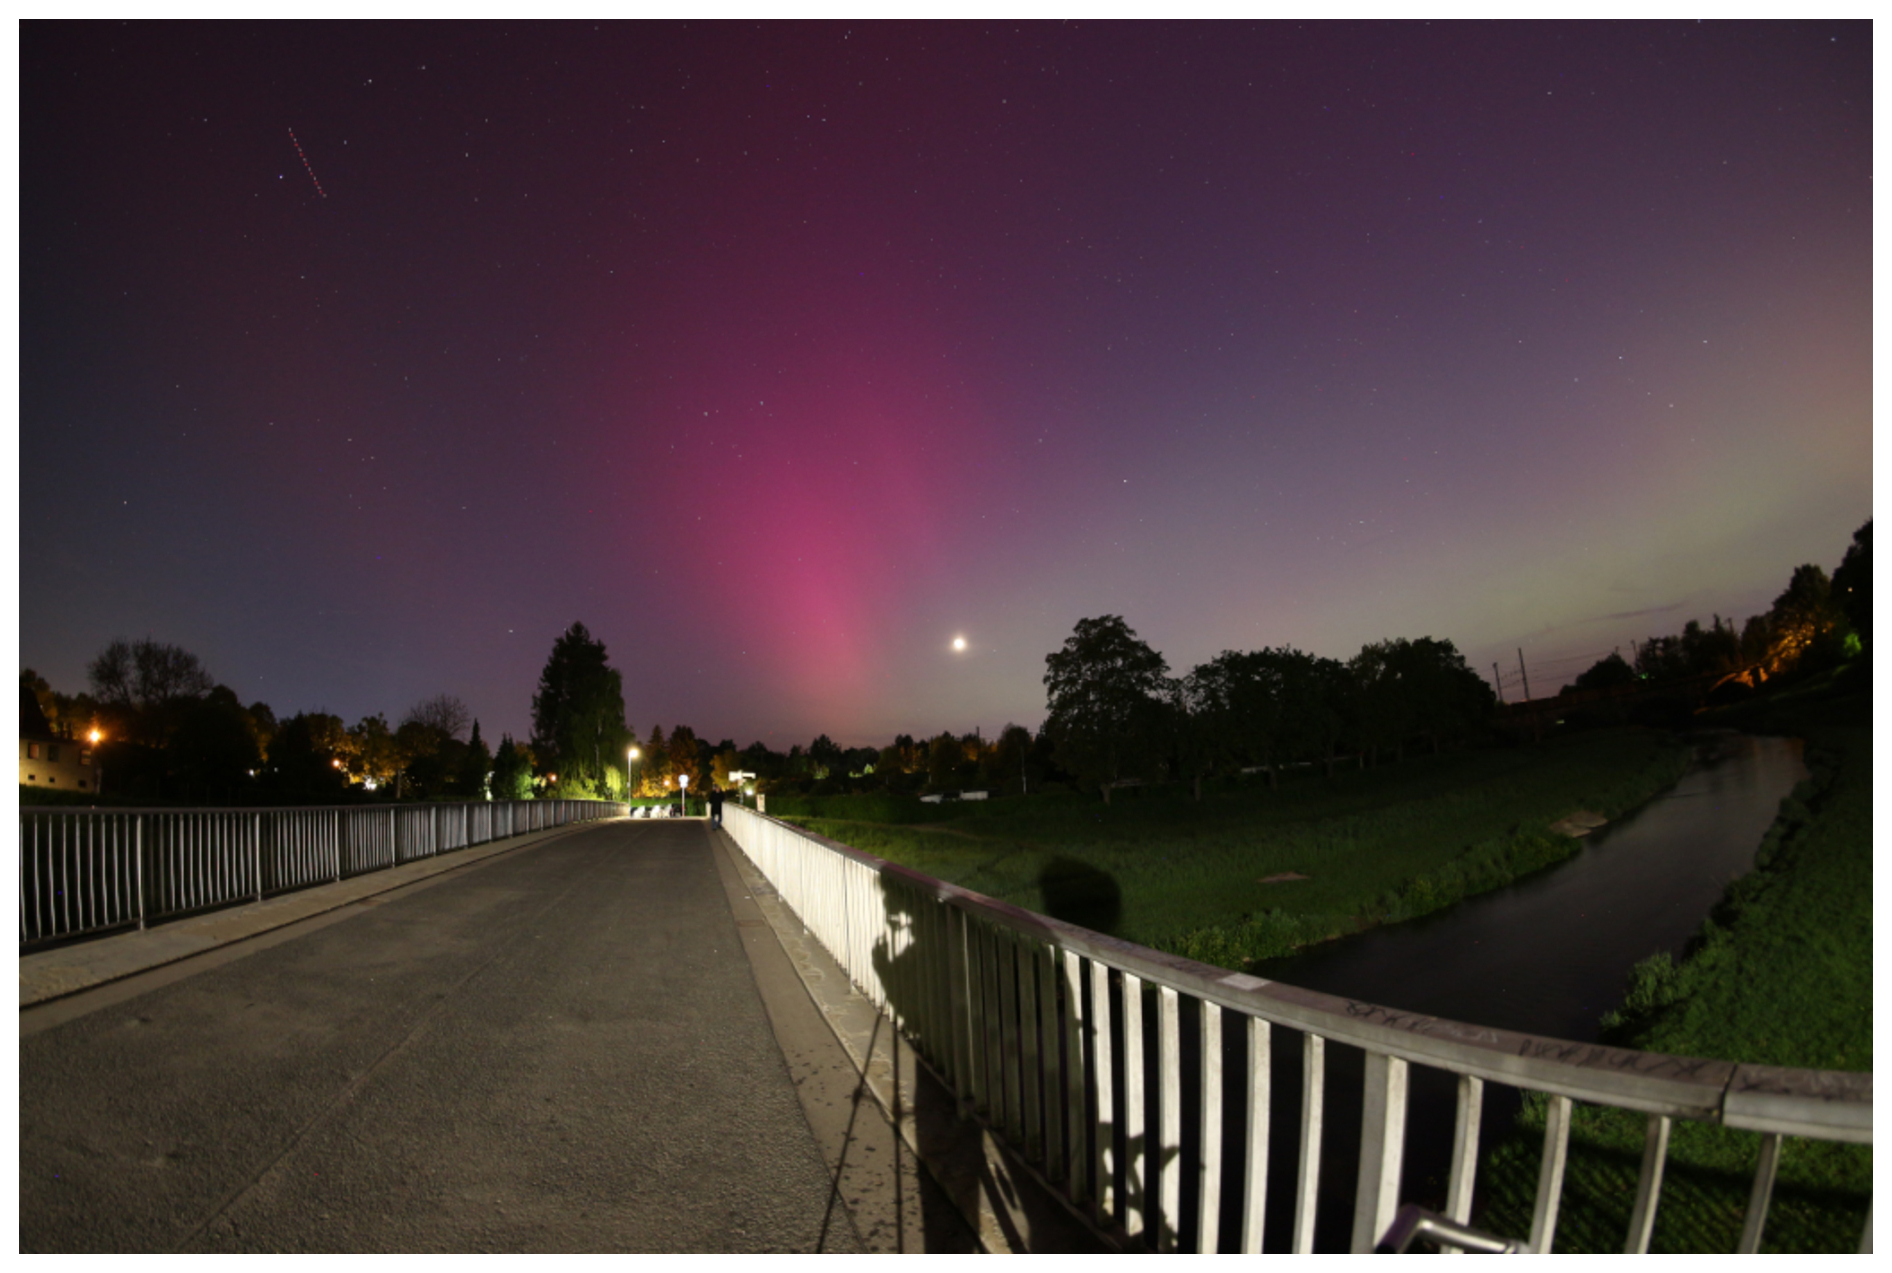
Figure 4A red and green aurora taken in Göttingen, Germany (L shell of 2.61). The red aurora is in the center of the image and the green arc is on the right. The direction of the image is 288° in azimuth or the west-north-west direction. The picture was taken with a Canon EOS M, an 8 mm Fish-Eye lens, and a f-stop of 2.8. The exposure time was 8 s. The ISO was 800. The picture was taken by Klaus Reinsch at 19:43 UT.
The auroral observations in Figs. 4, 2, and 3 occurred between ∼ 19:00 and 23:00 UT on 10 May during the storm second main phase. The red auroral observation time in Fig. 4 is indicated by the far-left triangle in Fig. 1g. This corresponds to the first step of the main phase storm extending into the beginning of the second step of the main phase storm. However, perhaps more important is that the time of the red and green auroral observation occurred during an SSS of intensity nT (Fig. 1f) triggered by an abrupt IMF Bz southward excursion of −18 nT (Fig. 1d) (see Hajra et al., 2025, for a detail discussion of all SSSs occurring during the May 2024 superstorm).
The red auroras in Figs. 2 and 3 (the second and third triangles from the left in Fig. 1g) occurred in the second step of the magnetic storm main phase when the SYM-H value was relatively intense. SYM-H was between −176 and −352 nT.
-
Modern high-speed camera images of red and green auroras over Braunschweig and Göttingen, Germany, during the second storm main phase showed parallel linear red auroral brightness rays, indicating that they were created by precipitating energetic electrons traveling along magnetic field lines.
-
Figure 4 was taken during an SSS of intensity and Figs. 2 and 3 were taken during an intense substorm with .
-
The red auroral rays continued to lower altitude green auroral rays indicating that both the red and green auroras were caused by the same magnetospheric/ionospheric phenomenon.
-
Other than the rays/streaks in the green aurora, the aurora was diffuse. No narrow band curtains or draperies were noted. Diffuse auroras (Thorne, 2010) are caused by magnetospheric equatorial pitch angle scattering of energetic electrons into the loss cone, propagating down the magnetic fields and loss to the atmosphere.
O'Brien and Moldwin (2003) construct an empirical model of the plasmapause location as a linear function of three geomagnetic indices: Kp, log AE, and log Dst. The MLT-dependence assumed a cosine function with respect to the plasmapause bulge direction. The model is an extension of the earlier model by Carpenter and Anderson (1992), and was based on over 900 plasmapause crossings of the CRRES spacecraft. We obtain from the empirical models (Eq. 3 and Table 3 in O'Brien and Moldwin, 2003) the plasmapause location using the three separate indices. For Kp=9 the predicted plasmapause is in the range L∼2.01 (post-midnight sector) to L∼2.68 (post-dusk sector). For log AE (with AE=4098 nT) the plasmapause is located between L∼2.36 (post-midnight) and L∼2.94 (post-dusk). For log Dst (with nT) the plasmapause is predicted to be located between L∼2.56 (post-midnight) and L∼2.66 (post-dusk). The estimated plasmapause location reasonably agrees with the L shell of Braunschweig (L∼2.69) as in Fig. 2 at 22:16 UT and Göttingen (L∼2.61) as in Fig. 3 at 22:49 UT and Fig. 4 at 19:43 UT.
The observations of continuous bright rays in the red and green aurora observed over Braunschweig and Göttingen, Germany, during the 10–11 May 2024 superstorm indicate a specific auroral generation mechanism. The bright ray enhancements show that energy is directly deposited at altitudes between ∼800 and ∼100 km (and below) by energetic electron precipitation.
This rules out the mechanism of Coulomb collision of ring current protons with plasmaspheric ions and heat conduction flowing down the magnetic field lines as proposed by Cole (1965), at least for causing the red streaks/rays. The presence of the rays in the red aurora is contrary to the idea of Landau damping of electromagnetic ion cyclotron waves produced by anisotropic ring current protons (Cornwall et al., 1970, 1971). The rays spatially continuing from the red aurora to the green aurora are contrary to the proposed idea that the red aurora is caused by energetic ring current oxygen ions (Kozyra et al., 1993). It is well known that green auroral rays are produced by energetic precipitating electrons (Lummerzheim, 2007).
5.1 Electron Acceleration Mechanism
Rees et al. (1967) proposed that ∼1 to 4 keV precipitating electrons are creating secondary electrons which then stimulate oxygen atoms into their elevated metastable states. Such low energy electrons are “monoenergetic” (Evans, 1974) and are now known to be accelerated in double layers a few Earth radii above the surface of the Earth (Lemaire and Scherer, 1974; Carlson and Kelley, 1977; Block, 1978). Hasegawa (1976) and Goertz and Boswell (1979) suggested that a parallel electric field component of the kinetic Alfvén wave is causing the electron acceleration. It is noted that the parallel electric field component of the kinetic Alfvén wave is sustained by the electron inertia terms in Goertz and Boswell (1979) mechanism and by the finite ion Larmor radius effects in Hasegawa (1976) mechanism. Both dispersive mechanisms play important roles in the auroral acceleration region. At higher altitudes finite ion Larmor radius effects (Hasegawa, 1976) dominate whereas at lower altitudes the electron inertial effects (Goertz and Boswell, 1979) dominate. The precipitation from acceleration in double layers forms discrete auroras of ∼ km width arcs, not diffuse auroras. Thus, the Rees et al. (1967) mechanism can possibly be discounted.
5.2 Energetic Electrons in the Plasmasphere
The fact that these red auroral observations were made during an intense magnetic storm main phase is suggestive that the energetic electron source is inside the high plasma density plasmasphere. This is the general conclusion of the plasmasphere and instabilities within playing a major role in red auroras, suggested in the review of Kozyra et al. (1997). The precipitation of broadband energetic electrons of ∼30 eV to 30 keV associated with substorms during magnetic storms by Shiokawa et al. (1997) is consistent with this hypothesis.
It has been speculated that substorm convection electric fields are separate and distinct from magnetic storm convection electric fields (Tsurutani and Gonzalez, 2007). The plasmapause location estimated at L∼2.6 supports the mechanism that the substorm electric fields have injected energetic particles into the high plasma density plasmasphere, leading to the red and green auroras.
If the sources of energetic electrons causing the red and green auroras are pitch angle scattered ring current electrons, what are the waves that scatter the ring current electrons into the loss cone and the instability that creates the plasma waves? What is detected at and near the plasmapause during strong geomagnetic activity are magnetosonic waves generated by an ion ring distribution instability (Gurnett, 1976; Perraut et al., 1982; Boardsen et al., 1992; Horne et al., 2000; Santolík et al., 2002; Meredith et al., 2008; Pokhotelov et al., 2008; Němec et al., 2013). Tsurutani et al. (2014) showed details of magnetosonic waves during a substorm at local midnight. The waves were linear polarization with exceptionally large electric oscillations perpendicular to B0 and large magnetic components parallel to B0. Plasmaspheric hiss was detected away from the magnetic equator. It is possible that both the magnetosonic wave electric field oscillations and the plasmaspheric hiss are leading to energetic electron pitch angle diffusion into the loss cone.
If the precipitating electrons are indeed deeply injected substorm particles, it is possible that there will be a high energy ∼100 to 200 keV precipitating component and bremsstrahlung X-rays produced which may cause interesting ionospheric and atmospheric effects below.
In this paper, we have discussed short duration red and green mid-latitude auroral events that have been detected during intense substorms during a storm main phase. The substorms occurred during the second step of the main phase of a magnetic storm. This is the first paper showing that red auroras and green auroras were connected (by the continuous streaks).
These events are probably not the same type of middle latitude red auroras as those that are called “Stable Auroral Red” aurora (SAR arcs) that last for “tens of hours” as was mentioned by Roach and Roach (1963) (although Kataoka et al., 2024b, has called these SAR arcs). There may be several different types of red auroras. Belon and Clark (1959) reported on spectroscopic observations on the 10–11 February 1958 “great red aurora”. They detected 5577 and 6584 Å emissions as well as the red lines. Rees and Deehr (1961) reported spectrophotomic observations of a high altitude red auroral arc that occurred on 27 November 1959. The intensity of the 6300 Å line was 66.7 kR, unusually intense (visible by eye). They reported that this arc was purely 6300–6364 Å lines and the N NG bands “with other usual auroral emission features being noticeably absent”. Mendillo et al. (2016) studied what they called an SAR arc with “several superimposed patches of emission in two oxygen lines (with a Å) ratio of ∼40.” Mendillo et al. (2016) also stated: “We find no evidence for highly localized heating effects, but rather evidence from GPS satellites supporting low-energy electron precipitation as the SAR arc modulating mechanism.” Earlier, Rassoul et al. (1993) determined a Å ratio of only 3.8 with “other weaker emissions that were characteristic of heavy particle auroras and can be attributed to energetic (keV) ions and neutral atoms from the ring current.”
It thus seems highly likely that there are many types of middle latitude red auroras. It will be interesting to determine if there are (1) pure red arcs without green aurora below, (2) all red arcs have green aurora below, or (3) if both possibilities exist. It will also be interesting to know if there are bremsstrahlung X-ray emissions produced in red-green auroras.
Future citizen science reports of close up high spatial and high temporal (integration times <10 s) results of red auroras will be useful for understanding the physical mechanism of the aurora. If there are no streaks and no green aurora below, the physical mechanism for the aurora will be different than the one concluded here. Although confirming that the mechanism is different (from this paper), it will be extremely difficult/impossible to determine which possible mechanism is the correct one.
The near-Earth solar wind plasma and IMF data are obtained from NASA's OMNIWeb Plus database https://omniweb.gsfc.nasa.gov/ (last access: 8 November 2025). The 1 h and 1 min data can be directly downloaded from the pages: https://omniweb.gsfc.nasa.gov/form/dx1.html (last access: 8 November 2025) and https://omniweb.gsfc.nasa.gov/form/omni_min.html (last access: 8 November 2025), respectively, by specifying start and stop times, and required plasma and IMF parameters.
Conceptualization: BTT, VB. Data curation: PS, SS, KR, RH, BTT, YN. Formal analysis: BTT, RH, GSL, KHG, MI, RBH, YN, IvB, VB. Funding acquisition: RH. Investigation: BTT, GSL, RH, YN, RBH, MI, IvB, VB, KHG, KR, PS, SS. Methodology: BTT, RH, GSL, KHG, RBH, MI. Resources: PS, SS, KR, RH, BTT, VB, IvB. Supervision: BTT, RH, YN. Validation: BTT, GSL, RH, YN, RBH, MI, IvB, VB, KHG, KR, PS, SS. Visualization: PS, SS, KR, VB, IvB. Writing – original draft: BTT. Writing – review & editing: BTT, GSL, RH, YN, RBH, MI, IvB, VB, KHG, KR, PS, SS. Writing – revision: BTT, YN.
The contact author has declared that none of the authors has any competing interests.
Publisher's note: Copernicus Publications remains neutral with regard to jurisdictional claims made in the text, published maps, institutional affiliations, or any other geographical representation in this paper. The authors bear the ultimate responsibility for providing appropriate place names. Views expressed in the text are those of the authors and do not necessarily reflect the views of the publisher.
We wish to acknowledge the passing of our esteemed colleague and coauthor Volker Bothmer, a world reknown researcher in Space Weather. It was a chance email conversation between Volker and Bruce T. Tsurutani that indicated photographs of the red-green aurora were taken over Göttigen. This was the beginning of the eventual research on this paper. We will dearly miss Volker, his scientific insights and his camaraderie. The work of Rajkumar Hajra is funded by the “Hundred Talents Program” of the Chinese Academy of Sciences (CAS), and the “Excellent Young Scientists Fund Program (Overseas)”, and the “Research Fund for International Excellent Young Scientists” (grant no. W2532030) of the National Natural Science Foundation of China (NSFC).
This research has been supported by the Chinese Academy of Sciences (Hundred Talents Program) and the National Natural Science Foundation of China (Excellent Young Scientists Fund Program (Overseas); grant no. W2532030).
This open-access publication was funded by Technische Universität Braunschweig.
This paper was edited by Georgios Balasis and reviewed by Dimitry Pokhotelov, Magnus Ivarsen, and one anonymous referee.
Barbier, D.: L'activite aurorale aux basses latitudes, Ann. Geophys., 14, 334–355, 1958. a
Belon, A. E. and Clark, K. C.: Spectroscopic observations of the great aurora of 10 February 1958– II. Unusual atomic features, J. Atmos. Terr. Phys., 16, 220–227, https://doi.org/10.1016/0021-9169(59)90070-4, 1959. a
Block, L. P.: A double layer review, Astrophys. Space Sci., 55, 59–83, https://doi.org/10.1007/BF00642580, 1978. a
Boardsen, S. A., Gallagher, D. L., Gurnett, D. A., Peterson, W. K., and Green, J. L.: Funnel-shaped, low-frequency equatorial waves, J. Geophys. Res.-Space, 97, 14967–14976, https://doi.org/10.1029/92JA00827, 1992. a
Carlson, C. W., and Kelley, M. C.: Observation and interpretation of particle and electric field measurements inside and adjacent to an active auroral arc, J. Geophys. Res., 82, 2349–2360, https://doi.org/10.1029/JA082i016p02349, 1977. a
Carpenter, D. L. and Anderson, R. R.: An ISEE/whistler model of equatorial electron density in the magnetosphere, J. Geophys. Res.-Space, 97, 1097–1108, https://doi.org/10.1029/91JA01548, 1992. a
Cole, K. D.: Stable auroral red arcs, sinks for energy of Dst main phase, J. Geophys. Res., 70, 1689–1706, https://doi.org/10.1029/JZ070i007p01689, 1965. a, b
Cornwall, J. M., Coroniti, F. V., and Thorne, R. M.: Turbulent loss of ring current protons, J. Geophys. Res., 75, 4699–4709, https://doi.org/10.1029/JA075i025p04699, 1970. a, b
Cornwall, J. M., Coroniti, F. V., and Thorne, R. M.: Unified theory of SAR arc formation at the plasmapause, J. Geophys. Res., 76, 4428–4445, https://doi.org/10.1029/JA076i019p04428, 1971. a, b
Evans, D. S.: Precipitating electron fluxes formed by a magnetic field aligned potential difference, J. Geophys. Res., 79, 2853–2858, https://doi.org/10.1029/JA079i019p02853, 1974. a
Foster, J. C., Erickson, P. J., Nishimura, Y., Zhang, S. R., Bush, D. C., Coster, A. J., Meade, P. E., and Franco-Diaz, E.: Imaging the May 2024 extreme aurora with ionospheric total electron content, Geophys. Res. Lett., 51, e2024GL111981, https://doi.org/10.1029/2024GL111981, 2024. a, b
Goertz, C. K. and Boswell, R. W.: Magnetosphere-ionosphere coupling, J. Geophys. Res., 84, 7239–7246, 1979. a, b, c
Gonzalez-Esparza, J. A., Sanchez-Garcia, E., Sergeeva, M., Corona-Romero, P., Gonzalez-Mendez, L. X., Valdes-Galicia, J. F., Aguilar-Rodriguez, E., Rodriguez-Martinez, M., Ramirez-Pacheco, C., Castellanos, C. I., Pazos, M., Mendoza, B., Gatica-Acevedo, V. J., Melgarejo-Morales, A., Caraballo, R., Andrade-Mascote, E., Villanueva-Hernandez, P., Bonifaz-Alfonzo, R., Sierra, P., Romero-Hernandez, E., Peralta-Mendoza, I., Perez-Tijerina, E., Mejia-Ambriz, J. C., Guerrero-Peña, C., Caccavari, A., Cifuentes-Nava, G., and Hernandez-Quintero, E.: The Mother's Day geomagnetic storm on 10 May 2024: Aurora observations and low latitude space weather effects in Mexico, Space Weather, 22, e2024SW004111, https://doi.org/10.1029/2024SW004111, 2024. a
Grandin, M., Bruus, E., Ledvina, V. E., Partamies, N., Barthelemy, M., Martinis, C., Dayton-Oxland, R., Gallardo-Lacourt, B., Nishimura, Y., Herlingshaw, K., Thomas, N., Karvinen, E., Lach, D., Spijkers, M., and Bergstrand, C.: The Gannon Storm: citizen science observations during the geomagnetic superstorm of 10 May 2024, Geosci. Commun., 7, 297–316, https://doi.org/10.5194/gc-7-297-2024, 2024. a, b
Gurnett, D. A.: Plasma wave interactions with energetic ions near the magnetic equator, J. Geophys. Res., 81, 2765–2770, https://doi.org/10.1029/JA081i016p02765, 1976. a
Hajra, R., Tsurutani, B. T., Lakhina, G. S., Lu, Q., and Du, A.: Interplanetary causes and impacts of the 2024 May superstorm on the geosphere: An Overview, Astrophys. J., 974, 264, https://doi.org/10.3847/1538-4357/ad7462, 2024. a, b, c
Hajra, R., Tsurutani, B. T., Lu, Q., Du, A., and Lakhina, G. S.: Supersubstorms during the May 2024 superstorm, J. Space Weather Space Clim., 15, 51, https://doi.org/10.1051/swsc/2025047, 2025. a
Hasegawa, A.: Particle acceleration by MHD surface wave and formation of aurora, J. Geophys. Res., 81, 5083–5090, https://doi.org/10.1029/JA081i028p05083, 1976. a, b, c
Horne, R. B., Wheeler, G. V., and Alleyne, H. St. C. K.: Proton and electron heating by radially propagating fast magnetosonic waves, J. Geophys. Res.-Space, 105, 27597–27610, https://doi.org/10.1029/2000JA000018, 2000. a
Kataoka, R., Miyoshi, Y., Shiokawa, K., Nishitani, N., Keika, K., Amano, T., and Seki, K.: Magnetic storm-time red aurora as seen from Hokkaido, Japan on 1 December 2023 associated with high-density solar wind, Geophys. Res. Lett., 51, e2024GL108778, https://doi.org/10.1029/2024GL108778, 2024a. a
Kataoka, R., Reddy, S. A., Nakano, S., Pettit, J., and Nakamura, Y.: Extended magenta aurora as revealed by citizen science, Sci. Rep., 14, 25849, https://doi.org/10.1038/s41598-024-75184-9, 2024b. a, b, c
Kataoka, R., Nakano, S., Uchino, S. and Reddy, S.A. Extended red aurora associated with super substorm igniting the October 10, 2024 magnetic storm as revealed by citizen science, Earth Planets Space, 77, 64, https://doi.org/10.1186/s40623-025-02178-w, 2025. a
Kozyra, J. U., Chandler, M. O., Hamilton, D. C., Peterson, W. K., Klumpar, D. M., Slater, D. W., Buonsanto, M. J., and Carlson, H. C.: The role of ring current nose events in producing stable auroral red arc intensifications during the main phase: Observations during the September 19–24, 1984, Equinox Transition Study, J. Geophys. Res.-Space, 98, 9267–9283, https://doi.org/10.1029/92JA02554, 1993. a, b, c
Kozyra, J. U., Nagy, A. F., and Slater, D. W.: High-altitude energy source(s) for stable auroral red arcs, Rev. Geophys., 35, 155–190, https://doi.org/10.1029/96RG03194, 1997. a
Lawrence, E., Beggan, C. D., Richardson, G. S., Reay, S., Thompson, V., Clarke, E., Orr, L., Hübert, J., and Smedley, A. R. D.: The geomagnetic and geoelectric response to the May 2024 geomagnetic storm in the United Kingdom, Frontiers in Astronomy and Space Sciences, 12, 1550923, https://doi.org/10.3389/fspas.2025.1550923, 2025. a, b
Lemaire, J. and Scherer, M.: Ionosphere-plasmasheet field-aligned currents and parallel electric fields, Planet. Space Sci., 22, 1485–1490, https://doi.org/10.1016/0032-0633(74)90013-0, 1974. a
Lummerzheim, D.: Modeling and forecasting aurora, Comp. Sci. Eng., 9, 53–61, https://doi.org/10.1109/MCSE.2007.103, 2007. a
Mendillo, M., Finan, R., Baumgardner, J., Wroten, J., Martinis, C., and Casillas, M.: A stable auroral red (SAR) arc with multiple emission features, J. Geophys. Res.-Space, 121, 10564–10577, https://doi.org/10.1002/2016JA023258, 2016. a, b
Meredith, N. P., Horne, R. B., and Anderson, R. R.: Survey of magnetosonic waves and proton ring distributions in the Earth's inner magnetosphere, J. Geophys. Res.-Space, 113, A06213, https://doi.org/10.1029/2007JA012975, 2008. a
Nanjo, S. and Shiokawa, K.: Spatial structures of blue low-latitude aurora observed from Japan during the extreme geomagnetic storm of May 2024, Earth Planets Space, 76, 156, https://doi.org/10.1186/s40623-024-02090-9, 2024. a, b, c
Němec, F., Santolík, O., Pickett, J. S., Hrbáčková, Z., and Cornilleau-Wehrlin, N.: Azimuthal directions of equatorial noise propagation determined using 10 years of data from the Cluster spacecraft, J. Geophys. Res.-Space, 118, 7160–7169, https://doi.org/10.1002/2013JA019373, 2013. a
O'Brien, T. P. and Moldwin, M. B.: Empirical plasmapause models from magnetic indices, Geophys. Res. Lett., 30, 2002GL016007, https://doi.org/10.1029/2002GL016007, 2003. a, b
Perraut, S., Roux, A., Robert, P., Gendrin, R., Sauvaud, J. A., Bosqued, J. M., Kremser, G., and Korth, A.: A systematic study of ULF waves above FH+ from GEOS 1 and 2 measurements and their relationships with proton ring distributions, J. Geophys. Res.-Space, 87, 6219–6236, https://doi.org/10.1029/JA087iA08p06219, 1982. a
Pokhotelov, O. A., Sagdeev, R. Z., Balikhin, M. A., Onishchenko, O. G., and Fedun, V. N.: Nonlinear mirror waves in non-Maxwellian space plasmas, J. Geophys. Res.-Space, 113, 2007JA012642, https://doi.org/10.1029/2007JA012642, 2008. a
Rassoul, H. K., Rohrbaugh, R. P., Tinsley, B. A., and Slater, D. W.: Spectrometric and photometric observations of low-latitude aurorae, J. Geophys. Res.-Space, 98, 7695–7709, https://doi.org/10.1029/92JA02269, 1993. a
Rees, M. H.: Physics and Chemistry of the Upper Atmosphere, 1st edn., Cambridge University Press, https://doi.org/10.1017/CBO9780511573118, 1989. a
Rees, M. H. and Deehr, C. S., The aurora of 27 November 1959 at College, Alaska including observations of a high altitude red arc, Planet. Space Sci., 8, 49–58, https://doi.org/10.1016/0032-0633(61)90155-6, 1961. a
Rees, M. H., Walker, J. C. G., and Dalgarno, A.: Auroral excitation of the forbidden lines of atomic oxygen, Planet. Space Sci., 15, 1097–1110, https://doi.org/10.1016/0032-0633(67)90096-7, 1967. a, b, c
Roach, F. E. and Marovich, E.: A monochromatic low-latitude aurora, J. Res. Nat. Bureau Standard, Section D: Radio Propagation, 63D, 297, https://doi.org/10.6028/jres.063D.029, 1959. a
Roach, F. E. and Roach, J. R.: Stable 6300 Å auroral arcs in mid-latitudes. Planet. Space Sci., 11, 523–549, https://doi.org/10.1016/0032-0633(63)90076-X, 1963. a
Santolík, O., Pickett, J. S., Gurnett, D. A., Maksimovic, M., and Cornilleau-Wehrlin, N.: Spatiotemporal variability and propagation of equatorial noise observed by Cluster, J. Geophys. Res.-Space, 107, SMP 43, https://doi.org/10.1029/2001JA009159, 2002. a
Shiokawa, K., Meng, C.-I, Reeves, G. D., Rich, F. J., and Yumoto, K.: multievent study of broadband electrons observed by the DMSP satellites and their relation to red aurora observed at midlatitude stations, J. Geophys. Res.-Space, 102, 14237–14253, https://doi.org/10.1029/97JA00741, 1997. a, b
Shiokawa, K., Ogawa, T., and Kamide, Y.: Low-latitude auroras observed in Japan: 1999–2004, J. Geophys. Res., 110, A05202, https://doi.org/10.1029/2004JA010706, 2005. a
Thorne, R. M.: Radiation belt dynamics: The importance of wave-particle interactions, Geophys. Res. Lett., 37, L22107, https://doi.org/10.1029/2010GL044990, 2010. a
Tsurutani, B. T. and Gonzalez, W. D.: A new perspective on the relationship between substorms and magnetic storms, Adv. Geosci., 8, 25–45, https://doi.org/10.1142/9789812708939_0002, 2007. a
Tsurutani, B. T., Falkowski, B. J., Pickett, J. S., Verkhoglyadova, O. P., Santolik, O., and Lakhina, G. S.: Extremely intense ELF magnetosonic waves: A survey of polar observations, J. Geophys. Res.-Space, 119, 964–977, https://doi.org/10.1002/2013JA019284, 2014. a
Tsurutani, B. T., Hajra, R., Echer, E., and Gjerloev, J. W.: Extremely intense (SML nT) substorms: isolated events that are externally triggered?, Ann. Geophys., 33, 519–524, https://doi.org/10.5194/angeo-33-519-2015, 2015. a