the Creative Commons Attribution 4.0 License.
the Creative Commons Attribution 4.0 License.
 | 05 Sep 2022
Temporal and altitudinal variability of the spread F observed by the VHF radar over Christmas Island
Ricardo Yvan de La Cruz Cueva
Eurico Rodrigues de Paula
Acácio Cunha Neto
The goal of this work is to study the time and altitude echo characteristics under different solar and seasonality conditions using the VHF radar range–time–intensity (RTI) images. The occurrence of equatorial spread F depends on the existence of conditions that can seed the Rayleigh–Taylor instability, and these conditions can change with solar flux, seasonality, longitude distributions, and day-to-day variability. So, the equatorial spread F is observed as its time and altitude occurrence. The VHF radar of Christmas Island (2.0∘ N, 157.4∘ W, 2.9∘ N dip latitude) has been operational in the equatorial region for some time, allowing long-term observations. The occurrence of echoes during solar minimum conditions is observed throughout the night since the post-reversal westward electric field is weaker than the solar maximum and the possibilities of the vertical plasma drift becoming positive are larger. On the other hand, echoes during solar maximum will be controlled by dynamics near the time of the pre-reversal peak (PRE). Our results indicate that the peak time occurrence of echoes along this period shows a well-defined pattern, with echoes distributed as closer to local sunset during solar maximum and around/closer to midnight during solar minimum conditions; meanwhile, the peak altitude occurrence of echoes shows a slightly regular pattern with higher-altitude occurrences during solar maxima and lower altitudes during solar minimum conditions.
- Article
(1809 KB) - Full-text XML
- BibTeX
- EndNote


The contemporaneous understanding of the formation of F-region plasma irregularities depends mainly on the Rayleigh–Taylor (RT) instability process, due to its appearance at the bottom side of the F region, then becoming unstable to finally generate plasma bubbles. These newly formed plasma bubbles evolve in a nonlinear process and then extend into high altitudes in the F region. The small-scale (centimeters to a few tens of meters) irregularities formed in this process are responsible for radar backscatter, with structures in the range–time–intensity (RTI) image of the radar. The pioneering ionospheric radar work of Woodman and La Hoz (1976) used the term “plumes” to describe radar echoes reaching the topside ionosphere. They observed a slope in the formation of the plumes, then explained using numerical simulation by Ossakow (1981) and Zalesak et al. (1982).
The RT instability (and Equatorial spread F – ESF) is controlled by a number of parameters like the pre-reversal enhancement (PRE) of the zonal equatorial electric field, zonal and meridional neutral winds, longitudinal conductivity gradients, flux tube integrated conductivities, and, possibly, variations in initial (or seed) perturbations (Abdu, 2001; Fejer et al., 1999). It has been noted that ESF bubbles at the pre-midnight and post-midnight hours could be driven by different mechanisms (Dao et al., 2011; Yizengaw et al., 2013). The mechanisms that should control the appearance or suppression of equatorial plasma irregularities are different for the pre- and post-midnight periods due to the ambient conditions that prevail through the night. Yizengaw et al. (2009) showed that h'F presents a peak at post-midnight hours that indicates the existence of some electrodynamic force that drives the F layer upward, creating conditions for irregularity development.
The effects of solar and geomagnetic activities on spread F vary with latitude and longitude. Cueva et al. (2013) examined data from three equatorial stations along solar minimum and maximum conditions. Their results showed an increase in the spread-F occurrence rate with solar flux. Although many researchers have discussed the characteristics of spread-F irregularities at equatorial and low latitudes, some issues are still needed for better understanding of their spatial and temporal variability of spread F and plasma bubbles. So, the analysis of long-term data was performed in this work covering high and low solar activity conditions with spread-F echo observations over the central Pacific region using the VHF radar installed on Christmas Island. In this study we present results from data analysis of the echo distribution using the 50 MHz Christmas Island radar along the 2003 and 2012 time periods. The observations allowed us to determine how the echoes vary with local time and height throughout different seasons and solar flux conditions.
2.1 VHF radar measurements
The Christmas Island VHF radar provides data of meter-scale F-region irregularities routinely, initially operated by the Stanford Research Institute – SRI International (2002–2007) – and then operated by the US Air Force Research Laboratory (AFRL). The system uses a 100 m × 100 m coaxial collinear (COCO) antenna array. Two stationary beams were used for measurements. One beam is pointed north (azimuth 0∘ and elevation 84.5∘), and the other one is pointed to the east (azimuth 90∘ and elevation 60.5∘). The coherent radar detects fluctuations related to the plasma instabilities called field-aligned irregularities, and then detection of such irregularities requires the antenna to be pointing perpendicularly to the geomagnetic field line (Tsunoda et al., 1979, 2000). Then, the northern beam antenna was chosen due to be pointed in the northerly direction to reach perpendicularly to the magnetic field line. More technical details of this radar can be found in Miller et al. (2009). Its geographic position is 2.0∘ N, 157.4∘ W, 2.9∘ N dip latitude, and its magnetic inclination (declination) varied from 4.69∘ (9.36∘ E) in 2003 to 4.61∘ (9.38∘ E) in 2012.
It is worth mentioning that measurements available to this study cover different solar conditions when F10.7 varied from 200 SFU (high solar flux conditions) to 66 SFU (low solar flux conditions), as shown in Fig. 1. Data measurements of spread-F echoes to this study are in the periods of January 2003 and December 2012. All our data are presented as altitude integration from 200 to 1000 km height as a function of the signal-to-noise ratio (present in Fig. 2) and the horizontal dashed lines (at 20:00 and 00:00 LT) representing a time threshold to assist observations of time–echo distribution. Lack of data is also presented as a black space in the figure, mainly for 2014 (March equinox and June solstice).
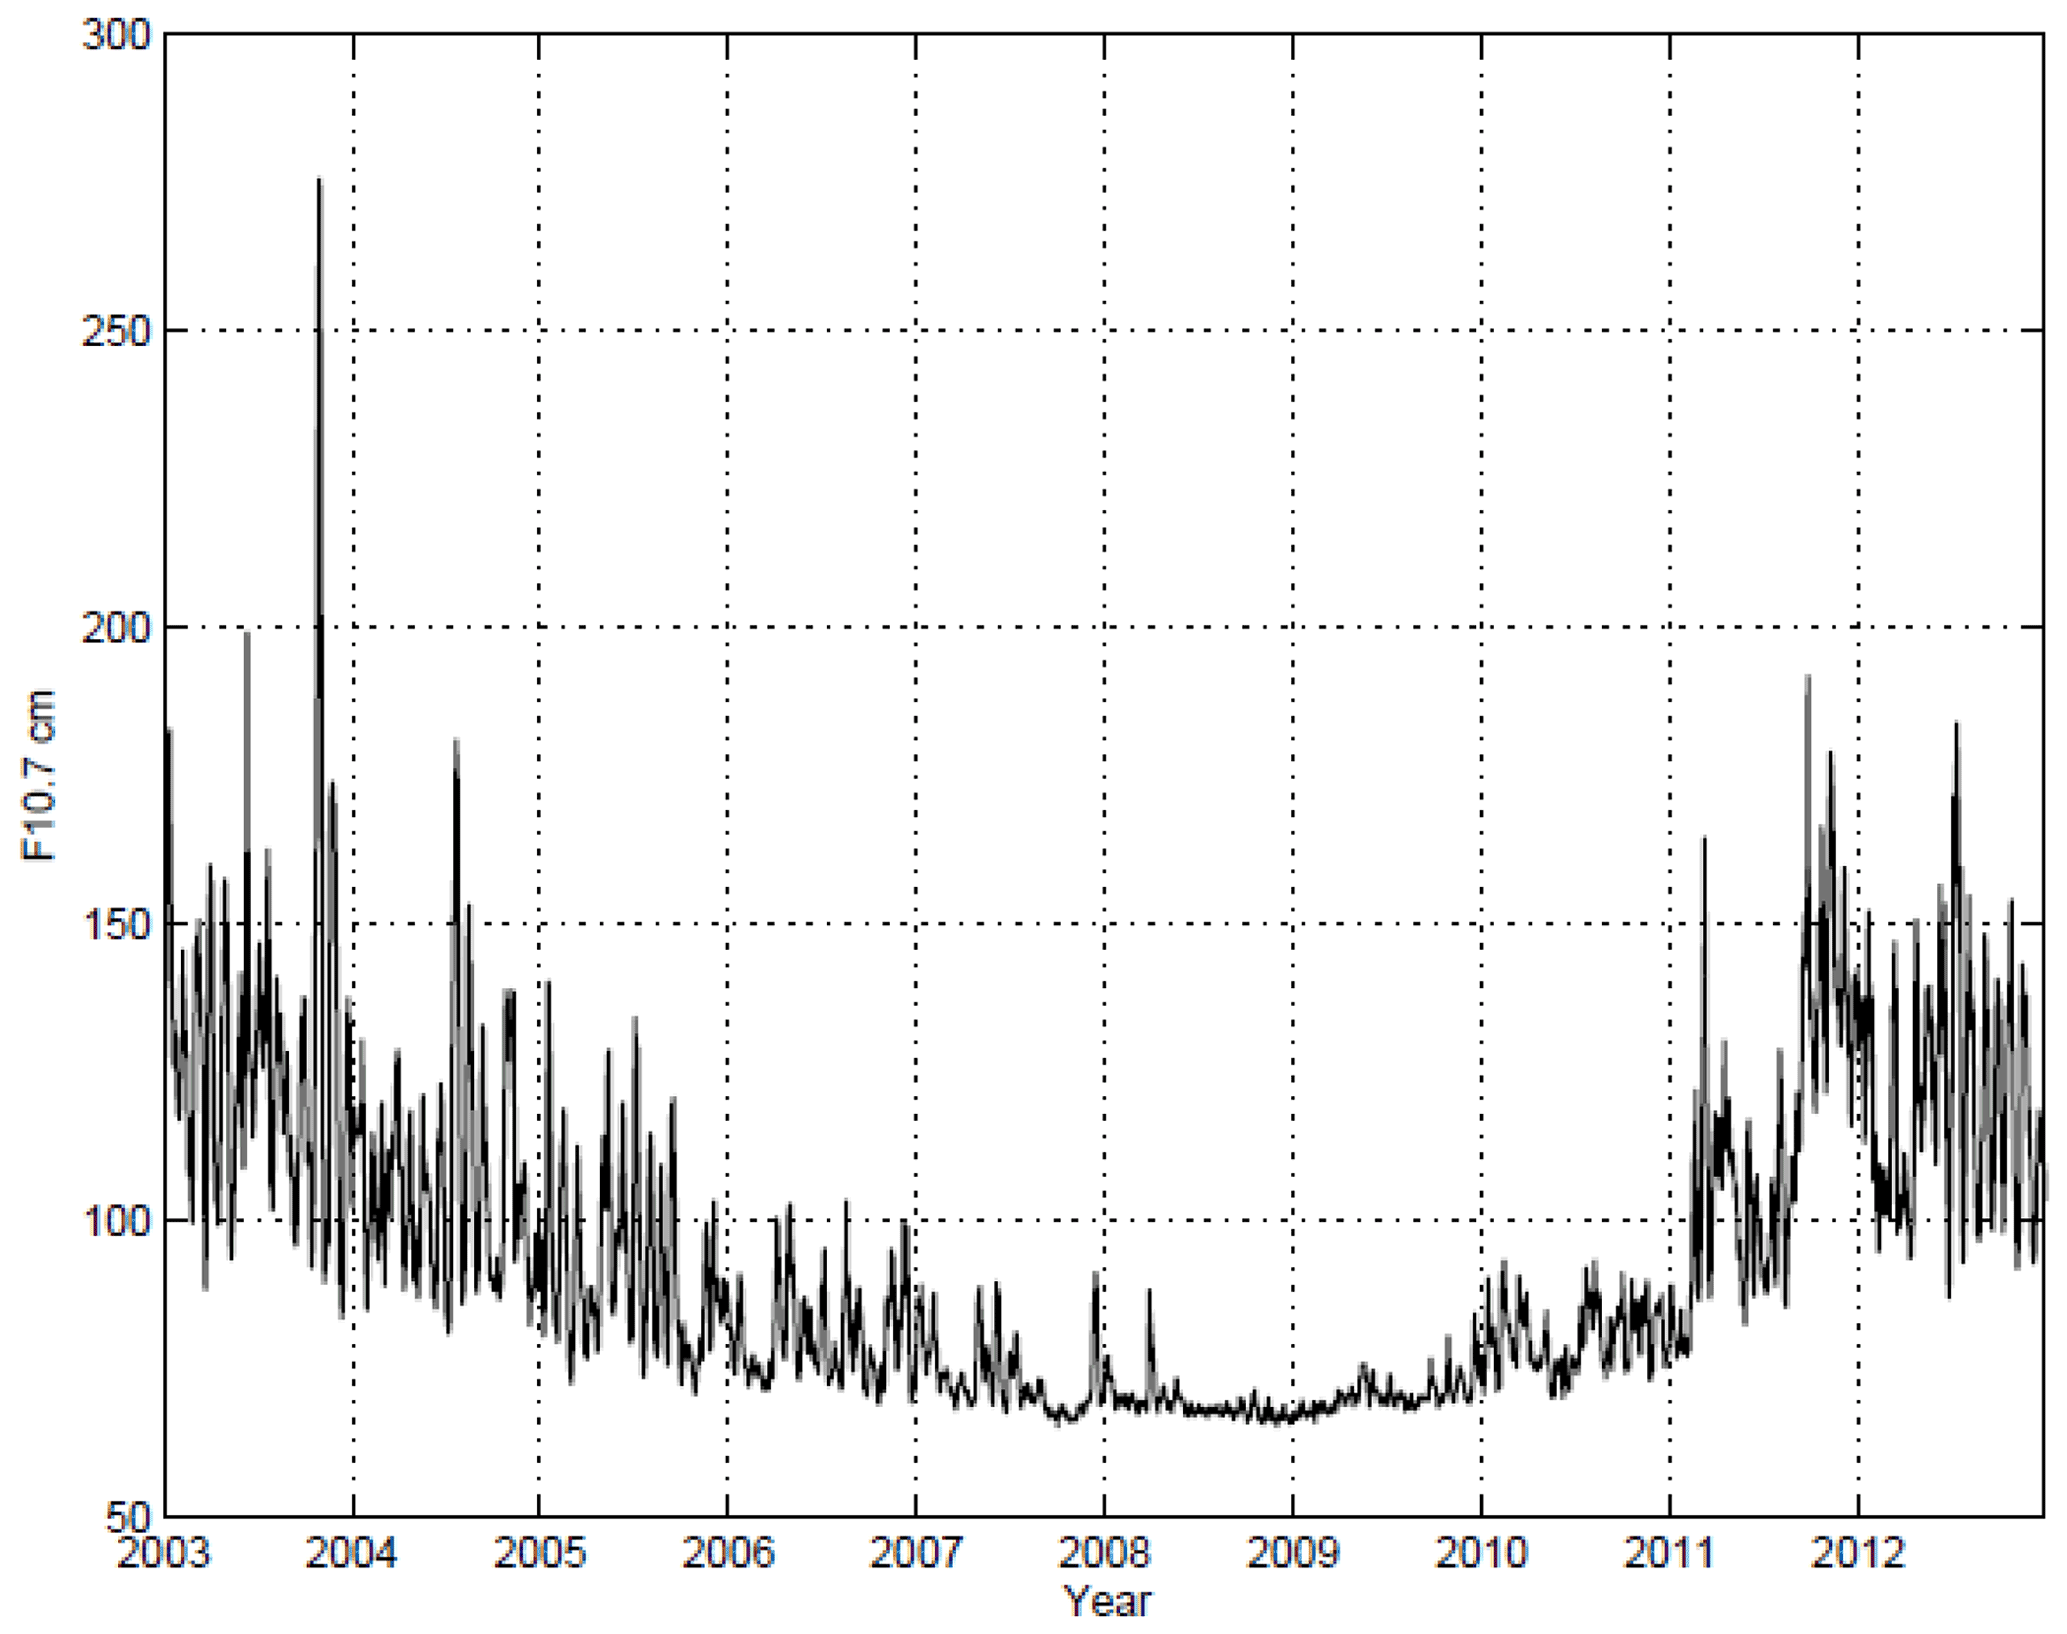
Figure 1Solar flux index F10.7 cm covering period used in this study, which covers solar conditions where F10.7 varied from 200 to 66 SFU.
Our interest focus is the local occurrence of F-region echoes (5 m scale irregularities) as one of the most interesting and challenging phenomena for space weather and climatological models. The physical mechanisms responsible for this phenomenon are complex and not fully understood. So, we organized our data attempting to present the difference in seasonal and solar flux conditions as a function of the time and height of irregularities observed in the VHF radar. For this study, we limit our focus to quiet-time irregularities.
2.2 Data analysis
It is well known that high geomagnetic activities directly cause drastic perturbations in the zonal electric field and in the equatorial and low-latitude regions, affecting the growth and development of ionospheric irregularities. These perturbations can be categorized as prompt penetration (PP) and disturbance dynamo (DD) electric fields (Abdu et al., 2018; Astafyeva et al., 2018; Shreedevi and Choudhary, 2017). These perturbed electric fields occurring in the post-sunset period can enhance/weaken the regular eastward electric field and vertical plasma drift and then affect the uplift of the F layer (Fejer et al., 1991), as a consequence affecting the generation of irregularities (Aarons, 1991; Abdu, 2012).
In sequence, to avoid the disturbed geomagnetic periods and their effects on irregularity generations, we classify the data with low geomagnetic conditions using the 3 h planetary K index (known as Kp). Each measurement was tagged with the value of Kp for the time of the measurement plus the previous 3 Kp values. We limited our study to quiet geomagnetic conditions to be those when none of the three Kp indexes exceeded 3.
The solstice is when the Sun reaches the most southerly or northerly points in the sky, while an equinox is when the Sun passes over Earth's Equator. So, to sort our measurements according to the four seasons spring, summer, fall, and winter, we use 91 d of data centered on each day 21 of March, June, September, and December, respectively. We used the quiet-time radar echoes for each season to obtain the occurrence rate of echoes. We establish that a good representation of irregularity occurrence is given by the echo distribution above 0 dB divided by the total number of observations. Our criterion is a good commitment between being able to identify the occurrence of spread-F echoes and to eliminate the effects of non-geophysical echoes.
The sample rate of the VHF radar is estimated for every 15 min interval starting at 18:00 LT, right before sunset until 05:00 LT near sunrise. To construct maps of the irregularity occurrence rate as a function of height and local time, we had computed for every 15 km height intervals starting at 200 km up to 1000 km altitude.
We can observe, in Fig. 2, a significant difference in time of occurrence and duration between the spread-F events at solar maximum and minimum. According to the data, during solar maximum the spread-F events were observed to occur near the time when upward drift is large, which is promptly after local sunset and lasts a few hours, while during solar minimum the upward drift is usually short, spread F was observed usually throughout the whole night, and so upward and downward ionospheric conditions may play a role in the morphology of irregularities. Stoneback et al. (2011) showed the role of vertical drift during the extended solar minimum and how it varies from sunset until the post-midnight periods. These previous work observations increase the need for further study of the climatology of echo evolution in time and altitude.
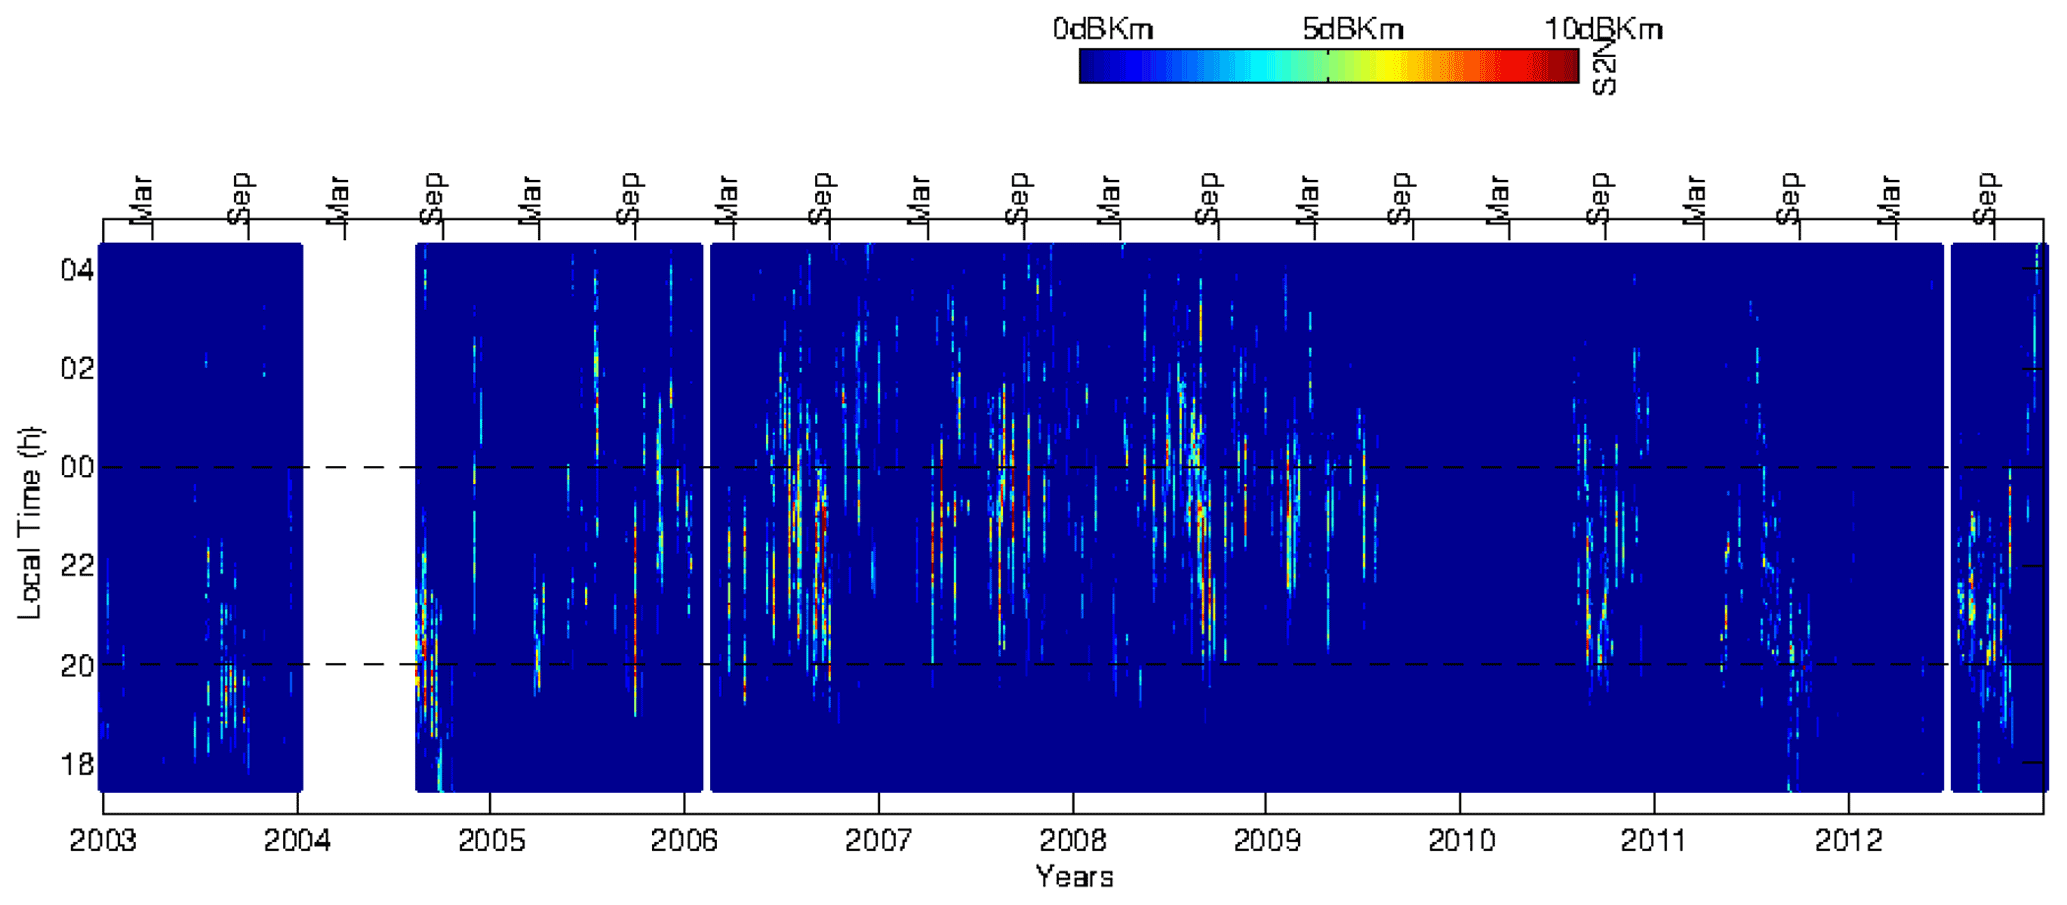
Figure 2VHF radar data are presented as altitude integration from 200 to 1000 km height as a function of the signal-to-noise ratio (dBKm). The horizontal lines represent local sunset and local midnight to help observations of echo distribution.
To understand this climatology of spread-F evolution along seasonality and solar activity, we analyzed radar echo occurrence as a function of time and altitude along solar maximum and extended solar minimum periods, since the evening vertical drifts and layer heights increase noticeably with solar activity and along nighttime.
3.1 On the height variability of echo occurrence rates
Peak altitude profiles of the occurrence rate of F-region echoes are shown in Fig. 3, top panels. They were organized by season (March equinox, June solstice, September equinox, and December solstice, from left to right, respectively) along the 2003 to 2012 period. Horizontal dashed lines are placed at the 250 and 350 km heights to assist observation (hereafter called the altitude threshold).

Figure 3Peak altitude (top panels) and time (bottom panels) variations along the years 2003, 2006, 2008, and 2012, also divided by seasons.
Comparing the peak of altitude echoes along seasons, we can observe higher occurrence rates of all years over the June solstice and September equinox than the March equinox and December solstice seasons. This observation matches the previous result by Cueva et al. (2013) that showed the peak occurrence of equatorial spread F for this region being around the July–August months.
When analyzing solar minimum years (2006 and 2008), we can focus our attention on the peak echo altitude, which was slightly higher, in altitude, in the June solstice than in the September equinox. As observed in Fig. 3, we found a more prominent peak time/altitude occurrence in the September equinox (before midnight) than in the June solstice (around midnight hours). For years of solar maximum (2003 and 2012), we can mention that peak altitude distribution is highest, mainly during the June and September seasons, but nevertheless presents a minor percentage of occurrence than solar minimum years (2006 to 2008). The minimum occurrence of peak altitude occurs in the March equinox, which is the period of scarce spread-F echoes over the Christmas Island region. During the solar maximum period spread-F echoes have less occurrence than in the solar minimum period, reaching higher altitudes as observed in the 2003 June solstice, when the peak altitude was higher than the threshold altitude of 350 km. During the September equinox higher plumes are frequently observed than in other periods, which agrees with results presented by Cueva et al. (2013).
3.2 On the time variability of echo occurrence rates
Time variation in the occurrence rates of F-region echoes for the period of the study is shown in Fig. 3, bottom panels, also separated by seasons (March equinox, June solstice, September equinox, and December solstice, from left to right, respectively). The vertical dashed lines represent local sunset and local midnight. As we can observe, the percentage of occurrence of echoes presents solar flux dependence. During solar maximum radar echoes are confined to a few hours after sunset; on the other hand, during solar minimum echoes are more broadened out in time and can arise late in the evening after sunset and more closely to midnight hours. As we get closer to the solar minimum period, the amplitude of echo occurrence increases due to the high probability of echoes occurring all through the night, which is observed during the years 2006 to 2008 with more amplitude than echoes observed during solar maximum. A similar finding was mentioned by Niranjan et al. (2003) when analyzing spread-F data from the 1997–2000 period and also by Burke et al. (2004) and Dao et al. (2011) using satellite data from different geographical locations.

Figure 4Peak time (a) and altitude (b) echo occurrences along the solar cycle divided by seasons. The error bars show the standard deviation of observations.
Seasonal dependence of echoes along the solar cycle is also observed. The September equinox has more conditions to develop irregularities over the region, as explained before, as well as higher echo occurrence for either the solar minimum or maximum periods. For the March equinox and December solstice, we have less probability of echo occurrence as observed in Fig. 3; moreover, the amplitude of echo occurrence is always lower in the solar maximum than in the solar minimum. It is important to mention that, for the June solstice, the echoes are especially observed around local midnight and post-midnight hours, which is in agreement with observations made by Otsuka et al. (2018) during the solar minimum period.
Under quiet magnetic conditions and solar minimum, there are some possible seeding mechanisms competing that increase the probability of spread-F generation throughout the night (pre-midnight and post-midnight) as well as uplifting of the F layer. For example, gravity waves, launched from the active convection region in the troposphere, could propagate into the ionosphere (Takahashi et al., 2009, 2010; Maurya et al., 2020; Correia et al., 2020) and contribute to the instability seeding. Another is the medium-scale traveling ionospheric disturbance (MSTID) activity providing perturbations in the electric fields for the low-latitude F region to be unstable at post-midnight hours, which can seed the RT instability at the magnetic equator (Otsuka et al., 2009; Yokoyama et al., 2011; Narayanan et al., 2019). Another mechanism could be the uplift of the F layer around midnight (Nicolls et al., 2006) caused by a decreasing westward electric field in conjunction with sufficient recombination and plasma flux. However, the causes of midnight F-layer increase are not yet clearly established.
For the extended solar minimum period, during the June solstice and December solstice months, we observed post-midnight echoes similar to those previously reported by Otsuka et al. (2012) during the 2005 to 2009 period. The September equinox also presents post-midnight events for the solar minimum period. Our findings are summarized in Fig. 4. In panel a is presented UT (LT = UT + 14) on the vertical axis for the time peak echo occurrence along the solar cycle separated by seasonality. The ionospheric sunset and the local midnight are highlighted as horizontal dashed lines, and the error bars represent the standard deviations. We can clearly observe that the peak time echo occurrences are closer to the time of the PRE during high solar activity years, with small standard deviations (see 2003, 2004, 2011, and 2012) and around midnight during solar minimum conditions, with bigger standard deviations (see years 2007 to 2009). The December solstice season shows very different behavior in the years 2004 and 2012 during the high solar condition; also in 2003, the peak time echo occurrence was very late compared with the other seasons for the same year. So, further study must be necessary at this point.
According to our observations, during solar minimum, the error bars (standard deviation) must be higher than during solar maximum periods due to the probability of spread-F echo occurrences, which are spread out in time (with maximum observations around local midnight) under minimum conditions and localized to around local sunset under maximum solar conditions. For example, the March equinox and June solstice are good representations of this behavior. They show very small deviation bars in 2003, 2011, and 2012 (solar maximum conditions) and large deviation bars from 2006 to 2009 (solar maximum conditions). The September equinox represents the same general trend, but during 2012 the deviation bar is large, beyond that expected for solar maximum conditions.
Figure 4b shows altitude peak variation along the solar cycle, also separated by seasonality. The error bars show the distribution of peak altitude echo observations. The altitude parameter seems to follow a very good trend, with higher altitudes for solar maximum conditions and lower altitudes for solar minimum conditions. Again, the December solstice does not match very well with this trend, also presenting a lower altitude peak compared with all seasons. During 2008 the December solstice is higher than its general trend. We observe the size of error bars decreasing from solar maximum to solar minimum conditions. During solar maximum, the echoes reach higher altitudes compared with echo occurrences during solar minimum, which is why the deviation bars are bigger during solar maximum years. The altitude parameter is an important parameter since it is one key process in the generation mechanism for ionospheric irregularities. Peak altitude echoes of the June solstice reach a higher altitude difference from solar maximum to solar minimum periods when compared with the March and September equinoxes, which were closer to 300 km for most of the solar cycle period.
The seasonal variability observed in the amplitude of peak echo occurrence, either for altitude or time, is suitable for the seasonal spread-F occurrence over the Pacific region. During high solar activity spread F was observed more often after sunset and rare/uncommon observations around midnight hours. The RT instability occurs at the magnetic equator after sunset when the eastward electric fields increase and structures reaching higher altitudes are due to vertical ExB drift at the Equator, well known for high solar flux periods. However, during the low solar cycle period observed (years 2006 to 2009), spread F did not reach higher altitudes than in high solar conditions: its appearance was very frequent around the midnight hours and lasted for many hours. The mechanism that governs its appearance is no longer the pre-reversal enhancement because it just happens around the sunset terminator. The generation mechanism for the post-midnight irregularities at quiet time during solar minimum conditions is still not clear or not completely understood. Some authors also found a similar occurrence, in the solar minimum period, of plasma density irregularities mostly after midnight (Heelis et al., 2010; Li et al., 2011; Dao et al., 2011). So, the occurrence of post-midnight events was observed to present negative correlation with solar activity, decreasing from solar minimum to solar maximum.
So, for the Christmas Island sector, we can conclude that spread-F echoes occur along all solar flux conditions. The PRE is the main mechanism for spread-F generation, with consequent occurrences arising closer to the sunset terminator and higher structures and short durations for solar maximum conditions. Spread-F occurrence over the December solstice season needs more study since it does not follow the peak time occurrence for the solar maximum condition. For solar minimum conditions the mechanisms necessary for spread-F generations are not clear, being the seeding of the RT instability and the uplift of the F layer. In any case, the spread-F occurrences happen all night, with high occurrence mainly around local midnight and peak altitude echo distribution remaining around 300 km and with a long time duration.
It is still not well understood what causes higher occurrences of midnight and post-midnight irregularities during the solar minimum compared with solar maximum conditions. Some theories have been raised to explain the generation mechanisms, but further investigation is needed. Studies must focus specifically on midnight and post-midnight echoes with multiple instrumentation to bring a clear understanding of the generation mechanisms.
All raw data belong to the AFRL Geospace Environment Applications and Impacts Program at Kirtland AFB. Data requirements will be made directly to the AFRL directorate. The processed data can be requested by the corresponding author.
RYdLCC came up with the idea, prepared all data analysis, and then prepared the article draft and final version. ERdP participated in advising on and reviewing the manuscript. ACN gave support with data analysis and equipment.
The contact author has declared that none of the authors has any competing interests.
Publisher’s note: Copernicus Publications remains neutral with regard to jurisdictional claims in published maps and institutional affiliations.
This article is part of the special issue “From the Sun to the Earth's magnetosphere–ionosphere–thermosphere”. It is a result of the VIII Brazilian Symposium on Space Geophysics and Aeronomy & VIII Symposium on Physics and Astronomy, Brazil, March 2021.
The authors are very grateful to Roland T. Tsunoda and Keith M. Groves for providing the VHF radar data from the Christmas Island equatorial station. The AFRL Geospace Environment Applications and Impacts Program at Kirtland AFB is also thanked. We thank the Brazilian Ministry of Science, Technology and Innovation and the Brazilian Space Agency.
The author Eurico Rodrigues de Paula was supported by CNPq (grant no. 302531/2019-0) as well as INCT GNSS-NavAer (grant nos. 2014/465648/2014-2 CNPq and 2017/50115-0 FAPESP). The author Ricardo Yvan de La Cruz Cueva received support by the PIBIC/UEMA program.
This paper was edited by Dalia Buresova and reviewed by two anonymous referees.
Aarons, J.: The role of the ring current in the generation or inhibition of equatorial F layer irregularities during magnetic storms, Radio Sci., 26, 1131–1149, 1991.
Abdu, M. A.: Outstanding problems in the equatorial ionosphere–thermosphere electrodynamics relevant to spread-F, J. Atmos. Sol.-Terr. Phys., 63, 869–884, 2001.
Abdu, M. A.: Equatorial spread F/plasma bubble irregularities under storm time disturbance electric fields, J. Atmos. Terr. Phys., 75/76, 44–56, 2012.
Abdu, M. A., Nogueira, P. A. B., Santos, A. M., de Souza, J. R., Batista, I. S., and Sobral, J. H. A.: Impact of disturbance electric fields in the evening on prereversal vertical drift and spread F developments in the equatorial ionosphere, Ann. Geophys., 36, 609–620, https://doi.org/10.5194/angeo-36-609-2018, 2018.
Astafyeva, E., Zakharenkova, I., Hozumi, K., Alken, P., Coïsson, P., Hairston, M. R., and Coley, W. R.: Study of the Equatorial and Low-Latitude Electrodynamic and Ionospheric Disturbances During the 22–23 June 2015 Geomagnetic Storm Using Ground-Based and Spaceborne Techniques, J. Geophys. Res.-Space, 123, 2424–2440, https://doi.org/10.1002/2017JA024981, 2018.
Burke, W. J., Gentile, L. C., Huang, C. Y., Valladares, C. E., and Su, S. Y.: Longitudinal variability of equatorial plasma bubbles observed by DMSP and ROCSAT-1, J. Geophys. Res., 109, A12301, https://doi.org/10.1029/2004JA010583, 2004.
Correia, E., Raunheitte, L. T. M., Bageston, J. V., and D'Amico, D. E.: Characterization of gravity waves in the lower ionosphere using very low frequency observations at Comandante Ferraz Brazilian Antarctic Station, Ann. Geophys., 38, 385–394, https://doi.org/10.5194/angeo-38-385-2020, 2020.
Cueva, R. Y. C., de Paula, E. R., and Kherani, A. E.: Statistical analysis of radar observed F region irregularities from three longitudinal sectors, Ann. Geophys., 31, 2137–2146, https://doi.org/10.5194/angeo-31-2137-2013, 2013.
Dao, E., Kelley, M. C., Roddy, P., Retterer, J., Ballenthin, J. O., de La Beaujardiere, O., and Su, Y.-J.: Longitudinal and Seasonal dependence of nighttime equatorial plasma density irregularities during solar minimum detected on the C/NOFS satellite, Geophys. Res. Lett., 38, L10104, https://doi.org/10.1029/2011GL047046, 2011.
Fejer, B. G., de Paula, E. R., González, S. A., and Woodman, R. F.: Average vertical and zonal F region plasma drifts over Jicamarca. J. Geophys. Res.-Space, 96, 13901–13906, https://doi.org/10.1029/91ja01171, 1991.
Fejer, B. G., Scherliess, L., and de Paula, E. R.: Effect of the vertical plasma drift velocity on the generation and evolution of equatorial spread F, J. Geophys. Res., 104, 19859–19869, 1999.
Heelis, R. A., Stoneback, R., Earle, G. D., Haaser, R. A., and Abdu, M. A.: Medium-scale equatorial plasma irregularities observed by coupled ion-neutral dynamics investigation sensors aboard the Communication Navigation Outage Forecast System in a prolonged solar minimum, J. Geophys. Res., 115, A10321, https://doi.org/10.1029/2010JA015596, 2010.
Li, G., Ning, B., Abdu, M. A., Yue, X., Liu, L., Wan, W., and Hu, L.: On the occurrence of postmidnight equatorial F region irregularities during the June solstice, J. Geophys. Res., 116, A04318, https://doi.org/10.1029/2010JA016056, 2011.
Maurya, A. K., Shrivastava, M. N., and Kumar, K. N.: Ionospheric monitoring with the Chilean GPS eyeball during the South American total solar eclipse on 2nd July 2019, Sci. Rep., 10, 19380, https://doi.org/10.1038/s41598-020-75986-7, 2020.
Miller, E. S., Makela, J. J., and Kelley, M. C.: Seeding of equatorial plasma depletions by polarization electric fields from middle latitudes: Experimental evidence, Geophys. Res. Lett., 36, L18105, https://doi.org/10.1029/2009GL039695, 2009.
Narayanan, V. L., Patra, A. K., Gurubaran, S., Pavan Chaitanya, P., and Emperumal, K.: Coincident airglow, VHF radar, and ionosonde observations of electrified medium-scale traveling ionospheric disturbances in the equatorial latitudes, Geophys. Res. Lett., 46, 7173–7181, https://doi.org/10.1029/2019GL083266, 2019.
Nicolls, M. J., Kelley, M. C., Vlasov, M. N., Sahai, Y., Chau, J. L., Hysell, D. L., Fagundes, P. R., Becker-Guedes, F., and Lima, W. L. C.: Observations and modeling of post-midnight uplifts near the magnetic equator, Ann. Geophys., 24, 1317–1331, https://doi.org/10.5194/angeo-24-1317-2006, 2006.
Niranjan, K., Brahmanandam, P. S., Ramakrishna Rao, P., Uma, G., Prasad, D. S. V. V. D., and Rama Rao, P. V. S.: Post midnight spread-F occurrence over Waltair (17.7∘ N, 83.3∘ E) during low and ascending phases of solar activity, Ann. Geophys., 21, 745–750, https://doi.org/10.5194/angeo-21-745-2003, 2003.
Ossakow, S. L.: Spread-F theories, J. Atmos. Terr. Phys., 43, 437–452, 1981.
Otsuka, Y., Ogawa, T., and Effendy: VHF radar observations of nighttime F-region field-aligned irregularities over Kototabang, Indonesia, Earth Planet Space, 61, 431–437, 2009.
Otsuka, Y., Shiokawa, K., Nishioka, M., and Effendy: VHF radar observations of post-midnight F-region field-aligned irregularities over Indonesia during solar minimum, Ind. J. Radio Space Phys., 41, 199–207, 2012.
Otsuka, Y.: Review of the generation mechanisms of post-midnight irregularities in the equatorial and low-latitude ionosphere, Prog. Earth Planet Sci., 5, 57, https://doi.org/10.1186/s40645-018-0212-7, 2018.
Shreedevi, P. R. and Choudhary, R. K.: Impact of oscillating IMF Bz during 17 March 2013 storm on the distribution of plasma over Indian low-latitude and mid-latitude ionospheric regions, J. Geophys. Res.-Space, 122, 11607–11623, https://doi.org/10.1002/2017JA023980, 2017.
Stoneback, R. A., Heelis, R. A., Burrell, A. G., Coley, W. R., Fejer, B. G., and Pacheco, E.: Observations of quiet time vertical ionos drift in the equatorial ionosphere during the solar minimum period of 2009, J. Geophys. Res., 116, A12327, https://doi.org/10.1029/2011JA016712, 2011.
Takahashi, H., Taylor, M. J., Pautet, P.-D., Medeiros, A. F., Gobbi, D., Wrasse, C. M., Fechine, J., Abdu, M. A., Batista, I. S., Paula, E., Sobral, J. H. A., Arruda, D., Vadas, S. L., Sabbas, F. S., and Fritts, D. C.: Simultaneous observation of ionospheric plasma bubbles and mesospheric gravity waves during the SpreadFEx Campaign, Ann. Geophys., 27, 1477–1487, https://doi.org/10.5194/angeo-27-1477-2009, 2009.
Takahashi, H., Abdu, M. A., Taylor, M. J., Pautet, P.-D., de Paula, E., Kherani, E. A., Medeiros, A. F., Wrasse, C. M., Batista, I. S., Sobral, J. H. A., Gobbi, D., Arruda, D., Paulino, I., Vadas, S., and Fritts, D.: Equatorial ionosphere bottom-type spread F observed by OI 630.0 nm airglow imaging, Geophys. Res. Lett., 37, L03102, https://doi.org/10.1029/2009GL041802, 2010.
Tsunoda, R. T., Baron, M. J., Owen, J., and Towle, D. M.: ALTAIR: an incoherent scatter radar for equatorial spread F studies, Radio Sci., 14, 1111, https://doi.org/10.1029/RS014i006p01111, 1979.
Tsunoda, R. T., Ecklund, W. L., and Johnston, P. E.: Radar measurements of electric fields in the topside of the equatorial electrojet: First results, Geophys. Res. Lett., 27, 2861–2864, https://doi.org/10.1029/2000gl003775, 2000.
Woodman, R. F. and La Hoz, C.: Radar observations of F region equatorial irregularities, J. Geophys. Res., 81, 5447–5466, 1976.
Yizengaw, E., Maldwin, M. B., Sahai, Y., and de Jesus, R.: Strong postmidnight equatorial ionospheric observations during magnetically quiet period, J. Geophys. Res., 114, A12308, https://doi.org/10.1029/2009JA014603, 2009.
Yizengaw, E., Retterer, J., Pacheco, E. E., Roddy, P., Groves, K., Caton, R., and Baki, P.: Postmidnight bubbles and scintillation in the quiet-time June solstice, Geophys. Res. Lett., 40, 1–6, https://doi.org/10.1002/2013GL058307, 2013.
Yokoyama, T., Yamamoto, M., Otsuka, Y., Nishioka, M., Tsugawa, T., Watanabe, S., and Pfaff, R. F.: On post-midnight low-latitude ionospheric irregularities during solar minimum, 1: Equatorial Atmosphere Radar and GPS-TEC observations in Indonesia, J. Geophys. Res., 116, A11325, https://doi.org/10.1029/2011JA016797, 2011.
Zalesak, S. T., Ossakow, S. L., and Chaturvedi, P. K.: Nonlinear equatorial spread F – the effect of neutral winds and background Pedersen conductivity, J. Geophys. Res., 87, 151–166, 1982.