the Creative Commons Attribution 4.0 License.
the Creative Commons Attribution 4.0 License.
 | 06 Jul 2021
Reflection of low-frequency fast magnetosonic waves at the local two-ion cutoff frequency: observation in the plasmasphere
Geng Wang
Mingyu Wu
Guoqiang Wang
Sudong Xiao
Irina Zhelavskaya
Yuri Shprits
Yuanqiang Chen
Zhengyang Zou
Zhonglei Gao
Tielong Zhang
We investigate the reflection of low-harmonic fast magnetosonic (MS) waves at the local two-ion cutoff frequency (). By comparing the wave signals of the two Van Allen Probes satellites, a distinct boundary where wave energies cannot penetrate inward are found in the time–frequency domain. The boundary is identified as the time series of local . For a certain frequency, there exists a spatial interface formed by , where the incident waves should be reflected. The waves with small incident angles are more likely to penetrate the thin layer where the group velocity reduces significantly and then slow down in a period of several to tens of seconds before the reflection process complete. The cutoff reflection scenario can explain the intense outward waves observed by probe A. These results of MS reflection at may help to predict the global distribution of MS waves and promote the understanding of wave–particle dynamics in the radiation belt.
- Article
(7629 KB) - Full-text XML
- BibTeX
- EndNote


Fast magnetosonic (MS) waves are a type of electromagnetic emission commonly observed in the radiation belts. These waves generally range from the hydrogen gyrofrequency () to the lower hybrid resonance frequency (fLH) (Boardsen et al., 1992) and often exhibit harmonic structures at approximately the integral times of in high-resolution spectra (Gurnett, 1976; Perraut et al., 1982; Balikhin et al., 2015). It is suggested that the free energy of the ring current hot protons excites the harmonic waves via the ion Bernstein instability (Gary et al., 2010; Liu et al., 2011; Min et al., 2018; Liu et al., 2018a). In the inner magnetosphere, MS waves normally have quasi-linear polarization (Curtis and Wu, 1979; Němec et al., 2005; Laakso et al., 1990) and have quasi-perpendicular wave vectors that account for the equatorial confinement (Russell et al., 1970; Zou et al., 2019). In recent years, MS waves have been considered to have the potential for heating electrons between the kiloelectronvolt (keV) and megaelectronvolt (MeV) energy ranges via the Landau resonance (Horne et al., 2007), the transit time scattering (Summers and Ma, 2000; Bortnik and Thorne, 2010) or the bounce resonance (Shprits, 2016; Tao and Li, 2016). Similar mechanisms can also result in a parallel acceleration and can lead to the butterfly pitch angle distribution for megaelectronvolt electrons (Xiao et al., 2015; Li et al., 2016b, a; Lei et al., 2017; Yang et al., 2017).
Recent studies found that the frequency of the wave peak occurrence increases from approximately at 2 RE to at 5 RE (Boardsen et al., 2016). Previous observations have demonstrated the propagation of MS waves in the radiation belt (Santolík et al., 2002; Su et al., 2017). The high harmonics with a few hundred hertz (Hz) that are generated in the plasmasphere can penetrate into the low altitude of approximately 700 km (Gulelmi et al., 1975; Santolík et al., 2016). Additionally, Chen and Thorne (2012) considered the perpendicular propagation in the central symmetrical medium and predicted the trapping of MS waves in the vicinity of the plasmapause, which has been supported by subsequent observations (Ma et al., 2014; Yuan et al., 2019). A systematic study by Posch et al. (2015) revealed a wide magnetic local time (MLT) distribution, both inside and outside the plasmapause. Furthermore, Liu et al. (2018b) found that the multiple fine-scale density irregularities where the Wentzel–Kramers–Brillouin (WKB) approximation is violated also effectively blocked MS propagation. Teng et al. (2019) further revealed a wide distribution of MS waves below , with a higher intensity in the high-density afternoon section.
Theoretically, if the background plasma consists of at least two ion components, then the R–X mode waves below should approach the cutoff frequency, which is dependent on the ion abundance ratios and magnetic field and is independent of either wave normal angle or plasma density (Smith and Brice, 1964; Stix, 1992). The refractive index and wavenumber are close to zero near the cutoff frequency; thus, the wave should be reflected as a consequence of Snell's law. Previous studies have demonstrated the reflection of hiss waves in the high-latitude region (Gurnett and Burns, 1968; Santolík and Parrot, 1999; Chen et al., 2017). To date, there is a lack of evidence for the reflection of MS waves near the local two-ion cutoff frequency (or the helium cutoff frequency, referred to as ) in the outer radiation belt (or in the vicinity). We present direct evidence for such a reflection process in the current study.
The data of the two Van Allen Probes satellites were used to analyze the wave behavior (Mauk et al., 2013). The 64 Hz magnetic field data from the triaxial fluxgate magnetometer (MAG) of the Electric and Magnetic Field Instrument and Integrated Science (EMFISIS) suite (Kletzing et al., 2013) were processed through fast Fourier transform (FFT, without detrending) and using the method of singular value decomposition (SVD) (Santolík et al., 2003) to obtain the wave normal angle and wave ellipticity. The 32 Hz electric field data from the Electric Field and Waves (EFW) instrument (Wygant et al., 2013) were used. As there are only two available components, the third component was estimated based on . The FFT was performed on the electric field and magnetic field (resampled to 32 Hz) to obtain the cross-power spectra, and the Poynting vector was then obtained (Santolík et al., 2010).
The electron density ne, which was derived from the upper hybrid frequency (Kurth et al., 2015) measured by the high-frequency receiver (HFR) of EMFISIS; the ambient magnetic field B0, which was measured by EMFISIS MAG; and the proton (H+) flux data, which was measured by the Helium, Oxygen, Proton, and Electron (HOPE) instrument (Funsten et al., 2013) and by the Radiation Belt Storm Probes Ion Composition Experiment (RBSPICE) instrument (Mitchell et al., 2013) were used for the calculation of growth rates. The RBSPICE fluxes were divided by a factor of 3 to eliminate the mismatch with HOPE fluxes (Min et al., 2017; Kistler et al., 2016). Following the work of Kennel (1966) and Chen et al. (2010b), we can evaluate the wave temporal growth rate,
and the corresponding convective growth rate,
Here, D(0) and D(1) are the real and imaginary parts of the dispersion relation (Chen et al., 2010b, a). depends on the phase space density F and its deviation with respect to energy and pitch angle. The technique details follow Su et al. (2018), Liu et al. (2018a) and Wang et al. (2019).
Simulations were carried out based on a ray-tracing code, where the transformation of the coordinate systems followed Horne (1989), and the adaptive step size was derived by restricting the deviation between the locally calculated wavenumber and the integrated wavenumber. Two kinds of plasma conditions were used for comparison. The first condition combined the Plasma density in the Inner magnetosphere Neural network-based Empirical (PINE) density model (Zhelavskaya et al., 2016, 2017) and the TS05 magnetic field model (Tsyganenko and Sitnov, 2005). In the second condition, the observed ne and B0 were simply replicated in the MLT to obtain the central symmetric two-dimensional distributions.
Figure 1 gives an overview of the MS wave event on 1 March 2017. At 11:35 UT, both probe A and probe B started to receive two groups of intense hydrogen band wave signals with several continuous patches: one approximately 4.0–7.0 Hz and the other approximately 8.0–14.0 Hz. The doubles of the peak frequencies of each wave patch in the lower-frequency group match well with the peak frequencies of wave patches in the higher-frequency group (black and white diamonds in Fig. 1a and e), indicating that the two groups of waves belong to the first harmonics and second harmonics, respectively. The frequency of each patch increases slightly within half an hour, the timescale of which is significantly larger than the rising tone structure (Fu et al., 2014), indicating its association with the injection of the wave sources rather than nonlinear generation. A sharp low boundary can be found just above the helium gyrofrequency (), indicating the existence of the . From Fig. 1b and f, the plasma density ne of approximately 2000 cm−3 indicates the immersion of probes inside the deep plasmasphere. From Fig. 1c and g, the enhancements of hot H+ (tens of keV) starting at 12:00 UT can be seen (beyond L∼3.5). These hot H+ can lead to a positive convective growth rate for the low harmonics, in particular for the first harmonics in the range 4.0–7.0 Hz (Fig. 1d), at a quasi-perpendicular wave normal angle ( here). This indicates a potential source region for the waves observed in the inner L-shell. No waves can be observed in the region of positive convective growth rates, as the values of growth rates are in the small magnitude of approximately 10−7. This region may be close to the source region of the waves, and the free energy has been significantly released at the time the satellite arrived. During the wave period, both probes were located at –8.0∘, MLT∼15.0–17.0 and L∼2.2– 4.0, i.e., near the equatorial plane of the afternoon sector. Figure 1h presents the global distribution of the density predicted by the PINE model and the satellite trajectories during 11:30–12:40 UT, in the equatorial plane of the solar magnetosphere (SM) coordinate. The separation of the two satellites is less than 0.5 RE during the wave period, allowing for a study of wave propagation at a small scale by comparative observation.
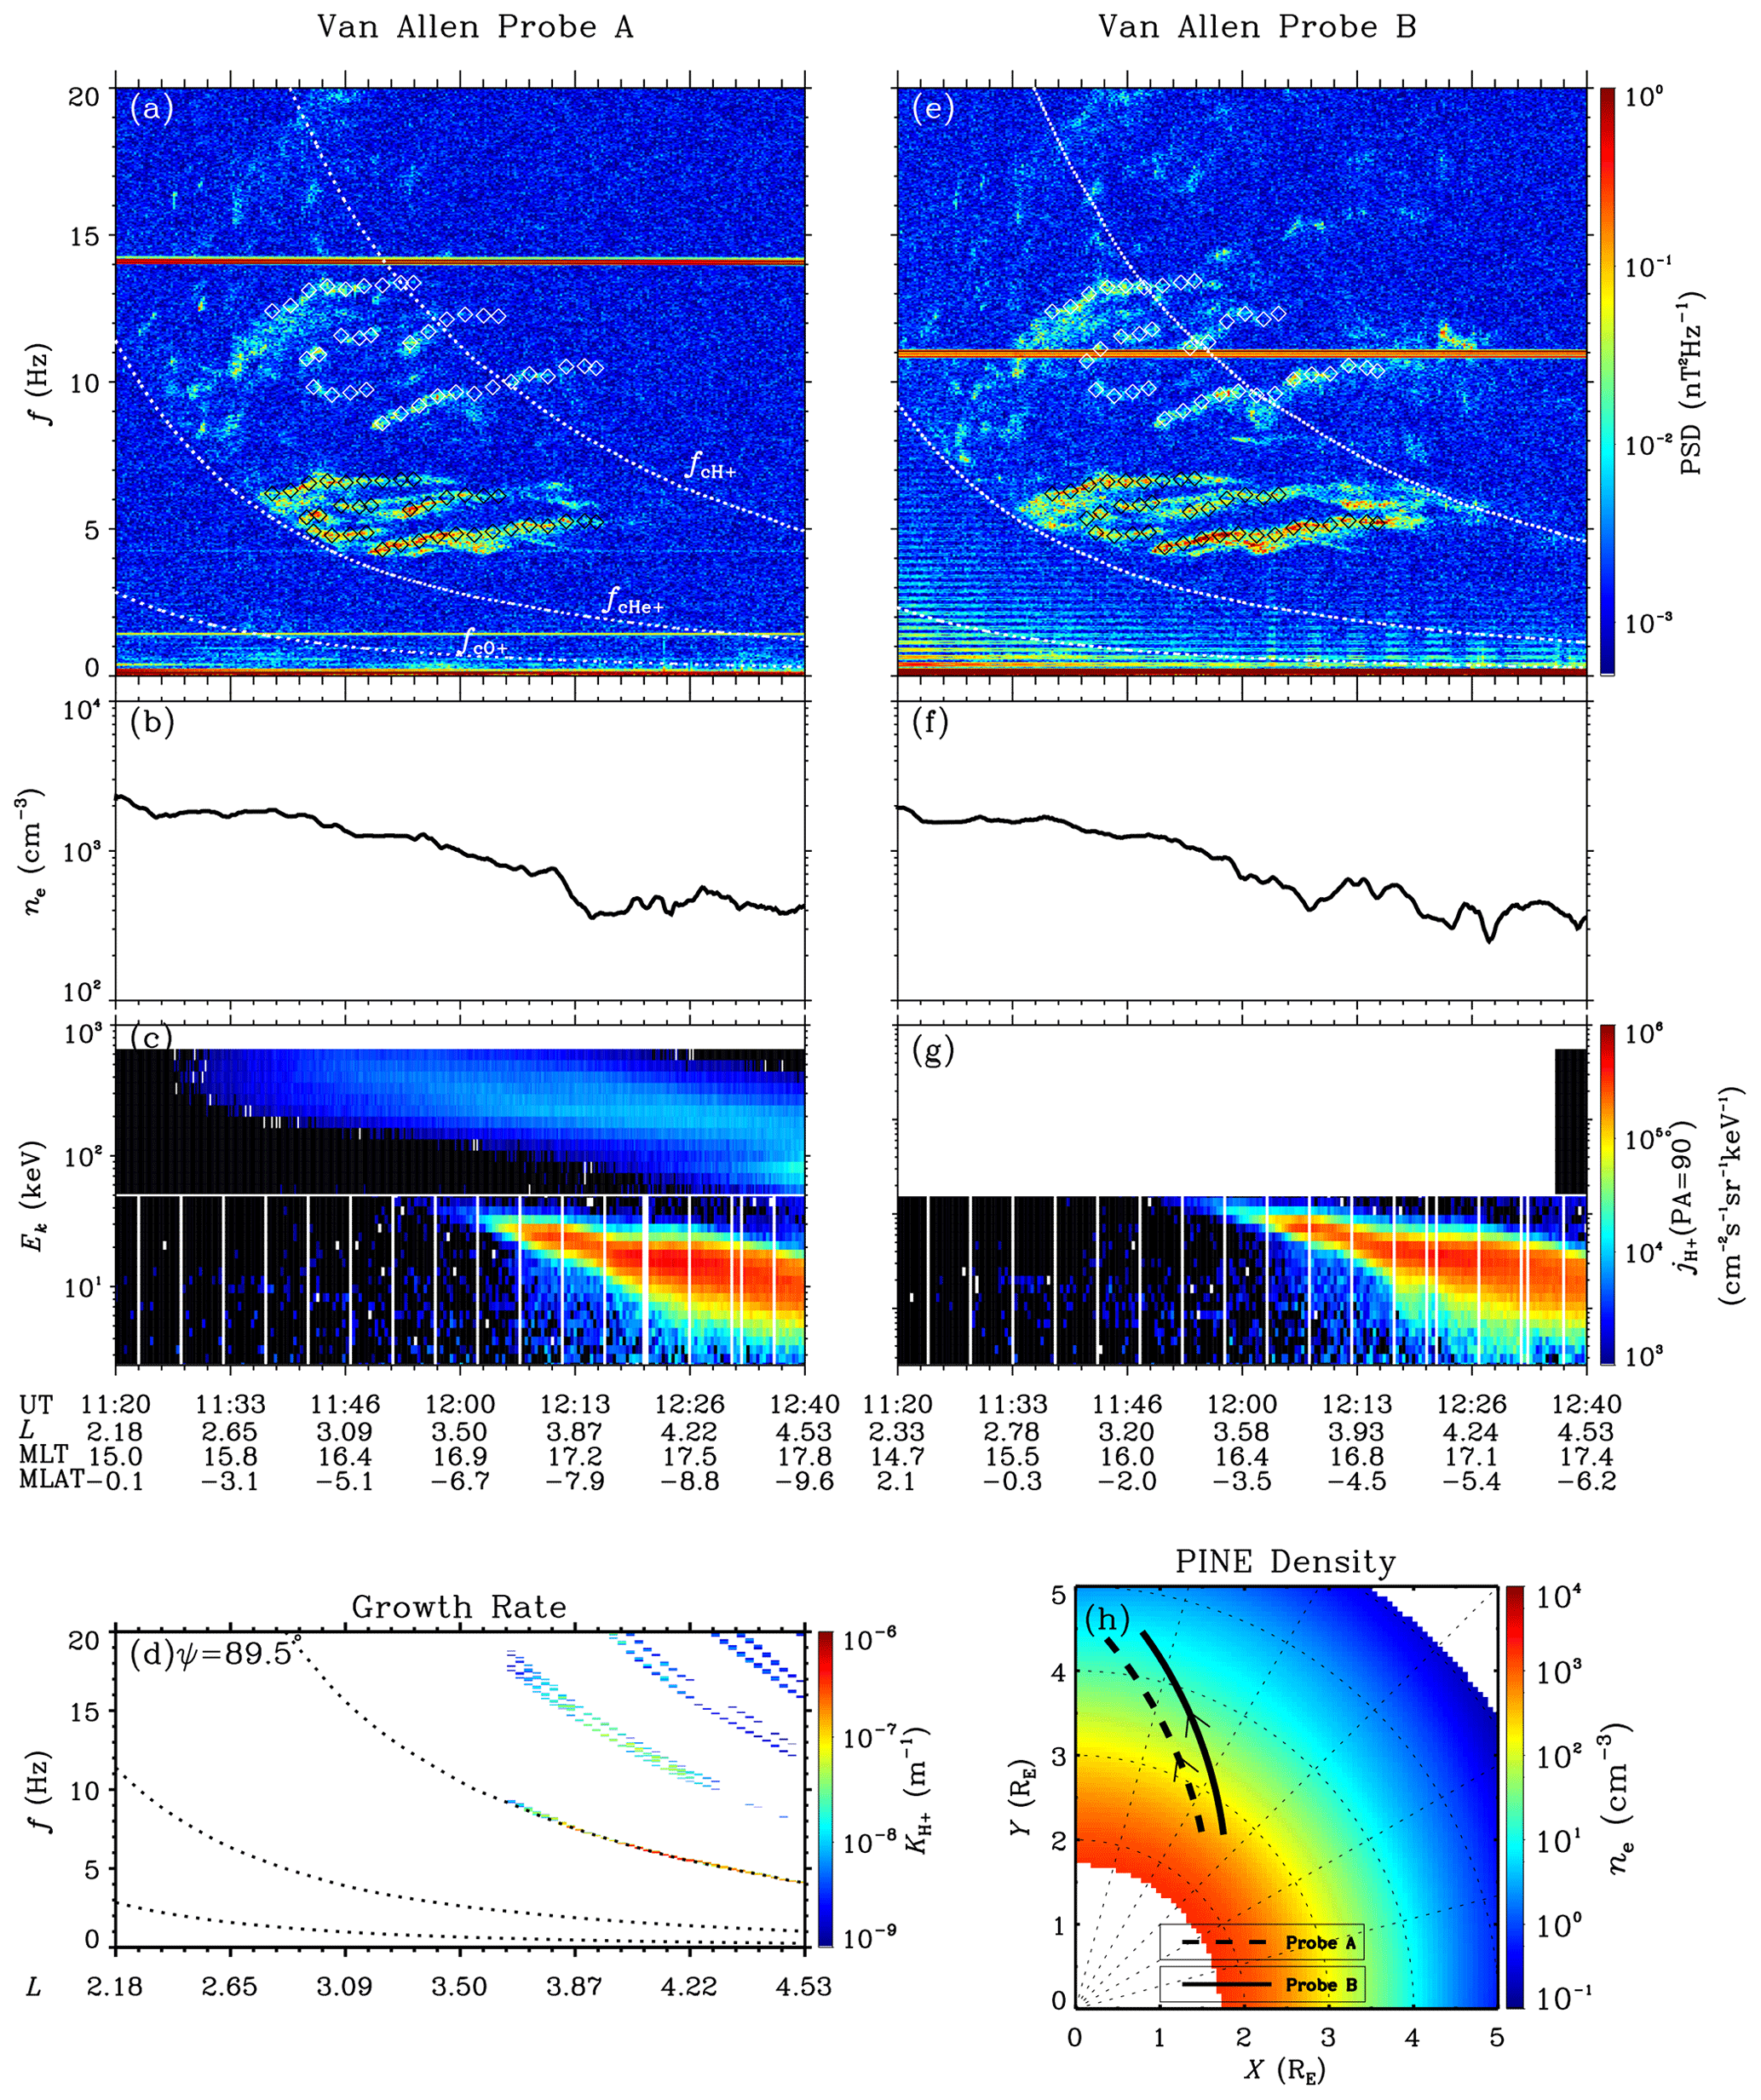
Figure 1Overview of the MS wave event on 1 March 2017. (a, e) Magnetic field power spectral density (PSD). Dashed white lines trace the local gyrofrequencies of proton (fcH+), helium (fcHe+) and oxygen (fcO+). The black diamonds mark the frequencies of the peak PSD for each patch of the fundamental waves, while the frequencies of the white diamonds are double those of the black diamonds. (b, f) Electron number density ne. (c, g) Energy-dependent H+ differential fluxes at a 90∘ pitch angle. (d) Convective growth rates for MS waves at a 89.5∘ wave normal angle. (h) Global distribution of the electron number density from the PINE model, in the equatorial plane of the SM coordinate. The satellite trajectories are drawn as thick dashed and solid lines.
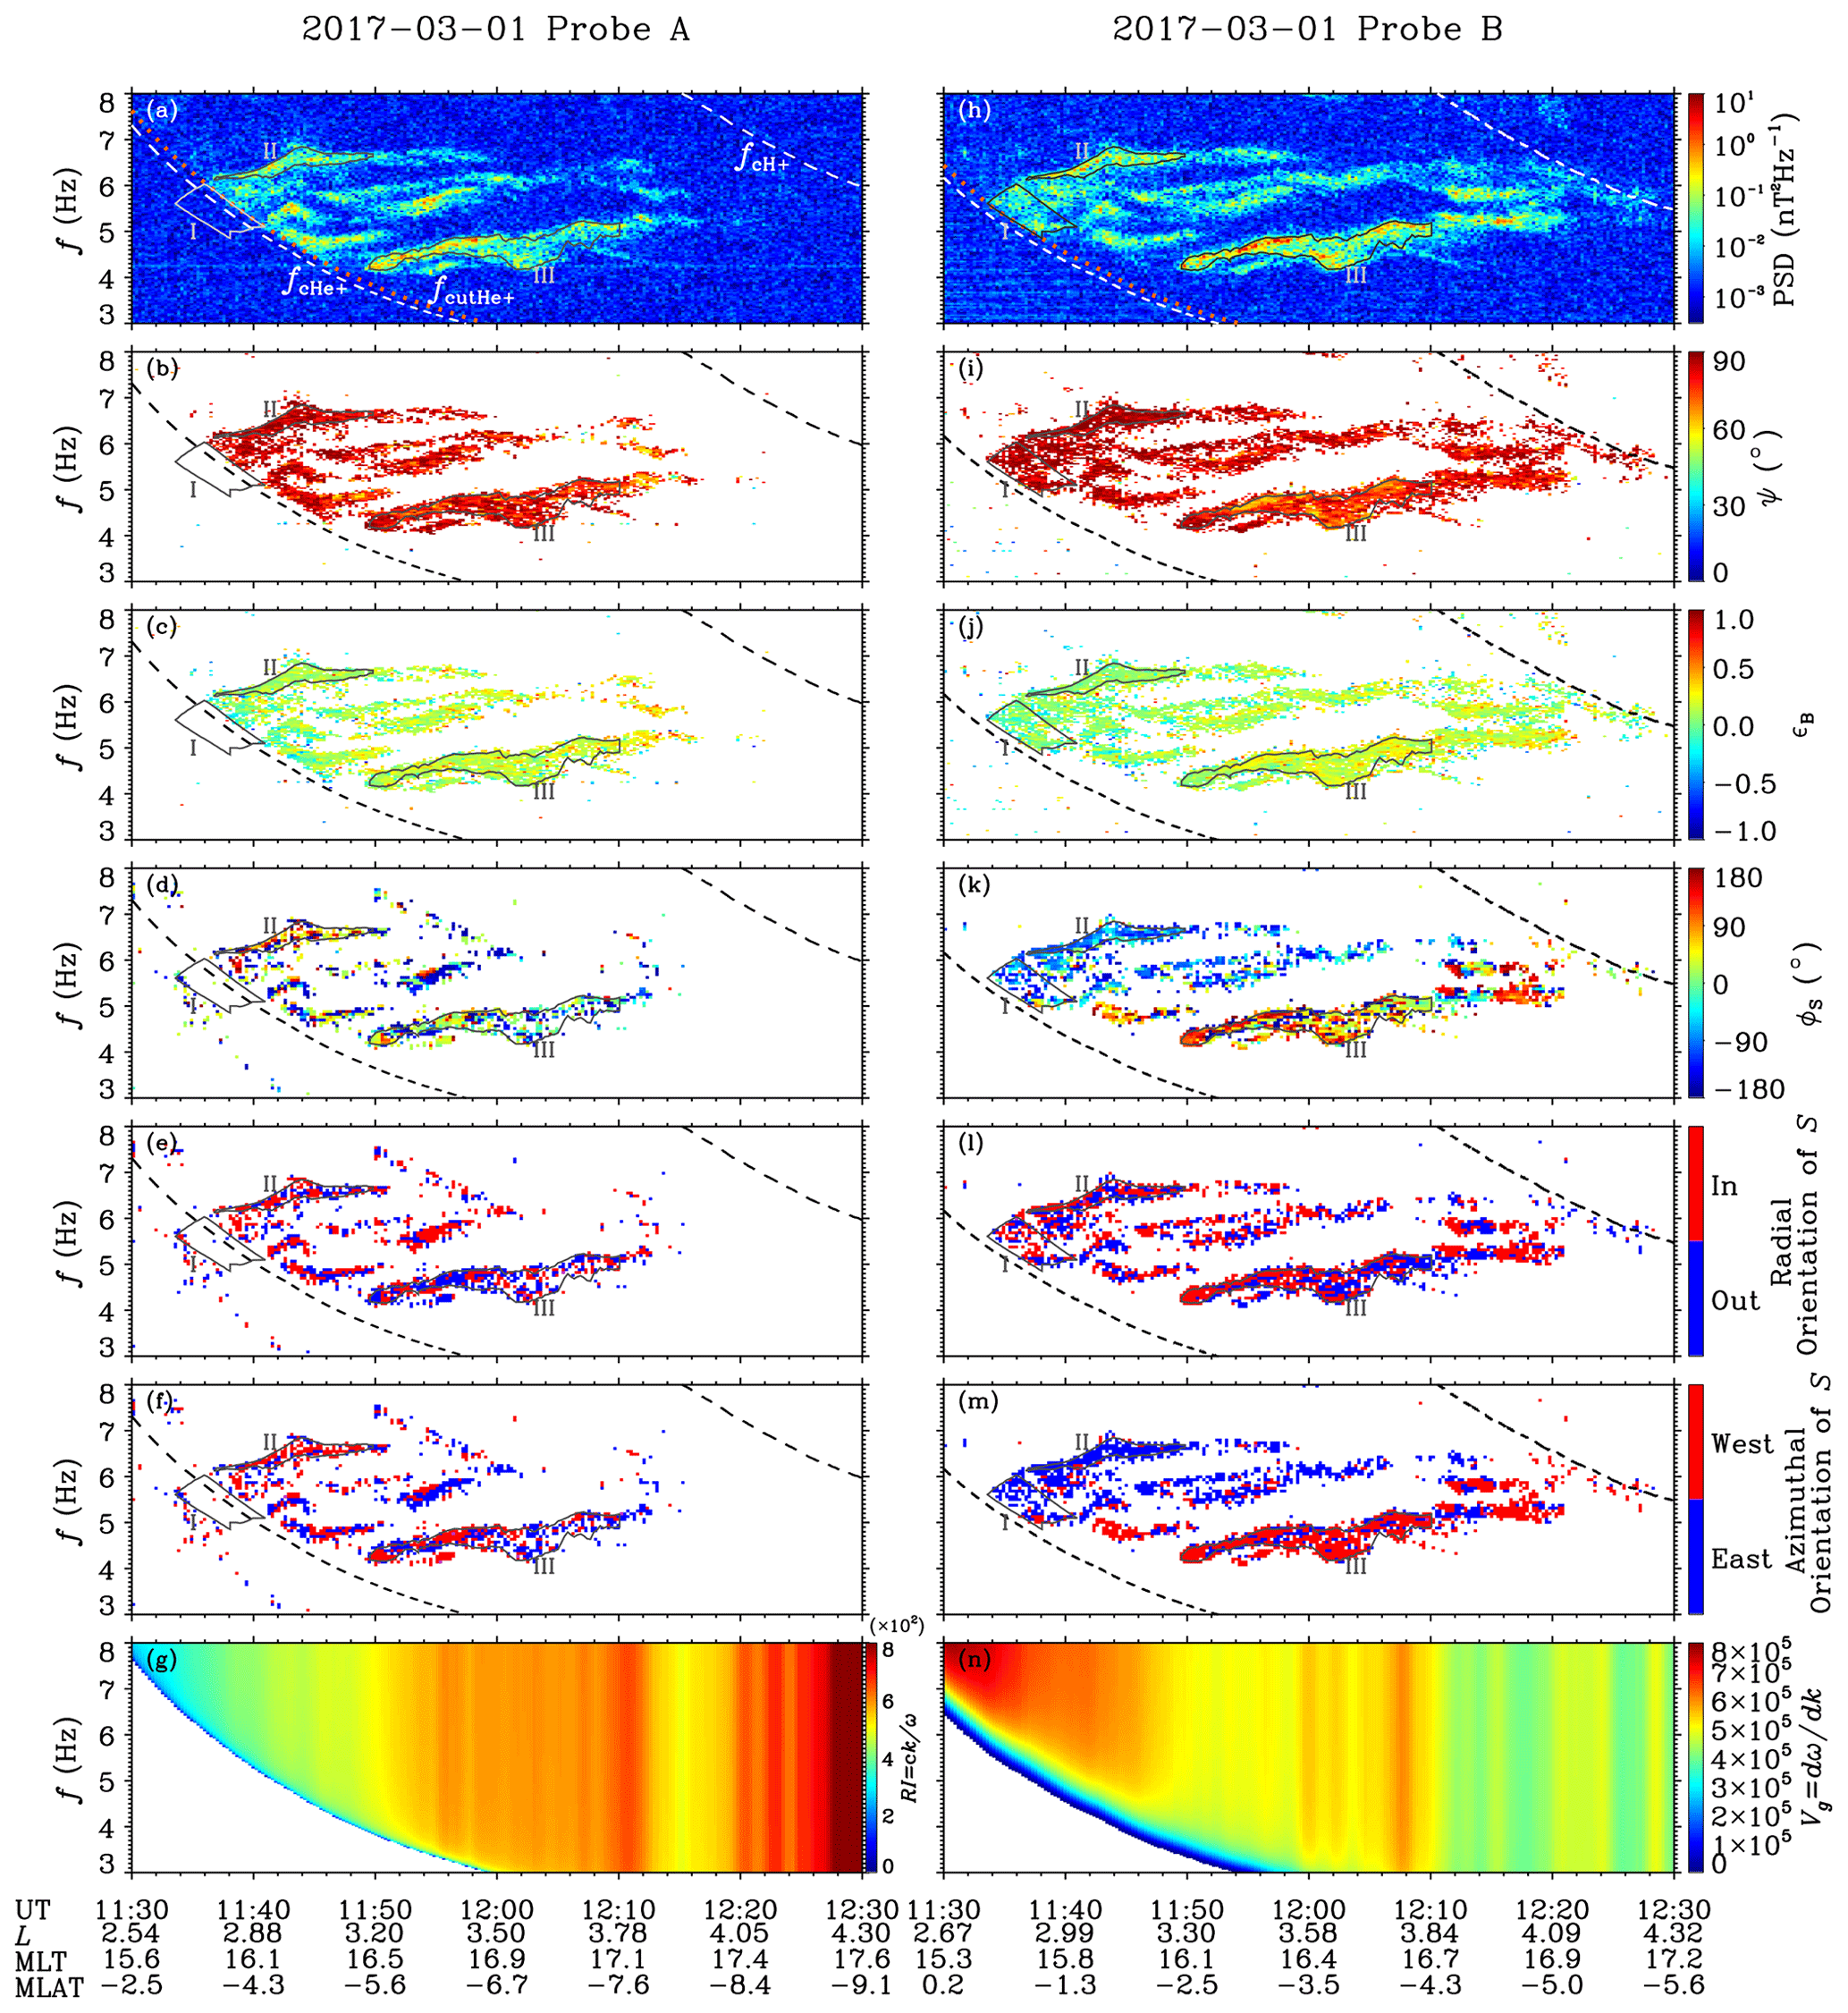
Figure 2Time–frequency distributions of wave properties. (a, h) Magnetic field power spectral density (PSD). The dotted red lines mark the lowest boundary (potential helium cutoff frequencies fcutHe+) of the visible waves. The dashed lines trace the local H+ and He+ gyrofrequencies. The grey closed curves mark the three selected regions in time–frequency domain. (b, i) Wave normal angle ψ (unifying the two field-aligned orientations). (c, j) Magnetic ellipticity ϵB. (d, k) Azimuthal angle of the Poynting flux ϕS. Angle 0∘ represents away from the Earth. The angle increases in a counterclockwise direction. (e, l) Radial orientation of the Poynting flux. (f, m) Azimuthal orientation of the Poynting flux. (g) Refractive index (RI) for the MS mode (at ). (n) Group velocity Vg for the MS mode (at ).
The main parameters of properties for the first harmonics are presented in Fig. 2. In general, the patterns of the intense waves in time–frequency domain are similar at locations of the two probes (Fig. 2a and h), indicating that the source region of the waves recorded by the two probes were approximately the same (otherwise the patterns should be significantly different). The wave normal angles ψ are larger than 60∘ (Fig. 2n and i), and the ellipticities, , are less than 0.3 (Fig. 2c and j), further confirming that they are MS waves. From Fig. 2d and k, distinct differences in the azimuthal angles of the Poynting flux ϕS can be found for waves with different frequencies, suggesting different propagation paths for these waves. To investigate the cutoff reflection, three regions are selected in the time–frequency domain.
As shown by the dotted red lines in Fig. 2a and h, there exists an obvious boundary at the lowest frequencies of the recognizable waves (PSD threshold is 10−2 nT2 Hz−1) for each probe, with a constant proportion of the local (∼0.26 times). Region I is determined by the two boundaries observed by the two probes. Within region I, the moderate waves were detected by probe B, but no signals were detected by probe A. This phenomenon was most probably a consequence of the reflection near the cutoff frequencies, i.e., near the observed boundaries. Assuming a two-ion plasma, the ion abundance ratios can therefore be estimated ( and here), and the dispersion relations can be obtained (for reasonability of this approach, please see Appendix A). The distributions of refractive index and wave group velocity are then calculated. As shown in Fig. 2g, RI decreases sharply near the predicted cutoff frequencies, which should lead to the significant deflection of the wave vector according to Snell's law. From 2n, there exists a narrow layer where Vg decreases, which will substantially restrict the wave propagation.
Regions II and III are selected, according to the obvious difference in the direction of the Poynting flux for each probe (Fig. 2d and k). For region II, most of the waves of probe A were oriented westward (Fig. 2f), while the waves of probe B were mainly oriented eastward (Fig. 2m). This suggests that the upstream waves were between the MLT of each probe. From Fig. 2e and f, some waves in region III measured by probe A exhibit prominent outward (also shown in Fig. 3a) and westward orientations, in particular during 11:50–11:52 UT and during 11:53–11:58 UT. In the meantime, the inward and westward waves dominate the signals of probe B (Fig. 2l and m). These observations suggests that the upstream waves were east of both probes, and a substantial number of waves had experienced reflection before they were captured as outward signals by probe A.
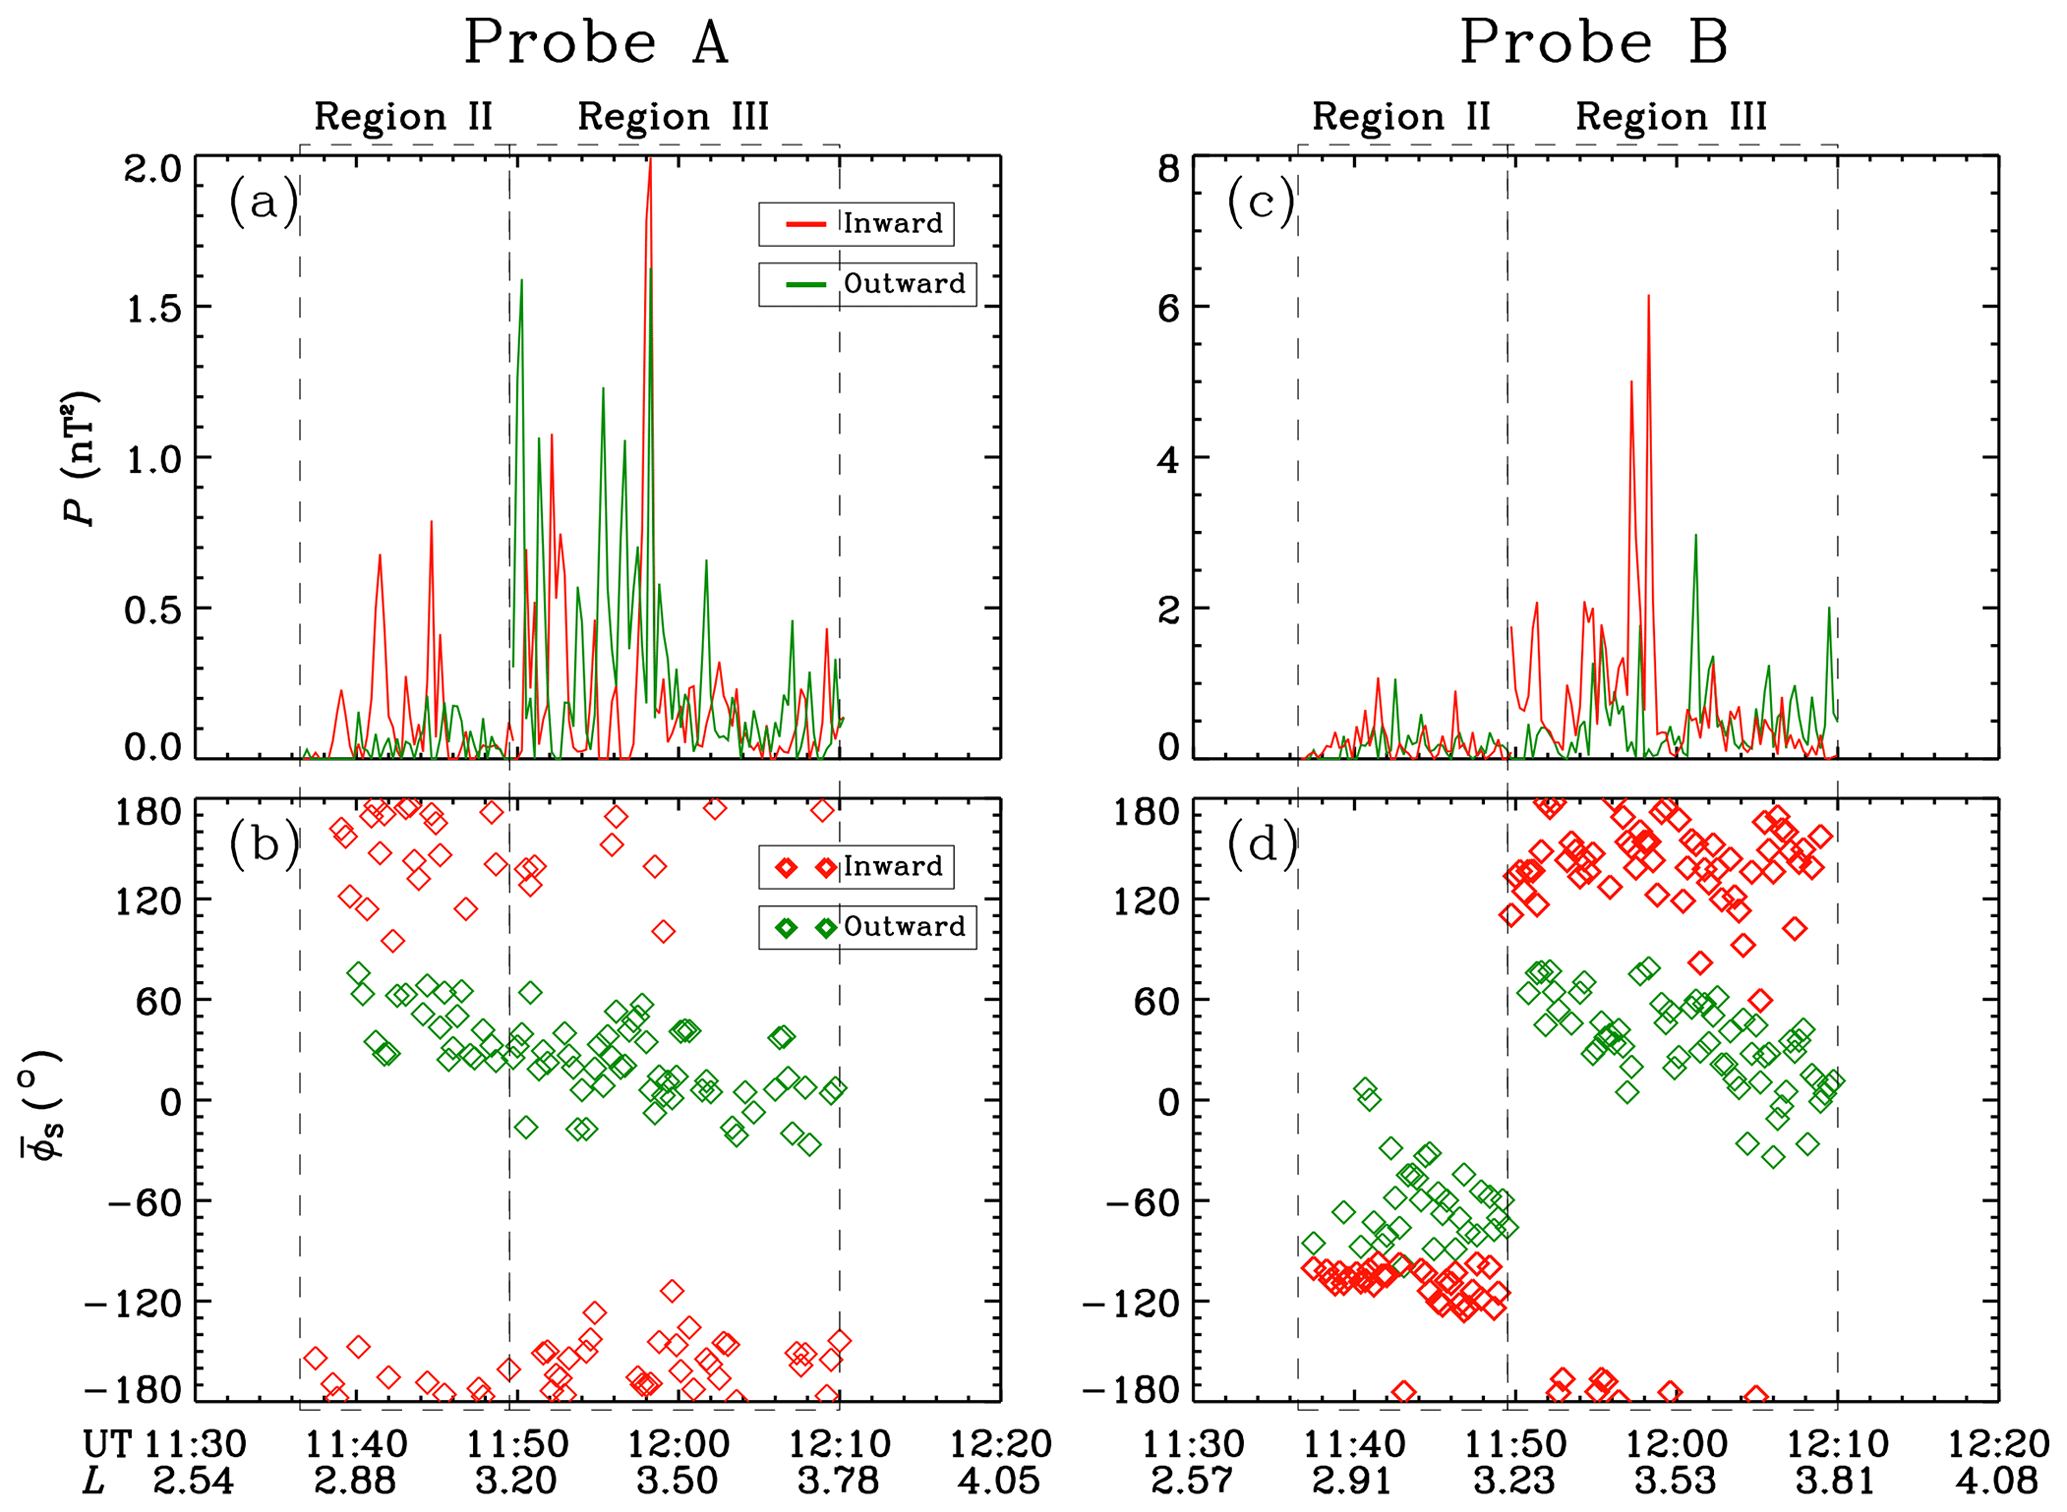
Figure 3Quantitative comparison of wave properties between probe A and probe B. (a, c) Total magnetic field power P. (b, d) Spectrum-weighted averaged azimuthal angle of Poynting flux .
The behaviors of the waves in regions II and III are analyzed quantitatively in Fig. 3. In region II, the intense inward waves of probe A have the values of (the spectrum-weighted averaged ϕS) are approximately 120–180∘, while the inward and outward waves of probe A have the values of of approximately −30 to −130∘. During most periods in the beginning of region III, probe B exhibits domination of the inward waves (–180∘) in total wave power, while the opposite results are exhibited in probe A (–60∘ for intense outward waves).
For a further demonstration of the wave reflection process, ray-tracing simulations are performed, with three assumptions for simplification. First, the rays are confined within the equatorial plane, as the waves are observed to be no higher than with . Second, two-ion plasma (H+ and He+) is considered when calculating the dispersion relation (98.5 % H+ and 1.5 % He+ here, as discussed in Sect. 3). Third, the direction of the wave vector and group velocity are treated as the same (proof in Appendix B).
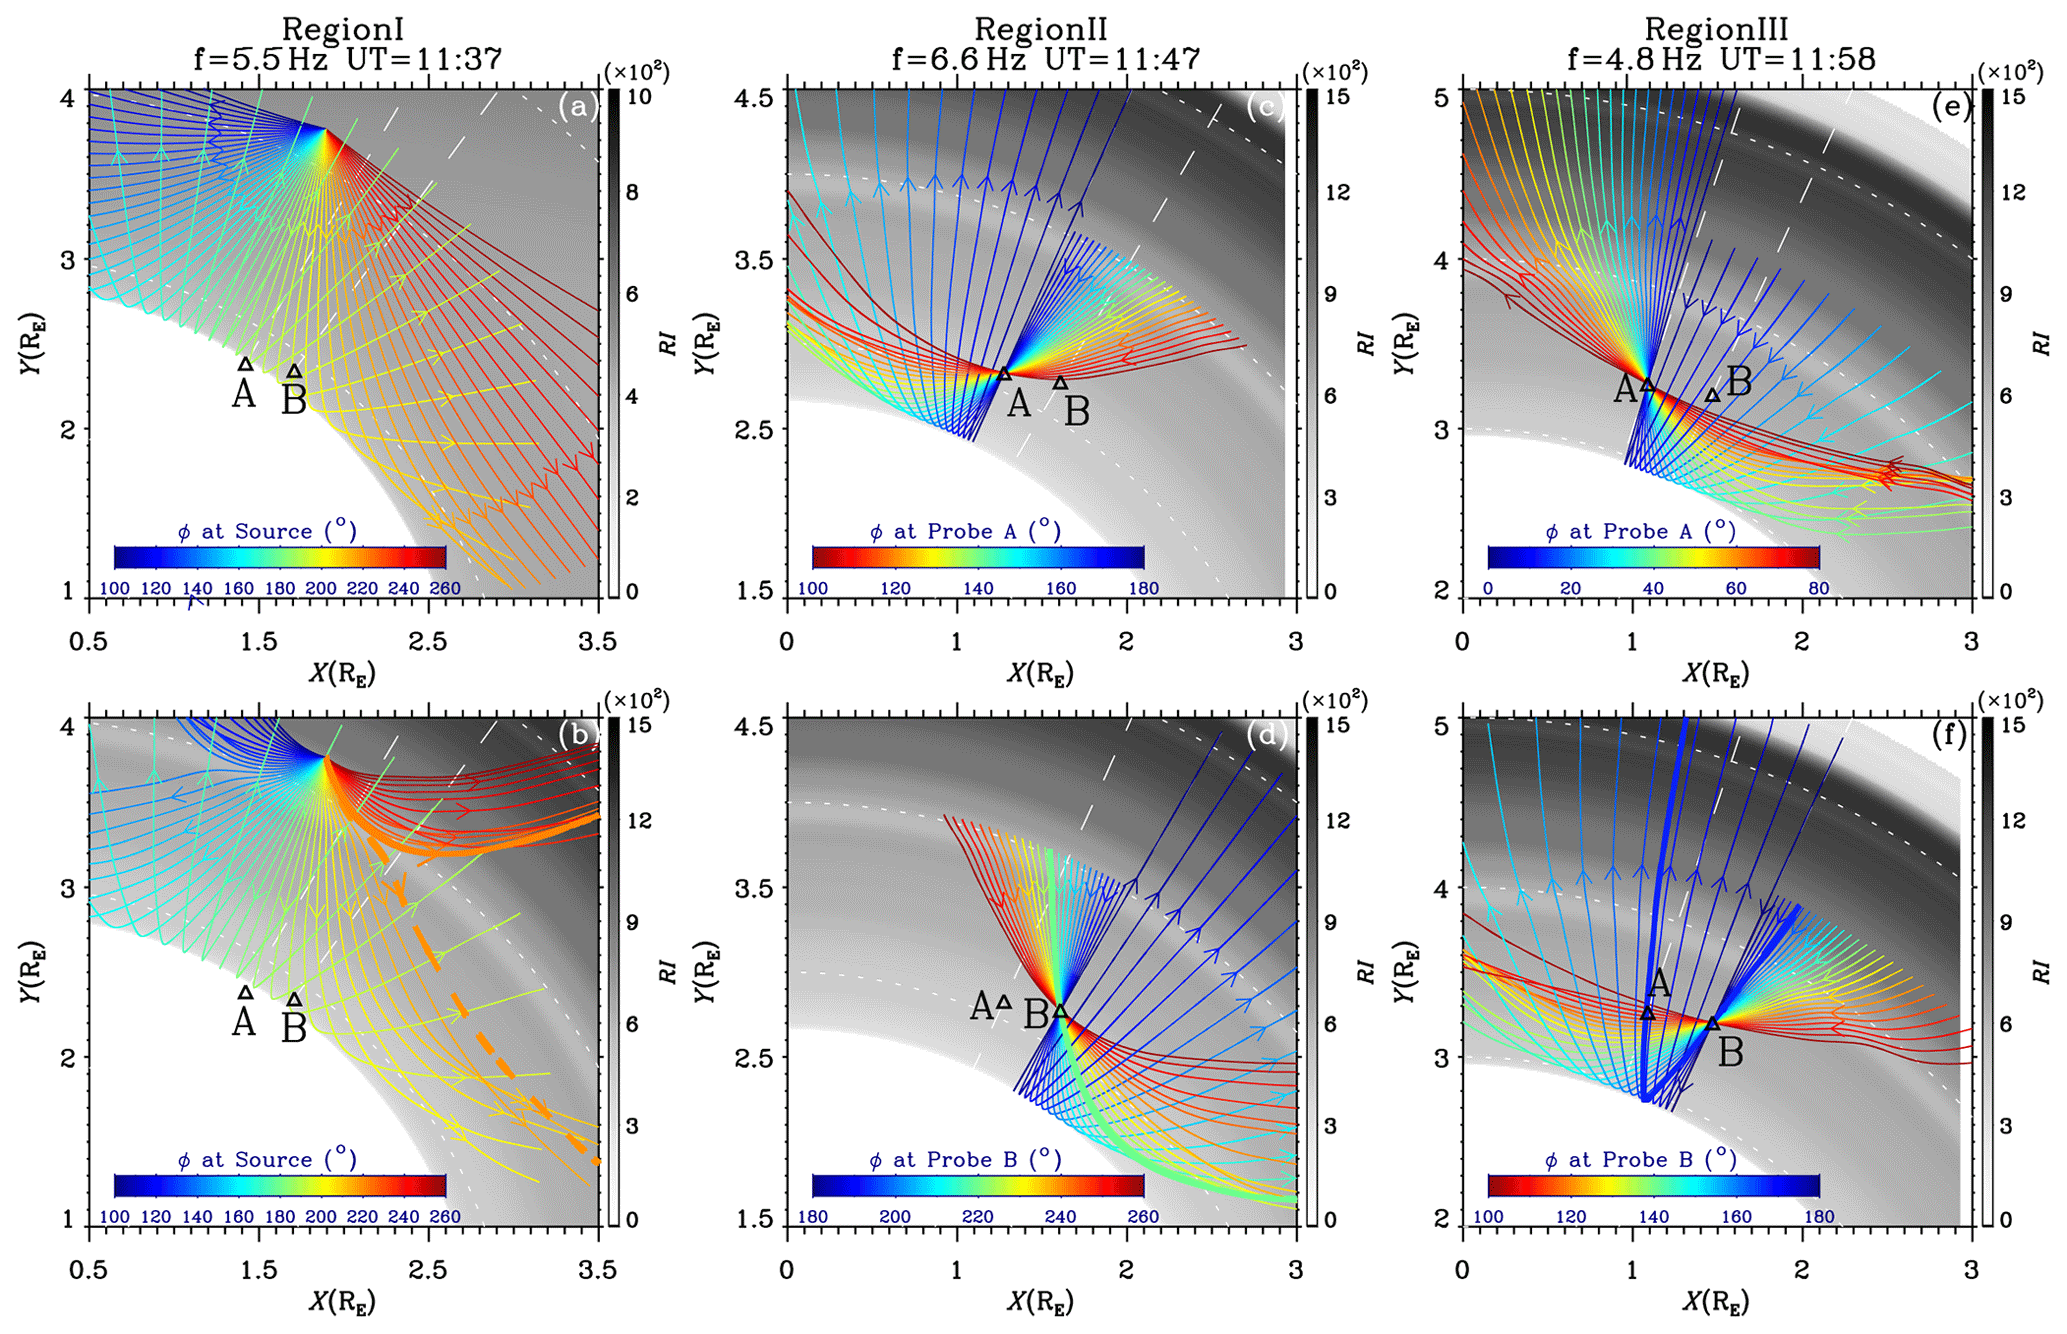
Figure 4Ray-tracing simulations in the X–Y (equatorial) plane of the SM coordinates. The left, middle and right columns show the simulations at three different points in time–frequency domain. The first two rows show the paths of the rays that (a, b) launched at a fixed source, (c, e) pass through probe A and (d, f) pass through probe B. The rainbow color bars in each panel represent the azimuthal angles of the rays at the corresponding intersection point of rays. The black–white color bars represent the refractive indexes of the background plasmas. The arrows denote the directions of the rays. Model magnetic field and density are used in (a), while the observed magnetic field and density are used in (b–f). The positions of the two probes are marked by triangles. In the second row, the thicker lines denote the selected rays which undergo analyses in Fig. 5.
The left column provides the simulations of the propagation scenario for the waves in region I. Multiple rays with different initial azimuthal angles ϕ are launched from a potential source point. The model magnetic field and density are used in the simulation in Fig. 4a, while the results using observed field and density (of probe B) are presented in Fig. 4b. In both simulations, the rays with small incident angles (approximately equivalent to the angle between ray direction and radial axis which is normal to the contour of RI) experience the sharp reflection near the cutoff frequency where the value of RI decreases to zero, while the rays with intermediate incident angles experience relatively moderate reflection with the decreasing RI which is caused by the increasing magnetic field B0. The difference between the two simulations appears for the rays with large incident angles. Two rays with obvious separation in Fig. 4b are selected and analyzed in Fig. 5a–f. As there exists a density dip structure at R∼4.0, k decreases rapidly and leads to a rapid deflection of ϕ for both rays; the ray with a relatively larger incident angle (thick solid line) is therefore reflected, while the ray with a relatively smaller incident angle (thick dashed line) does not approach before escaping from the density dip and continuing to propagate inward.
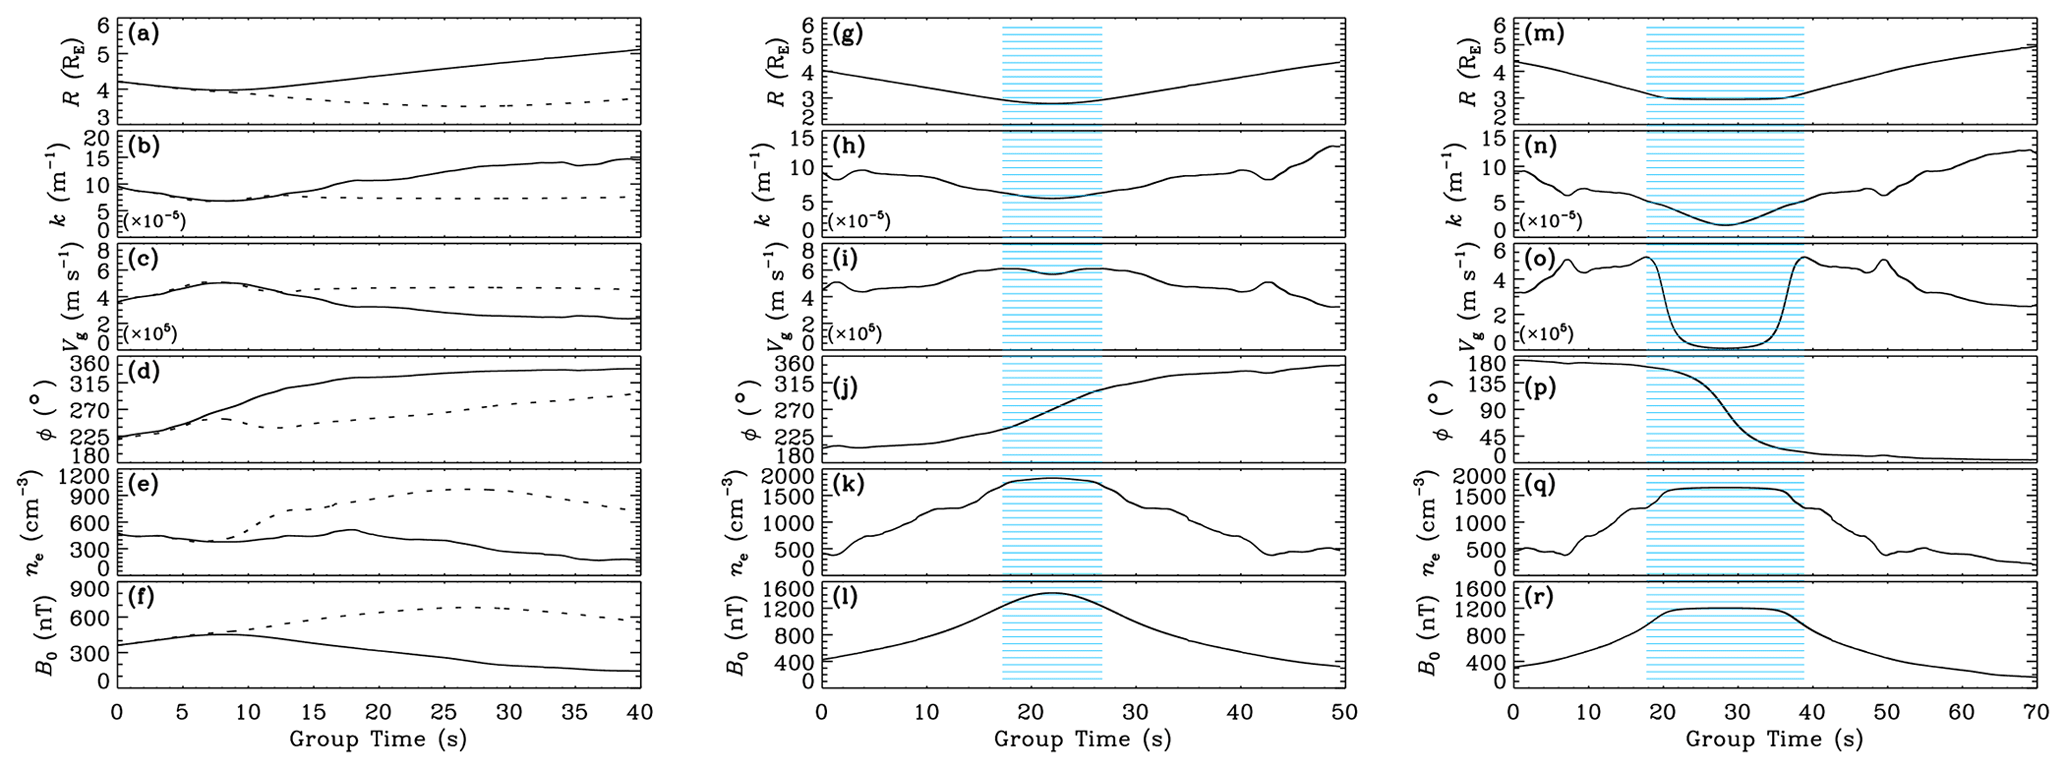
Figure 5The time series of (a, g, m) radial distance R, (b, h, n) wavenumber k, (c, i, o) group velocity Vg, (d, j, p) local azimuthal angle ϕ, (e, k, q) electron number density ne and (f, l, r) ambient magnetic field B0 for the selected rays. The blue shaded areas in (g–l) and (m–r) represent the regions of velocity drops.
The middle column of Fig. 4 provides the simulations for region II waves, using the observed B0 and ne. According to previous results, rays are reverse traced from probe A (probe B) to the east (west) to find the source, and they are forward traced from probe A (probe B) to the west (east) to reveal the reflection, as shown in Fig. 4c (Fig. 4d). Similar to the results in region I, the rays with smaller incident angles are reflected sharply near the cutoff frequency, while the rays with intermediate or large incident angles are reflected moderately in the outer position. A ray with the critical incident angle is selected (thick green line) and analyzed in Fig. 5m–r. At the beginning (group time<15 s), as B0 increases, k decreases gradually, leading to a moderate deflection of ϕ. The substantial reflection takes place at group time ∼20 s, along with the slight reduction of Vg, indicating that the ray propagates into the narrow layer where Vg decreases (Fig. 2h). From the dispersion relation (Fig. A1), Vg and k dramatically reduce with near fcutHe+, which is a typical effect near the cutoff frequency.
The reflection scenario in the simulation of region III (right column) is similar to that of region II. Comparing Fig. 4e and f, for the rays that can approach the satellite, the MLT extension of the source for the rays being reflected (Fig. 4e) is larger than that without reflection (Fig. 4f). This can explain why some outward waves measured by probe A are dominant in region III. For further revelation of the cutoff reflection process, a ray with a small incident angle (thick blue line) is analyzed in Fig. 5m–r. At the beginning (at group time<18 s), neither the variation of ne nor that of B0 deflect ϕ obviously. Vg increases with B0 as a consequence of the increasing of the slope of the dispersion curve (Fig. A1). At group time ∼18 s, the ray slows down in the region where Vg decreases (shaded region in Fig. 5m–r). Only the value of k maintains the rate of decreasing with time, leading to the reflection of ϕ, and the ray finally escapes from the region where Vg decreases after approximately 20 s.
Low-harmonic MS waves are frequently observed near the radiation belts (Balikhin et al., 2015; Boardsen et al., 2016; Teng et al., 2019) and have a potentially important dynamic influence on relativistic electrons (Maldonado et al., 2016; Yu et al., 2019). The propagation of low-harmonic MS waves is thus important as it controls the wave distribution. In the present study, the reflection of low-harmonic MS waves in the vicinity of the local two-ion cutoff frequency within the plasmasphere is studied. The results can be summarized as follows:
-
In the event on 1 March 2017, several wave patches were identified as the first harmonic MS waves. In a time–frequency region (region I) which was below the local for probe A and above local for probe B, the waves were intense for probe B but vanished for probe A. According to calculation and simulation, for waves with a certain frequency, there exists an interface in space at , where the refractive index (RI) decreases to zero, and incident waves should be reflected as a consequence of Snell's law. There also exists a spatial layer within which the group velocity decreases significantly, and the waves with small incident angles should slow down for several to tens of seconds before the reflection process completes.
-
In another time–frequency region (region III), prominent outward waves were measured by probe A, while the inward waves dominated the signals of probe B. Simulations suggested that a certain number of the outward waves recorded by probe A were previously reflected near their cutoff frequencies.
-
The results also demonstrate that there exist three factors which will lead to the decrease of RI and thus the reflection of MS waves in the plasmasphere. The structure of density dip can separate the wave paths for the waves with smaller and larger incident angles. The increase of ambient magnetic field can lead to the gradual decrease of RI and thus reflect the waves with intermediate incident angles. The waves with small incident angles can penetrate deep into the plasmasphere and be reflected near the interface of the cutoff frequency.
In region II, the azimuthal angles observed by probe B are almost perpendicular to the radial axis. The source of the rays with these angles are to the west of probe A from simulations. However, the observed upstream waves were east of probe A. This may be due to the separation of waves by the density dip along MLT in reality, similar to the mechanism in Fig. 4b.
Liu et al. (2018b) found that the multiple fine-scale density irregularities can block MS propagation. The event in the present study, however, penetrates deep into the plasmasphere, which may be because the waves are initially generated inside the plasmasphere and are not influenced by the multiple fine-scale structures. In fact, most of the waves near are actually reflected before their wavelengths (minimum λ∼300 km for the case of small incident angle according to Fig. 5n) become comparable with the scales of density irregularities (generally >0.05 RE according to Fig. 1b and f).
For the inward-propagating high-harmonic waves, with the increase in the ambient magnetic field or decrease in the plasma density, the refractive index decreases accordingly, and waves should be reflected, as studied by Chen and Thorne (2012), Ma et al. (2014) and Yuan et al. (2019). For the low harmonics, the waves propagating inward in a direction close to the radial axis are more likely to penetrate deep into the plasmasphere, and be reflected by the absolute boundary formed by the local . As the cutoff reflection of the low-harmonic MS waves should be common, these results may help to predict the global distribution of MS waves and therefore promote the understanding of wave–particle dynamics in the outer radiation belt.
Here we demonstrate the reasonability of neglecting the minor content of oxygen ion in deriving the MS mode dispersion relation. In the cold plasma, the following Stix parameters are helpful to investigate the dispersion relation (Stix, 1992):
where and are, respectively, the plasma frequency and the gyrofrequency of a particle species s.
The cutoff frequency Ωcut is the frequency where the phase velocity equals zero (Smith and Brice, 1964), and it can be obtained by setting the Stix parameter L equal to zero:
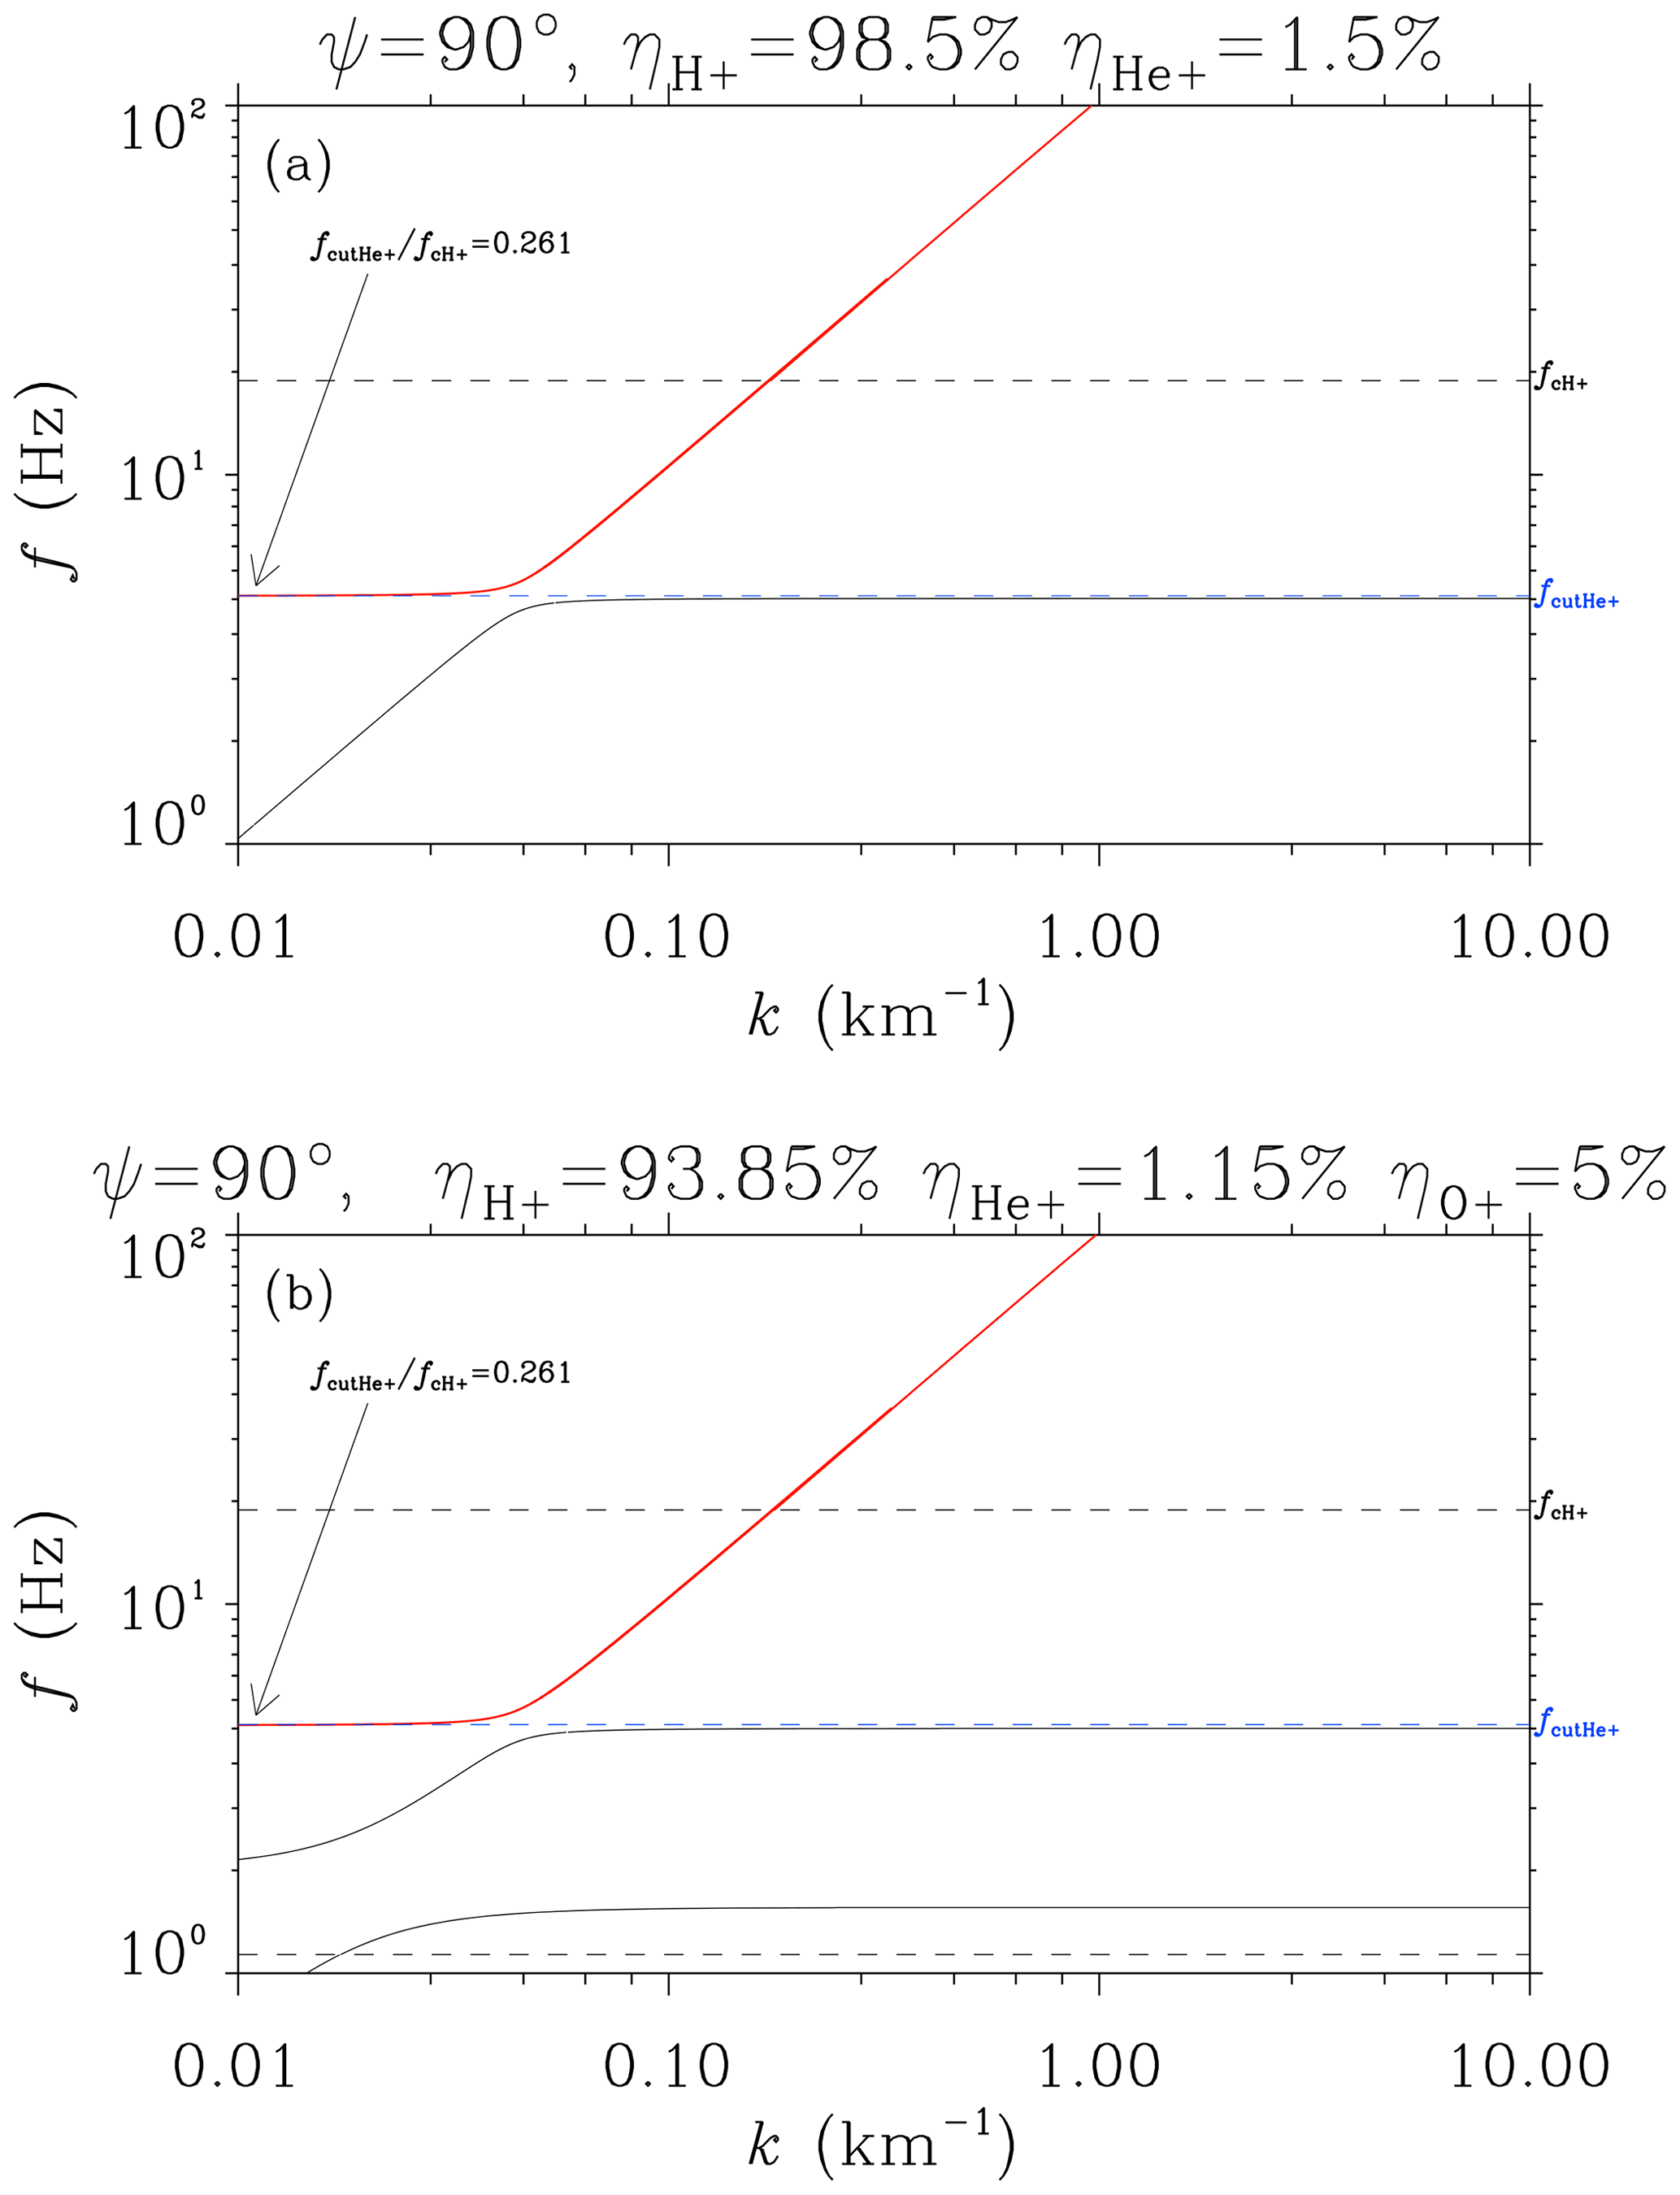
Figure A1Dispersion relations around ion gyrofrequencies for perpendicular wave mode, under the conditions of B0=1180 nT and ne=1500 cm−3. (a) The plasma contains no O+ ions. (b) The plasma contains 5 % O+ ions. For each case, the ratio of He+ cutoff frequency to H+ gyrofrequency fcutHe+/fcH+ is set to 0.261 (based on the event), and the abundance ratios of H+ and He+ are obtained accordingly. One can find that the difference in the MS mode dispersion curve (red curve) is small for the two sets of ion abundance ratios.
Considering the charge neutrality condition, the determination of full ion abundance ratios requires the values of at least two characteristic frequencies (except gyrofrequencies) to be known in H+, He+ and O+ plasma. However, if the O+ abundance ηO+ is much lower than the H+ abundance ηH+ and if the focused mode belongs to the H+ band which has a much larger frequency than the oxygen gyrofrequency ΩO+, then we have the following relations:
Therefore, if the three-ion (H+, He+ and O+) plasma is approximated as a two-ion (H+ and He+) plasma, i.e., the terms with oxygen plasma frequency ωpO+ are dropped in Eq. (A1), the Stix parameters will have only a negligible change. Under such an approximation, a group of ion abundance ratios (ηH+ and ηHe+) can be obtained by substituting the observed value of into Eq. (A2). Consequently, the approximated dispersion relations for the modes in the H+ band can be found.
Here we provide the proof that the directions of the wave vector and Poynting flux are the same for a perpendicular MS wave. In the magnetized cold plasma, the frequency for a plane wave is a function of magnetic field B0, electron density ne, wave normal angle ψ and wavenumber k:
Following Stix (1992), the group velocity can be expressed as
and the angular difference α of the two orthogonal directions can be expressed as
Here μ is the refractive index. We can express the dispersion relation in the form
where R,L and P are the Stix parameters, and . Considering a small angle β, by expanding the left side of Eq. (B4) around , and considering that for the fast magnetosonic mode branch, we can obtain the following relation:
Here . As tan α∼0 when β∼0, the direction of group velocity and wave vector are the same for the perpendicular MS waves.
The algorithms used in this work may be provided upon request via e-mail (wanggengayst@163.com).
The EMFISIS data are available from http://emfisis.physics.uiowa.edu/Flight/ (Kletzing et al., 2013), the ECT HOPE data are from http://www.RBSP-ect.lanl.gov/ (Funsten et al., 2013), the EFW data are from http://www.space.umn.edu/rbspefw-data/ (Wygant et al., 2013) and the RBSPICE data are from https://rbspgway.jhuapl.edu/Instr_RBSPICE (Mitchell et al., 2013). The magnetic field model of TS05 can be obtained from http://geo.phys.spbu.ru/~tsyganenko/modeling.html (Tsyganenko and Sitnov, 2005).
GW conceived the study and wrote the article. IZ and YS provided the estimated data of density distribution. ZG made contributions to wave analyses and ray-tracing code. All co-authors contributed to discussions and commented on the article.
The authors declare that they have no conflict of interest.
Publisher's note: Copernicus Publications remains neutral with regard to jurisdictional claims in published maps and institutional affiliations.
We appreciate EMFISIS, ECT, EFW and RBSPICE teams for the use of Van Allen Probes data. We appreciate the support of Key Laboratory of Geospace Environment, Chinese Academy of Sciences, University of Science and Technology of China. Tielong Zhang was supported by CAS Center for Excellence in Comparative Planetology.
This research has been supported by the National Natural Science Foundation of China (grant nos. 41774171, 41974205, 41774167, 41804157, 41904156, and 41904135), by the Shenzhen Science and Technology Research Program (grant no. JCYJ20180306171918617), and the Shenzhen Science and Technology Program (group no. KQTD20180410161218820).
This paper was edited by Jonathan Rae and reviewed by two anonymous referees.
Balikhin, M. A., Shprits, Y. Y., Walker, S. N., Chen, L., Cornilleau-Wehrlin, N., Dandouras, I., Santolik, O., Carr, C., Yearby, K. H., and Weiss, B.: Observations of discrete harmonics emerging from equatorial noise, Nat. Commun., 6, 7703, https://doi.org/10.1038/ncomms8703, 2015. a, b
Boardsen, S. A., Gallagher, D. L., Gurnett, D. A., Peterson, W. K., and Green, J. L.: Funnel-shaped, low-frequency equatorial waves, J. Geophys. Res., 97, 14, https://doi.org/10.1029/92JA00827, 1992. a
Boardsen, S. A., Hospodarsky, G. B., Kletzing, C. A., Engebretson, M. J., Pfaff, R. F., Wygant, J. R., Kurth, W. S., Averkamp, T. F., Bounds, S. R., Green, J. L., and De Pascuale, S.: Survey of the frequency dependent latitudinal distribution of the fast magnetosonic wave mode from Van Allen Probes Electric and Magnetic Field Instrument and Integrated Science waveform receiver plasma wave analysis, J. Geophys. Res., 121, 2902–2921, https://doi.org/10.1002/2015JA021844, 2016. a, b
Bortnik, J. and Thorne, R. M.: Transit time scattering of energetic electrons due to equatorially confined magnetosonic waves, J. Geophys. Res., 115, A07213, https://doi.org/10.1029/2010JA015283, 2010. a
Chen, L. and Thorne, R. M.: Perpendicular propagation of magnetosonic waves, Geophys. Res. Lett., 39, L14102, https://doi.org/10.1029/2012GL052485, 2012. a, b
Chen, L., Thorne, R. M., Jordanova, V. K., and Horne, R. B.: Global simulation of magnetosonic wave instability in the storm time magnetosphere, J. Geophys. Res., 115, A11222, https://doi.org/10.1029/2010JA015707, 2010a. a
Chen, L., Thorne, R. M., Jordanova, V. K., Wang, C.-P., Gkioulidou, M., Lyons, L., and Horne, R. B.: Global simulation of EMIC wave excitation during the 21 April 2001 storm from coupled RCM-RAM-HOTRAY modeling, J. Geophys. Res., 115, A07209, https://doi.org/10.1029/2009JA015075, 2010b. a, b
Chen, L., Santolík, O., Hajoš, M., Zheng, L., Zhima, Z., Heelis, R., Hanzelka, M., Horne, R. B., and Parrot, M.: Source of the low-altitude hiss in the ionosphere, Geophys. Res. Lett., 44, 2060–2069, https://doi.org/10.1002/2016GL072181, 2017. a
Curtis, S. A. and Wu, C. S.: Gyroharmonic emissions induced by energetic ions in the equatorial plasmasphere, J. Geophys. Res., 84, 2597–2607, https://doi.org/10.1029/JA084iA06p02597, 1979. a
Fu, H. S., Cao, J. B., Zhima, Z., Khotyaintsev, Y. V., Angelopoulos, V., Santolík, O., Omura, Y., Taubenschuss, U., Chen, L., and Huang, S. Y.: First observation of rising-tone magnetosonic waves, Geophys. Res. Lett., 41, 7419–7426, https://doi.org/10.1002/2014GL061867, 2014. a
Funsten, H. O., Skoug, R. M., Guthrie, A. A., MacDonald, E. A., Baldonado, J. R., Harper, R. W., Henderson, K. C., Kihara, K. H., Lake, J. E., Larsen, B. A., Puckett, A. D., Vigil, V. J., Friedel, R. H., Henderson, M. G., Niehof, J. T., Reeves, G. D., Thomsen, M. F., Hanley, J. J., George, D. E., Jahn, J.-M., Cortinas, S., De Los Santos, A., Dunn, G., Edlund, E., Ferris, M., Freeman, M., Maple, M., Nunez, C., Taylor, T., Toczynski, W., Urdiales, C., Spence, H. E., Cravens, J. A., Suther, L. L., and Chen, J.: Helium, Oxygen, Proton, and Electron (HOPE) Mass Spectrometer for the Radiation Belt Storm Probes Mission, Space. Sci. Rev., 179, 423–484, https://doi.org/10.1007/s11214-013-9968-7, 2013 (data available at: http://www.RBSP-ect.lanl.gov/, last access: 3 July 2021). a, b
Gary, S. P., Liu, K., Winske, D., and Denton, R. E.: Ion Bernstein instability in the terrestrial magnetosphere: Linear dispersion theory, J. Geophys. Res., 115, A12209, https://doi.org/10.1029/2010JA015965, 2010. a
Gulelmi, A. V., Klaine, B. I., and Potapov, A. S.: Excitation of magnetosonic waves with discrete spectrum in the equatorial vicinity of the plasmapause, Planet. Space Sci., 23, 279–286, https://doi.org/10.1016/0032-0633(75)90133-6, 1975. a
Gurnett, D. A.: Plasma wave interactions with energetic ions near the magnetic equator, J. Geophys. Res., 81, 2765, https://doi.org/10.1029/JA081i016p02765, 1976. a
Gurnett, D. A. and Burns, T. B.: The low-frequency cutoff of ELf emissions, J. Geophys. Res., 73, 7437–7445, https://doi.org/10.1029/JA073i023p07437, 1968. a
Horne, R. B.: Path-integrated growth of electrostatic waves: The generation of terrestrial myriametric radiation, J. Geophys. Res., 94, 8895–8909, https://doi.org/10.1029/JA094iA07p08895, 1989. a
Horne, R. B., Thorne, R. M., Glauert, S. A., Meredith, N. P., Pokhotelov, D., and Santolík, O.: Electron acceleration in the Van Allen radiation belts by fast magnetosonic waves, Geophys. Res. Lett., 34, L17 107, https://doi.org/10.1029/2007GL030267, 2007. a
Kennel, C.: Low-Frequency Whistler Mode, Phys. Fluids, 9, 2190–2202, https://doi.org/10.1063/1.1761588, 1966. a
Kistler, L. M., Mouikis, C. G., Spence, H. E., Menz, A. M., Skoug, R. M., Funsten, H. O., Larsen, B. A., Mitchell, D. G., Gkioulidou, M., Wygant, J. R., and Lanzerotti, L. J.: The source of O+ in the storm time ring current, J. Geophys. Res., 121, 5333–5349, https://doi.org/10.1002/2015JA022204, 2016. a
Kletzing, C. A., Kurth, W. S., Acuna, M., MacDowall, R. J., Torbert, R. B., Averkamp, T., Bodet, D., Bounds, S. R., Chutter, M., Connerney, J., Crawford, D., Dolan, J. S., Dvorsky, R., Hospodarsky, G. B., Howard, J., Jordanova, V., Johnson, R. A., Kirchner, D. L., Mokrzycki, B., Needell, G., Odom, J., Mark, D., Pfaff, R., Phillips, J. R., Piker, C. W., Remington, S. L., Rowland, D., Santolik, O., Schnurr, R., Sheppard, D., Smith, C. W., Thorne, R. M., and Tyler, J.: The Electric and Magnetic Field Instrument Suite and Integrated Science (EMFISIS) on RBSP, Space. Sci. Rev., 179, 127–181, https://doi.org/10.1007/s11214-013-9993-6, 2013 (data available at: http://emfisis.physics.uiowa.edu/Flight/, last access: 3 July 2021). a, b
Kurth, W. S., De Pascuale, S., Faden, J. B., Kletzing, C. A., Hospodarsky, G. B., Thaller, S., and Wygant, J. R.: Electron densities inferred from plasma wave spectra obtained by the Waves instrument on Van Allen Probes, J. Geophys. Res., 120, 904–914, https://doi.org/10.1002/2014JA020857, 2015. a
Laakso, H., Junginger, H., Schmidt, R., Roux, A., and de Villedary, C.: Magnetosonic waves above fc(H+) at geostationary orbit: GEOS 2 results, J. Geophys. Res., 95, 10609–10621, https://doi.org/10.1029/JA095iA07p10609, 1990. a
Lei, M., Xie, L., Li, J., Pu, Z., Fu, S., Ni, B., Hua, M., Chen, L., and Li, W.: The Radiation Belt Electron Scattering by Magnetosonic Wave: Dependence on Key Parameters, J. Geophys. Res., 122, 12338–12352, https://doi.org/10.1002/2016JA023801, 2017. a
Li, J., Bortnik, J., Thorne, R. M., Li, W., Ma, Q., Baker, D. N., Reeves, G. D., Fennell, J. F., Spence, H. E., Kletzing, C. A., Kurth, W. S., Hospodarsky, G. B., Angelopoulos, V., and Blake, J. B.: Ultrarelativistic electron butterfly distributions created by parallel acceleration due to magnetosonic waves, J. Geophys. Res., 121, 3212–3222, https://doi.org/10.1002/2016JA022370, 2016a. a
Li, J., Ni, B., Ma, Q., Xie, L., Pu, Z., Fu, S., Thorne, R. M., Bortnik, J., Chen, L., Li, W., Baker, D. N., Kletzing, C. A., Kurth, W. S., Hospodarsky, G. B., Fennell, J. F., Reeves, G. D., Spence, H. E., Funsten, H. O., and Summers, D.: Formation of energetic electron butterfly distributions by magnetosonic waves via Landau resonance, Geophys. Res. Lett., 43, 3009–3016, https://doi.org/10.1002/2016GL067853, 2016b. a
Liu, K., Gary, S. P., and Winske, D.: Excitation of magnetosonic waves in the terrestrial magnetosphere: Particle-in-cell simulations, J. Geophys. Res., 116, A07212, https://doi.org/10.1029/2010JA016372, 2011. a
Liu, N., Su, Z., Zheng, H., Wang, Y., and Wang, S.: Prompt Disappearance and Emergence of Radiation Belt Magnetosonic Waves Induced by Solar Wind Dynamic Pressure Variations, Geophys. Res. Lett., 45, 585–594, https://doi.org/10.1002/2017GL076382, 2018a. a, b
Liu, X., Chen, L., Yang, L., Xia, Z., and Malaspina, D. M.: One-Dimensional Full Wave Simulation of Equatorial Magnetosonic Wave Propagation in an Inhomogeneous Magnetosphere, J. Geophys. Res., 123, 587–599, https://doi.org/10.1002/2017JA024336, 2018b. a, b
Ma, Q., Li, W., Chen, L., Thorne, R. M., Kletzing, C. A., Kurth, W. S., Hospodarsky, G. B., Reeves, G. D., Henderson, M. G., and Spence, H. E.: The trapping of equatorial magnetosonic waves in the Earth's outer plasmasphere, Geophys. Res. Lett., 41, 6307–6313, https://doi.org/10.1002/2014GL061414, 2014. a, b
Maldonado, A. A., Chen, L., Claudepierre, S. G., Bortnik, J., Thorne, R. M., and Spence, H.: Electron butterfly distribution modulation by magnetosonic waves, Geophys. Res. Lett., 43, 3051–3059, https://doi.org/10.1002/2016GL068161, 2016. a
Mauk, B. H., Fox, N. J., Kanekal, S. G., Kessel, R. L., Sibeck, D. G., and Ukhorskiy, A.: Science Objectives and Rationale for the Radiation Belt Storm Probes Mission, Space. Sci. Rev., 179, 3–27, https://doi.org/10.1007/s11214-012-9908-y, 2013. a
Min, K., Takahashi, K., Ukhorskiy, A. Y., Manweiler, J. W., Spence, H. E., Singer, Howard, J., Claudepierre, S. G., Larsen, B. A., Soto-Chavez, A. R., and Cohen, R. J.: Second harmonic poloidal waves observed by Van Allen Probes in the dusk-midnight sector, J. Geophys. Res., 122, 3013–3039, https://doi.org/10.1002/2016JA023770, 2017. a
Min, K., Liu, K., Wang, X., Chen, L., and Denton, R. E.: Fast Magnetosonic Waves Observed by Van Allen Probes: Testing Local Wave Excitation Mechanism, J. Geophys. Res., 123, 497–512, https://doi.org/10.1002/2017JA024867, 2018. a
Mitchell, D. G., Lanzerotti, L. J., Kim, C. K., Stokes, M., Ho, G., Cooper, S., Ukhorskiy, A., Manweiler, J. W., Jaskulek, S., Haggerty, D. K., Brand t, P., Sitnov, M., Keika, K., Hayes, J. R., Brown, L. E., Gurnee, R. S., Hutcheson, J. C., Nelson, K. S., Paschalidis, N., Rossano, E., and Kerem, S.: Radiation Belt Storm Probes Ion Composition Experiment (RBSPICE), Space Sci. Rev., 179, 263–308, https://doi.org/10.1007/s11214-013-9965-x, 2013 (data available at: https://rbspgway.jhuapl.edu/Instr_RBSPICE, last access: 3 July 2021). a, b
Němec, F., Santolík, O., Gereová, K., Macúšová, E., de Conchy, Y., and Cornilleau-Wehrlin, N.: Initial results of a survey of equatorial noise emissions observed by the Cluster spacecraft, Planet. Space Sci., 53, 291–298, https://doi.org/10.1016/j.pss.2004.09.055, 2005. a
Perraut, S., Roux, A., Robert, P., Gendrin, R., Sauvaud, J. A., Bosqued, J. M., Kremser, G., and Korth, A.: A systematic study of ULF waves above from GEOS 1 and 2 measurements and their relationships with proton ring distributions, J. Geophys. Res., 87, 6219–6236, https://doi.org/10.1029/JA087iA08p06219, 1982. a
Posch, J. L., Engebretson, M. J., Olson, C. N., Thaller, S. A., Breneman, A. W., Wygant, J. R., Boardsen, S. A., Kletzing, C. A., Smith, C. W., and Reeves, G. D.: Low-harmonic magnetosonic waves observed by the Van Allen Probes, J. Geophys. Res., 120, 6230–6257, https://doi.org/10.1002/2015JA021179, 2015. a
Russell, C. T., Holzer, R. E., and Smith, E. J.: OGO 3 observations of ELF noise in the magnetosphere. 2. The nature of the equatorial noise., J. Geophys. Res., 75, 755–768, https://doi.org/10.1029/JA075i004p00755, 1970. a
Santolík, O. and Parrot, M.: Case studies on the wave propagation and polarization of ELF emissions observed by Freja around the local proton gyrofrequency, J. Geophys. Res., 104, 2459–2476, https://doi.org/10.1029/1998JA900045, 1999. a
Santolík, O., Pickett, J. S., Gurnett, D. A., Maksimovic, M., and Cornilleau-Wehrlin, N.: Spatiotemporal variability and propagation of equatorial noise observed by Cluster, J. Geophys. Res., 107, 1495, https://doi.org/10.1029/2001JA009159, 2002. a
Santolík, O., Parrot, M., and Lefeuvre, F.: Singular value decomposition methods for wave propagation analysis, Radio Sci., 38, 1010, https://doi.org/10.1029/2000RS002523, 2003. a
Santolík, O., Pickett, J. S., Gurnett, D. A., Menietti, J. D., Tsurutani, B. T., and Verkhoglyadova, O.: Survey of Poynting flux of whistler mode chorus in the outer zone, J. Geophys. Res., 115, A00F13, https://doi.org/10.1029/2009JA014925, 2010. a
Santolík, O., Parrot, M., and Němec, F.: Propagation of equatorial noise to low altitudes: Decoupling from the magnetosonic mode, Geophys. Res. Lett., 43, 6694–6704, https://doi.org/10.1002/2016GL069582, 2016. a
Shprits, Y. Y.: Estimation of bounce resonant scattering by fast magnetosonic waves, Geophys. Res. Lett., 43, 998–1006, https://doi.org/10.1002/2015GL066796, 2016. a
Smith, R. and Brice, N.: Propagation in multicomponent plasmas, J. Geophys. Res., 69, 5029–5040, 1964. a, b
Stix, T. H.: Waves in Plasmas, American Institute of Physics, New York, 1992. a, b, c
Su, Z., Wang, G., Liu, N., Zheng, H., Wang, Y., and Wang, S.: Direct observation of generation and propagation of magnetosonic waves following substorm injection, Geophys. Res. Lett., 44, 7587–7597, https://doi.org/10.1002/2017GL074362, 2017. a
Su, Z., Liu, N., Zheng, H., Wang, Y., and Wang, S.: Large-Amplitude Extremely Low Frequency Hiss Waves in Plasmaspheric Plumes, Geophys. Res. Lett., 45, 565–577, https://doi.org/10.1002/2017GL076754, 2018. a
Summers, D. and Ma, C.: Rapid acceleration of electrons in the magnetosphere by fast-mode MHD waves, J. Geophys. Res., 105, 15887–15896, https://doi.org/10.1029/1999JA000408, 2000. a
Tao, X. and Li, X.: Theoretical bounce resonance diffusion coefficient for waves generated near the equatorial plane, Geophys. Res. Lett., 43, 7389–7397, https://doi.org/10.1002/2016GL070139, 2016. a
Teng, S., Li, W., Tao, X., Ma, Q., and Shen, X.: Characteristics and Generation of Low-Frequency Magnetosonic Waves Below the Proton Gyrofrequency, Geophys. Res. Lett., 46, 11652–11660, https://doi.org/10.1029/2019GL085372, 2019. a, b
Tsyganenko, N. A. and Sitnov, M. I.: Modeling the dynamics of the inner magnetosphere during strong geomagnetic storms, J. Geophys. Res., 110, A03208, https://doi.org/10.1029/2004JA010798, 2005 (data available at: http://geo.phys.spbu.ru/~tsyganenko/modeling.html, last access: 3 July 2021). a, b
Wang, G., Zhang, T. L., Gao, Z. L., Wu, M. Y., Wang, G. Q., and Schmid, D.: Propagation of EMIC Waves Inside the Plasmasphere: A Two-Event Study, J. Geophys. Res., 124, 8396–8415, https://doi.org/10.1029/2019JA027055, 2019. a
Wygant, J. R., Bonnell, J. W., Goetz, K., Ergun, R. E., Mozer, F. S., Bale, S. D., Ludlam, M., Turin, P., Harvey, P. R., Hochmann, R., Harps, K., Dalton, G., McCauley, J., Rachelson, W., Gordon, D., Donakowski, B., Shultz, C., Smith, C., Diaz-Aguado, M., Fischer, J., Heavner, S., Berg, P., Malsapina, D. M., Bolton, M. K., Hudson, M., Strangeway, R. J., Baker, D. N., Li, X., Albert, J., Foster, J. C., Chaston, C. C., Mann, I., Donovan, E., Cully, C. M., Cattell, C. A., Krasnoselskikh, V., Kersten, K., Brenneman, A., and Tao, J. B.: The Electric Field and Waves Instruments on the Radiation Belt Storm Probes Mission, Space. Sci. Rev., 179, 183–220, https://doi.org/10.1007/s11214-013-0013-7, 2013 (data available at: http://www.space.umn.edu/rbspefw-data/, last access: 3 July 2021). a, b
Xiao, F., Yang, C., Su, Z., Zhou, Q., He, Z., He, Y., Baker, D. N., Spence, H. E., Funsten, H. O., and Blake, J. B.: Wave-driven butterfly distribution of Van Allen belt relativistic electrons, Nat. Commun., 6, 8590, https://doi.org/10.1038/ncomms9590, 2015. a
Yang, C., Su, Z., Xiao, F., Zheng, H., Wang, Y., Wang, S., Spence, H. E., Reeves, G. D., Baker, D. N., Blake, J. B., and Funsten, H. O.: A positive correlation between energetic electron butterfly distributions and magnetosonic waves in the radiation belt slot region, Geophys. Res. Lett., 44, 3980–3990, https://doi.org/10.1002/2017GL073116, 2017. a
Yu, J., Li, L. Y., Cui, J., Cao, J. B., and Wang, J.: Effect of Low-Harmonic Magnetosonic Waves on the Radiation Belt Electrons Inside the Plasmasphere, J. Geophys. Res., 124, 3390–3401, https://doi.org/10.1029/2018JA026328, 2019. a
Yuan, Z., Yu, X., Ouyang, Z., Yao, F., Huang, S., and Funsten, H. O.: Simultaneous trapping of EMIC and MS waves by background plasmas, J. Geophys. Res., 124, 1635–1643, https://doi.org/10.1029/2018JA026149, 2019. a, b
Zhelavskaya, I. S., Spasojevic, M., Shprits, Y. Y., and Kurth, W. S.: Automated determination of electron density from electric field measurements on the Van Allen Probes spacecraft, J. Geophys. Res., 121, 4611–4625, https://doi.org/10.1002/2015JA022132, 2016. a
Zhelavskaya, I. S., Shprits, Y. Y., and Spasojević, M.: Empirical Modeling of the Plasmasphere Dynamics Using Neural Networks, J. Geophys. Res., 122, 11227–11244, https://doi.org/10.1002/2017JA024406, 2017. a
Zou, Z., Zuo, P., Ni, B., Wei, F., Zhao, Z., Cao, X., Fu, S., and Gu, X.: Wave Normal Angle Distribution of Fast Magnetosonic Waves: A Survey of Van Allen Probes EMFISIS Observations, J. Geophys. Res., 124, 5663–5674, https://doi.org/10.1029/2019JA026556, 2019. a