the Creative Commons Attribution 4.0 License.
the Creative Commons Attribution 4.0 License.
 | 17 Dec 2020
Diurnal mesospheric tidal winds observed simultaneously by meteor radars in Costa Rica (10° N, 86° W) and Brazil (7° S, 37° W)
Wayne Hocking
Paulo P. Batista
Igo Paulino
Ana R. Paulino
Marcial Garbanzo-Salas
Barclay Clemesha
Amauri F. Medeiros
This paper presents a study of diurnal tidal winds observed simultaneously by two meteor radars located on each side of the Equator in the equatorial region. The radars were located in Santa Cruz, Costa Rica (10.3∘ N, 85.6∘ W) (hereafter CR) and São João do Cariri, Brazil (7.4∘ S, 36.5∘ W) (hereafter CA). The distance between the sites is 5800 km. Harmonic analysis has been used to obtain amplitudes and phases (hour of peak amplitude) for diurnal, semidiurnal and terdiurnal tides between 82 and 98 km altitude, but in this work we concentrate on the diurnal component. The period of observation was from April 2005 to January 2006. The results were compared to the Global Scale Waves Model (GSWM-09). Magnitudes of zonal and meridional amplitudes from November to January for CR were quite different from the predictions of the model. Concerning phases, the agreement between model and radar meridional tidal phases at each site was good, and a vertical wavelength of 24 km for the diurnal tide was observed practically every month, although on some occasions determination of the vertical wavelength was difficult, especially for the zonal component, due to nonlinear phase variations with height. For the diurnal zonal amplitude, there were notable differences between the two sites. We attribute this site-to-site difference of the diurnal zonal amplitude to the nonmigrating component of the tide and propose that an anomaly was present in the troposphere in the winter (Northern Hemisphere) of 2005–2006 which produced substantial longitudinal variation.
- Article
(3754 KB) - Full-text XML
- BibTeX
- EndNote


Atmospheric tides are driven principally by solar heating, which results in significant day–night differential heating; they are dynamically very dominant at mesospheric and lower thermospheric heights. Thermal excitation due to absorption of solar radiation by water vapor (at infrared wavelengths) and ozone (at ultraviolet wavelengths), coupled with latent heat release due to deep convection at low altitudes, results in expansion and contraction of atmospheric pressure/density fields, creating modes of oscillation with very well-defined characteristics. Such oscillations are particularly easy to observe in the lower thermosphere through their impact on wind fields, temperature, airglow and ionospheric parameters (e.g., Taylor et al., 1999; Buriti et al., 2005; Forbes et al., 2008). Because of this, tides are very important to the ionosphere–thermosphere system. Linear and nonlinear interactions between solar atmospheric tides, gravity waves, and planetary waves have been studied, aiming at a better description of the dynamics of the atmosphere from low to high altitudes (e.g., Garcia and Solomon, 1985; Teitelbaum et al., 1989; Meyer, 1999, Thayaparan et al., 1995). The classical theory of tides is moderately well established, but it neglects, for example, mechanical forcing and dissipation and considers the atmosphere horizontally stratified and isothermal. Many issues about interaction, excitation and temporal variability require further understanding. Those two mechanisms, forcing and dissipation, drive migrating and nonmigrating tides and are, basically, dependent on how the solar radiation heats the planet, which in turn is dependent on seasonality and the distribution of the ocean and continental plates on the Earth's surface. This makes the global heating different for the two hemispheres. A complete description of the forcing is very complex, because many others parameters and mechanisms must be included to describe realistically the dynamics of the atmosphere. In some cases, tides in the wind fields observed by various methods (including meteor radar) show good agreement with the Global Scale Wave Model (GSWM) (Hagan and Forbes, 2002, 2003; Yuan et al., 2006; Ward et al., 2010; Chang, et al., 2012,). Previous studies of tides in the equatorial region have shown that, in the altitude-range between 82 and 98 km, the diurnal (24 h period) amplitude is generally more significant than the semidiurnal mode for both zonal and meridional components (Buriti, et al., 2008; Davis et al., 2013). Tides also have a dependence on altitude and season. That behavior is in accordance with tidal theory for the propagation of the (1, 1) Hough mode (Chapman and Lindzen, 1970; Forbes, 1982). Frequently, the observed meridional diurnal phase in the equatorial region presents a more well-defined behavior as a function of altitude and season than the zonal component (Deepa et al., 2006; Buriti et al., 2008; Davis et al., 2013), which makes the calculation of the meridional vertical wavelength more accurate relative to the zonal component. Perhaps this difference occurs because the nonmigrating tides have a relatively more important impact on the zonal wind field at low latitudes. As noted, the semidiurnal mode (period of 12 h) is generally weaker than the diurnal mode in the low latitude and equatorial regions. The terdiurnal and quarterdiurnal tides are also present but with even smaller amplitudes, but nonetheless they play some role in mesospheric dynamics (Tokumoto et al., 2007; Guharay et al., 2018).
This paper concentrates on diurnal tides observed simultaneously with meteor radars installed in Santa Cruz, Costa Rica (hereafter CR), and São João do Cariri, Brazil (CA), with our focus being on the period from April 2005 to January 2006 (inclusive). Both radars, separated by 5800 km, are very similar in construction and operation to each other. They are located in opposite hemispheres but very close to the Equator. Their latitudes are very similar. The paper first presents a brief overview of the background wind at both sites, and then proceeds to a comparison between diurnal tidal characteristics. Amplitudes are discussed first, followed by phases. A discussion then follows.
Interesting results include a peak in amplitude observed in the diurnal zonal amplitude at the Costa Rican site in December, which is not predicted by the model, and a clear antiphase between CR and CA in regard to the diurnal meridional component.
Both meteor radars are called SKiYMET radars. These are all-sky interferometric meteor radars which consist of a transmitter antenna in the form of a three-element Yagi and a set of five receiver antennas comprising two-element Yagis. The radars are installed in different locations, namely, in São João do Cariri, PB, Brazil (7.4∘ S, 36.5∘ W) and Santa Cruz, Costa Rica (10.3∘ N, 85.6∘ W). The distance between the sites is about 5800 km, and they are at similar latitudes either side of the Equator (10∘ N and 7∘ S). The first uses a frequency of 35.24 MHz and the second one operates at 35.65 MHz. The radars run 24 h per day without interruption and provide meridional and zonal wind data at altitudes between 80 and 100 km. Weather conditions do not interfere with observations. Basically, the wind is measured when an ionized meteor trail, formed when a meteoroid collides with the atmosphere, reflects the radio wave emitted by the transmitter antenna. The echo is detected by five receiver antennas. The phase shift between each pair of antennas gives information about the direction from which the meteor trail was observed, the time delays of the transmitted pulses give the range to the target, and the Doppler shift of the received signal gives the radial velocity. This combination of data allows for generation of a wind field as a function of height and time (Hocking et al., 2001). Concerning the standard deviation of amplitude and phase, it is important to note that for each hour of a composite day, several thousand meteor trails are detected by the radar. The consequence of this is that the errors in determination of the amplitude and phase can be estimated to be less than 10 % and 1 h, respectively. The temperature of the mesosphere at the height of peak meteor detection (∼ 90–92 km) can also be determined by meteor radar (Hocking, 1999), but we will only concentrate on the wind field. In our case, we determine information of winds every 2 h centered at altitudes of 82, 85, 88, 91, 94 and 98 km, in order to make optimum use of the data, which are nonuniformly distributed in height.
In the present work, we will use CR data corresponding to the period from 14 April 2005 to 29 January 2006, with a gap of data from 17 November to 13 December. Data from CA for the same period will be presented for comparison. A study of 1 year of background mean winds, as well as diurnal and semidiurnal tides observed in both the zonal and meridional components above CA during 2004–2005, has previously been reported by Buriti et al. (2008).
The Global Scale Waves Model (GSWM-09) used in this work includes migrating and nonmigrating tides with zonal wavenumbers from eastward 6 to westward 6. Briefly, it is a two-dimensional model that solves the linearized and extended Navier–Stokes equations for a particular period and wavenumber s as a function of latitude (from 87∘ S to 87∘ N), altitude (from 0 to 124 km) and month (from January to December). It incorporates fields of mean wind (zonal), pressure, temperature and other important physical parameters from empirical models, such as MSISE-90 (Hedin, 1991). Depending on the altitude range, information on wind comes from different models and satellite observation. For example, between the stratosphere and the mesopause, winds are provided by the High Resolution Doppler Interferometer – HRDI – on board UARS (Upper Atmosphere Research Satellite). Details about GSWM can be obtained on High Altitude Observatory (HAO)'s home page and a vast number of papers, such as Hagan et al. (1997, 2002, 2003), Manson et al. (2002) and Pancheva et al. (2001). Information about tidal parameters determined by GSWM0-09 will be presented at specific altitudes, which are chosen to be closest to the radar heights (e.g., see Figs. 5 and 6).
Background winds
In order to set up the background conditions for the tides, we present wind variations on the timescale of months, and we present the background wind observed in CR and CA. Figure 1 shows the monthly averages of zonal (left) and meridional (right) winds in CR and CA. Data from February to March are missing for CR because the meteor radar presented technical problems.
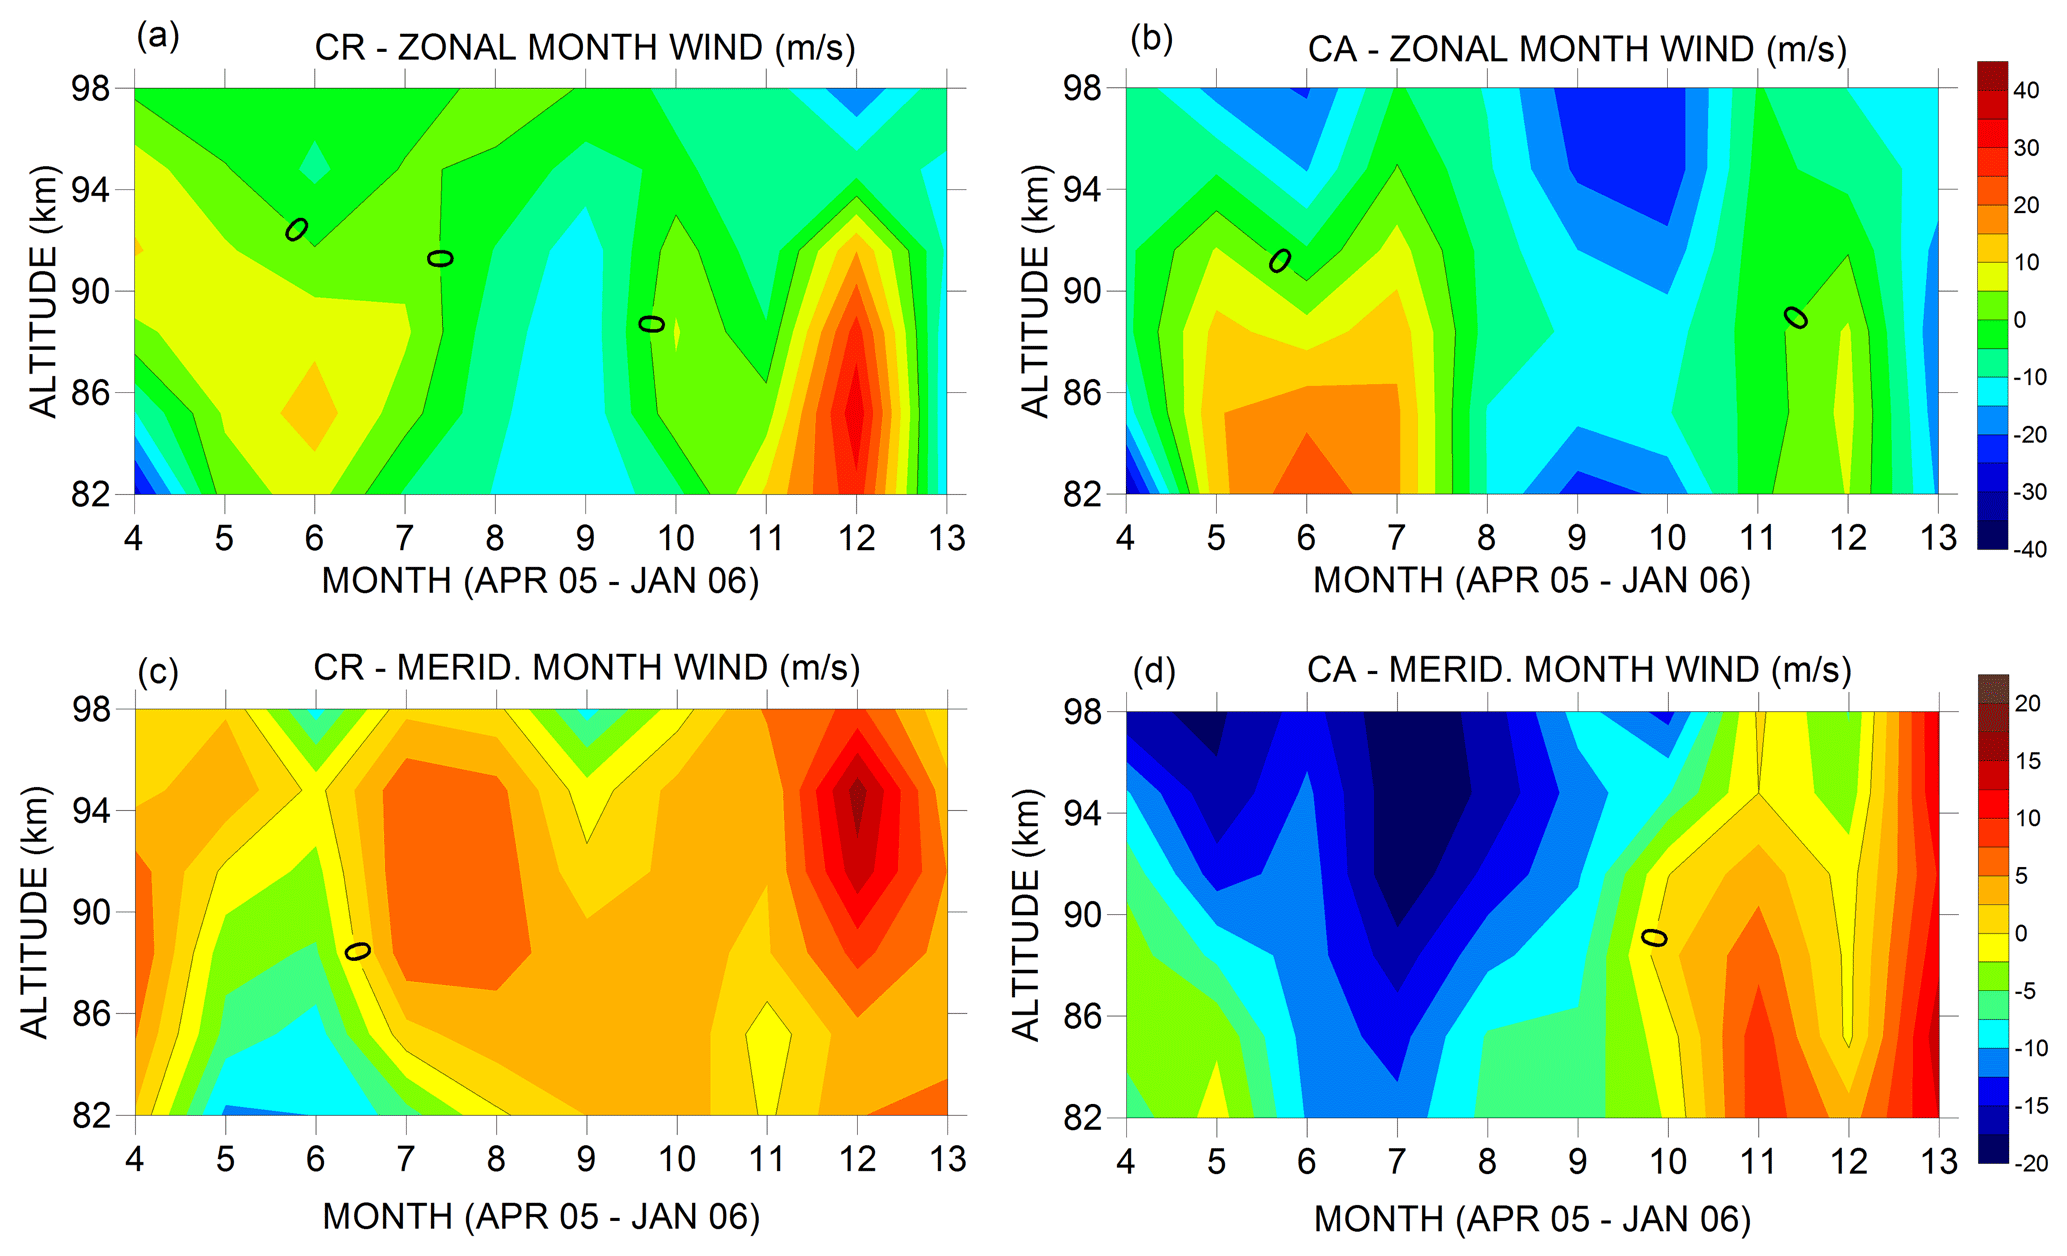
Figure 1Monthly averages of zonal (top) and meridional winds in CR (a, c) and CA (b, d) from April 2005 to January 2006. The color scales used for the zonal and meridional winds in the graphs are different.
Comparing monthly-mean winds at the two sites, some interesting results are evident. In general, both sites seem to present a clear annual and semiannual behavior, particularly in regard to the zonal wind. At heights of 82–91 km, the maximum eastward mean wind at CA is observed in June, while the maximum in CR is present in December. This is almost a 6-month delay, as might be expected due to the fact that the radars are in different hemispheres. The meridional winds are quite different at the two sites, although strong southward flows above CA in June–July and strong northward flows in December over CR are evident.
A harmonic analysis to derive semiannual oscillation – not presented in detail in this text – was carried out on these data. Briefly, not considering annual oscillation, the semiannual zonal amplitude decreased between 82 and 94 km from ∼ 15 to 6.3 m/s in CR with maximum values on day ∼ 160 of the year (9 June) or ∼ 342 (8 December). The amplitude in CA also decreased similarly to CR and presented maximum values close to 160 doy (day of year). The meridional component, on the other hand, is predominately northward in CR and southward at CA in the range between 82 and 98 km. Meridional amplitude values in CR and CA are practically the same, except at 98 km height where the value of CA is twice that of CR. In general, the semiannual meridional amplitude did not present values above 5 m/s at any specific altitude in the range studied in this work.
We now turn to tidal analyses. The analysis of CR and CA winds, in order to determine information about the diurnal tides, was similar to the procedure described in Hocking (2001) and Buriti et al. (2008). First of all, a superposed epoch averaging of winds at 2 h steps was made, producing monthly means at 01:00, 03:00, …, 23:00 (local time). After that, a standard least mean squares fitting technique was used to obtain amplitude, phase and DC values for each month. It is known that diurnal oscillation of meridional wind in regions close to the Equator presents good regularity in amplitude and phase according to altitude, and our results confirmed this. Consequently, a precise vertical wavelength is easier to calculate for the meridional wind than for zonal wind. A very interesting observation can be made regarding the diurnal phase of the meridional wind at the two sites. They are completely out of phase. In other words, if the wind has maximum magnitude towards the south at CA, then at the same local time in CR, the meridional wind has maximum magnitude towards the north.
In Figs. 2 to 5, information about amplitudes and phases of GSWM-09 and radars installed in CR and CA are presented for six different altitudes. The altitudes used for GSWM-09 do not coincide exactly with the specific altitudes of the radars, but nonetheless the comparisons between radar data and GSWM-09 are still easy to make. We now turn to more detailed discussions, beginning with the zonal diurnal tide.
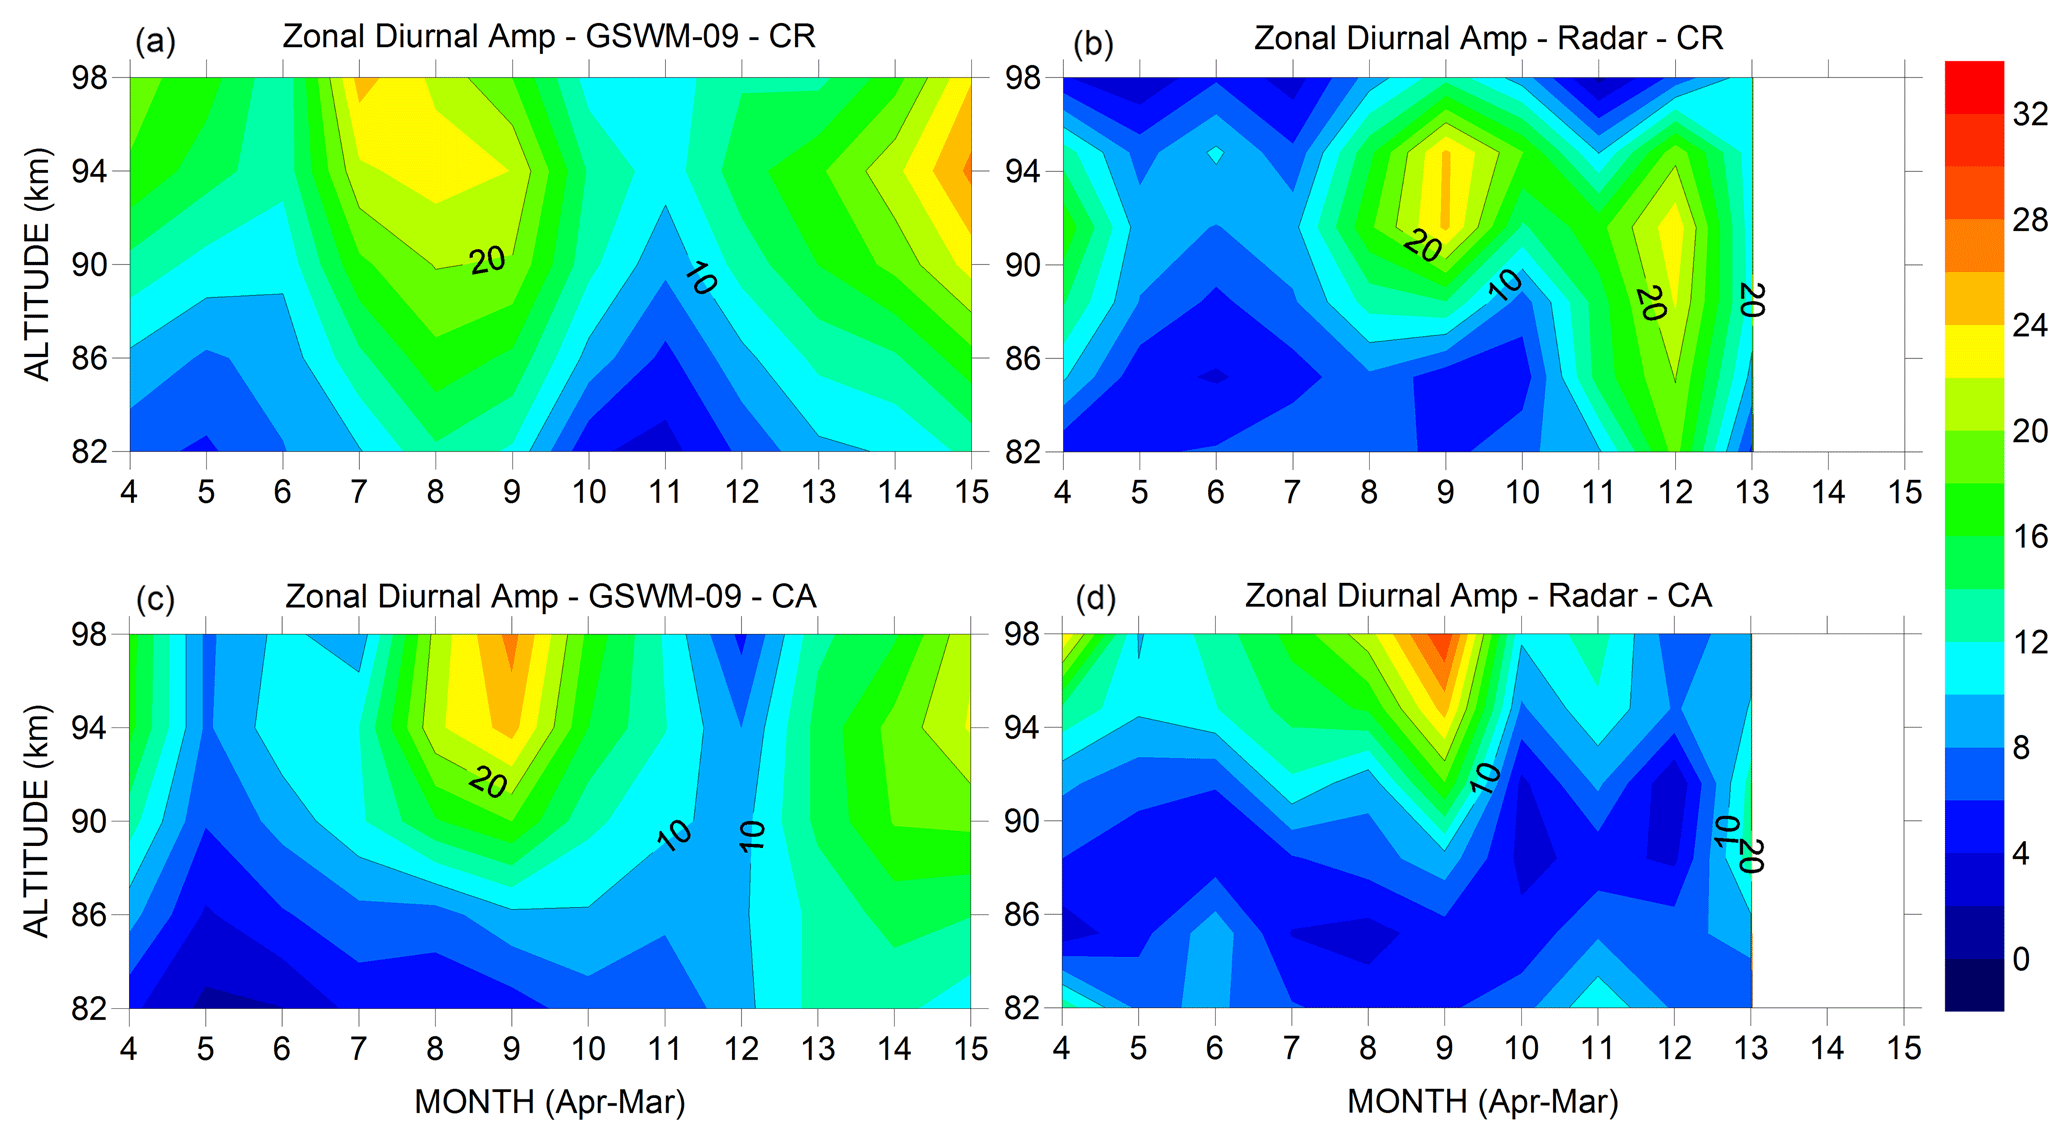
Figure 2Panels (a) and (c) show diurnal zonal amplitudes as predicted by GSWM-09 model in the range between 82 and 102 km height from April to March in CR and CA. Panels (b) and (d) show diurnal zonal amplitudes observed by radar in CR and CA in the same range from April 2005 to January 2006. The color scale represents the amplitude in meters per second (m/s).
3.1 Zonal diurnal amplitude
A general view of the observational diurnal tidal amplitudes in CR and CA, as well as GSWM-09 at both sites, can be seen in Fig. 2. In CR and CA the mean amplitudes, considering all months and altitudes, were close to 10 ± 5.7 m/s, but there is a clear difference between them. While CR values were above the average for November to January at all altitudes, CA values were largely below the average for altitudes between 82 and 91 km height for practically the whole period of observation. Also, amplitudes in CR were small between 82 and 98 km for May to July. CA presented similar results in October to January but with a 6-month difference compared to CR observations. Comparing to the model, CA is closer to the model only in November and December in the range between 82 and 98 km height. A good agreement between model and observation is specifically observed in September at CA. Both sites show increasing amplitude from 91 to 98 km. The presence of large amplitudes in September seems to be a common feature between the sites; in CR the amplitude increased to values of ∼ 24 m/s at an altitude of ∼ 94 km in September and December. On the other hand, CA presented values above 18 m/s between 91 and 98 km (32 m/s) in September. But, the small amplitude predicted by GSWM-09 in October–December between 82 and 91 km height is not observed over CR. On average, considering the dependence of amplitude with altitude, the amplitude in CR increased from 82 km (7.8 m/s) to 91 km (15 m/s) and then decreased to 98 km (6.6 m/s). CA presented a minimum at 85 km altitude (5.8 m/s) and increased almost linearly to 15.6 m/s at 98 km. Visually comparing the figures, GSWM-09 seems to qualitatively represent the CR and CA observation fairly well.

Figure 3Same as Fig. 2 but for meridional amplitude. The color scale here is double the scale in Fig. 2.
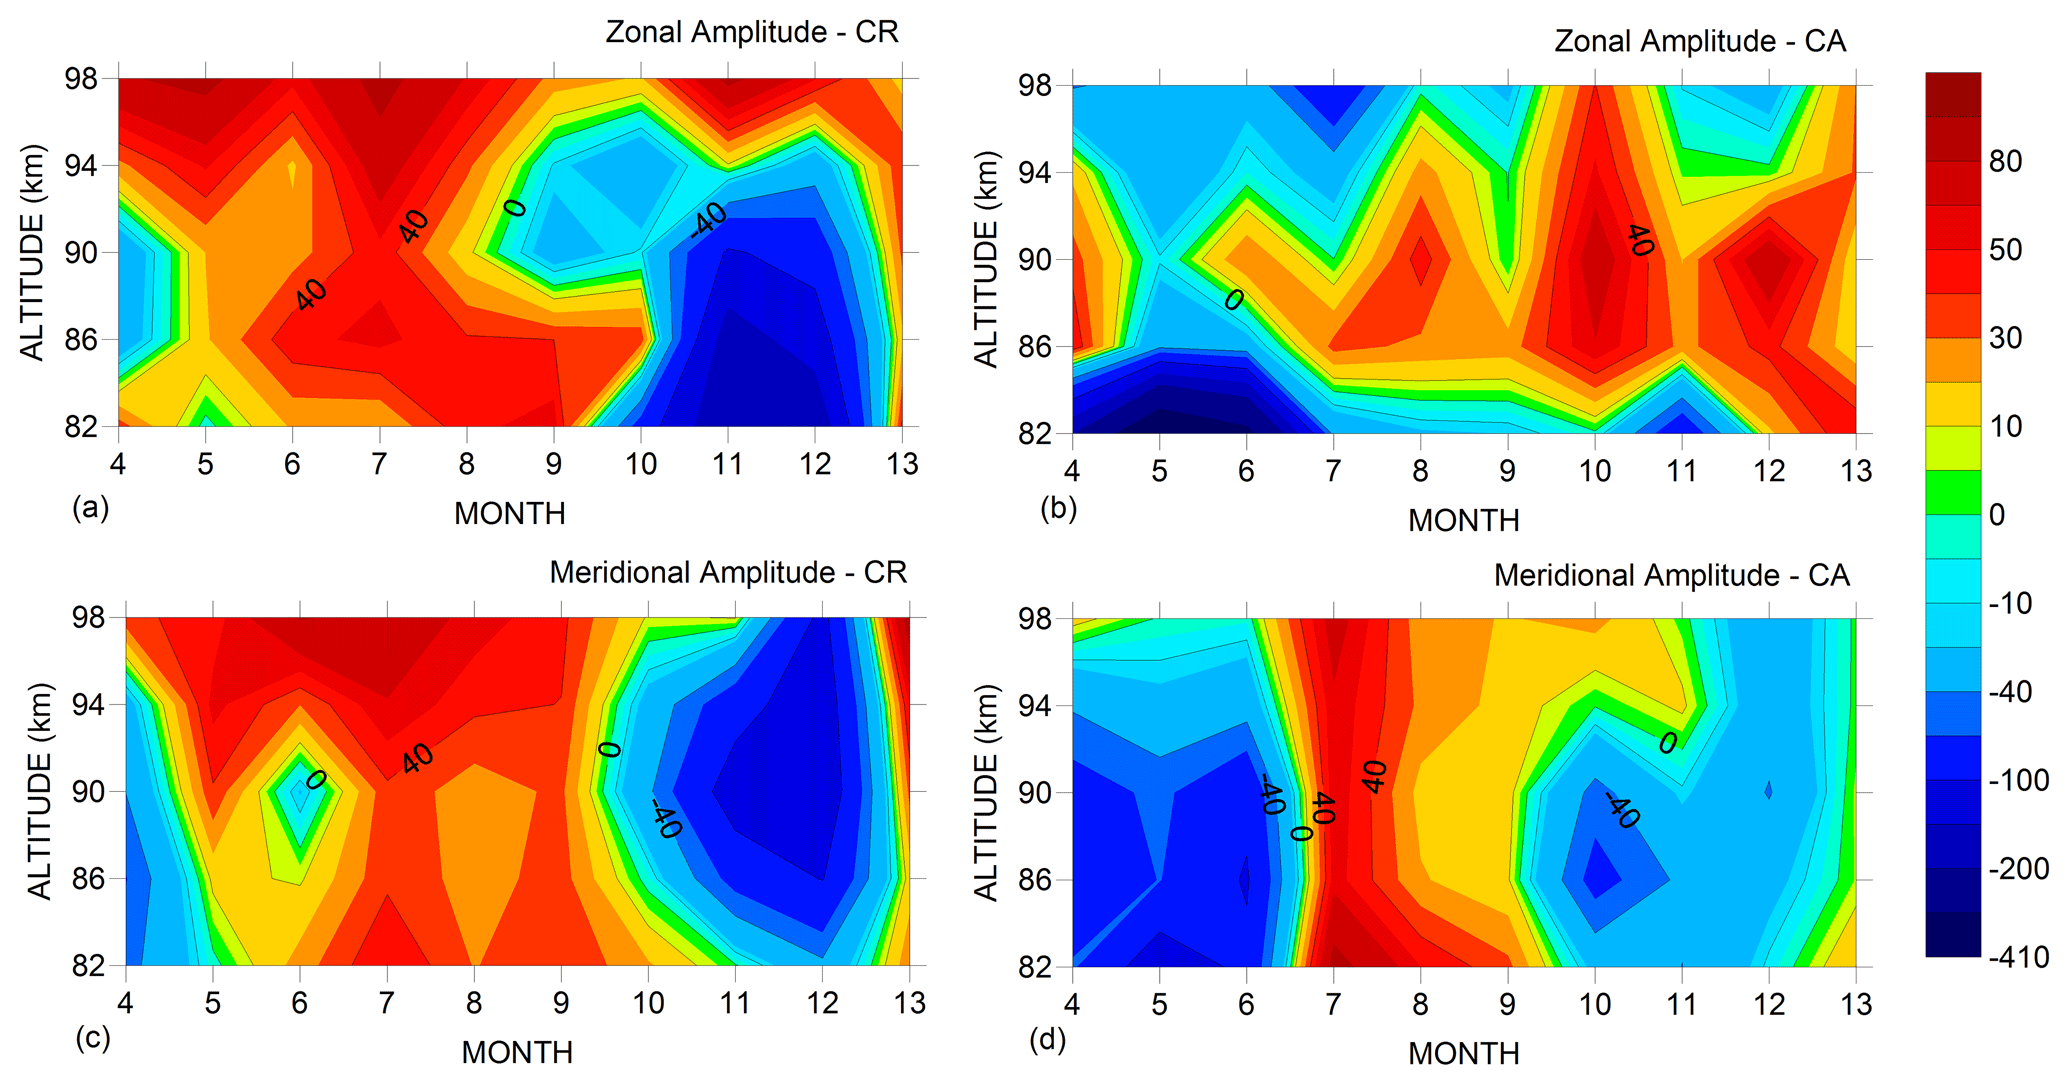
Figure 4Difference in percentage ((model – radar) × 100/model) between GSWM-09 and radar diurnal amplitude for zonal (a, b) and meridional (c, d) components at CR and CA from April 2005 and January 2006.
3.2 Meridional diurnal amplitude
Figure 3 shows the meridional diurnal tides observed in CR and CA, as well as those predicted by GSWM-09. Both sites show, according to the model, amplitudes above 20 m/s in July to September and January to April at altitudes between 82 and 98 km and minimum amplitudes in May to June and November. Observationally, CR presents larger amplitudes compared to CA, mainly in December. Comparing CR with CA, it is clear that they are similar to each other in this regard. The amplitudes in CR increase in July after presenting a minimum in May to June. On average, considering data from April to January in the range of 82 to 98 km of altitude, diurnal amplitudes in CR and CA were 23.3 ± 11.4 m/s and 22.6 ± 9.2 m/s, respectively. Differing from CA, in December CR presented a pronounced maximum, with values above 50 m/s at 94 km, which is not predicted by GSWM-09. Details about differences between model and radar are shown in Fig. 4.
Comparisons between GSWM-09 and radar are shown in Fig. 4 for both zonal and meridional diurnal amplitudes in the range of 82 to 98 km from April 2005 to January 2006. In order to match the altitude gates of model and radar, we calculated the mean of observed amplitudes from 85 to 88 km heights, which is applicable at a new altitude (86.5 km). The result was compared to the specific altitude of 86.3 km of the model. Figure 4 represents the difference in percentage between zonal and meridional amplitude from model and radar for each altitude and month, for both CR and CA. It is important to note that positive values in the graphs mean that the value from the model is higher than that observed by radar. In regard to zonal amplitude, the large blue area in Fig. 4a occurs because the observed amplitude in December at 86–94 km height was considerably larger than the model outputs. The months from April to October present the smallest differences between model and radar. On the other hand, in CA, considering altitudes above 86 km, the amplitude observed by the radar generally agree with the model, except in October when this difference increased to ∼ 70 %. The meridional component in CR, similarly to the zonal one, showed a large blue area in November–January which indicates that observed amplitudes are more than 100 % of the model. This is because meridional diurnal amplitudes observed by the radar also increased significantly in December above 91 km height. An interesting feature observed at CA was two large blue areas in meridional amplitude separated by a reddish area with values below 60 %. Comparing zonal and meridional components observed in CR and CA, we can say that the meridional amplitude seems to be more accurately described by GSWM-09 than the zonal data.
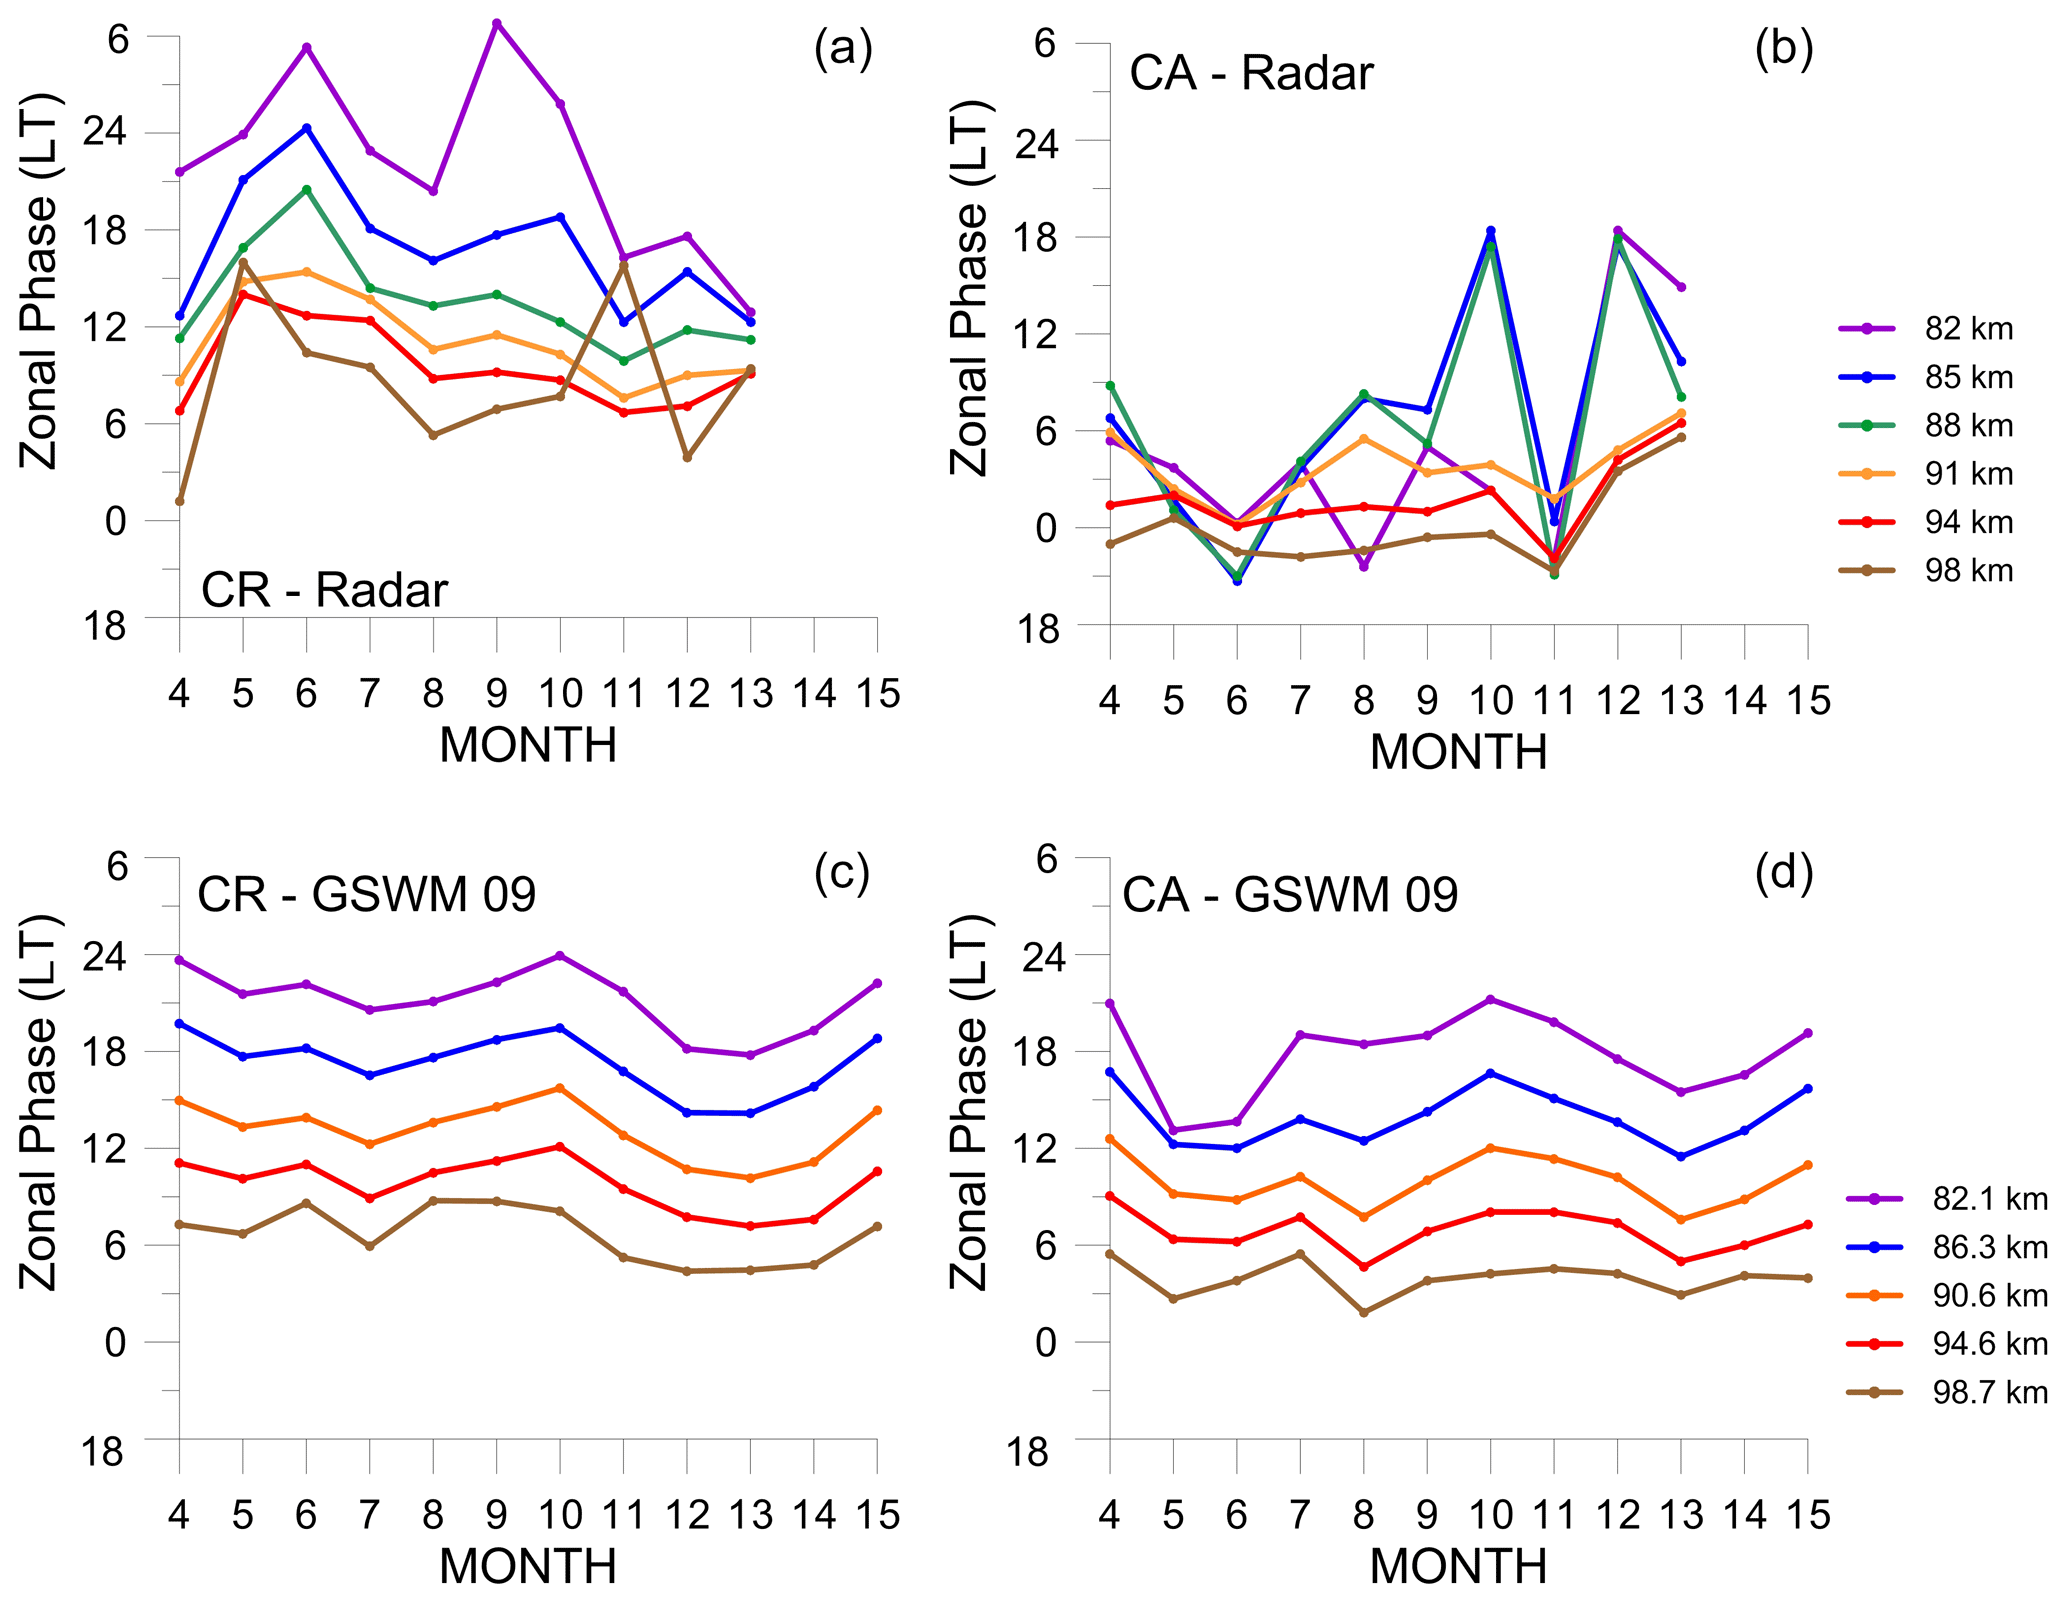
Figure 5Zonal diurnal phase in LT for CR (a) and CA (b) from April 2005 to January 2006 and GSWM-09 for CR (c) and CA (d) from April to March. The height gates for the radar data and the GSWM-09 data are not quite the same but close enough for visual comparisons.
3.3 Zonal diurnal phase
Figure 5 shows the observed and model zonal phases at different altitudes at CR and CA as a function of month of the year for each interval of altitude. The zonal phase (in local time) presented some interesting results. These included a clear uniform phase difference in altitude in CR, except for January 2006. The phase in CR, in contrast to CA, shows a clear linear dependence on altitude in most months, which makes it possible to determine the wavelengths of the tidal propagation assuming a quasi-monochromatic wave. A decrease of the phase between May and January is generally evident. Also, an upward propagation of the diurnal tide is clear, especially in CR where the phase decreases as the altitude increases. The vertical wavelength was obtained considering the altitude as an independent variable, but some additional criteria were considered in order to extract reliable vertical wavelengths. In particular, a linear regression of at least four altitudes in sequence was required, and the fit was only accepted if the R-squared value was above 0.9. The results for CR and CA, on average, were 25.4 ± 4.0 and 22.7 ± 7.3 km, respectively. Because the zonal diurnal phases in both CR and CA normally showed undefined behavior with height, only 4 months were available to determine the vertical wavelengths using the above criteria. According to GSWM-09, the vertical wavelength in CR and CA should be about 27.4 ± 2.1 and 29.3 ± 4.8 km, respectively. This is almost 8 % and 30 % higher (respectively) than the ones observed in CR and CA. We discarded very long vertical wavelengths in our analysis simply because of the criteria discussed above. Large vertical wavelengths could be indicative of an evanescent structure or the presence of another mode of oscillation, e.g., nonmigrating modes; in addition, gravity wave breaking can act to increase the vertical wavelength (Ortland and Alexander, 2006).
The zonal diurnal phase, according to GSWM-09, has differences in values in CR and CA. Comparing the same altitudes in CR and CA, the difference of phase between them, from April to March, on average, is 3.1 ± 0.2 h. In regard to observational versus model results, the irregularity of phase shift from CA as a function of month makes an observational comparison, which depends on the altitude and month, practically impossible. On the other hand, the difference between CR and model, even allowing for some discrepancies at a specific altitude and month, is 0.2 ± 4 h, on average.
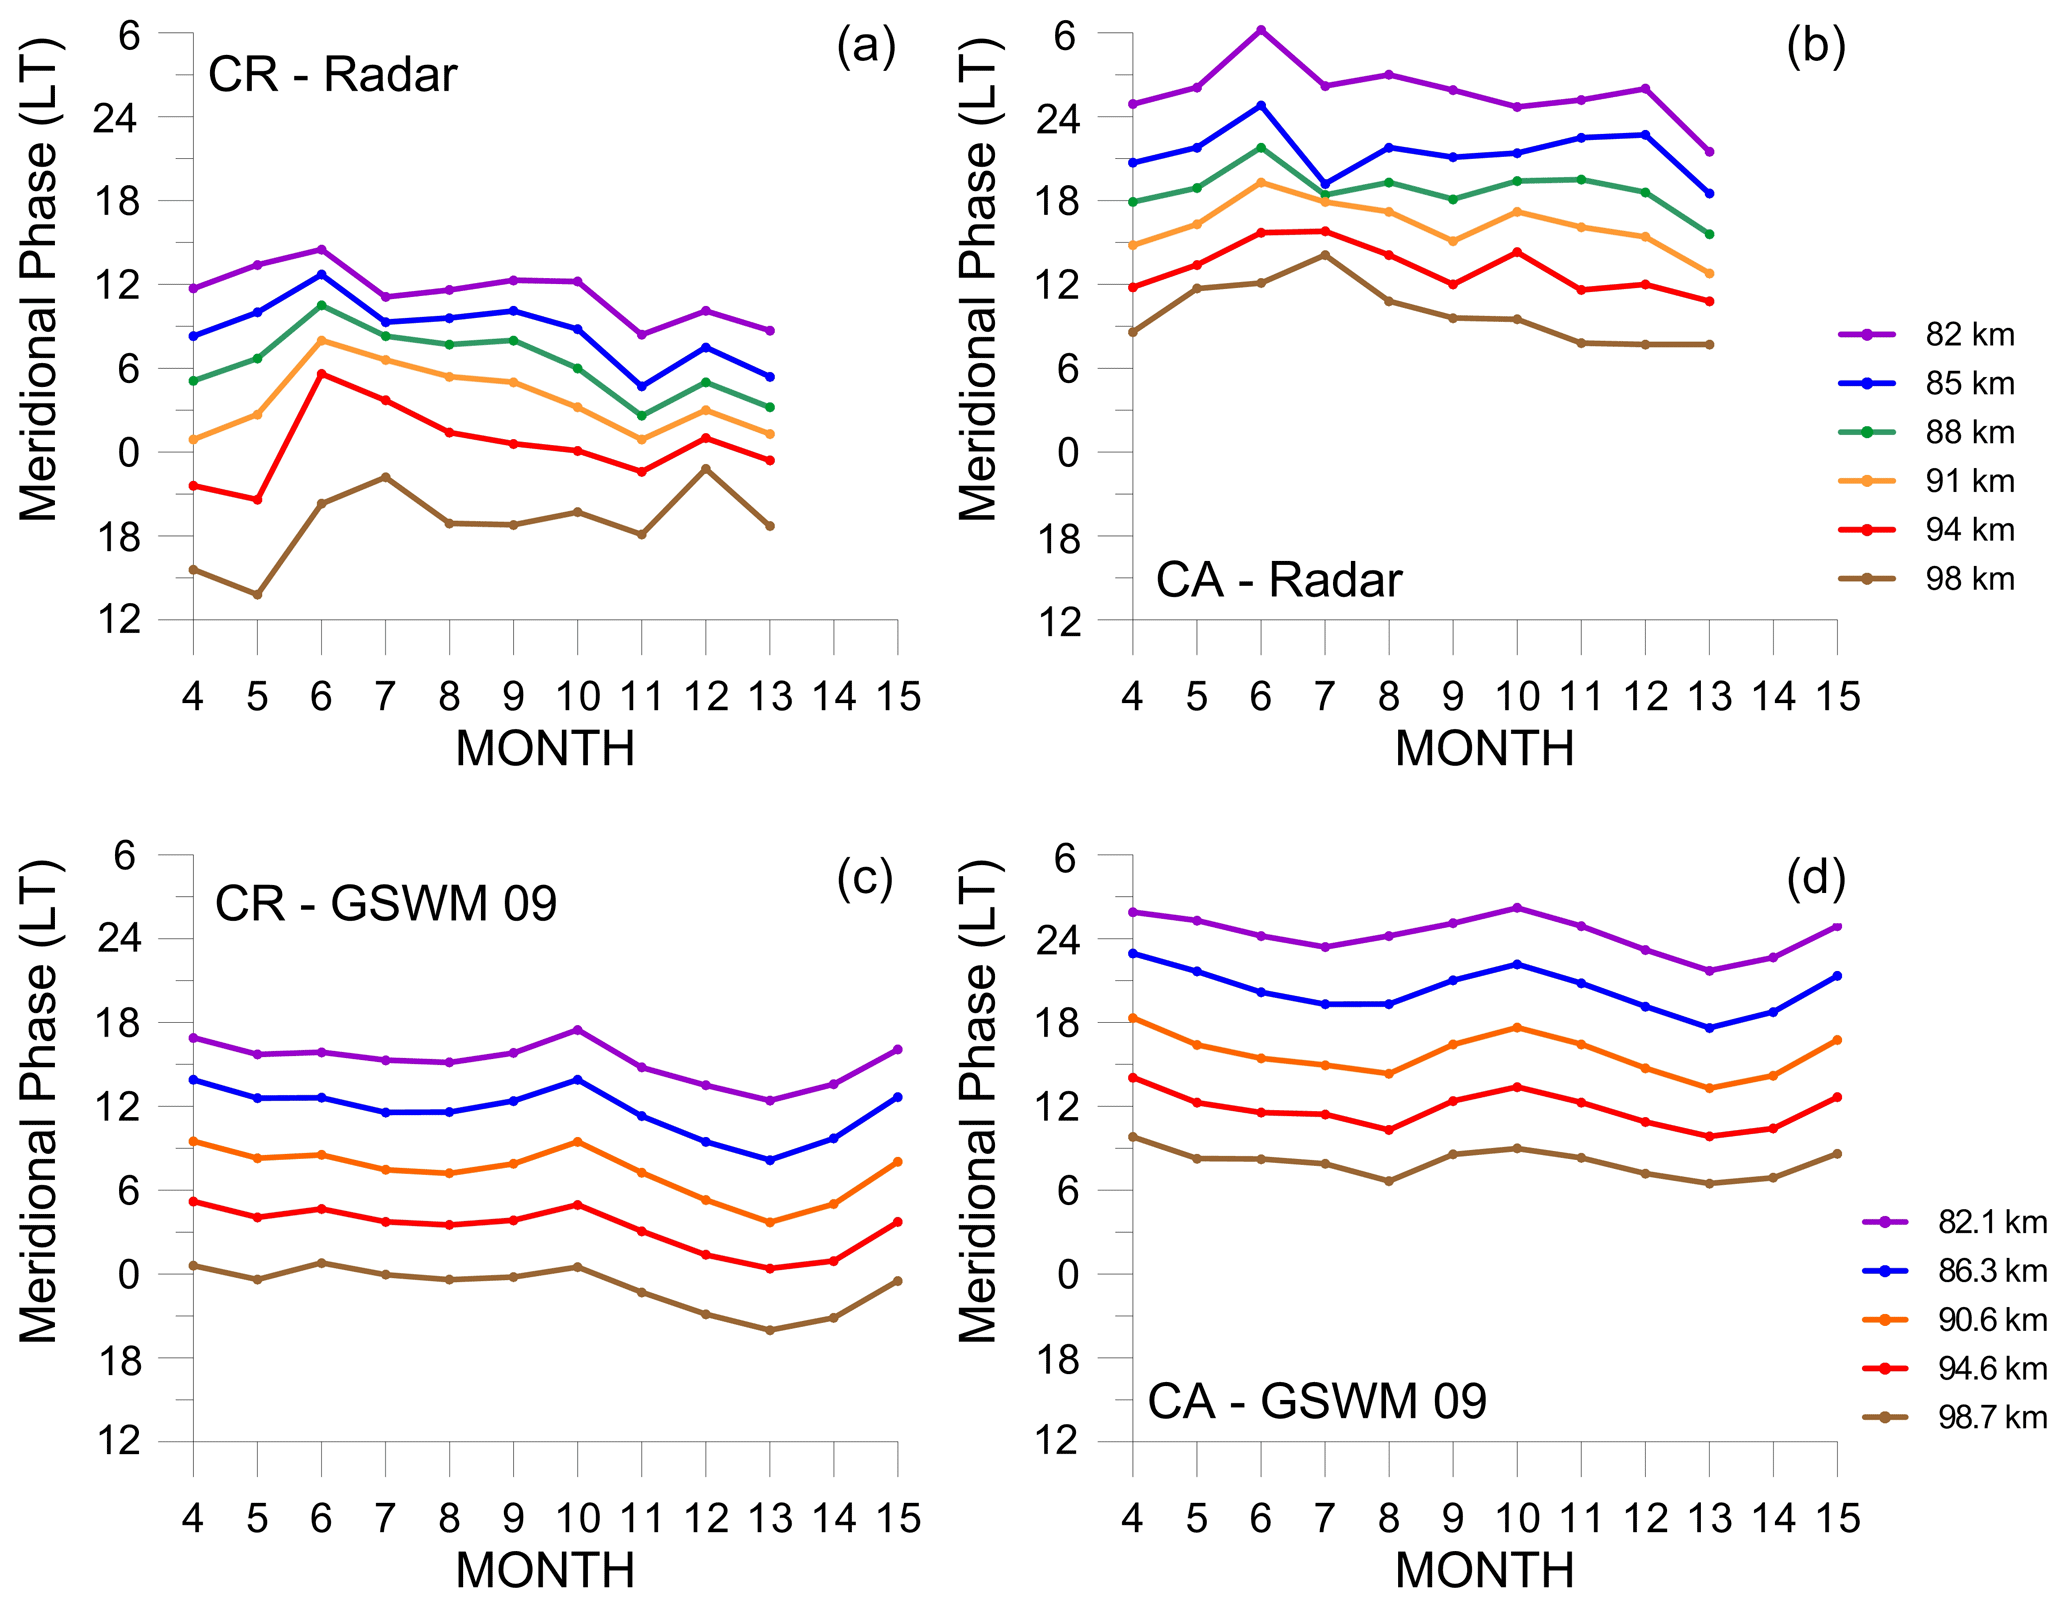
Figure 6Meridional diurnal phase in LT for CR (a) and CA (b) from April 2005 to January 2006 and GSWM-09 for CR (c) and CA (d) from April to March. The height gates for the radar data and the GSWM-09 data are not quite the same but close enough for visual comparisons.
3.4 Meridional diurnal phase
The meridional phase (in local time) presents a behavior quite different to that of the zonal component. Figure 6 presents the meridional phase observed by radar and by GSWM-09 in CR and CA. It is clear that an observed downward phase propagation is evident at both sites, and a small decrease of phase from June to January occurs. The regularity of phase with altitude permitted us to estimate the vertical wavelength, using the criteria mentioned earlier, for all months with data. The results were vertical wavelengths of 25.1 ± 5.3 and 25.6 ± 4.6 km in CR and CA, respectively. According to GSWM-09, the vertical wavelengths in CR and CA should be 24.5 ± 0.8 and 24.2 ± 1.0 km, respectively. An interesting feature observed was the difference of phase, in local time, between CR and CA. At the same altitude and month, the difference in the time of maximum in CR compared to CA was 13.3 ± 2.3 h, on average, if we consider that CR is ahead of CA. Considering phases calculated by GSWM-09 between 82 and 98 km, the difference between CR and CA should be, on average, 8.7 ± 0.6 h. GSWM-00, an earlier version of the model that does not include nonmigrating tides, shows that the difference between CA and CR should be 12.0 ± 1.6 h, on average. That result is close to the radar determinations.
The observational results were compared with the Global-Scale Wave Model (GSWM), version 2009, which is the newest one. In general, GSWM-09 predicts the meridional component more satisfactorily than the zonal one. However, just as for the zonal amplitude, the meridional component also showed large quantitative differences between model and observed results in most months. When comparisons are made between the sites, June and July present similar results for zonal and meridional amplitude, respectively. In August and October, the zonal winds at 82 km in CR and CA are similar in magnitude, but they are different in November–December. The increase of the zonal and meridional diurnal amplitude in CR in December was not observed in CA, and it is not predicted by the model.
Davis et al. (2013) reported a study of the diurnal amplitude of meteor winds observed at Ascension Island (8∘ S, 14∘ W) from 2002 to 2011. They show in Figure 6 of their work a composite-year monthly-mean zonal and meridional diurnal amplitudes as a function of month and altitude which present a good agreement to GSWM-09. The availability of 9 years of data may have smoothed out irregularities that arise in a short period of observation; even so, there is a good similarity between Ascension Island and 1 year of data in CA. In that work, they also have compared their observation with the Canadian Middle Atmosphere Model (eCMAM) and the Whole Atmosphere Community Climate Model (WACCM) (Fomichev et al., 2002; Du et al., 2007).
The zonal diurnal amplitudes calculated by GSWM-09 in the range between 82 and 98 km altitude for CR and CA are, in general, similar in behavior to the meridional component. Both components present a decrease in amplitude during summer and winter solstice months. However, the magnitude of the meridional diurnal amplitude is twice that of the zonal one during the whole year. Concerning the diurnal phase, the model presents a regular phase variation in time and altitude for both components. That regular variation was not observed by the radar in zonal diurnal phase, in contrast to the meridional one. The reason is possibly related to the influence of nonmigrating modes, which are in turn dependent on the zonal background wind field (Hagan and Forbes, 2002, 2003). Also, an increase in zonal and meridional amplitude at 88–98 km height in CR was observed in December, which is not predicted by the model.
The geographic and climate conditions in CR and CA are quite dissimilar. For example, it would be reasonable to expect different behavior of the tides at the two sites because of their different levels of response to water vapor absorption and tropospheric latent heat release by large-scale deep convection. Lieberman et al. (2007) modeled how the variations of diurnal tropospheric heating due to water vapor and latent heat could affect the amplitude of the meridional tidal winds in the mesosphere. This work concentrated on 1997–1988, when the ENSO (El Niño–Southern Oscillation) was very strong. Because water vapor heating presents a migrating component, it is expected that it helps define the migrating tide in the mesosphere wind. On the other hand, the nonmigrating component is driven by thermal forcing which is associated with water vapor heating and latent heat effects. The last months of the 2005 period were of weak positive phase for the Southern Oscillation Index (SOI). This means that the water of the eastern and central tropical Pacific Ocean was cooler, so the La Niña phenomenon was occurring. Thermal excitation due to absorption of solar radiation by water vapor would have decreased at that time, and the effect in the mesosphere could decrease too. This could explain the increase in amplitude in zonal and meridional components only in CR in December and January, which is not predicted by the model.
Specifically, the climate is desert-like at CA but very tropical in CR, which is a country of width of ∼ 120 km from southwest to northeast, surrounded by the Atlantic (east) and Pacific (west) oceans. São João do Cariri, on the other hand, is a city in the country of the northeast of Brazil, having the Atlantic Ocean 190 km to the east and 250 km to the north. The Pacific Ocean is 4800 km to the west. CA is located in the driest region in Brazil. Some reports have proposed that latent heat release is important for semidiurnal tides (Hagan and Forbes, 2003; Zhang et al., 2010). Lindzen (1978) originally considered that latent heat release is not important to the diurnal tide. Since then, however, many reports about the possibility of diurnal tides, including migrating and nonmigrating, in the MLT (mesosphere and lower thermosphere) being affected by ground-level sources in the tropical region have been published (Hamilton, 1981; Hagan, 1996; Forbes et al., 1997). Hagan et al. (1997) showed the importance of the seasonality of convective activity in the troposphere on the diurnal amplitude of the meridional wind at 21∘ N; it is strong in January and weak in July. This clear dependence is due to the diurnal amplitude of the effective rainfall rate that varies with months. So, convective activity could explain the difference in behavior of the zonal and meridional components in CR and CA. Ascension Island, which is located practically in the middle of the Atlantic Ocean, has a desert climate with total precipitation of only 200 mm per year. This is almost half that of CA and 10 times less than CR. As we have presented above, CA (and Ascension Island) tend to be closer to the model predictions than CR. It is likely that other modes of oscillation (including nonmigrating tides), which are more sensitive to latent heat release, are present in the CR winds.
The results presented in this work, specifically about diurnal oscillations, showed that mesospheric winds observed by meteor radars installed in CR and CA during 2005, in general, are in agreement with GSWM-09, especially in the meridional wind. In CA, for example, comparison between model and observation shows a great accordance between them, with minimum amplitude increasing according to height in the solstice of winter and maximum values from August to January. On the other hand, in CR, we can note some discrepancies between observation and model. In CR an increase of amplitude was observed in December between 91 and 98 km height, which is not predicted by the model. Also, in May to June, the meridional amplitude was low in the range of height of this work. GSWM-09 predicts two minima in May to June and October to December. Concerning the phase, we could say that CA, again, presented a better accordance with the model. The higher discrepancies between observation and model happened for zonal winds in CA and especially in CR. Again, the model can reproduce CA results better than CR in terms of amplitude. We suggest that this is because of the presence of active nonmigrating modes in CR, which are not predicted by the model. That anomaly could be, for example, a higher participation of water vapor absorption and tropospheric latent heat release by deep convection due a weak La Niña effect being more important in CR than CA. A longer-term study over many years could help clarify if anomalous behavior in diurnal amplitude could be associated with variability of convective activity over the sites of the radars.
All meteor radar data can be requested from the National Institute for Space Research (INPE) and the University of Western Ontario (UWO): contact Paulo Batista (paulo.batista@inpe.br) or Wayne Hocking (whocking@uwo.ca).
RAB is responsible for the operation of the radar at CA, has written the article and made the analyses of data using software provided by WH. The same software is used on the CR meteor radar, which was also built by WH using grants from NSERC (Natural Sciences and Engineering Research Council) in Canada. PPB and BC (in memoriam) are responsible for the data and for the meteor radar of CA. IP, ARP and AFM have contributed to the discussion of the article. MGS is a collaborator of WH and responsible for operation of the CR meteor radar.
The authors declare that they have no conflict of interest.
This article is part of the special issue “7th Brazilian meeting on space geophysics and aeronomy”. It is a result of the Brazilian meeting on Space Geophysics and Aeronomy, Santa Maria, RS, Brazil, 5–9 November 2018.
This work is partially supported by National Council for Scientific and Technological Development (CNPq) under process 307247/2016-7 and Paraíba State Research Foundation (FAPESQ) – 002/2019. We also thank the Federal University of Paraíba for facilities to install the meteor radar. Construction and support of the CR radar was supplied by the Natural Sciences and Engineering Research Council of Canada. The land and buildings at the CR site were supplied by the University of Costa Rica. We thank Xiaoli Zhang of the Department of Aerospace Engineering Sciences, University of Colorado, for making the GSWM-09 results available.
This research has been supported by the Conselho Nacional de Desenvolvimento Científico e Tecnológico (grant no. 307246/2016-7), and the Paraíba State Research Foundation (FAPESQ) (grant no. 002/2019).
This paper was edited by Andrew J. Kavanagh and reviewed by two anonymous referees.
Buriti, R. A., Takahashi, H., Lima, L. M., and Medeiros, A. F.: Equatorial planetary waves in the mesosphere observed by airglow periodic oscillations, Adv. Space Res. 35, 2031–2036, https://doi.org/10.1016/j.asr.2005.07.012, 2005.
Buriti, R. A., Hocking, W. K., Batista, P. P., Medeiros, A. F., and Clemesha, B. R.: Observations of equatorial mesospheric winds over Cariri (7.41∘ S) by a meteor radar and comparison with existing models, Ann. Geophys., 26, 485–497, doi.org/10.5194/angeo-26-485-2008, 2008.
Chang, L. C., Ward, W. E., Palo, S. E., Du,J., Wang, D.-Y., Liu, H. L., Hagan, M. E., Portnyagin,Y., Oberheide, J., Goncharenko, L. P., Nakamura, T., Hoffmann, P., Singer, W., Batista, P., Clemesha, B., Manson, A. H., Riggin, D. M., She, C.-Y., Tsuda, T., and Yuan, T.: Comparison of diurnal tide in models and ground-based observations during the 2005 equinox CAWSES tidal campaign, J. Atmos. Sol.-Terr. Phys., 78-79, 19–30, https://doi.org/10.1016/j.jastp.2010.12.010, 2012.
Chapman, S. and Lindzen, R. S.: Atmospheric Tides: Thermal and Gravitational, D. Reidel, Dordrecht, 200 pp., 1970.
Davis, R. N., Du, J., Smith, A. K., Ward, W. E., and Mitchell, N. J.: The diurnal and semidiurnal tides over Ascension Island (8∘ S, 14∘ W) and their interaction with the stratospheric quasi-biennal oscillation: studies with meteor radar, eCMAM and WACCM, Atmos. Chem. Phys., 13, 9543–9564, https://doi.org/10.5194/acp-13-9543-2013, 2013.
Deepa, V., Ramkumar, G., Antonita, M., Kumar, K. K., and Sasi, M. N.: Tidal oscillations in the MLT region over Trivandrum (8∘ N, 77∘ E) – results from SkiYMET meteor radar observations, ILWS Workshop 2006, GOA, 19–24 February, 2006.
Du, J., Ward, W. E., Oberheide, J., Nakamura, T., and Tsuda, T.: Semidiurnal tides from the Extended Canadian Middle Atmosphere Model (CMAM) and comparisons with TIMED Doppler Interferometer (TIDI) and meter radar observations, J. Atmos. Sol.-Terr. Phys., 69, 2159–2202, https://doi.org/10.1016/j.jastp.2007.07.014, 2007.
Fomichev, V. I., Ward, W. E., Beagley, S. R., McLandress, C., Mc-Connell, J. C., McFarlane, N. A., and Shepherd, T. G.: Extended Canadian Middle Atmosphere Model: Zonal-mean climatology and physical parameterizations, J. Geophys. Res., 107, 4087, https://doi.org/10.1029/2001JD000479, 2002.
Forbes, J. M., Hagan, M. E., Zhang, X., and Hamilton, K.: Upper-atmospheric tidal oscillations due to latent heat release in the tropical troposphere, Ann. Geophys., 15, 1165–1175, https://doi.org/10.1007/s00585-997-1165-0, 1997.
Forbes, J. M., Zhang, X., Palo, S., Russell, J., Mertens, C. J., and Mlynczak, M.: Tidal variability in the ionospheric dynamo region, J. Geophys. Res., 113, A02310, https://doi.org/10.1029/2007JA012737, 2008.
Forbes, M. J.: Atmospheric tides: 1. Model description and results for the solar diurnal component, L. Geophys. Res., 87, 5222–5240, https://doi.org/10.1029/JA087iA07p05222, 1982.
Garcia, R. R. and Solomon, S.: The effect of breaking gravity waves on the dynamics and chemical composition of the mesosphere and lower thermosphere, J. Geophys. Res., 90, 3850–3868, https://doi.org/10.1029/JD090iD02p03850, 1985.
Guharay, A., Batista, P. P., Buriti, R. A., and Schuch, N. J.: On the variability of the quarterdiurnal tide in the MLT over Brazilian lowlatitude stations, Earth Planet. Space, 70, 140 pp., https://doi.org/10.1186/s40623-018-0910-9, 2018.
Hagan, M. E.: Comparative effects of migrating solar sources on tidal signatures in the middle and upper atmosphere, J. Geophys. Res., 101, 21213–21222, 1996.
Hagan, M. E. and Forbes, J. M.: Migrating and nonmigrating diurnal tides in the middle and upper atmosphere excited by tropospheric latent heat release, J. Geophys. Res., 107, 4754, https://doi.org/10.1029/2001JD001236, 2002.
Hagan, M. E. and Forbes, J. M.: Migrating and nonmigrating semidiurnal tides in the upper atmosphere excited by tropospheric latent heat release, J. Geophys. Res., 108, 1062, https://doi.org/10.1029/2002JA009466, 2003.
Hagan, M. E., McLandress, C., and Forbes, J. M.: Diurnal tidal variability in the upper mesosphere and lower thermosphere, Ann. Geophys., 15, 1176–1186, https://doi.org/10.1007/s00585-997-1176-x, 1997.
Hamilton, K.: Latent heat release as a possible forcing mechanism for atmospheric tides, Mon. Weather Rev., 109, 3–17, 1981.
Hedin, A. E.: Extension of the MSIS thermosphere model into the middle and lower atmosphere, J. Geophys. Res., 96, 1159–1172, https://doi.org/10.1029/90JA02125, 1991.
Hocking, W. K.: Temperatures using radar-meteor decay times, Geophys. Res. Lett., 26, 3297–3300, https://doi.org/10.1029/1999GL003618, 1999.
Hocking, W. K.: Middle atmosphere dynamical studies at Resolute Bay over a full representative year: Mean winds, tides, and special oscillations, Radio Sci., 36, 1795–1822, https://doi.org/10.1029/2000RS001003, 2001.
Hocking, W. K., Fuller, B., and Vandepeer, B.: Real-time determination of meteor-related parameters utilizing modern digital technology, J. Atmos. Sol.-Terr. Phys., 63, 155–169, https://doi.org/10.1016/S1364-6826(00)00138-3, 2001.
Lieberman, R. S., Riggin, D. M., Ortland, D. A., Nesbitt, S. W., and Vincent, R. A.: Variability of mesospheric diurnal tides and tropospheric diurnal heating during 1997–1998, J. Geophys. Res, 112, D20110, https://doi.org/10.1029/2007JD008578, 2007.
Lindzen, R. S.: Effect of daily variations in cumulonimbus activity on the atmospheric semidiurnal tide, Mon. Wether Rev., 106, 526–533, 1978.
Manson, A. H., Meek, C., Hagan, M., Koshyk, J., Franke, S., Fritts, D., Hall, C., Hocking, W., Igarashi, K., MacDougall, J., Riggin, D., and Vincent, R.: Seasonal variations of the semi-diurnal and diurnal tides in the MLT: multi-year MF radar observations from 2–70∘ N, modelled tides (GSWM, CMAM), Ann. Geophys., 20, 661–677, https://doi.org/10.5194/angeo-20-661-2002, 2002.
Meyer, C. K.: Gravity wave interactions with mesospheric planetary waves: A mechanism for penetration into the thermosphere-ionosphere system, J. Geophys. Res., 104, 28181–28196, https://doi.org/10.1029/1999JA900346, 1999.
Ortland, D. A. and Alexander, M. J.: Gravity waves influence on the global structure of the diurnal tide in the mesosphere and lower thermosphere, J. Geophys. Res., 111, A10S10, https://doi.org/10.1029/2005JA011467, 2006.
Pancheva, D., Mitchell, N. J., Hagan, M. E., Manson, A. H., Meek, C. E., Luo, Yi, Jacobi, C., Kürschner, D., Clark, R. R., Hocking, W. K., MacDougall, J., Jones, G. O. L., Vincent, R. A., Reid, I. M., Singer, W., Igarashi, K., Fraser, G. I., Nakamura, T., Tsuda, T., Portnyagin, Yu., Merzlyakov, E., Fahrutdinova, A. N., Stepanov, A. M., Poole, L. M. G., Malinga, S. B., Kashcheyev, B. L., Oleynikov, A. N., and Riggin, D. M.: Global scale tidal structure in the mesosphere and lower thermosphere during the PSMOS campaign of June–August 1999 and comparisons with the Global Scale Wave Model, J. Atmos. Sol.-Terr. Phys., 64, 1011–1035, https://doi.org/10.1016/s1364-6826(02)00054-8, 2001.
Taylor, M. J., Pendleton Jr, W. R., Gardner, C. S., and States, R. J.: Comparison of terdiurnal tidal oscillations in mesospheric OH rotational temperature and Na lidar temperature measurements at mid-latitudes for fall/spring conditions, Earth Planet. Space, 51, 877–885, 1999.
Teitelbaum, H., Vial, F., Manson, A. H., Giraldez, R., and Massebeuf, M.: Non-linear interaction between the diurnal and semidiurnal tides: terdiurnal and diurnal secondary waves, J. Atmos. Terr. Phys., 51, 627–634, https://doi.org/10.1016/0021-9169(89)90061-5, 1989.
Thayaparan, T., Hocking, W. K., and MacDougall, J.: Observational evidence of tidal/gravity wave interactions using the UWO 2 MHz radar, Geophys. Res. Letts., 22, 373–376, https://doi.org/10.1029/94GL03270, 1995.
Tokumoto, A. S., Batista, P. P., and Clemesha, B. R.: Terdiurnal tides in the MLT region over Cachoeira Paulista (22.7∘ S; 45∘ W). Revista Brasileira de Geofísica, Vol. 25, 69–78, https://doi.org/10.1590/S0102-261X2007000600009, 2007.
Ward, W. E., Oberheide, J., Goncharenko, L. P., Nakamura, T., Hoffmann, P., Singer, W., Chang, L. C., Du, J., Wang, D.-Y., Batista, P., Clemesha, B., Manson, A. H., Riggin, D. M., She, C.-Y., Tsuda, T., and Yuan, T.: On the consistency of model, ground-based, and satellite observations of tidal signatures: Initial results from the CAWSES tidal campaigns, J. Geophys. Res., 115, D07107, https://doi.org/10.1029/2009JD012593, 2010.
Yuan, T., She, C. Y., Hagan, M. E., Williams, B. P., Tao Li, Arnould, Kan, Kawahara, T. D., Acott, P. E., Vance, J. D., Krueger, D., and Roble, R. G.: Seasonal variation of diurnal perturbations in mesopause region temperature, zonal, and meridional winds above Fort Collins, Colorado (40.6∘ N, 105∘ W), J. Geophys. Res., 111, D06103, https://doi.org/10.1029/2004JD005486, 2006.
Zhang, X., Forbes, J. M., and Hagan, M. E.: Longitudinal variation of tides in the MLT region: 1. Tides driven by tropospheric net radiative heating, J. Geophys. Res., 115, A06316, https://doi.org/10.1029/2009JA014897, 2010.