the Creative Commons Attribution 4.0 License.
the Creative Commons Attribution 4.0 License.
 | 08 Oct 2018
Statistical study of ULF waves in the magnetotail by THEMIS observations
Shuai Zhang
Anmin Tian
Quanqi Shi
Hanlin Li
Alexander W. Degeling
I. Jonathan Rae
Colin Forsyth
Mengmeng Wang
Xiaochen Shen
Weijie Sun
Shichen Bai
Ruilong Guo
Huizi Wang
Andrew Fazakerley
Suiyan Fu
Zuyin Pu
Ultra-low-frequency (ULF) waves are ubiquitous in the magnetosphere. Previous studies mostly focused on ULF waves in the dayside or near-Earth region (with radial distance R<12 RE). In this study, using the data of the Time History of Events and Macroscale Interactions during Substorms (THEMIS) mission during the period from 2008 to 2015, the Pc5–6 ULF waves in the tail region with , 8 RE<R<32 RE (mostly on the stretched magnetic field lines) are studied statistically. A total of 1089 azimuthal oscillating events and 566 radial oscillating events were found. The statistical results show that both the azimuthal and radial oscillating events in the magnetotail region (12 RE<R<32 RE) are more frequently observed in the post-midnight region. The frequency decreases with increasing radial distance from Earth for both azimuthal oscillating events (8 RE<R<16 RE) and radial oscillating events (8 RE<R<14 RE), which is consistent with the field line resonances theory. About 52 % of events (including the azimuthal and radial oscillating events) are standing waves in the region of 8–16 RE, while only 2 % are standing waves in the region of 16–32 RE. There is no obvious dawn–dusk asymmetry of ULF wave frequency for events in 8 RE<R<32 RE, which contrasts with the obvious dawn–dusk asymmetry found by previous studies in the inner magnetosphere (4 RE<R<9 RE). An examination for possible statistical relationships between the ULF wave parameters and substorm occurrences is carried out. We find that the wave frequency is higher after the substorm onset than before it, and the frequency differences are more obvious in the midnight region than in the flank region.
- Article
(1048 KB) - Full-text XML
- BibTeX
- EndNote


Ultra-low-frequency (ULF) waves with frequencies between about 1mHz and 5 Hz play a significant role in storing and transferring energy in Earth's magnetosphere. ULF waves can transport energy from the magnetosphere to the ionosphere, accelerate energetic particles, modulate the luminosity of aurorae, mediate reconnection, and trigger substorm onset (e.g., Baumjohann and Glassmeier, 1984; Lessard et al., 1999; Ukhorskiy et al., 2005; Keiling, 2009; Rae et al., 2014; Zong et al., 2009, 2017).
There are several excitation sources for magnetospheric ULF waves. These sources include the Kelvin–Helmholtz instability (KHI) along the magnetopause (e.g., Walker, 1981; Claudepierre et al., 2008), solar wind dynamic pressure impulse (e.g., Allan et al., 1986; Lee et al., 1989; Zhang et al., 2010; Zong et al., 2012; Shi et al., 2013, 2014; Degeling et al., 2014; Shen et al., 2015), periodic solar wind dynamic pressure variations (e.g., Kepko et al., 2002; Kepko and Spence, 2003), drift-bounce resonance (e.g., Southwood et al., 1969; Yang et al., 2010), and dynamic processes during substorms (e.g., Olson, 1999; Sun et al., 2015).
Although many previous studies have focused on waves occurring in the dayside magnetosphere (e.g., Samson et al., 1981; Rostoker et al., 1984; Zong et al., 2007; Shen et al., 2017), ULF waves occurring on stretched magnetic field lines in the magnetotail have also been reported in some observational studies (e.g., Zheng et al., 2006; Tian et al., 2012) and simulations (e.g., Rankin et al., 2000; Lui and Cheng, 2001). Pc5 (150–600 s) and Pc6 (>600 s) waves are the most common waves occurring at high latitudes and in the magnetotail (Saito, 1978). Investigating the source and characteristics of these waves in the magnetotail will help us further understand the solar wind–magnetosphere–ionosphere coupling processes in the nightside region.
Statistical studies of ULF wave properties in the magnetosphere have been performed using various satellites (e.g., Hudson et al., 2004; Liu et al., 2009; Takahashi et al., 2015). Hudson et al. (2004) performed a statistical study of the occurrence rate of Pc5 magnetic pulsations for both toroidal and poloidal modes at L values from 4 to 9 by using 14 months of magnetometer data from Combined Release and Radiation Effects Satellite (CRRES). They found that there is no dawn–dusk asymmetry on the occurrence rate of toroidal mode oscillations inside L=8; however, the occurrence rate of poloidal mode oscillations is higher on the dusk side. Liu et al. (2009) statistically studied both the occurrence and frequency distributions of Pc5 magnetic pulsations in toroidal and poloidal modes between L=4 and 9 by using 13 months electric and magnetic field measurements from Time History of Events and Macroscale Interactions during Substorms (THEMIS). They found that the occurrence distribution is similar to the results of Hudson et al. (2004) and the frequency is higher on the dawn side than on the dusk side by a factor 2 and decreases with radial distance. Takahashi et al. (2015) statistically investigated the fundamental toroidal mode oscillations from L=7 to 12 by using 2008–2013 ion bulk velocity data from THEMIS-D. They found that the occurrence rate and amplitude of toroidal mode oscillations are higher on the dawn side (04:00–8:00 magnetic local time or MLT, in hours) than on the dusk side (16:00–20:00 MLT). Moreover, the relationship between ULF wave characteristics and the solar wind conditions and geomagnetic activity level was also studied statistically (e.g., Takahashi and Ukhorskiy, 2007; Kokubun, 2013; Wang et al., 2015). Takahashi and Ukhorskiy (2007) found that the solar wind dynamic pressure variance has the best correlation with the power of magnetic pulsations at a geosynchronous orbit. Kokubun (2013) statistically studied Pc5 ULF waves (mostly on the 4–8 and 16–20 MLT) using the Geotail Satellite (GEOTAIL) data during the period of 1995 to 2000. They found that the wave occurrence tends to be larger for higher solar wind velocity (>400 km s−1), with a smaller IMF Bz and a lower cone angle. Wang et al. (2015) studied the spatial distribution of the irregular oscillations Pi2 (40–150 s) and Pc4–5 magnetic fluctuation power in the plasma sheet by using THEMIS A, C, D, and E data from 2007 to 2014. They found that the amplitude of Pc-5 fluctuations is globally larger during periods with a higher auroral electrojet (AE) index, faster solar wind, and larger solar wind dynamic pressure variations.
Although statistical studies of ULF waves have been performed, most have focused on the dayside or near-Earth region. The distributions and excitation mechanisms of ULF waves on stretched magnetic field lines are still unclear. Our work focuses on ULF waves on stretched magnetic field lines ( and 8 RE<R<32 RE).
This paper will be organized as follows. In Sect. 2, the data set and the selection criteria of the ULF wave event are presented. In Sect. 3, we show the statistical results. In Sect. 4, we discuss the occurrence and frequency distributions of ULF waves on the stretched field lines and the influence factors of solar wind parameters and the geomagnetic activity level. The main conclusions of this study are given in Sect. 5.
In this study, we use 3 s resolution magnetic field data from a fluxgate magnetometer (FGM) (Auster et al., 2008) and 3 s resolution plasma data from an electrostatic analyzer (ESA) (Mcfadden et al., 2008) of the THEMIS mission from 2008–2015. The THEMIS mission consists of five satellites (THEMIS A, B, C, D, and E), each with an orbital inclination of about 10∘ (Angelopoulos, 2008). In the first 2 years, the apogees were about 12 RE for THEMIS A, D, and E, 20 RE for THEMIS C, and 30 RE for THEMIS B. After 2010, THEMIS B and C were transferred to a lunar orbit that is about 60 RE from Earth. Because THEMIS A, D, and E have similar orbits, in this study we only use data from THEMIS A, B, and C. In addition, we use 1 min resolution interplanetary magnetic field (IMF) and solar wind plasma data from the OMNI database (https://spdf.sci.gsfc.nasa.gov/; last access: October 2018), which is calculated by time-shifting satellite data taken in the solar wind to Earth's bow shock subsolar point. Figure 1 shows the binned spatial distribution of the total observation time over the 2008–2015 interval for THEMIS A, B, and C in the magnetosphere.
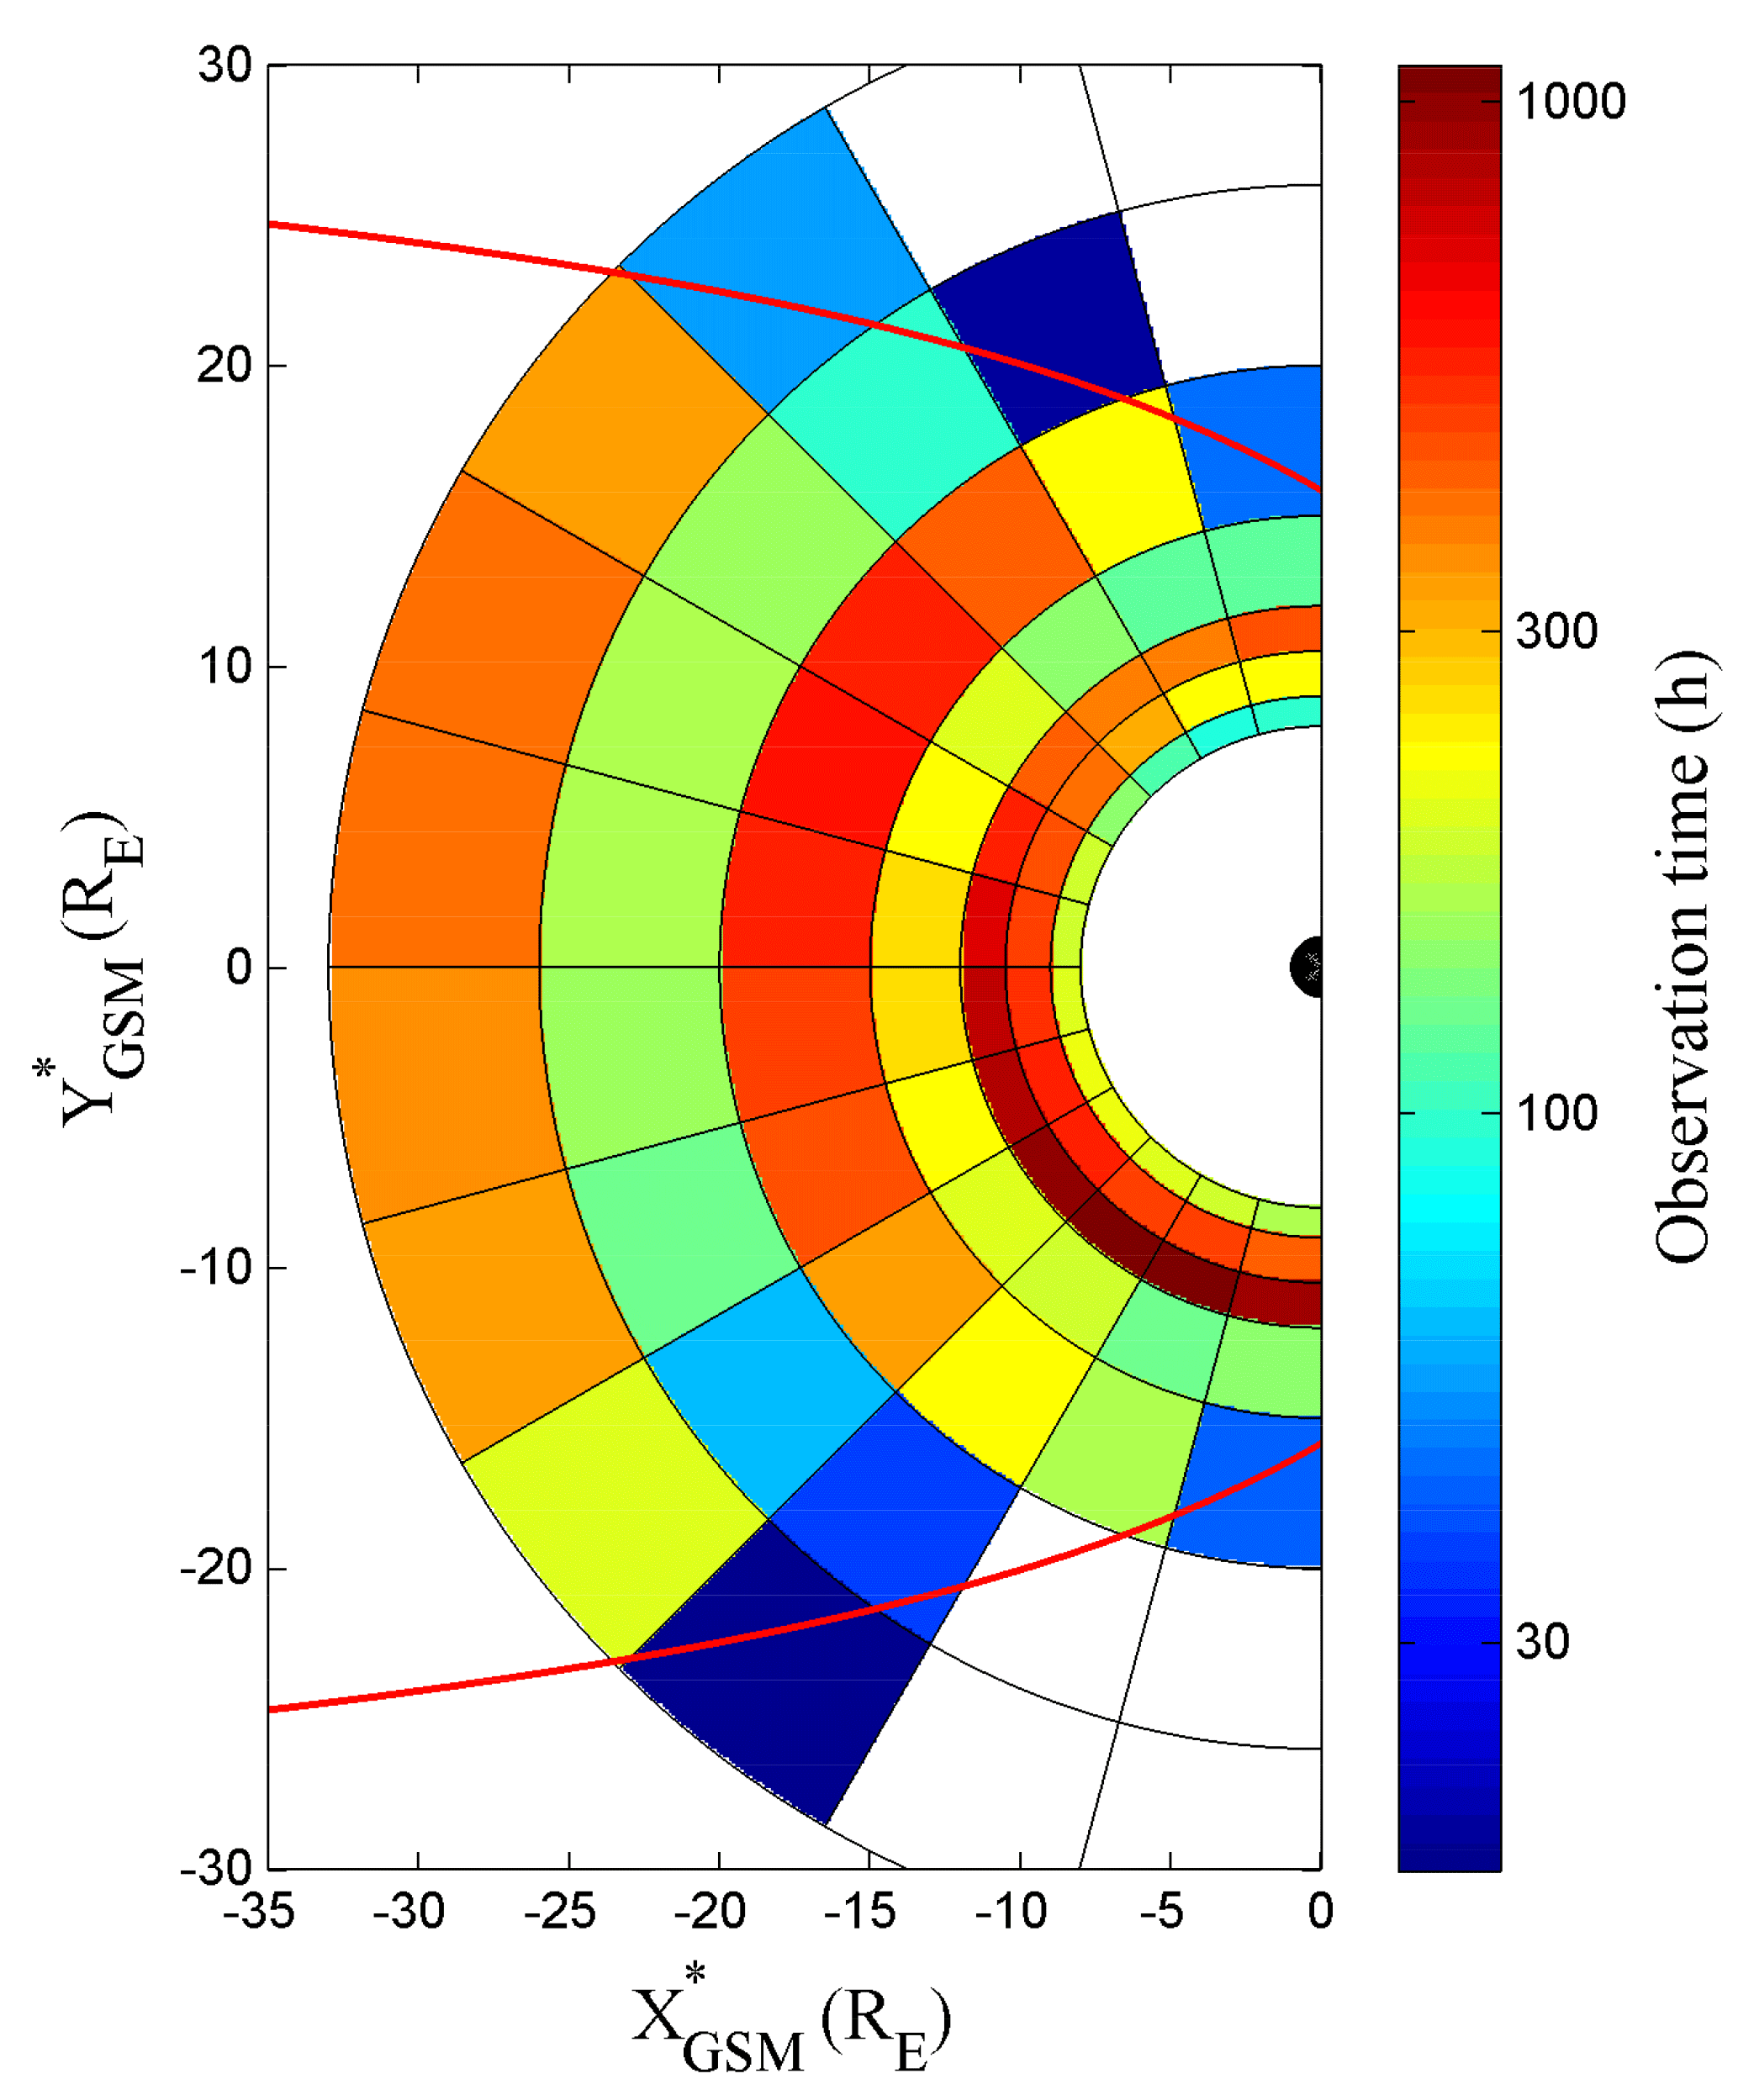
Figure 1The distribution of total observation time of THEMIS A, B, and C in the GSM∗ X-Y plane between 2008 and 2015. The red line is the average magnetopause, calculated by the model of Shue et al. (1998) where dynamic pressure is represented by (Dp) = 1.66 nPa and Bz = 0.16 nT. The blank bins indicate regions where the residence time of THEMIS is less than 10 h.
We use the aberration coordinate GSM∗, whose x axis is rotated 4∘ from the X axis of geocentric solar magnetospheric (GSM) coordinates for the spacecraft position, to remove the effect of Earth's revolution. In GSM coordinates, the x-axis is pointing from Earth towards the Sun, the x–z plane contains the dipole axis; the y-axis is perpendicular to Earth's magnetic dipole towards the dusk and is included in the magnetic equatorial plane. Field-aligned coordinates (FAC) are used to analyze waves and separate the azimuthal and radial oscillating wave components. The FAC system is defined in Eq. (1), where
In this equation, B0 is the background magnetic field vector, derived by taking a 30 min sliding average of the magnetic field data, R is the vector from Earth's center to the satellite, z is the parallel unit vector, a is the unit vector pointing east and r completes the right-hand rule. It should be noted that the direction of r is approximately radial due to the equatorial orbits of THEMIS.
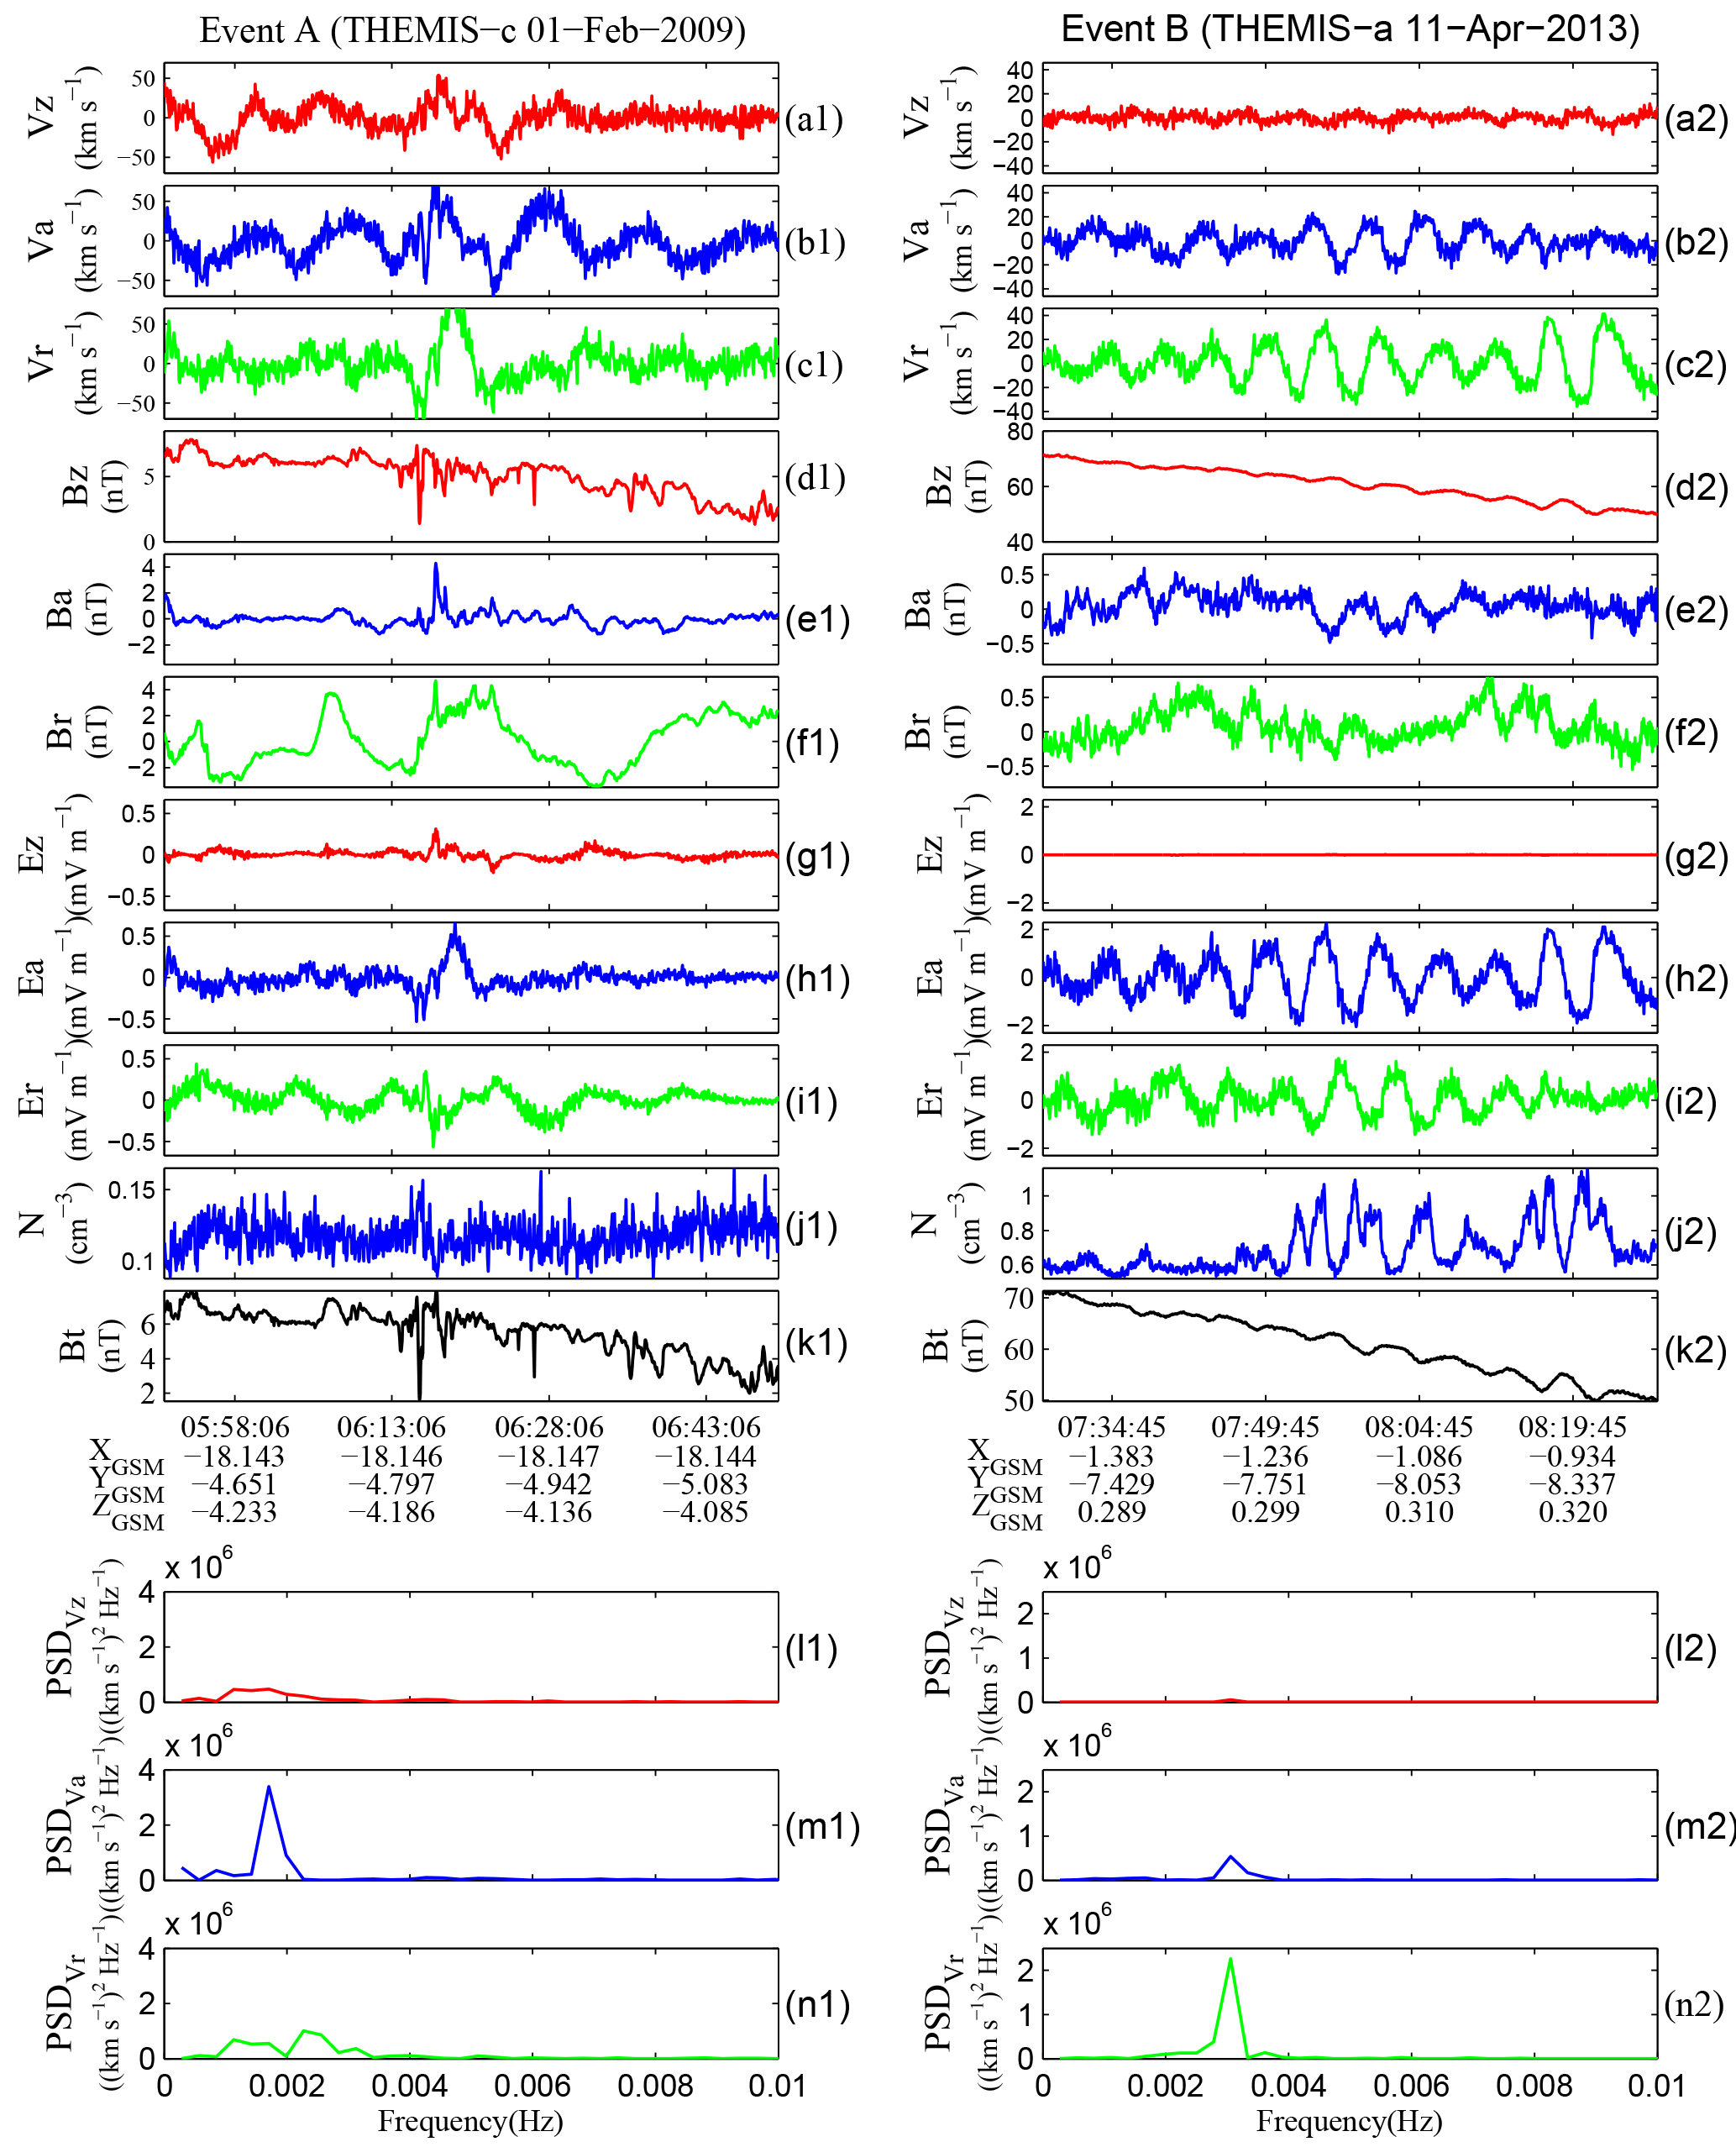
Figure 2Examples of an azimuthal oscillating event (Event A) from 05:50 to 06:50 UT on 1 February 2009 and a radial oscillating event (Event B) from 07:28 to 08:28 on 11 April 2013. (a–c) represent velocity components, (d–f) magnetic components, (g–i) electric field components, (j) total ion density, (k) total magnetic field, and (l–n) FFT analysis of ion velocity.
In this study, we mainly use ion velocity data to identify ULF waves, following the technique of Takahashi (2015). They suggested that using velocity is better than using magnetic field data, because fundamental mode magnetic field fluctuations (considered most likely in the Pc5 range) give rise to a node near the equatorial plane, making their measurement problematic along the low-inclination THEMIS orbital path. On the other hand, the fundamental mode has an antinode for the electric field and plasma velocity fluctuations under ideal MHD conditions. The electric field data are therefore estimated by , where δV indicates the variation of velocity, which is obtained by subtracting the 30 min sliding average values.
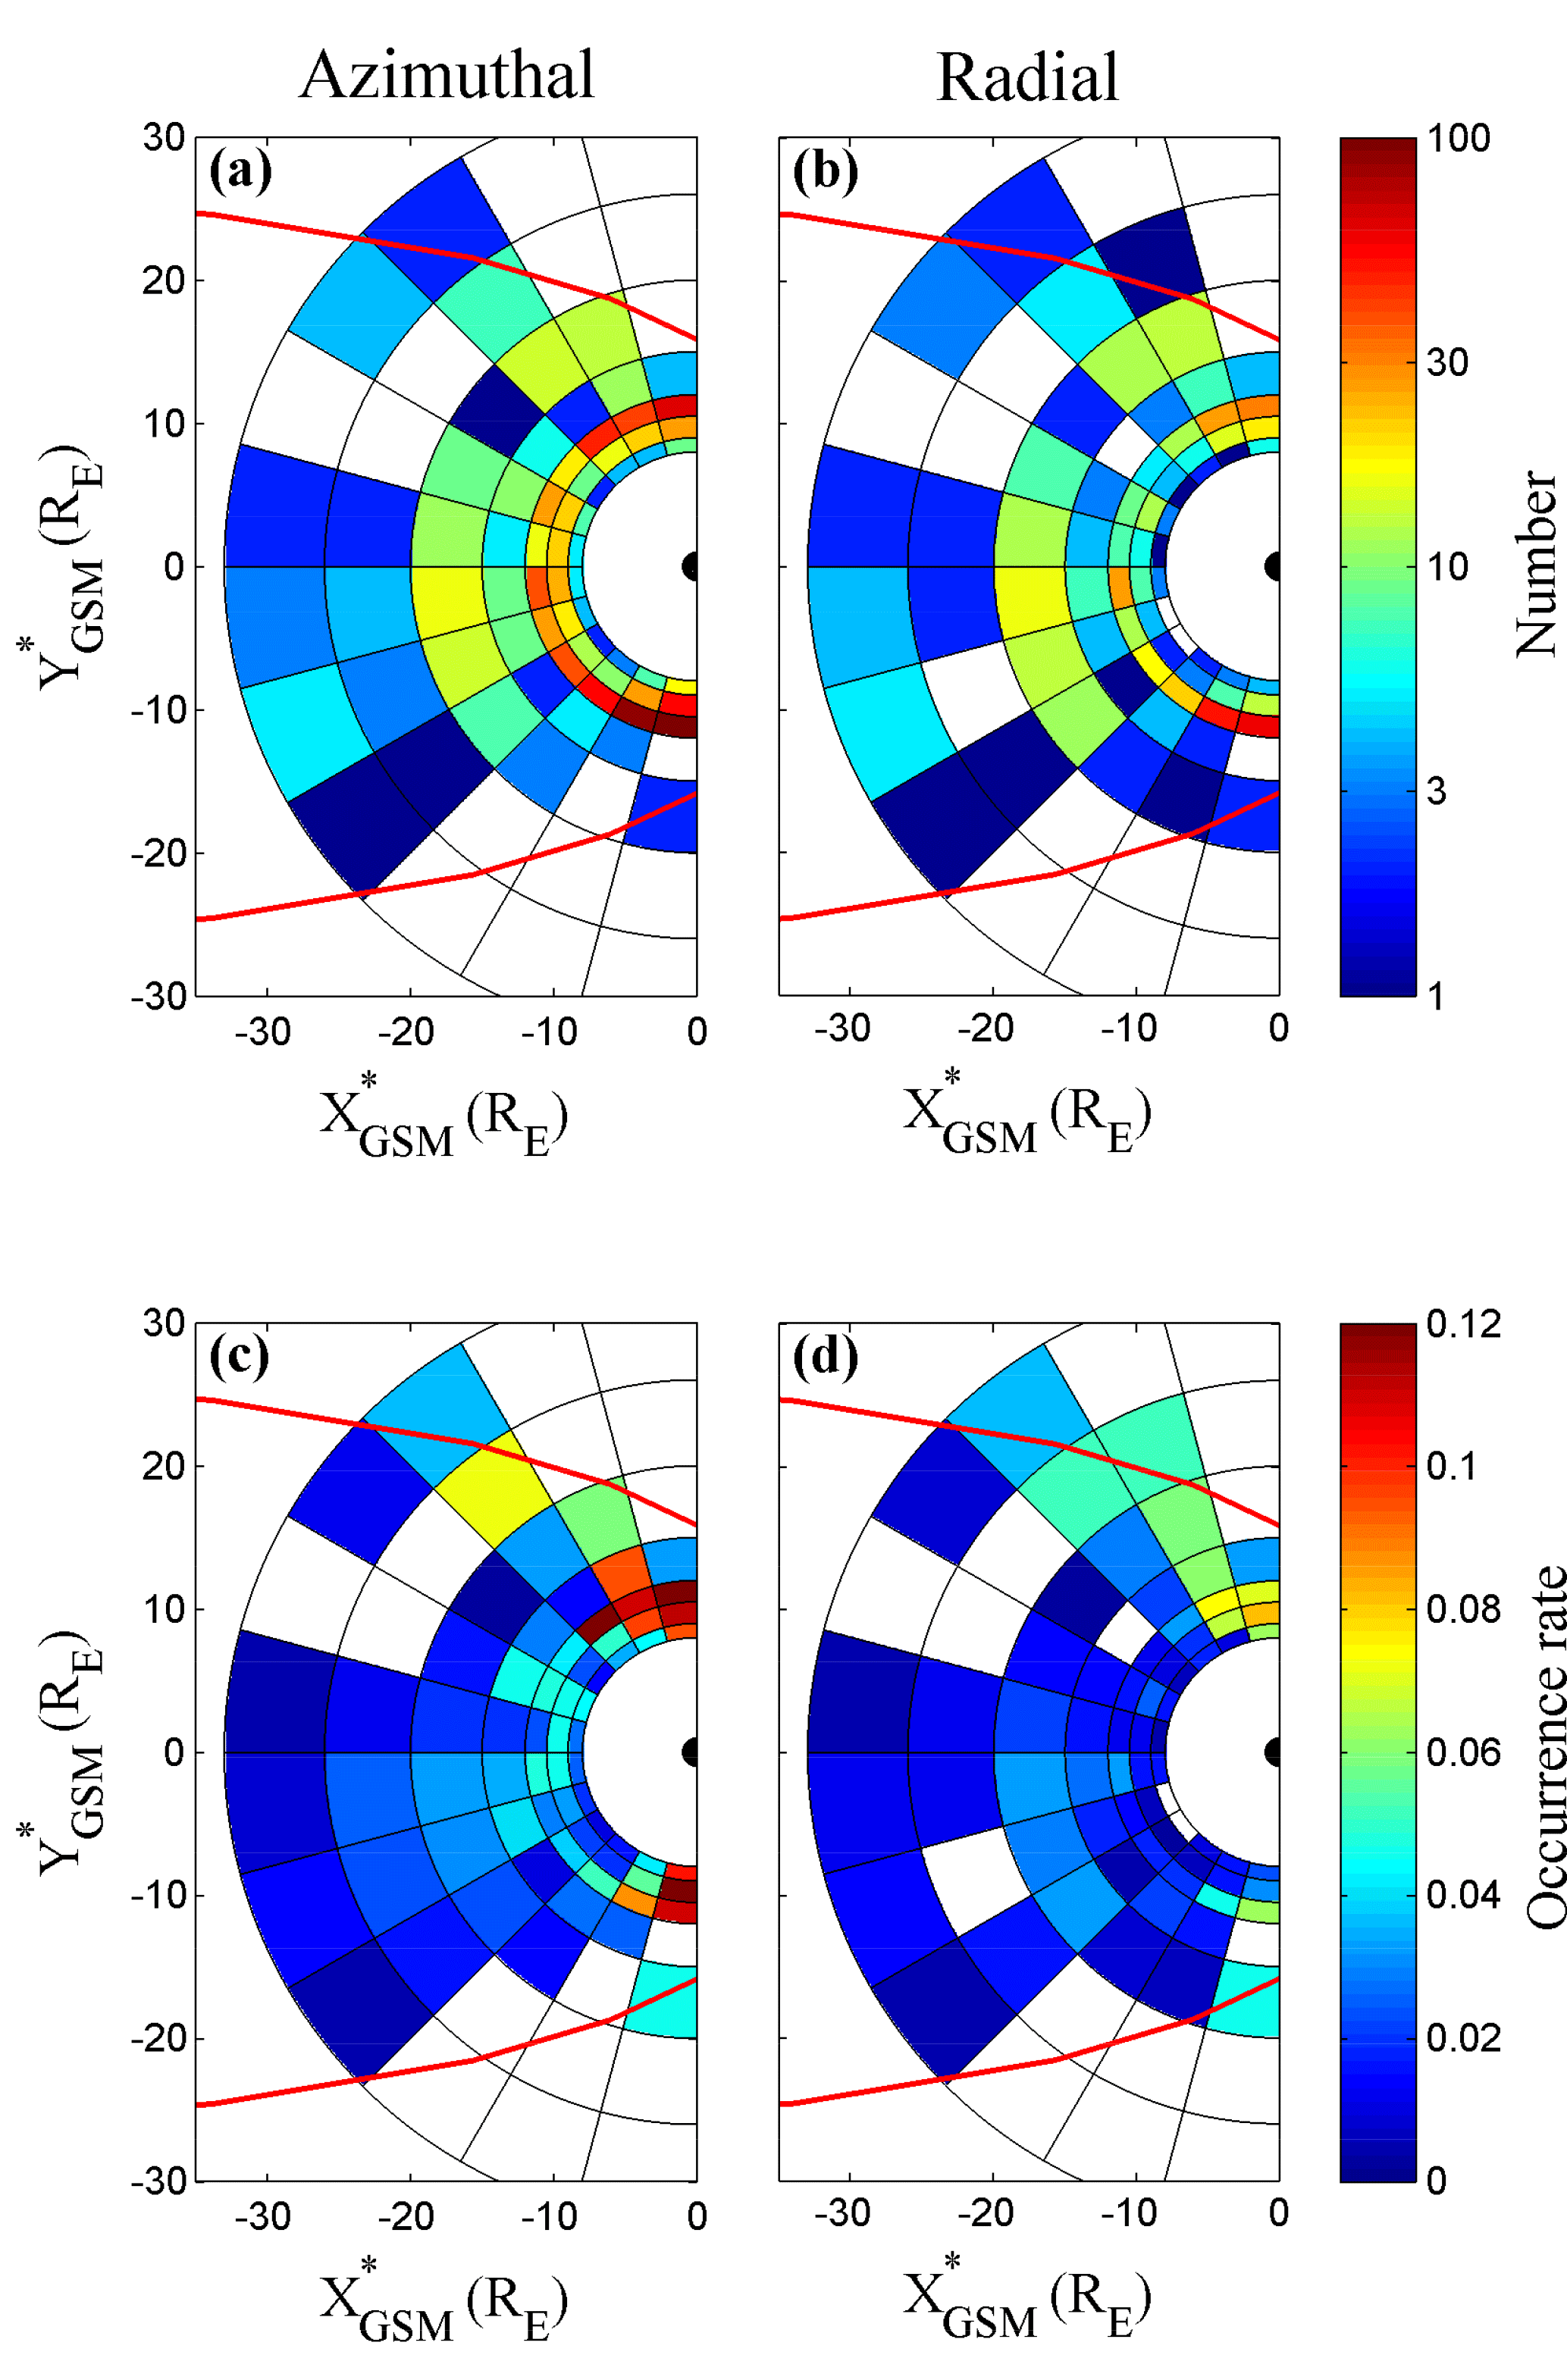
Figure 3The number (a, b) and occurrence rates (c, d) of azimuthal oscillating wave events (a, c) and radial oscillating wave events (b, d) in the GSM∗ X-Y plane.
As shown in Fig. 1, the region concerned in this work is RE and 8 RE<R<32 RE. In order to remove the likelihood of the identification of ULF wave events when THEMIS enters the magnetosheath or solar wind regions, only events for which density values less than 1 cm−3 if RE are included in the database.
The following criteria are used to select ULF waves in the magnetotail: (i) the wave frequency is below 7 mHz, (ii) the wave is quasi monochromatic and includes at least three cycles, (iii) the maximum of peak to trough value of fluctuations is more than 50 km s−1, (iv) mirror-like structures indicated by anti-phase variations of magnetic field and density are excluded, and (v) magnetotail flapping events characterized by sign changes in Bx are excluded. A quantitative standard is used to determine the beginning and ending time of each event, namely that the beginning and ending times are at the points where the amplitude is 20 km s−1. Additionally, if the interval time between two events is less than 20 min and they have similar frequency (within 0.5 mHz), we consider them as a single event.
The process of selecting wave events and distinguishing the wave mode in this study is as follows. Firstly, we conduct a wavelet analysis of THEMIS ion velocity and magnetic field data in GSM coordinates and choose the wave events that roughly satisfy the criteria mentioned above. Then, we transform from GSM to FAC coordinates for magnetic field and ion velocity data and calculate the electric field. To quantitatively distinguish the azimuthal or radial oscillating waves, a fast Fourier transform (FFT) analysis is applied to all three components of the ion velocity (Fig. 2).
Figure 2 shows two typical events (labeled A and B), with Event A occurring near R≈19 RE from 05:50 to 06:50 UT on 1 February 2009 and showing azimuthal oscillations, and Event B occurring near R≈8 RE from 07:28 to 08:28 on 11 April 2013 and showing radial oscillations. Figure 2 shows three components of the ion velocity (a–c), magnetic field (d–f), and calculated electric field (g–i), in addition to the total ion density (j) and total magnetic field (k), which are used for excluding mirror-like structures. Figure 2l–n show the power spectral density (PSD) of the three components of the ion velocity derived by FFT. Only events with an obvious single spectral peak, similar to events A and B, are considered quasi-monochromatic waves and are selected in our list of events. In events A and B, the peak in the PSD of the dominant wave component exceeds its counterpart by a factor of 4, enabling their unambiguous designation as an azimuthal and radial oscillation event, respectively. Events for which the peak in the PSD in Va and Vr have similar magnitudes are simply regarded as both an azimuthal oscillating event and a radial oscillating event. Note that the magnetic field vector used for calculating E () at each moment may deviate from the z-axis determined by the 30 min sliding average of the magnetic field data. Therefore, the Ez component will have a small deviation from zero in the FAC coordinate system, as shown in Fig. 2g.
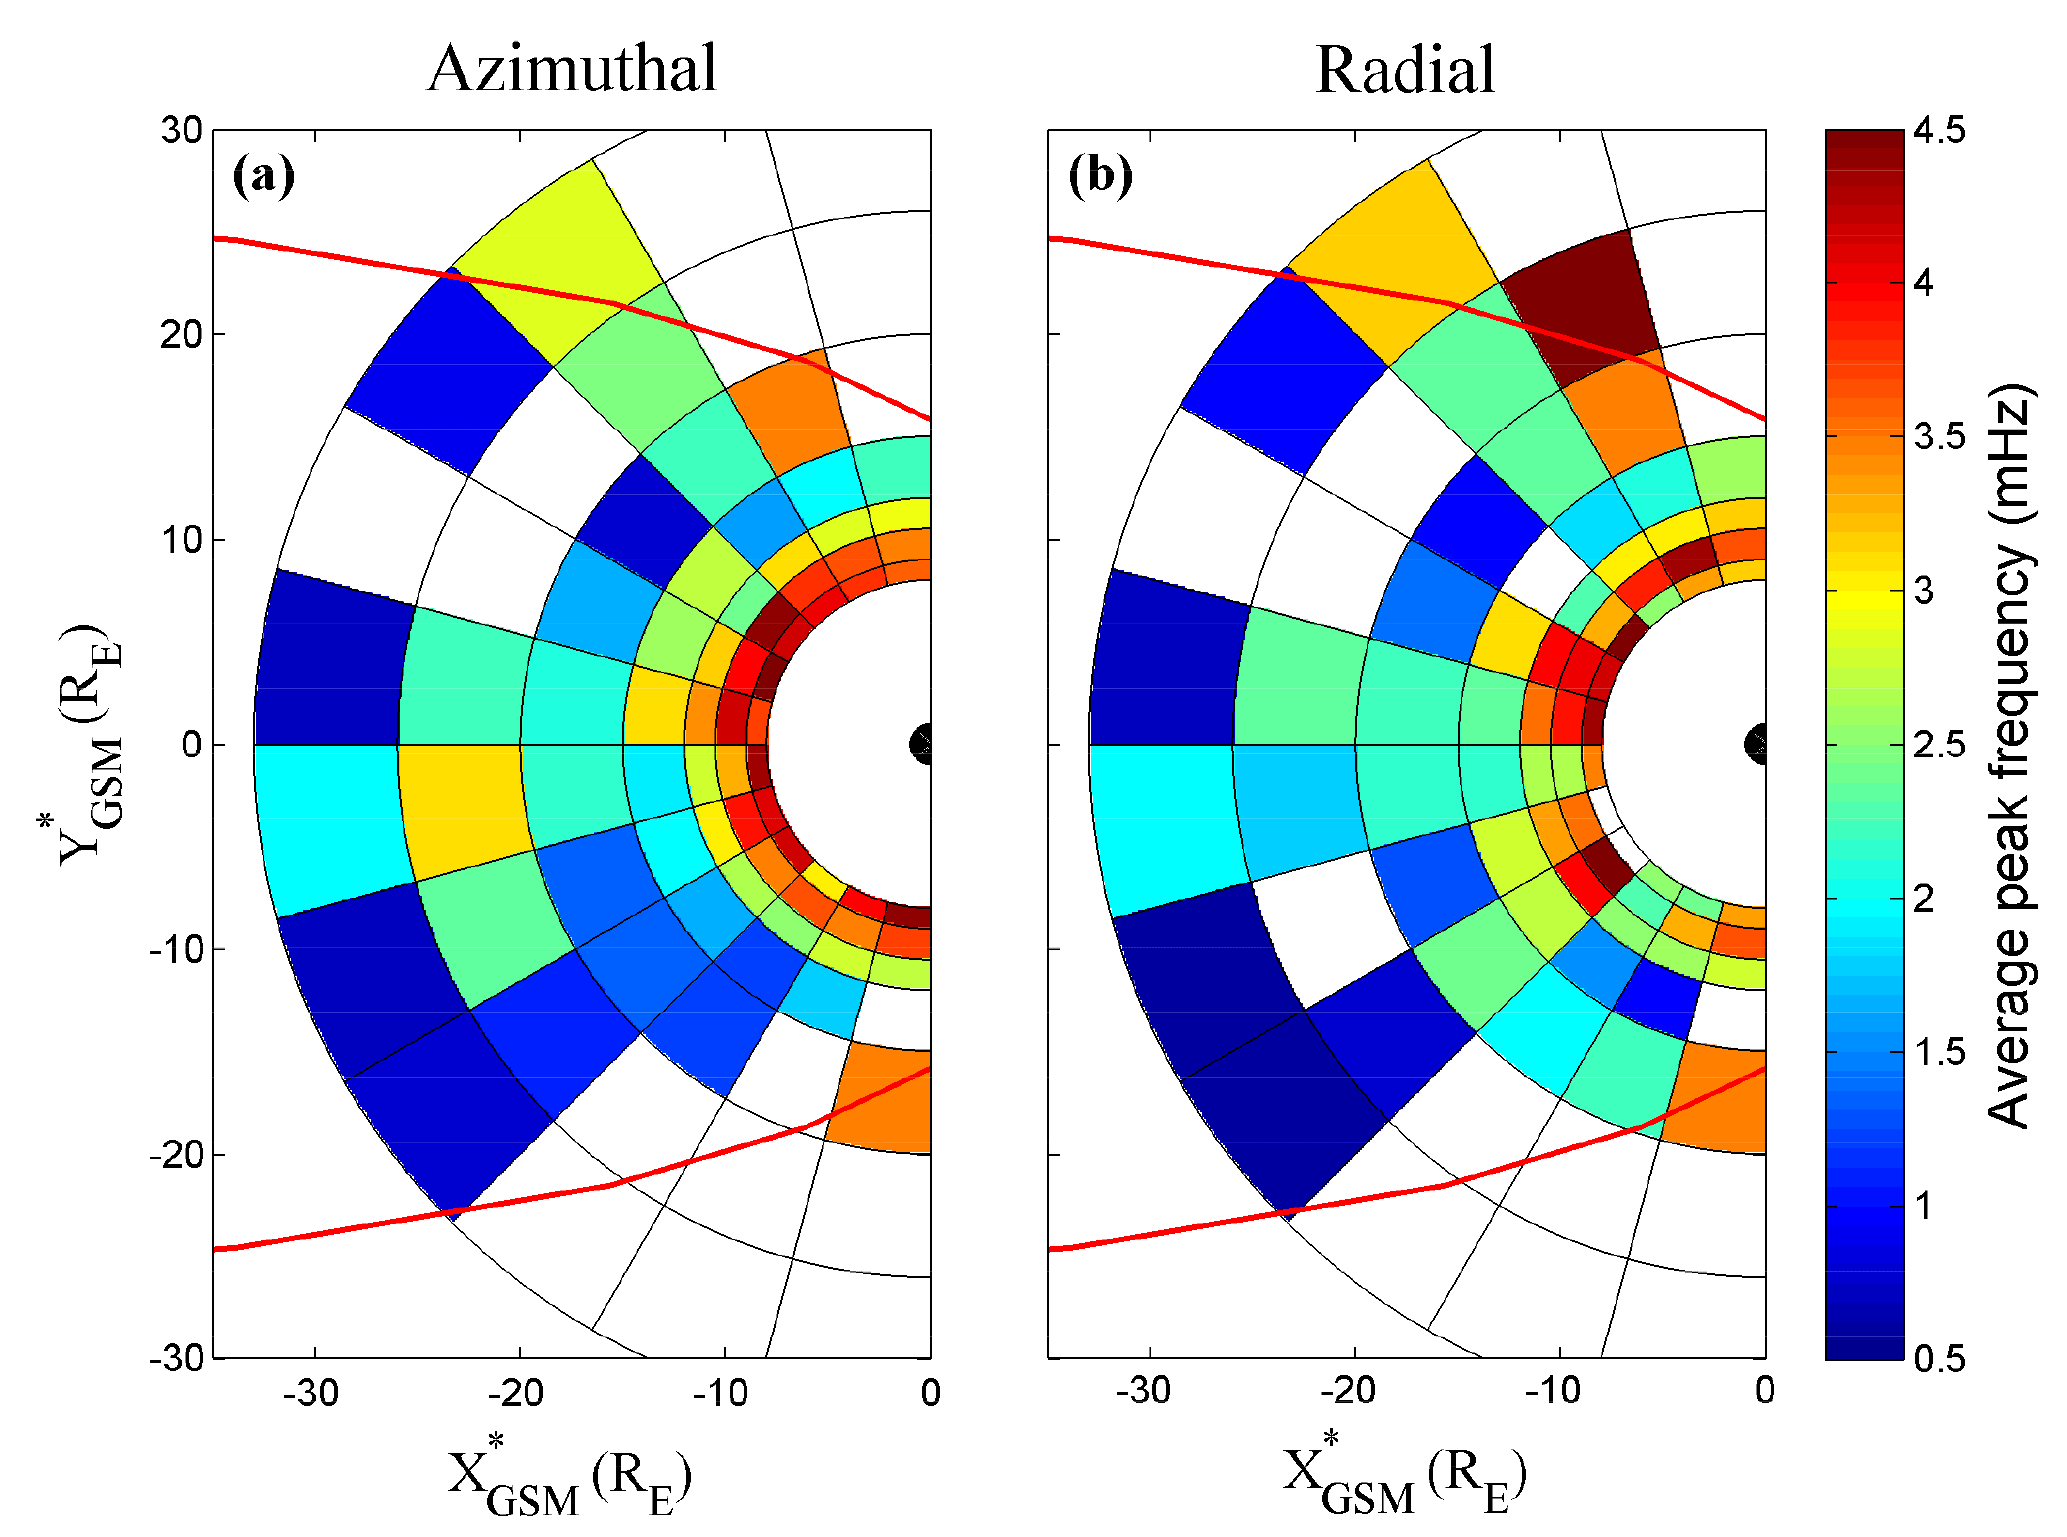
Figure 4The average frequencies of azimuthal oscillating wave events (a) and radial oscillating wave events (b) in the GSM∗ X-Y plane.
In total, we find 1089 azimuthal oscillating wave events and 566 radial oscillating wave events, with an average event-time duration of ∼54 min. Figure 3a and b show the spatial distribution of the number of events in the GSM∗ X-Y plane, both for azimuthal (left panel) and radial (right panel) oscillating wave events. The blank bins inside the magnetopause indicates that there are no events.
3.1 Occurrence rate
Figure 3c and d show the occurrence rates of azimuthal oscillating wave events (left panel) and radial oscillating wave events (right panel) in the GSM∗ X-Y plane. The color indicates the occurrence rate calculated by dividing the total duration of all events by the total duration of observations in each bin shown in Fig. 1. The blank bins inside the magnetopause indicate that there are no events. In the near-Earth region (8 RE<R<12 RE), we can see that the occurrence rates of both azimuthal and radial oscillating events in the dusk and dawn flanks (18:00–21:00 MLT and 03:00–06:00 MLT) are higher than the midnight regions (21:00–03:00 MLT). For radial oscillating events, the occurrence rates of waves are higher on the dusk side than on the dawn side. For azimuthal oscillating events, the dawn–dusk asymmetry in the occurrence rates is less clear than that of radial oscillating events. In the magnetotail region (12 RE<R<32 RE), the occurrence rates of both modes of waves are slightly higher in the post-midnight region. Note that, although no wave events are found in the dawn-side flank region (20 RE<R<32 RE, 03:00–06:00 MLT), the total observation time is also very short (< 38 h) in this region. So we cannot conclusively say that the occurrence rates on the dusk side flank region are higher than that of the dawn side.

Figure 5The wave frequency versus radial distance for azimuthal (a, c) and radial (b, d) oscillating events. In panels (a) and (b), the grey dots are individual events and the open circles are the median values of frequencies in each 1 RE bin. The vertical bars connect the lower and upper quartiles. In panels (c) and (d), the grey dots and circles indicate the dusk and dawn events, respectively. The solid and open triangles are the same as the open circles in Fig. 5a, but for dusk and dawn events, respectively.
3.2 Frequency distribution
Figure 4 shows the spatial distribution of the average frequency for azimuthal (left panel) and radial (right panel) oscillating wave events in the equatorial plane. The color in each bin is the average of all event frequencies (obtained by FFT analysis as described earlier) in that bin. A blank bin inside the magnetopause indicates that there are no events. It can be seen roughly that the frequency decreases with increasing radial distance both for azimuthal and radial oscillating wave events in the region of R<15 RE. Note that the crimson bin in the upper right corner (19:00–20:00 MLT and 20<R<26 RE) of the right panel is caused by a short residence time (∼19 h) and only one wave event with a frequency of 5.71 mHz.
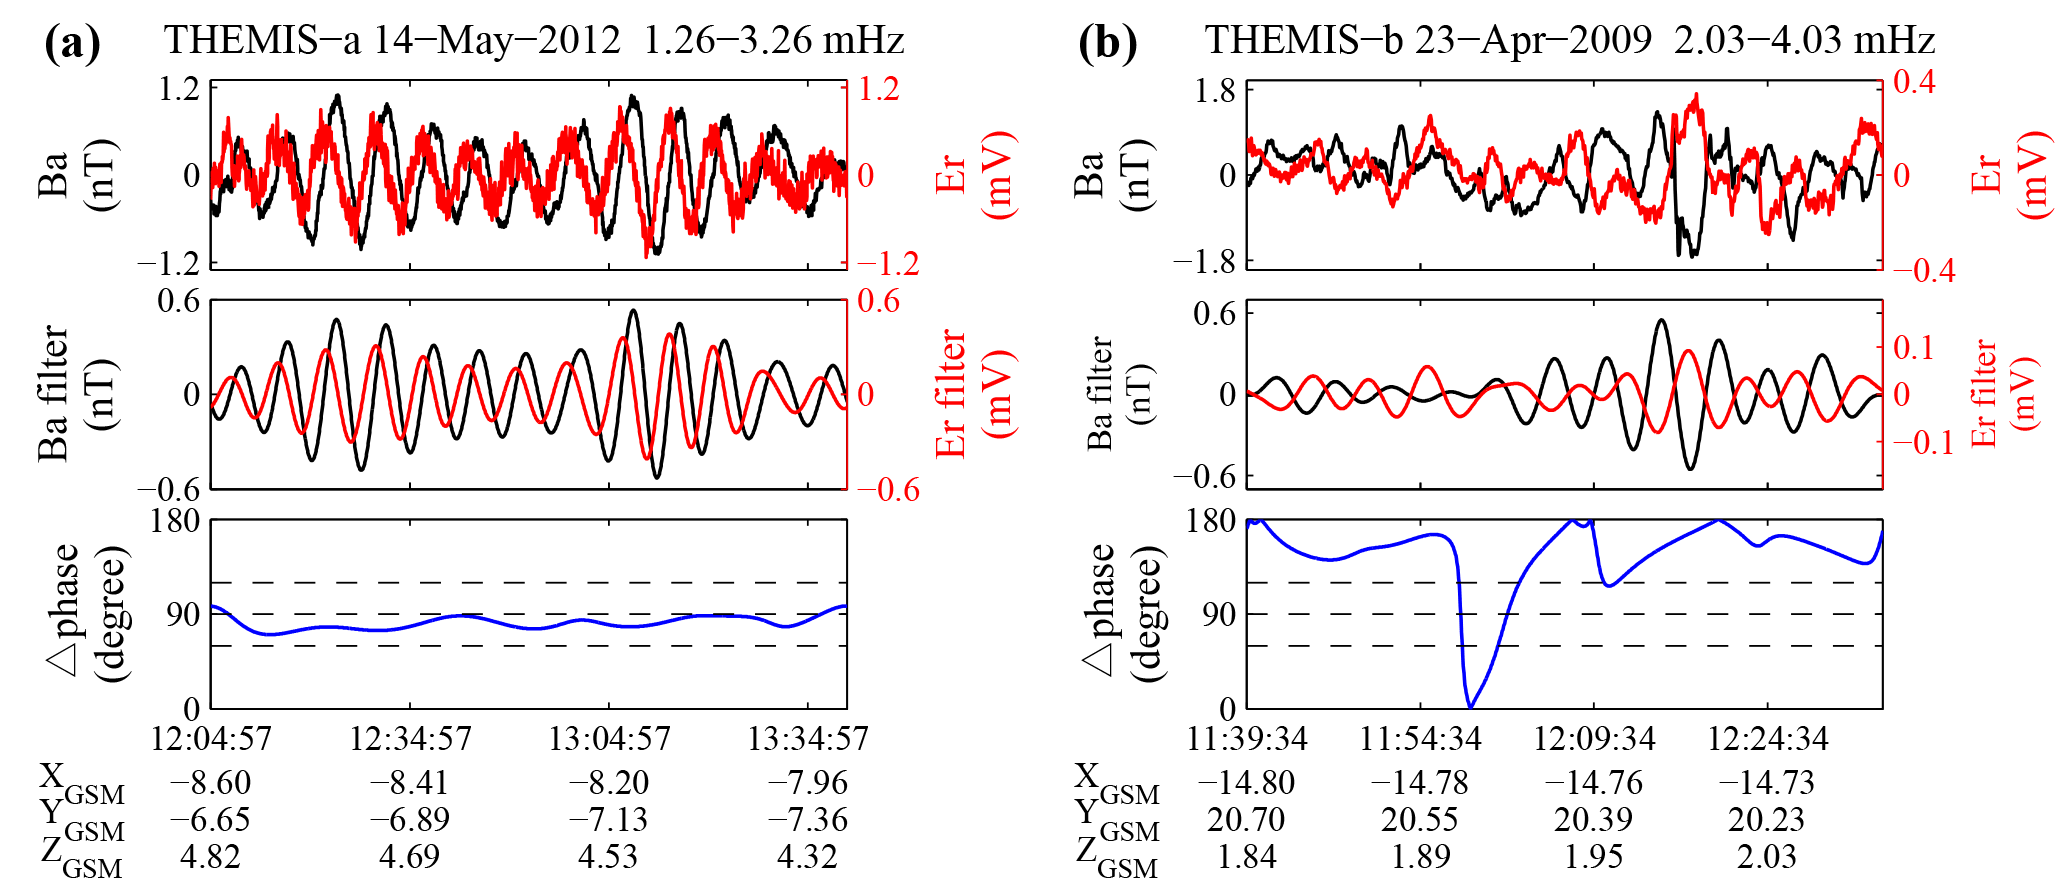
Figure 6Examples of (a) a standing azimuthal oscillating event and (b) a non-standing azimuthal oscillating event.
We further plot the relationship between the peak frequency and the distance from Earth in Fig. 5. It shows that the frequency can be as low as 0.55 mHz. As shown in Fig. 5a and b, the median frequency of azimuthal oscillating events decreases with increasing radial distance from Earth in the region with 8 RE<R<16 RE, and the same trend is found for the radial oscillating events with 8 RE<R<14 RE. Figure 5c and d show frequency distribution of events in the dawn side (Y∗ gsm <0) and dusk side (Y∗ gsm >0) regions, respectively. The frequency for both azimuthal and radial oscillating events show no obvious dawn–dusk asymmetry. This is verified by the Wilcoxon rank sum test applied to the dawn and dusk data sets. The Wilcoxon rank sum test is a non-parametric statistical hypothesis test that can be used to assess whether two samples have the same distribution or not (Gibbons and Chakraborti, 2011). Specifically, in the Wilcoxon rank sum test, a P-value result greater than 0.01 means that there is no significant statistical difference between two data sets. The P-value for the dawn and dusk side data sets is 0.4535 (for all azimuthal and radial oscillating events). This confirms that the dawn- and dusk-side frequency data sets belong to the same distribution.
3.3 Standing wave
According to Singer et al. (1982), Alfvénic standing wave oscillations are characterized by a phase difference of 90∘ between the electric field and magnetic field components. Figure 6 shows the standing wave analysis of two azimuthal oscillating events. The first row shows the magnetic field component Ba and electric field component Er. The second row shows the 1.26–3.26 mHz (Fig. 6a) and 2.03–4.03 mHz (Fig. 6b) band-pass filtered Ba and Er components. The lower (upper) limits of the frequency bands are obtained by subtracting (adding) 1 mHz from the peak frequencies in Fig. 2–n. The absolute value of the phase differences between the band-pass filtered Ba and Er are shown in the bottom panels, in which three dotted lines indicate the 60, 90, and 120∘ phase differences, respectively. We can see that the first event (Fig. 6a) shows characteristics of a standing wave, as indicated by the ∼90∘ phase difference between Er and Ba, while the second event (Fig. 6b) does not have this characteristic. We quantify the criteria of standing azimuthal (radial) oscillating waves as the absolute value of the phase differences between the filtered Ba and Er (Br and Ea) that falls within the range 60–120∘ and lasts for at least three cycles.
Figure 7 shows the radial distribution of the probability that a given azimuthal or radial oscillating wave event shows signatures of a standing wave. The light and dark histogram represents the probability for azimuthal and radial oscillating events, respectively. The error bars shown are calculated by , where n is the number of standing wave events and N is the total number of wave events in each bin and for each polarization. It is obvious that standing waves occupy a larger proportion in the region of 8–16 RE, while almost no standing waves are identifiable in the region of 16–32 RE. We find that about 52 % events (including the azimuthal and radial oscillating events) are standing waves in the region of 8–16 RE, while only 2 % are standing waves in the region of 16–32 RE. This figure also shows that the probability of standing waves is higher for the azimuthal oscillating events than for the radial oscillating events.
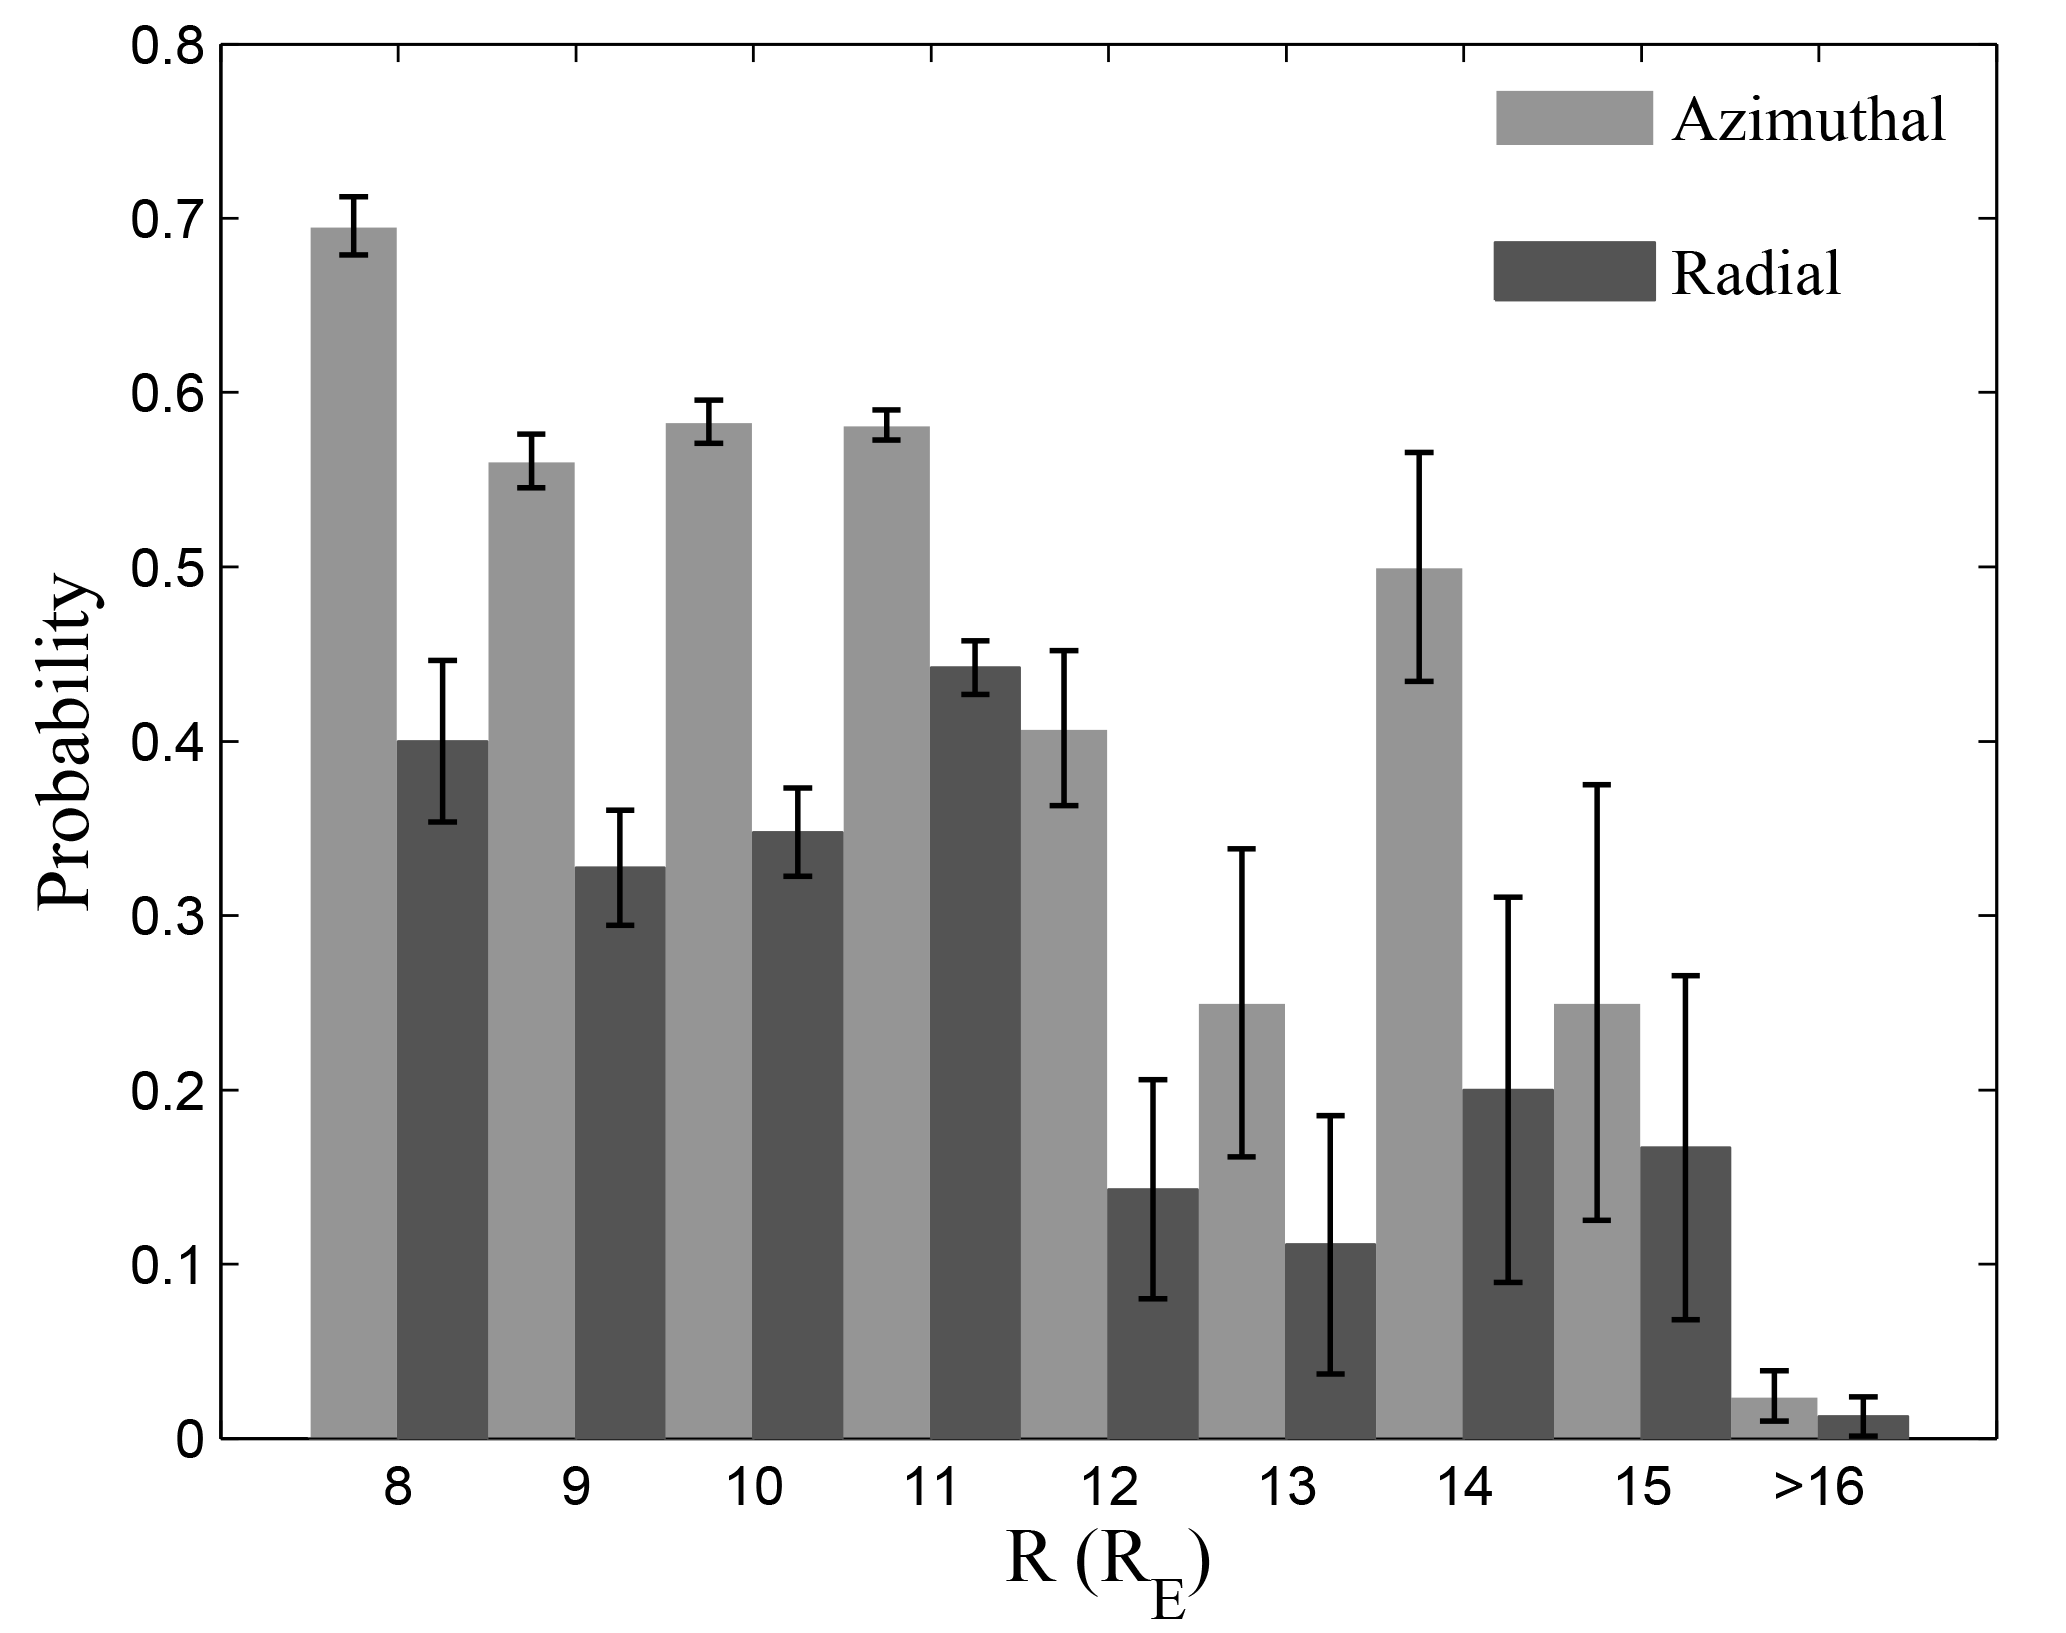
Figure 7The radial distribution of the probability of identifying standing waves for azimuthal and radial oscillating events (light and dark histograms, respectively).
Using THEMIS data during the period from 2008 to 2015, we find 1314 Pc5–6 ULF wave events in the region of and 8 RE<R<32 RE. The elevation angle of the magnetic field of each event was calculated by the formula , where Bx, By, Bz are the three magnetic field components in GSM∗ coordinates. We find that 61.70 % of the events have an elevation angle larger than 45∘, and only 2.48 % events have an elevation angle less than 10∘. This suggests that most of our events are observed near the magnetic equatorial plane. The harmonic mode of each event was identified by the E–B phase difference and the magnetic latitude. We find that only 2.90 % wave events may be second harmonic waves. It is reasonable to consider that most of our standing wave events belong to the fundamental eigenmode. In this study, the ion velocity data used to identify ULF waves are usually reliably measured in the plasma sheet. Furthermore, Lui and Cheng (2001) indicated that the magnetic field lines in the nightside are very stretched in the region of R>8 RE, especially during intervals of high Kp index. We therefore consider it likely that most of our events should be observed on stretched magnetic field lines but not on open magnetic field lines.
4.1 Occurrence rate
As shown in Fig. 3c and d, in the region of 8 RE<R<12 RE, the occurrence rates are higher on the dusk side than dawn side for radial oscillating waves, while the dawn–dusk asymmetry in the occurrence rates is less clear for azimuthal oscillating waves than that for radial oscillating waves. This is consistent with the wave mode distributions in the inner magnetosphere (4 RE<R<9 RE) presented in previous works (Hudson et al., 2004; Liu et al., 2009). One possible reason is that the westwardly drifting ions' injection, which is associated with substorm, may excite more radial oscillating wave events on the dusk side via the ion drift-bounce resonance (Southwood et al., 1969; Chen and Hasegawa, 1988). However, Takahashi et al. (2014) found that the occurrence rate of toroidal waves is higher on the dawn side than dusk side, which is different from our results. We noticed that they only focused on the pure toroidal wave, while azimuthal oscillating waves with comparable power in Va and Vr are also included in our list of events. Thus, more azimuthal oscillating waves could be observed on the dusk side because of the possible coupling of azimuthal oscillating waves and radial oscillating waves (with higher occurrence in the dusk sector). In contrast to that of the inner magnetosphere (4 RE<R<9 RE), the occurrence rates for both azimuthal and radial oscillating events in the region of 12 RE<R<32 RE are slightly higher on the post-midnight region than the pre-midnight region. It is possible that the K–H instability may play an important role on the generation of ULF waves on the stretched magnetotail, given that the K–H instabilities are more inclined to occur in the dawn side than in the dusk side (Nykyri et al., 2013) and even can happen in the down tail flanks up through the lunar orbit (∼60 RE) (Wang et al., 2017). In view of the limited observation times in the dawn-side magnetopause, more events are needed to further study the definite reasons of the dawn–dusk asymmetry of the occurrence rate in the outer-side region (12 RE<R<32 RE).
4.2 Frequency distribution
As shown in Fig. 5a and b, the frequency decreases with increasing radial distance from Earth for both azimuthal oscillating events (8 RE<R<16 RE) and radial oscillating events (8 RE<R<14 RE). This is consistent with the Alfvén continuum of field line resonance (FLR) theory (e.g., Allan and Poulter, 1992; Waters et al., 2000). However, this trend does not continue for R>16 RE. Previous observation and simulation studies have shown that standing waves can exist on the stretched magnetic field lines (Lui and Cheng, 2001; Zheng et al., 2006; Tian et al., 2012). Our statistical results show that 52 % of all event types are standing waves in the region of 8–16 RE, while only 2 % can be confirmed as standing waves in the region of 16–32 RE, as shown in Fig. 7. Given the likelihood that most of our wave events belong to the fundamental mode, the uncertainty in the phase measurement of the weak magnetic field signal near the equatorial plane will affect the identification of standing waves. Moreover, the complicated phase relationship between the electric field and the magnetic field caused by magnetic field disturbances in the farther deeper magnetotail will also affect the identification of standing waves. These suggest that our data may underestimate the proportion of standing wave events. Even so, the finding that only 2 % of events in the down-tail region (R>16 RE) can be identified as standing waves suggests that the standing waves are far less common on the highly stretched field lines.
As shown in Fig. 5c and d, there is no obvious dawn–dusk asymmetry in the ULF wave frequency for 8 RE<R<32 RE. This is different from previous studies in the near-Earth region (Liu et al., 2009; Takahashi et al., 1982, 2015). Takahashi et al. (1982) found that the frequencies of Pc3–4 ULF waves were higher on the dawn side than on the dusk side at a geosynchronous orbit. They suggested that the quasi-parallel shock and the associated turbulent magnetosheath flow is more likely to occur on the dawn side, which leads to higher harmonic waves to be excited on the dawn side. Takahashi et al. (2015) found that the frequencies of Pc5 toroidal waves in the region with L values between 7 and 12 RE is lower in the dusk side (16:00–20:00 MLT) than in the dawn side (04:00-08:00 MLT). They suggest that this is due to the higher mass density in the dusk-side near-Earth region, supplied by the particles from ionosphere. However, the wave frequency distributions shown in this paper (, 8 RE<R<32 RE) show a different distribution feature from that of the events in the inner or dayside magnetosphere. This suggests that neither of the above mechanisms for producing asymmetry are important within the region of interest in our study. This may be expected for the turbulent magnetosheath flow mechanism more applicable to higher frequencies. The influence of particle injection from the ionosphere may be weakened by higher E×B drift speeds and longer field line lengths in the nightside magnetotail region, compared to the near-Earth region.
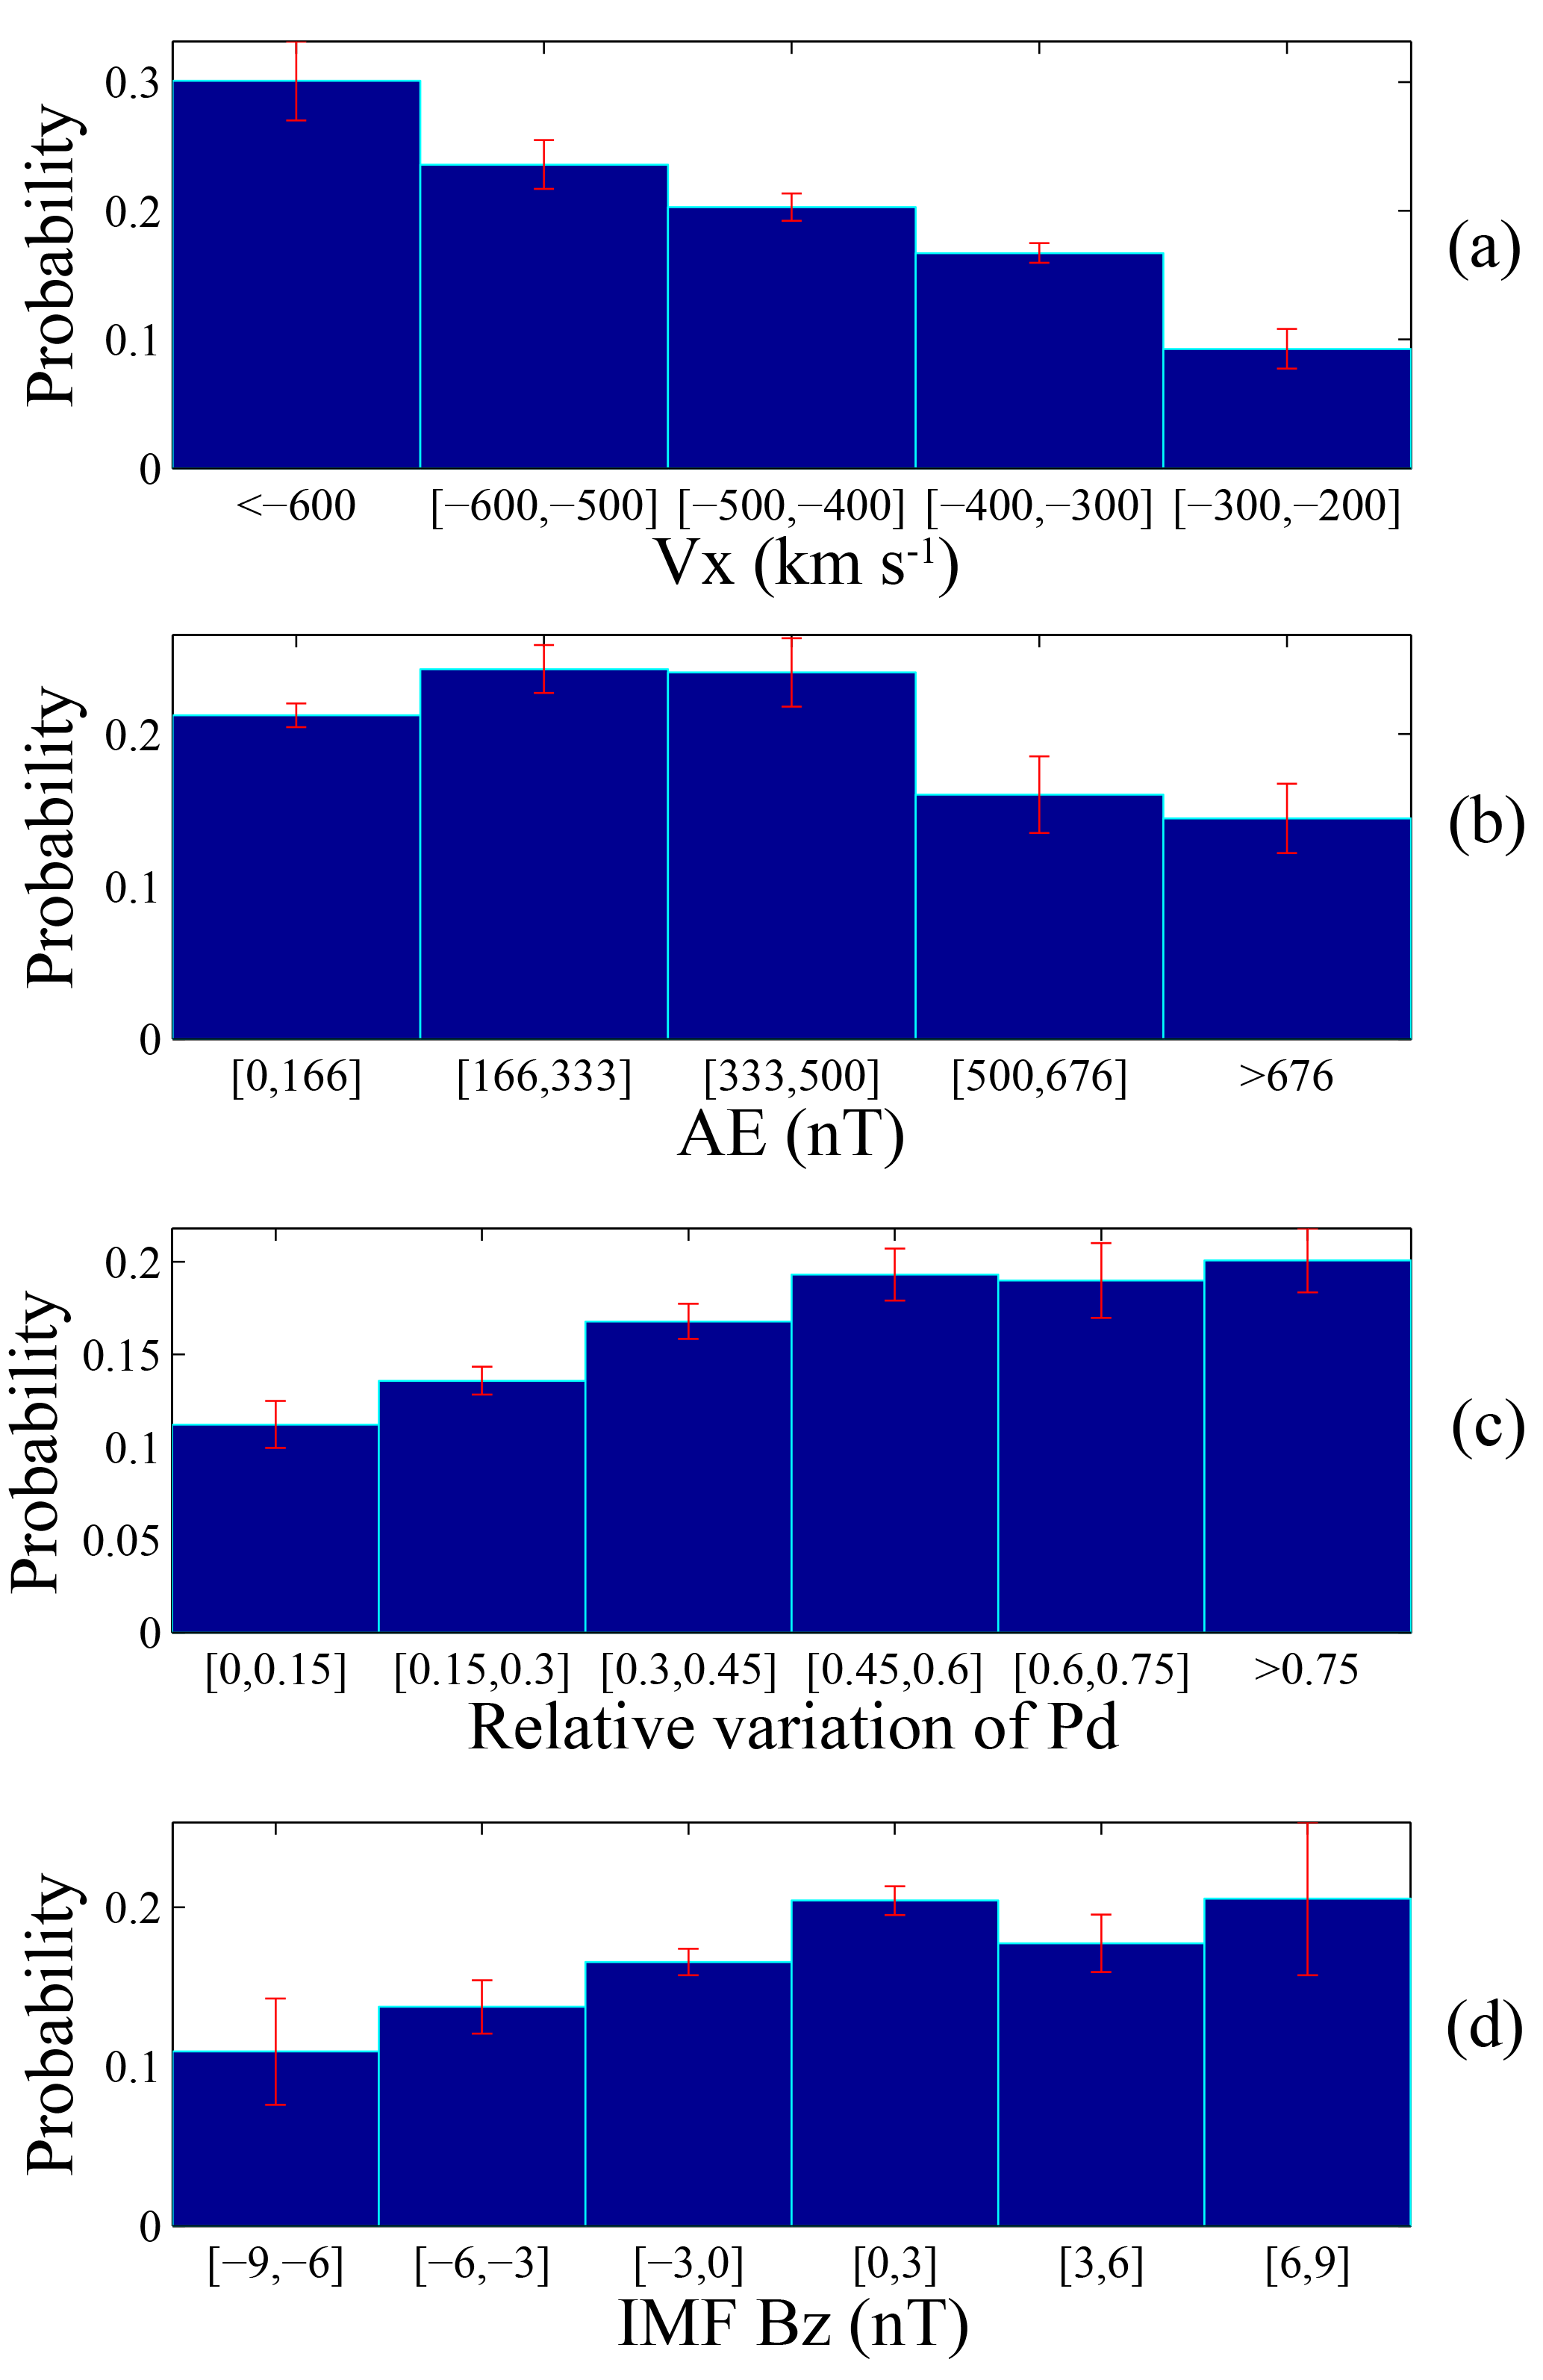
Figure 8The occurrence probability of waves versus (a) solar wind velocity Vx, (b) AE index, (c) relative variation of Pd, and (d) IMF Bz.
4.3 The influence of solar wind parameters and geomagnetic activity level
Figure 8a and b show the relationship between the occurrence rate of wave events and solar wind velocity Vx and the AE index. The y-axis indicates the probability of detecting one wave event in each bin. The background solar wind data are obtained from OMNI from 2008 to 2015. We can see that the ULF wave occurrences increase with increasing solar wind speed . This implies that the K–H instability could be a source of ULF waves in the magnetotail region (8–32 RE), since the higher shear velocity is an important factor in exciting K–H instabilities (Miura, 1992). Figure 8b shows that the wave occurrence is higher when the AE values are less than 500 nT. Note that about 74.8 % of the waves occurred when the AE values are less than 250 nT. This suggests that most of the wave events in the magnetotail are observed during quiet times or weak substorm times. Figure 8c and d show the relationship between the occurrence of ULF waves and the relative variation of the solar wind dynamic pressure (Pd) and the IMF Bz values. The relative variation of Pd for a given event is calculated by the formula , where Pdmax, Pdmin, and Pdmean denote the maximum, minimum, and mean value of the solar wind Pd within a 30 min window, starting 20 min before the beginning time of this event. We find that the occurrence rates are higher for larger solar wind Pd variance and during periods of northward IMF Bz.
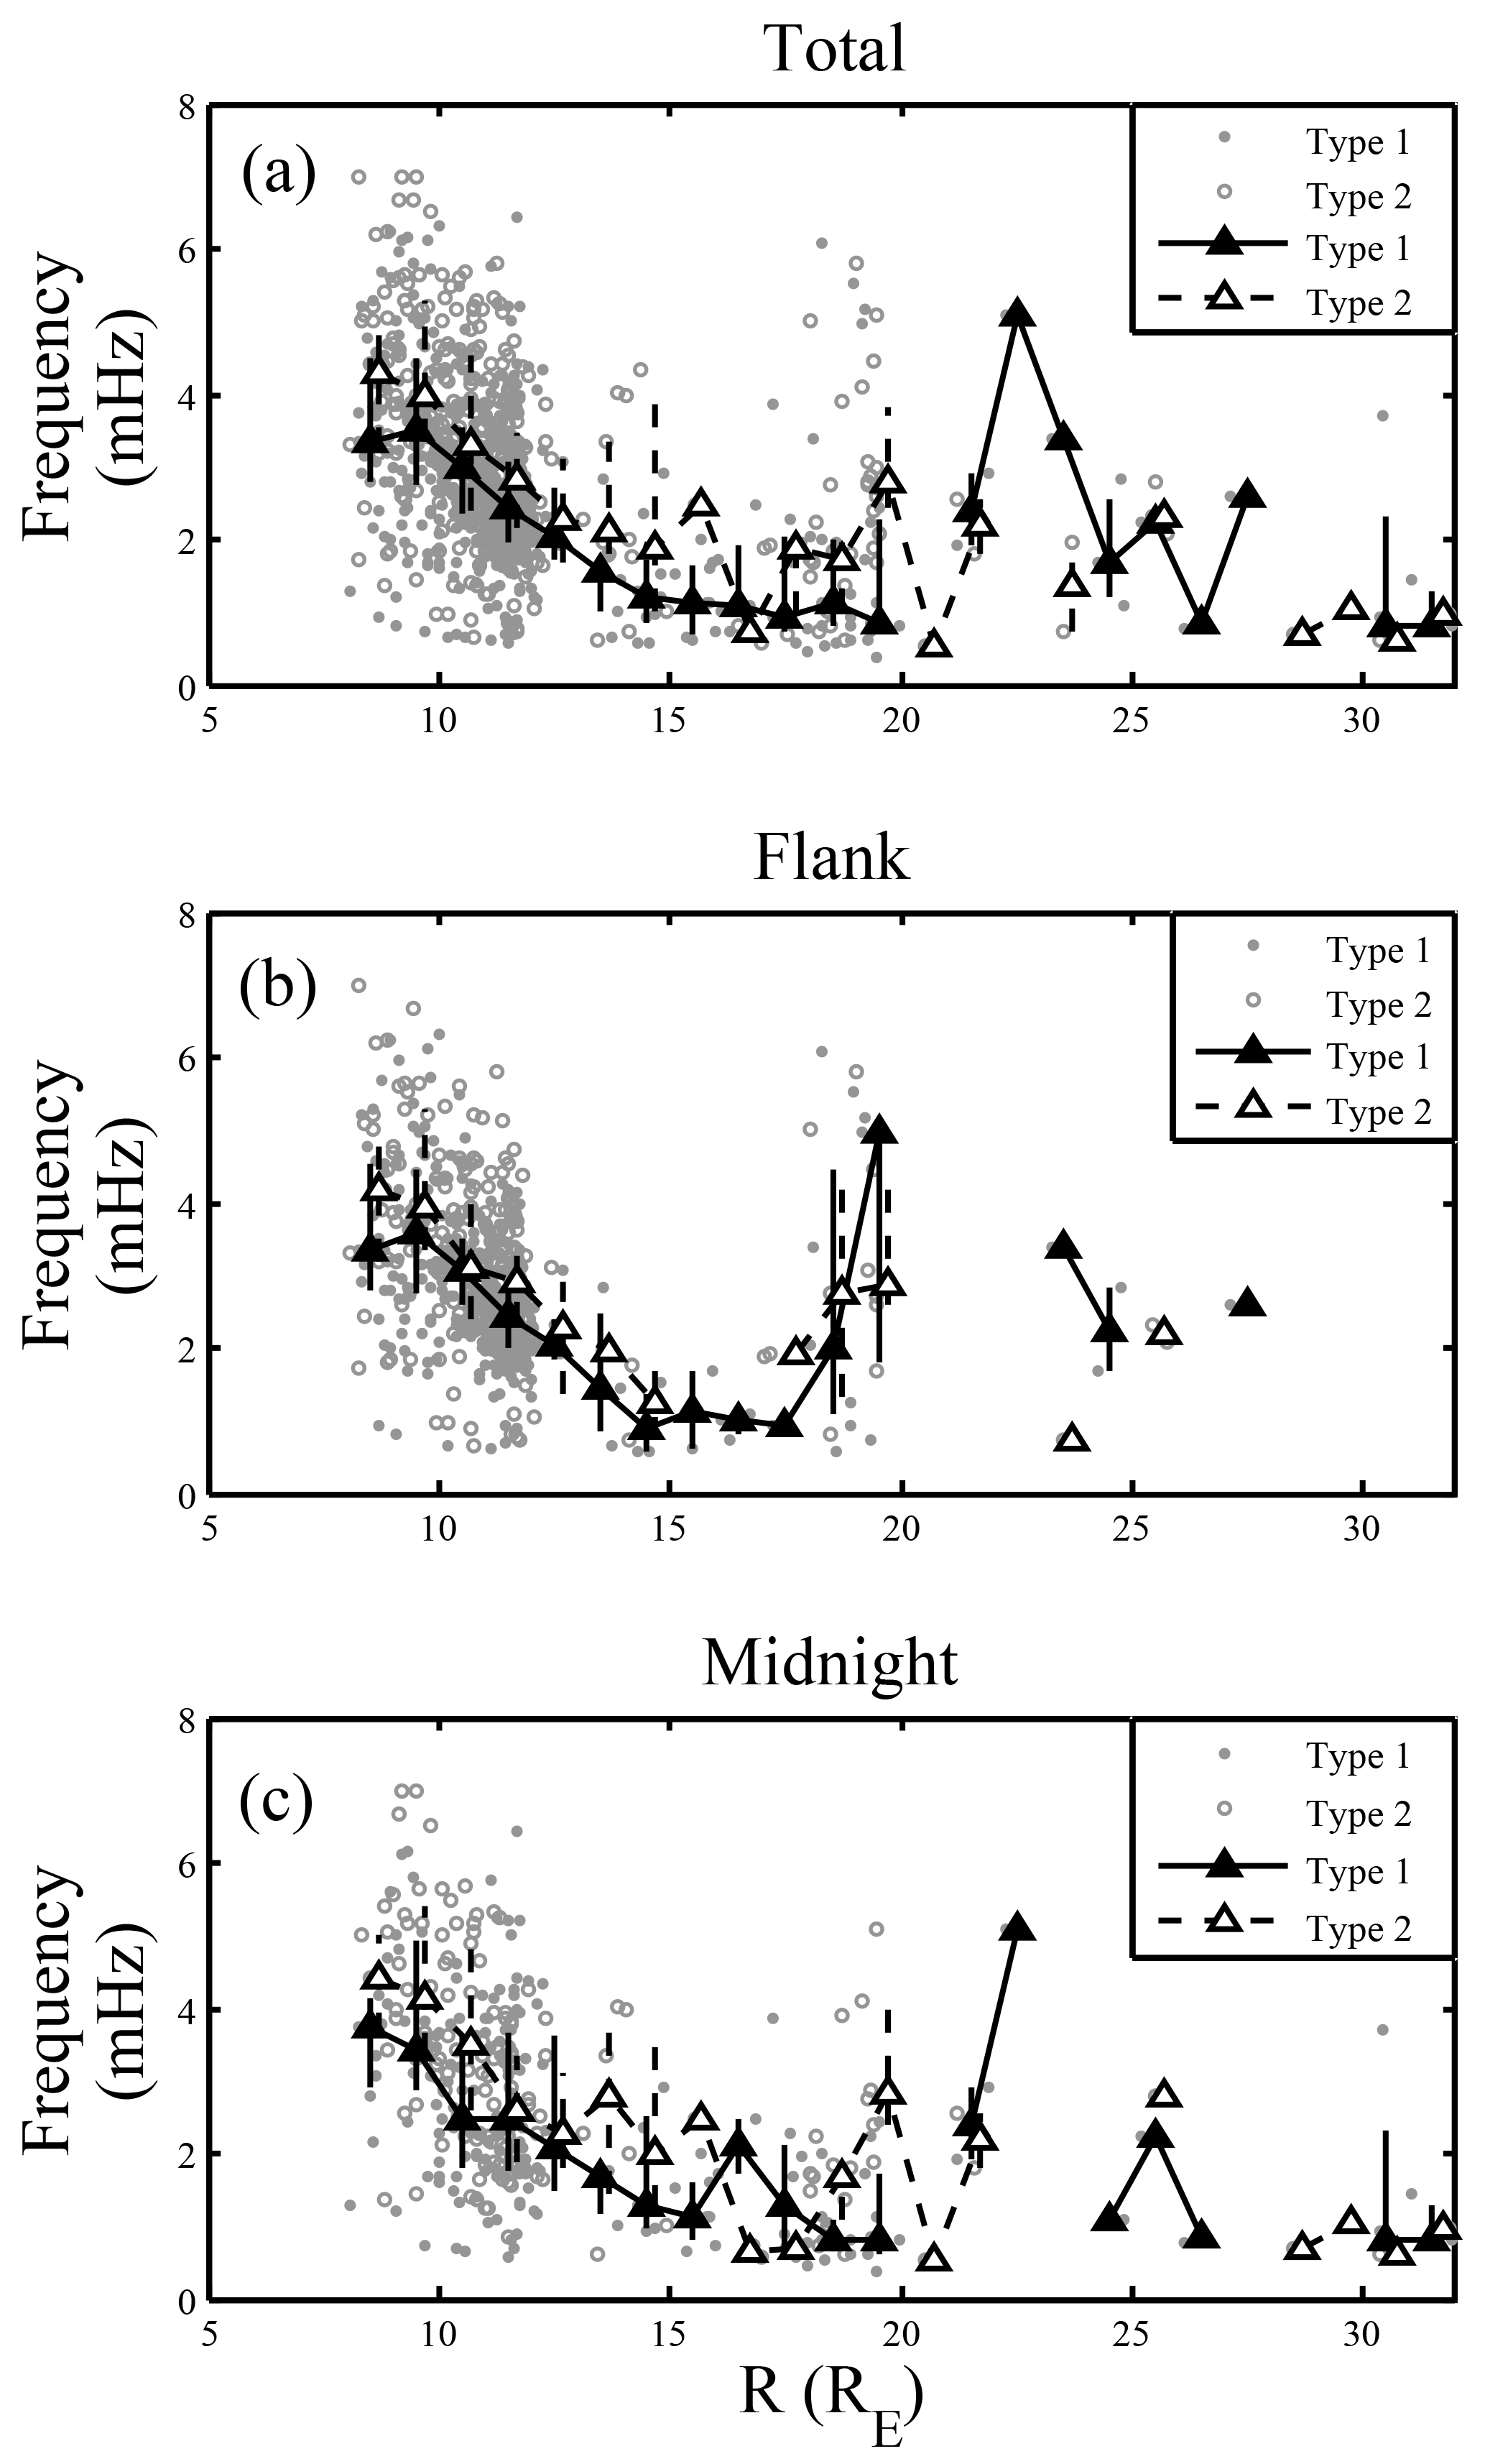
Figure 9The wave frequency versus the distance from Earth for (a) the type one and type two wave events, (b) the wave events in the flank region, and (c) the wave events in the midnight region, respectively. The grey dots and circles indicate type one and type two wave individual events, respectively. The solid and open triangles are the median values of frequencies in each 1RE bin for the type one and type two wave events, respectively. The vertical bars connect the lower and upper quartiles for each category.
The possibility that substorm activity may affect the frequency of ULF waves, thereby influencing the distribution of ULF frequencies in our database, is examined using the following method, based on the substorm event list of Forsyth et al. (2015). The ULF wave events were divided into two categories based on their start time relative to the onset time of individual substorm events. The first category (type one) consists of events that occurred more than 2 h after the most recent substorm onset, and more than 1 h before the next substorm onset. These events are considered to be independent of substorm activity. The second category (type two) consists of events that occurred between 0 and 2 h after the most recent substorm onset. In principle a third category consisting of events that occur less than 1 h before the next substorm onset could be defined. However, this category contains very few events, so their frequency characteristics will not be discussed here. The radial dependence of median frequency for type one and two events is shown in Fig. 9a. This plot clearly shows that the median frequencies for type two events are higher than type one events. A plausible explanation for this difference could be that field line depolarization following the substorm onset results in an increase in local magnetic field strength compared to more stretched magnetotail field lines during quiet times. The resulting higher Alfvén speed profile raises the fundamental mode eigenfrequency for the type two events, compared to the type one events.
Figure 9b and c show the radial dependence of median frequency for type one and two events occurring in the dawn and dusk flank (03:00–06:00 MLT and 18:00–21:00 MLT) and midnight sectors (21:00–03:00 MLT), respectively. According to these plots, the frequency differences between type one and type two wave events are more obvious in the midnight region than in the flank region. This is understandable, given that the configuration of field lines will be changed much more in the midnight region than in the flank regions during substorm times. It should be noted that only the possible influence of the field line configuration or plasma environment associated with weak substorms on the ULF wave frequencies are discussed here. The question of whether substorms could trigger or be triggered by ULF waves still cannot be answered by the present analysis.
We have statistically studied the distributions of the occurrence rate and frequency of the Pc5–6 ULF waves in the region of and 8 RE<R<32 RE (occurring mostly on stretched magnetic field lines) using 8 years of THEMIS data. We also examined the influence of solar wind parameters and the geomagnetic activity level on the features of these ULF waves. Some new results that differ from those of ULF waves observed in the inner magnetosphere are obtained. The main results are summarized as follows.
In the far magnetotail region (12 RE<R<32 RE), the occurrence rates of both azimuthal and radial oscillating events are higher in the post-midnight region than in the pre-midnight region. In the near-Earth magnetotail (8 RE<R<12 RE), the occurrence rates of radial oscillating events are higher on the dusk side, while the dawn–dusk asymmetry in the occurrence rates of azimuthal oscillating events is less clear than that of radial oscillating events, which is similar to the distributions in the inner magnetosphere (4 RE<R<9 RE).
Statistically, the peak frequency decreases with increasing radial distance from Earth for both azimuthal oscillating events (8 RE<R<16 RE) and radial oscillating events (8 RE<R<14 RE). A possible explanation for this distribution is that at least 52 % of events (including both azimuthal and poloidal oscillating events) are standing waves in the region of 8–16 RE, while only 2 % are unambiguous standing waves in the region of 16–32 RE. Moreover, the frequencies for all the events in this paper do not show obvious dawn–dusk asymmetry, contrary to results from previous studies for waves in the inner magnetosphere (4 RE<R<9 RE), where the wave frequencies are higher on the dawn side than on the dusk side.
The ULF wave occurrence rates are higher for larger solar wind velocity and solar wind Pd variations. Therefore, we suggest that the solar wind may be the main energy source of the ULF waves in the region of 8 RE<R<32 RE. About 74.8 % of the ULF waves occurred when the AE values were less than 250 nT, which indicates that the ULF waves are most likely to occur during the quiet times or weak substorm times. We have further studied the frequency change between the quiet time and the weak substorm time events. We found that the wave frequency is higher during the substorm time (0–2 h after substorm onset). The frequency differences are clearer in the midnight region than in the flank region. We suggest that the field lines' configuration or the plasma environment's variation during weak substorm times could increase the eigenfrequencies of ULF waves in the magnetotail, leading to the observed change in the frequency distribution.
THEMIS data are publicly available from http://themis.ssl.berkeley.edu/ (NASA, 2018). OMNI data are publicly available from the Space Physics Data Facility (SPDF) web service at https://spdf.sci.gsfc.nasa.gov/ (GSFC, 2018).
The authors declare that they have no conflict of interest.
We acknowledge this THEMIS project team for THEMIS data at
http://themis.ssl.berkeley.edu/ (last access: October 2018), and the
SPDF web service for OMNI data at https://spdf.sci.gsfc.nasa.gov/ (last
access: October 2018). This work was supported by the Shandong University
(Weihai) Future Plan for Young Scholars (2017WHWLJH08), the National Natural
Science Foundation of China (Grants no. 41304129, 41774153, 41574157, and
41628402), the Science and Technology Facilities Council (Grants
no. ST/N000722/1) and the Natural Environment Research Council (Grants
no. NE/L007495/1, NE/P017150/1 and NE/P017185/1). Project Supported by the
Specialized Research Fund for State Key Laboratories.
Edited by: Minna Palmroth
Reviewed by: Maxime
Grandin and one anonymous referee
Allan, W. and Poulter, E. M.: Ulf waves-their relationship to the structure of the earth's magnetosphere, Rep. Prog. Phys., 55, 533–598, https://doi.org/10.1088/0034-4885/55/5/001, 1992.
Allan, W., White, S. P., and Poulter, E. M.: Impulse-excited hydromagnetic cavity and field-line resonances in the magnetosphere, Planet. Space Sci., 34, 371–385, https://doi.org/10.1016/0032-0633(86)90144-3, 1986.
Angelopoulos, V.: The THEMIS mission, Space Sci. Rev., 141, 5–34, https://doi.org/10.1007/s11214-008-9336-1, 2008.
Auster, H. U., Glassmeier, K. H., Magnes, W., Aydogar, O., Baumjohann, W., Constantinescu, D., Fornacon, K. H., Georgescu, E.; Harvey, P., Hillenmaier, O., Kroth, R., Ludlam, M., Narita, Y., Nakamura, R., Okrafka, K., Plaschke, F., Richter, I., Schwarzl, H., Stoll, B., Valavanoglou, A., and Wiedemann, M.: The Themis fluxgate magnetometer, Space Sci. Rev., 141, 235–264, https://doi.org/10.1007/s11214-008-9365-9, 2008.
Baumjohann, W. and Glassmeier, K. H.: The transient response mechanism and Pi2 pulsations at substorm onset: Review and outlook, Planet. Space Sci., 32, 1361–1370, https://doi.org/10.1016/0032-0633(84)90079-5, 1984.
Chen, L. and Hasegawa, A.: On magnetospheric hydromagnetic waves excited by energetic ring current particles, J. Geophys. Res., 93, 8763–8767, 1988.
Claudepierre S. G., Elkington, S. R., and Wiltberger, M.: Solar wind driving of magnetospheric ULF waves: Pulsations driven by velocity shear at the magnetopause, J. Geophys. Res., 113, A05218, https://doi.org/10.1029/2007JA012890, 2008.
Degeling, A. W., Rankin, R., and Zong, Q.-G.: Modeling radiation belt electron acceleration by ULF fast mode waves, launched by solar wind dynamic pressure fluctuations, J. Geophys. Res.-Space, 119, 8916–8928, https://doi.org/10.1002/2013JA019672, 2014.
Forsyth, C., Rae, I. J., Coxon, J. C., Freeman, M. P., Jackman, C. M., Gjerloev, J., and Fazakerley, A. N.: A new technique for determining Substorm Onsets and Phases from Indices of the Electrojet (SOPHIE), J. Geophys. Res.-Space, 120, 10592–10606, https://doi.org/10.1002/2015JA021343, 2015.
Gibbons, J. D., and Chakraborti, S.: Nonparametric Statistical Inference, 5th Edn., Boca Raton, FL: Chapman & Hall/CRC Press, Taylor & Francis Group, 2011.
GSFC (Goddard Space Flight Center): Space Physics Data Facility (SPDF), available at: https://spdf.sci.gsfc.nasa.gov/, last access: October 2018.
Hudson, M. K., Denton, R. E., Lessard, M. R., Miftakhova, E. G., and Anderson, R. R.: A study of Pc-5 ULF oscillations, Ann. Geophys., 22, 289–302, https://doi.org/10.5194/angeo-22-289-2004, 2004.
Keiling, A.: Alfvén Waves and Their Roles in the Dynamics of the Earth's Magnetotail: A Review, Space Sci. Rev., 142, 73–156, 2009.
Kepko, L. and Spence, H. E.: Observations of discrete, global magnetospheric oscillations directly driven by solar wind density variations, J. Geophys. Res., 108, A61257, https://doi.org/10.1029/2002JA009676, 2003.
Kepko, L., Spence, H. E., and Singer, H. E.: ULF waves in the solar wind as direct drivers of magnetospheric pulsations, J. Geophys. Res., 29, 39-1–39-4, 2002.
Kokubun, S.: ULF waves in the outer magnetosphere: Geotail observation 1 transverse waves, Earth Planet. Space, 65, 411–433, https://doi.org/10.5047/eps.2012.12.013, 2013.
Lee, D. and Lysak, R. L.: Magnetospheric ulf wave coupling in the dipole model: the impulsive excitation, J. Geophys. Res.-Space, 94, 17097–17103, 1989.
Lessard, M. R., Hudson, M. K., and Luhr, H.: A statistical study of Pc3–Pc5 magnetic pulsations observed by the AMPTE/Ion Release Module satellite, J. Geophys. Res., 104, 4523, https://doi.org/10.1029/ 1998JA900116, 1999.
Liu, W., Sarris, T. E., Li, X., Elkington, S. R., Ergun, R., Angelopoulos, V., Bonnell, J., and Glassmeier, K. H.: Electric and magnetic field observations of Pc4 and Pc5 pulsations in the inner magnetosphere: A statistical study, J. Geophys. Res., 114, A12206, https://doi.org/10.1029/2009JA014243, 2009.
Lui, A. T. Y. and Cheng, C. Z.: Resonance frequency of stretched magnetic field lines based on a self-consistent equilibrium magnetosphere model, J. Geophys. Res., 106, 25793–25802, https://doi.org/10.1029/2001JA000113, 2001.
Mcfadden, J. P., Carlson, C. W., Larson, D., Bonnell, J., Mozer, F., Angelopoulos, V., Glassmeier, K. H., and Auster, U.: THEMIS ESA first science results and performance issues, Space Sci. Rev., 141, 477–508, https://doi.org/10.1007/s11214-008-9433-1, 2008.
Miura, A.: Kelvin-Helmholz Instability at the Magnetospheric Boundary: Dependence on the Magnetosheath Sonic Mach Number, J. Geophys. Res., 97, 10655–10675, 1992.
NASA (National Aeronautics and Space Administration): THEMIS, available at: http://themis.ssl.berkeley.edu, last access: October 2018.
Nykyri, K.: Impact of MHD shock physics on magnetosheath asymmetry and Kelvin-Helmholtz instability, J. Geophys. Res.-Space, 118, 5068–5081, https://doi.org/10.1002/jgra.50499, 2013.
Olson, J. V.: Pi2 pulsations and substorm onsets: A review, J. Geophys. Res., 104, 17499–17520, https://doi.org/10.1029/1999JA900086, 1999.
Rae, I. J., Murphy, K. R., Watt, C. E. J., Rostoker, G., Rankin, R., Mann, I. R., Hodgson, C. R., Frey, H. U., Degeling, A. W., and Forsyth, C.: Field line resonances as a trigger and a tracer for substorm onset, J. Geophys. Res.-Space, 119, 5343–5363, https://doi.org/10.1002/2013JA018889, 2014.
Rankin, R., Fenrich, F., and Tikhonchuk, V. T.: Shear Alfvén waves on stretched magnetic field lines near midnight in Earth's magnetosphere, Geophys. Res. Lett., 27, 3265–3268, 2000.
Rostoker, G., Spadinger, I., and Samson, J. C.: Local time variation in the response of Pc5 pulsations in the morning sector to substorm expansive phase onsets near midnight, J. Geophys. Res., 89, 6749–6757, https://doi.org/10.1029/JA089iA08p06749, 1984.
Saito, T.: Long-period irregular magnetic pulsation, Pi3, Space Sci. Rev., 21, 427–467, https://doi.org/10.1007/BF00173068, 1978.
Samson, J. C. and Rostoker, G.: Response of dayside Pc5 pulsations to substorm activity in the nighttime magnetosphere, J. Geophys. Res., 86, 733–752, https://doi.org/10.1029/JA086iA02p00733, 1981.
Shen, X. C., Zong, Q.-G., Shi, Q. Q., Tian, A. M., Sun, W. J., Wang, Y. F., Zhou, X. Z., Fu, S. Y., Hartinger, M. D., and Angelopoulos, V.: Magnetospheric ULF waves with increasing amplitude related to solar wind dynamic pressure changes: The Time History of Events and Macroscale Interactions during Substorms (THEMIS) observations, J. Geophys. Res., 120, 7179–7190, https://doi.org/10.1002/2014JA020913, 2015.
Shen, X.C., Shi, Q. Q., Zong, Q.-G., Tian, A. M., Nowada, M., Sun, W. J., Zhao, H. Y., Hudson, M. K., Wang, H. Z., Fu, S. Y., and Pu, Z. Y.: Dayside magnetospheric ULF wave frequency modulated by a solar wind dynamic pressure negative impulse, J. Geophys. Res.-Space, 122, https://doi.org/10.1002/2016JA023351, 2017.
Shi, Q. Q., Hartinger, M. D., Angelopoulos, V., Zong, Q.-G., Zhou, X.-Z., Zhou, X.-Y., Kellerman, A., Tian, A. M., Weygand, J., Fu, S. Y., Pu, Z. Y., Raeder, J., Ge, Y. S., Wang, Y. F., Zhang, H., and Yao, Z. H.: THEMIS observations of ULF wave excitation in the nightside plasma sheet during sudden impulse events, J. Geophys. Res., 118, 284–298, https://doi.org/10.1029/2012JA017984, 2013.
Shi, Q. Q., Hartinger, M. D., Angelopoulos, V., Fu, S. Y., Zong, Q.-G., Tian, A. M., Weygand, J. M., Raeder, J., Pu, Z. Y., Zhou, X. Z., Dunlop, M. W., Liu, W. L., Zhang, H., Yao, Z. H., and Shen, X. C.: Solar wind pressure pulse-driven magnetospheric vortices and their global consequences, J. Geophys. Res., 119, 4274–4280, https://doi.org/10.1002/2013JA019551, 2014.
Shue, J.-H., Song, P., Russell, C. T., Steinberg, J. T., Chao, J. K., Zastenker, G., Vaisberg, O. L., Kokubun, S., Singer, H. J., Detman, T. R., and Kawano, H.: Magnetopause location under extreme solar wind conditions, J. Geophys. Res., 103, 17691–17700, https://doi.org/10.1029/98JA01103, 1998.
Singer, H. J., Hughes, W. J., and Russell, C. T.: Standing hydromagnetic waves observed by ISEE 1 and 2: Radial extent and harmonic, J. Geophys. Res., 87, 3519–3529, 1982.
Southwood, D. J., Dungey, J. W., and Eherington, R. L.: Bounce resonant interaction between pulsations and trapped particles, Planet Space Sci., 17, 349–361, 1969.
Sun, W. J., Slavin, J. A., Fu, S., Raines, J. M., Sundberg, T., and Zong, Q.-G., Jia, X. Z., Shi, Q. Q., Shen, X. C., Poh, G. K., Pu, Z. Y., and Zurbuchen, T. H.: Messenger observations of alfvénic and compressional waves during mercury's substorms, Geophys. Res. Lett., 42, 6189–6198, 2015.
Takahashi, K. and McPherron, R. L.: Harmonic structure of Pc3–4 pulsations, J. Geophys. Res., 87, 1504, https://doi.org/10.1029/JA087iA03p01504, 1982.
Takahashi, K. and Ukhorskiy, A. Y.: Solar wind control of Pc5 pulsation power at geosynchronous orbit, J. Geophys. Res., 112, A11205, https://doi.org/10.1029/2007JA012483, 2007.
Takahashi, K., Denton, R. E., Hirahara, M., Min, K., Ohtani, S., and Sanchez, E.: Solar cycle variation of plasma mass density in the outer magnetosphere: Magnetoseismic analysis of toroidal standing Alfvén waves detected by Geotail, J. Geophys. Res.-Space, 119, 8338–8356, https://doi.org/10.1002/2014JA020274, 2014.
Takahashi, K., Hartinger, M. D., Angelopoulos, V., and Glassmeier, K. H.: A statistical study of fundamental toroidal mode standing Alfvén waves using THEMIS ion bulk velocity data, J. Geophys. Res.-Space, 120, 6474–6495, https://doi.org/10.1002/2015JA021207, 2015.
Tian, A. M, Zong, Q.-G., Zhang, T. L., Nakamura, R., Du, A. M., Baumjohann, W., Glassmeier, K. H., Volwerk, M., Hartinger, M., Wang, Y. F., Du, J., Yang, B., Zhang, X. Y., and Panov, E.: Dynamics of long-period ULF waves in the plasma sheet: Coordinated space and ground observations, J. Geophys. Res., 117, A03211, https://doi.org/10.1029/2011JA016551, 2012.
Ukhorskiy, A. Y., Takahashi, K., Anderson, B. J., and Korth, H.: Impact of toroidal ULF waves on the outer radiation belt electrons, J. Geophys. Res., 110, A10202, https://doi.org/10.1029/2005JA011017, 2005.
Walker, A. D. M.: The Kelvin-Helmholtz instability in the low-latitude boundary layer, Planet. Space Sci., 29, 1119–1133, https://doi.org/10.1016/0032-0633(81)90011-8, 1981.
Wang, G. Q., Zhang, T. L., and Ge, Y. S.: Spatial distribution of magnetic fluctuation power with period 40 to 600 s in the magnetosphere observed by THEMIS, J. Geophys. Res.-Space, 120, 9281–9293, https://doi.org/10.1002/2015JA021584, 2015.
Wang, C.-P., Merkin, V. G., and Angelopoulos, V.: Mesoscale perturbations in midtail lobe/mantle during steady northward IMF: ARTEMIS observation and MHD simulation, J. Geophys. Res., 122, 6430–6441, https://doi.org/10.1002/2017JA024305, 2017.
Waters, C. L., Harrold, B. G., Menk, F. W., Samson, J. C., and Fraser, B. J.: Field line resonances and waveguide modes at low latitudes: 2. A model, J. Geophys. Res., 105, 7763–7774, https://doi.org/10.1029/1999JA900267, 2000.
Yang, B., Zong, Q.-G., Wang, Y. F., Fu, S. Y., Song, P., Fu, H. S., Korth, A., Tian, T., and Reme, H.: Cluster observations of simultaneous resonant interactions of ULF waves with energetic electrons and thermal ion species in the inner magnetosphere, J. Geophys. Res., 115, A02214, https://doi.org/10.1029/2009JA014542, 2010.
Zhang, X. Y., Zong, Q.-G., Wang, Y. F., Zhang, H., Xie, L., Fu, S. Y., Yuan, C. J., Yue, C., Yang, B., and Pu, Z. Y.: ULF waves excited by negative/positive solar wind dynamic pressure impulses at geosynchronous orbit, J. Geophys. Res., 115, A10221, https://doi.org/10.1029/2009JA015016, 2010.
Zheng, Y., Lui, A. T. Y., Mann, I. R., Takahashi, K., Watermann, J., Chen, S.-H., Rae, I. J., Mukai, T., Russell, C. T., Balogh, A., Pfaff, R. F., and Rème, H.: Coordinated observation of field line resonance in the mid-tail, Ann. Geophys., 24, 707–723, https://doi.org/10.5194/angeo-24-707-2006, 2006.
Zong, Q.-G.: Ultralow frequency modulation of energetic particles in the dayside magnetosphere, Geophys. Res. Lett, 34, 195–225, 2007.
Zong, Q.-G., Zhou, X. Z., Wang, Y. F., Li, X., Song, P., Baker, D. N., Fritz, T. A., Daly, P. W., Dunlop, M., and Pedersen, A.: Energetic electron response to ULF waves induced by interplanetary shocks in the outer radiation belt, J. Geophys. Res., 114, A10204, https://doi.org/10.1029/2009JA014393, 2009.
Zong, Q.-G., Wang, Y. F., Zhang, H., Fu, S. Y., Zhang, H., Wang, C. R., Yuan, C. J., and Vogiatzis, I.: Fast acceleration of inner magnetospheric hydrogen and oxygen ions by shock induced ULF waves, J. Geophys. Res., 177, A11206, https://doi.org/10.1029/2012JA018024, 2012.
Zong, Q.-G., Rankin, R., and Zhou, X. Z.: The interaction of ultralow frequency Pc3–5 waves with charged particles in earth's magnetosphere, Rev. Mod. Plasma Phys., 1, 10, https://doi.org/10.1007/s41614-017-0011-4, 2017.