
the Creative Commons Attribution 4.0 License.
the Creative Commons Attribution 4.0 License.
 | 25 Sep 2026
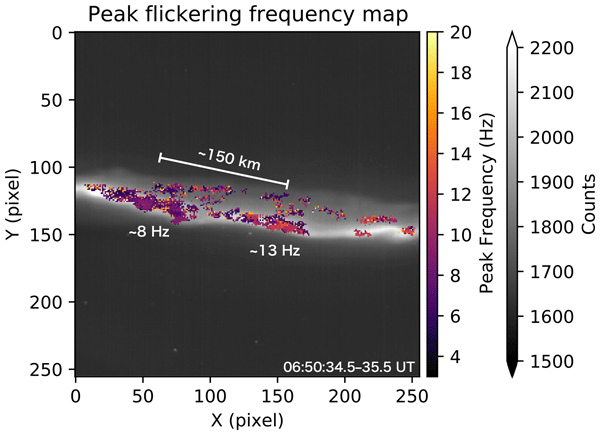
Mesoscale structure of flickering aurora from wide-field high-speed imaging

Satoshi Kurita
Tima Sergienko
Yoshizumi Miyoshi
Ryuho Kataoka
We report wide-field observations of flickering aurora obtained with a fast sCMOS camera and a diagonal fisheye lens at Poker Flat Research Range, Alaska, on 8 February 2016. The system recorded 512×512 pixel images at 80 Hz, enabling us to investigate the mesoscale organization of flickering along a discrete auroral arc over spatial scales of several hundred kilometers. Flickering occurred intermittently with dominant frequencies between 3 and 20 Hz, most commonly within a narrower band of 4–12 Hz. Spatial maps of the peak frequency reveal that regions with similar periodicities sometimes formed coherent clusters on scales of ∼ 10 km, and that multiple clusters with different frequencies (e.g., ∼8 and ∼13 Hz) could coexist simultaneously along the same arc, separated by ∼150 km. Some of these clusters moved together with the background arc, suggesting that the modulation is closely tied to the local plasma environment and inverted-V potential structures associated with discrete aurora. An automated patch detection analysis showed that, although individual events may locally suggest an inverse relationship between flickering frequency and patch size, this trend does not persist statistically. Instead, flickering at a given dominant frequency occurs over a wide range of patch sizes, with a typical apparent north–south scale of 4.4±2.4 km when projected to an assumed emission altitude of 110 km. These results are consistent with generation scenarios in which electron precipitation is modulated by interference among multiple EMIC waves in the auroral acceleration region, extending previous narrow-field studies to the mesoscale and demonstrating the diagnostic value of wide-field, high-cadence imaging for wave–particle interactions in the auroral ionosphere.
- Article
(9995 KB) - Full-text XML
- BibTeX
- EndNote


Flickering aurora is an optical phenomenon in which luminosity rapidly oscillates at frequencies of approximately 3–15 Hz within localized, patch-like regions with horizontal scales of a few kilometers (Kataoka et al., 2021). These patches are known to appear below bright discrete auroras (Beach et al., 1968; Kunitake and Oguti, 1984) and may exhibit drifting or rotational motions (Kunitake and Oguti, 1984; Gustavsson et al., 2008; Whiter et al., 2008). The amplitude of the luminosity modulation is typically about 10 %–20 % of the brightness of the background discrete aurora (Lund et al., 1995; Sakanoi and Fukunishi, 2004; Gustavsson et al., 2008; Grydeland et al., 2008).
Based on previous observational results, the origin of flickering aurora is widely regarded as being closely related to electron acceleration by electromagnetic ion cyclotron (EMIC) waves. Using simultaneous observations with sounding rockets and ground-based cameras, McFadden et al. (1987) reported field-aligned oscillations of the electron flux, known as field-aligned bursts (FABs), occurring simultaneously with flickering aurora. From the velocity dispersion of these electrons, they inferred that the source region was located at altitudes of approximately 4000–8000 km. It has been pointed out that the cyclotron frequencies of oxygen EMIC waves generated at these altitudes are in good agreement with the typical frequencies observed in flickering aurora (Temerin et al., 1986; Lund et al., 1995; Michell et al., 2012).
Several theoretical interpretations have been proposed to explain how EMIC waves accelerate electrons. Temerin et al. (1986) suggested that EMIC waves excited in the lower part of the acceleration region generate an ambipolar potential through the ponderomotive force. This potential transports cold electrons from the ionosphere upward to the lower part of the acceleration region, where the electrons subsequently resonate with the EMIC waves and are precipitated back into the ionosphere, leading to FABs. However, this model requires unrealistically large wave amplitudes. As an alternative scenario, McFadden et al. (1987) proposed that EMIC waves periodically perturb and release cold electrons trapped within the acceleration region, allowing them to be accelerated by the potential drop and precipitated into the ionosphere, thereby producing flickering aurora.
Sakanoi et al. (2005) demonstrated that the spatiotemporal patterns of flickering aurora observed with an imaging photometer can be explained by interference between two dispersive Alfvén waves (EMIC waves or inertial Alfvén waves), and showed that their results are consistent with the model proposed by Temerin et al. (1986), in which flickering aurora is generated through resonance between EMIC waves and electrons in the lower part of the acceleration region. In addition, Gustavsson et al. (2008) used numerical simulations to show that the complex spatiotemporal structures of flickering aurora can be reproduced by considering interference among multiple EMIC waves.
Within this theoretical framework, Whiter et al. (2010) observed chirps in which the flickering frequency varied on time scales of about 1 s, using narrow-field cameras and photometers. They suggested that higher flickering frequencies correspond to lower electron energies inferred from auroral emission intensity ratios, whereas lower frequencies are associated with higher electron energies. Their observations can be explained by the model of Chen et al. (2005), in which electron energy is primarily controlled by the parallel phase velocity of dispersive Alfvén waves (such as EMIC waves), and are also consistent with the picture proposed by Temerin et al. (1986) and Sakanoi et al. (2005), in which electron flux is modulated through resonance between EMIC waves and electrons.
If EMIC waves excited at altitudes of several thousand kilometers are responsible for flickering aurora, then not only oxygen ion modes at frequencies of about 3–15 Hz but also higher-frequency modes associated with hydrogen and helium ions may be observable. In earlier periods, however, the temporal resolution of TV cameras was limited to 30 frames s−1, making it difficult to record the rapid luminosity variations of flickering aurora in video. McHarg et al. (1998) overcame this limitation by performing photometric observations of flickering aurora at 40 kHz, and found amplitude modulations in the 35–60 Hz range, as well as fluctuation components reaching up to 180 Hz. With the advent of electron-multiplying CCD (EMCCD) detectors, Yaegashi et al. (2011) further demonstrated, using high-speed imaging at 100 Hz, that variations above 30 Hz were frequently observed, accounting for roughly one third of all events. Using multispectral EMCCD imaging, Kataoka et al. (2011) demonstrated fine-scale spatiotemporal variations of flickering aurora near the magnetic zenith and discussed their consistency with interference-based EMIC/DAW scenarios. More recently, using a scientific CMOS (sCMOS) camera, which provides higher-fidelity images without electron multiplication, Fukuda et al. (2017) conducted imaging observations at 160 frames s−1 and suggested that, in addition to patches flickering at typical frequencies of around 10 Hz, patch-like regions can also flicker over only a few frames (i.e., near 80 Hz). They interpreted this as the first evidence that flickering patches can be generated by multi-ion-mode EMIC waves.
As summarized above, a wide range of previous studies has suggested that interactions with EMIC waves play an essential role in the generation of flickering aurora and the accompanying FABs. However, the observational evidence used to construct these models has almost exclusively been obtained with narrow-field cameras. This is partly unavoidable for clearly resolving flickering patches, which are small-scale phenomena with horizontal sizes of a few kilometers and rapid intensity variations at frequencies of order 10 Hz, and for minimizing projection and line-of-sight superposition effects when characterizing small-scale structuring.
At the same time, there have been efforts to extend high-speed imaging to moderately larger fields of view (FoV). For example, Kataoka et al. (2015) used a 15° × 15° high-speed camera oriented toward the magnetic zenith and reported compound auroral microstructures, including cases where localized flickering appeared together with pulsating aurora; they noted that the larger FoV was an important factor in identifying such simultaneous features. Recent observations have also linked pre-onset wave-like auroral forms to auroral kilometric radiation precursors and dispersive-Alfvén-wave-driven double layers (Wu et al., 2025), highlighting the importance of mesoscale structuring in discrete auroral arcs.
Nevertheless, when the FoV is limited, it remains difficult to continuously follow flickering aurora over longer periods, particularly when it appears together with discrete auroral arcs that are narrow in the latitudinal direction and evolve dynamically. In this study, we successfully observed flickering aurora over a much wider FoV than in previous studies by using a ground-based camera equipped with a diagonal fisheye lens. While wide-FoV imaging provides improved contextual coverage, interpreting off-zenith (i.e., oblique) observations may require additional care because line-of-sight mixing can become more pronounced. We evaluate the consistency of our observations with existing generation models for flickering aurora and introduce newly revealed spatiotemporal characteristics: although individual examples may suggest a dispersion-like relationship between flickering frequency and patch size, this apparent trend does not persist statistically, implying that dispersion-like behavior inferred from generation models does not always translate directly into the optical signatures of flickering aurora.
The detector used in the camera system was an ORCA-Flash 4.0 V2 manufactured by Hamamatsu Photonics. A NIKKOR 8 mm f/2.8 lens was employed, providing a diagonal FoV of 180°. No dedicated optical filters were used to block specific wavelengths. In this paper, we refer to this system simply as a scientific complementary metal–oxide–semiconductor (sCMOS) camera. The camera was installed at the Poker Flat Research Range, Alaska (65.12° N, 147.43° W), and oriented toward the geographic zenith. During the event analyzed in this study, images were recorded at 80 Hz with a frame size of 512×512 pixels. For the analyses presented after Fig. 1, 2×2 software binning was applied to improve the signal-to-noise ratio, and the resulting 256×256 pixel images were used.
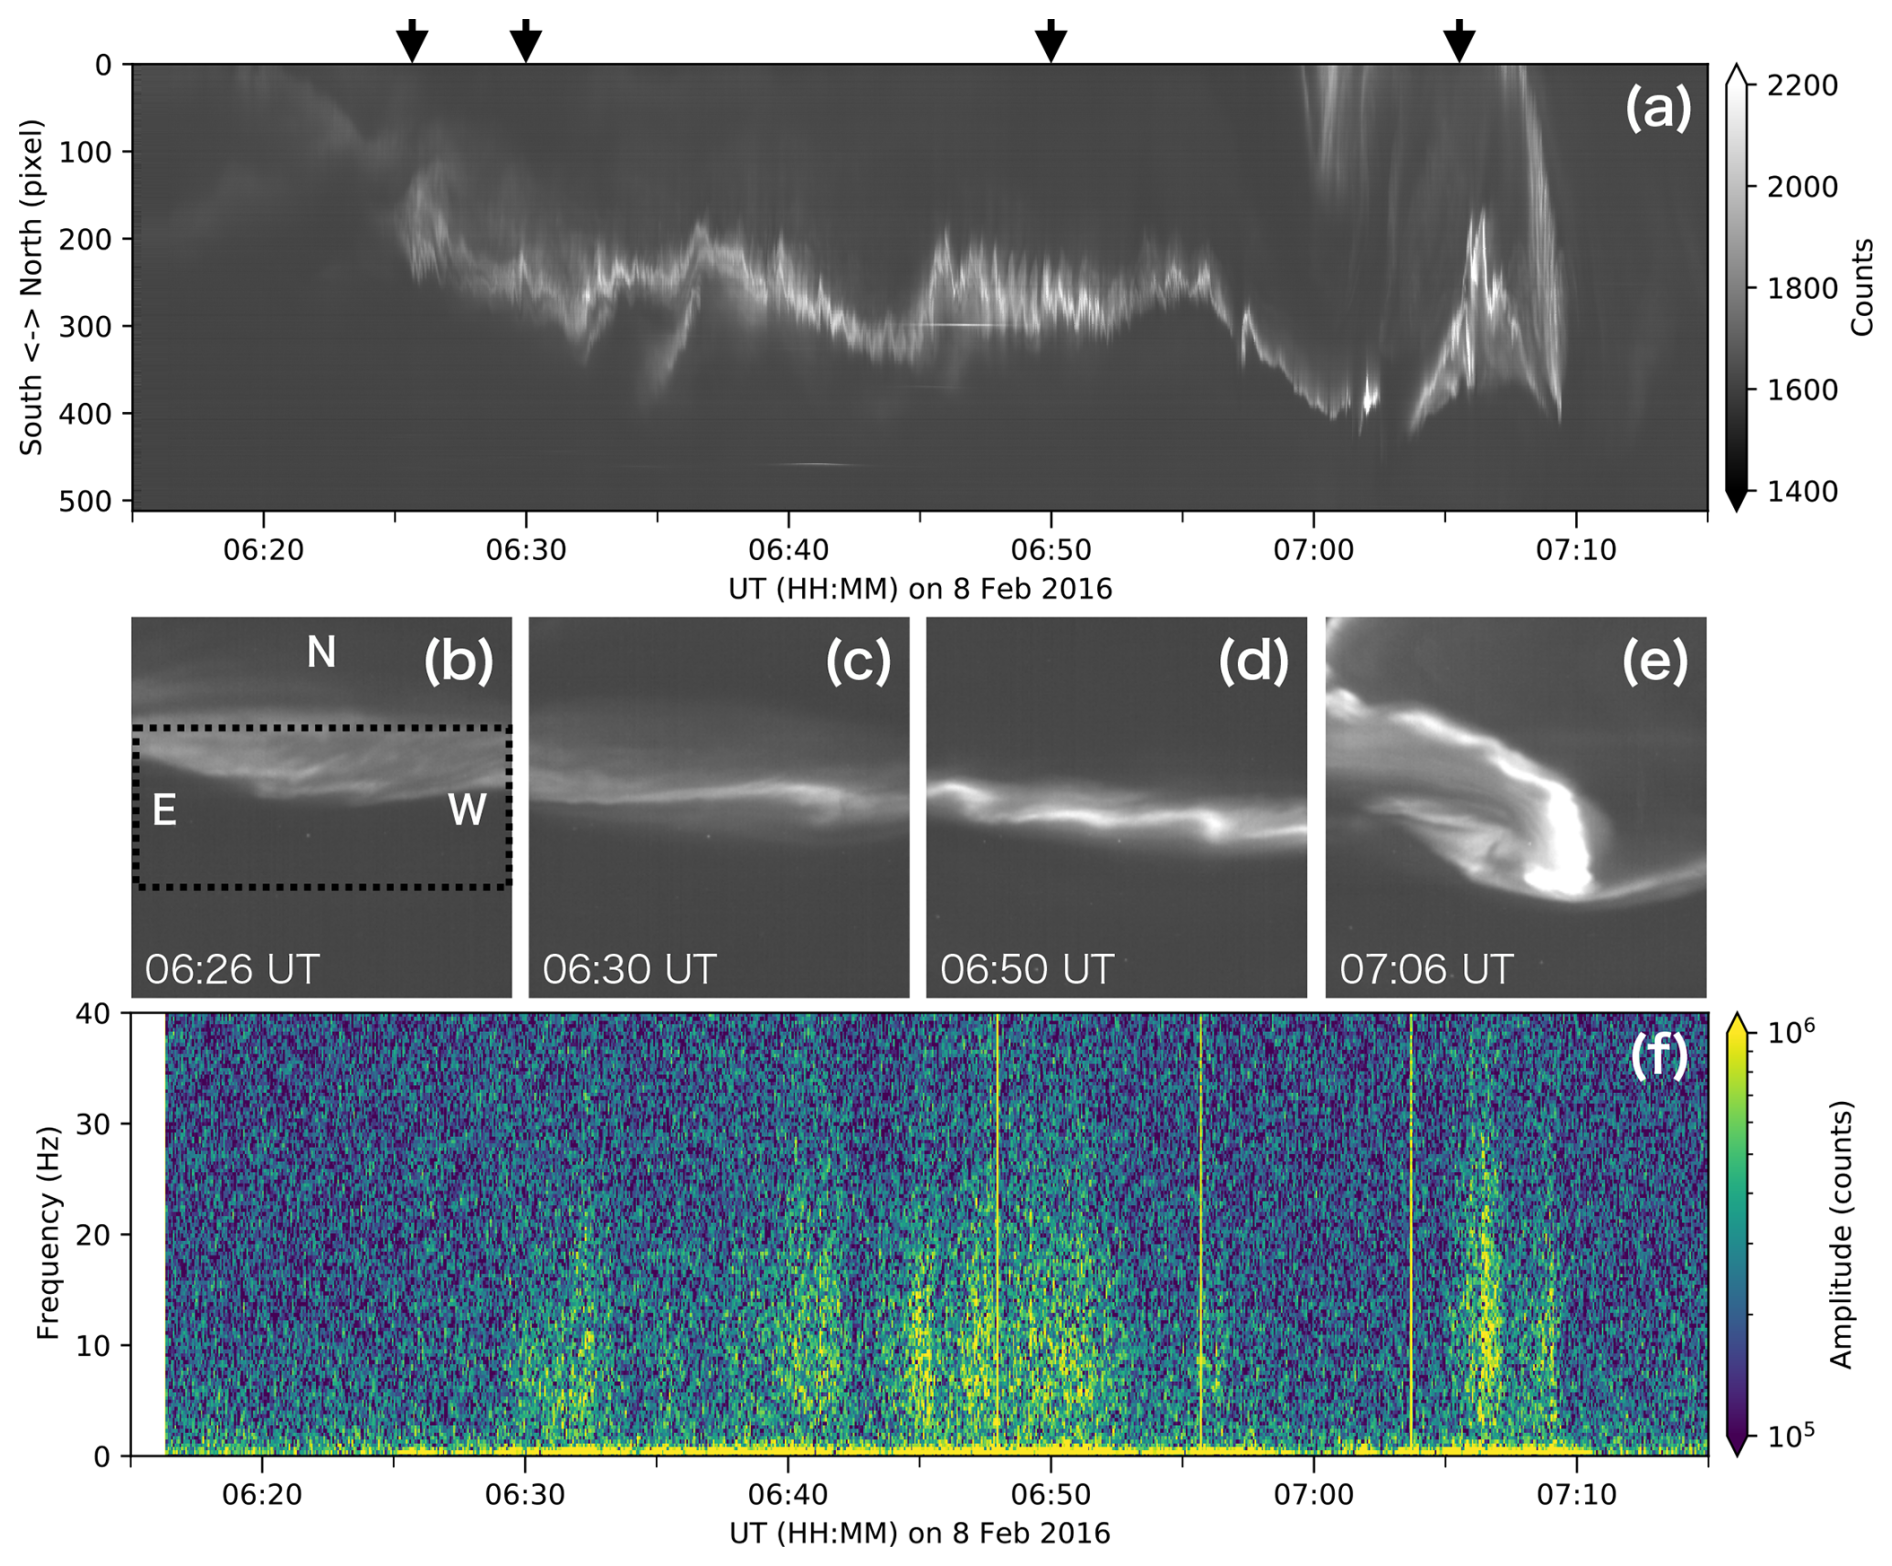
Figure 1(a) Keogram constructed from the sCMOS camera images on 8 February 2016. (b–e) Selected all-sky images at the times indicated by the arrows in (a). (f) Sum of FFT spectra for the region outlined in (b), showing intermittent enhancements in the 3–20 Hz range associated with flickering aurora. The narrow vertical spike-like structures around 06:48:00, 06:55:44, and 07:03:44 UT are artifacts caused by short image-acquisition gaps.
Unless otherwise stated, spatial distances reported below are apparent horizontal distances obtained by projecting the images to an assumed emission altitude of 110 km. Because the observations were made with a single camera, these mapped distances should not be interpreted as uniquely reconstructed true horizontal scales.
Flickering aurora was observed with the sCMOS camera on 8 February 2016. Selected intervals of the observation are provided as Video 1 accompanying the electronic version of this paper to illustrate representative examples of flickering aurora (Nanjo, 2026). Figure 1 summarizes the event. Panel (a) shows a keogram constructed by extracting a vertical cross section at x=256 pixels from each frame of the 512×512-pixel image sequence and stacking these cross sections in time. Panels (b)–(e) present all-sky images corresponding to the times indicated by the black arrows above panel (a).
The aurora initially appeared as a faint east–west arc around 06:20 UT (panel b). It subsequently intensified, developing into a typical discrete auroral arc by approximately 06:30 UT (panel c). From this period onward, localized, patch-like blinking areas became detectable within the arc on scales of several kilometers. The discrete arc and its associated flickering patches remained within the FoV for about 1 h, exhibiting temporal variations in their average brightness, and eventually faded after 07:00 UT as a bulge-like bright auroral structure propagated westward. During the event, the magnetic coordinates of the observation site were approximately 65.3° MLAT and 19.2–20.0 MLT. The broader geophysical and optical context of this event is summarized in Appendices A and B. The solar-wind and geomagnetic data indicate enhanced auroral activity during the 06:25–07:10 UT interval, while the keograms show that the flickering aurora was embedded in a dynamically evolving auroral activation rather than occurring under quiet conditions.
Panel (f) shows the sum of spectra obtained by applying the fast Fourier transform (FFT) for every 4 s window to the pixels within the region outlined by the black dashed line in panel (b). From around 06:30 UT, when the aurora began to brighten, intervals of enhanced power appeared intermittently in the frequency range from a few hertz up to about 20 Hz. The frequencies exhibiting high power were broadly consistent with previous studies (Kataoka et al., 2021). However, the occurrence of flickering was intermittent, and the dominant frequencies varied with time. The spike-like vertical structures in Panel (f) at approximately 06:48:00, 06:55:44, and 07:03:44 UT are artifacts caused by short data gaps of about 1 s in the image acquisition. They should not be interpreted as broadband rapid temporal variations of the auroral luminosity.
At 06:34–06:39, 06:43–06:45, and 06:52–06:55 UT (intervals indicated by white arrows), the signals in this frequency band dropped to the noise level. This occurred because the background discrete aurora weakened, reducing the amplitude of the flickering to a level at which it was no longer detectable as a signal. Weak flickering can nevertheless be identified in Video 1, especially in the video interval from 00:00 to about 11:50. Around 06:58–07:02 UT, the arc propagated equatorward and narrowed in its north–south extent, forming a typical curtain-like aurora just before the substorm onset. During this interval, no flickering was detected on the arc. However, flickering was observed in a latitudinally broader discrete aurora that appeared in a region farther north, as well as in the bulge observed afterward.
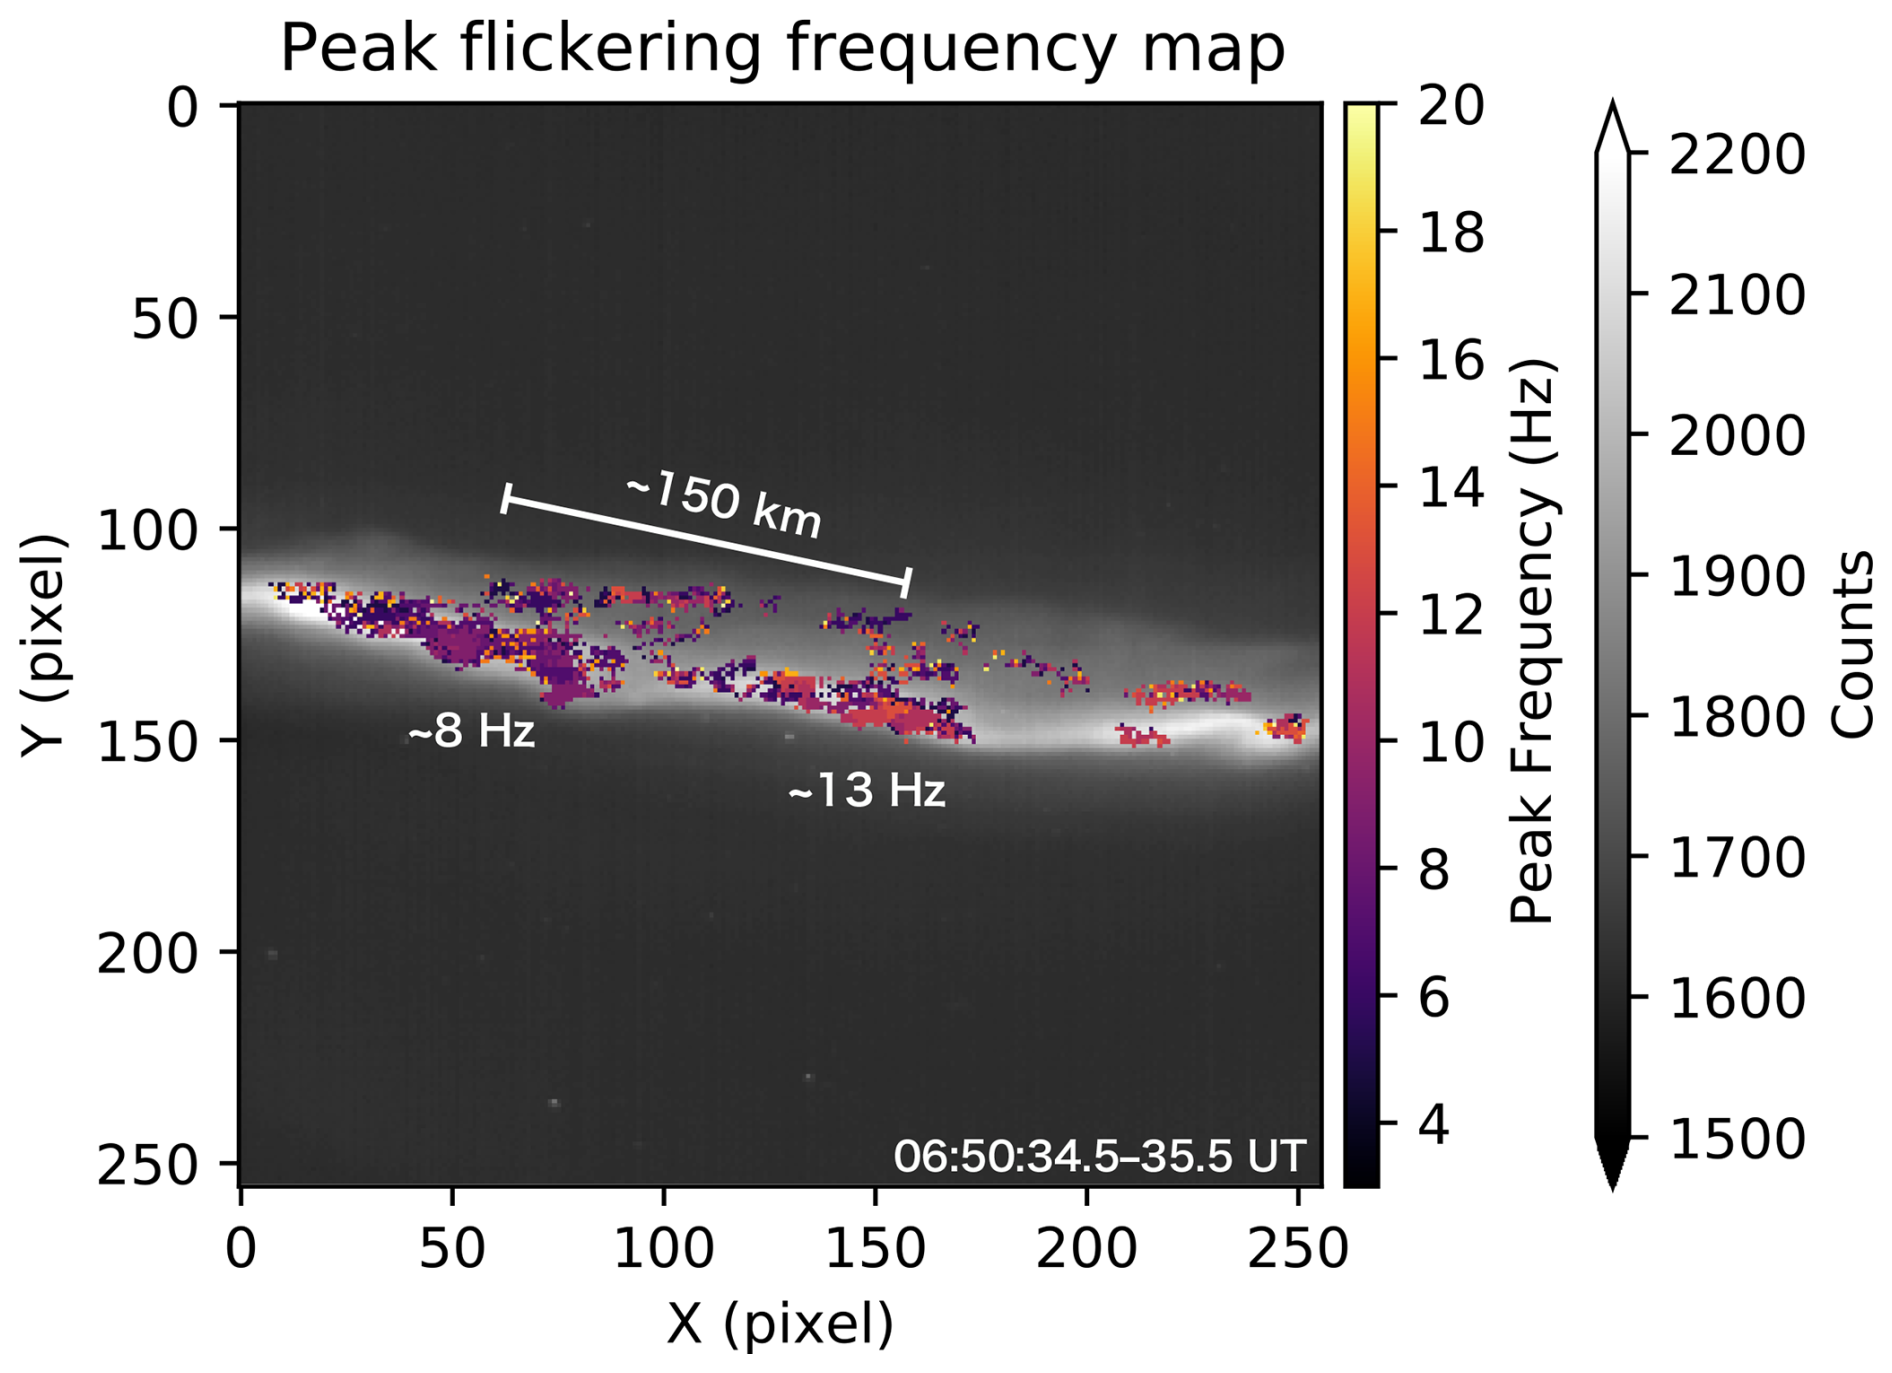
Figure 2Spatial distribution of the dominant flickering frequency for the 1 s interval starting at 06:50:34.5 UT. The color indicates the peak frequency in the 3–20 Hz range at pixels where the FFT power exceeds a threshold.
To investigate spatial variations in the periodicity, we examined the frequency distribution within a 1 s interval. Figure 2 presents the results for the 1 s interval starting at 06:50:34.5 UT (Fig. 1d), during which flickering aurora was clearly observed. The grayscale background image represents the average of the 80 frames acquired during this one-second period. The fast Fourier transform (FFT) was applied to the 1 s time series at each pixel whose mean count exceeded a predefined threshold, indicating the presence of auroral emissions. Among these spectra, pixels for which the spectral power in the 3–20 Hz range exceeded a threshold determined by visual inspection were identified as exhibiting flickering. For these pixels, the frequency corresponding to the maximum amplitude is shown in color.
Flickering was detected over broad portions of the arc, although not uniformly across its entire extent. This spatially intermittent pattern is consistent with visual inspection. The dominant frequencies varied spatially, generally ranging from 5 to 15 Hz. The distribution was not completely random: in some regions extending over more than 10 km, spatially coherent clusters exhibited similar peak frequencies. These clusters were larger than individual flickering patches; that is, multiple patches sharing similar frequencies formed a single cluster. In Fig. 2, for example, frequencies around ∼8 Hz were prevalent in regions with x coordinates below ∼80, whereas frequencies around ∼13 Hz were more common in regions with x coordinates above ∼120. The apparent mapped separation between these two regions was approximately 150 km when projected to the assumed emission altitude of 110 km.
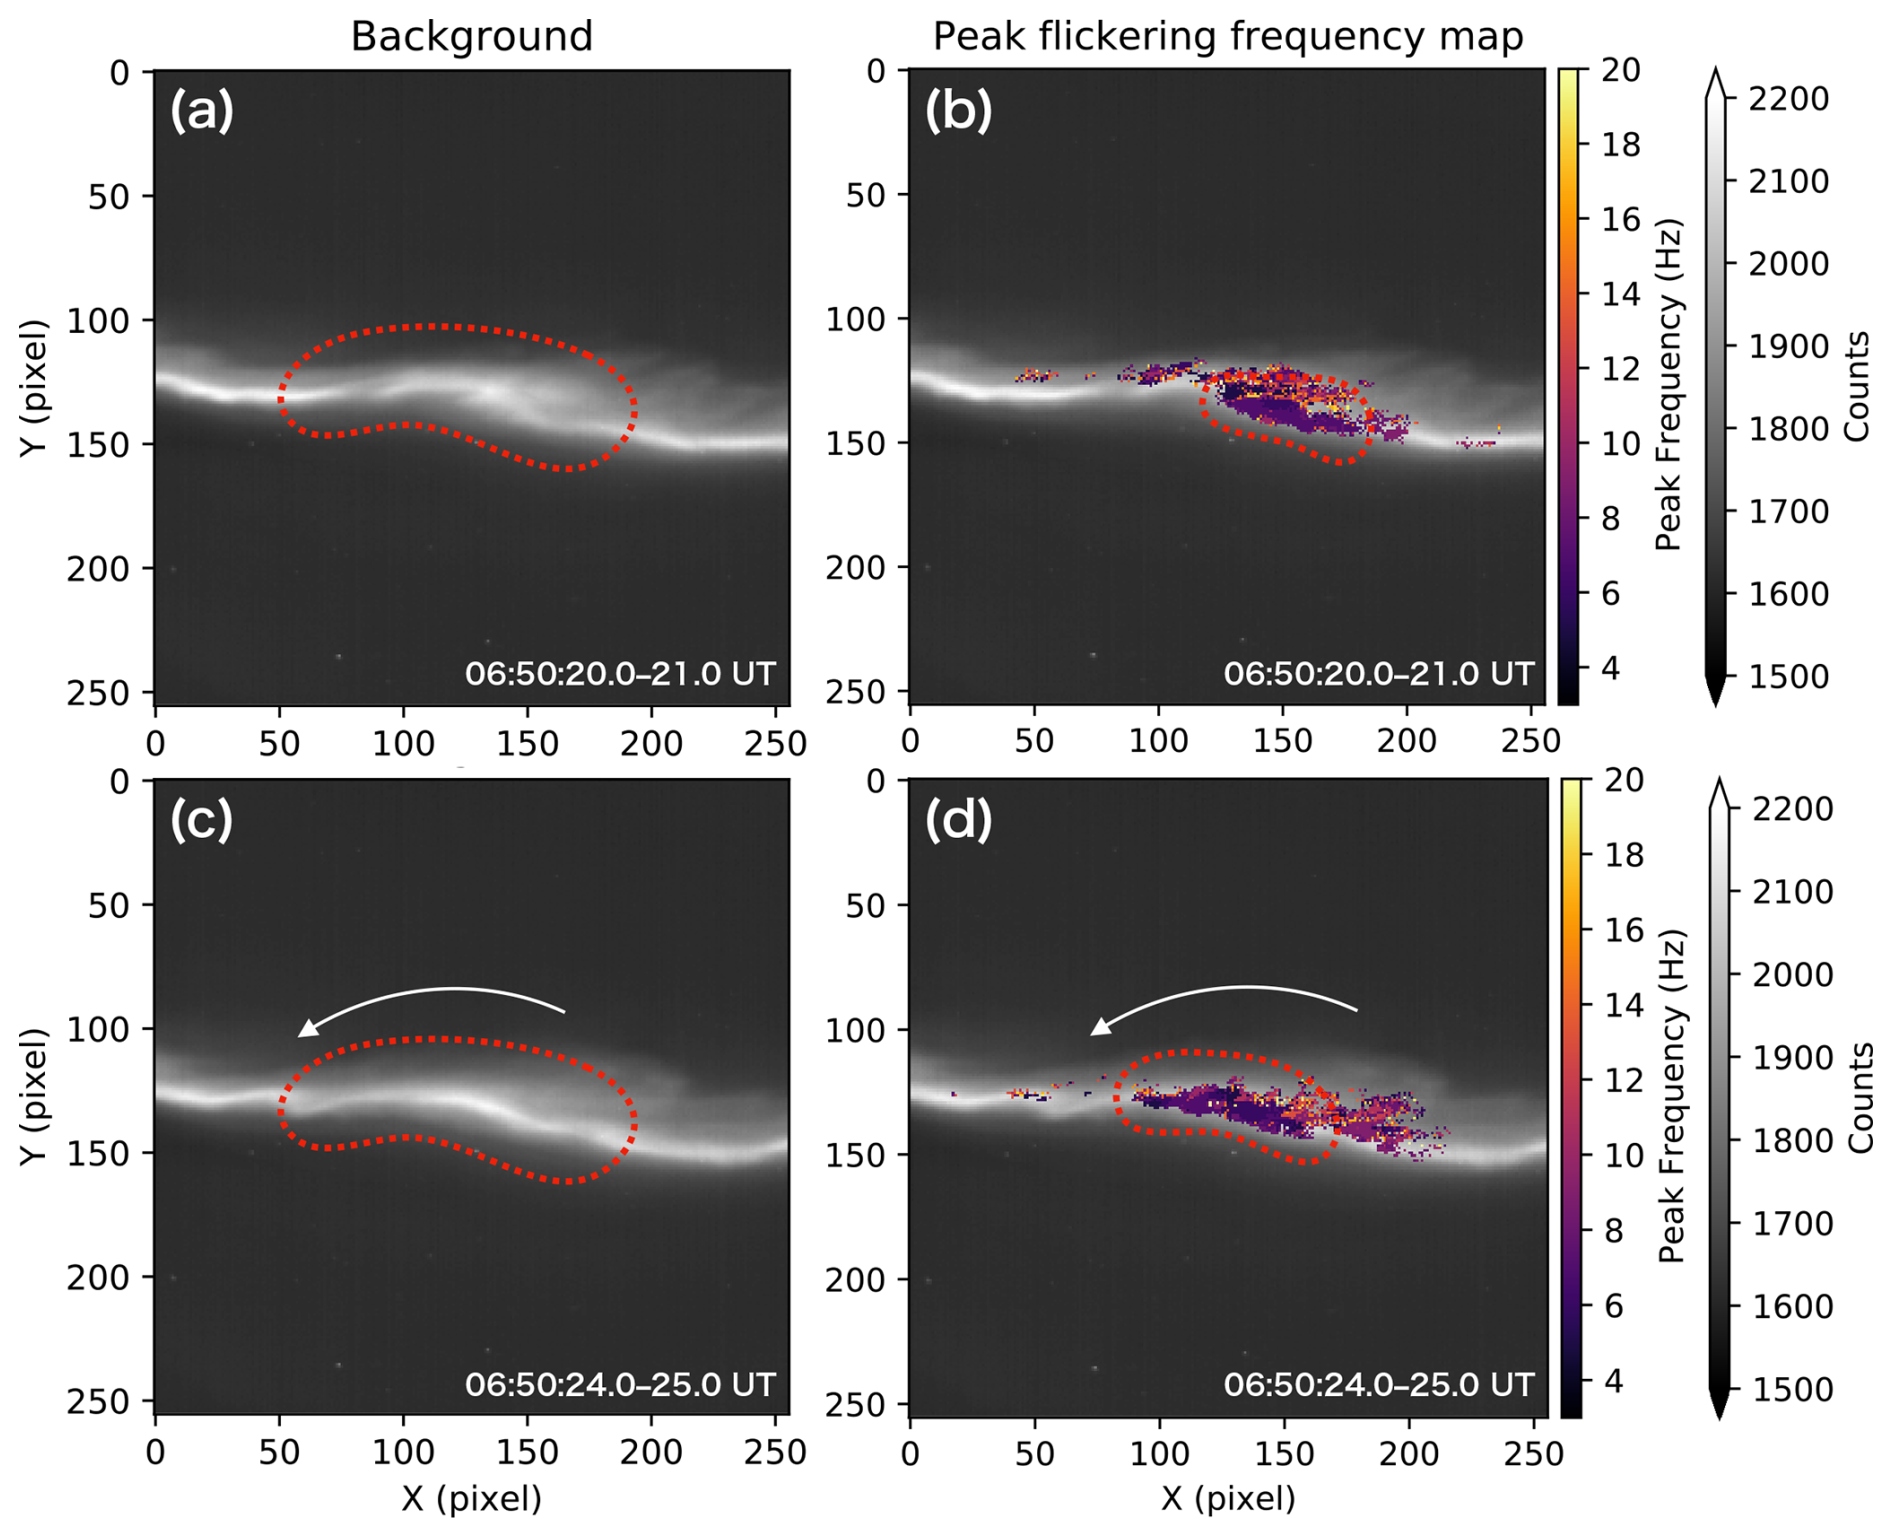
Figure 3Spatiotemporal evolution of flickering-frequency clusters associated with an auroral arc. (a) Average of 80 images over a 1 s interval starting at 06:50:20.0 UT. (b) Spatial distribution of the peak flickering frequency (3–20 Hz) derived from FFT. (c, d) Same as (a) and (b), respectively, but for data acquired 4 s later.
As shown in Fig. 3, clusters at a given peak frequency were sometimes observed to move together with the background auroral arc. Panel (a) shows the average of 80 images acquired during a 1 s interval starting at 06:50:20.0 UT. An arc extending in the east–west direction is visible; although the flickering cannot be discerned from the still image, the luminosity modulation is clearly seen in Video 1. The FFT was applied to the time series obtained during this 1 s interval at each pixel, and, as in Fig. 2, the frequency with the maximum amplitude in the 3–20 Hz range is shown in panel (b). Panels (c) and (d) show the same analyses applied to data acquired 4 s later, corresponding to panels (a) and (b), respectively.
Comparing panels (b) and (d) of Fig. 3, an eastward propagation is evident in the region enclosed by the red dotted line, in the direction indicated by the white arrow in panel (c). Specifically, a slightly folded, twisted structure becomes more linear in panel (c). At the same time, comparison of panels (b) and (d) shows that the 7–8 Hz cluster corresponding to this folded structure (outlined by the red dotted line in panel b) shifted eastward in concert with the motion of the auroral arc.
In the analyses presented so far, frequency analysis was performed on a pixel-by-pixel basis, without explicitly considering individual patch structures. However, to systematically investigate the relationship between patch size and periodicity, it is necessary to automatically detect the flickering patches themselves. Although two-dimensional region extraction directly from the video data is in principle possible, no optical filter was used in the present observations. As a result, the strong 557.7 nm oxygen emission can blur the boundaries of flickering patches, potentially introducing uncertainty in the estimated patch sizes. Therefore, in this study, patch detection was performed using keograms constructed from the video data. This approach has several limitations. First, a keogram cross section does not necessarily pass through the center of every patch; a slice intersecting only the edge of a patch can underestimate its apparent size. Therefore, the derived patch-size distribution should be interpreted as a distribution of apparent cross-slice extents rather than exact two-dimensional patch diameters. Second, off-zenith viewing may increase line-of-sight superposition, so multiple flickering components can contribute to a single pixel and complicate the apparent patch morphology. Nevertheless, keograms offer the practical advantage that even when the brightening of a single patch persists over multiple frames, it can be continuously tracked as a single patch. In this study, we prioritized this advantage.
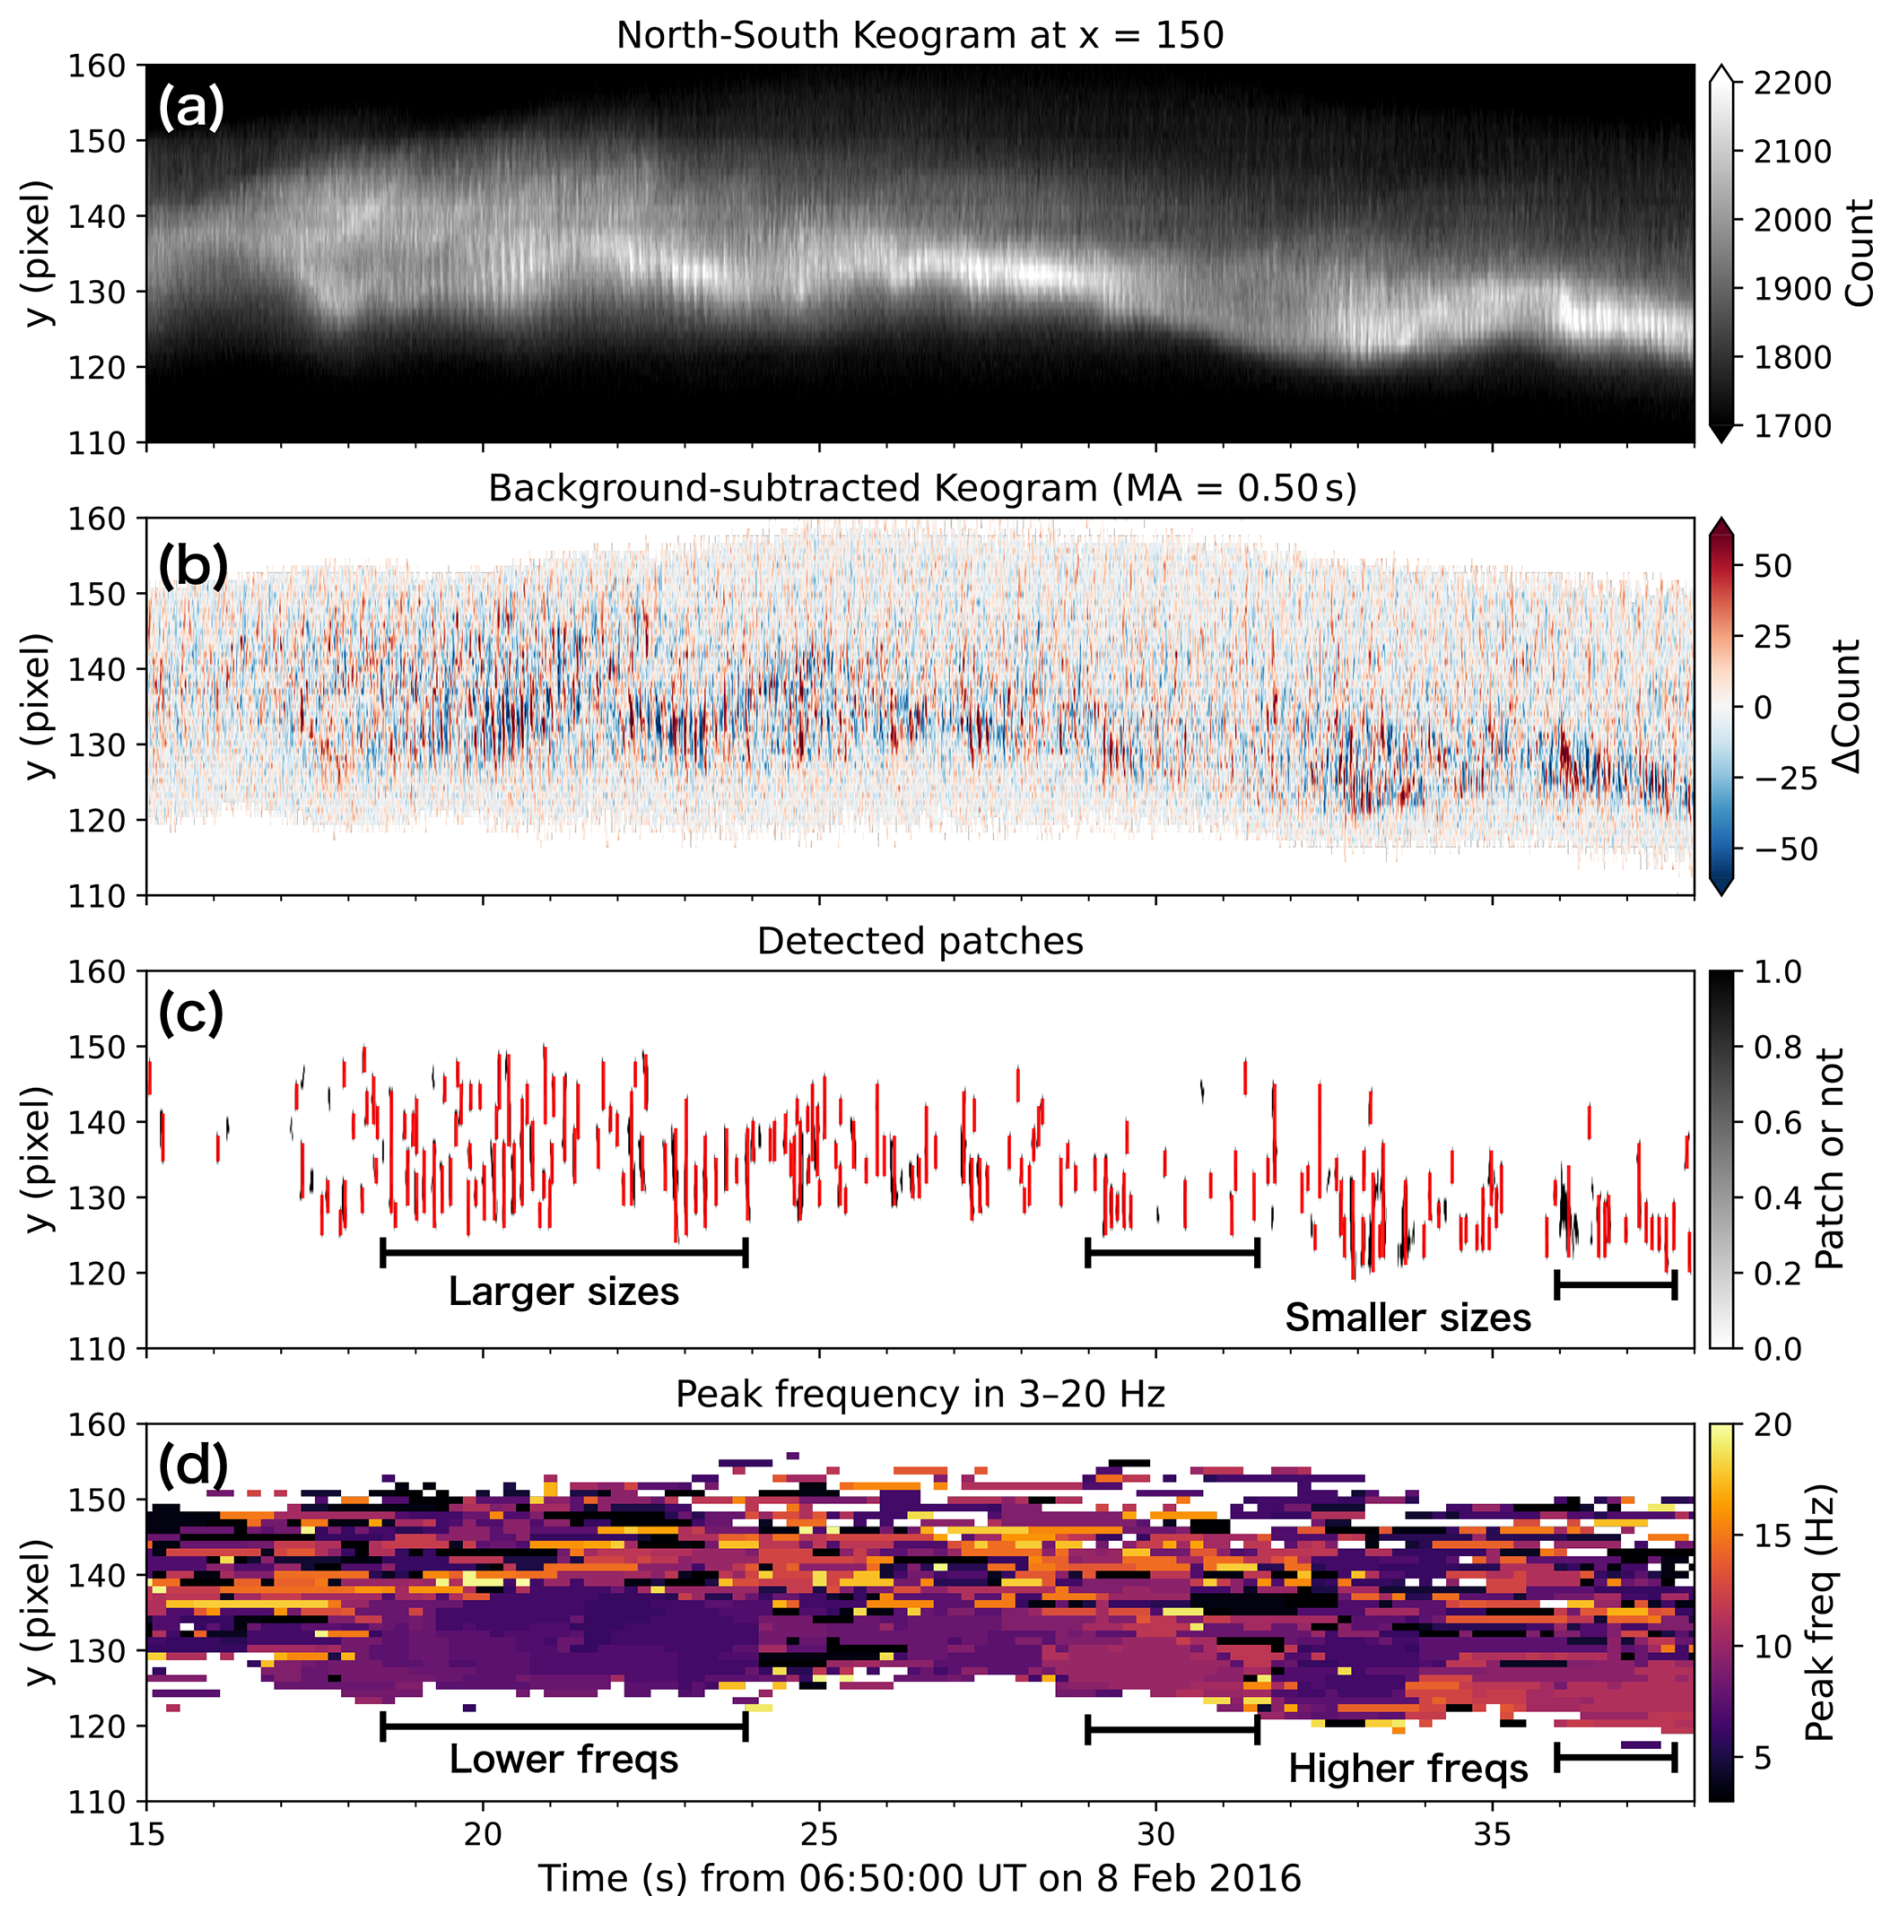
Figure 4Workflow for the automatic detection of flickering patches, illustrated using a relatively stable 23 s interval starting at 06:50:15 UT. (a) Keogram extracted at x=150, showing vertical stripe structures associated with flickering luminosity modulation. (b) High-frequency variations enhanced by thresholding and subtraction of a 0.5 s moving average. (c) Binary detection of flickering patches (ΔCount >30), with patch lengths identified by red lines. (d) Peak flickering frequency obtained from FFT analysis of the time series in (b).
Figure 4 illustrates the workflow for the automatic detection of flickering patches. As an example, we show a relatively stable interval with little motion, observed over a 23 s period starting at 06:50:15 UT. Panel (a) shows a keogram extracted at x=150. Fine vertical stripe structures on time scales shorter than 1 s are visible over much of the panel (minor ticks on the horizontal axis are given at 1 s intervals); these stripes represent the luminosity modulation of flickering aurora, and our first goal is to measure their vertical extent.
Panel (b) is obtained by removing dark regions in panel (a) using a threshold and subtracting a 0.5 s moving average from the remaining regions, thereby enhancing the high-frequency variations. Panel (c) shows a binary image derived from panel (b), where regions with ΔCount exceeding 30 are set to 1 and the others to 0. Structures extending over more than four pixels in the vertical direction are detected and overlaid with red lines. Each red line corresponds to the apparent cross-slice extent of an individual patch. The threshold ΔCount>30 was chosen because a relatively high threshold reduces false detections from background fluctuations and weak non-flickering brightness variations, although not all flickering structures are detected.
Panel (d) shows the frequency with the maximum amplitude obtained by applying the FFT to the time series extracted from panel (b) at 2 s intervals. The time windows were shifted in steps of 0.2 s, resulting in overlapping segments. Regions with small amplitudes (i.e., low brightness) were regarded as non-flickering and are left blank.
Comparison of panels (a) and (c) shows that, although not all flickering structures are detected, the identified structures (highlighted in red in Fig. 4c) correspond to the bright phases of the flickering and their lengths are generally consistent with the structures seen in panel (a). Furthermore, comparison of panels (c) and (d) indicates that, as illustrated in the figure, relatively long patches in the y direction (corresponding to about 7–10 km at an altitude of 110 km) were observed during the earlier part of the interval (approximately 18–24 s), when the peak frequency was around 8 Hz. In contrast, during the later intervals (approximately 29–32 and 36–38 s), shorter patches (about 4–6 km at an altitude of 110 km) were detected, with corresponding frequencies of about 12 Hz. In other words, larger patches tended to exhibit longer flickering periods (i.e., lower frequencies).
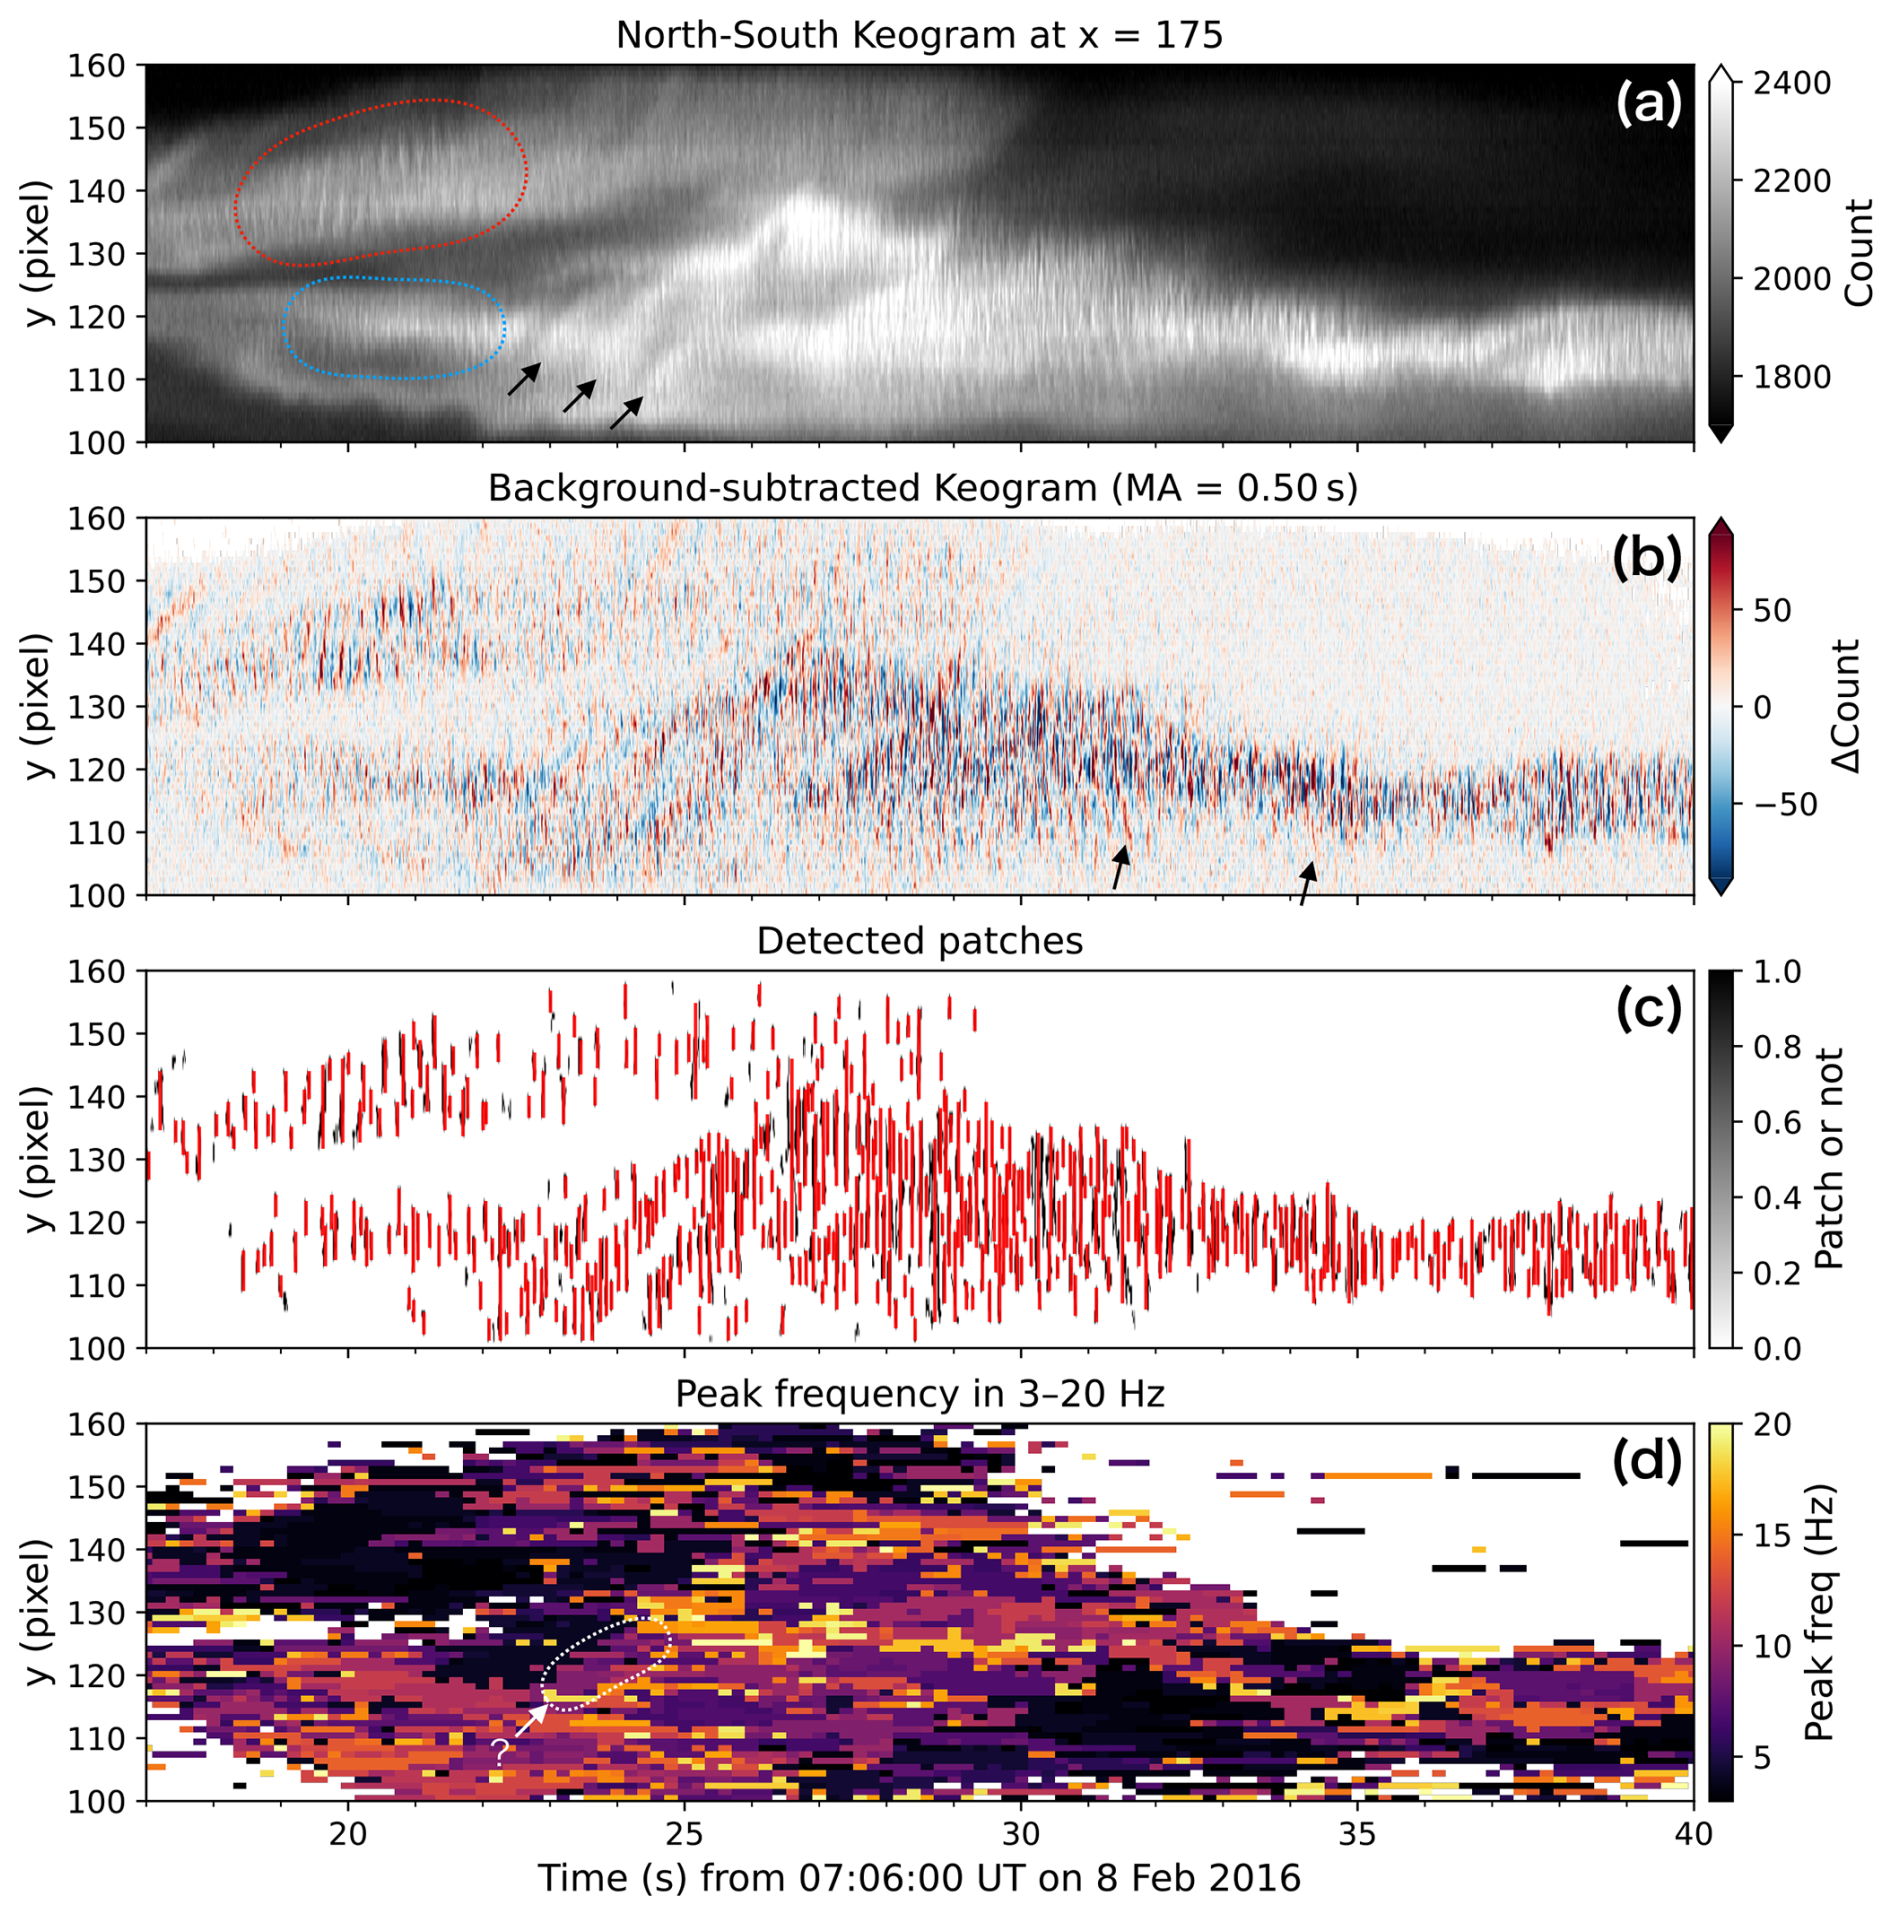
The same analysis as that shown in Fig. 4 was also applied to a brighter and more dynamically evolving discrete aurora observed during a 23 s interval starting at 07:06:17 UT (corresponding to Fig. 1e). The results are presented in Fig. 5. The figure format and analysis procedure are the same as in Fig. 4; however, note that the range of the y axis and the color-map scales in panels (a) and (b) are slightly different.
As shown in Fig. 5a, compared with Fig. 4a, the aurora occupied a much broader region, and flickering was correspondingly observed over a wider area. During the earlier part of the interval, two structures with comparable background brightness were observed above and below (north and south of) y≈125 pixels. In the region enclosed by the red dotted line, the flickering patches appeared at relatively long intervals, corresponding to a frequency of about 4 Hz as seen in panel (d). The apparent patch sizes in this region were typically about 7–11 km at an altitude of 110 km.
At the same time, in the region enclosed by the blue dotted line, located approximately 20 km away, the patches flickered at much shorter intervals, with a corresponding frequency of about 14 Hz in panel (d), roughly three times higher than in the red region. The apparent patch extents in this region were mostly about 3–5 km, representing roughly a factor-of-two difference compared with the red region. The tendency for larger patches to exhibit longer flickering periods (lower frequencies) is consistent with the results shown in Fig. 4.
In Fig. 5a, during a few seconds starting at 07:06:22 UT, structures extending toward the upper right were observed three times, as indicated by the black arrows. From the inclination of these structures, it can be inferred that the bright portion of the aurora propagated from south to north at a speed of approximately 10 km s−1. Figure 5b and c show that, even as these bright regions moved, flickering continued to accompany them. However, the patches themselves did not remain continuously bright while drifting northward.
In Fig. 5d, a region in which the peak frequency remains nearly constant along an upward-rightward trend can be identified, as outlined by the white dotted line. Although such a region does not correspond one-to-one with the structures seen in Fig. 5a, they may indicate that the flickering period is not strongly modulated during the propagation of the discrete aurora.
After the interval during which north–south-propagating auroral structures were observed (after 07:06:25 UT), patches with a wide range of apparent mapped extents, from approximately 2 to 15 km, were detected. Correspondingly, the peak-frequency panel in Fig. 5d shows a broad distribution of values ranging from about 3 to 20 Hz. In contrast to the period up to 07:06:22 UT and the cases shown in Fig. 4, it was difficult to identify a systematic relationship between patch size and frequency during this later interval. Even when focusing on individual moments, multiple isolated patches sometimes appeared without continuity in the north–south direction.
In addition, as indicated by the black arrows in Fig. 5b, patch structures resembling a laterally reversed J shape were observed. This implies that the patches propagated in the north–south direction at speeds of up to approximately 30 km s−1, rather than expanding from a fixed point. Although not shown in the figures, numerous patches propagating in the east–west direction were also identified in Video 1, particularly in the interval after about 15:53.
We statistically examined the relationship between the apparent north–south extent of patches and their flickering frequency observed in Figs. 4 and 5. We used the north–south extent because the discrete auroral arc was elongated mainly in the east–west direction, so this direction approximately sampled the arc across its narrow dimension. In addition, Video 1 shows that some flickering patches propagated along the east–west direction within the arc; therefore, an east–west extent would be more sensitive to along-arc motion. The north–south extent is thus used here as a practical one-dimensional measure of apparent patch size, rather than as a full two-dimensional patch diameter. Specifically, for the software-binned 256×256 pixel image sequences, the same analysis as in Figs. 4 and 5 was applied at x coordinates from 25 to 250 in steps of 25 pixels, at 1 min intervals over the period from 06:20 to 07:10 UT. For each analysis window, the length of each patch (in pixels) obtained from panel (c) was associated with the corresponding peak frequency from the frequency map in panel (d), yielding pairs of apparent patch length and peak frequency. The patch lengths were then converted to apparent mapped distances at an assumed altitude of 110 km.
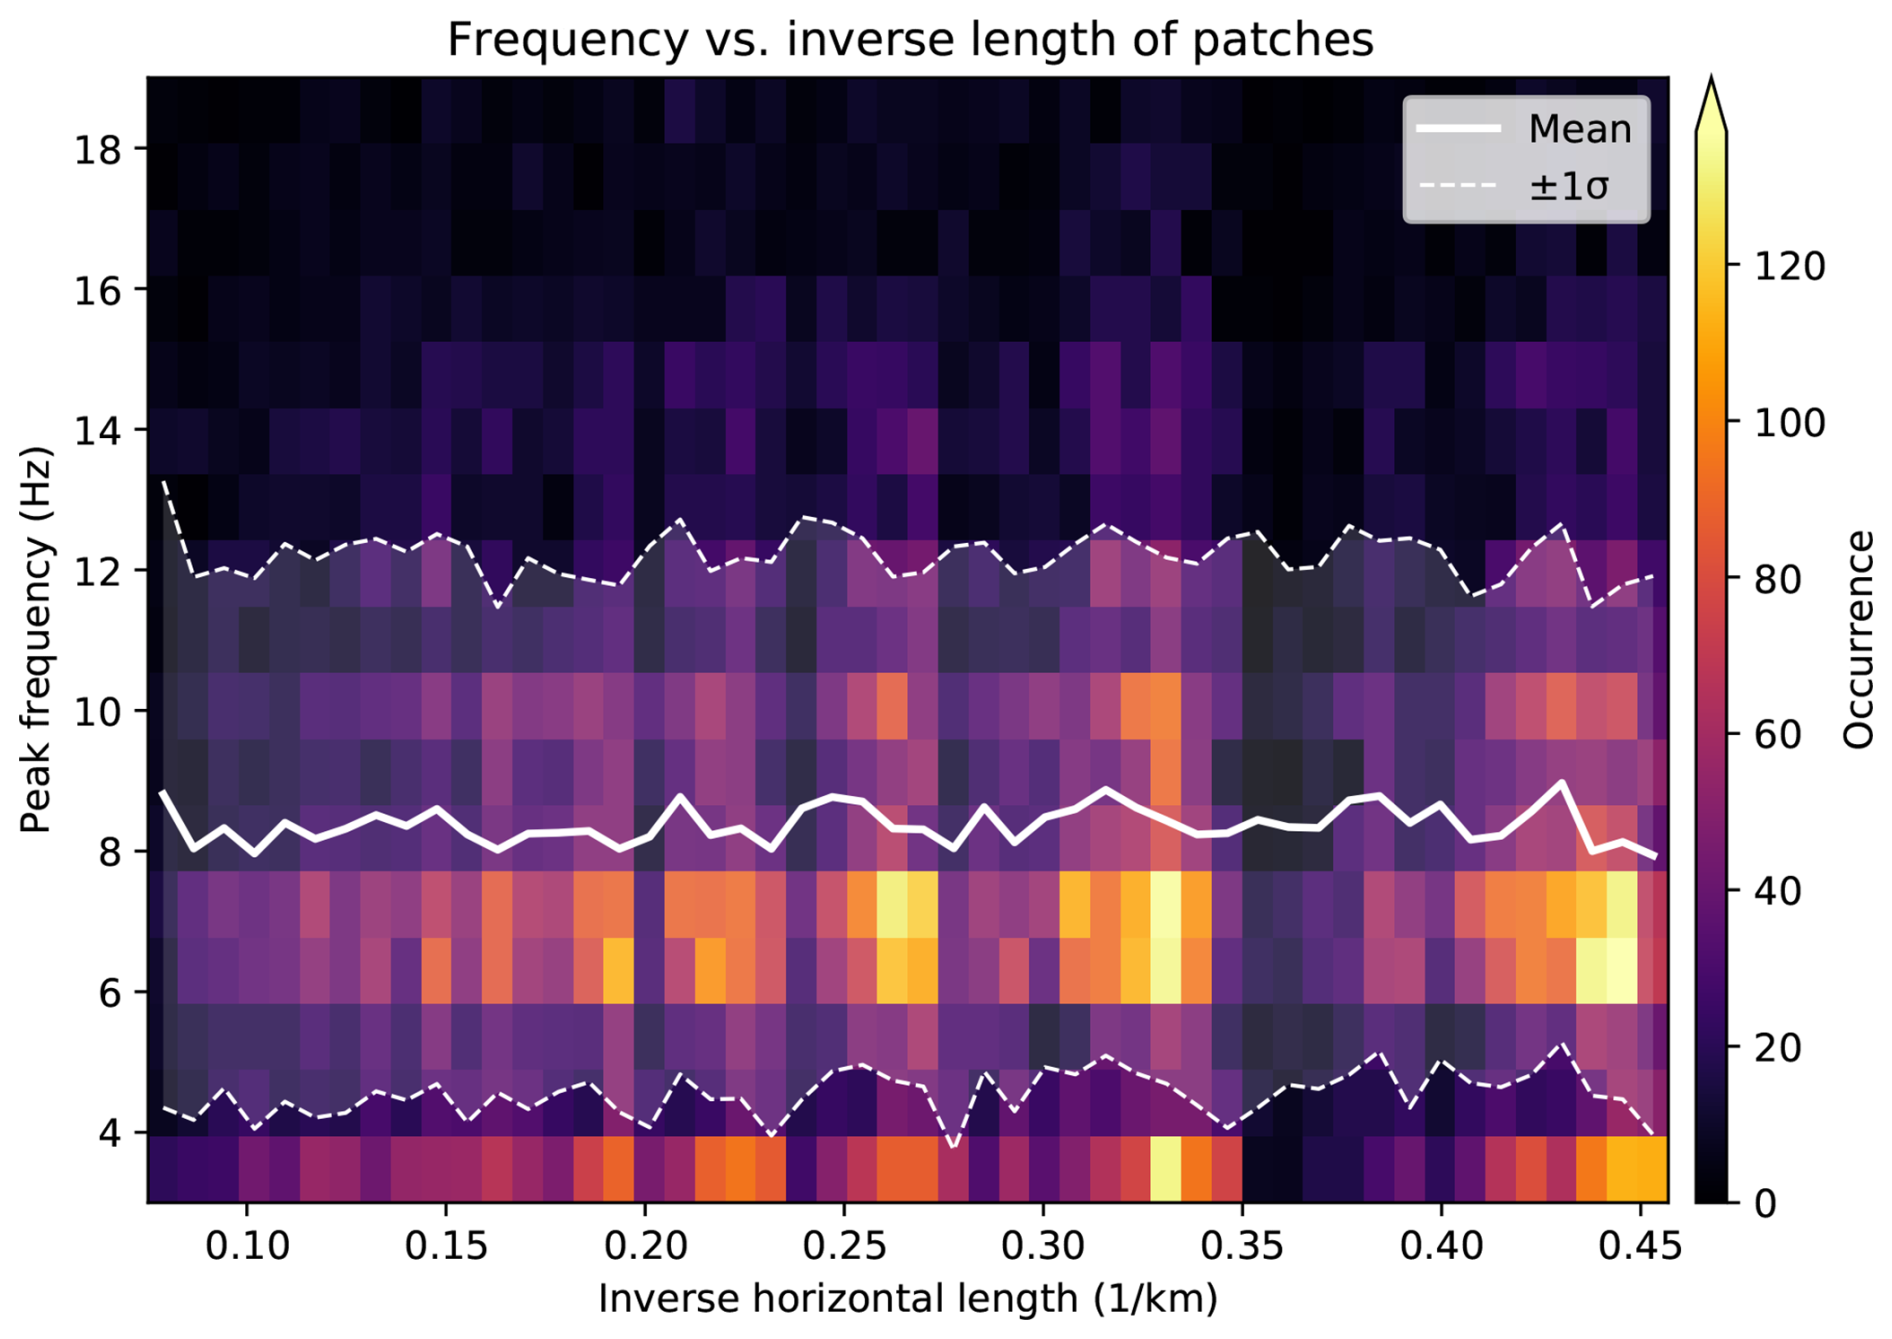
Figure 6Statistical relationship between flickering frequency and apparent patch size. The occurrence frequency map shows the peak flickering frequency as a function of the inverse apparent north–south patch length at an assumed altitude of 110 km, based on 23 704 detected patches. White solid and dashed lines indicate the mean value and the ±1σ range for each bin, respectively.
Figure 6 shows the occurrence frequency map of the inverse of the apparent north–south patch length at an altitude of 110 km and the corresponding peak flickering frequency, based on the 23 704 patches obtained through the procedure described above. In the figure, the mean value and the ±1σ range for each bin on the horizontal axis are indicated by white solid and dashed lines, respectively. According to Fig. 6, the flickering frequency remains nearly constant at about 8±4 Hz, regardless of patch size. Although the examples shown in Figs. 4 and 5 suggested a tendency for larger patches to exhibit lower frequencies (i.e., longer flickering periods), this trend is not reproduced statistically. This result is unchanged even when the analysis is restricted to shorter time intervals; that is, patch size does not depend on the flickering period over time. The typical north–south patch size is 4.4±2.4 km. We performed additional robustness checks for viewing geometry, detection threshold, finite emission thickness, and the assumed projection altitude; the details are given in Appendix C.
The inverse patch size shows a pattern of repeated local minima and maxima, particularly on the right-hand side of the distribution (corresponding to smaller patch sizes); however, this behavior is an artifact of the analysis arising from the fact that the spatial resolution of the observations is lower than the bin resolution along the horizontal axis.
The absence of a statistical relationship between flickering frequency and patch size suggests that the observed optical scale does not directly reflect a simple single-mode dispersion relation. Instead, it is naturally interpreted in terms of interference among multiple EMIC waves, as proposed in previous studies (Sakanoi et al., 2005; Gustavsson et al., 2008).
We analyzed a flickering aurora event observed above the Poker Flat Research Range, Alaska, during the interval from approximately 06:20 to 07:10 UT on 8 February 2016. The main results can be summarized as follows:
-
Flickering occurred intermittently in both space and time over a frequency range of 3–20 Hz.
-
Flickering patches at similar frequencies sometimes formed spatial clusters extending over regions larger than 10 km.
-
Some of these frequency clusters moved together with the background auroral arc.
-
Although individual patch analyses locally suggested a tendency for larger patches to exhibit lower frequencies, this trend was not confirmed statistically.
-
These results provide mesoscale observational support for interference-based EMIC/DAW generation scenarios, extending previous narrow-FoV interpretations to spatial scales of several hundred kilometers.
The flickering frequencies observed in this study are generally consistent with values reported in previous studies (e.g., Gustavsson et al., 2008; Michell et al., 2012; Sakanoi and Fukunishi, 2004; Whiter et al., 2010). These frequencies are not inconsistent with models in which flickering aurora originates from O+-mode EMIC waves excited at altitudes of approximately 4000–8000 km (Temerin et al., 1986; McFadden et al., 1987). Variations at frequencies higher than 30 Hz, which were discussed by McHarg et al. (1998), Yaegashi et al. (2011), and Fukuda et al. (2017), are close to the Nyquist frequency of the present observations (40 Hz) and are therefore difficult to measure reliably; accordingly, they are not discussed in this paper.
The spatiotemporal variation in the presence or absence of flickering may provide insight into the conditions under which flickering becomes visible, and by extension into the excitation conditions of EMIC waves. As shown in Fig. 1, flickering disappeared as the auroral arc propagated equatorward (southward) toward substorm onset while both weakening in brightness and narrowing in latitudinal extent; the same was true even when the brightness increased sharply just before onset. In contrast, during the same interval, flickering accompanied a relatively bright, latitudinally broader discrete aurora that appeared on the poleward (northward) side.
These observational results suggest that, while a certain level of background discrete auroral brightness is favorable for the visibility of flickering, flickering does not necessarily occur most readily in the brightest discrete aurora. They also indicate that a broader latitudinal extent of the background discrete aurora may be one of the conditions required for flickering aurora to be observable.
One possible growth mechanism for EMIC waves that may drive flickering aurora is a beam-driven instability associated with precipitating auroral electrons (e.g., Temerin and Lysak, 1984; Lin et al., 1989). In this framework, the wave growth rate depends on a variety of parameters, including the temperature and density of the electron beam and the background electron density (see Eq. 11 in Temerin and Lysak, 1984). Considering our observations, it is possible that the relevant parameters initially lay within a range favorable for EMIC growth, but that as substorm onset approached, for example, the background electron density became too high, reducing the growth rate so that flickering became undetectable.
It should also be noted that in the growth theory of Temerin and Lysak (1984), EMIC wave growth is controlled primarily by propagation along the magnetic field line, and perpendicular (vertical) propagation is not emphasized. Therefore, the apparent disappearance of flickering when the arc becomes latitudinally narrow may simply coincide with a period when the background arc weakened and the flickering amplitude became too small to detect, rather than indicating a direct causal relationship. It should also be noted that this linear growth model cannot account for the large amplitudes of observed O+ EMIC waves; Lund and LaBelle (1997) suggested that nonlinear or inhomogeneous effects may be important.
According to Temerin et al. (1986), flickering aurora can be produced when EMIC waves in/below the main acceleration region carry a finite parallel electric field that induces an oscillatory motion of low-energy electrons; if the oscillation velocity becomes comparable to the wave's parallel phase velocity, electrons can stay in phase with the wave and be accelerated downward, modulating the field-aligned flux at the wave frequency. They also showed that the parallel phase velocity of EMIC waves depends sensitively on the plasma density distribution along the magnetic field line, so that regions of lower density provide more favorable conditions for such wave–particle interaction.
In the present event, the temporal variation in the presence or absence of flickering should not be attributed solely to changes in the EMIC wave growth rate. It also reflects variations in the parameters required for resonant acceleration, as well as changes in the supply of low-energy electrons, associated with the spatiotemporal evolution of the discrete arc. For example, as onset approached, changes in the plasma distribution around the acceleration region may have shifted the parallel phase velocity of EMIC waves and the altitude at which the parallel electric field peaks, making resonant acceleration less effective along field lines in the equatorward onset arc, while the resonance condition may have been maintained along field lines connected to the broader and poleward discrete aurora.
Figure 2 shows that, at the same time, two regions along the same discrete arc exhibited coherent flickering at clearly different peak frequencies, around 8 Hz and around 13 Hz, with a horizontal separation of ∼ 150 km at an assumed altitude of 110 km. In addition to these two frequency bands, smaller-scale regions with a variety of flickering frequencies were scattered along the entire arc.
In the framework proposed by Sakanoi et al. (2005), flickering aurora is produced when dispersive Alfvén/EMIC waves emitted from a localized source region are confined within a resonance cone and form standing or interfering wave patterns, which then map to patches or columns a few kilometers across in the ionosphere. The ∼150 km separation between the two main frequency bands in Fig. 2 is therefore difficult to reconcile with the idea that all of the observed flickering arises from a single resonance cone fed by a single localized source; the distance is more than an order of magnitude larger than the typical size of an individual flickering patch. A more natural interpretation is that multiple wave sources are distributed along the arc in the east–west direction, each sampling slightly different local plasma conditions (electron density, temperature, ion composition, and field–aligned potentials) and therefore developing its own preferred modulation frequency through differences in EMIC/DAW growth rate and electron resonance conditions.
The observed frequency differences can also be interpreted in terms of variations in the source altitude. If the dominant flickering frequency is primarily controlled by the local ion cyclotron frequency of the relevant EMIC mode, , then a given frequency band corresponds to a specific range of magnetic field strength along the magnetic field line. Using the IGRF model, O+ cyclotron frequencies of 8 and 13 Hz are estimated to correspond to source altitudes of approximately 6000 and 3800 km, respectively, above the observation site. This implies that the two main frequency bands observed in Fig. 2 could originate from EMIC waves generated at different heights along neighboring field lines that map to the same auroral arc.
The simultaneous appearance of flickering patches with different peak frequencies was also confirmed during the interval enclosed by the red and blue dotted lines in Fig. 5a. In this case, a region of reduced auroral luminosity, appearing dark in the keogram, was present between the two flickering areas, indicating that each area corresponds to a separate inverted-V potential structure. This may imply that different wave source regions can coexist while being spatially separated, even on scales of only ∼ 20 km at ionospheric altitudes.
Furthermore, the two regions exhibited dominant frequencies of approximately 4 and 14 Hz, respectively, differing by roughly a factor of three. This suggests that, even at such close spatial separations, local variations in plasma parameters, such as electron density, ion composition, and current system, can strongly influence the growth and resonance conditions of EMIC waves, thereby producing substantial differences in the observed flickering frequencies.
Figure 3 shows that frequency clusters can move in concert with the background arc. This result suggests that the frequencies of EMIC waves driving flickering are not uniquely determined by large-scale spatial parameters such as magnetic latitude or L shell, but are instead strongly tied to the inverted-V potential structures present at a given time and to the local plasma environment associated with the accompanying discrete aurora. As demonstrated in Figs. 2 and 5, multiple wave source regions can coexist along the arc in the east–west direction, exhibiting markedly different peak frequencies at different locations. The results in Fig. 3 further indicate that these wave source regions can migrate collectively as the background auroral arc evolves and moves.
In other words, the visibility of flickering aurora likely depends not only on the presence of localized EMIC wave sources along magnetic field lines, but also critically on the structure and temporal evolution of the inverted-V potentials and the associated discrete auroral arcs that host these sources. This interpretation is consistent with the idea proposed by Sakanoi et al. (2005), in which flickering aurora is generated by EMIC/IAW closely linked to inverted-V electron precipitation in the auroral acceleration region, and extends that picture by providing mesoscale observational evidence that multiple interference-driven wave source regions can coexist and migrate along a single discrete auroral arc.
In Fig. 4 and in the early phase of Fig. 5, when the spatial structure of the background auroral arc was relatively stable, larger patches appeared to be associated with lower flickering frequencies. This behavior hints at a possible correspondence between the flickering frequency f and the perpendicular wave number k⟂ expected from the dispersion relation of obliquely propagating EMIC waves. Indeed, Yaegashi et al. (2011) examined the relationship between frequency and apparent wave number derived from optical observations and compared it with the dispersion relation of O+ EMIC waves (their Eq. 7 and Fig. 7), showing that the observations are broadly consistent with the theoretical curve at frequencies below 15 Hz. Michell et al. (2012) also showed consistency between observed flickering aurora features and the theoretical dispersion relation for O+ EMIC waves over a range of parallel wave numbers (see their Fig. 12).
Motivated by these results, we also investigated the statistical relationship between patch size and flickering frequency in Fig. 6. However, no clear tendency for larger patches to correspond to lower frequencies was identified; instead, flickering occurred over a wide range of patch sizes within the frequency band of 4–12 Hz. We note that the present analysis may be affected by off-zenith viewing, where integration along the line of sight can cause multiple flickering components to be mixed within a single pixel and the apparent periodicity to become less stable. Since we use only the FFT peak frequency as a summary metric, it is unlikely that this effect strongly distorts the overall frequency–size distribution; however, it cannot be completely neglected and may contribute to additional scatter.
This result is not necessarily inconsistent with generation models involving EMIC/DAW waves. In the Sakanoi–Temerin model, flickering aurora is interpreted as arising not from a single wave but from the interference of multiple EMIC/DAW waves. As a result, a simple relationship derived from the dispersion relation is not guaranteed to be directly reflected in the observed optical patch structures. Indeed, Fig. 7 of Yaegashi et al. (2011) shows that patches with broadband frequency characteristics exhibit widely scattered representative frequencies, such that the relationship between f and k⟂ is not uniquely defined. They further suggested that the optical scale may reflect the scale of the interference pattern constrained by the electron inertial length λe.
Therefore, although a correspondence consistent with the dispersion relation may appear transiently when the background arc structure and peak frequency are stable (Fig. 4 and the early phase of Fig. 5), such behavior is not expected to persist in a statistical sense. Instead, the statistical result that flickering is concentrated within a relatively limited frequency range (4–12 Hz in this study), independent of patch size, can be naturally interpreted in terms of interference among multiple waves and the characteristic scale set by the electron inertial length.
Considering the present observations and the results of Yaegashi et al. (2011), it may be possible, at least during moments when both the background arc shape and the peak frequency are temporally stable, to estimate the modulation altitude of the electron flux from the patch size and the flickering frequency. For events such as Fig. 4 and the early phase of Fig. 5, the observed combination of the frequency peak and the apparent wave number (i.e., patch size) does not strongly conflict with the dispersion relation of O+ EMIC waves. In such cases, a single wave mode may locally dominate, and interference among multiple modes may be relatively weak.
Under this assumption, the horizontal scale of the patches can be regarded as the ionospheric mapping of the electron inertial length in the region where electrons interact with the waves. The electron inertial length is given by . By adopting a model for the altitude profile of electron density and inverting this relationship, the approximate altitude of the modulation region may be inferred. The representative apparent patch size obtained in this study, 4.4 km at an assumed altitude of 110 km, corresponds, when mapped to the auroral acceleration region, to an electron inertial length of order λe∼100–400 m. This suggests that the optical scale of flickering patches may provide a useful diagnostic of the modulation altitude.
The corresponding electron density estimated from this inertial scale is on the order of . This value appears somewhat high compared to typical electron densities for the auroral acceleration region (Rönnmark, 1999); however, it is not implausible if the modulation occurs near the lower boundary of the acceleration region or within a relatively dense plasma environment connected to the topside ionosphere.
In this study, we used wide-FoV observations with a diagonal fisheye lens to examine flickering aurora generation models that have previously been discussed mainly on the basis of narrow-field camera and photometer observations. This approach allows the investigation to be extended to mesoscales of several hundred kilometers. While earlier studies have investigated in detail the temporal evolution of individual patches, dispersion relations, and their correspondence with EMIC waves within localized FoV, mesoscale structures such as the spatial extent over which modulation at the same frequency band is maintained, or how wave sources with different peak frequencies are arranged relative to one another, have not been fully captured.
By covering a wide FoV simultaneously, this study demonstrates (1) how the presence or absence of flickering evolves toward substorm onset, (2) that multiple wave source regions can be aligned in the east–west direction, each exhibiting a distinct peak frequency while following the background auroral arc, and (3) that although the relationship between patch size and frequency can be locally consistent with the dispersion relation, it may not hold statistically due to the influence of wave interference. These results indicate that mesoscale observations of flickering aurora provide an effective diagnostic for understanding how the microscopic physics of EMIC growth, propagation, and resonant electron acceleration is influenced by the macroscopic dynamics of discrete auroral arc development and motion during substorms. In addition, diagonal-fisheye imaging provides access to off-zenith perspectives that may be useful for exploring apparent vertical structuring and motion, potentially offering further constraints on field-aligned development and emission-altitude variability. Future accumulation of wide-FoV, high-time-resolution observations under a range of geomagnetic activity levels is expected to further advance our understanding of the mesoscale structure and temporal evolution of EMIC acceleration regions as revealed through flickering aurora.
Although the observed frequencies and their mesoscale organization are consistent with EMIC/DAW-related interpretations of flickering aurora, the present study is based primarily on optical imaging. We did not identify suitable conjugate in-situ wave measurements in the magnetosphere or ISR measurements for this interval. Therefore, the source-region wave properties, electron density structure, and acceleration-region altitude cannot be determined directly from the present data set. The EMIC/DAW interpretation should thus be regarded as a consistency argument based on the observed optical frequencies and morphology, rather than as a direct identification of the responsible wave mode.
Using high-time resolution, wide-field imaging, we have characterized the mesoscale organization of flickering aurora over spatial scales of several hundred kilometers, placing previous narrow-field results into a broader mesoscale context. Flickering was observed intermittently in the 3–20 Hz range, with most power between 4 and 12 Hz, consistent with O+ EMIC waves generated at altitudes of several thousand kilometers. The occurrence and visibility of flickering depended strongly on the evolution of the discrete arc: it disappeared as the background arc narrowed and intensified before substorm onset, while persisting on a wider polar-side discrete aurora and in the subsequent bulge, suggesting that suitable plasma and acceleration conditions are not simply controlled by brightness alone but also by the latitudinal width and structure of the arc. Spatial mapping revealed multiple frequency clusters along the same arc, separated by ∼150 km. These features indicate that multiple EMIC sources can coexist along neighboring field lines, each shaped by local plasma parameters and inverted-V potential structures, in line with interference-based models (Sakanoi et al., 2005; Gustavsson et al., 2008) and with beam-driven instability (Temerin and Lysak, 1984). Finally, although individual examples sometimes show an inverse relation between patch size and frequency reminiscent of the EMIC dispersion relation, our statistical analysis demonstrates that flickering frequencies are distributed within a similar band regardless of patch size, consistent with the idea that the optical scale reflects interference patterns rather than a simple one-to-one mapping from a single-mode dispersion curve.
Figure A1 shows the upstream solar wind and geomagnetic conditions on 8 February 2016, obtained from the 1 min OMNI data set (Papitashvili and King, 2020). The panels show the IMF magnitude and GSM Bz, solar-wind speed, proton density, SYM-H, and AE/AL indices from 03:00 to 16:00 UT. The two vertical dotted lines indicate the optical observation interval used in this study, 06:25–07:10 UT. During this interval, the IMF was predominantly southward, with GSM Bz reaching about −9 nT near the beginning of the optical observations. The solar-wind speed was approximately 400–420 km s−1 and the proton density was about 6–8 cm−3.
The geomagnetic indices indicate enhanced auroral activity during the optical interval. AE increased to about 1100 nT and AL decreased to nearly −950 nT, indicating strong westward electrojet activity around the time of the observations. SYM-H remained moderately negative, reaching about −46 nT, but did not indicate a major storm. These conditions show that the flickering aurora event occurred during an interval of enhanced geomagnetic activity.
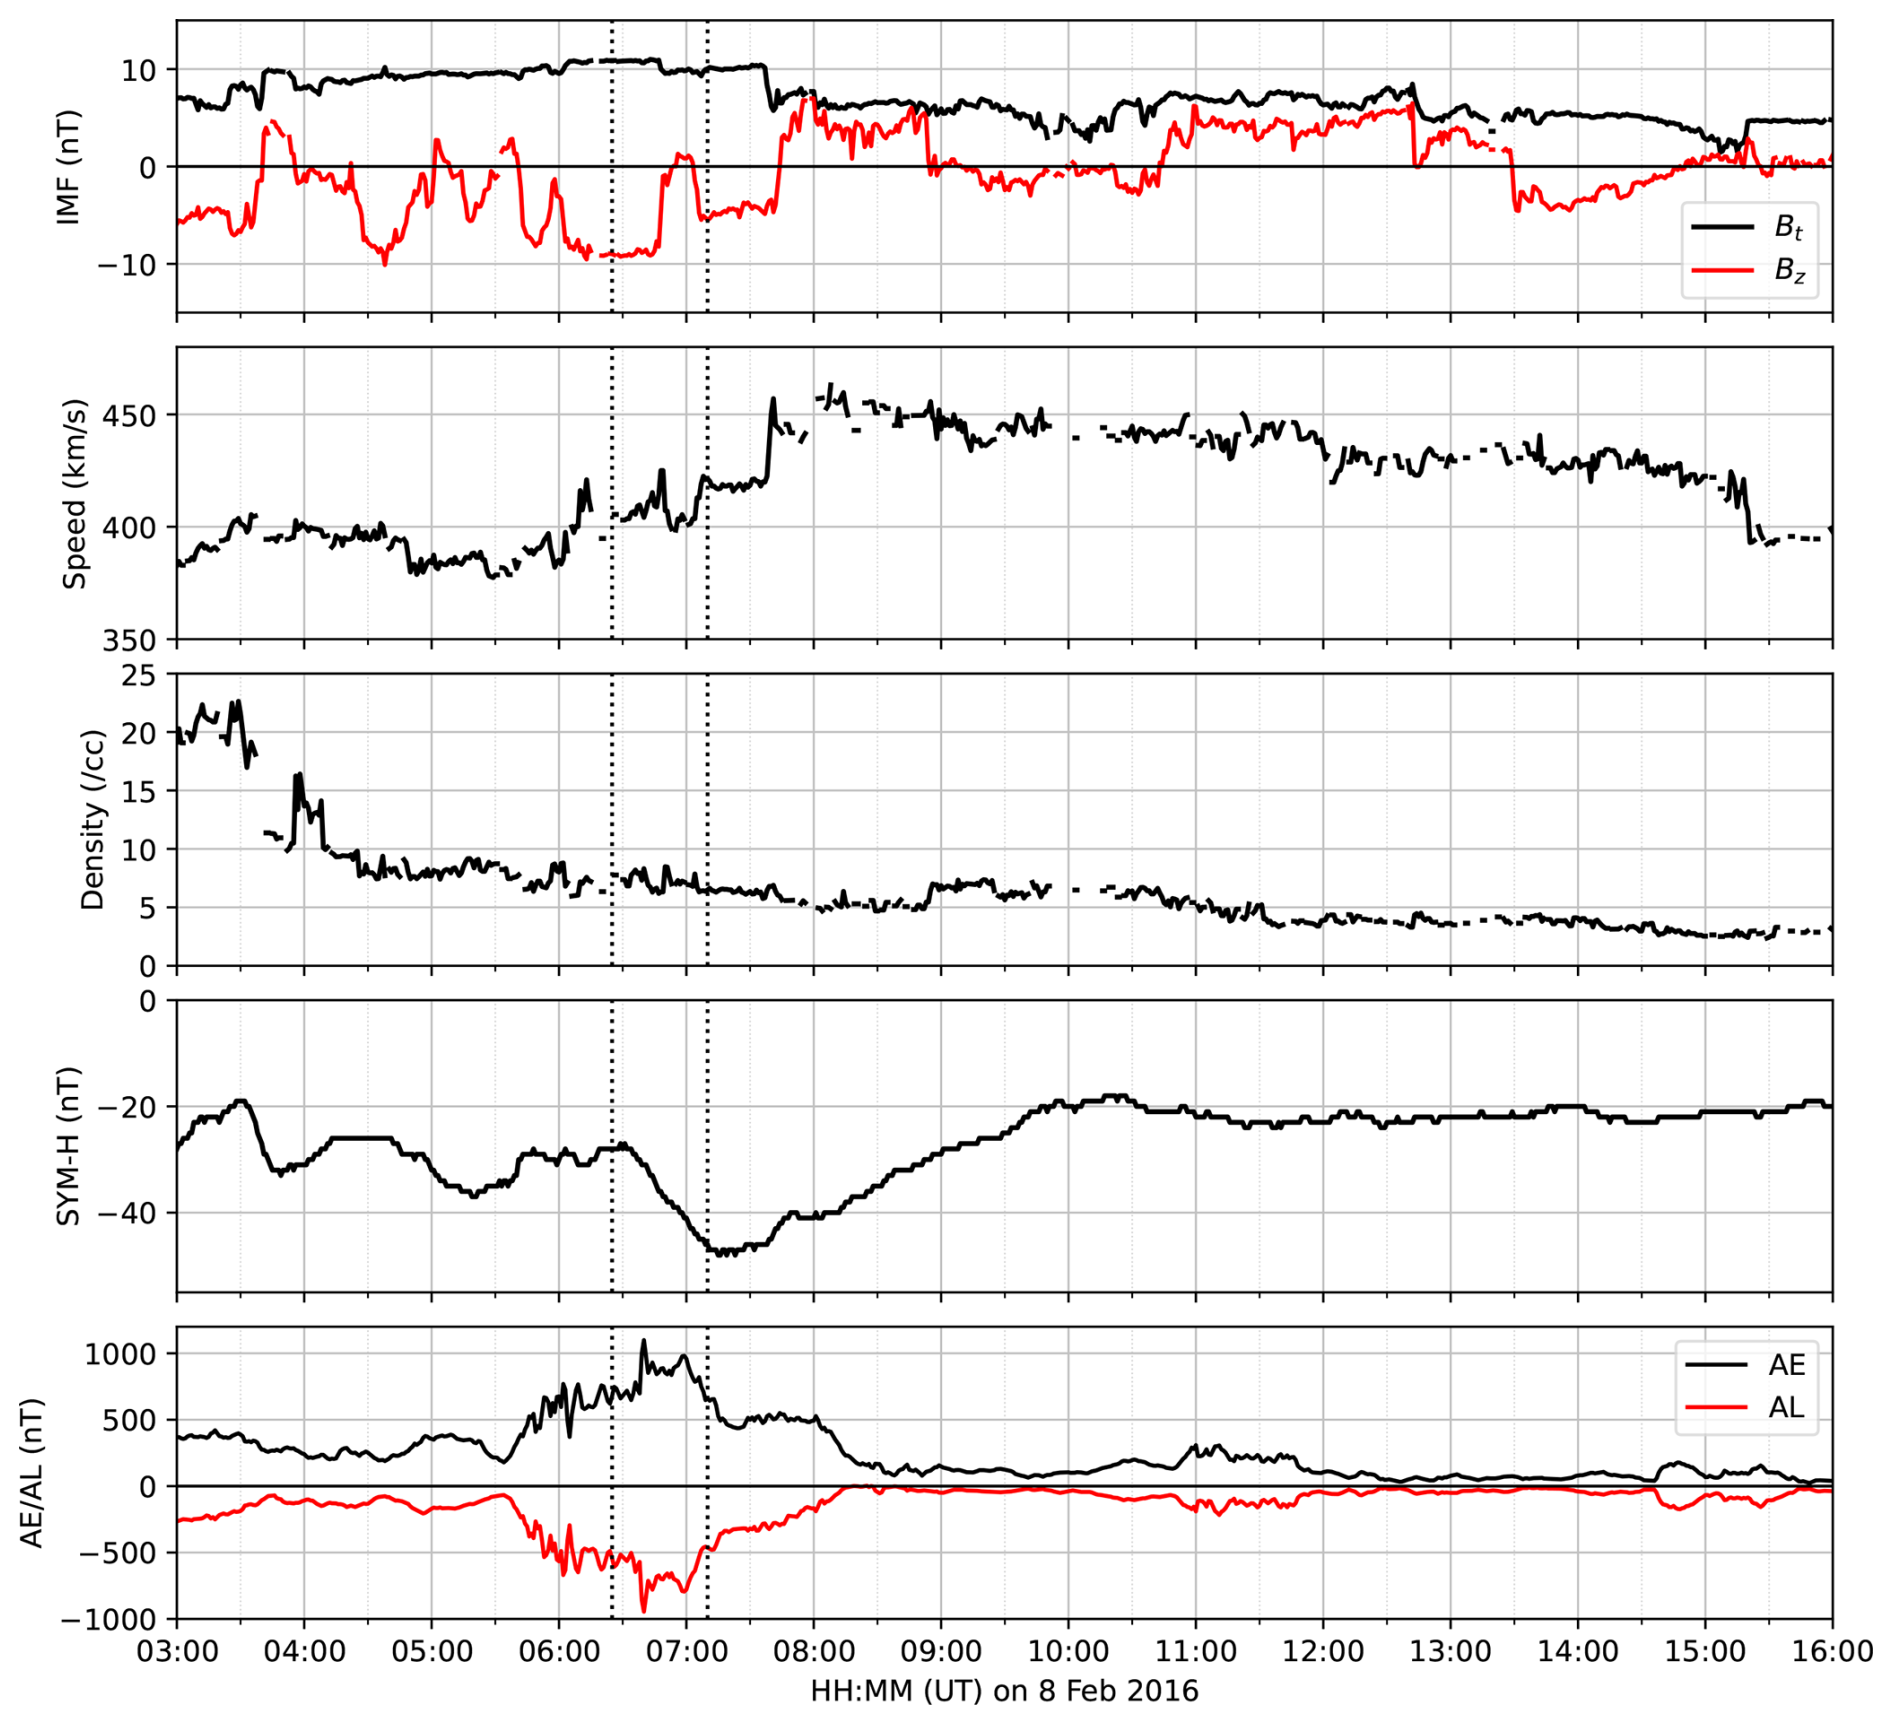
Figure A1Solar wind and geomagnetic context on 8 February 2016 from the 1 min OMNI data set. From top to bottom, the panels show IMF magnitude Bt and GSM Bz, solar-wind speed, proton density, SYM-H, and AE/AL indices. The vertical dotted lines mark the optical observation interval from 06:25 to 07:10 UT.
Figure B1 shows north–south keograms from the Poker Flat Research Range all-sky imager on 8 February 2016. The keograms provide a longer optical context for the flickering aurora interval analyzed in this study. The panels show emissions at 557.7, 427.8, 486.1, and 630.0 nm from approximately 03:00 to 16:00 UT. The interval used in the main analysis, 06:25–07:10 UT, occurred during an interval of enhanced auroral activity rather than during quiet conditions.
In the 557.7 and 427.8 nm keograms, bright discrete auroral structures were observed near and before the analyzed interval. The aurora intensified around 06:00–07:00 UT and showed substantial north–south motion, indicating that the flickering event was embedded in an active and dynamically evolving auroral arc system. The 486.1 nm emission was much weaker but also showed enhanced emission during the same broad interval, while the 630.0 nm keogram indicates more extended red-line auroral activity over several hours. These all-sky observations support the interpretation that the flickering aurora analyzed in the main text occurred as part of a broader auroral activation.
The all-sky keograms also show that auroral activity continued after the main sCMOS interval, including intensified structures around and after 07:00 UT. This is consistent with the geomagnetic context described in Appendix A, where enhanced AE/AL activity indicates strong auroral electrojet activity during the optical observations. Thus, the event should be interpreted as a flickering aurora interval embedded within a larger-scale active auroral system, rather than as an isolated optical feature.
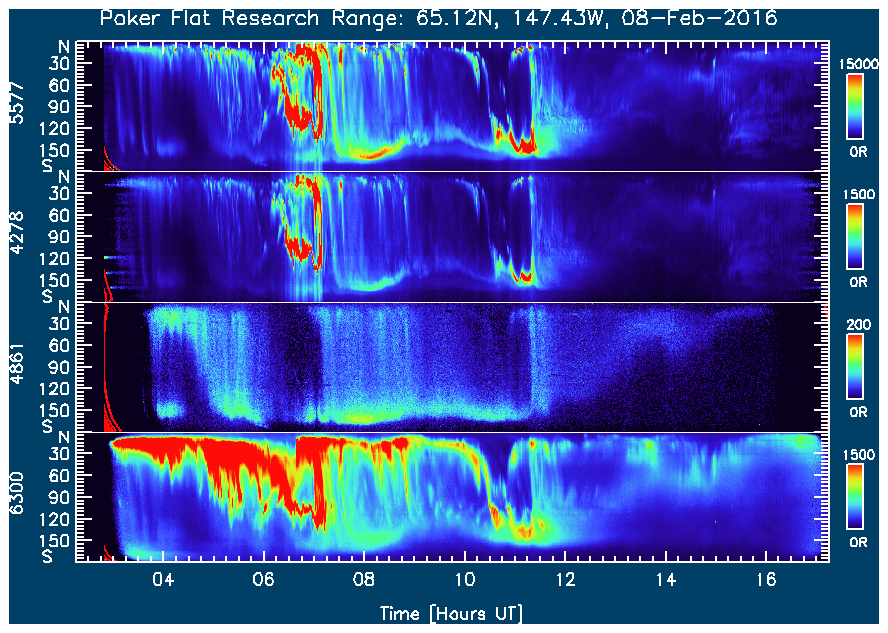
Figure B1North–south all-sky keograms from Poker Flat Research Range on 8 February 2016. From top to bottom, the panels show emissions at 557.7, 427.8, 486.1, and 630.0 nm. The flickering aurora interval analyzed in this study, 06:25–07:10 UT, occurred during an interval of enhanced and dynamically evolving auroral activity.
Figure 6 shows the statistical relationship between the apparent north–south patch length and peak flickering frequency for the 23 704 patches detected using the analysis parameters described in the main text. In this appendix, we summarize additional checks of the viewing geometry, finite-emission-thickness effect, detection threshold, and assumed projection altitude. These tests are intended to evaluate whether the absence of a monotonic frequency–size relation in Fig. 6 depends on the analysis assumptions.
The viewing geometry of the detected patches was first examined using the elevation angles of the 23 704 detections used in Fig. 6. Most detections were obtained at relatively high elevation: 22 956 detections (96.8 %) were above 45°, 17 075 detections (72.0 %) were above 60°, 748 detections (3.2 %) were between 30 and 45°, and no detections were below 30°. We repeated the frequency–size analysis using only the higher-elevation subsets. The Pearson correlation coefficients between inverse patch length and peak frequency were 0.002 for all detections, −0.004 for elevation >45°, and −0.020 for elevation >60°. Thus, although projection effects affect the absolute apparent patch sizes and cluster boundaries, especially away from zenith, the absence of a robust monotonic frequency–size relation is not controlled by low-elevation detections.
The possible effect of finite emission thickness was quantified using a simple geometrical estimate. If an auroral emission layer has an effective vertical thickness H and is viewed at elevation angle e, the apparent horizontal smearing caused by projection is approximately . For H=10 km, this smearing is 5.77 km at e=60°, 10.00 km at e=45°, 17.32 km at e=30°, and 27.47 km at e=20°. Thus, apparent patch sizes and cluster boundaries can be substantially overestimated at low elevation angles.
To test whether this effect controlled the frequency–size result, we repeated the statistical analysis using only high-elevation detections (e>60°), thereby excluding the detections most susceptible to severe off-zenith broadening. We then applied a patch-by-patch correction to the measured length, , assuming H=10 km, and retained only detections with positive corrected lengths (Lcorr>0.5 km). The resulting occurrence map is shown in Fig. C1. Even after this elevation filtering and conservative length correction, the mean peak frequency did not show a robust dependence on inverse patch length. Therefore, finite-thickness projection may affect individual patch-size estimates, especially at lower elevation angles, but it does not control the absence of a clear statistical frequency–size relation in Fig. 6.
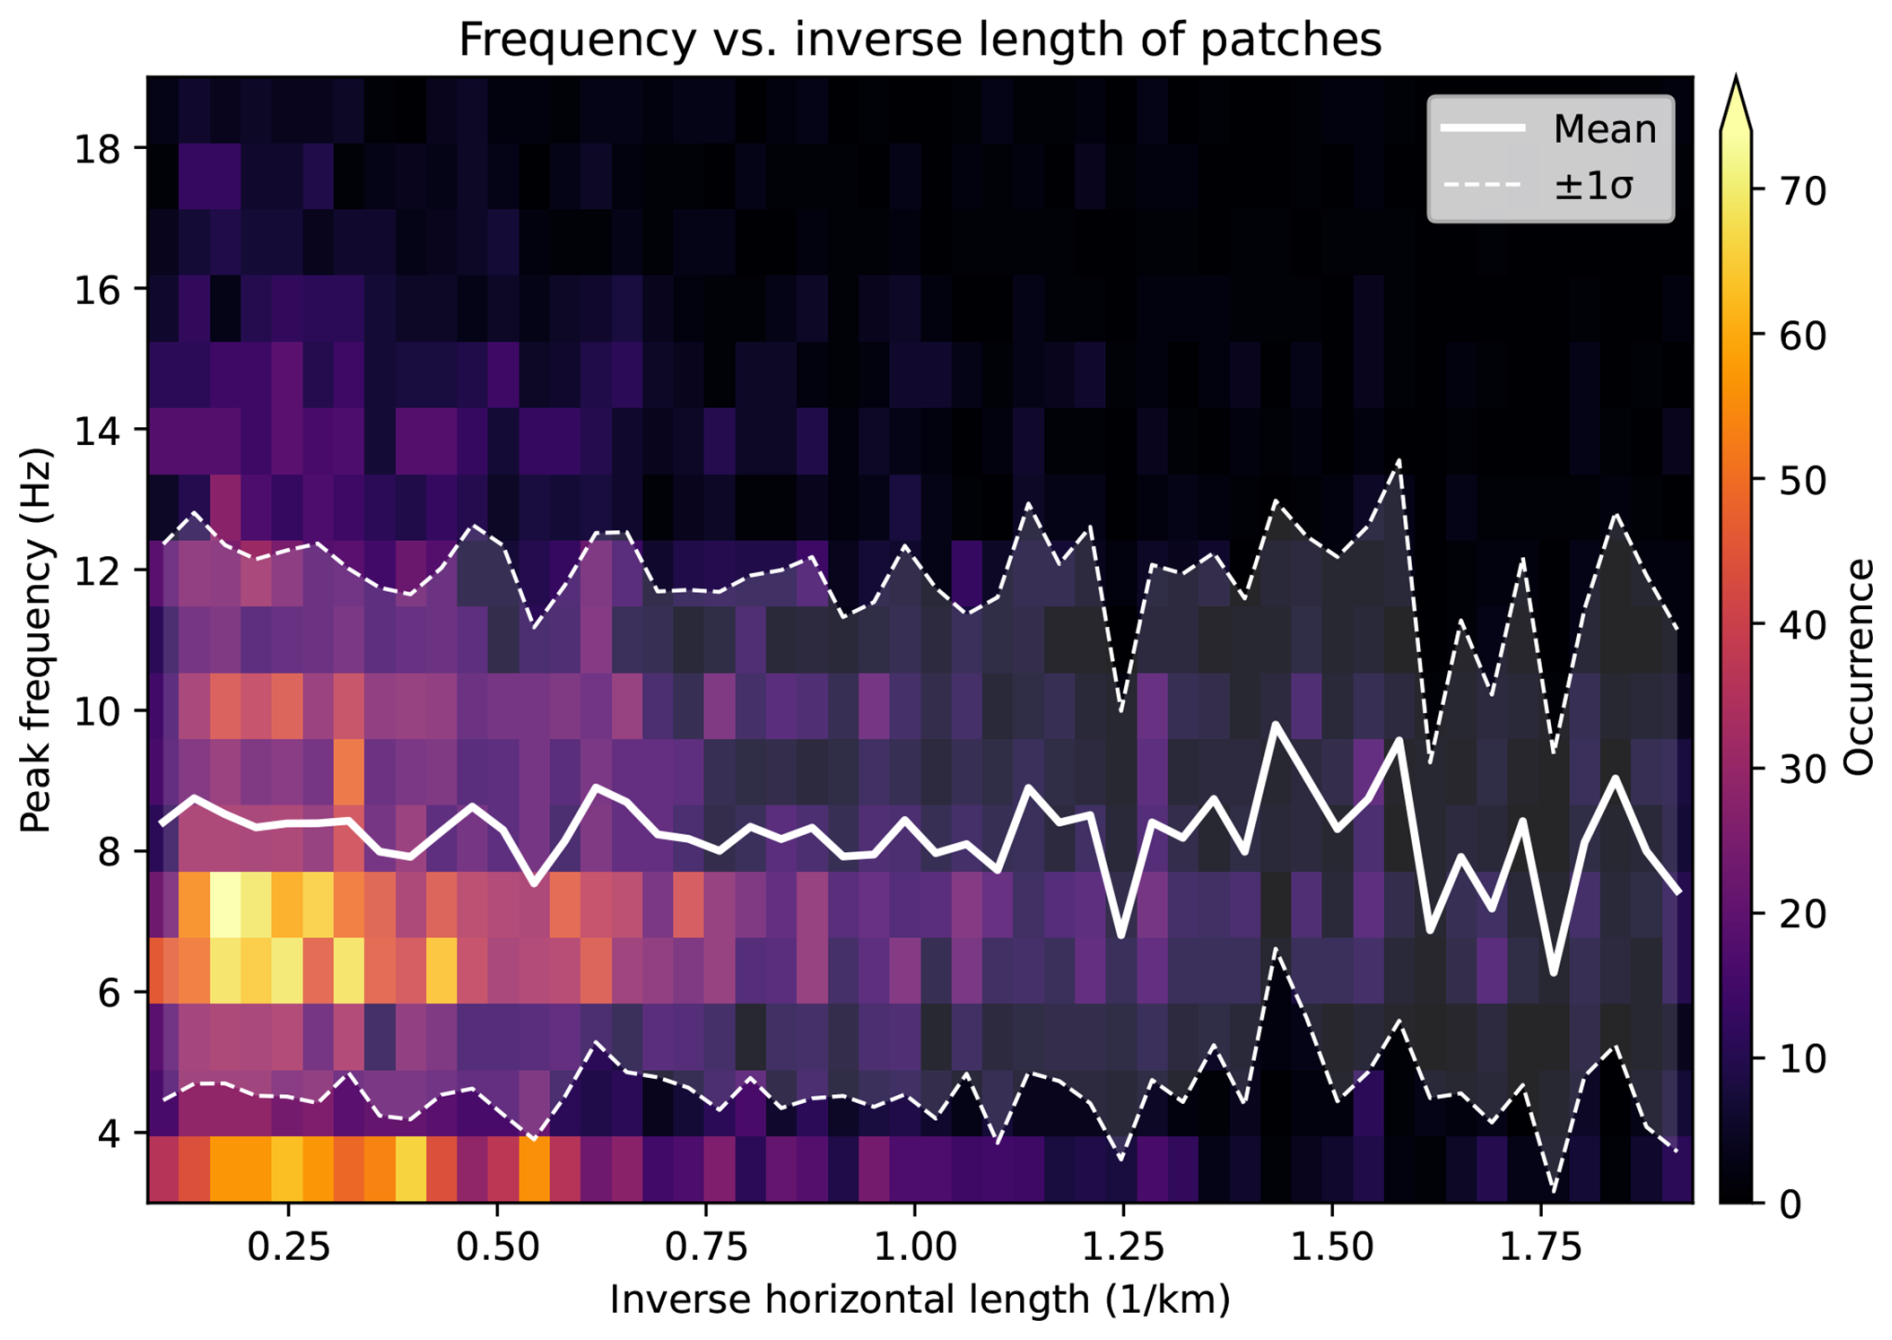
Figure C1Same format as Fig. 6, but using only high-elevation detections (e>60°) and patch lengths corrected for finite-thickness projection smearing, with H=10 km. Only detections with Lcorr>0.5 km are included.
The sensitivity to the ΔCount detection threshold was tested by repeating the full patch-detection and frequency–size analysis using thresholds of 20, 30, and 40. The numbers of detected patches were 46 622 for ΔCount>20, 23 704 for ΔCount>30, and 10 036 for ΔCount>40. As expected, the apparent patch-size distribution changed with threshold, with lower thresholds detecting more weak and extended structures and higher thresholds selecting fewer and generally shorter structures. The corresponding apparent patch lengths were 5.71±3.68, 4.35±2.43, and 3.93±2.00 km, respectively.
Despite this threshold dependence of the detected patch sizes, the frequency–size relation did not change systematically. The mean peak frequencies were 8.41±3.92, 8.45±3.92, and 8.52±3.97 Hz for thresholds of 20, 30, and 40, respectively. The Pearson correlation coefficients between inverse patch length and peak frequency were −0.004, 0.002, and −0.008, respectively. Figure C2 shows the Fig. 6-style occurrence maps for the three thresholds. We therefore conclude that the absence of a robust frequency–size relation is not an artifact of the chosen ΔCount threshold.
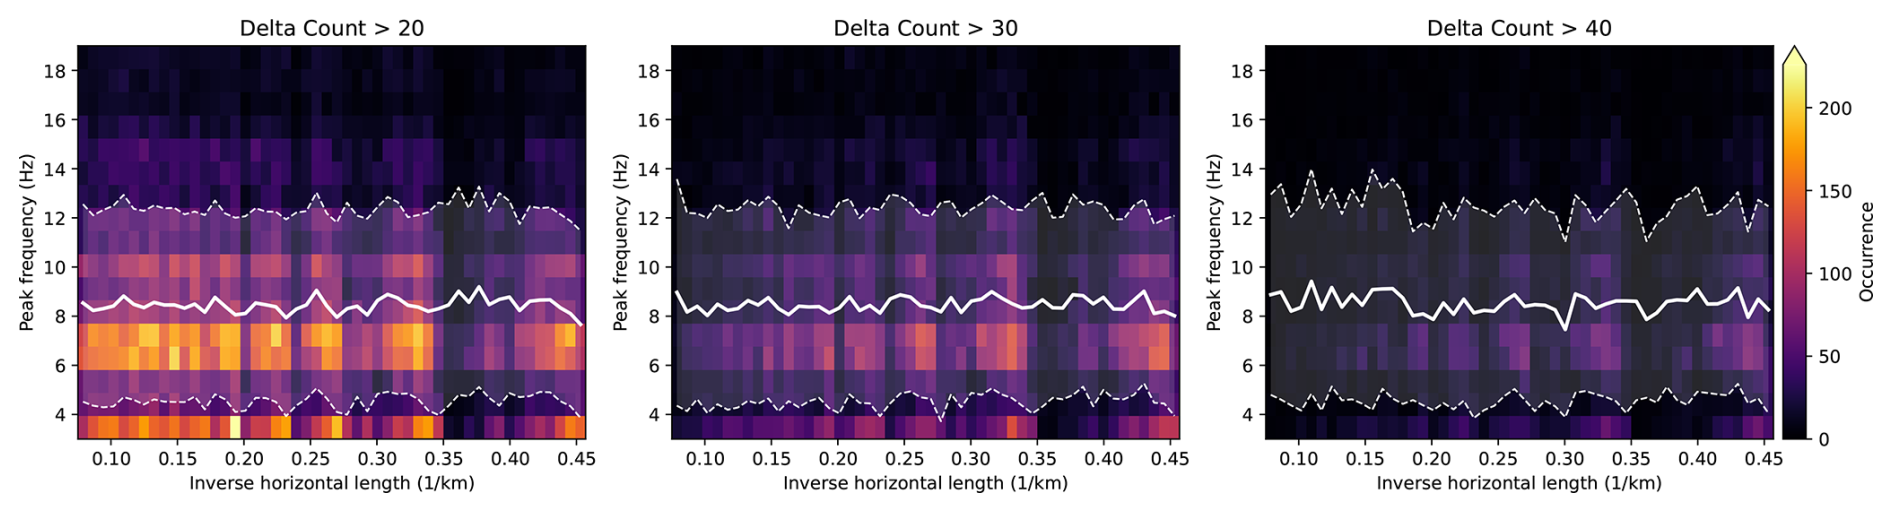
Figure C2Occurrence maps of peak flickering frequency as a function of inverse apparent patch length for three detection thresholds: ΔCount>20, 30, and 40. The main result, namely the absence of a frequency–size relation, is unchanged across the tested thresholds.
Finally, the sensitivity to the assumed projection altitude was tested by repeating the spatial mapping of the detected patches using projection altitudes of 90, 100, 110, and 120 km, while keeping the patch detection and peak-frequency estimates identical to those used in Fig. 6. Thus, the same 23 704 detected patches were compared for all assumed altitudes. The mean apparent patch length was 3.56±1.99 km at 90 km, 3.96±2.21 km at 100 km, 4.35±2.43 km at 110 km, and 4.75±2.65 km at 120 km. The corresponding medians were 2.98, 3.31, 3.64, and 3.97 km. Therefore, for an assumed emission-height range of 90–120 km, the mean apparent patch length changes by about 1.2 km. The peak frequencies are unchanged because the same detected patches were used, and the Pearson correlation coefficient remained 0.002 for all four altitudes. Thus, the assumed emission altitude affects the absolute apparent patch sizes and separations, but not the conclusion that this event shows no statistical dependence of peak flickering frequency on apparent patch size.
The raw files used in the analyses presented in this paper are available from Zenodo at https://doi.org/10.5281/zenodo.18481501 (Nanjo and Miyoshi, 2026a) and https://doi.org/10.5281/zenodo.18537506 (Nanjo and Miyoshi, 2026b). The 1 min solar wind parameters and geomagnetic indices were obtained from the NASA/GSFC Space Physics Data Facility OMNI data set through OMNIWeb (https://doi.org/10.48322/45bb-8792; Papitashvili and King, 2020).
Video 1 shows selected intervals of the flickering aurora observed at Poker Flat Research Range, Alaska, on 8 February 2016, obtained with the sCMOS camera used in this study. The video is available via the TIB AV-Portal at https://doi.org/10.5446/72336 (Nanjo, 2026).
SN performed all data analyses and prepared the manuscript. SK contributed to the conception of the study. TS contributed to the interpretation of the results. YM contributed to the observations, data management, and interpretation of the results. All authors contributed to revising the manuscript and approved the final version.
At least one of the (co-)authors is a member of the editorial board of Annales Geophysicae. The peer-review process was guided by an independent editor, and the authors also have no other competing interests to declare.
Publisher's note: Copernicus Publications remains neutral with regard to jurisdictional claims made in the text, published maps, institutional affiliations, or any other geographical representation in this paper. The authors bear the ultimate responsibility for providing appropriate place names. Views expressed in the text are those of the authors and do not necessarily reflect the views of the publisher.
The authors thank Don Hampton, Yoko Fukuda and the staff at Poker Flat Research Range for operational support for the sCMOS camera observations. This work was carried out by the joint research program of Institute for Space–Earth Environmental Research, Nagoya University. The first author is a JSPS Overseas Research Fellow.
This research has been supported by the Japan Society for the Promotion of Science (grant no. 25302006).
The publication of this article was funded by the Swedish Research Council, Forte, Formas, and Vinnova.
This paper was edited by Erik Schmölter and reviewed by three anonymous referees.
Beach, R., Cresswell, G., Davis, T., Hallinan, T., and Sweet, L.: Flickering, a 10-cps fluctuation within bright auroras, Planet. Space Sci., 16, 1525–1529, https://doi.org/10.1016/0032-0633(68)90064-0, 1968. a
Chen, L.-J., Kletzing, C. A., Hu, S., and Bounds, S. R.: Auroral electron dispersion below inverted-V energies: Resonant deceleration and acceleration by Alfvén waves, J. Geophys. Res.-Space Phys., 110, https://doi.org/10.1029/2005JA011168, 2005. a
Fukuda, Y., Kataoka, R., Uchida, H. A., Miyoshi, Y., Hampton, D., Shiokawa, K., Ebihara, Y., Whiter, D., Iwagami, N., and Seki, K.: First evidence of patchy flickering aurora modulated by multi-ion electromagnetic ion cyclotron waves, Geophys. Res. Lett., 44, 3963–3970, https://doi.org/10.1002/2017GL072956, 2017. a, b
Grydeland, T., Gustavsson, B., Baddeley, L., Lunde, J., and Blixt, E. M.: Conditional integration of Incoherent Scattering in relation to flickering aurora, J. Geophys. Res.-Space Phys., 113, https://doi.org/10.1029/2008JA013039, 2008. a
Gustavsson, B., Lunde, J., and Blixt, E. M.: Optical observations of flickering aurora and its spatiotemporal characteristics, J. Geophys. Res.-Space Phys., 113, https://doi.org/10.1029/2008JA013515, 2008. a, b, c, d, e, f
Kataoka, R., Miyoshi, Y., Sakanoi, T., Yaegashi, A., Ebihara, Y., and Shiokawa, K.: Ground-based multispectral high-speed imaging of flickering aurora, Geophys. Res. Lett., 38, https://doi.org/10.1029/2011GL048317, 2011. a
Kataoka, R., Fukuda, Y., Miyoshi, Y., Miyahara, H., Itoya, S., Ebihara, Y., Hampton, D., Dahlgren, H., Whiter, D., and Ivchenko, N.: Compound auroral micromorphology: ground-based high-speed imaging, Earth Planet. Space, 67, 23, https://doi.org/10.1186/s40623-015-0190-6, 2015. a
Kataoka, R., Chaston, C. C., Knudsen, D., Lynch, K. A., Lysak, R. L., Song, Y., Rankin, R., Murase, K., Sakanoi, T., Semeter, J., Watanabe, T.-H., and Whiter, D.: Small-Scale Dynamic Aurora, Space Sci. Rev., 217, 17, https://doi.org/10.1007/s11214-021-00796-w, 2021. a, b
Kunitake, M. and Oguti, T.: Spatial-Temporal Characteristics of Flickering Spots in Flickering Auroras, J. Geomagn. Geoelectr., 36, 121–138, https://doi.org/10.5636/jgg.36.121, 1984. a, b
Lin, C. S., Wong, H. K., Koga, J., and Burch, J. L.: Excitation of low-frequency waves by auroral electron beams, J. Geophys. Res.-Space Phys., 94, 1327–1337, https://doi.org/10.1029/JA094iA02p01327, 1989. a
Lund, E. J. and LaBelle, J.: On the generation and propagation of auroral electromagnetic ion cyclotron waves, J. Geophys. Res.-Space Phys., 102, 17241–17253, https://doi.org/10.1029/97JA01455, 1997. a
Lund, E. J., LaBelle, J., Torbert, R. B., Liou, K., Peria, W., Kletzing, C. A., Kelley, M. C., Baker, S. D., Primdahl, F., Stenbaek-Nielsen, H. C., Ranta, A., Haerendel, G., and Frey, H. U.: Observation of electromagnetic oxygen cyclotron waves in a flickering aurora, Geophys. Res. Lett., 22, 2465–2468, https://doi.org/10.1029/95GL02409, 1995. a, b
McFadden, J. P., Carlson, C. W., Boehm, M. H., and Hallinan, T. J.: Field-aligned electron flux oscillations that produce flickering aurora, J. Geophys. Res.-Space Phys., 92, 11133–11148, https://doi.org/10.1029/JA092iA10p11133, 1987. a, b, c
McHarg, M. G., Hampton, D. L., and Stenbaek-Nielsen, H. C.: Fast photometry of flickering in discrete auroral arcs, Geophys. Res. Lett., 25, 2637–2640, https://doi.org/10.1029/98GL01972, 1998. a, b
Michell, R. G., McHarg, M. G., Samara, M., and Hampton, D. L.: Spectral analysis of flickering aurora, J. Geophys. Res.-Space Phys., 117, https://doi.org/10.1029/2011JA016703, 2012. a, b, c
Nanjo, S.: Flickering Aurora Observed at Poker Flat Research Range, Alaska, on 8 February 2016, Swedish Institute of Space Physics (IRF), TIB AV Portal [video], https://doi.org/10.5446/72336, 2026. a, b
Nanjo, S. and Miyoshi, Y.: Raw images observed by an sCMOS camera at Poker Flat, Alaska during 06:14–06:44 UT on 8 February 2016, Zenodo [data set], https://doi.org/10.5281/zenodo.18481501, 2026a. a
Nanjo, S. and Miyoshi, Y.: Raw images observed by an sCMOS camera at Poker Flat, Alaska during 06:45–07:15 UT on 8 February 2016, Zenodo [data set], https://doi.org/10.5281/zenodo.18537506, 2026b. a
Papitashvili, N. E. and King, J. H.: OMNI 1-min Data Set, Space Physics Data Facility [data set], https://doi.org/10.48322/45bb-8792 (last access: 22 June 2026), 2020. a, b
Rönnmark, K.: Electron acceleration in the auroral current circuit, Geophys. Res. Lett., 26, 983–986, https://doi.org/10.1029/1999GL900133, 1999. a
Sakanoi, K. and Fukunishi, H.: Temporal and spatial structures of flickering aurora derived from high-speed imaging photometer observations at Syowa Station in the Antarctic, J. Geophys. Res.-Space Phys., 109, https://doi.org/10.1029/2003JA010081, 2004. a, b
Sakanoi, K., Fukunishi, H., and Kasahara, Y.: A possible generation mechanism of temporal and spatial structures of flickering aurora, J. Geophys. Res.-Space Phys., 110, https://doi.org/10.1029/2004JA010549, 2005. a, b, c, d, e, f
Temerin, M. and Lysak, R. L.: Electromagnetic ion cyclotron mode (ELF) waves generated by auroral electron precipitation, J. Geophys. Res.-Space Phys., 89, 2849–2859, https://doi.org/10.1029/JA089iA05p02849, 1984. a, b, c, d
Temerin, M., McFadden, J., Boehm, M., Carlson, C. W., and Lotko, W.: Production of flickering aurora and field-aligned electron flux by electromagnetic ion cyclotron waves, J. Geophys. Res.-Space Phys., 91, 5769–5792, https://doi.org/10.1029/JA091iA05p05769, 1986. a, b, c, d, e, f
Whiter, D. K., Lanchester, B. S., Gustavsson, B., Ivchenko, N., Sullivan, J. M., and Dahlgren, H.: Small-scale structures in flickering aurora, Geophys. Res. Lett., 35, https://doi.org/10.1029/2008GL036134, 2008. a
Whiter, D. K., Lanchester, B. S., Gustavsson, B., Ivchenko, N., and Dahlgren, H.: Using multispectral optical observations to identify the acceleration mechanism responsible for flickering aurora, J. Geophys. Res.-Space Phys., 115, https://doi.org/10.1029/2010JA015805, 2010. a, b
Wu, S. Y., Whiter, D. K., Lamy, L., Wang, M. M., Zarka, P., Jackman, C. M., Ye, S. Y., Waters, J. E., Fogg, A. R., Mende, S. B., Kaweeyanun, N., Kasaba, Y., Kurita, S., Kojima, H., Paxton, L. J., Kasahara, Y., Miyoshi, Y., Shinbori, A., and Tsuchiya, F.: Radio emissions reveal Alfvénic activity and electron acceleration prior to substorm onset, Nat. Commun., 16, 10553, https://doi.org/10.1038/s41467-025-65580-8, 2025. a
Yaegashi, A., Sakanoi, T., Kataoka, R., Asamura, K., Miyoshi, Y., Sato, M., and Okano, S.: Spatial-temporal characteristics of flickering aurora as seen by high-speed EMCCD imaging observations, J. Geophys. Res.-Space Phys., 116, https://doi.org/10.1029/2010JA016333, 2011. a, b, c, d, e
- Abstract
- Introduction
- Instruments
- Observation and analysis
- Discussion
- Conclusions
- Appendix A: Solar wind and geomagnetic context
- Appendix B: Other optical observations
- Appendix C: Robustness of Fig. 6
- Data availability
- Video supplement
- Author contributions
- Competing interests
- Disclaimer
- Acknowledgements
- Financial support
- Review statement
- References
- Abstract
- Introduction
- Instruments
- Observation and analysis
- Discussion
- Conclusions
- Appendix A: Solar wind and geomagnetic context
- Appendix B: Other optical observations
- Appendix C: Robustness of Fig. 6
- Data availability
- Video supplement
- Author contributions
- Competing interests
- Disclaimer
- Acknowledgements
- Financial support
- Review statement
- References