
the Creative Commons Attribution 4.0 License.
the Creative Commons Attribution 4.0 License.
 | 01 Sep 2026
Magnetotail response to corotating interaction region driven geomagnetic storms: Cluster observations
Adriane Marques de Souza Franco

Rashmi Rawat
Mauricio José Alves Bolzan
Ezequiel Echer
In this work we have selected 40 corotating/stream interaction (CIR) driven geomagnetic storms that occurred between 2001 and 2016, and statistically studied their impacts on the magnetotail. The wavelet transform was applied to the interplanetary magnetic field (IMF) Bz component, magnetotail Bx component, and the auroral electrojet (AE) index during geomagnetic storms. The cross-wavelet technique was applied to determine the periods of higher correlation between the IMF Bz× magnetotail Bx, IMF Bz×AE index and magnetotail Bx×AE index. More than 80 % of the most energetic periods in the IMF Bz and magnetotail Bx are found to be shorter than 4 h, independently of the storm phase. The AE index presented the range between 2–4 h as the most common with energetic periods for both storm main and recovery phases. In the recovery phase, periodicities in the AE index are more spread (≤12 h) than for the main phase (≤8 h) probably due to the presence of high-intensity long-duration continuous AE activities (HILDCAAs). From the cross-wavelet analysis (IMF Bz× magnetotail Bx, IMF Bz×AE index and magnetotail Bx× AE index), periods≤4 h are found to be dominant in both storm phases, which coincide with the cyclic substorm periods. The power spectral analysis showed that the IMF Bz and magnetotail Bx time series follow the Kolmogorov () power law. Additionally, the mean values of the spectral indices for the magnetotail Bx and AE index are higher during the recovery phase than the main phase.This suggests that turbulence is more pronounced during the recovery phase of geomagnetic storms driven by CIRs.
- Article
(9887 KB) - Full-text XML
- BibTeX
- EndNote


-
The HILDCAA events that occur during the storm recovery phases could cause a spread of energy to periodicities of 2–12 h in the auroral region.
-
During both phases of geomagnetic storms driven by CIRs, cyclic substorm periods (≤4 h) were found as dominant in the coupling between solar wind- magnetotail (IMF Bz× magnetotail Bx), solar wind-auroral region (IMF Bz×AE index) and magnetotail-auroral region (magnetotail Bx×AE index).
-
Spectral index results suggest a strong turbulence in the magnetotail and auroral regions during recovery phases.
A magnetized plasma is continuously emitted from the solar corona, known as the solar wind (Parker, 1958). This plasma propagates away from the Sun filling the interplanetary medium, with supermagnetosonic speed and carrying with it the solar magnetic field, called the interplanetary magnetic field (IMF) (Hundhausen, 1995). The IMF has a typical magnitude of the order of 5–10 nT near Earth's orbit (Baumjohann and Nakamura, 2007). As of today, the solar wind is broadly classified into two groups: high-speed streams (HSS) and slow streams (Schwenn, 2006). The slow speed streams have typical speed Vsw of ∼350–450 km s−1, and originated mainly from the helmet streamers of the Sun (Gosling et al., 1981; Suess et al., 2009; Abbo et al., 2016). HSSs, on the other hand, with Vsw in the range of ∼750–850 km s−1 (Phillips et al., 1995; Tsurutani et al., 2006) emanate from solar coronal holes (Krieger et al., 1973). When an HSS overtakes the ambient slower solar wind, a region of compressed plasma with an intense and fluctuating IMF is formed, called stream interaction regions (SIRs) or, if they persist for several solar rotations, corotating interaction region (CIR) (Smith and Wolfe, 1976; Tsurutani et al., 1995; Sánchez-García et al., 2024; Chian et al., 2024). For brevity and consistency with earlier works we will call all events studied here as CIRs.
In the CIRs there is compression and acceleration of plasma in the slow solar wind streams in the opposite direction to the Sun, and compression and deceleration of the fast solar wind streams towards the Sun. At 1 AU (Astronomical Unit = distance from Earth to the Sun ≈150 million kilometers), CIRs, in general, do not present well-developed shocks (Smith and Wolfe, 1976; Tsurutani et al., 1995). However they can lead to the occurrence of geomagnetic storms and other significant geomagnetic activity occurrence (Tsurutani et al., 1995, 2006; Alves et al., 2006). The geoeffectiveness of CIRs is related to fluctuations caused by Alfvén waves that can result in intervals of southward IMF (Richardson, 2006). They are usually followed by moderate storms with smaller percentages of CIRs leading to intense storms (Alves et al., 2006; Echer et al., 2008, 2013). Another type of geomagnetic activity, high-intensity long-duration continuous AE activities (HILDCAA) events, have their main cause associated to alfvénic fluctuations in HSS originating from coronal holes (Tsurutani and Gonzalez, 1987), since most of the events occurred during CIRs (Hajra et al., 2013, Souza et al., 2016).
Interplanetary Coronal Mass Ejections (ICMEs) are the main geomagnetic storm drivers during solar maximum and rising phases and tend to cause more intense events (Gonzalez et al., 2007; Echer et al., 2008; Rawat et al., 2018). On the other hand, in the declining phase, CIRs occur more often and become more important in the interaction between solar wind and the magnetosphere (Gonzalez et al., 1999, 2007). CIR driven geomagnetic storms are mostly moderate (), but they show to have a higher integrated energy and therefore a long-term higher effectiveness in the solar wind- magnetosphere coupling than geomagnetic storms driven by ICMEs (Turner et al., 2006). Thus they also present risks for space technology, communication power and transportation systems (Strugarek et al., 2014).
Koller et al. (2022) studied the relation between jets in the magnetosheath and large-scale structures from the solar wind, ICMEs and SIRs/CIRs using THEMIS observations. Their results suggest that SIR/CIRs and HSS can enhance the number of geoeffective jets in the magnetosheath.
Denton et al. (2006) have found that CIR-driven geomagnetic storms produce a more significant modulation in the plasma sheet temperature than events caused by ICMEs.
The response of the ionosphere to 79 CIR events during 2004–2009 using GPS-derived ionospheric total electron content (TEC) values was investigated by Chen et al. (2015). Those authors considered latitude, longitude, local time and storm onset time dependence. The daytime TEC response to CIR storms appeared to be different from that of ionospheric F2 peak densities at high and middle latitudes. The ionospheric peak density seems to present long periods of negative response of about 2–3 d while the TEC response seems to be mostly positive. Further, a positive response from the electron density in the daytime can be observed, whereas the subauroral region showed a negative response (Chen et al., 2015).
Korth et al. (2006, 2011) studied the response of the magnetotail and polar cusps to CIRs using wavelet and cross-wavelet analysis. Their results showed periods of 2–3 h of higher correlation between solar wind and magnetotail plasma parameters (Korth et al., 2006), while for the cusps, the periods found were around 15–25 min (Korth et al., 2011). The effects in the interior of the Earth's cusp and the recurrent substorm activity are due to the Alfvén waves present in the HSS (Korth et al., 2011).
Echer et al. (2017) studied the magnetosphere response, including magnetotail, to CIR and their HSS occurred in September–October 2003 during HSS-driven storms and substorms. It was found in that work that the magnetosphere exhibits a periodic response in the range 1.8–3 h to solar wind HSS fluctuations. These responses were found to be globally consistent in the magnetotail, geosynchronous orbit, auroral region and ground-based magnetometers.
Typical ionospheric disturbances and magnetotail signatures of a magnetospheric substorm are observed during the passage of CIRs and HSS by Earth. Further, the aurora related to CIRs also showed similar signatures of substorms, with localized onset and expansion toward the pole and both longitudinal directions (Despirak et al., 2013, 2014). Nevertheless, while auroras formed by substorms are confined to a small region, usually located in the midnight sector, auroras with large sizes were observed during CIR passages (Despirak et al., 2014).
The higher effectiveness of CIR-driven geomagnetic storms in the magnetosphere-ionosphere system is due to the fact that, although the CIR driven geomagnetic storms tend to be weaker than the storms caused by ICMEs, they usually have a longer recovery phase duration.Then CIR-driven storms show a larger value of integrated energy dissipated in the magnetosphere during its duration (Turner et al., 2009).
The main aim of this work is to investigate the response of the magnetotail to geomagnetic storms caused by CIRs using statistical analysis. We intend to identify the dominant periods of IMF and magnetosphere fluctuations in the solar wind, magnetotail and auroral region for Cluster magnetotail's intervals and also find the periods of higher correlation between them. The characteristic energy distribution during the magnetotail interval of these events, as well as correlation distributions were also investigated. In our study we have also divided the Cluster magnetotail's crossings in intervals of main and recovery phases, with the aim to search for differences and similarities between them.
2.1 Data sources
In this study we have used IMF Bz component, magnetotail Bx component and from the auroral electrojet index (AE). The IMF data were obtained from NASA's OMNI database (http://omniweb.gsfc.nasa.gov/, last access: 14 August 2026) with a time resolution of 1 min. The geomagnetic field Bx component data were obtained from the magnetometer onboard the SC1 spacecraft of the Cluster constellation from the European Space Agency (ESA) website (http://www.cosmos.esa.int/web/csa/access, last access: 14 August 2026) We used 1 min averaged Cluster magnetic field data in this work. The Bx component was used here because it can be an indicator of the geometry and large-scale dynamics of the magnetotail current sheet, providing signatures of processes like thinning, reconnection, and flapping, which can be useful in understanding the magnetotail's response to CIR-driven storms (McPherron et al., 1973, Korth et al., 2006). In order to remove long-term effects observed in the geomagnetic field Bx, a technique of long-term trend extraction using the Haar wavelet function was applied in the data (Bolzan et al., 2020).
The auroral electrojet (AE) index was proposed by Davis and Sugiura in 1966 (Davis and Sugiura, 1966) and is used to measure geomagnetic activity in the auroral zone (Rostoker, 1972). The 1 min AE index data are provided by the World Data Center for Geomagnetism (WDC), Kyoto, Japan (http://wdc.kugi.kyoto-u.ac.jp/, last access: 14 August 2026) For the storm phase classification into main and recovery phases, we have used storm time disturbance indices Dst and SYM-H with temporal resolutions of 1 h and 1 min respectively from WDC Kyoto (Sugiura, 1964; Iyemori 1990; Gonzalez et al., 1999). The storm main phase was marked between the times when sharp depression in SYM-H (Dst) was noted until the minimum value was attained while the recovery phase was defined as the period between time of minimum SYM-H (Dst) and recovery to pre-storm levels. The selection criterion followed the classification proposed by Gonzalez et al. (1994), where a moderate geomagnetic storm is defined by a minimum Dst value in the range .
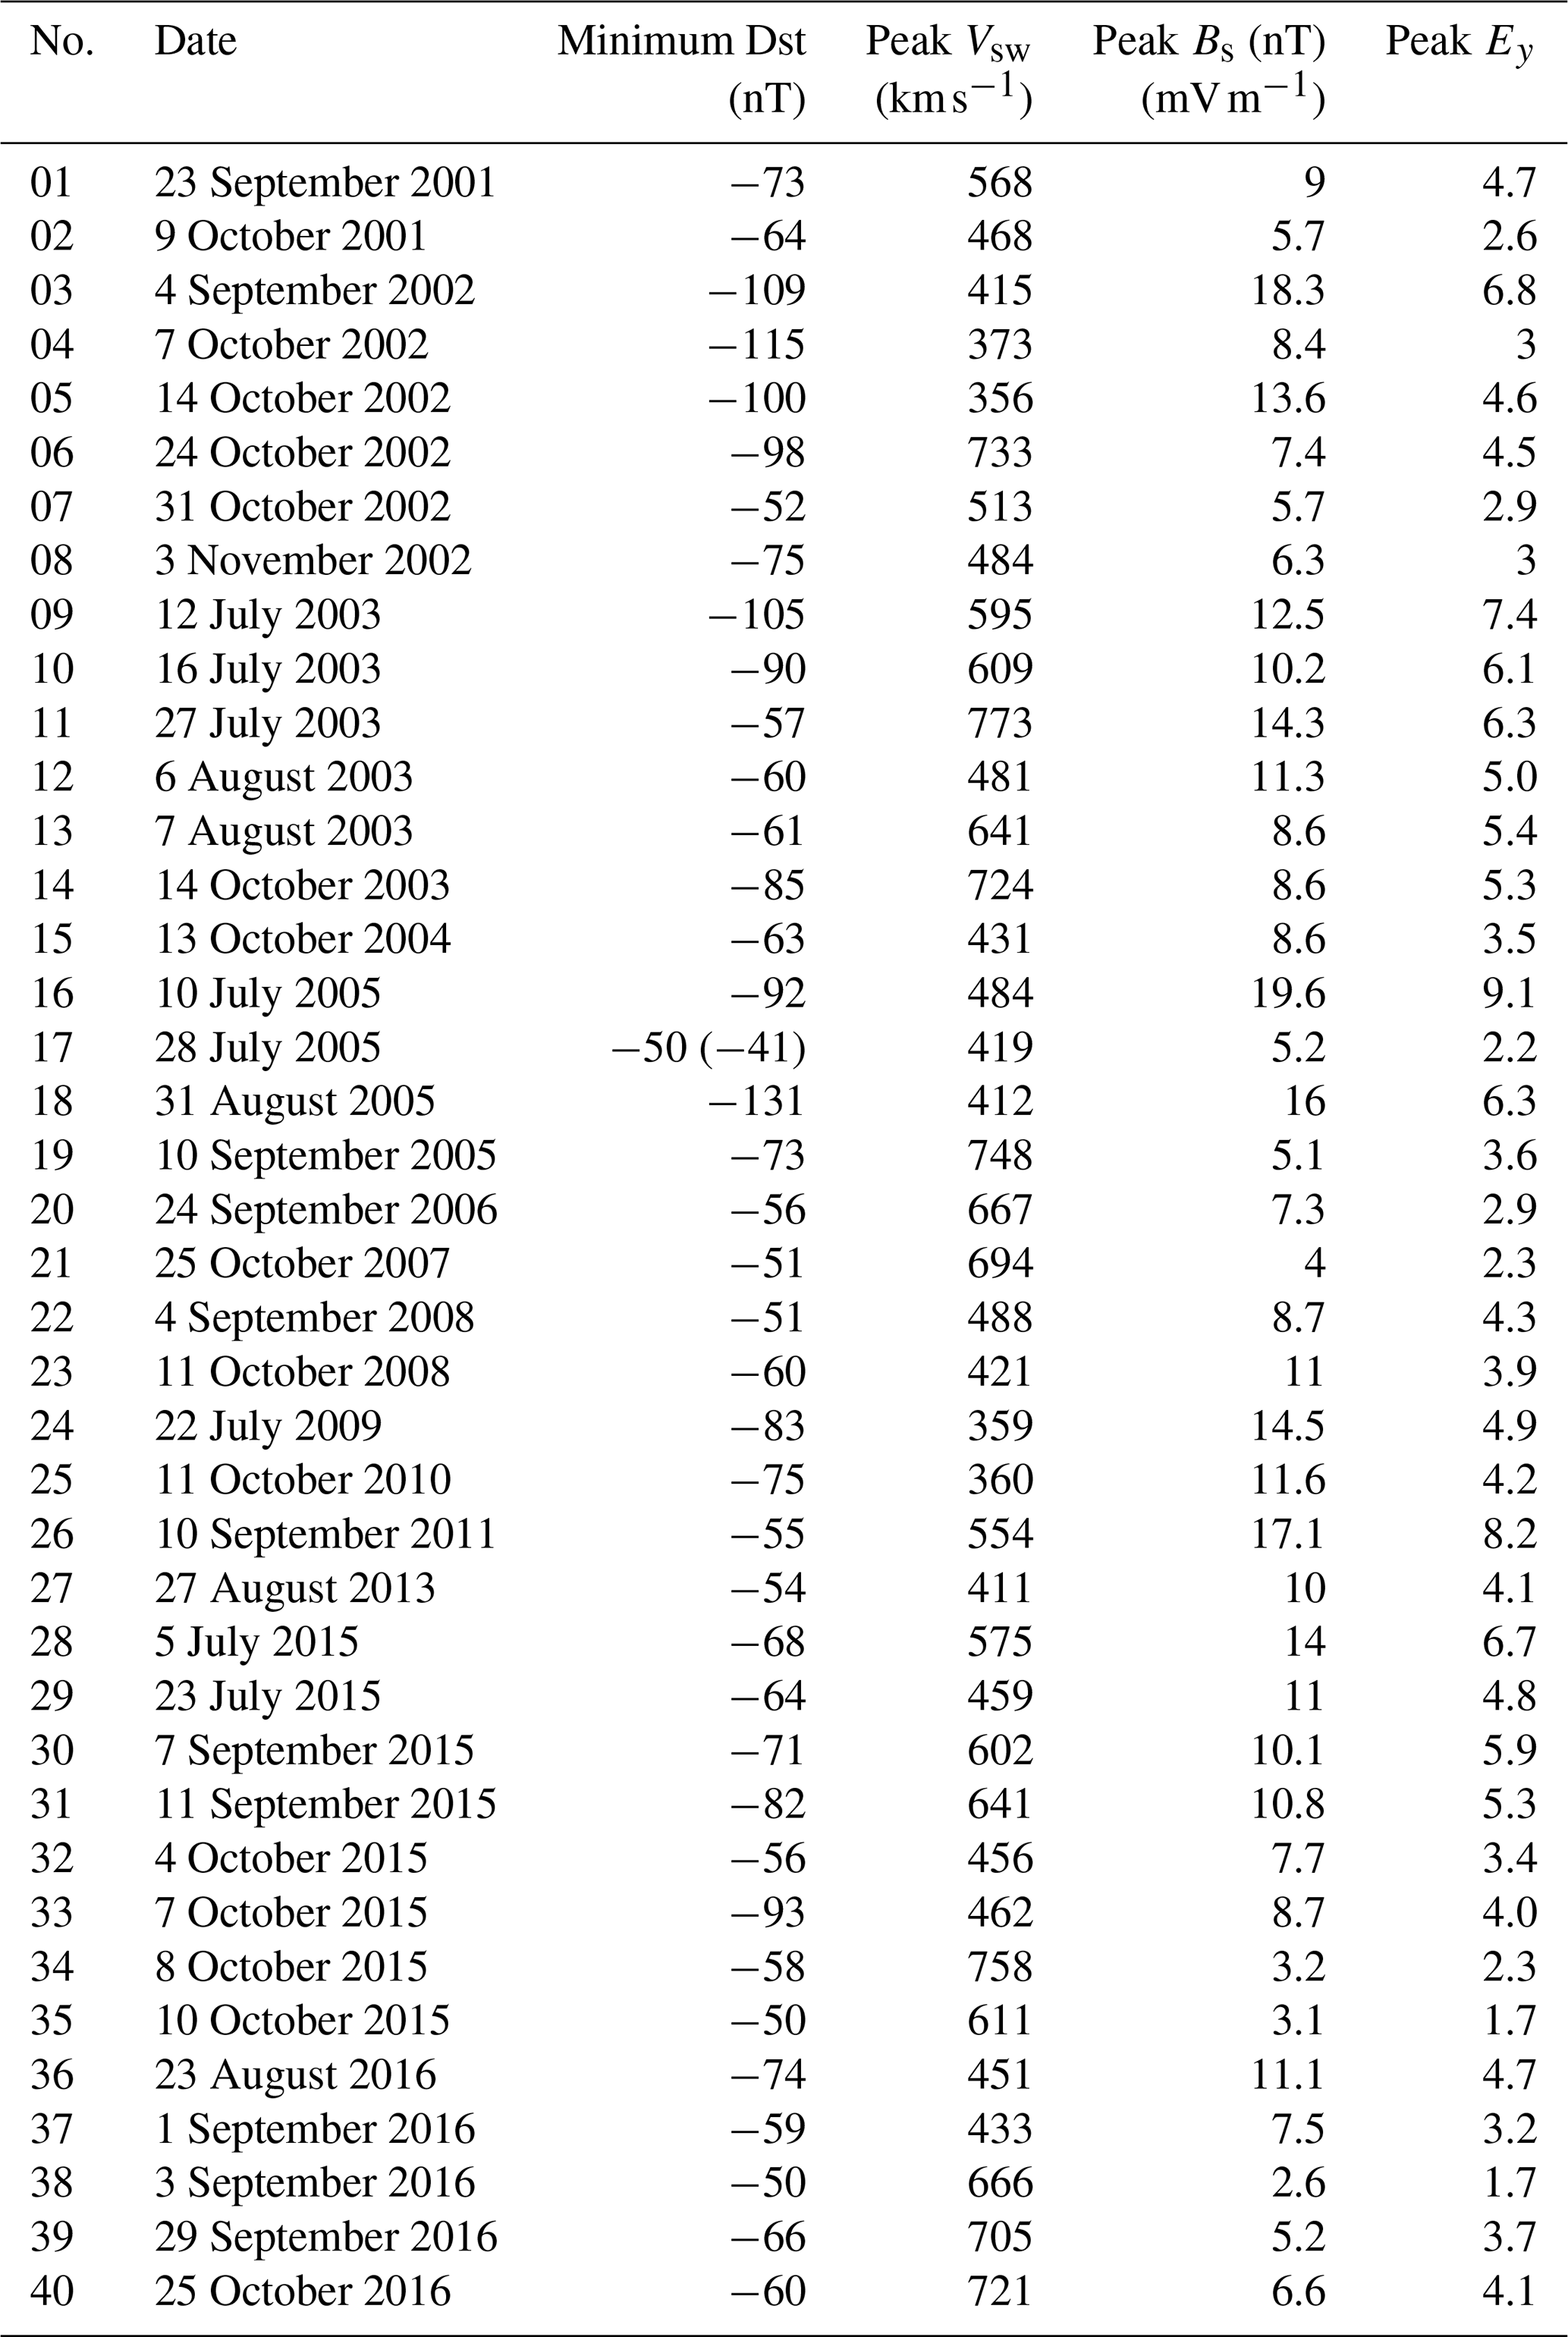
In Table 1 the 40 CIR-driven geomagnetic storms that occurred between 2001 and 2016 are presented. In addition to the date of occurrence, the Dst, Vsw, Bs ( southward IMF Bz) and Ey (y-component of the electric field) values are also shown. From Table 1 it is noted that the event number 17 exhibited double minimum in Dst. The event occurred on 28 July 2005, and the first Dst minimum (−50 nT) could be attributed to the CIR whereas HSS caused the second, smaller depression in Dst (minimum ). Alfvénic fluctuations in IMF Bz associated with HSS are distinctly visible. The density enhancements indicate the compression region of CIRs.
2.2 Methodology of analysis
In this section the methodologies used for developing this work are presented: wavelet and Fourier transforms.
2.2.1 Wavelet and cross-wavelet transform
In order to determine the main periodicities occurring in HSS and in the magnetotail and auroral regions, the wavelet transform (WT) was employed to the IMF, magnetotail and auroral data.
The WT allows us to investigate how the energy is distributed in time and period or frequency ranges in non-stationary time series (Torrence and Compo, 1998). The wavelet functions (known as “daughter wavelets”) are generated from a simple generating function (called wavelet-mother):
for and a≠0, which undergoes expansions/contractions and translations in time. The WT transforms the signal f(t) into a function with two variables (scale and time), represented by WT(a,b) from Eq. (1):
where a is the dilation coefficient, b is the coefficient of translation in time, and ψa,b(t) represents the complex conjugate of the mother-wavelet function.
The Cross-Wavelet Transform (XWT) is constructed from two continuous WT of the variable time series (Grinsted et al., 2004; Bolzan, 2005) and can be obtained by Eq. (2).
In Eq. (2), Wx and Wy represent the WT applied to the time series x(t) and y(t), and (*) represents the complex conjugate of the WT.
The periods with high energy or with higher correlation can be detected using the Global Wavelet Spectrum (GWS), which can be computed by for the main periodicities. For the identification of the periods with higher correlation, the GWS is obtained by
where σx and σy represent the variances of the time series, x(t) and y(t), respectively.
Energy distribution Classification
The wavelet power persistence can be classified into four types: Local, Intermittent, Quasi-Continuous, and Continuous, based on their temporal duration and physical significance. Local distribution indicates power restricted to short intervals, representing transient phenomena like bursty bulk flows. The Intermittent characteristic describes features appearing and disappearing at intervals, reflecting recurrent or stochastic processes. The Quasi-continuous distribution denotes signals present for most of the duration, suggesting a sustained but modulated response to solar wind drivers. Continuous classification refers to power persisting throughout the entire interval, signifying a steady-state, stable coupling between the solar wind and the magnetosphere (Souza et al., 2016).
2.2.2 Fourier Transform
In order to study the turbulence of space plasmas, one powerful technique is to apply Fourier transform to the data and obtain a power law spectrum for different frequency ranges. The Fourier spectrum of a time series is fitted by a power-law function as P(f)=cfα, where P(f) is the Fourier spectral power, c is a constant, f is the frequency, and the α exponent is the power law index (Bolzan and Echer, 2014). While the spectral power gives an indication of the amplitude of turbulence fluctuations in different regions and frequency ranges, the power law index indicates how steep is the spectrum, i.e., how fast it changes with frequency, and how the rate of energy is transferred from large to small scales (Bruno et al., 2005). In this study, the Fourier analysis was used in order to obtain the spectral index from the solar wind, magnetotail and auroral index data.
In this section, the wavelet, cross-wavelet and Fourier power law analysis results are shown for the main and recovery phases of CIR-driven geomagnetic storms during Cluster magnetotail intervals.
As expected, for CIR-driven geomagnetic storms, the majority of the events are moderate storms. From the 40 events (Table 1), 87.5 % corresponds to moderate storm classification () while only 12.5 % (5 events) were intense storms (). Weak and super intense storms were not identified in this dataset.
Figure 1 shows the time series of the IMF Bz (left upper panel), solar wind speed (left second panel), solar wind pressure (left third panel), magnetotail Bx (left fourth panel), AE index (left fifth panel), Dst index (left sixth panel), and SYM-H index (left bottom panel) for the interval when the Cluster remained in the magnetotail during part of the geomagnetic storm caused by a CIR that is identified as event 6 from Table 1. The main phase is indicated by the gray area and corresponds to the interval between 00:00 and 19:09 UT, 24 October 2002. From Fig. 1 one can notice that oscillations in the IMF Bz increase after 08:00 UT, while in the magnetotail Bx data, high amplitude oscillations are observed from 04:00–06:00 UT. These oscillations are related to the southward IMF Bz extended interval seen from about 01:00–06:00 UT. Several quasi-periodic oscillations in the Bx data can be seen from 06:00–18:00 UT. This seems to be related to the high amplitude IMF Bz fluctuations noted after about 10:00 UT. In the AE index we can observe peaks higher than 1000 nT in intervals close to both time ranges, as well as a low (0.31) anti-correlation with the oscillations of IMF Bz with a lag of 22 min. Lower values are observed around 12:00 UT in the IMF Bz, followed by peaks around 13:00 UT, which decreases after 14:00 UT. While the opposite behavior is observed in the AE index, where we have peaks around 12:00 UT, lower values observed around 13:00 UT and other peaks are seen after 14:00 UT. There are several substorm events noted in the AE index. One group seems to be associated with the first interval of negative Bz, while the second group of substorms is related to the fluctuating IMF Bz interval. In the Dst index, the characteristic sharp decrease that occurs during the geomagnetic storm main phase due to the increase of ionized particles being “trapped” in the magnetic field lines can be observed. The minimum Dst (−98 nT) is reached at the end of the time series (19:09 UT on 24 October 2002). The typical signature of the main phase of the geomagnetic storm can be also seen in the SYM-H index time series (bottom-left panel). The right panel of Fig. 1 shows the Cluster orbit, where the interval that covers the gray region from the time series is marked in pink.
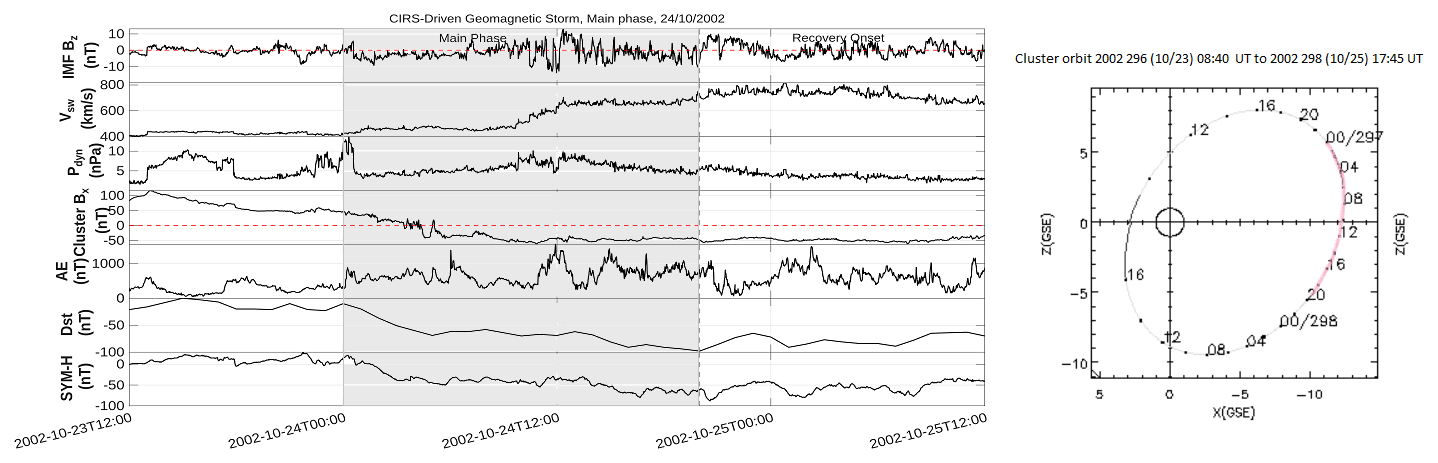
Figure 1(left) Temporal variations of IMF Bz, solar wind speed (Vsw), solar wind pressure (Pdyn), magnetotail Bx, AE index, Dst, and SYM-H indices during the main phase of a geomagnetic storm caused by a CIR on 24 October 2002. The interval when Cluster remained in the magnetotail (00:00 and 19:09 UT on 24 October 2002) is shaded in gray (left panel). Right panel shows the Cluster orbit for the same interval marked in pink.
Figure 2 illustrates another example of a Cluster magnetotail during a CIR-driven geomagnetic storm (Event 18, Table 1), focusing on the recovery phase interval (shaded gray area). Following the format of Fig. 1, the panels on the left present the time series for IMF Bz (top), solar wind speed (Vsw), and dynamic pressure (Pdyn), followed by the magnetotail Bx, the AE index, and the Dst and SYM-H indices (bottom). In the last two panels, the recovery phase of the Dst and SYM-H indices is clearly observed. The right panel displays the Cluster orbit, with the analyzed interval highlighted in pink.
From the top-left panel, as well as in the Bx and AE index plots (fourth and fifth panels, respectively), a prominent positive peak is observed across all three parameters, followed by a subsequent decrease. The IMF Bz exhibits oscillating patterns with several intervals of southward (negative) orientation. Furthermore, both the magnetotail and auroral regions show multiple substorm-like events, characterized by the typical signature of an AE index increase accompanied by a decrease in the magnetotail Bx magnitude (Gonzalez et al., 1994).
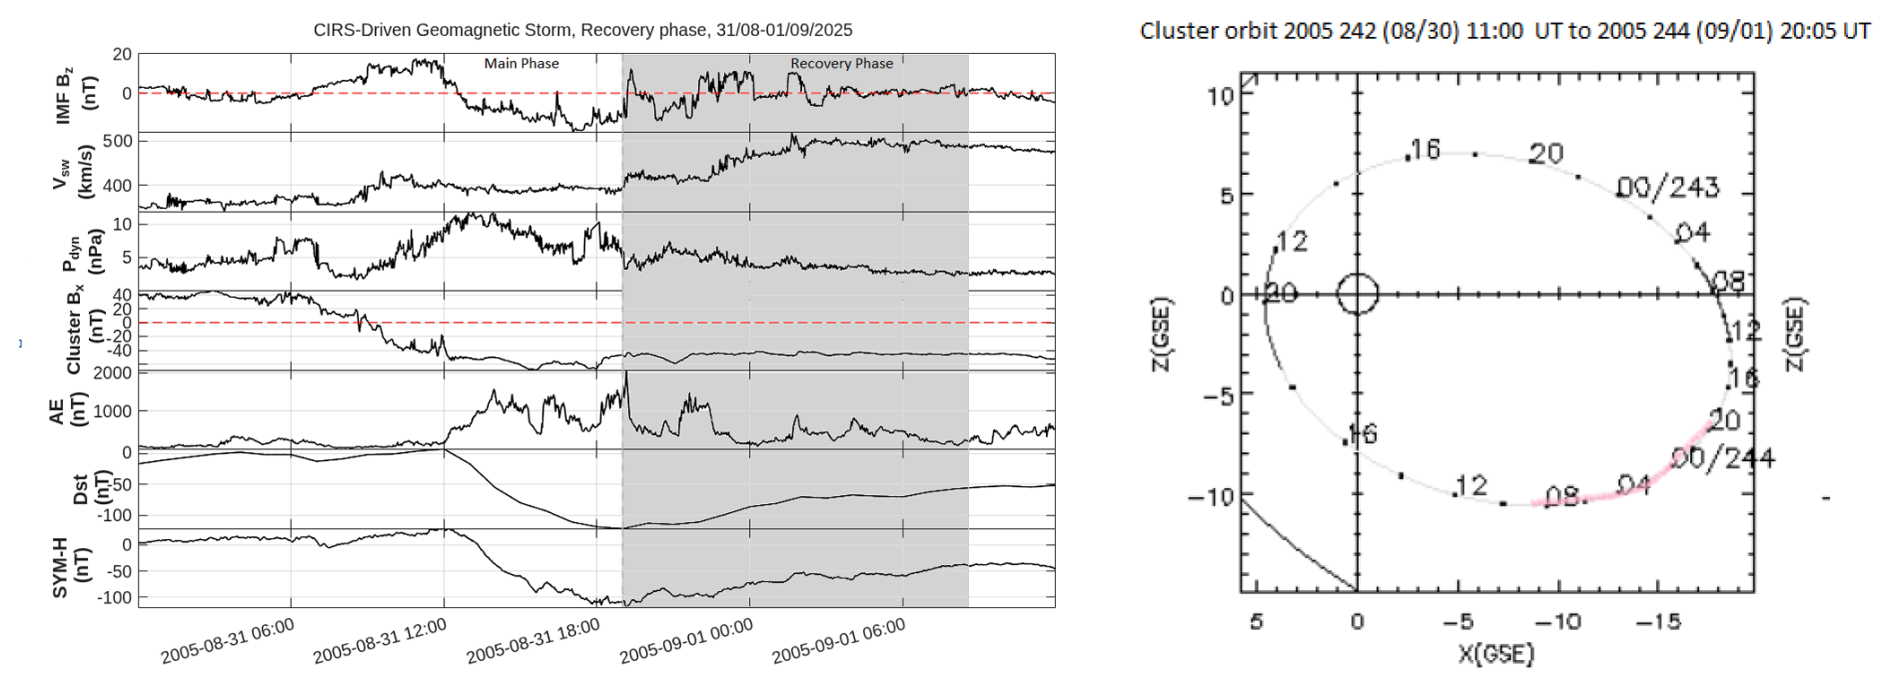
Figure 2Time series of IMF Bz (left upper panel), solar wind speed (Vsw), solar wind pressure (Pdyn), magnetotail Bx, AE index, Dst, and SYM-H indices during the geomagnetic storm caused by a CIR between that occurred between 31 August and 1 September 2005. The interval when Cluster remained in the magnetotail, from 19:00 UT, 31 August to 08:40 UT, 1 September 2005 is shaded in gray (left panel). The right panel shows the Cluster orbit. The time series interval is marked in pink.
3.1 Wavelet and Cross-Wavelet Analyses
The Wavelet transform was applied to the IMF Bz component, to the magnetotail Bx component and to the AE index for intervals when the Cluster spacecraft was in the magnetotail during CIR-driven geomagnetic storms. The analysis is subdivided for intervals of main and recovery phases. The cross-wavelet between these variables was also computed for both geomagnetic storm phase intervals in order to investigate at which periods the correlation between them is higher.
3.2 Wavelet Analysis
3.2.1 Main Phase
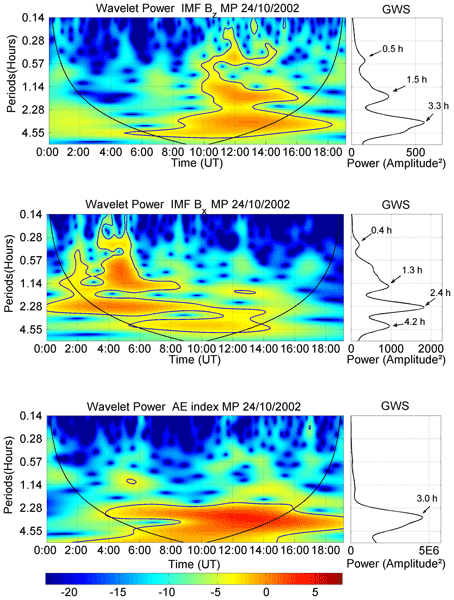
Figure 3 shows the wavelet spectrogram (map) applied to the IMF Bz component (top panel) and magnetotail Bx component (middle panel) and AE index (bottom panel) during a moderate geomagnetic storm main phase interval between 00:00 UT and 19:09 UT, 24 October 2002 (Event 06 from Table 1). In the upper panel, the left figure shows the wavelet spectrum of the IMF Bz and the right figure presents the global wavelet spectrum (GWS). In the GWS, three periods with higher energy can be identified. The first, around 0.5 h, can be characterized as having local distribution, since higher energy (integrated wavelet power) is observed in the wavelet spectrum only in a small interval between ∼ 10:00 and ∼ 15:00 UT. The second period is of 1.5 h and also presents local distribution, located in a similar region of the first period (from ∼ 10:00 to ∼ 16:00 UT). The last observed period is around 3.3 h, and in the wavelet spectrum it can be observed continuously for a long time interval, from around ∼ 05:00 UT to more than 16:00 UT, characterizing a quasi-continuous behavior. The quasi-continuous nature of the 3.3 h period can indicate large-scale fluctuations in the solar wind's driving force. This is related to the characteristics of the high-speed stream (HSS) following the CIR, which can contain continuous fluctuations that drive the magnetosphere over a long duration (Borovsky and Denton, 2006).
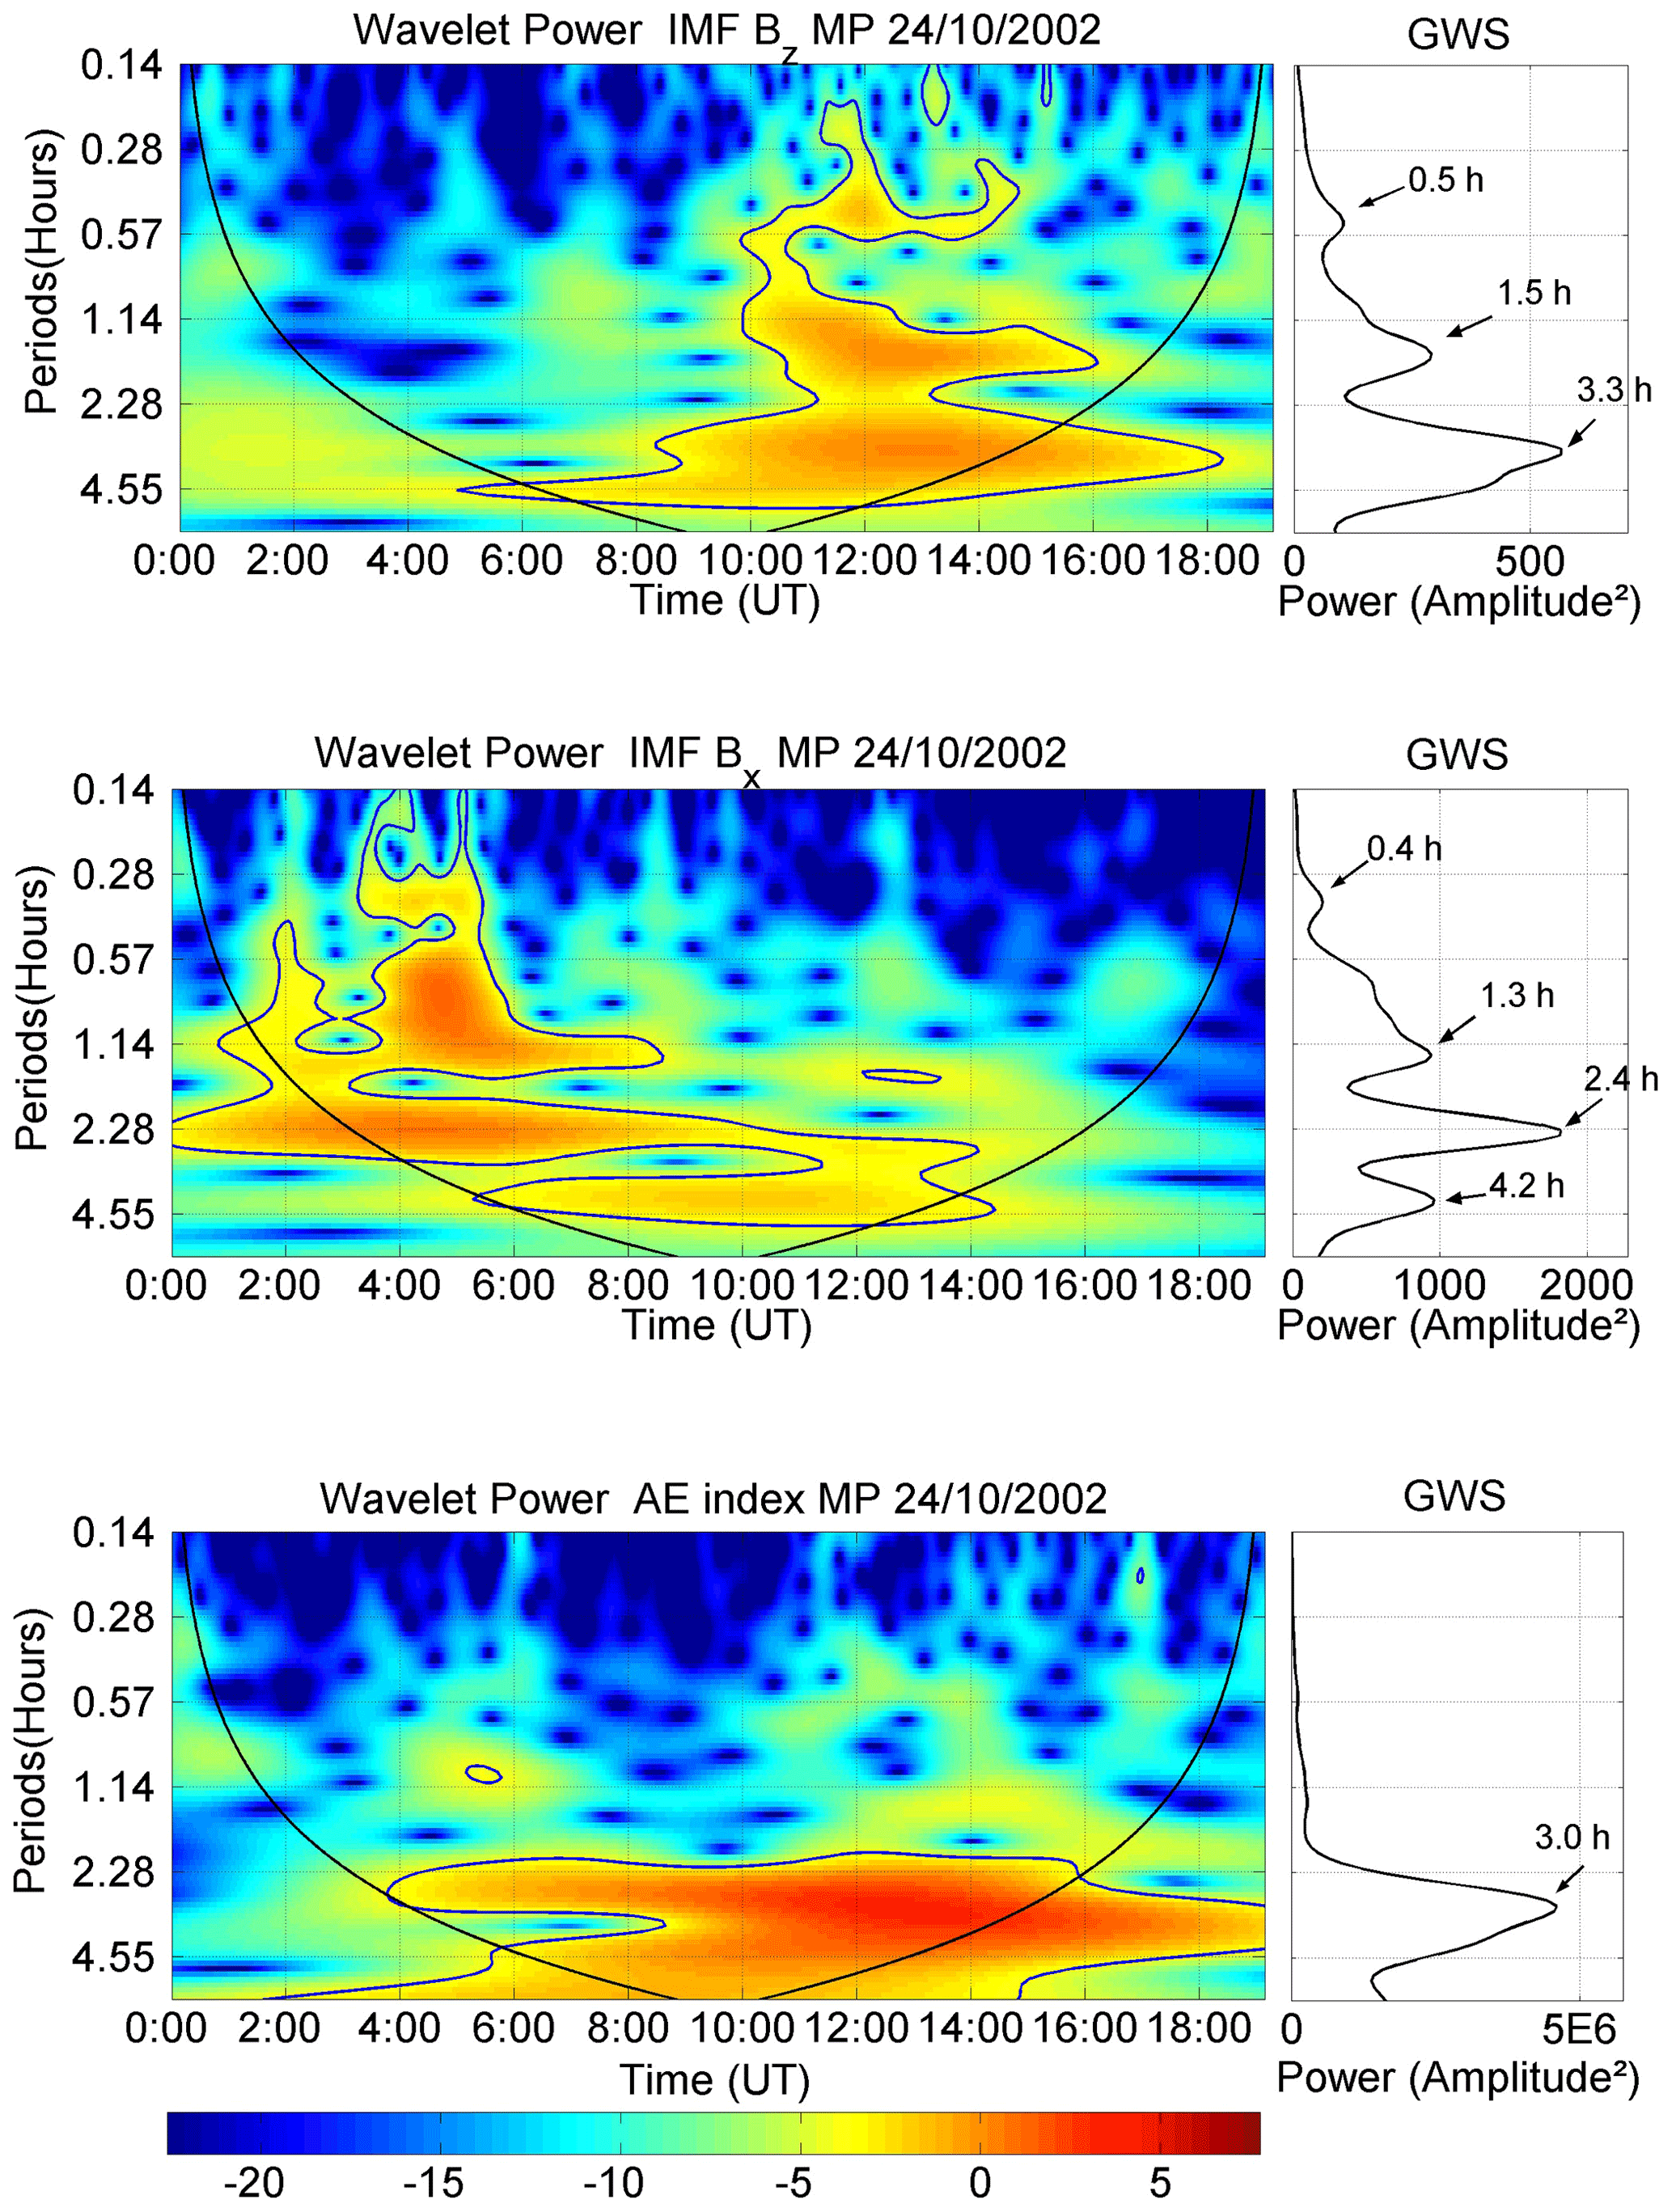
Figure 3Wavelet transform analysis for the interval when Cluster remained in the magnetotail during the main phase of a geomagnetic storm caused by a CIR between 00:00 and 19:09 UT, 24 October 2002 for the IMF Bz component (top panel) and magnetotail Bx geomagnetic field component (middle panel) and AE index (bottom panel). Left panels show the wavelet power spectrum and right panels display the GWS.
In the middle panel of Fig. 3, the wavelet transform periodogram for the magnetotail Bx is shown. As for the IMF Bz wavelet spectrum, upper panel, the left figure shows the wavelet spectrum and the right panel shows the GWS. Four significant periods were identified in the GWS: ∼ 0.4, ∼ 1.3, 2.4 and 4.2 h. From the wavelet spectrum one can see that local distribution is observed in the two first periods, which are found from about 03:00–05:20 UT and from about 01:00–08:30 UT, respectively. The other two periods show quasi-continuous distribution, where the period of 2.4 h is the most energetic. The strong energy at these periods suggests that the magnetotail's internal dynamics, possibly related to current sheet flapping or other global oscillations, are being excited and maintained by the external solar wind driver (Runov et al., 2005). The wavelet analysis of the AE index (bottom panel) shows a single, significant quasi-continuous period around 3 h. This timescale is consistent with the substorm cycle (Borovsky et al., 1993; Korth et al., 2011).
The coincidence of this dominant period with the quasi-continuous periodicities found in both the solar wind (IMF Bz) and magnetotail (Bx) provides evidence of a direct and efficient coupling mechanism between the external driver and the magnetospheric response. It indicates that fluctuations in the solar wind (IMF Bz) are directly linked to magnetotail dynamics (Bx) and subsequently drive auroral substorm activity (AE).
We also applied the wavelet transform to the solar wind and magnetospheric data during the main phase intervals of the events from Table 1 when the Cluster spacecraft remained at least 10 h in the magnetotail. A total of 6 events were analyzed (events: 6, 7, 9, 14, 26 and 30). The number of events analyzed for each variable varies due to gaps in the available data of IMF Bz and magnetotail Bx components. For the IMF Bz and magnetotail Bx, the WT was applied to data in 5 events: 6, 7, 9, 14 and 30 for IMF Bz and 6, 7, 9, 14 and 26 for magnetotail Bx. The statistical result of this analysis is shown in the Section below along with the results of the recovery phase.
3.2.2 Recovery phase
As mentioned before, the WT was also applied to the CIR-driven geomagnetic storm recovery phases during intervals when Cluster was in the magnetotail. Figure 4 shows one example, where the WT was performed for event 18 of Table 1, which occurred from 19:00 UT on 31 August to 08:40 UT on 1 September 2005 (intense storm).
Similarly as it was shown in Fig. 3, the upper panel shows WT for the IMF Bz component, the middle panel for the magnetotail Bx and the bottom panel shows the WT applied to the AE index. Again, the left panels correspond to the wavelet spectrum and the right panels to the global wavelet spectrum.
The GWS, shown in the top panel in Fig. 4, for IMF Bz, shows that two significant spectral peaks are observed, both with local distributions (left panel). The first period, near 1.0 h, is localized between 19:00 and 23:00 UT. The second one is observed at 2.0 h, with higher energy (integrated wavelet power) concentrated between 23:00 UT on 31 August and ∼04:20 UT on 1 September 2005.
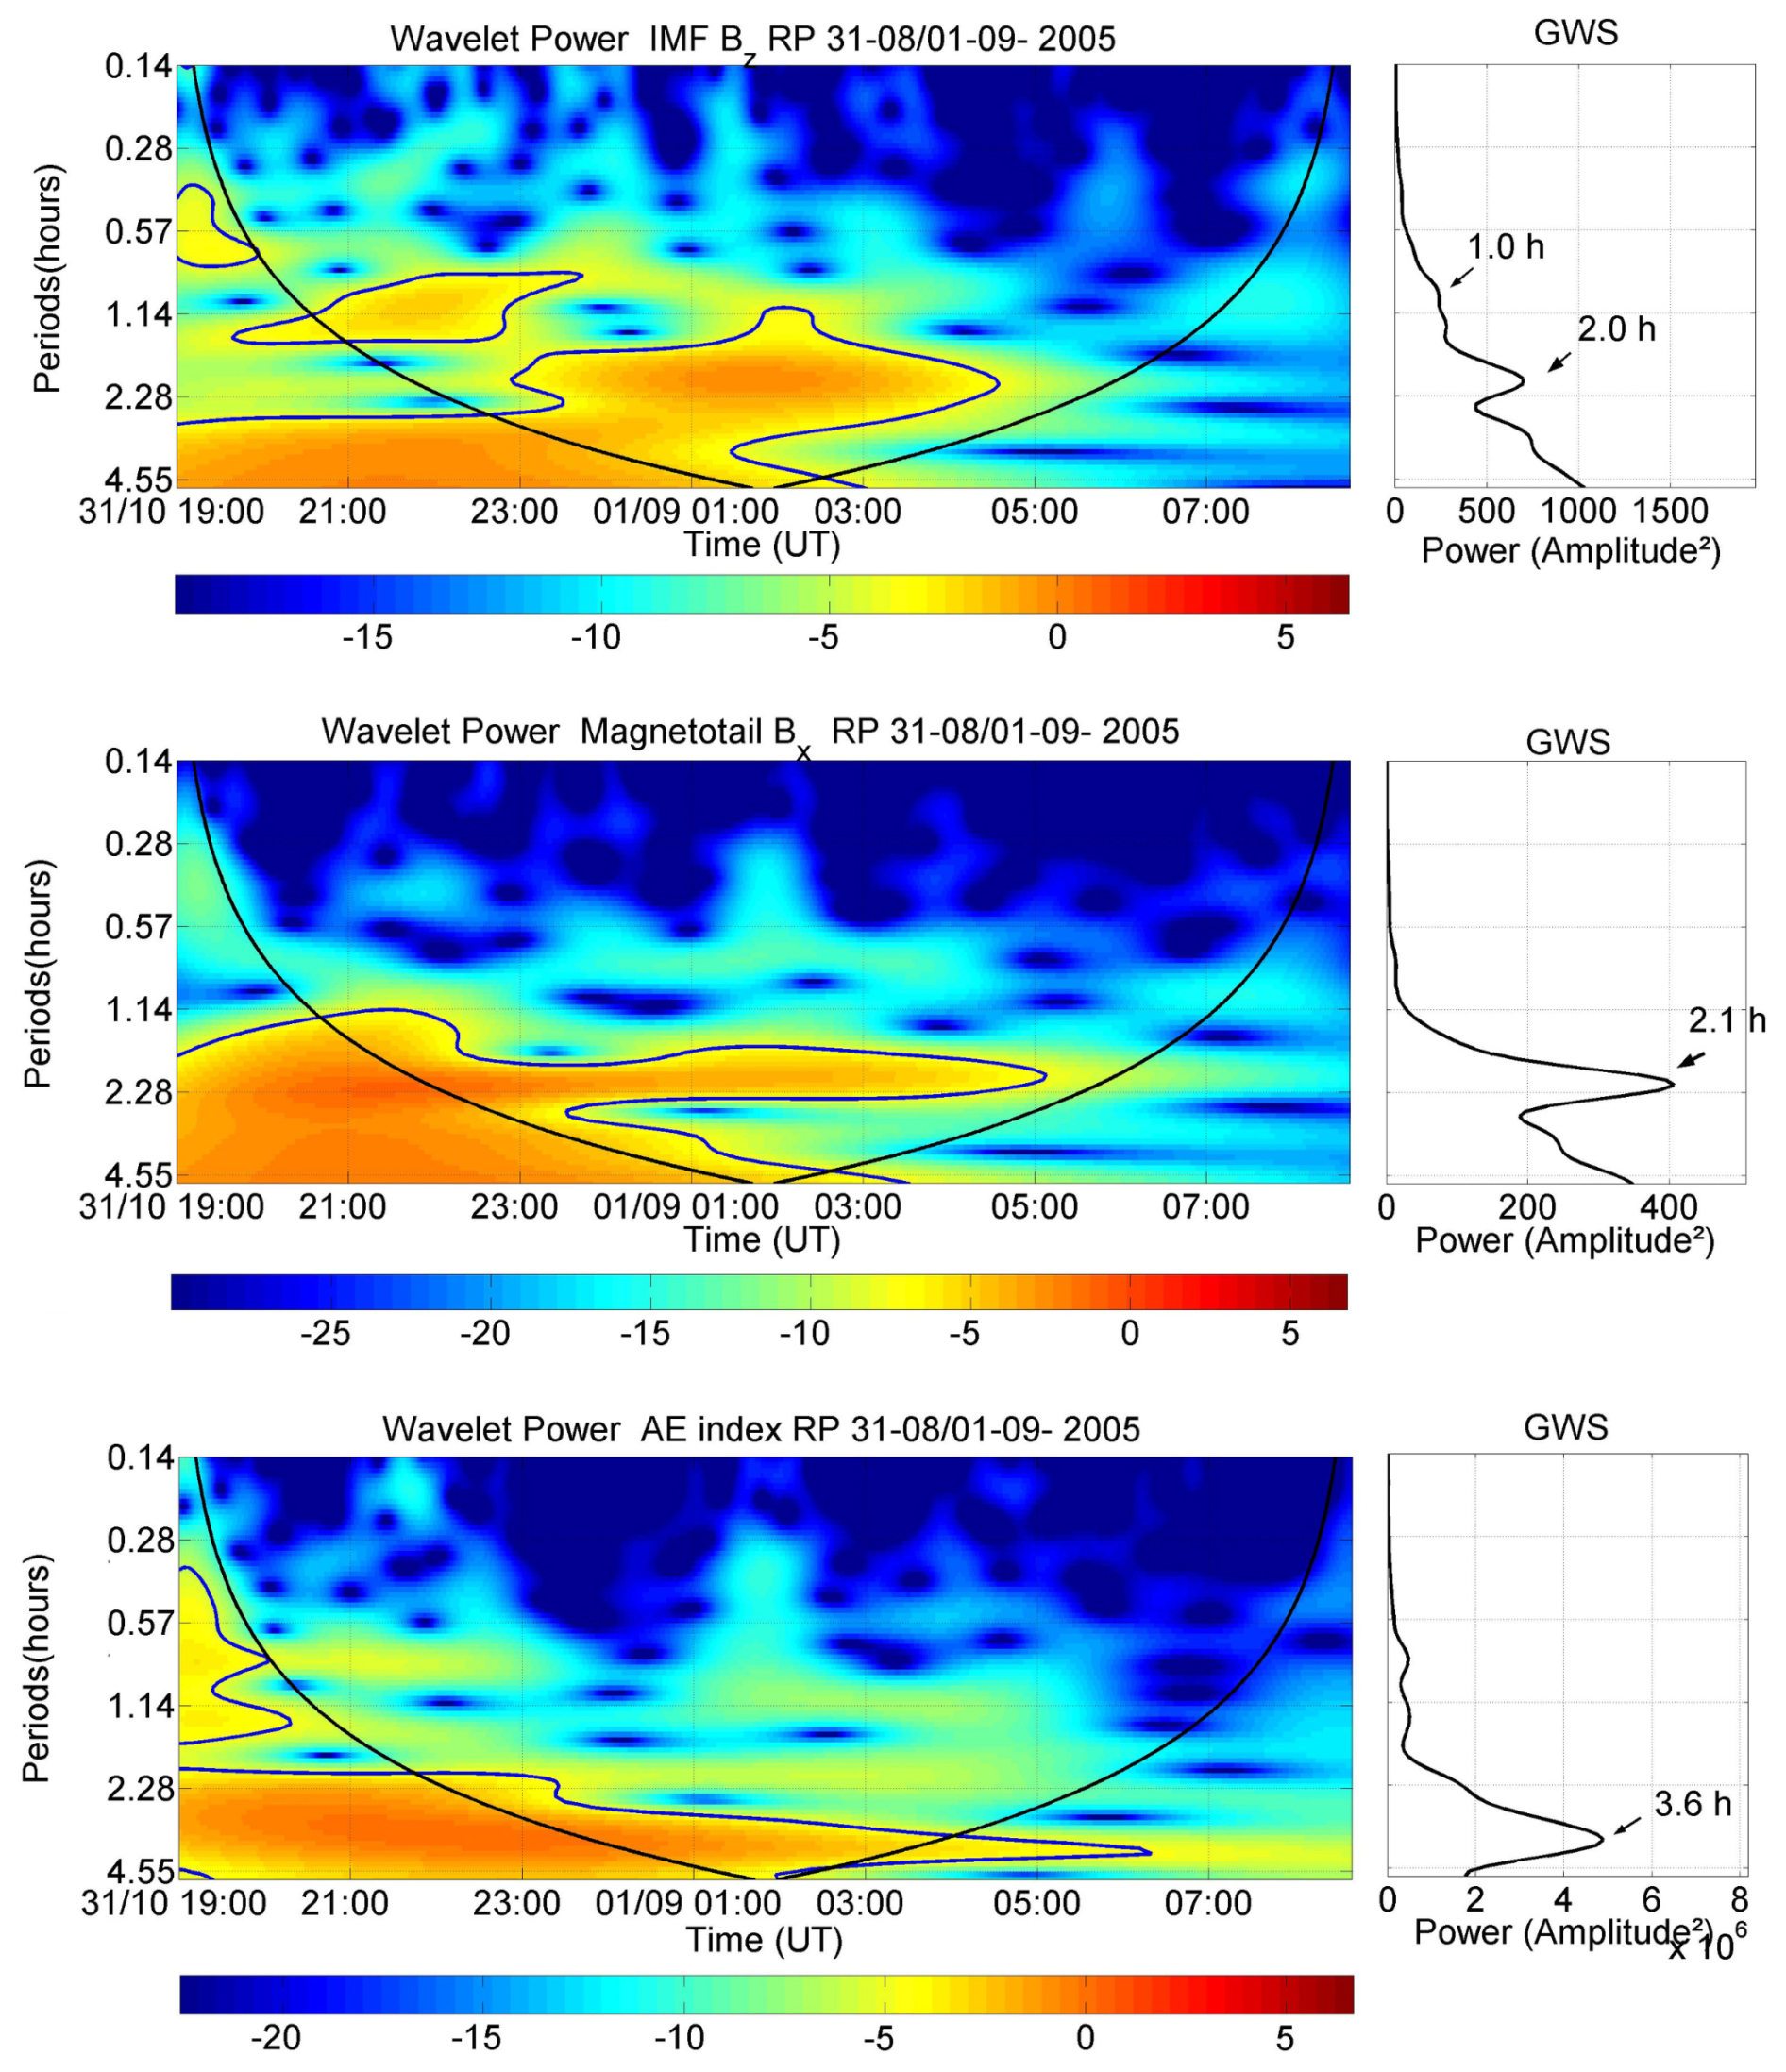
Figure 4Wavelet transform analysis for the interval when Cluster remained in the magnetotail during the recovery phase of a geomagnetic storm caused by a CIR between 19:00 UT on 31 August and 08:40 UT on 1 September 2005 for IMF Bz component (top panel) and magnetotail Bx geomagnetic field component (middle panel) and AE index (bottom panel). Left panels show the wavelet power spectrum and right panels display the GWS.
For the magnetotail Bx, shown in the right middle panel, the GWS also shows only one significant period, very close to the periodicity observed for IMF Bz, 2.1 h. However, for the magnetotail Bx component, the energy distribution has a quasi-continuous variation (left middle panel), and is observed from the beginning of Cluster interval until about 05:00 UT of 1 September. In the AE index, (bottom panels), the wavelet analysis shows a period around 3.6 h in the GWS, which also has a quasi-continuous distribution, from the beginning of the interval to the period at about 06:00 UT on 1 September 2002. Other short periods can be seen in the GWS, but in the wavelet distribution (left bottom panel), the higher energy is observed outside the cone of influence (COI), which delimits the region that is not affected by edge effects. Therefore they were discarded.
While the IMF Bz shows localized, high-energy periods at 1.0 and 2.0 h, the magnetotail Bx and AE index display quasi-continuous dominant periods at 2.1 and 3.6 h, respectively. This continuous nature suggests that even in the recovery phase, the magnetosphere is being driven by sustained solar wind fluctuations, a typical characteristic of HSS (Tsurutani and Gonzalez, 1987; Souza et al., 2018).
We followed the same criteria used to compute WT for both the main and recovery phases. For the Cluster magnetotail's periods this interval should be ≥ 10 h. For the recovery phase, a much higher number of events followed this criterion (29 events). It is worth mentioning that for some cases only one or two variables meet the criterion due to the absence of available data. Figure 5 shows the histograms for period ranges, with bins of 2 h, for the three variables for the main phase (left panels) and recovery phase (right panels). This figure shows that, except for the magnetotail Bx, longer periods begin to be observed in the recovery phases, right top and bottom panels. For the IMF Bz component histograms, main phase (left panels) and recovery phase (right panels), we can see the same dominant ranges of periods for both geomagnetic storm phases. Periods ≤2 h represent 50.0 % of the main periods during the main phase, and 54.2 % of the periods during the recovery phase. The range between 2 and 4 h corresponds to more than 35 % of the periods for the main phase, and 31.3 % for the recovery phase. These two ranges are also predominant for the magnetotail Bx periodicities. During HILDCAA events (Franco et al., 2019), the stronger magnetotail response to the IMF fluctuations are typically found in the substorm periodicity range (2–4 h) (Borovsky et al., 1993; Franco et al., 2019).
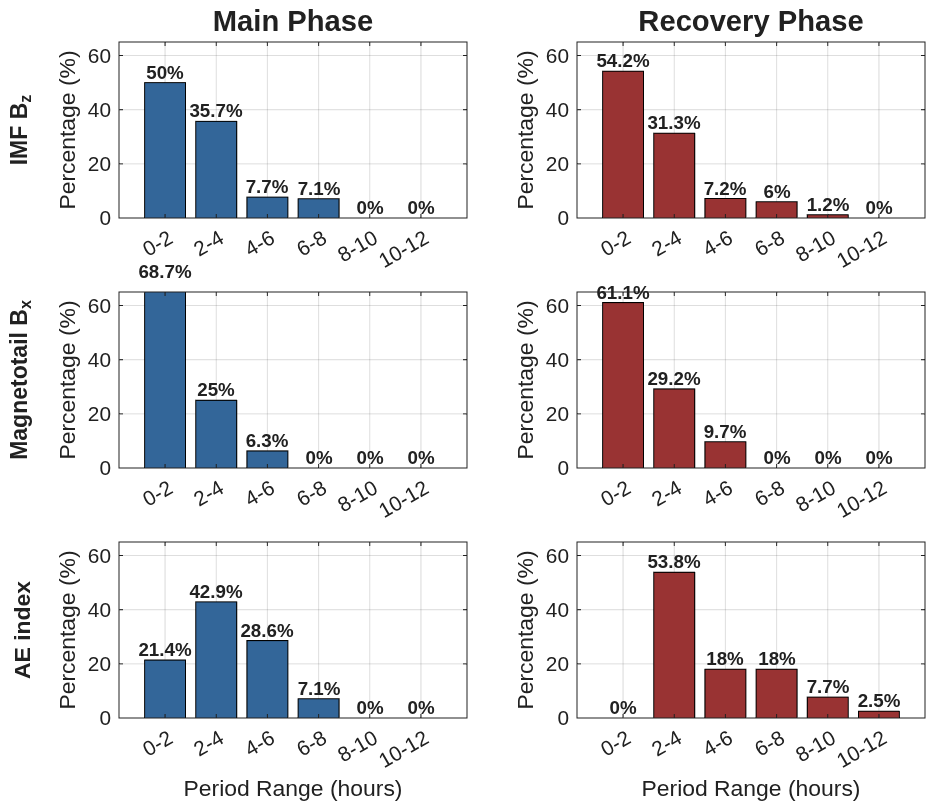
Figure 5Histograms with period ranges for the main phase (left panels) and recovery phase (right panels). From top to bottom the panels show: IMF Bz, magnetotail Bx and the AE index distributions.
For the magnetotail Bx, although the range between 2 and 4 h corresponds to 25 % of the periods for the main phase, and 29.2 % for the recovery phase, periods≤2 h represent 68.7 % of the periods during the main phase and 61.1 % for the recovery phase. From our present results, it seems that during CIR-driven geomagnetic storms the magnetotail has a stronger response to lower periods than during HILDCAA events. This could occur because the prolonged duration and wave-driven nature of HILDCAAs favor longer characteristic periods, while the shorter, more intense driving of the CIR main phase emphasizes the shorter, internal magnetotail response periods. Further, these results show us that more than 80 % of the most energetic periods in the IMF Bz and magnetotail Bx during geomagnetic storms driven by CIRs are found for periods shorter than 4 h, independently of the storm phase. Similar periods (1.8–3.1 h) were found by Echer et al. (2017) in a study of the solar wind – magnetotail coupling during HSS and CIR intervals.
The AE index analysis revealed that periods between 2 and 4 h are the most prominent during both the main (42.9 %) and recovery (53.7 %) phases of geomagnetic storms. However, there are notable differences between these phases. During the main phase, periods between 4 and 6 h are the second range most often observed, followed by periods shorter than 2 h. In contrast, during the recovery phase, no significant periods shorter than 2 h were observed. Instead, the distribution of higher-energy periods seems to extend to longer durations, with the 4–6 and 6–8 h ranges sharing the same percentage of periods. This difference may be attributed to the occurrence of HILDCAA events during the recovery phase (Kamide et al., 1998). These events are often associated with Alfvénic trains in the IMF, and typically have periods between 4 and 12 h (Souza et al., 2016). While the increased number of analyzed recovery phase events could potentially influence the period distribution, we believe this is not the primary cause of the observed distribution. This is supported by the fact that the spread in periods was not observed for the magnetotail Bx component but it was noted only in the IMF Bz component distribution, which oscillations are usually due to Alfvén waves during CIR intervals. Furthermore, the absence of shorter periods during the recovery phase cannot be solely explained by the higher number of analyzed cases.
Figure 6 represents the energy distribution across the main identified periods for each variable and period range during the main and recovery phases. Considering all ranges, the continuous behavior dominates the IMF Bz energy distribution during the main phase with 35.7 % of the cases, which is also observed for individual ranges, except for the range≤2 h, at which local distribution dominates. During the recovery phase, the local and intermittent distributions are the most common observed energy distribution types, while the continuous distributions represent only 3.6 % of the most energetic periods identified. Further, note that during the main phase, the local characteristic dominates the range with the larger occurrence of energetic periods (≤2 h), while during the recovery phase, the intermittent behavior is dominant for this period range. This distinction in energy distribution characteristics is significant, as the main phase of geomagnetic storms is frequently characterized by enhanced substorm activity and the most intense occurrence of magnetotail dipolarizations (Lee and Min, 2002).
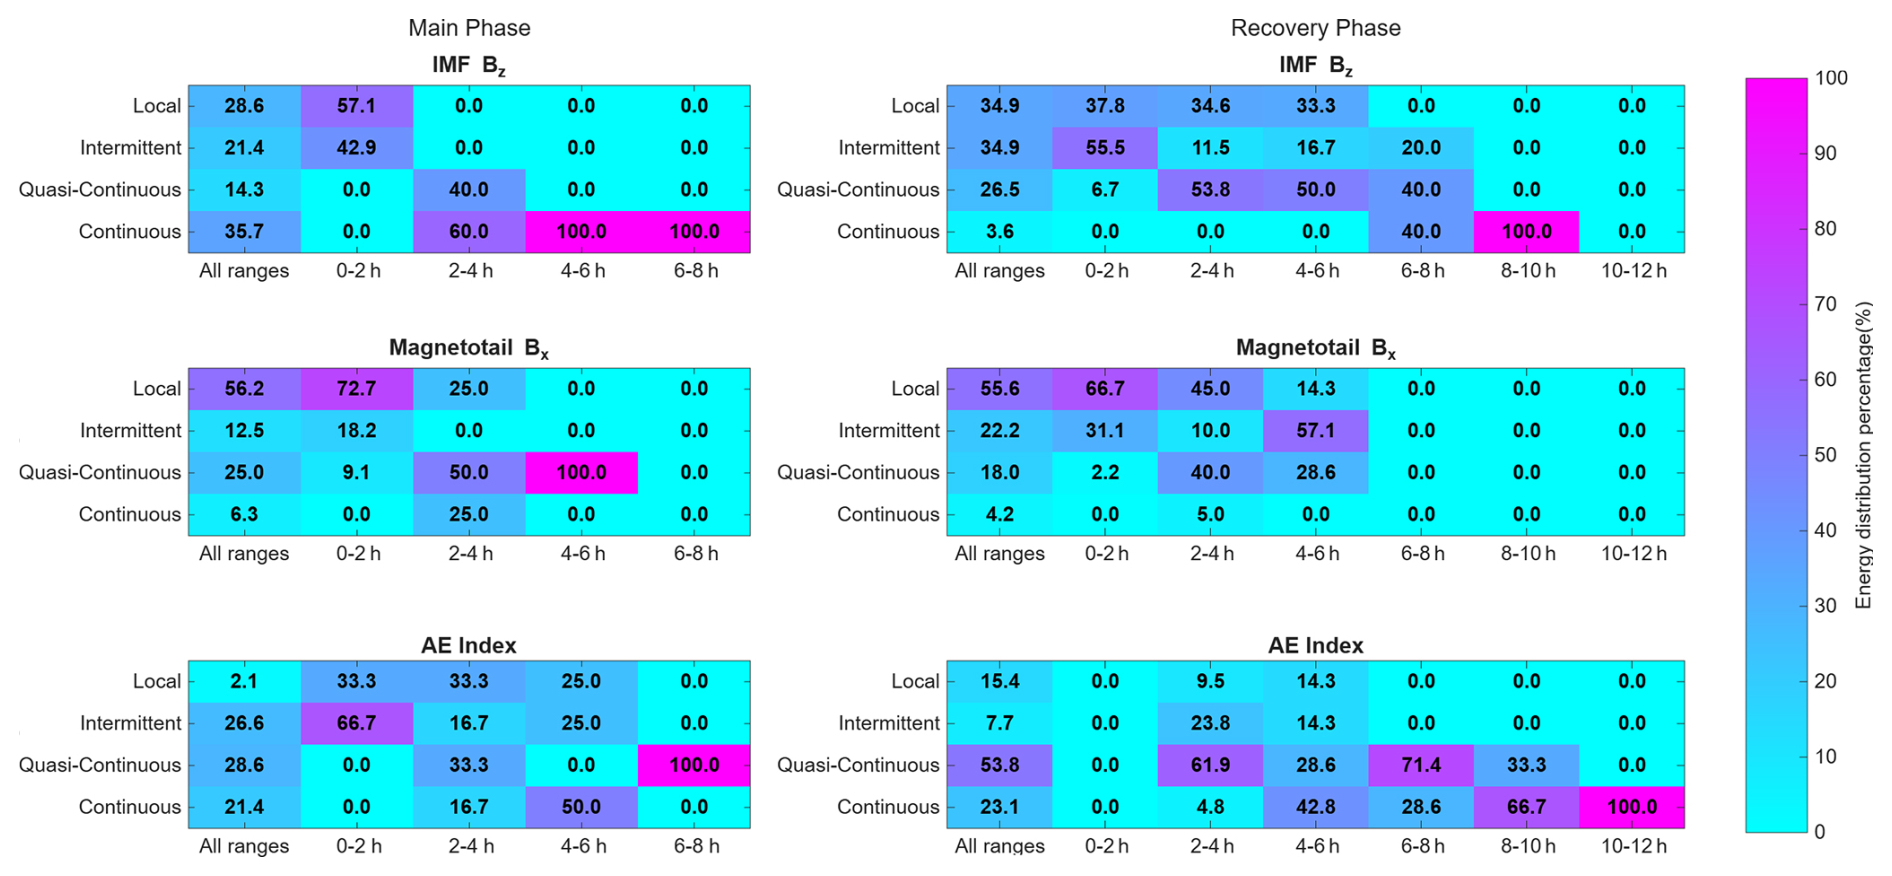
Figure 6Color maps of energy distribution classification percentage. Maps for IMF Bz (upper panels), magnetotail Bx (middle panels), and the AE index (bottom panels) display the percentage distribution across period ranges (x axis) and energy distribution classification (y axis). Results are separated by storm phase: main phase (left column) and recovery phase (right column).
Near Earth, these events can be associated with localized fast plasma jets during intense substorms, which may justify the local distribution observed in the most energetic periods during the main phase (Nakamura et al., 2002, 2017). The quasi-continuous behavior observed in the recovery phase was also seen in the IMF Bz component during HILDCAA events. For shorter periods (≤2 h), an intermittent distribution was observed, which might be related to the events that occur during geomagnetic storm recovery phases (Souza, 2015; Souza et al., 2016).
For the magnetotail Bx component, the local type distribution of the periodicities was the most often observed for both main and recovery phases considering all ranges. The same characteristic is observed for the range with the higher occurrence of the main periods (≤2 h) with 72.7 % for the main phase, which could also be related to localized fast plasma jets in the magnetotail (Nakamura et al., 2017). The same predominant distribution was also observed for the recovery phases (66.7 %). This result differs from those found in a previous magnetotail study during HILDCAAs (Franco et al., 2019), that showed that more than 50 % of the magnetotail Bx periods presented quasi-continuous and intermittent distributions, which is a characteristic of substorms. In the AE index, quasi-continuous and intermittent distributions dominate for all ranges in the main phase. Intermittent behavior was also observed for periods ≤ 2 h. In the recovery phases, the quasi-continuous characteristic is more frequent for all ranges, which is also seen for the main range, between 2 and 4 h. Again, these results differ from that observed from HILDCAAs ( Souza et al., 2016), which presented intermittent energy distribution as the most observed type of periodicity in the wavelet spectrum. As it was perceived during supersubstorms studied by (Hajra et al., 2023), during geomagnetic storms, in short periods, the local and intermittent behavior is dominating while for longer periods, quasi-continuous and continuous distributions are more often observed.
3.3 Cross-Wavelet Analysis
With the aim to identify the periodicities at which there is higher correlation between the solar wind and the magnetotail (IMF Bz× magnetotail Bx), between solar wind and the auroral region (IMF Bz×AE index) and between the magnetotail and the auroral region (magnetotailBx×AE index) during the main and recovery phases of these events, the cross-wavelet transform was employed. This study allows us to identify the main periods at which the energy transfer of the solar wind to the magnetotail, as well as the energy transfer from magnetotail-stored energy to the auroral region, occurs during geomagnetic storms caused by CIRs.
3.3.1 Main Phase
The cross-wavelet results applied for the interval of the magnetotail Cluster crossing during the main phase of the event 6 (24 October 2002) of CIR-driven geomagnetic storm presented in Table 1 are shown in Fig. 7. For this same event the wavelet transform was applied (presented in Fig. 3). The cross wavelet spectrum is presented in the left panels: IMF Bz component and magnetotail Bx (upper panel), IMF Bz component and AE index (middle panel) and magnetotail Bx and AE index (bottom panel). The GWS is shown in the right panel of the respective figure. Then the XWT between IMF Bz and magnetotail Bx (top panel) and between magnetotail Bx and AE index (bottom panel) shows three similar main periods of correlation around: 1.30, 2.60 and 4.20 h. The local distribution dominates these periods, except for the period near 2.60 h of the bottom panel (magnetotail Bx×AE index), where quasi-continuous behavior is observed. In the middle panel (IMF Bz×AE index) only one significant period is seen, which shows local distribution and a period of 3.21 h. Note that in the cross-wavelet spectrum, the region with higher correlation occurs between 08:00 and 15:00 UT for the top and bottom panels, which is also observed in the middle panel, but with a shift in time (10:00 and 16:30 UT). These similar dominant periods (1.30, 2.60 and 4.20 h) of correlation between solar wind-magnetosphere-auroral region oscillations can indicate resonant modes of the coupling of the solar-wind–magnetosphere–ionosphere system, and represent the time scales at which the energy transfer is most efficient. This supports the idea of a linked chain of events: solar wind fluctuations drive magnetotail oscillations, which in turn drive substorms and auroral activity at the same time scales.
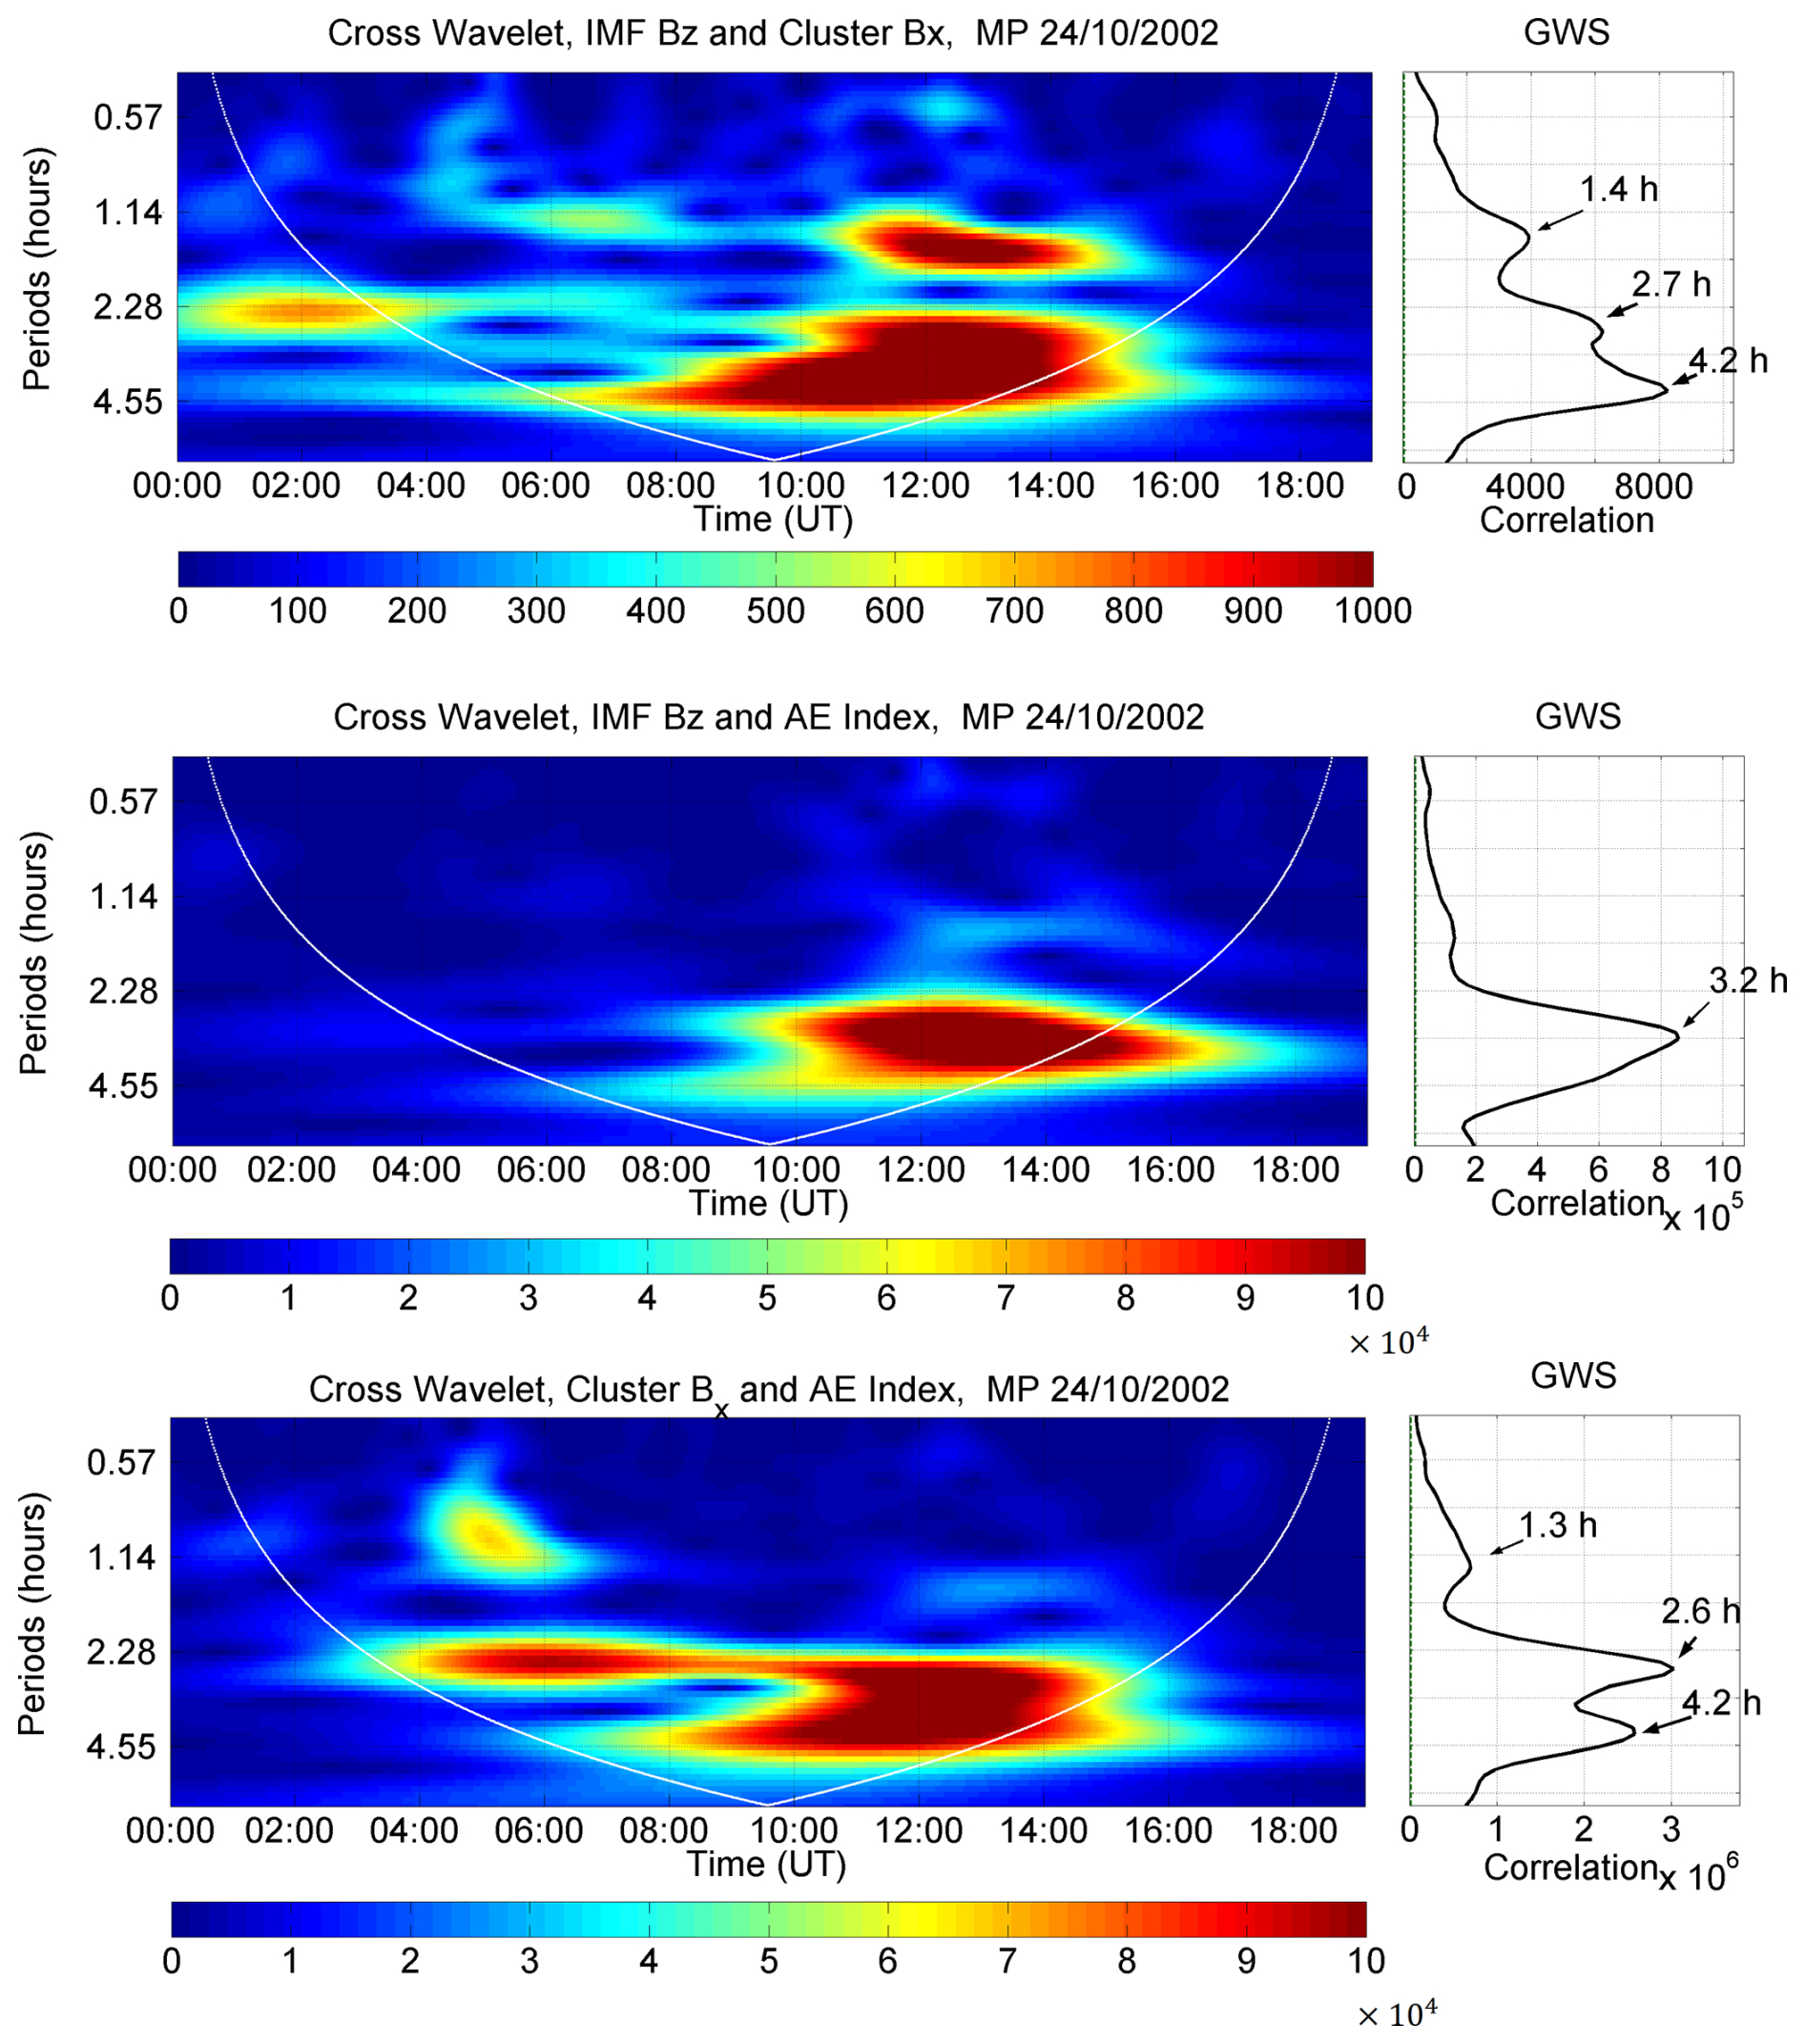
Figure 7Cross-wavelet between IMF Bz component and magnetotail Bx (left upper panel), IMF Bz component and AE index (left middle panel) and between magnetotail Bx and AE index (left bottom panel) for the interval when Cluster remained in the magnetotail during the main phase of a geomagnetic storm caused by a CIR that occurred between 00:00 and 19:09 UT on 24 October 2002. The right panels show the GWS.
Following the WT analysis approach, we initially planned to apply the cross-wavelet transform to the 6 events with data intervals of at least 10 h. However, as not all analyzed variables met the duration criterion within these events, the number of events suitable for cross-wavelet analysis varied depending on the availability of IMF Bz and magnetotail Bx data. The XWT was applied between IMF Bz and magnetotail Bx in only 4 events (6, 7, 9 and 14 from Table 1). For IMF Bz and the AE index, it was applied in 5 events (6, 7, 9, 14 and 30 from Table 1), and for magnetotail Bx and the AE index, it was applied in 5 events (6, 7, 9, 14 and 26 from Table 1). The results of this analysis are presented in the following section, combined with the recovery phase analysis results.
3.3.2 Recovery Phase
Figure 8 shows the cross-wavelet transform applied to the event 18 (31 August–1 September 2005) from Table 1, the same event shown in Fig. 4. The left panels show the cross wavelet spectrum between the IMF Bz component and magnetotail Bx (upper panel), IMF Bz component and AE index (middle panel) and between magnetotail Bx and AE index (bottom panel). The right panel shows the GWS, where we can note that the period near 2.28 h is present in the three cases. These intervals show quasi-continuous behavior for the top and bottom panels, and local correlation distributions for the middle panel (IMF Bz×AE index). Further, periods with higher correlation are observed near 0.80 h and ∼3.5 h in the GWS of the middle (IMF Bz×AE index) and bottom (magnetotailBx×AE index) panels. For both cases, the periodicity around 0.80 h shows local distribution, while the 3.5 h shows a quasi-continuous distribution. In the middle panel, (IMF Bz×AE index), an intermittent higher correlation distribution is found for the period of 1.31 h.
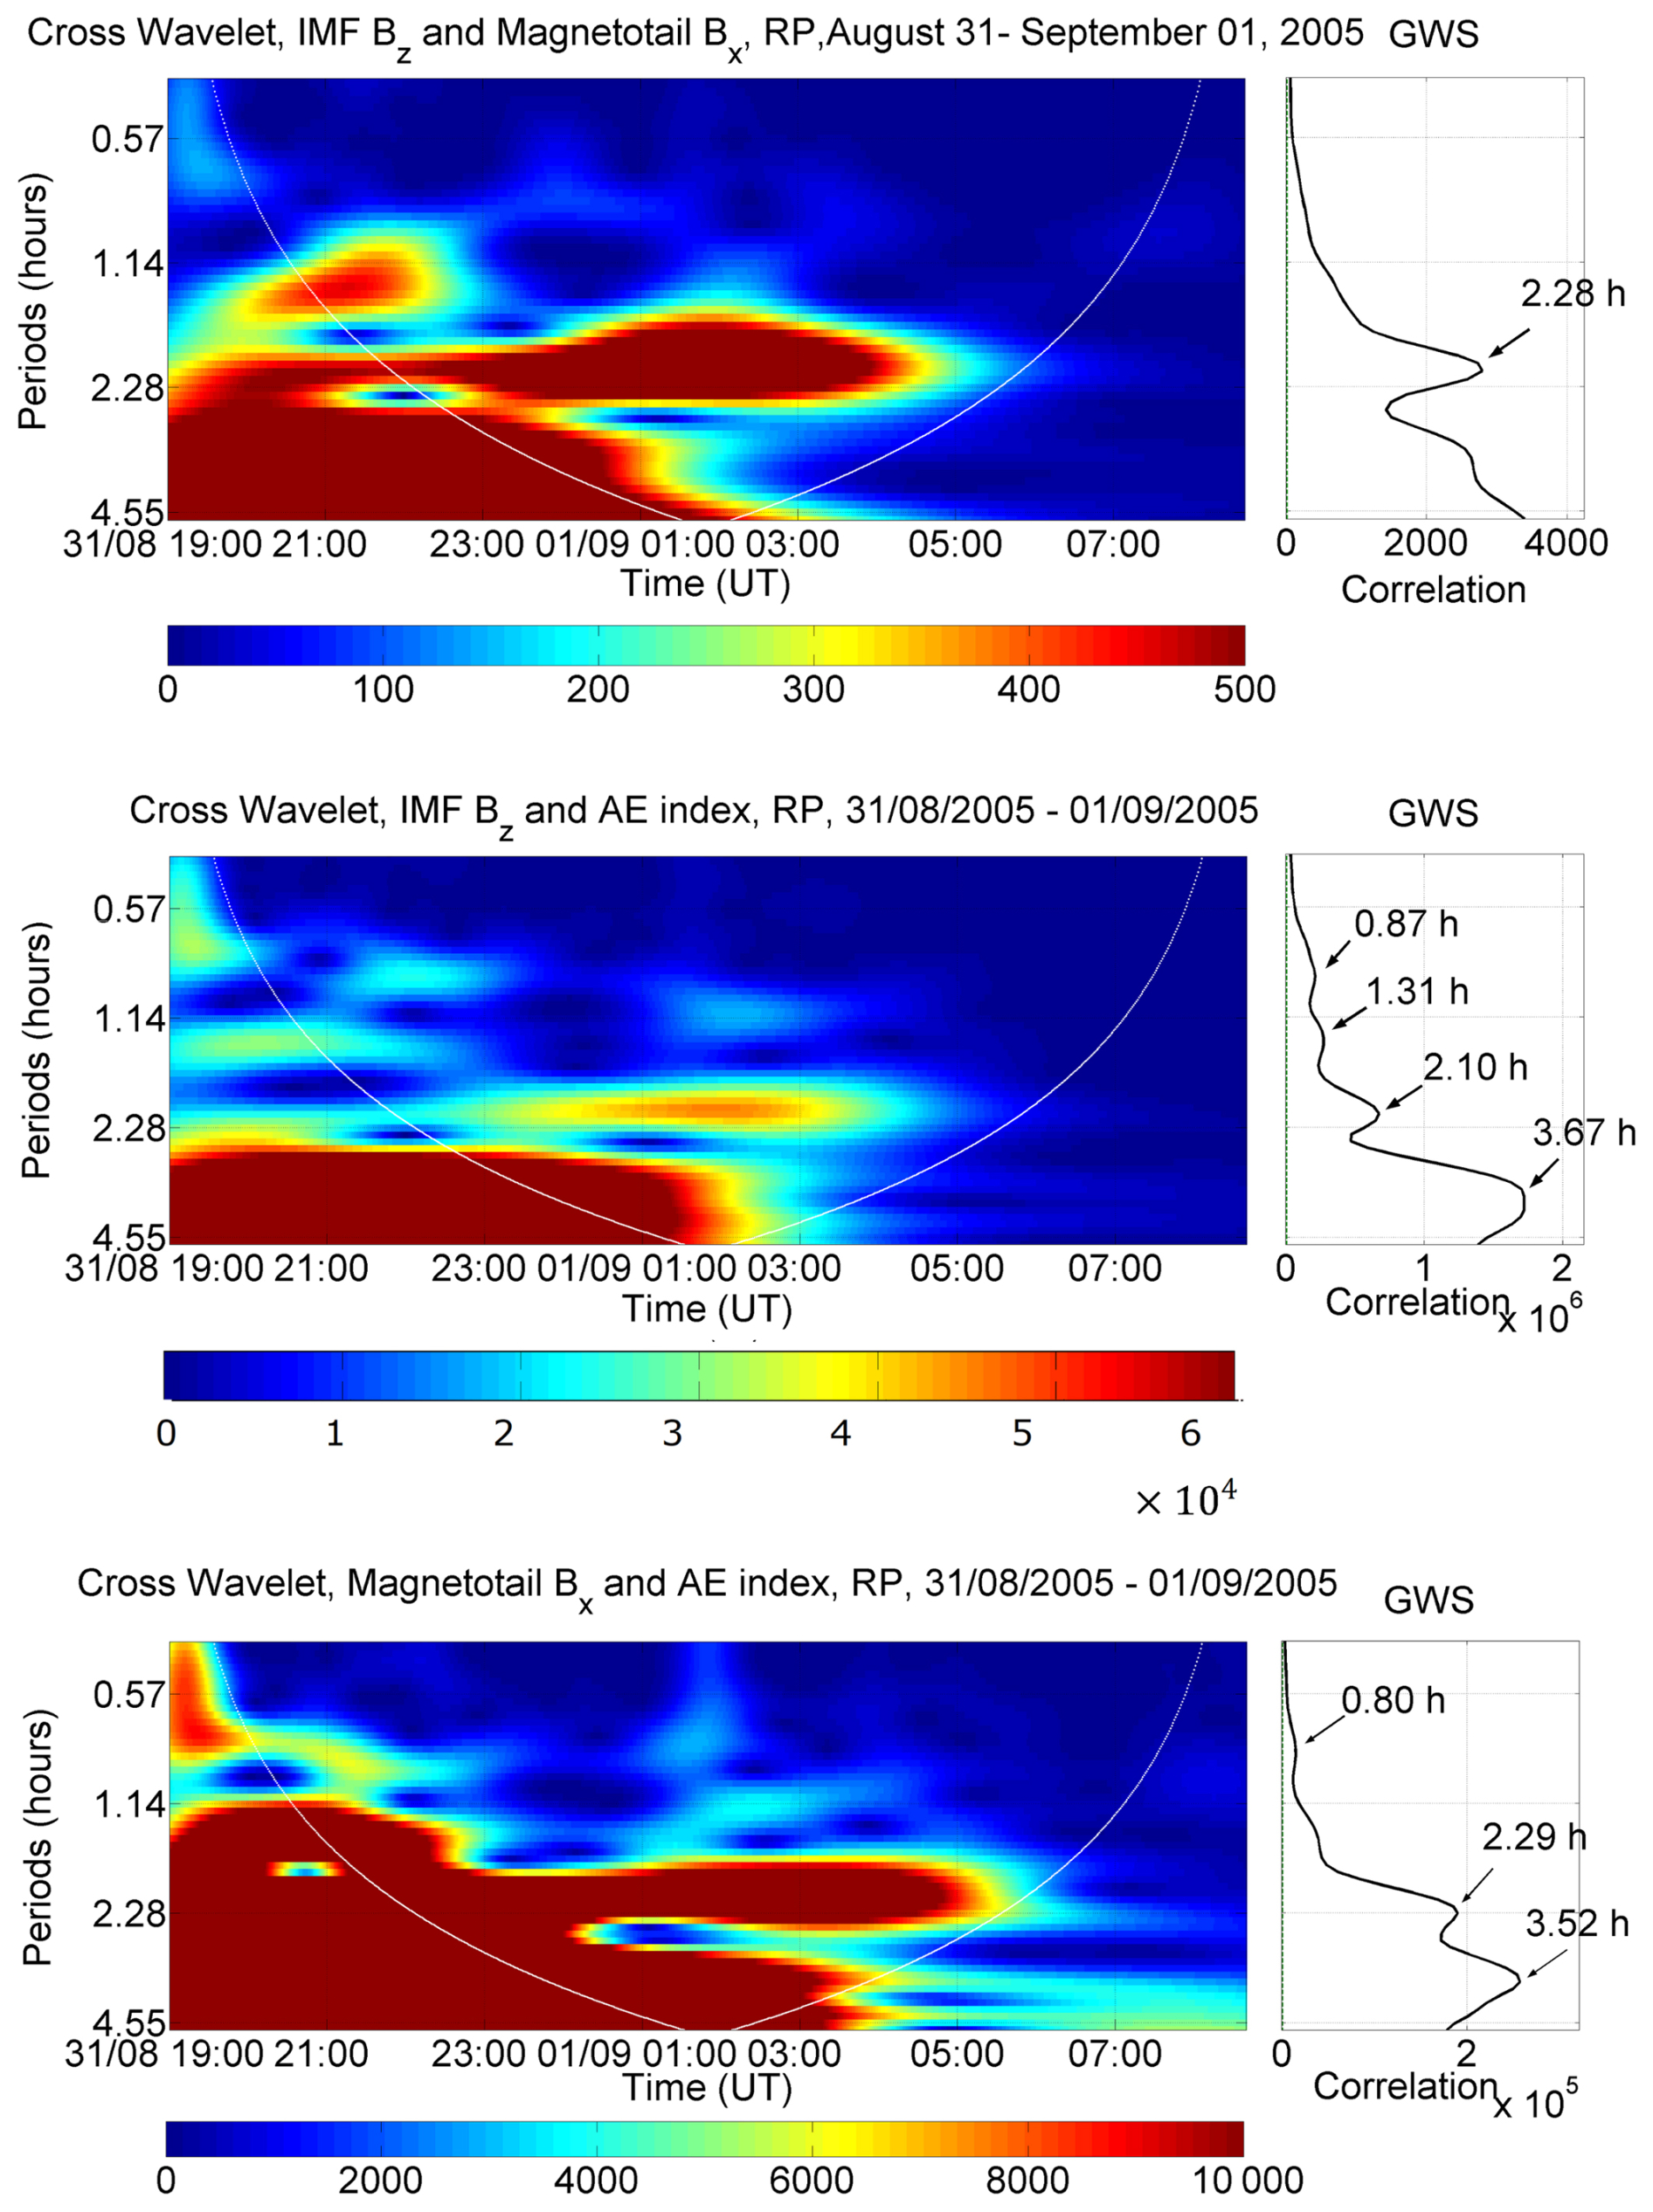
Figure 8Cross-wavelet between IMF Bz component and magnetotail Bx (left upper panel), IMF Bz component and AE index (left middle panel) and between magnetotail Bx and AE index (left bottom panel) for the interval when Cluster remained in the magnetotail during the recovery phase of the geomagnetic storm caused by a CIR between 19:00 UT on 31 August and 08:40 UT on 1 September 2005. The right panels show the GWS.
In Fig. 9, histograms with the range of periods with higher correlation obtained from the XWT are presented for the main and recovery phases. As it was seen in the wavelet analysis, in the main phase the periodicities are restricted for periods shorter than 8 h, while during the recovery phase, except for the magnetotail Bx×AE index analysis, longer periods are observed. Despite that, even for the recovery phases, more than 95 % of the periods are lower than 8 h. Similar periods that were found for the IMF Bz WT analysis were obtained in the correlation between the IMF Bz and magnetotail Bx (upper panel). Most of the higher correlation intervals, ∼54 % for the main phase and ∼44 % (recovery phase), occurred for shorter periods (≤ 2 h). Further, the second range (2–4 h) also represents about 30 % of the periods with higher correlation for main (∼31 %) and recovery (∼33 %) phases. These results are in agreement with those results that were found in the XWT analysis performed by (Franco et al., 2019) for HILDCAAs events.
A significant difference can be observed between the main and the recovery phases in the periods of correlation between the IMF Bz and the AE index. Although the dominant range is the same (2–4 h) in both phases, during the recovery phase, periods≤2 h represent more than 40 % of periods while in the main phase they represent only 21.4 %. Furthermore, considering ranges with longer periods, the main phase has more than 21 % of the periods of correlation between 4 and 8 h, while less than 15 % of the periods of correlation during the recovery phase are found for periods>4 h. This change reflects a transition from external, sustained driving to the magnetosphere's internal process of unloading stored energy through a series of more frequent, cyclic substorms. Further, the dominance of periods≤4 h in the recovery phase coincide with cyclic substorm periods (Korth et al., 2011). The periodicity with higher correlation observed in the range between 10 and 12 h may be related to Alfvén waves present in the IMF Bz during periods of HILDCAAs in the magnetotail (Smith et al., 1995; Souza et al., 2016).
In the analysis of the periods at which the energy stored in the magnetotail is transferred to the auroral region (XWT between magnetotail Bx×AE index), the histogram with the periods of correlation distribution is presented in the lower panels of Fig. 9. In the main phase (left panel), the percentage of periods of correlation per range decreased as the periods increased. About 47 % of the periods with higher correlation are ≤2 h. The range between 2–4 h corresponds to almost 30 % of the periods, followed by 17.65 % (4–6 h) and 5.88 % in the range between 6 and 8 h. In the recovery phase (right panel) the range 0–2 h and the range 2–4 h showed the same percentage of periods (41.93 %). The others ∼16 % intervals are found in the range between 4–6 h, indicating that all the periods with higher correlation are shorter than 6 h. As the periods with higher energy from the previous analysis, the periodicities with higher correlation values occur for substorms.
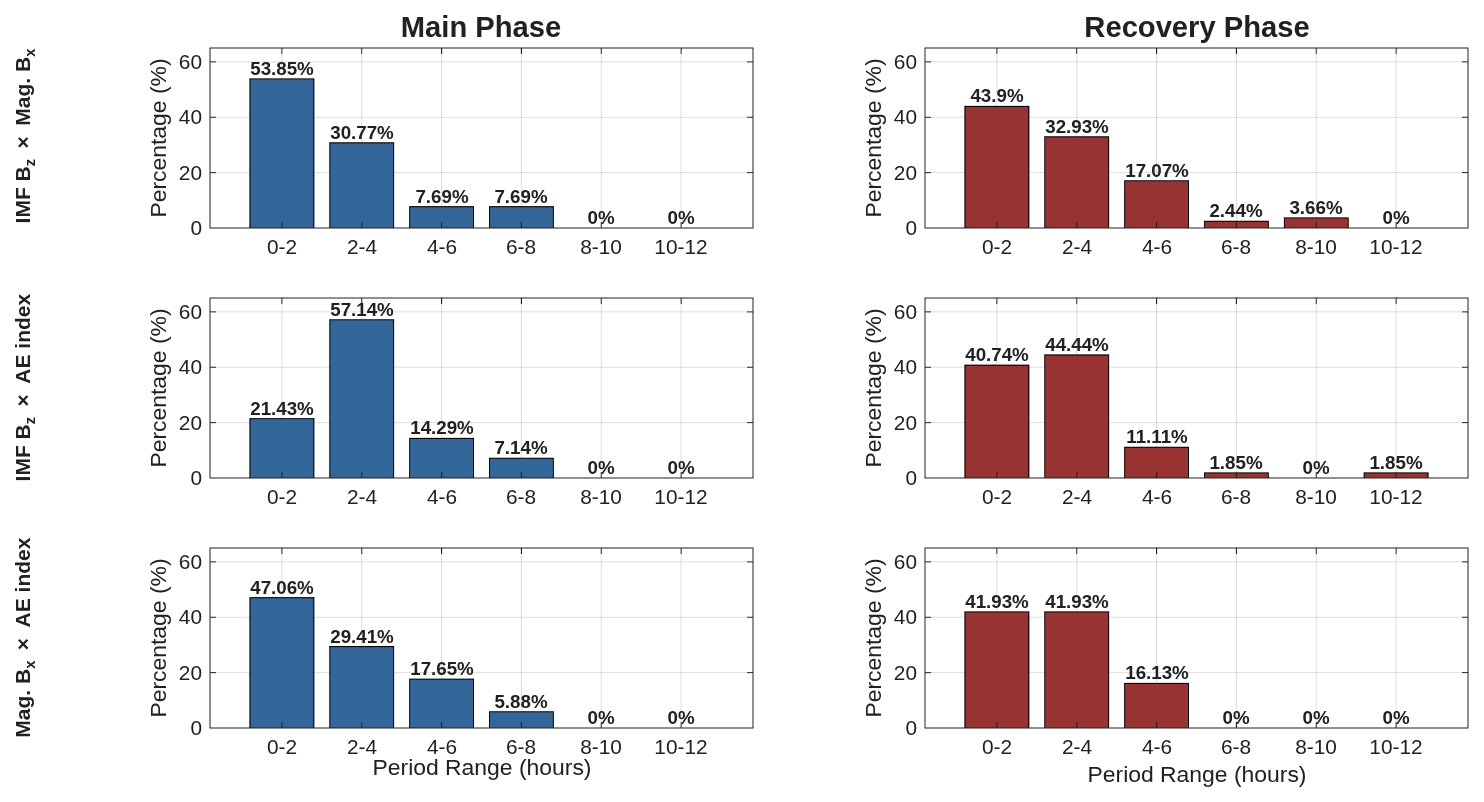
Figure 9Histograms for period ranges with significant correlation (cross wavelet power) for the main phase (left panels) and recovery phase (right panels). From top to bottom the panels show: IMF Bz× magnetotail Bx, IMF Bz× magnetotail Bx and magnetotail Bx×AE index distributions.
Figure 10 shows the results with the classification of the type of correlation distribution. Considering all periods, the local distribution is dominant in three investigated cases: IMF Bz× magnetotail Bx, IMF Bz×AE index and magnetotail Bx×AE index (also intermittent) during the main phase. For the recovery phase, only the analysis between IMF Bz and magnetotail Bx data did not show the predominance of local distribution, with the intermittent behavior as the most commonly observed, probably related to substorm events.
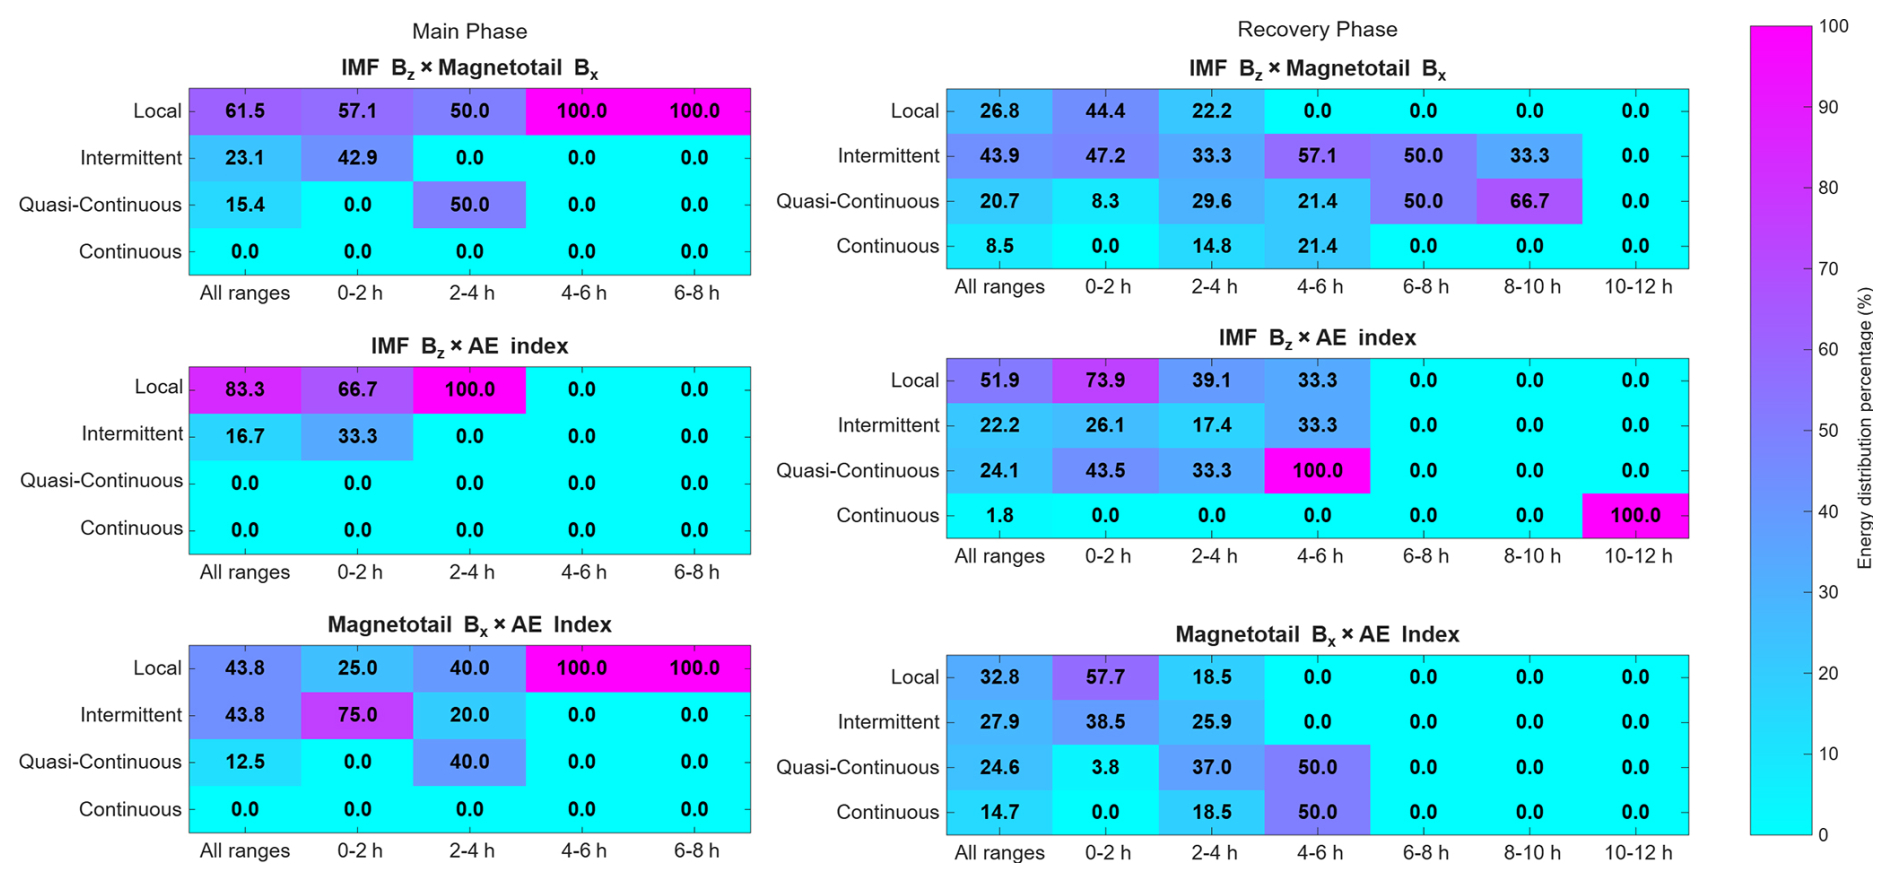
Figure 10Color maps correlation distribution classification percentage obtained from the XWT analysis. Maps for IMF Bz× magnetotail Bx (upper panels), IMF Bz×AE index (middle panels), and magnetotail Bx×AE index (bottom panels) display the percentage distribution across period ranges (x axis) and correlation distribution classification (y axis). Results are separated by storm phase: main phase (left column) and recovery phase (right column).
3.4 Power Law analysis
In order to determine the spectral index for the solar wind, magnetospheric and auroral data during the geomagnetic storms main and recovery phases, we applied the Fourier analysis to the IMF Bz, magnetotail Bx and AE index data. The datasets were separated in two categories: main and recovery phases.
3.4.1 Main Phase
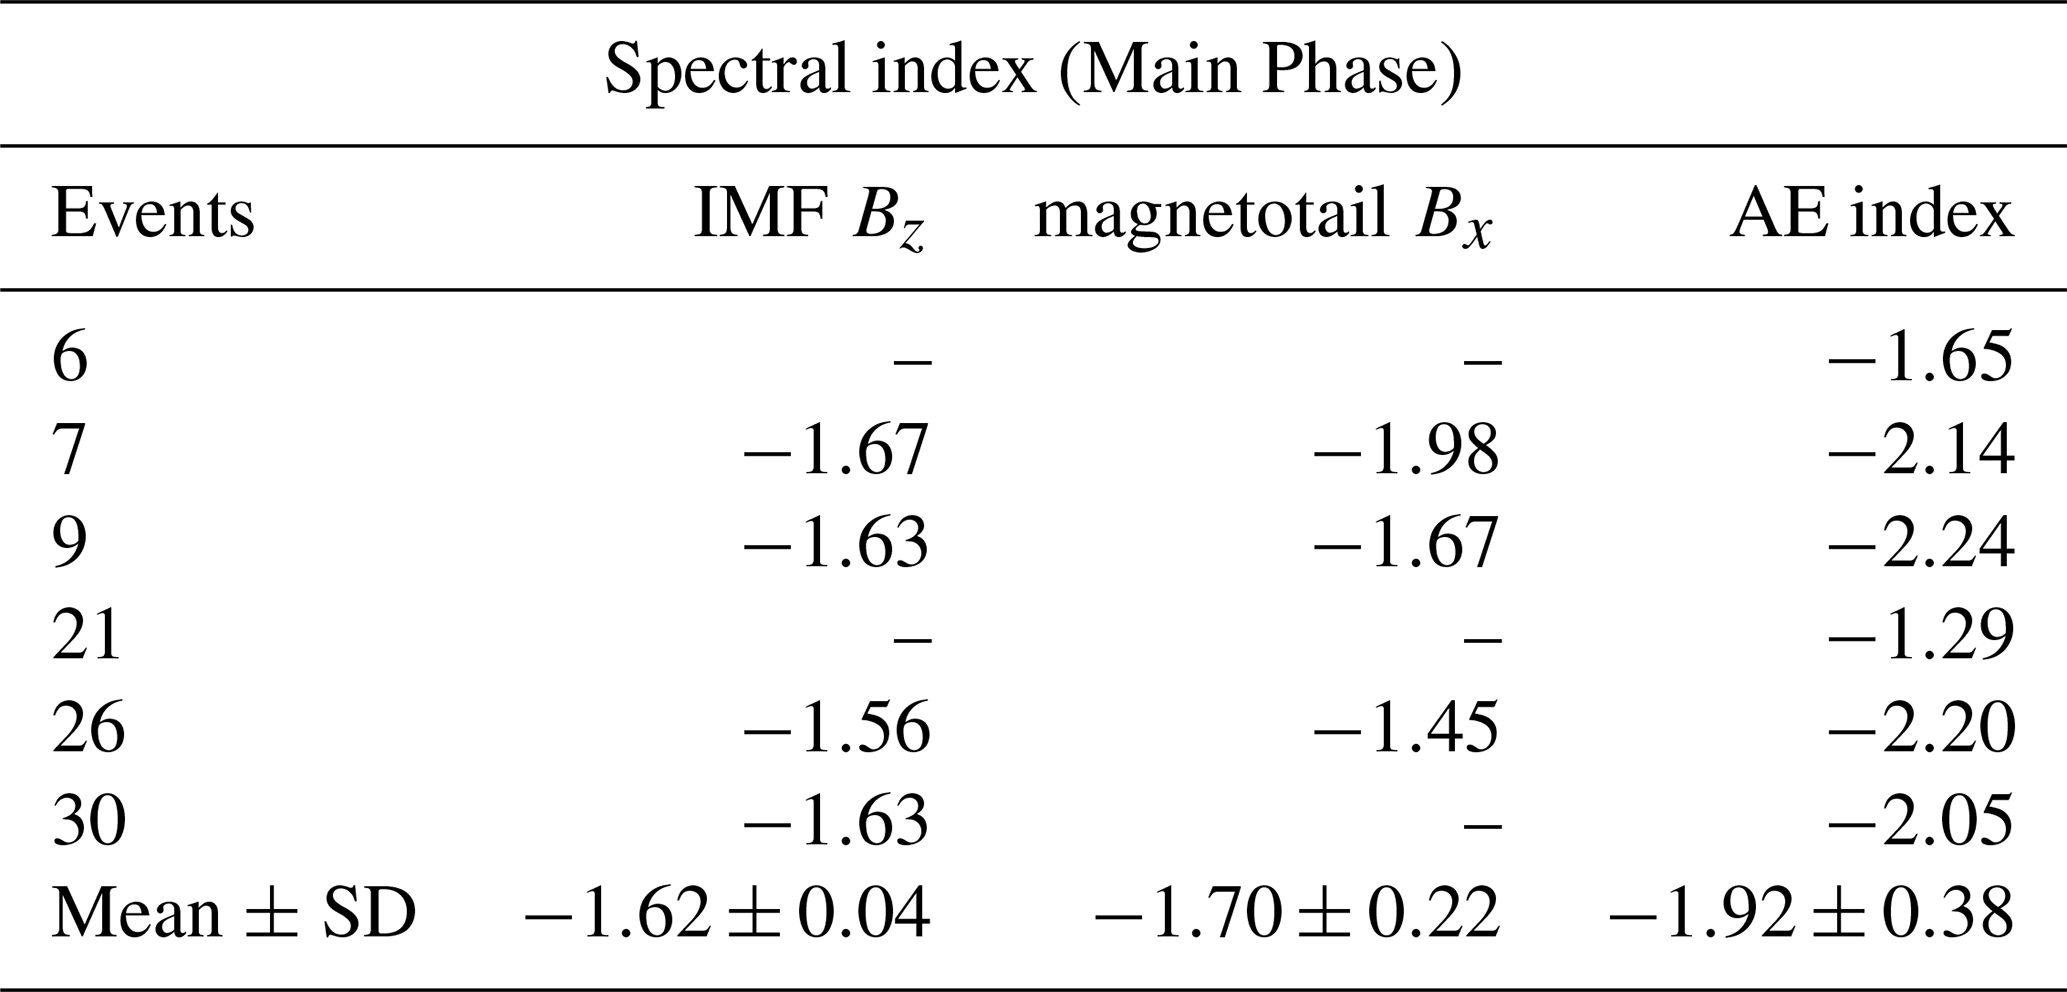
Results from the main phase are summarized in Table 2, and the spectral indices for event 7 are shown in Fig. 11a). According to Table 2, considering all analyzed events, it is possible to observe that mean values of the spectral indices were () for the IMF Bz, () for the magnetotail Bx and () for the AE index. Recently, Rakhmanova et al. (2020) studied the dependence of the spectral indices over plasma turbulence and showed that both the solar wind parameters and bow shock geometry have a great influence on the variation on the spectral index values. This fact shows that these values are sensible to this kind of parameters and the geometry from the space environment. These dependencies from the space geometry for the spectral indices are due to the formation of several kinds of phenomena, such as Alfvén waves, and also the coherent structures inside the plasma turbulence. This dependence of the spectral indices over the space environment was also demonstrated in Neptune day side magnetosheath fluctuations during Voyager-2 flyby (Echer et al., 2023) and during solar-wind high-speed streams (HSSs) at high heliolatitudes during the last two solar-cycle minima (SCM) (Echer et al., 2022).
Table 2Spectral indices (IMF Bz, magnetotail Bx and AE index) obtained for Main Phase.
Bolzan (2005) showed that the coherent structures present in solar wind time series increase (in absolute value) the spectral indices. The idea is that, into the turbulence flow, these organized structures are responsible to lead the energy from large to small scales in the fast and energetic way like a cascade as proposed by (Kolmogorov, 1941). According to Müller and Biskamp (2000), MHD turbulence is driven by the Alfvén wave effect, which couples small-scale velocity and magnetic fluctuations. This results in an energy spectrum consistent with a law (the K41 law), which also aligns with observations of solar wind turbulence. Thus, our results from spectral indices mean values found for the AE index are consistent with previous works, where the difference found between and are due to the intermittency phenomena present in the MHD turbulence.
An interesting aspect observed in this study is the difference found between spectral index mean values obtained for the AE index time series and the solar wind-magnetotail time series (IMF Bz and magnetotail Bx). Three important points are noted: first, the mean values for the IMF Bz and magnetotail Bx series matches the K41 law which corresponds to ; second, despite the standard deviation, there is a notable difference between these spectral indices for these both kinds of time series; third, the mean values for the AE index are in agreement with results from (Tsurutani et al., 1990). Tsurutani et al. (1990) suggested that high amplitude fluctuations in the southward IMF component will generate flux variations in the magnetotail and may be related to the increase of the ionospheric conductivity, which can be associated with the higher spectral index values found for AE index.
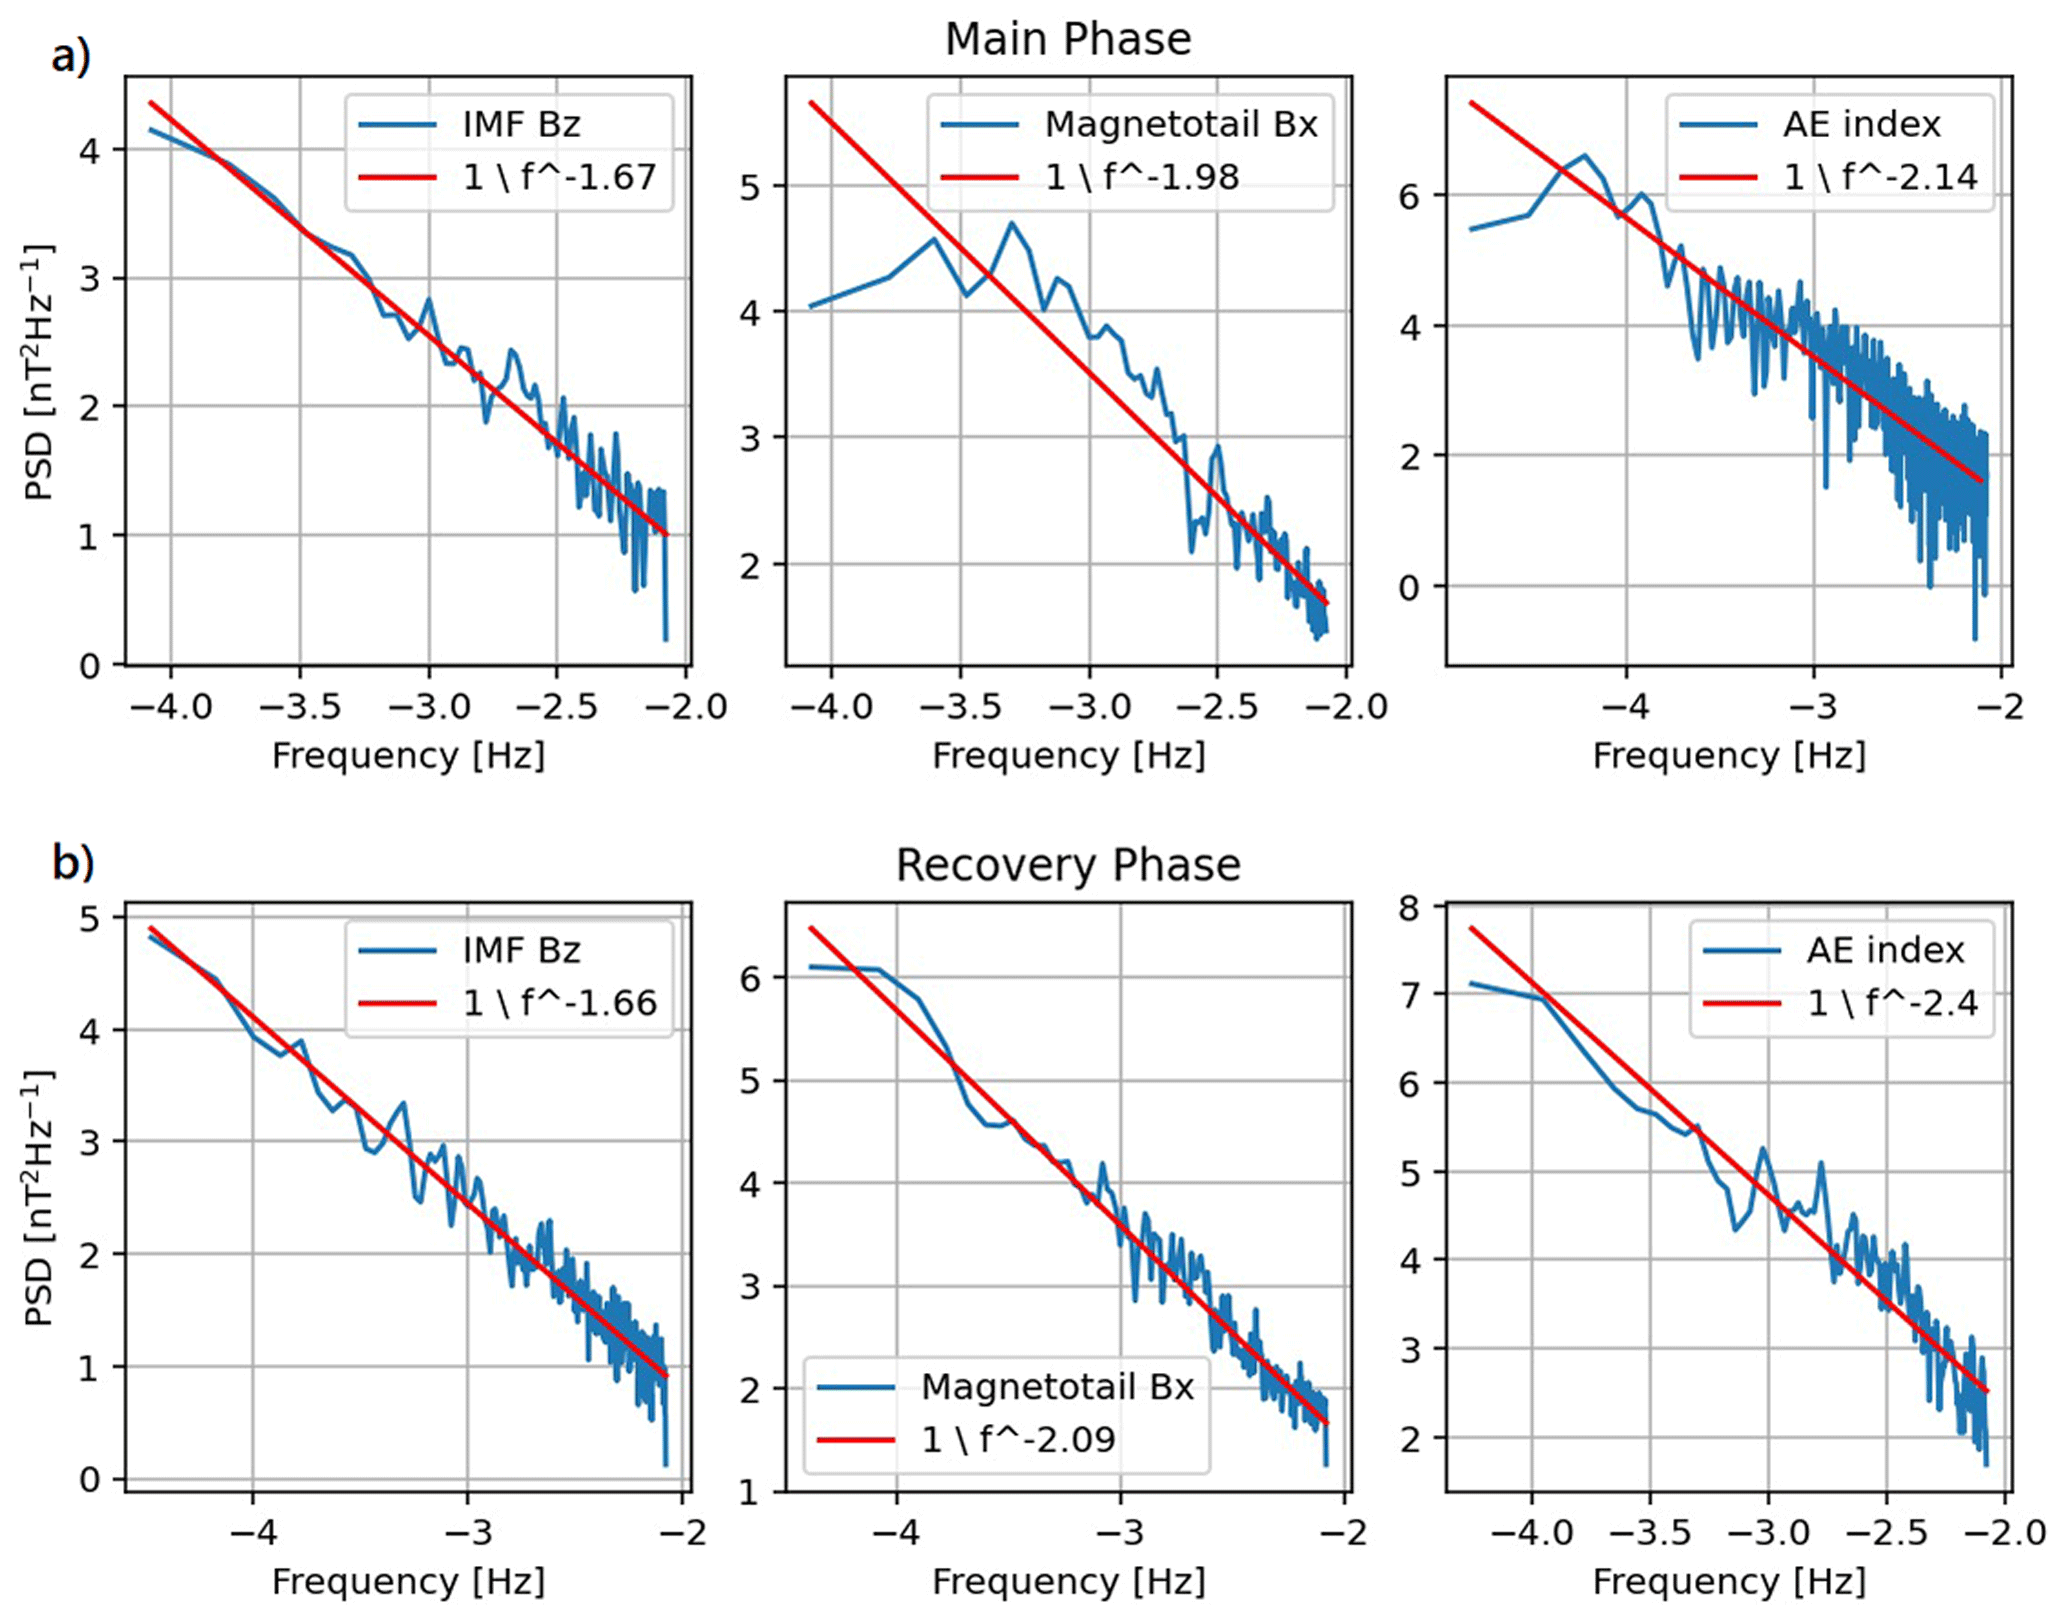
Figure 11Spectral indices for IMF Bz, magnetotail Bx and AE index for (a) Main Phase (event 7) and (b) Recovery Phase (event 1).
In a previous work, similar results were obtained for the study of the Earth's magnetotail variability during supersubstorms (Hajra et al., 2023). In that study it was found that the IMF Bz exhibits the lowest spectral index (compared to the magnetotail Bx and SML auroral indices), thus, corroborating our results. It is important to mention that the solar wind turbulence is significantly amplified after crossing the bow shock, and plasma flows are generated in the magnetosheath region. In the nightside, eddy vortices are generated due to those large-scale magnetospheric flows, which can drive the magnetotail turbulence (Antonova and Stepanova, 2021).
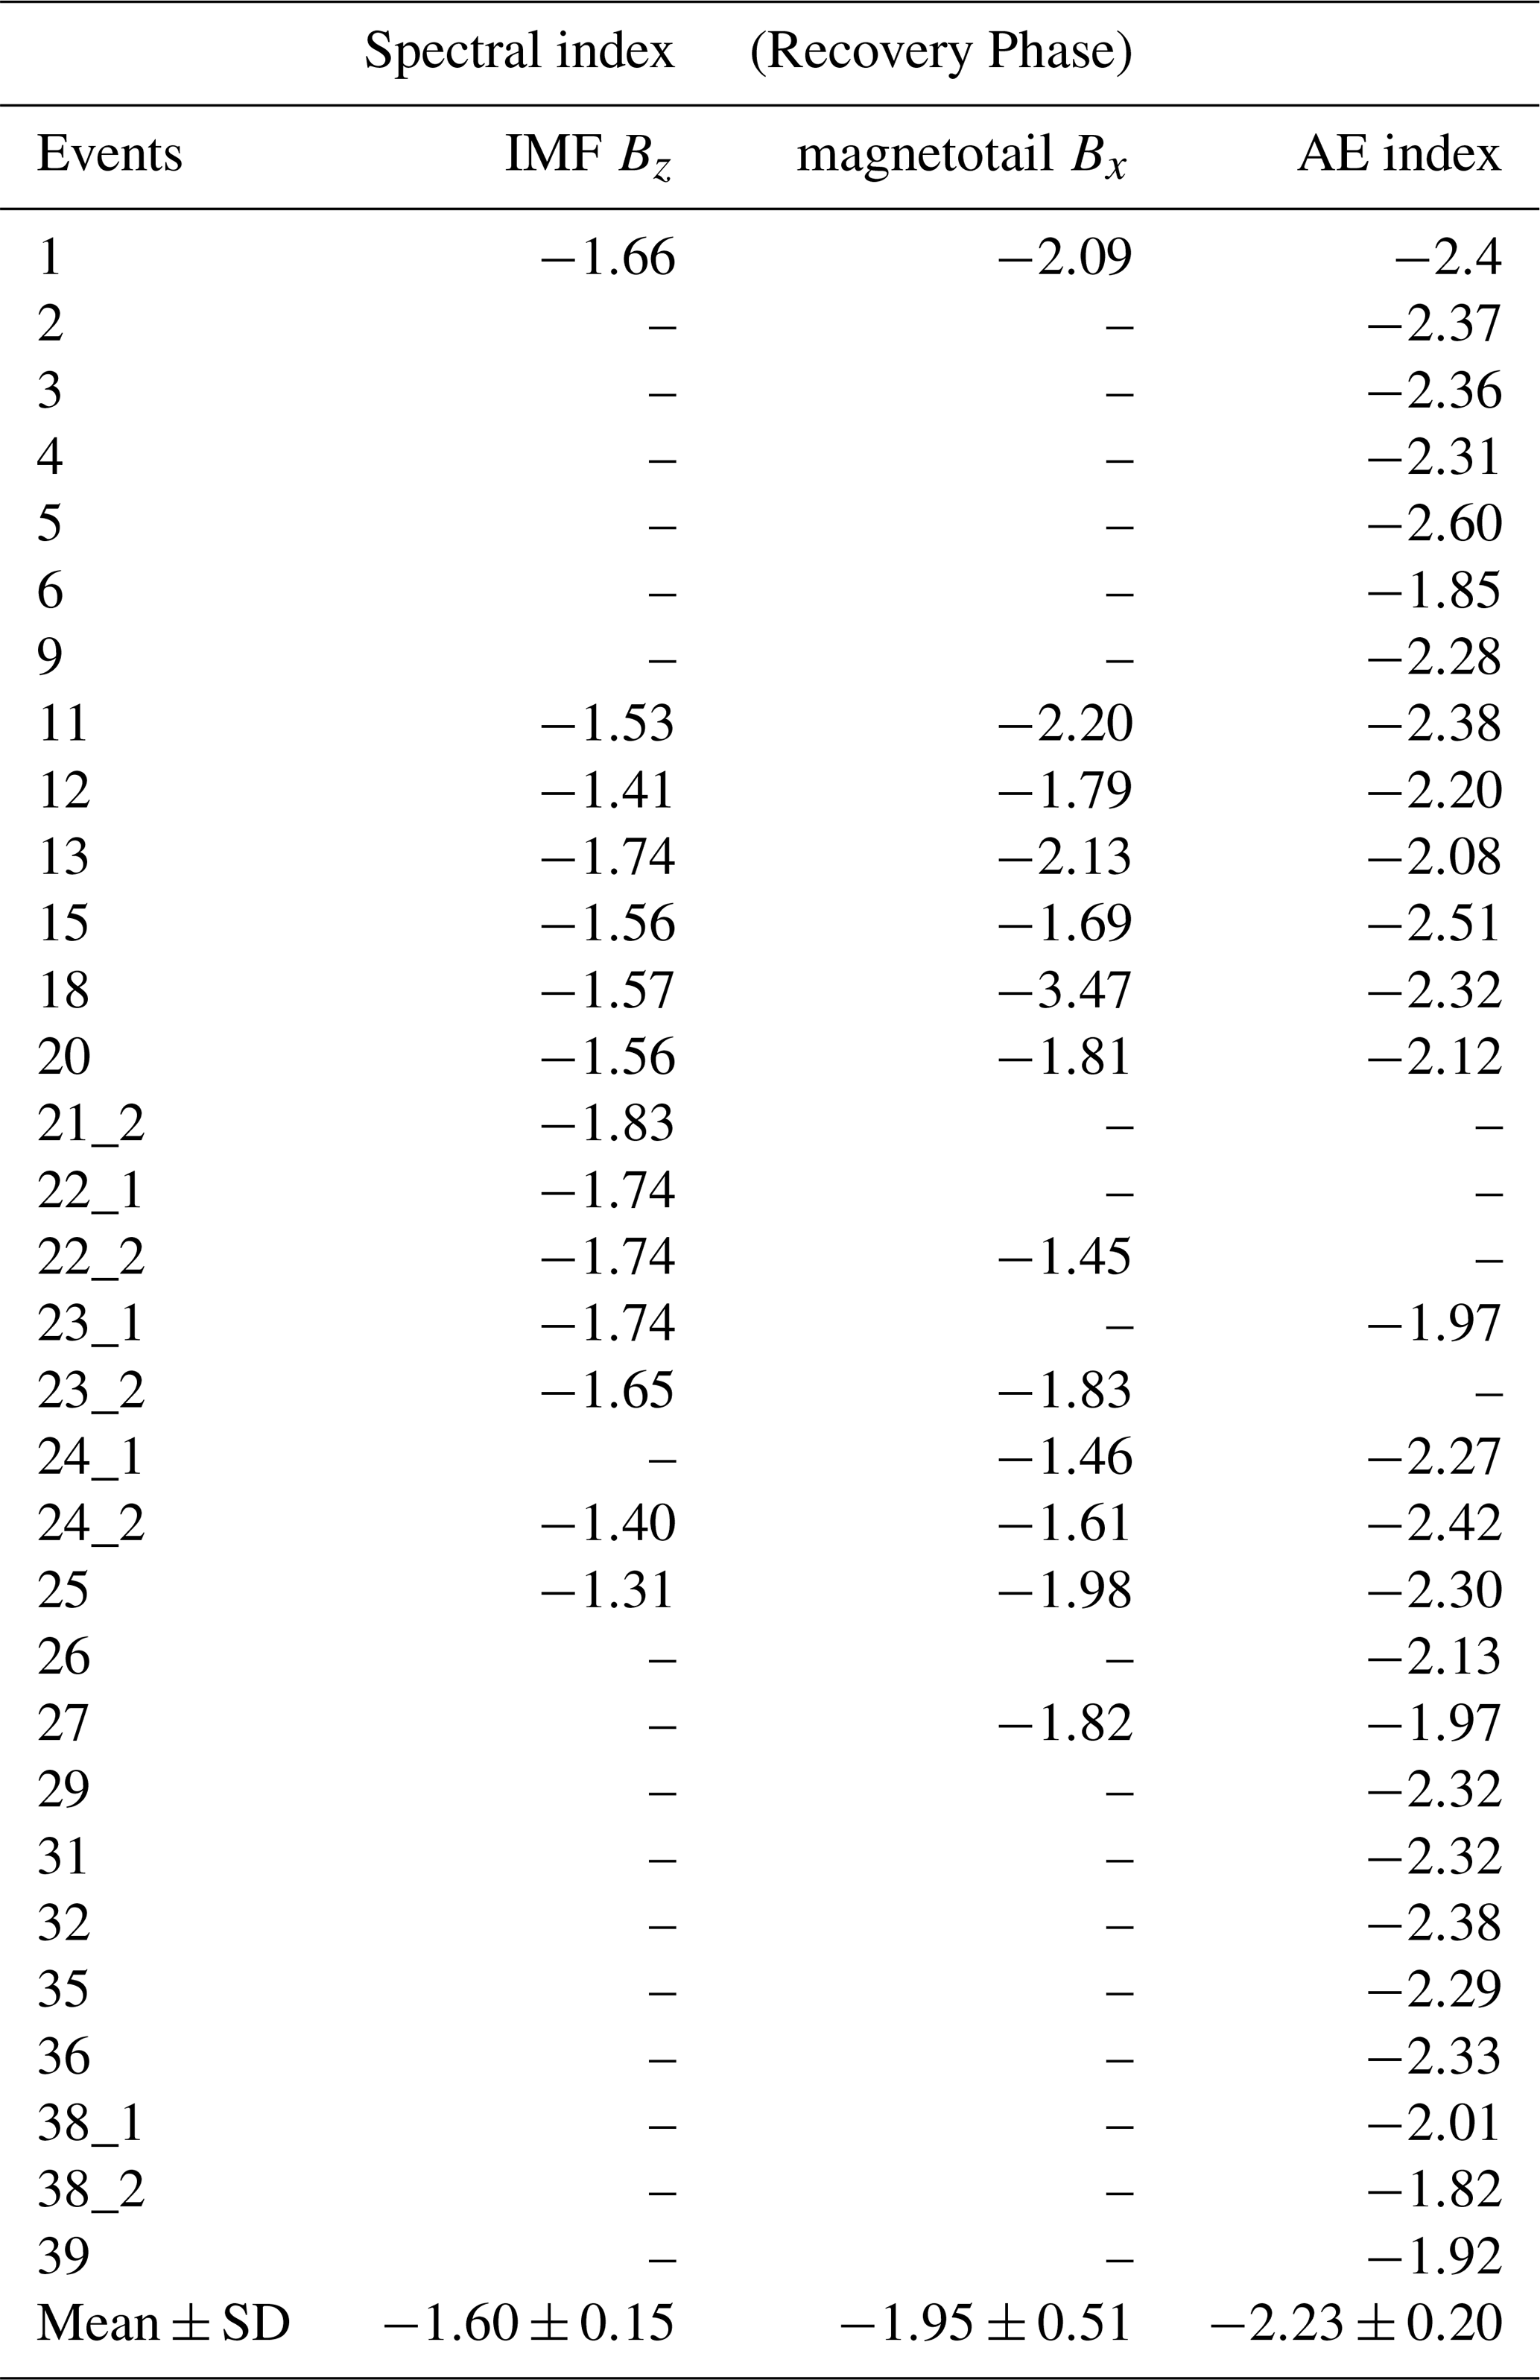
Table 3Spectral indices (IMF Bz, magnetotail Bx and AE index) obtained for Recovery Phase.
3.4.2 Recovery Phase
Similarly to the analyses conducted for the main phase intervals, we performed the Fourier Transform in all data in order to obtain the spectral indices during the recovery phase. An example is shown in Fig. 11b, which displays the spectral indices obtained for the parameters analyzed during Event 1. Table 3 shows the results where the mean values found for IMF Bz, magnetotail Bx and AE index were , and , respectively. For the IMF Bz index, the spectral index is lower in the recovery phase than during the main phase,while for the magnetotail and auroral data, higher mean absolute values are found, where they were and , respectively. A sharp break is observed in the magnetotail Bx and AE index PSDs during the main phase, which is not seen during the recovery phase (Fig. 11). We may conjecture that during the recovery phase the geomagnetic field promotes a fast transfer of the energy from the large to small scales in order to leave the magnetosphere to return to almost steady state.
We also have separated the spectral indices from AE indices time series and magnetic ones (IMF Bz and Bx) where the results were, respectively, and . Note, again, the magnetic time series, IMF Bz and Bx, following the K41 law, corroborating results from (Müller and Biskamp, 2000). Furthermore, these results, similar to those observed in the main phase, suggest a characteristic of AE index time series: a distinct behavior compared to magnetic time series, as previously discussed in (Hajra et al., 2023). Also, despite the large standard deviation, it is possible to recognize that the mean values of the spectral indices for the recovery phases are greater if compared with those noted during the main phase. We can associate this result with the presence of the strong turbulence present during the recovery phase. It is just in this phase that the turbulent phenomena need to act in order to promote the transferring of energy from large to small scales like a Kolmogorov cascade.
In this work, the magnetotail response to geomagnetic storms driven by CIRs was investigated using wavelet and power spectrum analyses. By examining a comprehensive dataset of 40 CIR-driven storms over a 15 year period (2001–2016), this study provides a significantly broader statistical basis than previously reported in the literature. The wavelet analyses applied to the IMF Bz and the magnetotail Bx time series showed that during CIR-driven geomagnetic storms the magnetotail responds stronger to lower periods than for HILDCAA events. Furthermore, we extended this analysis by distinguishing the magnetotail response between the main and recovery phases, allowing for quantitative comparison of turbulence levels.
The results demonstrate that more than 80 % of the most energetic periods in the IMF Bz and magnetotail Bx in the magnetotail during geomagnetic storms driven by CIRs were found at ≤4 h, independently of the storm phase. For the AE index, periodicities between 2 and 4 h dominate during both phases. A notable difference is that, during the main phase, the second range with higher number of periodicities was found in the interval between 4 and 6 h, followed by periods≤2 h, while for the recovery phase, no energetic period was observed below 2 h. Further, besides the dominant range, the number of periods of higher energy seems to be spread in longer periods, with the 4–6 and 6–8 h ranges showing the same percentage of periods. The explanation of this difference may happen because during the recovery phase of geomagnetic storms, HILDCAA events often occur (Kamide et al., 1998 Tsurutani and Gonzalez 1987). It is well known that the main periodicities of the AE index during HILDCAAs are generally found between 4 and 12 h and that they are associated with Alfvénic trains in the IMF (Souza et al., 2016).
The XWT analyses performed to the magnetotail Bx×AE index and IMF Bz×AE index data indicated that the percentage of periods of correlation per range decreased as the periods increased. About 47 % of the periods of higher correlation are found at ≤2 h for the main phase. For the recovery phase we obtained almost the same results. This analysis shows that the energy transfer from the solar wind, IMF Bz, to the magnetotail Bx, and finally to the auroral region, AE, occurs mainly at oscillations with periods ≤ 4 h. Similar values were also found during HILDCAAs by (Franco et al., 2019). The HSS is associated with the generation of CIRs, and the periods found here correspond to cyclic substorm periods caused by Alfvén waves in the IMF during the HSS (Lee et al., 2006; Echer et al., 2017).
Results from spectral indices obtained for the IMF Bz during both the main and recovery phases showed agreement to K41 () law. Besides, we observed a difference between the spectral index mean values obtained for AE indices time series and IMF Bz and magnetotail Bx for the main phase. These results show that the mean values for the interplanetary and magnetospheric time series are close to K41 law which corresponds to while AE spectral index values are close to −1.93. For the recovery phase, higher values of spectral indices were found for the magnetotail Bx (−1.92) and AE index −2.23, corroborating results from Tsurutani et al. (1990). Two results can be summarized:
-
The IMF Bz and magnetotail Bx magnetic time series following the K41 () law during the main phase, corroborating results from Müller and Biskamp (2000);
-
The mean values of the spectral indices for the recovery phase is greater, in the magnetotail and auroral region, if compared with the main phase. We can associate this result with the presence of the strong turbulence present in these regions during the recovery phase.
Several studies were performed about the effect of geomagnetic activity in the Earth's magnetotail and they allowed us to have a general idea of the energy transfer from solar wind to the magnetotail during different kind of events (Nakamura and Kokubun, 2000; Nakamura et al., 2002; Franco et al., 2019; Hajra et al., 2023). Here we conducted a study on geomagnetic storms caused by CIRs in the Earth's magnetotail. The findings of this study support the conclusion that the magnetosphere responds to CIR-driven solar wind forcing mainly at the 2–4 h timescales characteristic of substorms. It would be interesting to perform this kind of investigation about solar wind magnetosphere coupling on the magnetotail of other planets (Souza Echer et al., 2021).
The analysis code used in this study is based on the wavelet transform methodology originally developed by Torrence and Compo (1998). Our implementation is an adaptation of their publicly available software, customized to process the specific Cluster, OMNI, and AE index datasets used in this work.
The OMNI database used for interplanetary magnetic field data is publicly available via NASA's GSFC at https://omniweb.gsfc.nasa.gov/ (GSFC, 2026). The auroral electrojet (AE) index data were obtained from the World Data Center for Geomagnetism, Kyoto, available at http://wdc.kugi.kyoto-u.ac.jp/dstae/index.html (WDC, 2026). Cluster spacecraft magnetic field data can be accessed through the European Space Agency (ESA) Science Archive at https://www.cosmos.esa.int/web/csa/access (last access: 14 August 2026).
EE provided the original idea for this study. AMdSF, RR, and MJAB performed the data analysis. All authors contributed to the writing and revision of the manuscript.
The contact author has declared that none of the authors has any competing interests.
Publisher's note: Copernicus Publications remains neutral with regard to jurisdictional claims made in the text, published maps, institutional affiliations, or any other geographical representation in this paper. The authors bear the ultimate responsibility for providing appropriate place names. Views expressed in the text are those of the authors and do not necessarily reflect the views of the publisher.
The AE index and IMF Bz data used in this manuscript are publicly available at https://wdc.kugi.kyoto-u.ac.jp/dstae/index.html (WDC, last access: 14 August 2026) and https://omniweb.gsfc.nasa.gov/form/sc_merge_min1.html (GSFC, last access: 14 August 2026). A. M. S. F. would like to thank the Institute of Geosciences and Engineering (UNIFESSPA, project no. 23479.009478/2024-60) and the Institute of Exact and Technological Sciences (ICET/UFJ, project nº PI06225-2026) for their institutional support. R. Rawat thanks the Department of Science and Technology, India, for their support, and the Director, NCPOR, for all the necessary assistance (NCPOR contribution number J-29/2026-27). E. Echer and M. J. A. Bolzan thank the Conselho Nacional de Desenvolvimento Científico e Tecnológico (CNPq) for their support. We also thank the Brazilian Ministry of Science, Technology and Innovation and the Brazilian Space Agency.
This research has been supported by the Department of Science and Technology, Ministry of Science and Technology, India (grant no. DST/WOS-A/EA-24/2020) and the Conselho Nacional de Desenvolvimento Científico e Tecnológico – CNPq (grant nos. PQ-301883/2019-0, PQ-303900-2024-5, and 304552/2023-2).
This paper was edited by Christopher Mouikis and reviewed by two anonymous referees.
Abbo, L., Ofman, L., Antiochos, S. K., Hansteen, V. H., Harra, L., Ko, Y.-K., Lapenta, G., Li, B., Riley, P., Strachan, L., von Steiger, R., and Wang, Y.-M.: Slow solar wind: Observations and modeling, Space Sci. Rev., 201, 55–108, https://doi.org/10.1007/s11214-016-0264-1, 2016.
Alves, M., Echer, E., and Gonzalez, W.: Geoeffectiveness of corotating interaction regions as measured by Dst index, J. Geophys. Res.-Space, 111, A07S05, https://doi.org/10.1029/2005JA011379, 2006.
Antonova, E. E. and Stepanova, M. V.: The impact of turbulence on physics of the geomagnetic tail, Frontiers in Astronomy and Space Sciences, 8, 622570, https://doi.org/10.3389/fspas.2021.622570, 2021.
Baumjohann, W. and Nakamura, R.: Magnetospheric contributions to the terrestrial magnetic field, Developments in Earth and Environmental Sciences, 5, 77–92, https://doi.org/10.1016/B978-044452748-6.00088-2, 2007.
Bolzan, M. J. A.: Statistical and wavelet analysis of the solar wind data, Braz. J. Phys., 35, 592–596, https://doi.org/10.1590/S0103-97332005000400002, 2005.
Bolzan, M. J. A. and Echer, E.: A multifractal approach applied to the magnetic field turbulence in Jupiter's magnetosheath, Planet. Space Sci., 91, 77–82, https://doi.org/10.1016/j.pss.2013.12.004, 2014.
Bolzan, M. J. A., Franco, A. M. S., and Echer, E.: A wavelet based method to remove the long term periodicities of geophysical time series, Adv. Space Res., 66, 299–306, https://doi.org/10.1016/j.asr.2020.04.014, 2020.
Borovsky, J. E. and Denton, M. H.: Differences between CME-driven storms and CIR-driven storms, J. Geophys. Res.-Space, 111, A07S08, https://doi.org/10.1029/2005JA011447, 2006.
Borovsky, J. E., Nemzek, R. J., and Belian, R. D.: The occurrence rate of magnetospheric-substorm onsets: Random and periodic substorms, J. Geophys. Res.-Space, 98, 3807–3813, https://doi.org/10.1029/92JA02556, 1993.
Bruno, R., Carbone, V., Veltri, P., Politano, H., and Malara, F.: Identification of cascade in the solar wind: The role of the cross-helicity, Planet. Space Sci., 53, 49–54, https://doi.org/10.1016/j.pss.2004.09.023, 2005.
Chen, Y., Wang, W., Burns, A. G., Liu, S., Gong, J., Yue, X., Jiang, G., and Coster, A.: Ionospheric response to CIR-induced recurrent geomagnetic activity during the declining phase of solar cycle 23, J. Geophys. Res.-Space, 120, 1394–1418, https://doi.org/10.1002/2014JA020657, 2015.
Chian, A., Miranda, R., Bertucci, C., Blanco-Cano, X., Borovsky, J., Dasso, S., Echer, E., Franco, A., Girgis, K. M., González-Esparza, J. A., Hada, T., Hasegawa, H., Hsieh, S.-Y., Kajdič, P., Mazelle, C., Rempel, E., Rojas-Castillo, D., Sánchez-Cano, B., Sibeck, D., Stepanova, M., Valdés-Galicia, J., and Valdivia, J.: Terrestrial and Martian space weather: A complex systems approach, J. Atmos. Sol.-Terr. Phy., 259, 106253, https://doi.org/10.1016/j.jastp.2024.106253, 2024.
Davis, T. N. and Sugiura, M.: Auroral electrojet activity index AE and its universal time variations, J. Geophys. Res., 71, 785–801, https://doi.org/10.1029/JZ071i003p00785, 1966.
Denton, M., Borovsky, J., Skoug, R., Thomsen, M., Lavraud, B., Henderson, M., McPherron, R. L., Zhang, J. C., and Liemohn, M.: Geomagnetic storms driven by ICME- and CIR-dominated solar wind, J. Geophys. Res.-Space, 111, A07S07, https://doi.org/10.1029/2005JA011436, 2006.
Despirak, I., Lubchich, A., and Koleva, R.: Magnetospheric signatures of auroral disturbances during the passage of the solar wind's CIR and sheath regions, Cosmic Res., 52, 37–45, https://doi.org/10.1134/S001095251401002X, 2014.
Despirak, I. V., Lyubchich, A. A., and Koleva, R.: Magnetotail signatures of auroral disturbances associated with Sheath and CIR regions in the solar wind, in: Proceedings of the fifth workshop “Solar influences on the magnetosphere”, edited by: Georgieva, K., Nessebar, Bulgaria, 3–7 June 2013, E13, http://ws-sozopol.stil.bas.bg/ (last access: 24 August 2026), 2013.
Echer, E., Gonzalez, W. D., Tsurutani, B. T., and Gonzalez, A. L. C.: Interplanetary conditions causing intense geomagnetic storms () during solar cycle 23 (1996–2006), J. Geophys. Res.-Space, 113, A05221, https://doi.org/10.1029/2007JA012744, 2008.
Echer, E., González, W. D., Tsurutani, B. T., and Alves, M. V.: Interplanetary conditions leading to intense geomagnetic storms () during solar cycle 23 (1996–2008), J. Atmos. Sol.-Terr. Phy., 102, 236–241, https://doi.org/10.1016/j.jastp.2013.06.002, 2013.
Echer, E., Korth, A., Bolzan, M. J. A., and Friedel, R. H. W.: Global geomagnetic responses to the IMF Bz fluctuations during the September/October 2003 high-speed stream intervals, Ann. Geophys., 35, 853–868, https://doi.org/10.5194/angeo-35-853-2017, 2017.
Echer, E., Franco, A. M. S., da Costa Junior, E., Hajra, R., and Bolzan, M. J. A.: Solar-wind high-speed stream (HSS) Alfvén wave fluctuations at high heliospheric latitudes: Ulysses observations during two solar-cycle minima, Sol. Phys., 297, https://doi.org/10.1007/s11207-022-02070-w, 2022.
Echer, E., Franco, A. M. S., Magalhães, F. P., Bolzan, M. J. A., and Hajra, R.: Study of Neptune dayside magnetosheath fluctuations during Voyager-2 flyby, Adv. Space Res., 71, 3468–3478, https://doi.org/10.1016/j.asr.2022.12.022, 2023.
Gonzalez, W., Tsurutani, B., and Clúa de Gonzalez, A.: Interplanetary origin of geomagnetic storms, Space Sci. Rev., 88, 529–562, https://doi.org/10.1023/A:1005160129098, 1999.
Gonzalez, W., Echer, E., Clua-Gonzalez, A., and Tsurutani, B.: Interplanetary origin of intense geomagnetic storms () during solar cycle 23, Geophys. Res. Lett., 34, https://doi.org/10.1029/2006GL028879, 2007.
Gonzalez, W. D., Joselyn, J. A., Kamide, Y., Kroehl, H. W., Rostoker, G., Tsurutani, B. T., and Vasyliunas, V. M.: What is a geomagnetic storm?, J. Geophys. Res.-Space, 99, 5771–5792, https://doi.org/10.1029/93JA02867, 1994.
Gosling, J. T., Borrini, G., Asbridge, J. R., Bame, S. J., Feldman, W. C., and Hansen, R. T.: Coronal streamers in the solar wind at 1 AU, J. Geophys. Res., 86, 5438–5448, https://doi.org/10.1029/JA086iA07p05438, 1981.
Grinsted, A., Moore, J. C., and Jevrejeva, S.: Application of the cross wavelet transform and wavelet coherence to geophysical time series, Nonlin. Processes Geophys., 11, 561–566, https://doi.org/10.5194/npg-11-561-2004, 2004.
GSFC: OMNIWeb Plus: Near-Earth Heliosphere Data, NASA Goddard Space Flight Center [data set], https://omniweb.gsfc.nasa.gov/, last access: 14 August 2026.
Hajra, R., Echer, E., Franco, A. M. d. S., and Bolzan, M. J. A.: Earth's magnetotail variability during supersubstorms (SSSs): A study on solar wind–magnetosphere–ionosphere coupling, Adv. Space Res., 72, 1208–1223, https://doi.org/10.1016/j.asr.2023.04.013, 2023.
Hajra, R., Echer, E., Tsurutani, B. T., and Gonzalez, W. D.: Solar cycle dependence of high-intensity long-duration continuous AE activity (HILDCAA) events, relativistic electron predictors?, J. Geophys. Res.-Space, 118, 5626–5638, https://doi.org/10.1002/jgra.50530, 2013.
Hundhausen, A. J.: The Solar Wind, in: Introduction to Space Physics, edited by: Kivelson, M. G. and Russell, C. T., Cambridge University Press, Cambridge, 91–128, https://doi.org/10.1017/9781139878296, 1995.
Iyemori, T.: Storm-time magnetospheric currents inferred from mid-latitude geomagnetic field variations, J. Geomagn.Geoelectr., 42, 1249–1265, https://doi.org/10.5636/jgg.42.1249, 1990.
Kamide, Y., Baumjohann, W., Daglis, I. A., Gonzalez, W. D., Grande, M., Joselyn, J. A., McPherron, R. L., Phillips, J. L., Reeves, E. G. D., Rostoker, G., Sharma, A. S., Singer, H. J., Tsurutani, B. T., and Vasyliunas, V. M.: Current understanding of magnetic storms: Storm-substorm relationships, J. Geophys. Res.-Space, 103, 17705–17728, https://doi.org/10.1029/98JA01426, 1998.
Koller, F., Temmer, M., Preisser, L., Plaschke, F., Geyer, P., Jian, L. K., Roberts, O. W., Hietala, H., and Lamoury, A. T.: Magnetosheath jet occurrence rate in relation to CMEs and SIRs, J. Geophys. Res.-Space, 127, e2021JA030230, https://doi.org/10.1029/2021JA030230, 2022.
Kolmogorov, A. N.: The local structure of turbulence in an incompressible viscous fluid for very large Reynolds numbers, Dokl. Akad. Nauk SSSR, 30, 299–304, 1941.
Korth, A., Echer, E., Guarnieri, F. L., Franz, M., Friedel, R., Gonzalez, W. D., Mouikis, C. G., and Reme, H.: Cluster observations of plasma sheet activity during the 14–28 September 2003 corotating high speed stream event, in: Proceedings of the Eighth International Conference on Substorms (ICS-8), edited by: Syrjäsuo, A. and Donovan, E., Banff, Alberta, Canada, 27–31 March 2006, 133–138, https://ics8.ca/proc_files/korth.pdf (last access: 24 August 2026), 2006.
Korth, A., Echer, E., Zong, Q.-G., Guarnieri, F., Fraenz, M., and Mouikis, C.: The response of the polar cusp to a high-speed solar wind stream studied by a multispacecraft wavelet analysis, J. Atmos. Sol.-Terr. Phy., 73, 52–60, https://doi.org/10.1016/j.jastp.2009.10.004, 2011.
Krieger, A. S., Timothy, A. F., and Roelof, E. C.: A coronal hole and its identification as the source of a high velocity solar wind stream, Sol. Phys., 29, 505–525, https://doi.org/10.1007/BF00150828, 1973.
Lee, D.-Y., and Min, K. W.: Statistical features of substorm indicators during geomagnetic storms, J. Geophys. Res.-Space, 107, 1362, https://doi.org/10.1029/2002JA009243, 2002.
Lee, D.-Y., Lyons, L., Kim, K.-C., Baek, J.-H., Kim, K.-H., Weygand, J., Moon, Y.-J., Cho, K.-S., Park, Y. D., and Han, W.: Repetitive substorms caused by Alfvénic waves of the interplanetary magnetic field during high-speed solar wind streams, J. Geophys. Res.-Space, 111, A12S09, https://doi.org/10.1029/2006JA011685, 2006.
Marques de Souza, A., Echer, E., Bolzan, M. J. A., and Hajra, R.: Cross-correlation and cross-wavelet analyses of the solar wind IMF Bz and auroral electrojet index AE coupling during HILDCAAs, Ann. Geophys., 36, 205–211, https://doi.org/10.5194/angeo-36-205-2018, 2018.
Marques de Souza Franco, A., Echer, E., and José Alves Bolzan, M.: Wavelet analysis of the magnetotail response to solar wind fluctuations during HILDCAA events, Ann. Geophys., 37, 919–929, https://doi.org/10.5194/angeo-37-919-2019, 2019.
McPherron, R. L., Russell, C. T., and Aubry, M.: Satellite studies of magnetospheric substorms on 15 August 1968: 5. Phenomenological model for substorms, J. Geophys. Res., 78, 3131–3143, https://doi.org/10.1029/JA078i016p03131, 1973.
Müller, W.-C., and Biskamp, D.: Scaling properties of three-dimensional magnetohydrodynamic turbulence, Phys. Rev. Lett., 84, 475–478, https://doi.org/10.1103/PhysRevLett.84.475, 2000.
Nakamura, R. and Kokubun, S.: Tail configuration during storms, Adv. Space Res., 25, 1631–1638, https://doi.org/10.1016/S0273-1177(99)00677-8, 2000.
Nakamura, R., Baumjohann, W., Klecker, B., Bogdanova, Y., Balogh, A., Rème, H., Bosqued, J. M., Dandouras, I., Sauvaud, J. A., Glassmeier, K. -H., Kistler, L., Mouikis, C., Zhang, T. L., Eichelberger, H., and Runov, A.: Motion of the dipolarization front during a flow burst event observed by Cluster, Geophys. Res. Lett., 29, 3-1–3-4, https://doi.org/10.1029/2002GL015763, 2002.
Nakamura, R., Nagai, T., Birn, J., Sergeev, V., Contel, O. L., Varsani, A., Baumjohann, W., Nakamura, T., Apatenkov, S., Artemyev, A., Ergun, R. E., Fuselier, S. A., Gershman, D. J., Giles, B. J., Khotyaintsev, Y. V., Lindqvist, P.-A., Magnes, W., Mauk, B., Russell, C. T., Singer, H. J., Stawarz, J., Strangeway, R. J., Anderson, B., Bromund, K. R., Fischer, D., Kepko, L., Le, G., Plaschke, F., Slavin, J. A., Cohen, I., Jaynes, A., and Turner, D. L.: Near-earth plasma sheet boundary dynamics during substorm dipolarization, Earth Planets Space, 69, 16, https://doi.org/10.1186/s40623-017-0707-2, 2017.
Parker, E. N.: Dynamics of the interplanetary gas and magnetic fields, Astrophys. J., 128, 664, https://doi.org/10.1086/146579, 1958.
Phillips, J., Bame, S., Feldman, W., Gosling, J., Hammond, C., McComas, D., Goldstein, B. E., Neugebauer, M., Scime, E. E., and Suess, S.: Ulysses solar wind plasma observations at high southerly latitudes, Science, 2685213, 1030–1033, https://doi.org/10.1126/science.268.5213.1030, 1995.
Rakhmanova, L. S., Riazantseva, M. O., Zastenker, G. N., Yermolaev, Y. I., and Lodkina, I. G.: Dependence of the properties of a turbulent cascade behind the bow shock on the dynamics of the solar wind parameters, Cosmic Res., 58, 478–486, 2020.
Rawat, R., Echer, E., and Gonzalez, W. D.: How different are the solar wind-interplanetary conditions and the consequent geomagnetic activity during the ascending and early descending phases of the solar cycles 23 and 24?, J. Geophys. Res.-Space, 123, 6621–6638, https://doi.org/10.1029/2018JA025683, 2018.
Richardson, I. G.: The formation of CIRs at stream-stream interfaces and resultant geomagnetic activity, in: Recurrent magnetic storms: Corotating solar wind streams, American Geophysical Union (AGU), 45–58, https://doi.org/10.1029/167GM06, 2006.
Rostoker, G.: Geomagnetic indices, Rev. Geophys., 10, 935–950, https://doi.org/10.1029/RG010i004p00935, 1972.
Runov, A., Sergeev, V. A., Baumjohann, W., Nakamura, R., Apatenkov, S., Asano, Y., Volwerk, M., Vörös, Z., Zhang, T. L., Petrukovich, A., Balogh, A., Sauvaud, J.-A., Klecker, B., and Rème, H.: Electric current and magnetic field geometry in flapping magnetotail current sheets, Ann. Geophys., 23, 1391–1403, https://doi.org/10.5194/angeo-23-1391-2005, 2005.
Sánchez-García, E., Gonzalez-Esparza, J. A., Aguilar-Rodríguez, E., and Corona-Romero, P.: Statistical study of the geoeffectiveness of CIRs during solar cycles 23 and 24, J. Geophys. Res.-Space, 129, e2023JA031685, https://doi.org/10.1029/2023JA031685, 2024.
Schwenn, R.: Space weather: The solar perspective, Living Rev. Sol. Phys., 3, https://doi.org/10.12942/lrsp-2006-2, 2006.
Smith, E. J. and Wolfe, J. H.: Observations of interaction regions and corotating shocks between one and five AU: Pioneers 10 and 11, Geophys. Res. Lett., 3, 137–140, https://doi.org/10.1029/GL003i003p00137, 1976.
Smith, E. J., Balogh, A., Neugebauer, M., and McComas, D.: Ulysses observations of Alfvén waves in the southern and northern solar hemispheres, Geophys. Res. Lett., 22, 3381–3384, https://doi.org/10.1029/95GL03268, 1995.
Souza, A., Echer, E., Bolzan, M., and Hajra, R.: A study on the main periodicities in interplanetary magnetic field Bz component and geomagnetic AE index during HILDCAA events using wavelet analysis, J. Atmos. Sol.-Terr. Phy., 149, 81–86, https://doi.org/10.1016/j.jastp.2016.09.006, 2016.
Souza, A. M.: Estudo do acoplamento vento solar-magnetosfera durante eventos HILDCAAS utilizando análise por wavelets, Doctoral dissertation, Instituto Nacional de Pesquisas Espaciais, http://urlib.net/sid.inpe.br/mtc-m21b/2015/02.10.16.57 (last access: 24 August 2026), 2015.
Souza Echer, M. P. A., Echer, E., Domingues, M., Mendes, O., Seo, R. T., and Gonzalez, W.: Wavelet analysis of low frequency magnetic field fluctuations in the Jupiter's magnetotail, Adv. Space Res., 68, 246–258, https://doi.org/10.1016/j.asr.2021.03.003, 2021.
Strugarek, A., Janitzek, N., Lee, A., Löschl, P., Seifert, B., Hoilijoki, S., Kraaikamp, E., Mrigakshi, A. I., Philippe, T., Spina, S., Bröse, M., Massahi, S., O’Halloran, L., Pereira Blanco, V., Stausland, C., Escoubet, P., and Kargl, G.: A space weather mission concept: Observatories of the solar corona and active regions (OSCAR), Proc. SPIE, 9143, 91430E, https://doi.org/10.1051/swsc/2016040, 2014.
Suess, S. T., Ko, Y.-K., von Steiger, R., and Moore, R. L.: Quiescent current sheets in the solar wind and origins of slow wind, J. Geophys. Res.-Space, 114, A04103, https://doi.org/10.1029/2008JA013704, 2009.
Sugiura, M.: Hourly values of equatorial Dst for the IGY, Annals of the International Geophysical Year, 35, 9–45, 1964.
Torrence, C. and Compo, G. P.: A practical guide to wavelet analysis, B. Am. Meteorol. Soc., 79, 61–78, https://doi.org/10.1175/1520-0477(1998)079<0061:APGTWA>2.0.CO;2, 1998.
Tsurutani, B. T. and Gonzalez, W. D.: The cause of high-intensity long-duration continuous AE activity (HILDCAAs): Interplanetary Alfvén wave trains, Planet. Space Sci., 35, 405–412, https://doi.org/10.1016/0032-0633(87)90097-3, 1987.
Tsurutani, B. T., Sugiura, M., Iyemori, T., Goldstein, B. E., Gonzalez, W. D., Akasofu, S. I., and Smith, E. J.: The nonlinear response of AE to the IMF BS driver: A spectral break at 5 h, Geophys. Res. Lett., 17, 279–282, https://doi.org/10.1029/GL017i003p00279, 1990.
Tsurutani, B. T., Gonzalez, W. D., Gonzalez, A. L. C., Tang, F., Arballo, J. K., and Okada, M.: Interplanetary origin of geomagnetic activity in the declining phase of the solar cycle, J. Geophys. Res.-Space, 100, 21717–21733, https://doi.org/10.1029/95JA01476, 1995.
Tsurutani, B. T., Gonzalez, W. D., Gonzalez, A. L. C., Guarnieri, F. L., Gopalswamy, N., Grande, M., Kamide, Y., Kasahara, Y., Lu, G., Mann, I., McPherron, R., Soraas, F., and Vasyliunas, V.: Corotating solar wind streams and recurrent geomagnetic activity: A review, J. Geophys. Res.-Space, 111, A07S01, https://doi.org/10.1029/2005JA011273, 2006.
Turner, N. E., Cramer, W. D., Earles, S. K., and Emery, B. A.: Geoefficiency and energy partitioning in CIR-driven and CME-driven storms, J. Atmos. Sol.-Terr. Phys., 71, 1023–1031, https://doi.org/10.1016/j.jastp.2009.02.005, 2009.
Turner, N. E., Mitchell, E. J., Knipp, D. J., and Emery, B. A.: Energetics of magnetic storms driven by corotating interaction regions: A study of geoeffectiveness, In Recurrent magnetic storms: Corotating solar wind streams, American Geophysical Union (AGU), 113–124, https://doi.org/10.1029/167GM11, 2006.
WDC: World Data Center for Geomagnetism, Kyoto: AE index data, World Data Center for Geomagnetism, http://wdc.kugi.kyoto-u.ac.jp/dstae/index.html, last access: 14 August 2026.