
the Creative Commons Attribution 4.0 License.
the Creative Commons Attribution 4.0 License.
 | 26 Aug 2026
Post launch spectral and radiometric performances of MAJIS, the VIS-NIR imaging spectrometer of JUICE
Yves Langevin
Sébastien Rodriguez
Sandrine Guerlet
François Poulet
Giuseppe Piccioni
Livio Agostini
Raymond Armante
Emiliano D'Aversa
Gianrico Filacchione
Leigh Fletcher
Fabrizio Oliva
Clément Royer
Benoît Seignovert
Katrin Stephan
Federico Tosi
Tim Trent
The post-launch spectral and radiometric performances of MAJIS, the VISNIR imaging spectrometer of the ESA Jupiter Icy Moon Explorer (JUICE), have been evaluated using observations performed during the Lunar-Earth Gravitational Assist (LEGA) of 19–20 August 2024 and observations of the Internal Calibration Unit (ICU). Observations of the Earth provided a comprehensive check of the spectral performances taking advantage of narrow atmospheric absorption bands over the full wavelength range of MAJIS (0.5–5.56 µm). This was of particular interest for wavelengths larger than 3.5 µm due to limitations of the ground calibration setup in this wavelength range. The radiometric performance of MAJIS has been reassessed considering the updated spectral calibration and the comparison of ICU observations before and after launch. On this basis, the observations of the Earth and Moon by MAJIS were compared to that of other instruments. The very good agreement with atmospheric spectral features observed by Earth observation instruments validate the updated spectral calibration of MAJIS. Comparing radiances for the Earth is not straightforward due to the very specific photometric angles for MAJIS observations (phase ∼ 90°, “glint spot”) and the high time variability of cloud patterns. A good agreement has been obtained within these limitations and the MAJIS radiance evaluations for the Moon are also consistent with that obtained by instruments on lunar orbiters, which indicates that the post-launch absolute radiometric calibration of MAJIS is close to the mark. These comparisons benefited from the high quality of the MAJIS data obtained during the LEGA with a very high operability and a signal to noise ratio (SNR) up to 400 (more with stacking). Extrapolating the operating conditions at 1 AU to those at 5 AU confirm that MAJIS will obtain high quality data during the science operations phase around Jupiter.
- Article
(4679 KB) - Full-text XML
- BibTeX
- EndNote


The Jupiter Icy Moon Explorer mission of ESA (JUICE) will investigate the Jupiter system during a 3.3 years long tour before an orbital phase around Ganymede with a duration of nearly 1 year. MAJIS is the VIS-NIR imaging spectrometer of the JUICE mission. The science objectives, design and performances of MAJIS have been presented in Poulet et al. (2024). MAJIS covers a spectral range from 0.5 to 5.56 µm with two channels: the VISNIR channel (0.495–2.35 µm) and the IR channel (2.28–5.56 µm) each with up to 640 spectral samples.
The results of the on-ground calibration of MAJIS have been presented in Langevin et al. (2024) for the radiometric calibration, Haffoud et al. (2024) for the spectral calibration and Filacchione et al. (2024) for the spatial calibration. In this article, we present an updated spectral calibration and instrument transfer function on the basis of post-launch observations which revealed relatively minor changes in terms of performances. Two data sets have been used for investigating the post-launch evolution of these performances:
-
Observations of the Moon and the Earth during a double flyby (Lunar Earth Gravitational Assist, LEGA hereafter) performed in August 2024 (minimum altitude: 750 km for the Moon, 6100 km for the Earth). The Earth atmosphere exhibits narrow spectral lines over the whole spectral range of MAJIS, and complementary information can be obtained from narrow absorption lines in the solar spectrum which can be observed by MAJIS in lunar reflectance spectra as they do not present very narrow absorption features. These flybys provide a highly valuable new dataset for in-flight calibration, as reported in this article, as well as for scientific investigations (Poulet et al., 2026; Guerlet et al., 2026; Oliva et al., 2026; D'Aversa et al., 2026; Tosi et al., 2026). A detailed description of the datasets is provided in Poulet et al. (2026).
-
Observations with the internal calibration unit (ICU, Stefani et al., 2025). The ICU implements two light sources: a quantum tungsten halogen lamp (QTH) for wavelengths ranging from 0.5 to 4 µm and a black body (BB) for wavelengths covered by the IR channel (2.27 to 5.55 µm). ICU observations have been performed as part of the ground calibration, during the Near-Earth Commissioning Phase (NECP) and for each passive check-out (every six months during cruise).
The updated spectral calibration obtained by comparing MAJIS spectra with models of the Earth atmospheric signatures is presented in Sect. 2. Post-launch evolutions have also been identified for the spatial and radiometric calibration, which are presented in Sect. 3.
In Sect. 4, the MAJIS radiance spectra of the Moon and the Earth as derived from the updated spectral calibration of Sect. 2 and the updated radiometric calibration of Sect. 3 are compared with the multi-band images obtained by JANUS (the imaging camera of JUICE) in August 2024 and the radiance spectra of the Moon and Earth obtained by other multi-band imagers and imaging spectrometers. High quality comparisons of the spectroscopic and radiometric performances were made possible by the high to very high SNR (up to 450 for single spectra) obtained by MAJIS for observations of the Earth and Moon. Companion articles in the special issue of Annales Geophysicae dedicated to JUICE observations of the Earth and Moon present in more details the comparisons with two Earth observation instruments, IASI (Guerlet et al., 2026) and PRISMA (Oliva et al., 2026).
The comparisons of radiometric performances are not straightforward for the Moon due to the very specific photometric angles of the MAJIS observations (see Poulet et al., 2026) and even more so for the Earth due to the time variability of the cloud cover when it was not possible to identify matching observations in time and location. It is more reliable for wavelengths larger than 3 µm for which radiances are dominated by thermal emission. Additional checks can be obtained by comparing the brightness temperatures of the lunar surface as derived from MAJIS with that predicted by models as discussed in Tosi et al. (2026).
The spectral capabilities of MAJIS have been estimated during the on-ground calibration campaign (Haffoud et al., 2024; Rodriguez et al., 2024) and for a set of post-launch measurements using the internal calibration unit (Haffoud et al., 2024), allowing for the evaluation of the absolute spectral calibration of the MAJIS VISNIR and IR channels (i.e. the central wavelength, CWL), spectral response (i.e. the Full Width at Half-Maximum, (FWHM) of the gaussian-like response function of the spectral channels) and smile (spectral aberrations across the spatial dimension). On-ground monochromator scan series, completed by the use of atmospheric absorptions, ICU measurements and solid samples' observations, allowed Haffoud et al. (2024) to accurately derive the CWL, FWHM and smile for a few narrow wavelength ranges in the VISNIR and IR (more numerous in the VISNIR than in the IR), at a few specific MAJIS slit positions (20, 200 and 380). These results were interpolated and generalized down to the physical pixel level in both the spatial and spectral dimensions to provide reference spectral tables (CWL and FWHM) and 2D maps of the smile (as a function of the 800 slit positions and 1016 wavelengths) in the VISNIR and IR. Rodriguez et al. (2024) complemented on-ground spectral calibration evaluations by using the MAJIS acquisition of spectra of a reference spectralon (“Pink Spectralon”, Rodriguez et al., 2024), providing new constraints on the CWL and smile at 3 positions in the MAJIS FOV with high spectral sampling thanks to the numerous and sharp absorption signatures in the visible and near-infrared spectrum of the Pink Spectralon. Due to operational limitations, these measurements were limited to the 0.4–3.0 µm spectral region, hence mostly in the VISNIR channel.
Haffoud et al. (2024) identified a post-launch spectral shift (∼ 3.8 nm for the VISNIR channel, ∼ 5.4 nm for the IR channel) with respect to on-ground calibration results by comparing pre-launch and post-launch observations of absorption features of the didymium (VISNIR) and polystyrene (IR) filters of the ICU sub-system. A similar spectral shift was observed over the full FOV for the wavelengths corresponding to these absorption features (0.6 to 0.9 µm for didymium, 3.15 to 3.5 µm for polystyrene), so that there was no evidence for a post-launch evolution of the smile. Therefore, the spectral calibration was adjusted by adding 3.8 nm (VISNIR) and 5.4 nm (IR) to the central wavelengths corresponding to each MAJIS data element.
Observations of the Earth during the LEGA are particularly interesting for spectral calibration as there are many narrow spectral atmospheric signatures distributed over nearly the full spectral range of the VISNIR and IR channels. The Earth observations made it possible to evaluate the post-launch CWL, the FWHM and smile over the full wavelength range of each channel, providing a check of the validity of extrapolating the spectral shift identified by Haffoud et al. (2024) over narrow spectral ranges (one for each channel) to other wavelengths. In the following, the results on the CWL and smile are expressed as spectral residuals with respect to the post-launch absolute spectral calibration from Haffoud et al. (2024).
2.1 Absolute spectral calibration and spectral smile in the MAJIS VISNIR and IR ranges with LEGA data
2.1.1 Comparison with the 4A/OP radiative transfer model
The absolute spectral calibration of the MAJIS VISNIR and IR channels has first been checked by comparing MAJIS observations of the Earth to reference radiance spectra simulated by a state-of-the-art radiative transfer model, the Automatized Atmospheric Absorption Atlas Operational (4A/OP) model. The model has been updated on a regular basis since its very first concept (Scott and Chedin, 1981; Cheruy et al., 1995). 6 MAJIS dayside cubes were selected among the 19 Earth's observations of MAJIS performed during the Earth flyby of August 2024, 3 for the VISNIR spectral calibration and 3 for the IR spectral calibration (Table 1). For these cubes, the CWL at different locations of the FOV has been derived on the basis of the spectral smile measured during the on-ground calibration campaign, following the conclusions of Haffoud et al. (2024). The 6 selected dayside cubes have been chosen to optimize the spatial coverage over the MAJIS slit. Then, for each cube, we selected an across-slit row (across-slit positions in Table 1) and, within this row, a series of along-slit pixels (along-slit positions in Table 1), selected to be free of clouds and with no major impact of the glint spot (solar specular reflection). The 4A/OP model was used to simulate visible and near-infrared spectra under geometrical conditions (incidence, emission and azimuth angles) and environmental conditions (temperature and pressure profiles, gaseous abundances, potential presence of aerosols and/or of wind-driven waves for pixel above the ocean) as close as possible to those of MAJIS spectra. A description of the 4A/OP model and how it was adapted to Earth's MAJIS observations with the IR channel can be found in Guerlet et al. (2026).
The 4A/OP model has been recently adapted to VISNIR wavelengths. We selected for this work a bi-directional reflectance function (BRDF) adapted to the ocean, considering solar absorption lines. Keeping pixels from the same row of a given cube allows for the geometry of observation and environmental parameters to vary by only a few %. In these conditions, we verified that using one 4A/OP run of simulation per selected cube/raw is a reasonable choice and provide sufficient accuracy for the purpose of spectral calibration. Figure 1 presents examples of Earth's MAJIS spectra extracted from two different cubes in the VISNIR and IR channels with respect to their corresponding 4A/OP simulations. The radiative transfer simulations are in good overall agreement with the MAJIS observations. However, the 4A/OP synthetic spectra underestimate the radiance by factors of up to 10 within strong water absorption bands (e.g. at 1.9 µm). This can result from an issue with the selected BRDF or from contamination by aerosols, which has not been considered. There is no impact on the post-launch spectral calibration which is the focus of this section as a wider BRDF or a contamination by aerosols results in a larger radiance in nearly saturated absorption bands without changing their wavelength.
Table 1List of MAJIS observations of the Earth and selected spatial and spectral pixels used for the absolute spectral calibration of the MAJIS VISNIR and IR channels. The full list of MAJIS Earth observations with all their characteristics is presented in Table 1 of Poulet et al. (2026).
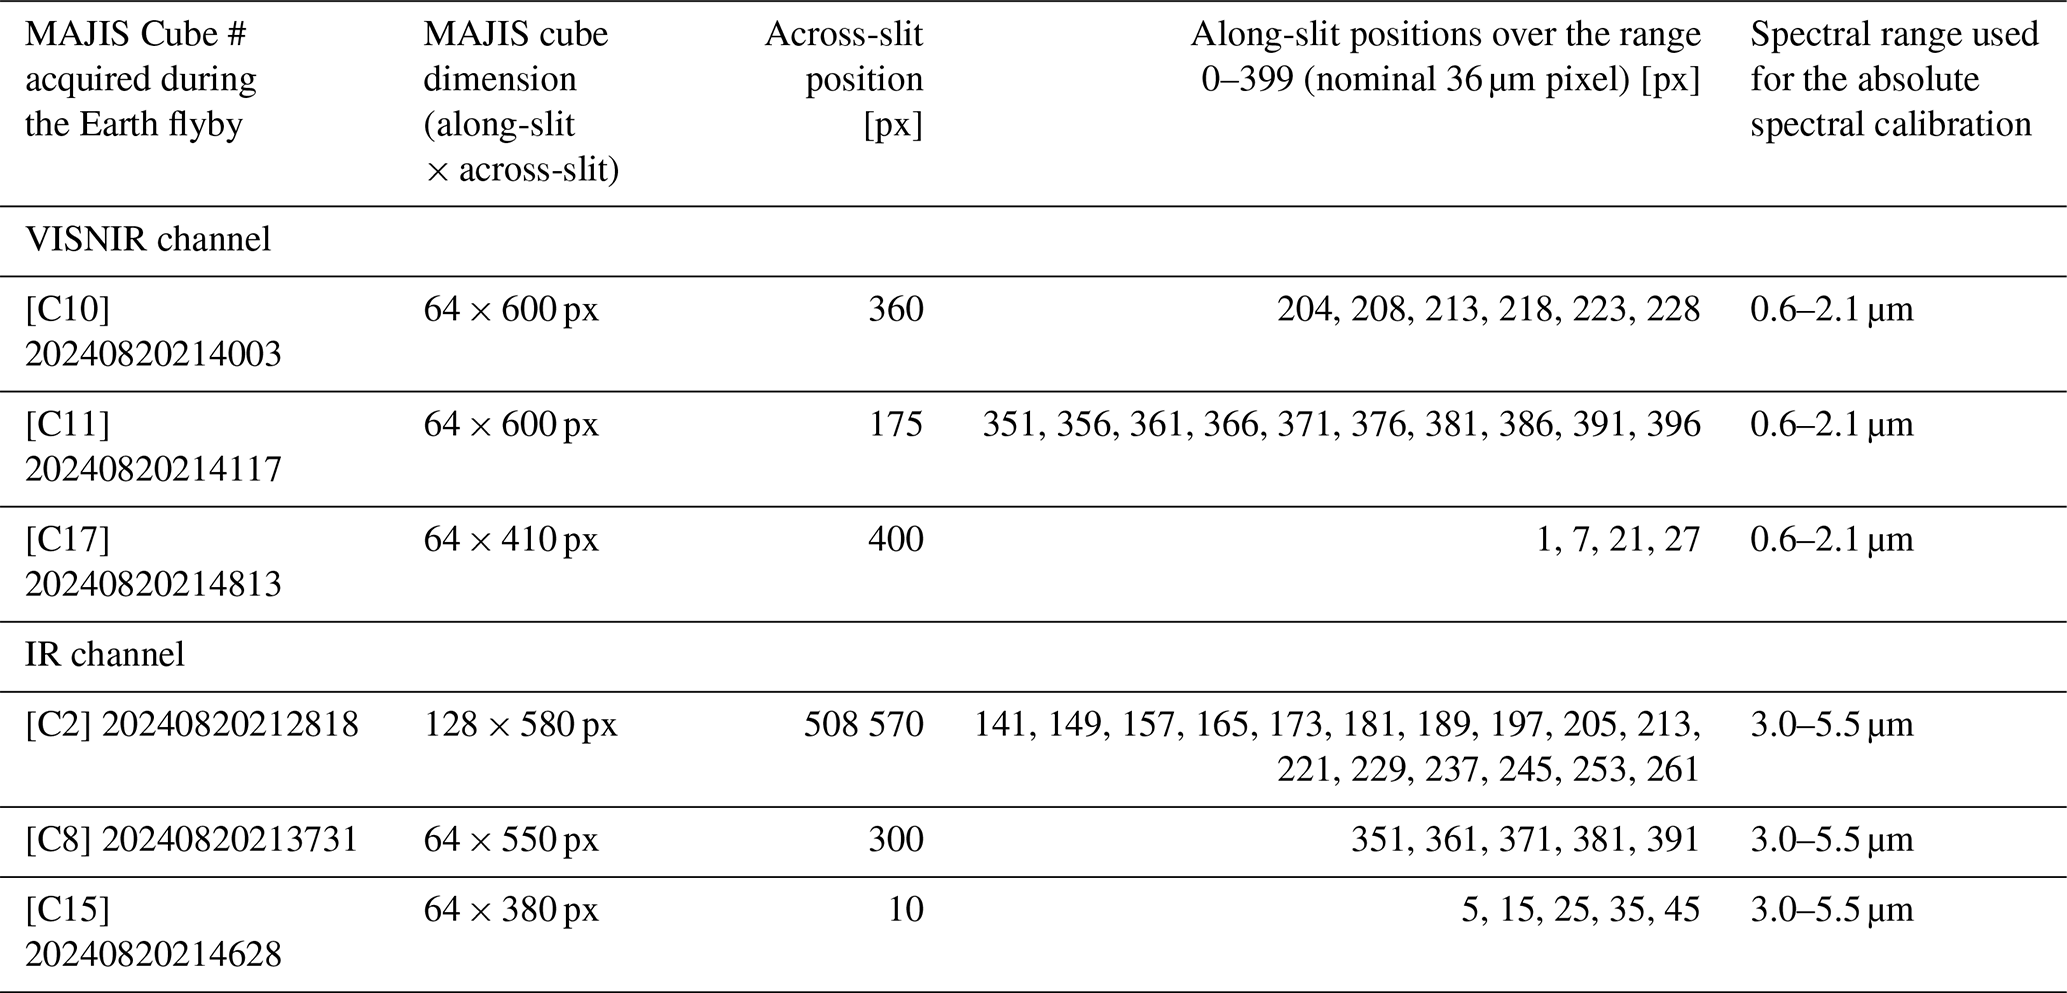
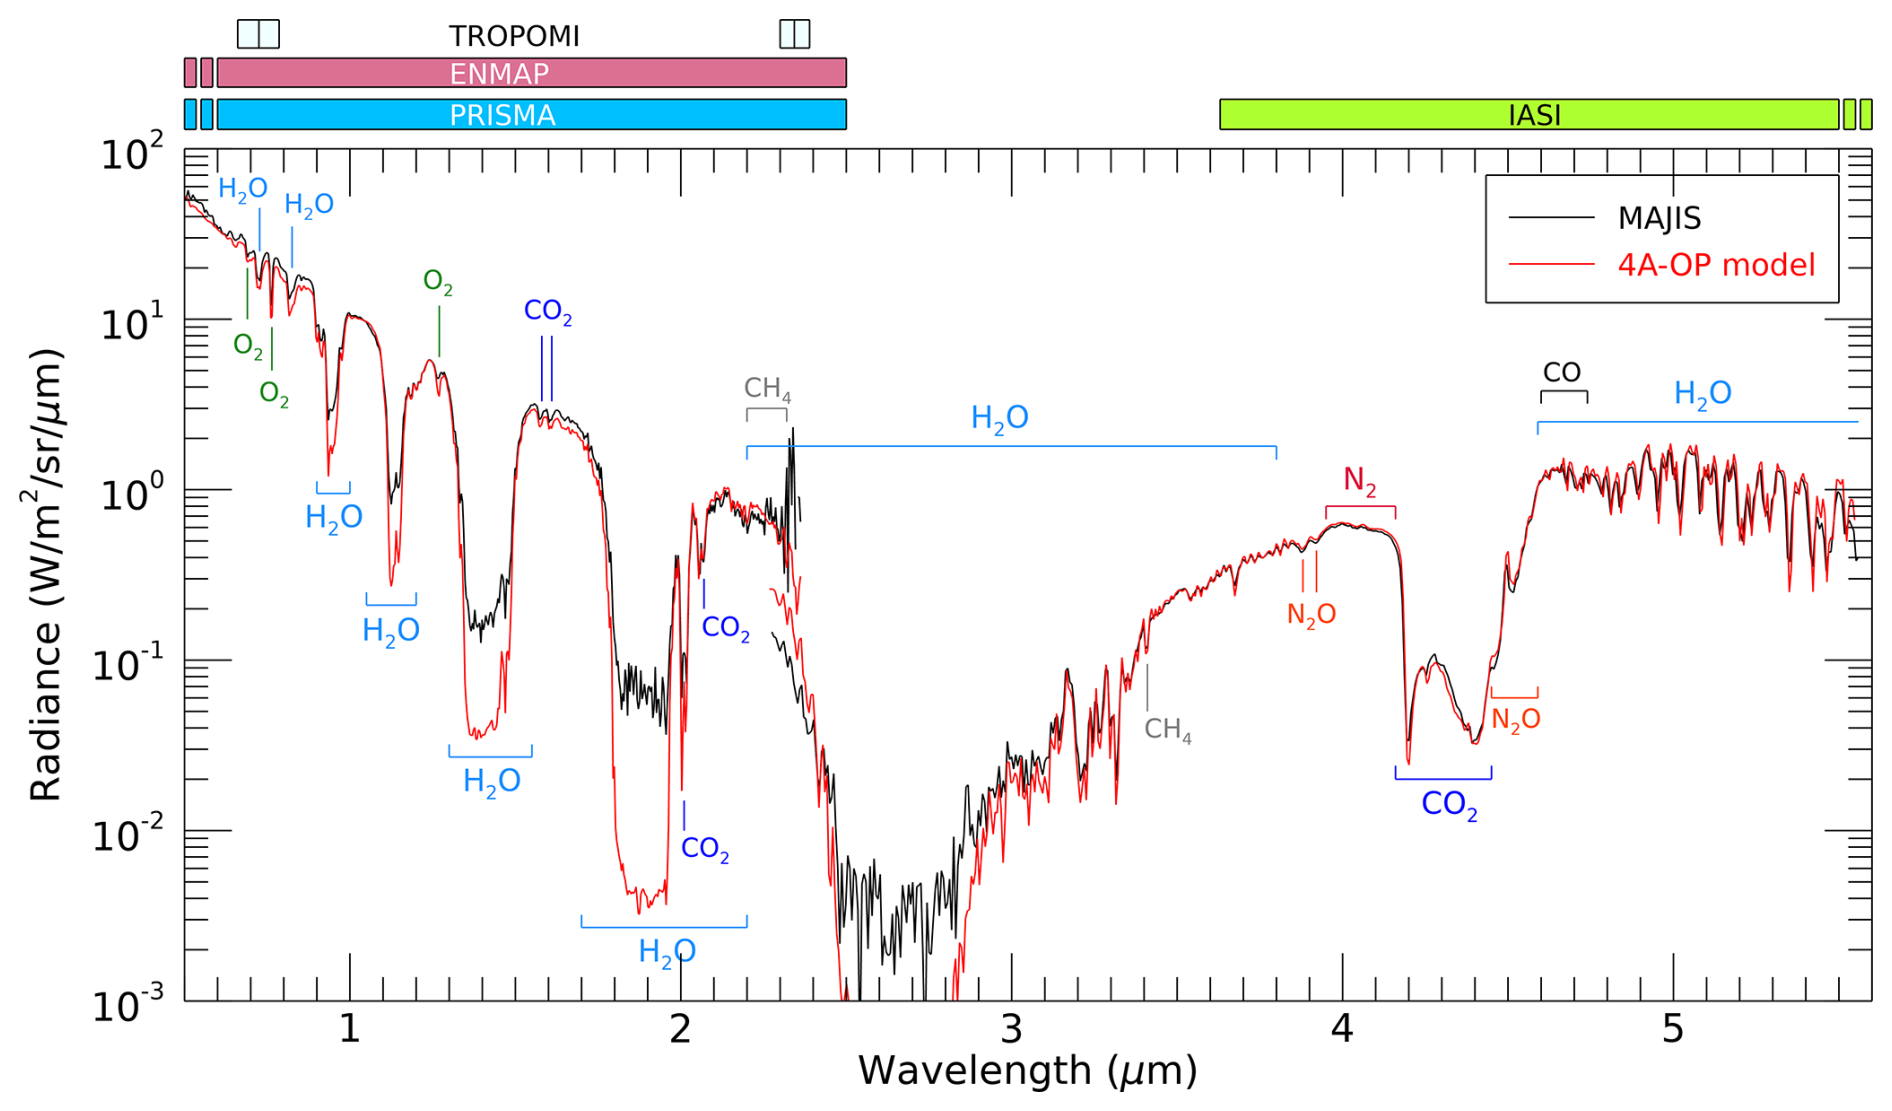
Figure 1MAJIS VISNIR spectrum extracted from cube C17 (#20240820214813, pixel [42,400]) and MAJIS IR spectrum extracted from cube C15 (#20240820214628, pixel [20,10]) compared to radiative transfer simulations from the 4A/OP model specific to the observational and atmospheric conditions of the VISNIR and IR spectra (see text for details). Main atmospheric gaseous absorptions and the spectral ranges/operating bands of the PRISMA, TROPOMI, ENMAP and IASI instruments used for comparison with MAJIS in this section and in Sect. 4 are also indicated. The main focus is on the wavelength of spectral absorption features as their strength depend on spatially variable column densities.
With the use of accurate 4A/OP simulations and thanks to the presence of numerous distinctive gaseous absorptions from the Earth's atmosphere in the MAJIS spectral range (O2, H2O and CO2 in the VISNIR channel, H2O, CH4, N2O, CO2 and CO in the IR channel – see Fig. 1), we were able to evaluate the MAJIS absolute spectral calibration (CWL position) with a fine spectral sampling in the VISNIR and IR channels for the 6 cubes and each of the slit positions listed in Table 1, following the methodology of Rodriguez et al. (2024). Each MAJIS spectrum has been directly compared with its corresponding 4A/OP simulation convolved at the spectral resolution of MAJIS and interpolated on the reference MAJIS wavelengths grids. The residual between the MAJIS and reference 4A/OP spectra has been evaluated by maximizing the correlation between both spectra within a sliding window of a given spectral width over the MAJIS VISNIR and IR spectral ranges with a one-spectel step. The same calculations have been performed with 5 sliding window widths (40, 50, 60, 70 and 80 spectels) for assessing the robustness of the spectral residuals. The final values of the spectral residuals and their associated uncertainties have been obtained from the median residual and the standard deviation of the residuals estimated for the 5 sliding window widths. Taking advantage of the fine spectral sampling and decent spatial sampling, we obtained complete 2D maps of the residuals for both the VISNIR and IR channels by bilinear 2D interpolation over all MAJIS wavelengths and slit positions (Fig. 2). From these residual maps, we could directly calculate new CWL grids and spectral smiles at higher spectral and spatial samplings than that presented in Haffoud et al. (2024) and Rodriguez et al. (2024), with complementary information on spectral and spatial domains where they could not be evaluated during ground calibration. These correlations fail for a few spectral regions where no spectral features are available or where noise dominates. Since residuals have a relatively smooth dependence on wavelength, filtering out values which are more than one standard deviation away from the values interpolated from well behaved neighbor spectral ranges made it possible to safely remove all the outliers (see Fig. 2).
The residuals and smile maps presented in Fig. 2 for the MAJIS VISNIR channel show that the absolute spectral calibration (CWL) provided by Haffoud et al. (2024) is extremely robust and that the extrapolation to the full VISNIR spectral range of the spectral shift of 3.8 nm observed for Didymium absorption features (0.6 to 0.9 µm) is legitimate at the nanometer level. The residuals evaluated from the MAJIS Earth cubes which are needed to reconcile MAJIS observations with Earth's reference spectra (Fig. 2, panels a, b) range from −1.5 and +2 nm for the CWL and −1 and +1 nm for the smile, well within the uncertainties of the retrievals (Fig. 2, panel c). We can therefore consider that no further correction is needed for the absolute spectral calibration of the VISNIR channel.
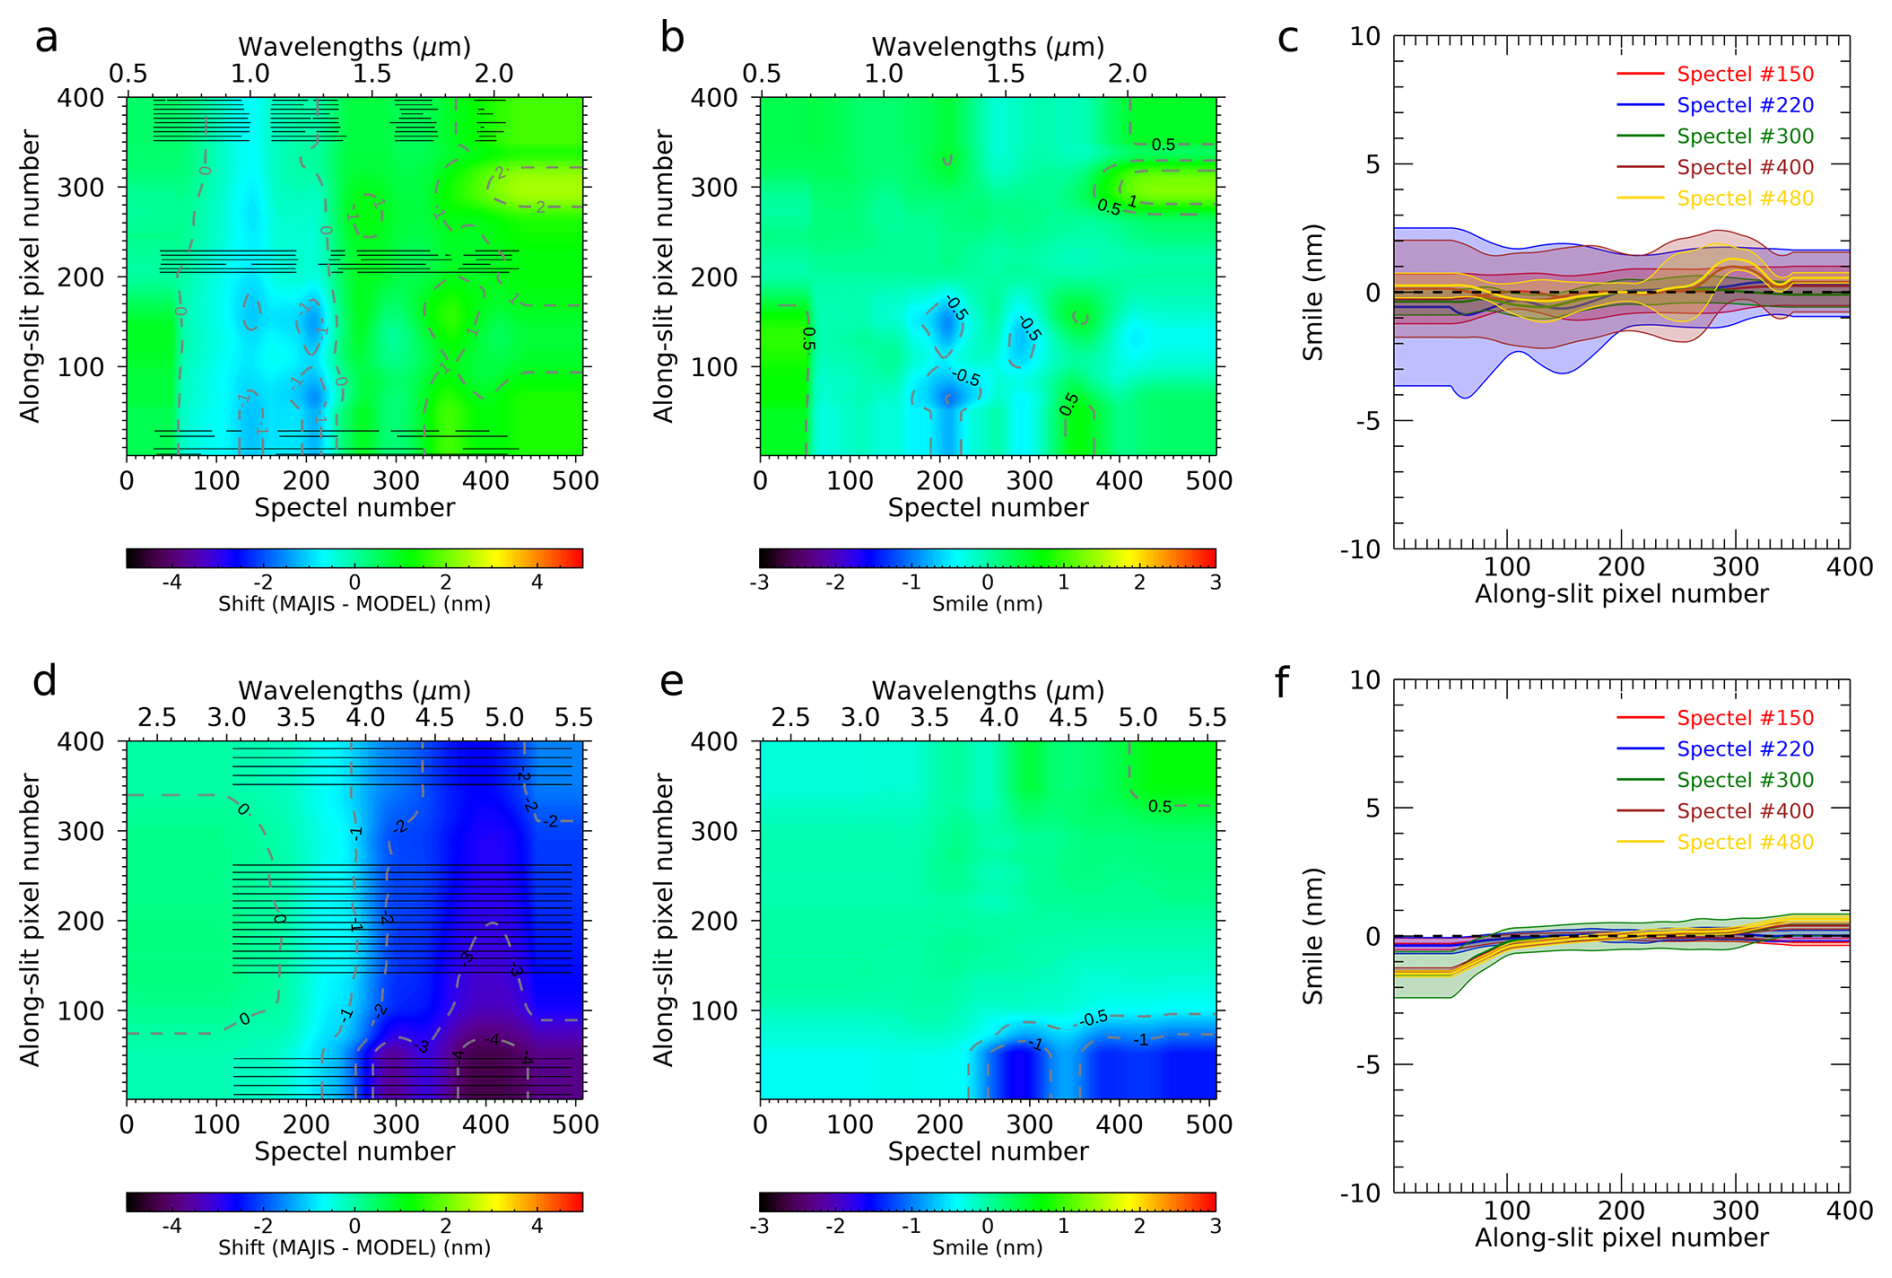
Figure 2Panel (a): Map of the spectral residual (in nm) between MAJIS and reference 4A/OP simulated spectra for the VISNIR channel, as a function of the nominal spectel number (the corresponding wavelengths are indicated on the upper axis) and slit positions in units of nominal pixels; Panel (b): Same as (a) but for the VISNIR smile effect (in nm), i.e. the spectral residual at a given location and wavelength when compared to the central slit position, #200); Panel (c): Selection of transects through the smile map in (b) for spectels #150, 220, 300, 400 and 480, with their respective 1σ-uncertainty envelope. Panels (d), (e) and (f): Same as panels (a), (b) and (c) for the MAJIS IR channel. In panels (a) and (d), black lines designate the actual spectral and spatial pixels used for the residual retrievals after removal of the outliers (see text for details). The maps showed in panels (a), (b), (d) and (e) have been obtained by bilinear 2D interpolation and smoothed by an averaging [50 spectels × 50 pixels] 2D boxcar.
For the IR channel, there are numerous and narrow atmospheric absorption bands over nearly the entire wavelength range. Therefore, the results on the CWL present only few outliers before interpolation between the black lines in Fig. 2, panel (d) and the uncertainties are very low for both the CWL (Fig. 2, panel d) and the smile (Fig. 2, panel e).
Similarly to the VISNIR channel, the residuals at wavelengths shorter than 3.5 µm (IR spectel 210) are close to 0 within the uncertainty margins for both CWL and smile. This validates in this spectral range the post-launch absolute spectral calibration from Haffoud et la. (2024) which assumed that the spectral shift after launch (+5.4 nm) observed with polystyrene bands (3.15 to 3.5 nm) also applied down to 2.28 µm (lower limit of the IR wavelength range).,
For wavelengths larger than 3.5 µm, the residuals are significant with respect to the nominal sampling (6.5 nm), down to −4.5 nm with an average value of −4 nm (see Fig. 2.e). This means that at long wavelengths the post-launch shift when compared to the outcome of the ground calibration is only ∼ 1.5 nm on average. The smile map and transects (Fig. 2e and f) show that at long wavelengths it is close to that evaluated during ground calibration except for pixels 0 to 100, where the residuals reach −1.5 to −2 nm and to a lower extent for pixels 350 to 400 at very long wavelengths (5 to 5.56 µm) with residuals ranging from 0.5 to 1 nm. At these wavelengths, the smile from the left edge to the right edge of the FOV is therefore up to 3 nm larger than estimated during calibration. These discrepancies were to be expected as no direct measurement of the CWL at long wavelengths was available due to calibration set-up limitations so that the absolute spectral calibration at these wavelengths was mostly extrapolated. Therefore, for wavelengths > 3.5 µm, reliable post-launch reference tables for the CWL across the FOV at the nominal MAJIS resolution (400 pixels and 508 spectels) have been obtained by adding the measured residuals to the previous tables for an optimum match of Earth atmosphere spectral features. They will be used in an updated version of the MAJIS pipeline so as to regenerate the MAJIS radiance cubes for Moon and Earth observations in August 2024 at wavelengths > 3.5 µm. This updated pipeline will be used for new observations during cruise, in particular observations of comet 31/ATLAS (data available in February 2026) followed by Earth and Moon observations during the second Earth flyby (September 2026) which will provide additional checks of the absolute spectral calibration of MAJIS.
2.1.2 Comparison with Earth's observations from the PRISMA mission and IASI instrument
The PRISMA (Hyperspectral Precursor of the Application Mission) mission and IASI (Infrared Atmospheric Sounding Interferometer) instrument onboard the MetOp (Meteorological Operational) satellite – both Earth's monitoring missions, performed observations close in time and location to the Earth's observations recorded by MAJIS during the LEGA maneuvers. PRISMA is an hyperspectral imager with 233 bands at a spatial resolution of 30 m on a swath of 30 km and with a spectral resolution better than 12 nm in a spectral range of 0.4–2.5 µm. IASI is a Fourier transform spectrometer recording spectra from 645 to 2760 cm−1 (3.62–15.5 µm) at 0.25 cm−1 spectral sampling, and 0.5 cm−1 resolution after apodisation. Complete descriptions of PRISMA and IASI instruments and concomitant and collocated observations with MAJIS can be found in Oliva et al. (2026) and Guerlet et al. (2026), respectively.
An additional check of the MAJIS absolute calibration has been made with PRISMA and IASI observations performed at nearly the same time and locations as the MAJIS observations, which has been compared with the results obtained with the 4A/OP model (see Sect. 2.1.1).
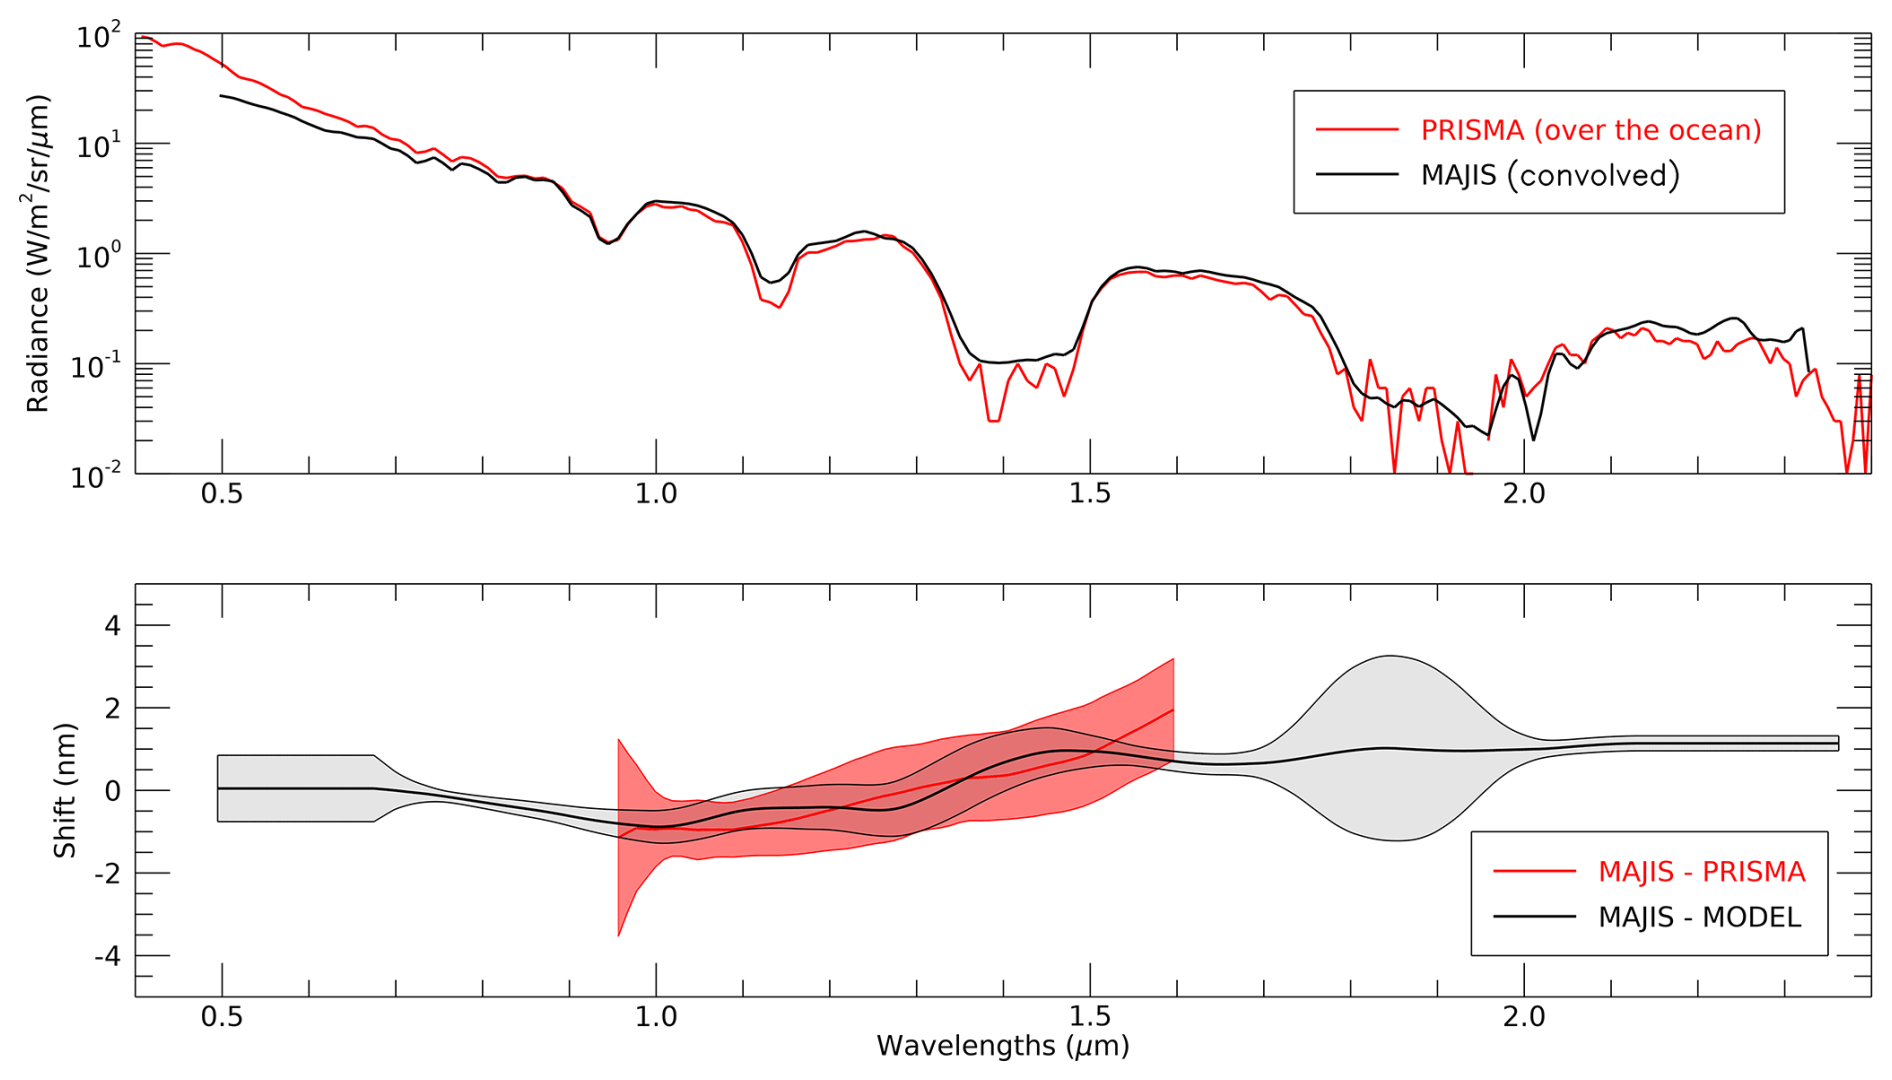
Figure 3Top panel: Best collocated and concomitant PRISMA spectrum (red) and MAJIS VISNIR spectrum (black). The observations are both over the Earth's ocean; bottom panel: Spectral residuals between the MAJIS and PRISMA spectra presented in the top panel are shown in red with their 1σ-uncertainties envelop. The spectral residuals with respect to the 4A/OP radiative transfer model for the same MAJIS pixel (from Fig. 2a) are shown in black with their 1σ-uncertainties envelop for comparison.
Figure 3 (top panel) shows a direct comparison between PRISMA and MAJIS VISNIR spectra recorded over Earth's ocean (i.e. extracted from a cloud-free pixel), close in time and location. The MAJIS spectrum has been extracted from cube C10 (#20240820214003, frame 321, pixel 31 of a 64 pixels window corresponding to pixel 199 of the MAJIS FOV). Is has been convolved and interpolated at the PRISMA spectral resolution and sampling. Since PRISMA has a lower spectral resolution than the MAJIS VISNIR channel, we convolved the MAJIS VISNIR spectrum at the PRISMA spectral resolution and interpolated it on the PRISMA wavelengths grid. Figure 3 (bottom panel) presents the estimation of the spectral residual between the MAJIS and PRISMA spectra, using the same methodology as that presented in Sect. 2.1.1. This spectral residual is compared with that estimated from the 4A/OP model in Sect. 2.1.1, extracted from Fig. 2a for the MAJIS pixel (199) collocated with the selected PRISMA observation. In the 0.95–1.6 µm range, the match between the two sets of residuals with PRISMA and the 4A/OP model is excellent. At wavelengths shorter than 0.9 µm, there are no strong spectral features and for wavelengths larger than 1.7 µm, the SNR of PRISMA spectra is low for deep absorption bands.
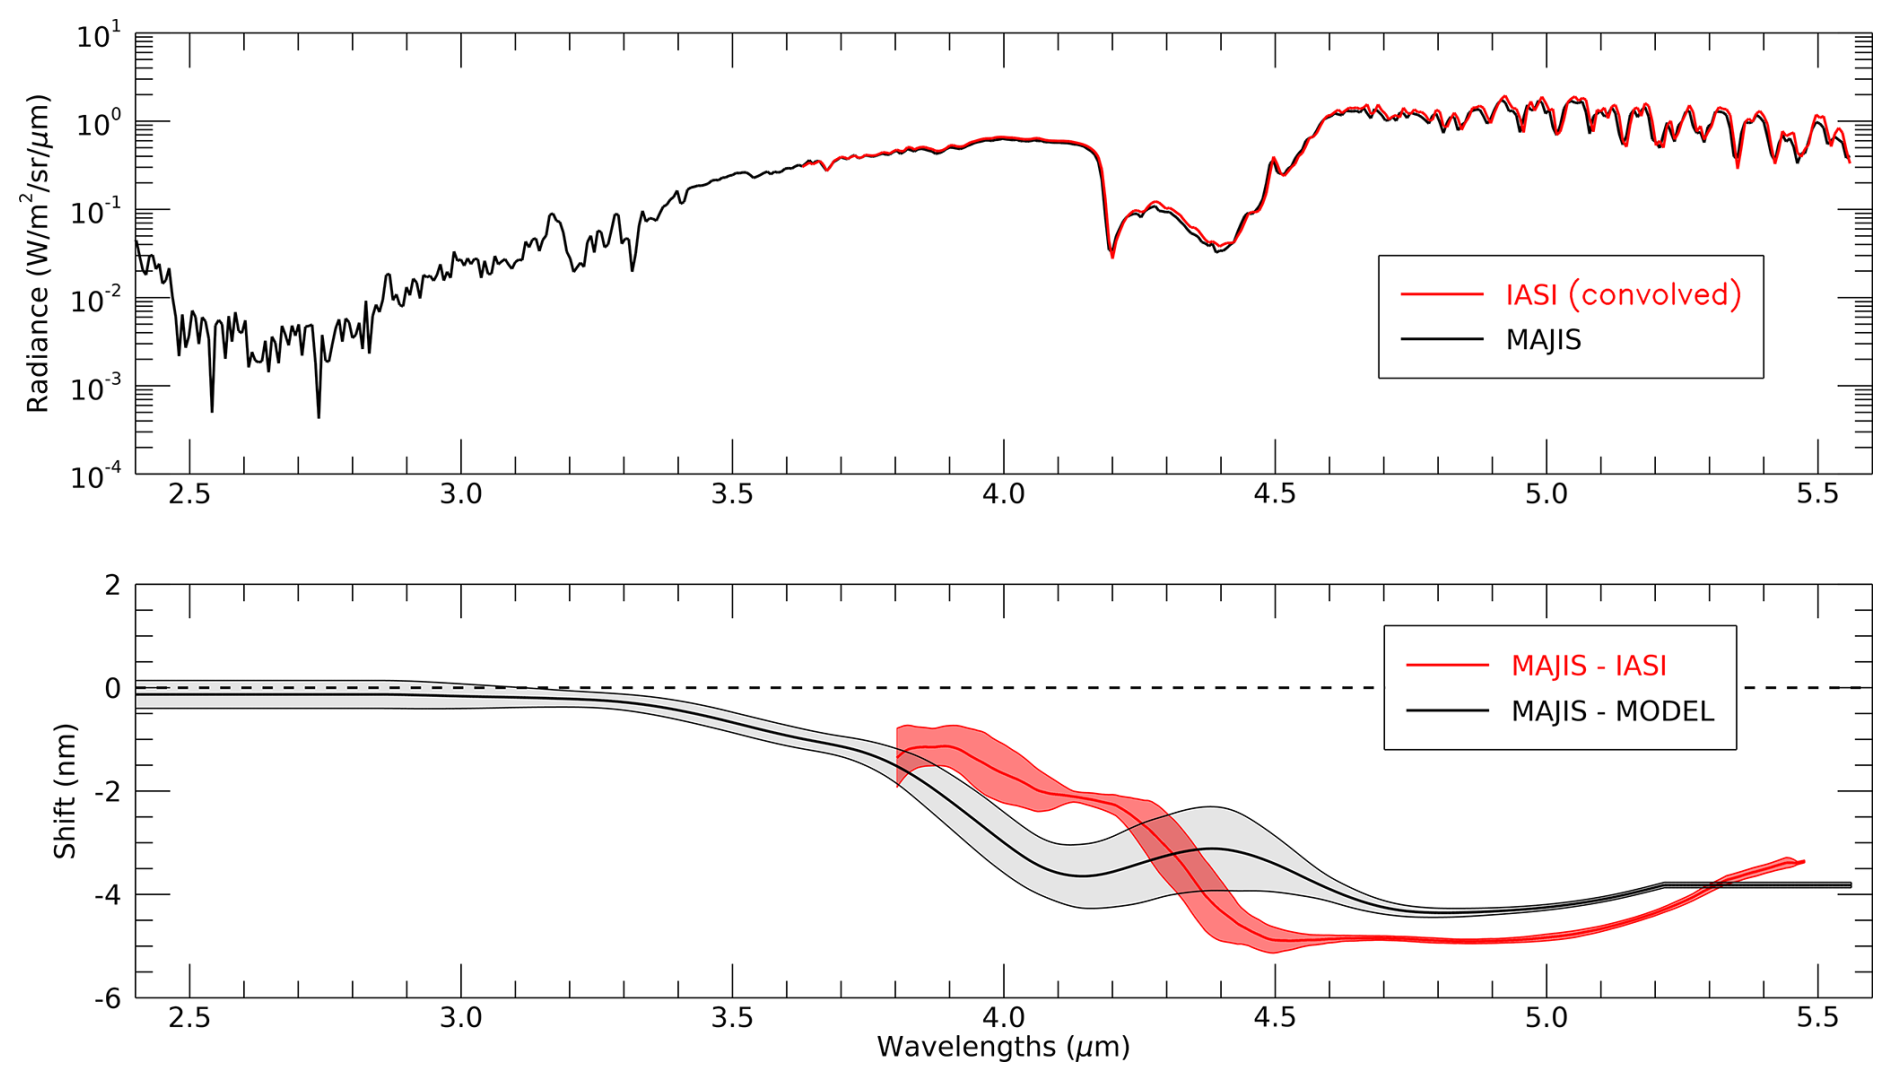
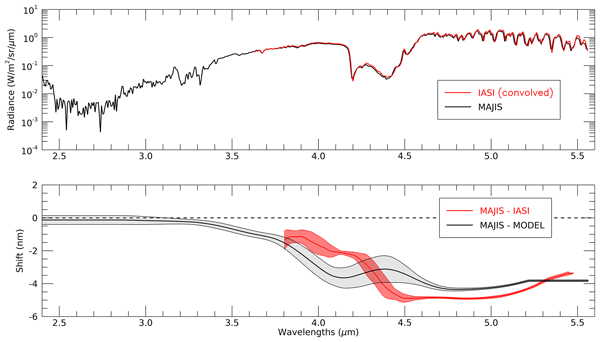
Figure 4Top panel: Best collocated and concomitant IASI spectrum (red) and MAJIS IR spectrum (black); bottom panel: The spectral residuals between the MAJIS and IASI spectra (presented in the top panel are shown in red with their 1σ-uncertainties envelop). The spectral residuals with respect to the 4A/OP radiative transfer model for the same MAJIS pixel (from Fig. 2d) are shown in black with their 1σ-uncertainties envelop for comparison.
We performed the same complementary analysis in the MAJIS IR channel with a IASI spectrum. Figure 4 (top panel) shows a comparison between IASI and MAJIS IR spectra as close as possible in time and location. The collocated MAJIS spectrum was extracted from the cube C15 (#20240820214628) at pixel positions 20 along-slit and 10 across-slit, corresponding to the position 5 in the MAJIS slit (in nominal pixels). IASI has a much higher spectral resolution than the MAJIS IR channel. We thus convolved the IASI spectrum to the MAJIS IR spectral resolution and interpolated it on the MAJIS IR reference wavelength grid provided before launch by Haffoud et al. (2024). We show in Fig. 4 (bottom panel) the resulting estimation of the spectral residual between the MAJIS and IASI spectra using the same methodology than in Sect. 2.1.1. This spectral residual is compared with that estimated with respect to the 4A/OP model, extracted from Fig. 2.d for the MAJIS pixel collocated with the IASI observation. Over the overlapping spectral range, the discrepancies between the two independently estimated sets of spectral residuals never exceed 1.5 nm to be compared with a MAJIS nominal spectral sampling of 6.5 nm.
2.2 Spectral response of the IR channel at the nominal spectral pixel level
The observations of the Earth performed in August 2024 provided an opportunity to test the spectral response of the MAJIS instrument, notably the spectral width (FWHM) and to compare it with on-ground calibration (Haffoud et al., 2024) in order to evaluate the evolution after launch and the compliance with the scientific requirements.
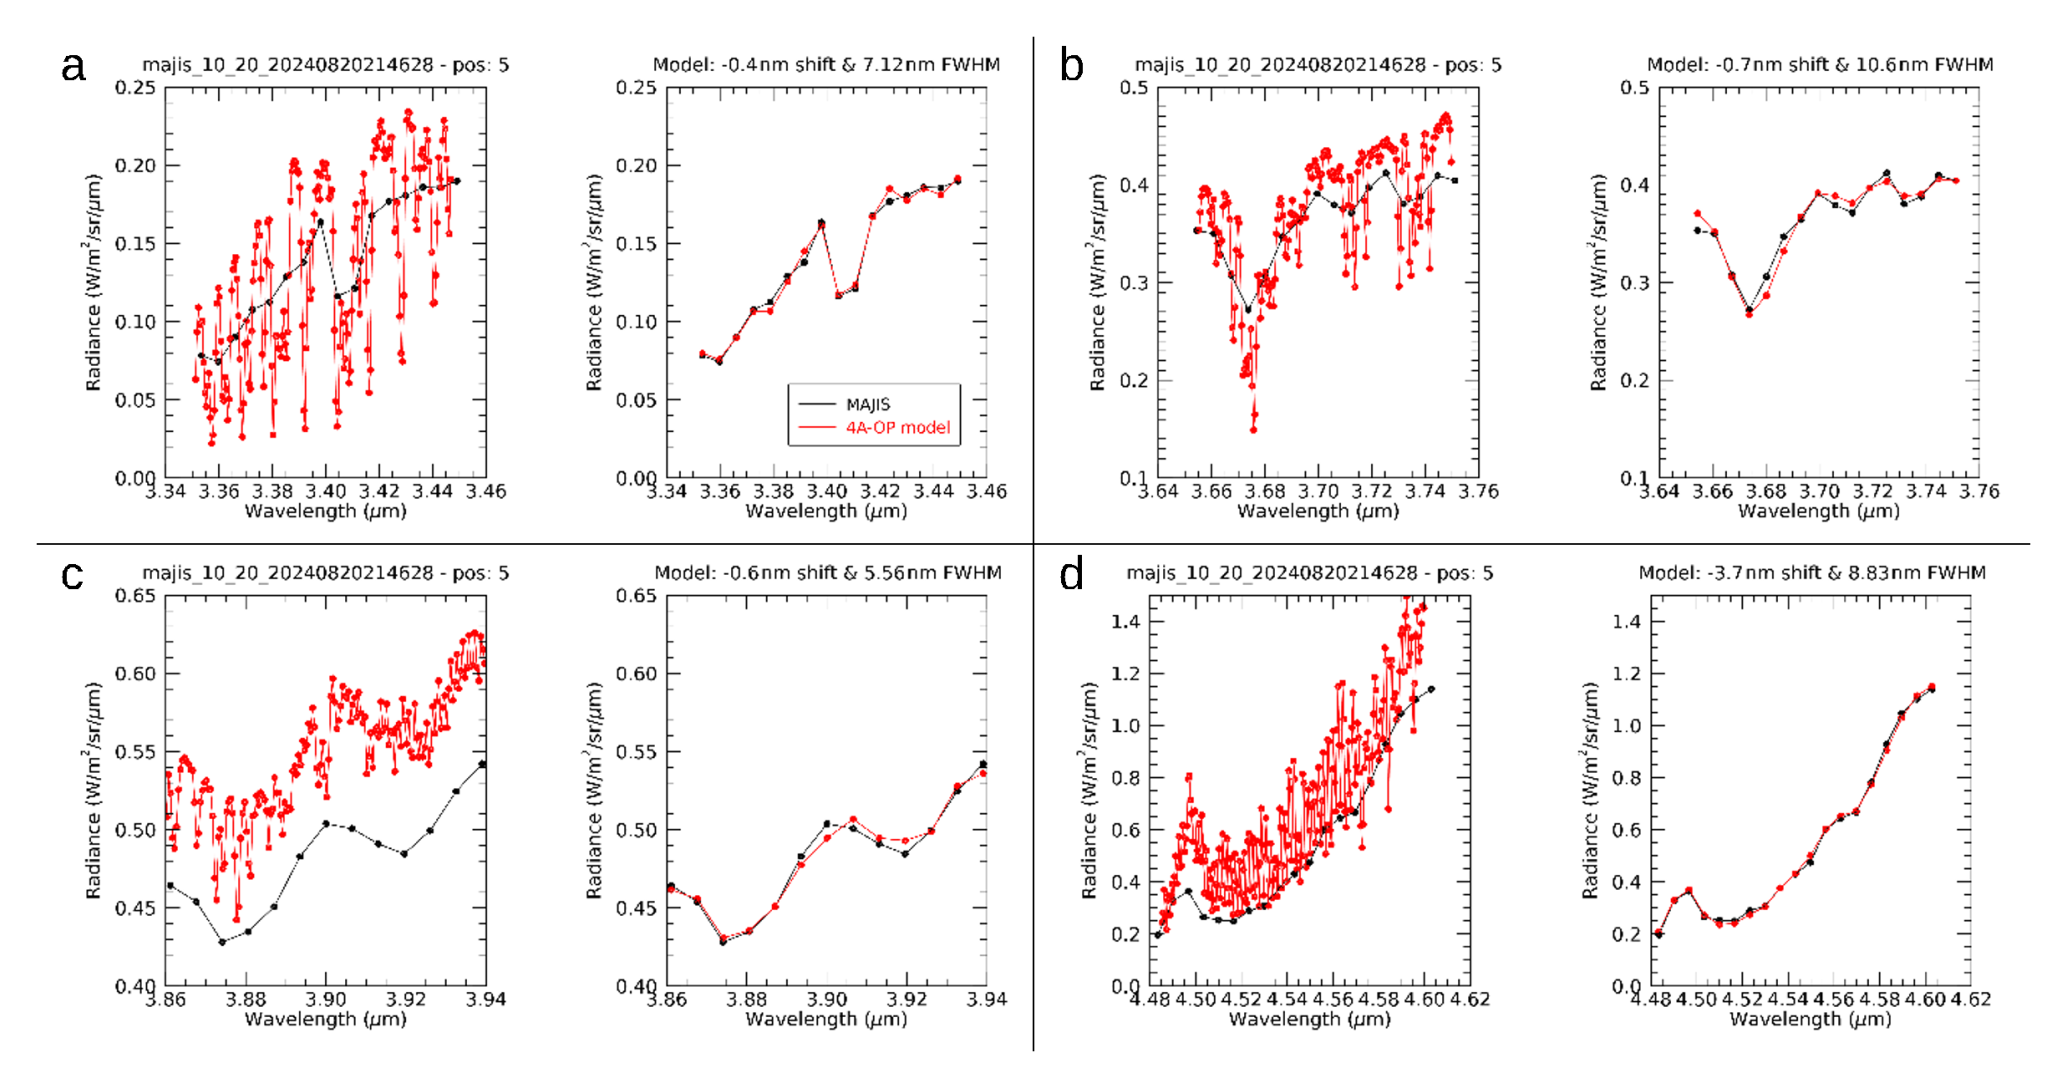
Figure 5Examples of simultaneous retrievals of the spectral residual and the spectral width (FWHM) in 4 spectral ranges within the MAJIS IR channel, for the position 5 (in nominal pixels) of the MAJIS slit. Each spectral range includes a specific absorption band used for constraining both the CWL and FHWM at the nominal pixel level within the wavelength range of the IR channel; Panel (a): residuals and FHWM retrievals for the interval 3.35–3.45 µm including the CH4 band at 3.4 µm. The black lines and dots display a MAJIS spectrum extracted from the cube C15 (#20240820214628) at the across-slit × along-slit position [10, 5] in nominal pixels. Red lines and dots present the results of the 4A/OP model adapted to match the conditions of observation of the MAJIS spectrum, at 1 nm FWHM on the left of panel (a), and, on the right of panel (a), convolved with the FWHM and residuals needed to best fit the MAJIS spectrum (best fitting values of the residuals and FWHM are indicated above the graph on the left); Panel (b): Same as panel (a), but for the for the 3.65–3.75 µm interval including the H2O band at 3.67 µm. Panel (c): Same as panel (a), but for the for the 3.86–3.94 µm interval including the double N2O band at 3.875 and 3.92 µm; Panel (d): Same as panel (a), but for the for the 4.48–4.6 µm interval including the N2O band at 4.51 µm.
We were able to re-estimate the FWHM in the IR channel with the help of the 4A/OP model. It was done at 4 specific wavelength ranges, distributed over the MAJIS IR channel, where we could isolate asymmetric gaseous absorption bands of sufficient width (spanning a minimum of 4 spectels): (1) 3.35–3.45 µm including a CH4 band, (2) 3.65–3.75 µm including a H2O band, (3) 3.86–3.94 µm and (4) 4.48–4.6 µm including both a N2O band (Fig. 5). For this particular study, the 4A/OP model was run at high spectral resolution (with a FHWM of 1 nm – red spectra in Fig. 5a–d left), higher than the reference FWHM in the MAJIS IR channel (6.8 nm, Haffoud et al., 2024). By using a classic Levenberg-Marquardt (LM) gradient-descent algorithm (Marquardt, 1963), we searched for the spectral resolution (FWHM) of the model spectrum and the spectral residual between the MAJIS and model spectra that provide the best match between the modified model (red spectra in Fig. 5) and MAJIS observations (black spectra in Fig. 5). The spectral slope and offset of the model simulations are also slightly adjusted during the inversion process to minimize the spectral distortion between the model and the observations and ensure for a maximum sensitivity of the inversion to the FWHM and shift parameters. The LM inversion algorithm allows for the evaluation of 1σ uncertainties on the jointly retrieved parameters [shift, FWHM].
In Appendix A, Fig. A1 presents the spectral residuals and Fig. A2 presents the FWHM values that need to be applied to the 4A/OP model to best fit the MAJIS IR spectra for the 4 selected bands and all the positions in the MAJIS slit listed in Table 1.
It should be noted that retrieving the spectral residual and FWHM with this methodology is particularly challenging due to the high sensitivity of the inversion to the overall spectrum shape, that in turn is extremely sensitive to the water vapor abundance fixed in the model (more details are provided in Guerlet et al., 2026). It was however possible to obtain very consistent spectral residual values (Fig. A1) that are in excellent agreement with those calculated and mapped in Sect. 2.1 for the 4 evaluated spectral ranges. This shows that the absolute spectral calibration (CWL) presented Sect. 2.1 is robust except for spectral range 3 (3.86 – 3.95 µm), for which it is difficult to finely represent the MAJIS observations with the model, and a few slit positions where the MAJIS spectra are noisy. We can draw the same conclusions for the retrieved FWHM (Fig. A2). All the retrieved values (except for a few outliers), are consistent with the evaluation of the FWHM (6.8 nm) in Haffoud et al. (2024), which was estimated for a narrow wavelength range (2.27–2.32 µm). This makes it possible to reliably use the FWHM as derived from Earth spectra for all MAJIS IR wavelengths and slit positions.
3.1 Status after ground calibration
The radiometric response of MAJIS (Instrument Transfer Function, ITF) as determined by the characterization of the VISNIR and IR detectors and the ground calibration campaign have been presented in Langevin et al. (2024).
The radiometric calibration was considered as quite reliable for the IR channel, as the radiometric calibration could be performed using as a source a black body inside the vacuum chamber with temperatures ranging from −80 to +50 °C with a single reflection on an Aluminum collimator so as to cover the full FOV of MAJIS. The combination of the black body emittance and the reflectance on the collimator reduced the radiance by a factor ∼ 0.97. This made it possible to obtain reliable performance evaluations for both readout modes of the detectors (100 kHz for long integration times, 1 MHz for short integration times, see Poulet et al., 2024). A small straylight contribution had to be subtracted in the broad band filter spectral range (2.28–2.88 µm) as with cold black bodies there are much more photons at wavelengths close to 5 µm (well below the cut-off wavelength) than in the broad band filter range and these long wavelength photons are not completely filtered out by the broad band filter. For dayside observations of Jupiter and icy satellites, the broad band filter range will be dominated by reflected solar photons. Therefore, this straylight contribution is only relevant for observations of Jupiter hot spots on the night side, with very low signals in the broadband filter range (2.280–2.880 µm).
With a black body inside the vacuum chamber, it was possible to reliably monitor the operability (warm and hot pixels) and inter-pixel variability (for nominal pixels) of the IR channel across the full FOV. The radiometric response of MAJIS for the VISNIR channel was on less firm grounds due to several factors:
-
the temperature of the black body inside the vacuum chamber was limited to +80 °C as there are thermal and vacuum control issues at higher temperatures. This provided adequate SNR only for wavelengths ranging from 1.8 to 2.35 µm. Therefore, a black body outside the vacuum chamber was used, which could be heated up to 500 °C. This made it possible to provide reference calibration date for the wavelength range from 1 to 1.8 µm, but with several limitations:
-
the radiance from the external blackbody was impacted by 7 reflections in the optical bench outside the chamber and the transmission of the window of the vacuum chamber.
-
The spatial extent of this blackbody was 20 MAJIS pixels. Due to time limitations for the calibration campaign, the full FOV could not be covered, with information on the radiometric response at three positions left, center and right of the FOV.
At wavelengths lower than 1 µm, up to 50 % of the signal came from a straylight contribution for the relatively cold sources used during the calibration campaign (QTH: ∼ 2000 K, less for the black bodies inside and outside the vacuum chamber). Observations of the Earth have shown that this straylight contribution is smaller for sunlit targets (see Sect. 3.3). As a result, the ITF from 0.5 to 1 µm for the legitimate signal was evaluated from radiometric modelling supported by observations with QTH lamps (see Langevin et al., 2024). Due to these limitations, the ITF for each of the 400 pixels of the VISNIR channel needed to be consolidated using post-launch measurements even if there had been no changes after launch.
3.2 Post-launch evolution of the 2D-ITF
3.2.1 Evaluation of the post-launch 2D-ITF in the spatial direction
Post-launch signal evolution
The observations performed with the two light sources of the ICU (a QTH lamp for wavelengths up to 4 µm and a black body providing adequate signal levels for the full wavelength range of the IR channel, 2.28–5.56 µm) showed that the spatial profile of the ICU signal changed significantly after launch, as shown in Fig. 6.
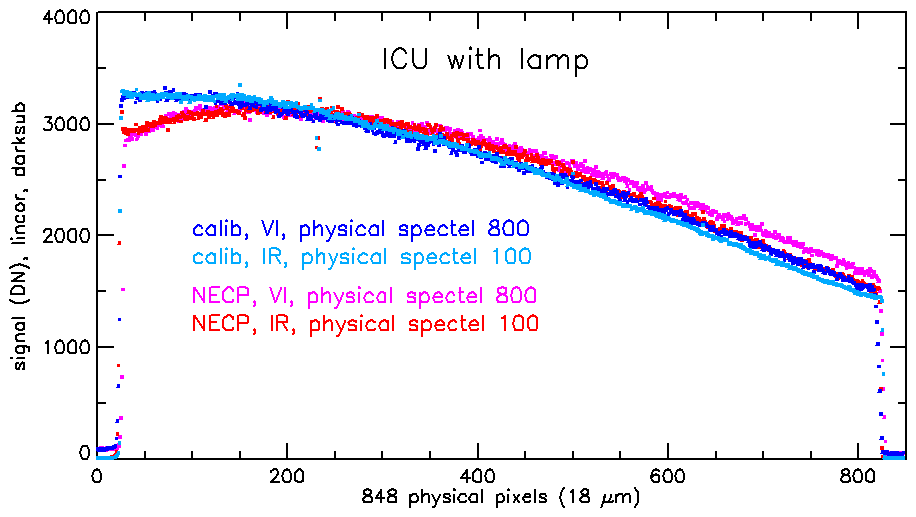
Figure 6Spatial profile of the ICU signal before and after launch. The profiles obtained during calibration and 2 months after launch (Near Earth Commissioning Campaign, NECP) are shown for a VISNIR H1RG spectel (spectel 800, 1.952 µm) and for an IR H1RG spectel (spectel 100, 2.58 µm). These two spectels have been selected as they provided very similar raw signal levels across the field of view (FOV).
As shown in Fig. 6, the spatial profiles of the ICU lamp as observed by the two MAJIS channels were very consistent before launch, and they remained very consistent after launch, but with a higher signal level on the right of the FOV and a lower signal level on the left of the FOV. Therefore, the origin of this evolution must be upstream of the slit and the beam splitter as it impacts both channels in the same way. A similar evolution was observed for the two ICU light sources (QTH lamp and black body). The most likely interpretation is that the spatial relationship between the ICU sources, the scattering screen and the line of sight changed during launch.
This hypothesis is supported by the similarity of the spectral shape of the ICU signal before and after launch. The spectral, radiometric and spatial performances for observations of the Moon and Earth are overall in line with expectations as discussed in Sect. 2 for the spectral performances, in the next sub-sections of Sect. 3 for radiometric performances and in Seignovert et al. (2026), for spatial performances. This excludes a significant deformation of optical elements in the fore-optics during launch.
Post-launch spatial shift along the slit
Due to the small spatial shift reported after launch in Filacchione et al. (2024), four H1RG pixels (18 µm) of the VISNIR channel at the right edge of the FOV and three H1RG pixels (18 µm) of the IR channel at the left edge of the FOV (out of 800 H1RG pixels in the FOV) were not fully in the FOV during calibration. Therefore, no 2D-ITF was obtained during calibration for these H1RG pixels. The ITF for these pixels was derived by considering that the ICU signal (lamp for the VISNIR, black body for the IR) had the same spectral shape as determined within the FOV, with a spatial gradient as observed in the FOV after launch (Fig. 6).
Impact of the post-launch spatial shift on inter-pixel variability
As shown by Langevin et al. (2024), the spatial profiles show variations at the 1 % level which are correlated for all wavelengths. These variations are attributed to small changes in the effective width of the slit across the FOV. Due to the small shift (0.33 % to 0.35 % of the FOV) in the relative positions of the detectors and the slit, these variations apply to different detector elements after launch. For the IR detector, a comprehensive 2D-ITF was determined before launch, with a variability of a few % for the response of operable H1RG pixels. These response variations as well as the operability map (location of warm, hot and dead H1RG pixels) are not impacted by the spatial shift. Therefore, the 2D-ITF as determined during calibration and extended to the 3 H1RG pixels left of the FOV during calibration was convolved in the spatial direction by the ratio (close to 1) of the pre-launch and post-launch slit efficiency factors as derived from the measured spatial shift of the FOV (3 H1RG pixel for the IRs).
As discussed in Sect. 3.1, the inter-pixel variability of the VISNIR detector as determined during characterization is very low (in the 0.5 % range), and direct information on the high frequency terms of the 2D-ITF was only available for 3 locations in the left, center and right part of the FOV. Therefore, the high frequency terms in both the spatial direction and spectral direction were directly determined from the ICU lamp signal as discussed in Sect. 3.2.2.
3.2.2 VISNIR 2D-ITF: impact of the post-launch spectral shift and high-frequency terms
The VISNIR channel is equipped with a high pass Linear Variable Filter (LVF) with no filter boundary, so that no major change in terms of filter transmission was expected as a result of the small spectral shift reported in Sect. 2. The interpixel variability is very small (∼ 0.35 %, Langevin et al., 2024) and the operability exceeds 99 %. The main contribution to the ITF in the spectral direction results from the optical efficiency of elements in the fore-optics and the spectrometer.
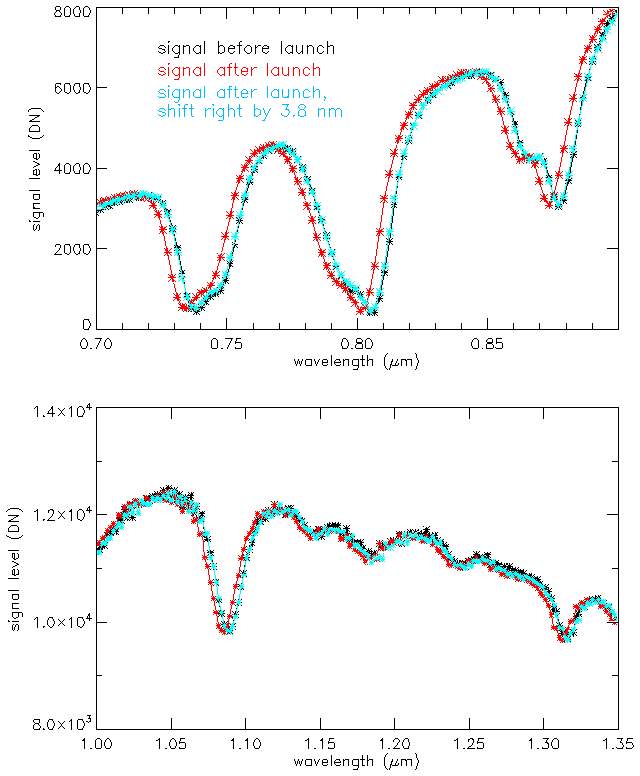
Figure 7Straylight corrected signal near the left edge of the FOV from the ICU lamp before and after launch; top panel: Spectral range with strong didymium absorptions; Bottom panel: Spectral range with no strong spectral features from the QTH lamp; A scaling factor has been applied to the signal after launch (1.08 for the top panel, 1.12 for the bottom panel) so as to compensate for the decrease in the ICU lamp signal from before to after launch near the left edge of the FOV (see Sect. 3.2.1).
The spectral shift reported by Haffoud et al. (+3.8 nm) was determined from a shift in position of the strong didymium bands of the ICU lamp at short wavelengths (Fig. 7, top panel). As shown in Fig. 7 (bottom panel), a very similar spectral shift applies to spectral regions where the ITF spectral features dominate. Therefore, the pre-launch VISNIR ITF from Langevin et al. (2024) was resampled with the post-launch wavelengths. This resulted in changes of the radiometric response by up to 7 % close to narrow ITF spectral features (e.g. 1.090 µm, see Fig. 7, bottom panel). The shift by 3.8 nm was confirmed in Sect. 2 by comparisons of Earth MAJIS spectra with models. The validity of the adjustment of the ITF was confirmed by the smooth spectral shape of lunar spectra acquired by MAJIS (see Sect. 4 and Zambon et al., 2026) and the comparison of MAJIS observations of the Earth with that of other instruments (see Sects. 2, 4 and Oliva et al., 2026) which used the updated ITF for evaluating the radiance of MAJIS VISNIR spectra.
In the spatial direction, the main contribution to low spatial frequency variations of the 2D-ITF is a vignetting by up to 20 % observed near the right edge of the FOV (Langevin et al., 2024). For the VISNIR channel, high frequency terms of the post-launch 2D-ITF could not be evaluated during calibration over the full FOV (see Sect. 2.1). They were evaluated from the ICU lamp signal as observed after launch. This QTH lamp is not expected to exhibit very narrow spectral features, and the same applies in the spatial direction when observing a scattering screen illuminated by the QTH lamp. Therefore, high frequency terms can be attributed to inter-pixel variability combined with variations in optical efficiency in the spatial direction due the small variations in the transmission efficiency along the slit. They have been determined by dividing the ICU signal averaged over 12 acquisitions during flight (providing a SNR > 500 for most of the spectral range) by the ICU signal smoothed over 10 × 10 H1RG pixels and spectels after screening out the few dead pixels.
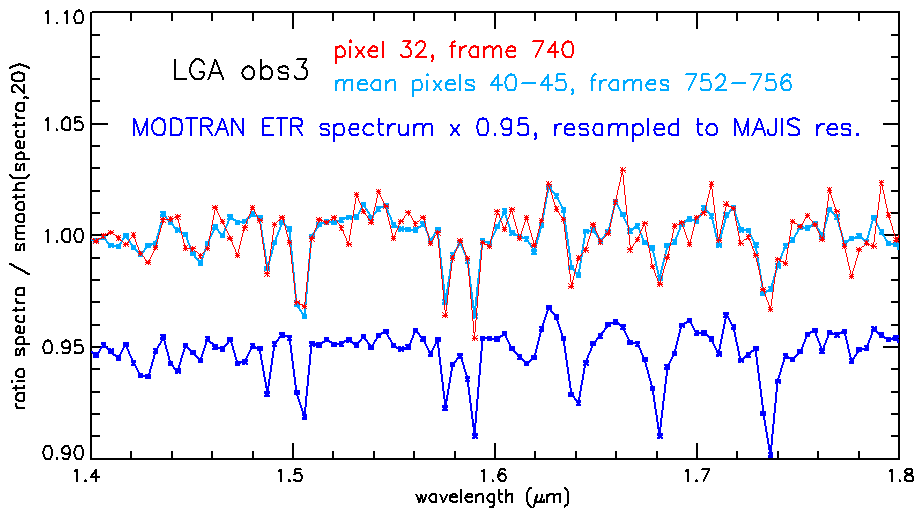
Figure 8Narrow spectral features of a MAJIS radiance spectrum of the Moon divided by a continuum at the nominal MAJIS resolution and for an average of 36 MAJIS spectra (SNR > 1000) as obtained by applying the updated 2D-ITF of the VISNIR channel compared with narrow spectral features of the MODTRAN ETR solar spectrum.
The high frequency terms of the updated 2D-ITF have been validated by observations of the Moon. Lunar reflectance spectra do not exhibit narrow absorption features in the VISNIR wavelength range (see e.g. Ohtake et al., 2013). Continuum corrected MAJIS radiance spectra as derived from the revised ITF are shown in Fig. 8 together with a continuum corrected MODTRAN solar spectrum resampled to the MAJIS resolution using the spectral calibration and FWHM as derived in Sect. 2. The very good match obtained for solar absorption features with a strength of only a few % at the MAJIS resolution shows that the high frequency terms of the MAJIS 2D-ITF have been evaluated with an accuracy better than 0.5 %. It also validates the post-launch spectral calibration presented in Sect. 2 as even a residual of 0.5 nm would result in a significant mismatch in the profile of solar absorption features with a spectral width of a few MAJIS spectels (sampling: 3.4 nm).
3.2.3 Post-launch evaluation of the IR 2D-ITF
Impact of the IR detector operability and inter-pixel variability
The H1RG detector of the IR channel has a larger cutoff wavelength (5.65 µm) that that of the H1RG detector of the VISNIR channel (2.5 µm). As a result, the dark current can reach 1000 e− s−1 or more for operating temperatures exceeding 90 K, to be compared with a few e− s−1 for the VISNIR detector at operating temperatures ranging from 130 to 140 K, and there can be up to 5 % of warm and hot the HI1RG pixels depending on the temperature and integration time (Langevin et al., 2024). Interpixel variability is also much larger for nominal pixels with a standard deviation ∼ 1.5 %, to be compared to 0.3 % for the VISNIR detector (Sect. 3.2.3) and ∼ 1 % for the variations in the effective width of the slit, which apply to both channels. Therefore, the operability and the response of each H1RG pixel (18 × 18 µm) dominate the high order terms of the 2D-ITF of the IR channel. They have been accurately determined during detector characterization and ground calibration, and there is no evidence from ICU observations after launch that detector characteristics have markedly changed.
Post-launch spectral effects and update of the IR 2D-ITF
The IR detector is equipped with two filters: a broad band filter covering the spectral range from 2.28 to 2.88 µm which rejects both high orders of the grating (at shorter wavelengths) and thermal photons from the spectrometer (at longer wavelength) and a Linear Variable Fitler (LVF) covering the spectral range from 2.88 to 5.56 µm with a spectral width of a few % which rejects high orders of the grating and much reduces the contribution from the thermal background. The decrease in transmission near the filter boundary (2.88 µm) is the most prominent spectral feature of the IR ITF in the spectral direction (Langevin et al., 2024) with the decrease in optical and quantum efficiency at very long wavelengths.
This conclusion is supported by the comparison of the spectral profile of the ICU signal from the lamp and the black body before and after launch. The evolution of the spatial profile of the ICU signal after launch (Sect. 3.2.1) is attributed to an evolution of illumination conditions for the scattering screen which should not change its spectral shape.
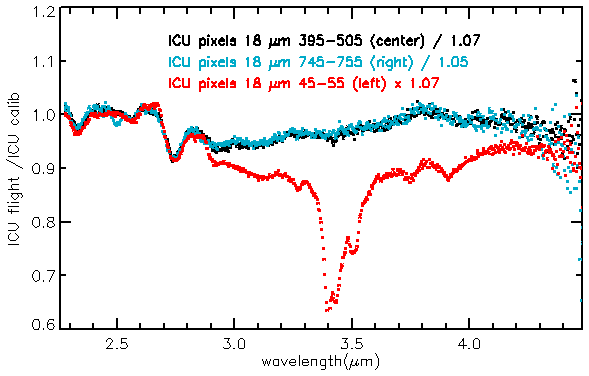
Figure 9ICU lamp signal after launch divided by the signal before launch near the center, the right edge and the left edge of the FOV. The ratios have been normalized by a factor smaller than 1 at the center and right of the FOV, larger than 1 left of the FOV so as to compensate for the evolution of the spatial profile from before to after launch (see Fig. 6).
The ICU black body is equipped with a polystyrene filter (Stefani et al., 2025) resulting in very low signals in absorption bands from 3.200 to 3.550 µm. Therefore, the normalized ICU signal ratios from before to after launch presented in Fig. 9 have been evaluated with the QTH lamp, which provided high SNR up to 4 µm. The contributions to the ITF associated with the detector (filter boundary, interpixel variability) are ratioed out, which is not the case for contributions from a spectral shift as discussed for the VISNIR channel in Sect. 3.2.2.
The normalized ratios are very consistent in the center and right parts of the FOV, with evolutions by at most a few % (8 % for a small spectral region close to the filter boundary, where the spectral gradient of the ITF is steep), which can be attributed to the impact of the spectral shift. However, in the left part of the FOV (red curve in Fig. 9) a very significant decrease of the radiometric efficiency is observed, reaching 37 % close to 3.400 µm. The narrow absorption features correspond to sp3 C-H stretching, so that this decrease is attributed to a contamination of the left part of the IR detector by aliphatic compounds during or shortly after launch, as the ICU signal remained very stable from NECP (early June 2023, 1.5 months after launch) to an instrument check-out end of March 2025. The evolution of this contamination will continue to be monitored during cruise.
The ICU signal is observed at the H1RG pixel level over the full FOV (800 pixels × 1016 spectels). This made it possible to determine an updated 2D-ITF of the IR channel accounting for minor changes in the radiometric efficiency in the central and right parts of the FOV combined with the impact of contamination in the left part of the FOV on the basis of the normalized ratios presented in Fig. 9.
Validation of the updated IR 2D-ITF using lunar observations
A check on this first stage of update for the IR ITF was provided by observations of the Moon in August 2024 by comparing the spectra obtained at different locations in the FOV. As shown in Fig. 10, these spectra a very similar, which demonstrate that the decrease by up to 37 % of the response near the left edge of the FOV due to contamination has been adequately compensated. The variations of the thermal contribution at long wavelengths are discussed in Tosi et al. (2026).
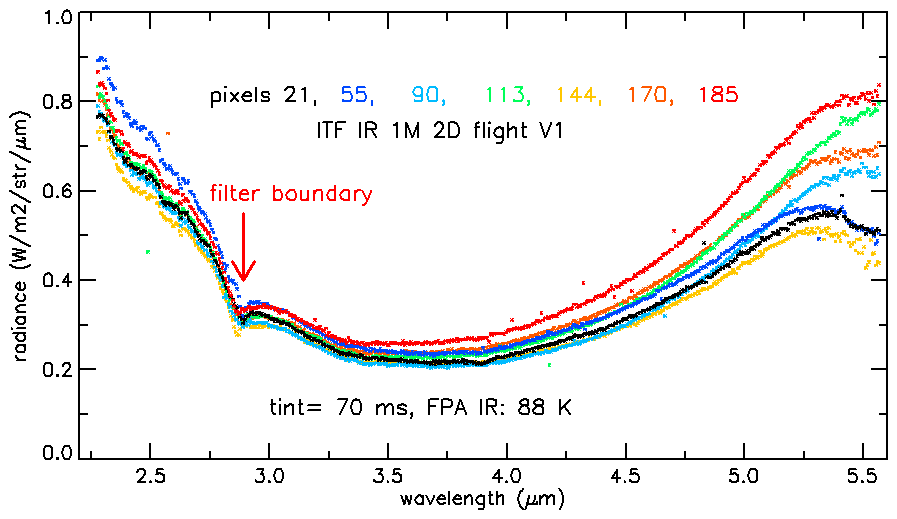
Figure 10Radiance spectra of the Moon obtained over the left half of the FOV after the first stage of ITF adjustment. The 7 spectra correspond to MAJIS pixels (36 µm pitch) from pixel 21 (close to the left edge) to pixel 185 (close to the center of the 400 pixels FOV).
With this first version of the post-launch IR 2D-ITF, a spectral feature was observed in all lunar spectra at 2.88 µm (see Fig. 10). There was a suspicion of an artefact as this corresponds to the location of the filter boundary, with similar spectral features observed when mineral samples were observed at an incidence angle of 45° during ground calibration (Rodriguez et al., 2024). OH bands in the 2.8–3 µm spectral range have been reported for lunar spectra (Clark et al., 2024), but they are broader than that in Fig. 10.
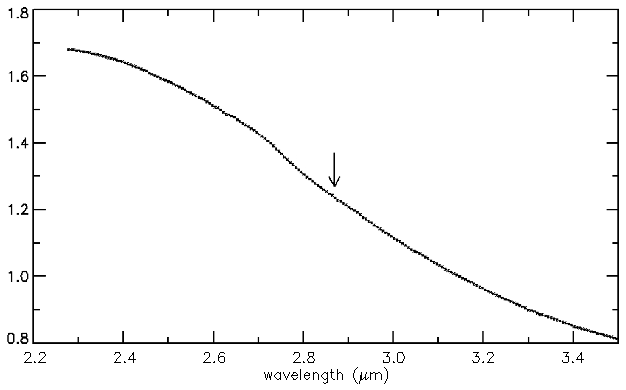
Figure 11Ratio of radiances observed in the same MAJIS cube for highlands and mare areas. The arrow corresponds to the filter boundary at 2.880 µm.
A first clue was obtained by comparing highland and mare spectra in the same MAJIS cube. The spectral ratio shown in Fig. 11 was determined on an average of 20 frames and 20 MAJIS pixels (the same for the two areas). The solar incidence was ∼ 43° for the highland area (with a spread due to local slopes), 28° for the mare area. As expected, the highland area is brighter but colder than the mare area, with a larger radiance at short wavelengths and a smaller radiance at long wavelengths. The SNR is very high (>1000) and there is no hint of a spectral feature close to the filter boundary. This points to an artefact in the 2D-ITF which is removed in the ratio as it impacts in the same way highland and mare radiance spectra obtained with the same detector pixels. The 2D-ITF has been corrected accordingly, assuming there was no narrow signature close to the filter boundary in the MAJIS lunar spectra obtained during the 4th observation of the Moon, with the lowest incidence hence the best SNR (see Poulet et al., 2026).
Search for signatures with high-SNR MAJIS observations of the Moon
The MAJIS radiance spectra presented in Fig. 12 have been obtained using the IR 2D-ITF after the two stages of post-launch update. They showcase the high SNR (>200) obtained even with the nominal spatial and spectral resolution of MAJIS (400 pixels across the FOV and 508 spectels for each channel). By design of the updated ITF, the narrow spectral feature around 2.880 µm has been removed from MAJIS radiance spectra obtained during the 4th observation (solar incidence: 28° for the red spectrum in Fig. 12) and has also been strongly reduced in spectra obtained at higher incidence (43 and 73°).
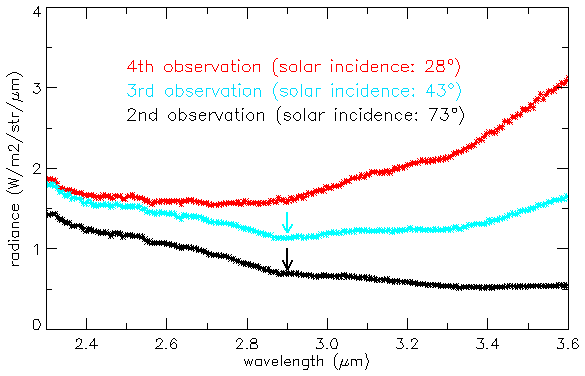
Figure 12MAJIS radiance spectra obtained during three of the five observations of the Moon by MAJIS (see Poulet et al., 2026) applying the updated IR 2D-ITF. Blue and black arrows correspond to a possible weak OH signature at 2.9 µm for mid to high incidence MAJIS observations.
Spectra at mid to high incidence exhibit a broad and weak absorption feature centered at ∼ 2.9 µm which may correspond to an OH signature for regions close to the terminator. Such a weak absorption could be consistent with previous lunar observations showing that the 3 µm band displays strong variability with local time, latitude, and surface temperature. In particular, Li and Milliken (2016) reported that absorptions are generally weakest near local noon and at low latitudes, especially close to the equator, and tend to increase toward the late afternoon as surface temperatures decrease and thermally loosely bound becomes more stable. More recent analyses confirm that equatorial regions exhibit very shallow 3 µm absorptions, with stronger signatures preferentially observed at higher latitudes or under low solar incidence conditions (Clark et al., 2024).
Caution is however required due to the proximity with the filter boundary, which was intentionally selected in this spectral region as it is expected to have very low SNR for icy satellites due strong OH signatures and for Jupiter due to strong methane absorption bands. When comparing the 3 spectra in Fig. 12, this possible signature lies close to the cross-over between the wavelengths dominated by solar photons and that dominated by thermal emission. In this spectral region, the evaluation of reflectance band strengths is particularly sensitive to the model-dependent subtraction of the thermal contribution, motivating continued monitoring and validation using observations acquired under a range of illumination and local-time conditions.
3.3 Post-launch evolution of the VISNIR straylight
The straylight contribution reported in Langevin et al. (2024) for the VISNIR channel has an impact on the science interpretation of radiance spectra obtained with this channel. For wavelengths longer than 2.2 µm, the legitimate signal rapidly decreases due to the dichroic so that the straylight dominates, and this contribution is also quite significant at wavelengths shorter than 1.3 µm. It was therefore important to evaluate possible changes after launch in terms of straylight contributions. The ICU observations extend beyond the two edges of the FOV, hence it is possible to reliably evaluate the legitimate signal and the straylight contributions close to the edge of the FOV (see Langevin et al., 2024).
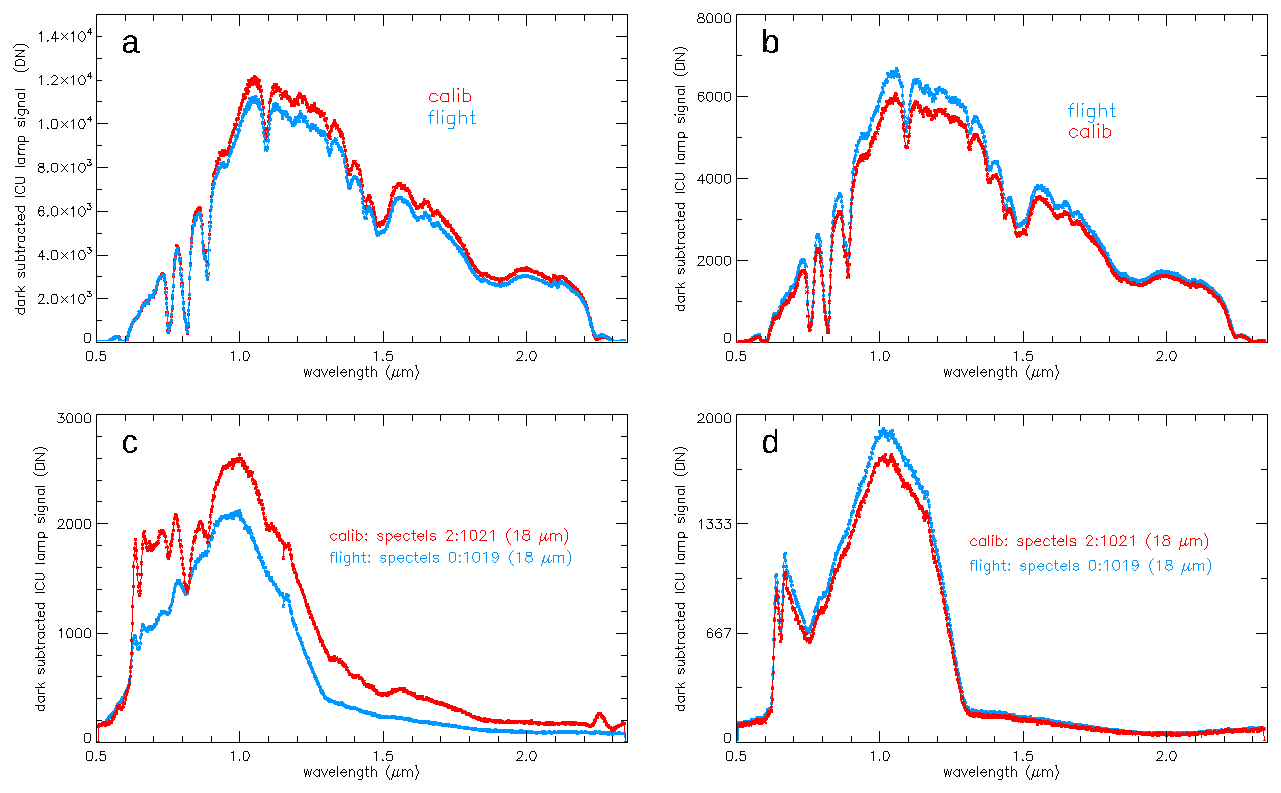
Figure 13Legitimate signal and straylight contribution for observations of the ICU lamp with the VISNIR channel during ground calibration (“calib”) and after launch (“flight”). The legitimate signal for a region near the left edge of the FOV is presented in panel (a) and that for a region near the right edge of the FOV in panel (b). The straylight contribution beyond the left edge of the FOV is presented in panel (c) and that beyond the right edge of the FOV in panel (d). The ICU spectra during flight have been shifted by 2 H1RG spectels so as to compensate for the spectral shift reported by Haffoud et al (2024). and updated in Sect. 2.
As discussed in Sect. 3.2 and 3.3.1, the legitimate signal as displayed in Fig. 13 (panels a and b) has a very similar shape before and after launch when considering the spectral shift, with a small overall decrease near the left edge of the FOV (panel a) and a small overall increase near the right edge of the FOV (panel b). The straylight contribution near the edge of the FOV can be derived from the signal observed beyond the edge of the FOV (Langevin et al., 2024). It slightly increased on the right of the FOV (Fig. 13, panel d) by a factor similar to that observed for the legitimate contribution near the right edge, but it decreased on the left of the FOV (Fig. 13, panel c) by a larger factor than the legitimate contribution near the left edge. The spurious narrow spectral signatures at short wavelengths (0.6 to 0.85 µm) have also been strongly reduced, which will make it easier to identify legitimate absorption and emission features in this spectral range in the left part of the FOV.
The source region of the VISNIR straylight extends from 1.5 µm to the cut-off wavelength (2.5 µm) and the impacted region extends from 0.5 to 1.3 µm (Langevin et al., 2024). The relative weight of the VISNIR straylight was therefore expected to decrease for reflectance spectra (see Langevin et al., 2024), as the solar brightness temperature (∼ 5800 K) is much higher than that of the black bodies and QTH lamps used as light sources during calibration and in the ICU.
This reduced impact of the VISNIR straylight should be enhanced for planetary targets with strong absorption bands in the source region of the straylight, which is the case for the Earth and icy satellites (H2O absorption bands) and Jupiter (CH4 absorption bands). It is not the case for the Moon, so that the Earth is more representative of science targets in the Jupiter system in this respect in particular for the areas in the Pacific Ocean.
Observations of the Earth with windows extending beyond the edge of the FOV were obtained so as to reliably evaluate VISNIR straylight from the signal beyond the edge of the FOV (see Poulet et al., 2026).
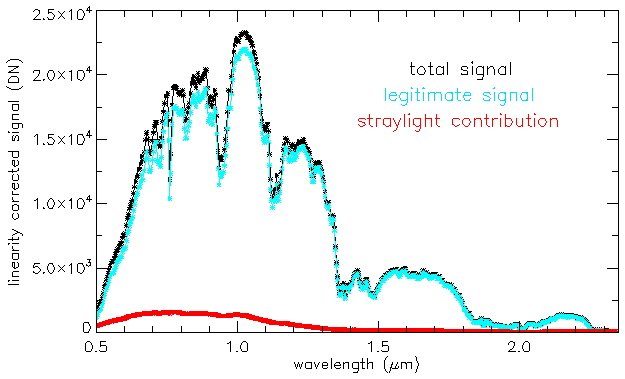
Figure 14Total signal, legitimate signal and straylight contribution for an Earth spectrum from observation C17.
The results are shown in Fig. 14 for observation C17, which extended beyond the left edge of the FOV. Except at very short wavelengths, the straylight contribution is smaller than 10 % at the left edge of the FOV and it is expected to be smaller than 15 % at the center of the FOV. As shown on Fig. 14, the straylight contribution is relatively featureless near the left edge, in line with Figure 13, panel (c). In this part of the FOV, the VISNIR straylight has therefore a relatively minor impact on the identification of spectral features and the evaluation of their band strengths. This should also be the case for Jupiter and icy satellites. Some caution will be required at short wavelengths (0.6 to 0.7 µm) near the right edge of the FOV due to two narrow straylight emission features (Fig. 13, panel d).
The Moon is a worst case as it has a very red reflectance spectrum compared to the Earth or icy satellites, with large radiances in the straylight source region (1.5–2.5 µm) relatively to the impacted region at short wavelengths (0.5–1.3 µm). Therefore, the 4th observation of the Moon has been used for the comparisons with other data sets on the Moon in Sect. 4.2.1 as it extends beyond the left edge of the FOV, so that the large straylight contribution (up to 40 % at 0.65 µm) can be reliably subtracted (see Langevin et al., 2024).
Table 2Contribution of the VISNIR straylight to the total signal in three wavelength ranges for targets with a decreasing reflectance in the VISNIR range (“blue” targets: Earth, Jupiter, icy moons) and targets with an increasing reflectance in the VISNIR range (“red” targets: Moon).

As indicated in Table 2, the very strong straylight contribution at long VISNIR wavelengths makes it very difficult to recover legitimate signals with this channel for wavelengths longer than 2.2 µm. It should however be noted that reliable spectral information can be obtained with the IR channel at wavelengths longer than 2.28 µm.
When in the Jupiter system, the read-out window for a representative set of observations will be shifted by ∼ 10 pixels left (out of 400) so as to directly assess the straylight contribution in the left part of the FOV and its impact on science interpretations at a cost of a minor reduction (by 2.5 %) of the useful FOV. As the lower boundary of the VISNIR range critically impacted by straylight (2.2 µm) has been set conservatively, this should make it possible in most cases to bridge the small spectral gap (2.2–2.28 µm) between the reliable VISNIR range and the IR range.
4.1 Criteria for selecting data sets relevant for radiometric comparisons
The Moon is not expected to exhibit significant time variability, so that one can compare the reflectance measured by MAJIS with that of previous observations of the lunar surface. The data set used as a reference is that selected by Ohtake et al. (2013) for comparing reflectance measurements of both mare and continents. Radiometric comparisons of lunar spectra must consider viewing geometries. Compensating for different incidences, emergences and phases is dependent on photometric models. The best case for a direct comparison of radiometric performances with MAJIS is JANUS, the imaging camera of JUICE (Palumbo et al., 2025), as the photometric angles for observations of the Moon were very similar as those of overlapping MAJIS observations.
At the scale of the projected MAJIS IFOV (0.9 km × 0.9 km at closest approach, 1.4 km × 3 km for the last observation of the Earth surface, C17) and FOV (from 57 km to 190 km for 64 pixels, see Poulet et al., 2026), the cloud cover on Earth changes with a timescale of minutes to hours, so that for Earth observations the optimum approach would have consisted in comparing observations of the same area obtained at the same time as MAJIS observations. Such simultaneous observations were not available, so that observations as close as possible in time have been selected. In this respect, cloud-free areas are more reliable than cloud-covered areas, except when the incidence and emergence are close to symmetrical (“glint spot”, with an extent depending on the wave patterns). The glint spot has a major impact on radiance but should not impact atmospheric absorption features. The MAJIS observations most at risk are those with an emission angle similar to the incidence angle, C13 and C14 and to a lesser extent C15 (see Poulet et al., 2026, Table 1).
A search for matching observations has been conducted for JANUS and four Earth observation instruments overlapping the spectral range of MAJIS: PRISMA, an Italian earth-observation satellite with a VISNIR imaging spectrometer (Galeazzi et al., 2009), ENMAP, a German imaging spectroscopy mission (Storch et al., 2023), TROPOMI (Veefkind et al., 2012), a push-broom spectrometer on-board the Sentinel 5P ESA mission and IASI (Clerbaux et al., 2009), an imaging spectrometer on-board the METOP ESA mission, which covers a large part of the spectral range of the IR channel of MAJIS. The comparison of MAJIS results with that of PRISMA and IASI for spectroscopic identifications are presented in two articles companion papers (Oliva et al., 2026 and Guerlet et al., 2026).
A straylight contribution has been identified for the VISNIR channel (Langevin et al., 2024). Its impact and evolution after launch has been presented in Sect. 3.3. This straylight contribution can be quite significant for wavelengths shorter than 1.3 µm, in particular for spectra with a red spectral slope (which is the case for the Moon, see Fig. 15) and for wavelengths larger than 2.2 µm (see Table 2).
As shown in Langevin et al. (2024), the signal beyond the edges of the FOV provides a direct evaluation of the straylight contribution, so that the VISNIR straylight can be reliably corrected by extrapolating the out of field signal to pixels close to the edge of the field of view. Therefore, whenever possible, comparisons for the VISNIR channel have been made with the single observation of the Moon (C4, see Poulet et al., 2026) and the two observations of the Earth (C15 and C17) for which straylight corrected radiances have been determined for the VISNIR channel.
4.2 Comparison of MAJIS results with those of other instruments
4.2.1 Observations of the Moon by other instruments in the VISNIR range
Observation C4 of the Moon (see Poulet et al., 2026 for the list of MAJIS cubes) covers both highland areas and mare areas. It has been compared to previous observations using the set of instruments selected by Ohtake et al. (2013). The title of this article, “one Moon, many measurements” emphasizes the difficulty in reaching a definite conclusion on lunar reflectances. They selected two instruments on-board Selene (multiband imager, MI, Ohtake et al., 2008; spectral profiler, SP, Matsunaga et al., 2008), two instruments on-board Chandrayaan-1 (Moon Mineralogy Mapper, M3, Pieters et al., 2009; shortwave near-infrared grating spectrometery, SIR-2, Bugiolacchi et al., 2013) and an Earth-based telescopic system (Robotic Lunar Observatory, ROLO, Kieffer and Stone, 2005)
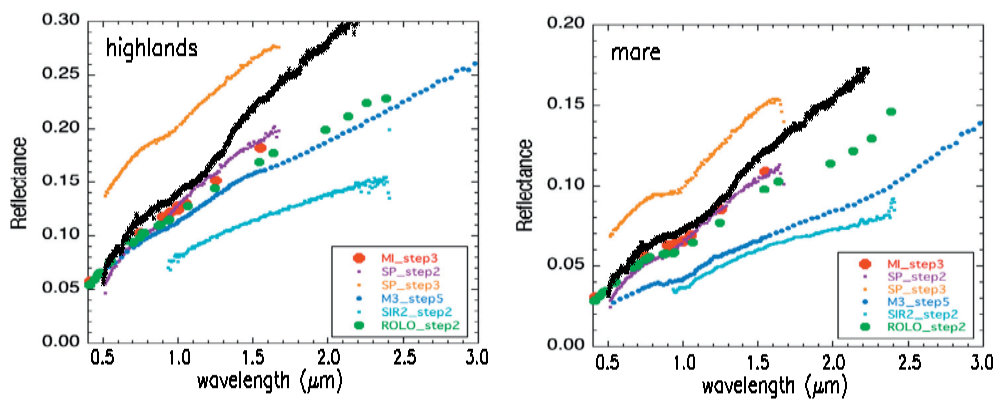
Figure 15Lunar reflectance spectra from MAJIS observations (black stars) in the VISNIR spectral range (0.5–2.250 µm) corrected for straylight and assuming Lambert scattering for highlands (left panel) and for mare (right panel) compared to lunar reflectance spectra of highlands and mare obtained by other instruments (Ohtake et al., 2013).
Figure 15 shows how the lunar reflectance spectra obtained by MAJIS (assuming Lambert scattering) compares with those reported by Ohtake et al. (2013). The wide spread of previous results can be attributed in part to differences in viewing geometries and model dependent photometric corrections. Orbital instruments implement nadir pointing with a wide range of incidences and phases. Due to thermal constraints on the attitude of the JUICE spacecraft at 1 AU, all MAJIS observations were performed at a phase of 90°, with emergence increasing from 0 to 75°. As shown in Fig. 15, the reflectance measured by MAJIS at short wavelengths is well within the wide range of reflectance measured by other instruments, considering that different “highlands” and “mare” surface elements cannot be expected to have exactly the same reflectance. All instruments including MAJIS concur in observing an increase of the reflectance with wavelength. One can however note a slightly steeper slope with MAJIS. Absorption features in MAJIS spectra of the Moon are discussed in Zambon et al. (2026).
4.2.2 JANUS observations of the Moon and Earth
JANUS is the high-resolution camera of JUICE (Palumbo et al., 2025). Given the extensive synergies between the science goals of JANUS and MAJIS, comparing their radiometric performances was of clear interest. As discussed in the overview article on MAJIS LEGA observations (Poulet et al., 2026), five of the JANUS color filters cover wavelengths in the spectral range of the VISNIR channel of MAJIS.
MAJIS observation C4 of the lunar surface has been selected for photometric comparisons as a straylight corrected radiance could be derived (see Sect. 3.1) For this MAJIS observation, there are several overlapping observations by JANUS for all 5 filters. Radiances can be directly compared as the emergence, incidence and phase are nearly the same for both instruments (the lines of sights of MAJIS and JANUS are aligned within 0.3°).
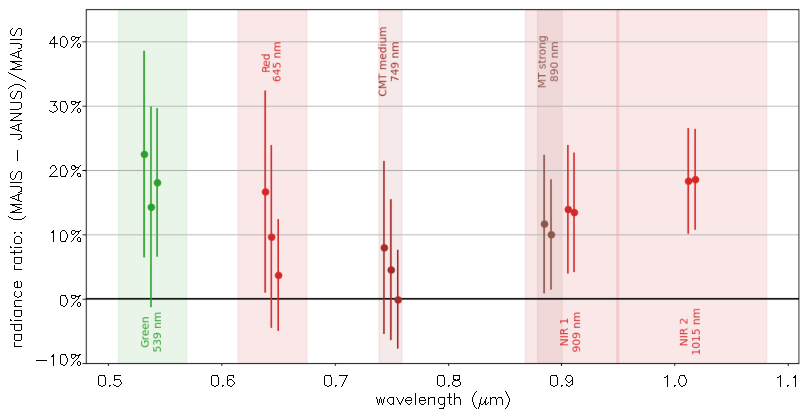
Figure 16Ratio of the radiance measured by JANUS with one of the 5 filters and the radiance measured by MAJIS for the same surface element. The MAJIS radiances have been averaged over the spectral extent of each filter as indicated by the colored rectangles.
The results are shown in Fig. 16. The radiance ratios are very consistent for observations with the same filter. The radiance as measured by JANUS is higher by ∼ 15 % than for MAJIS. This is well within the range of uncertainties for absolute radiometry when comparing two independently calibrated instruments, considering that the MAJIS instrument transfer function was in part derived from optical modelling (Langevin et al., 2024) for the wavelength range covered by JANUS filters (0.51 to 1.08 µm).
Observations of the Earth, which has much bluer spectral slopes in the VISNIR spectral range than the Moon due to absorption bands of H2O at 1.5, 2 and 3 µm, would have been better suited for cross-comparisons than observations of the Moon as the straylight contribution for MAJIS is smaller than for the Moon, so that MAJIS radiances corrected from straylight contributions are more reliable. However, very few matching JANUS observations could be identified for the 3 MAJIS observations extending beyond the edge of the FOV for which the VISNIR straylight can be reliably corrected, and observations with only one JANUS filter were available for each MAJIS observation. Therefore, a set of coordinated JANUS/MAJIS observations is being planned for the 2nd Earth flyby (28 September 2026) with images taken by all 5 JANUS filters overlapping MAJIS observations extending beyond the edge of the FOV. These joint observations will consolidate the comparison of radiometric performances between MAJIS and JANUS at wavelengths shorter than 1.080 µm.
4.2.3 EnMAP observations of the Earth
ENMAP (Environmental Mapping and Analysis Program) is a German hyperspectral imaging spectroscopy mission that monitors and characterizes Earth's environment (Chabrillat et al., 2024; Storch et al., 2023). EnMAP was successfully launched in April 2022 and orbits the Earth synchronous to the Sun in an altitude of approximately 650 km. It detects Earth's surface in the wavelength range between 418.2 and 2445.5 nm with 224 spectral bands and a high radiometric and spectral accuracy and stability. The local time for dayside equatorial crossings on the sun-synchronous orbit is 11:00, so that the incidence is 15° at the equator, increasing with latitude. The ENMAP IFOV (30 × 30 m) is much smaller than that of MAJIS near closest approach (1 km). With a pixel ground resolution of 30 by 30 m and a swath width of 30 km, EnMAP observations allow studying Earth on a global scale.
Seven ENMAP observations were performed in order to support the JUICE mission during the first LEGA flyby for comparisons with JANUS and MAJIS, the two JUICE instruments acquiring data in the spectral range of ENMAP. It was not possible to observe at the same time areas covered by daytime MAJIS observations. As discussed in Sect. 4.1, for comparing the radiometric and spectroscopic performances, we selected the ENMAP observation with the closest match in timing (1.3 h time difference), location (4° away in longitude at a latitude of 23°) and low incidence (13.6° for ENMAP, 26° for MAJIS at a latitude of 23°) with MAJIS observations. This closest match was with C17, the last of the MAJIS observations which extends beyond the edge of the FOV, so that the MAJIS data could be corrected for straylight contribution. With a mean incidence of 26° and a mean emergence of 63°, glint should not be an issue for C17. The reflectance (controlled by incidence) can be legitimately compared, assuming that cloud and ocean characteristics were similar 1.3 h earlier and 400 km away from the MAJIS observation. It should however be noted that the emission angle (31.2° for ENMAP, 63° for MAJIS) and phase (44.2° for ENMAP, 89° for MAJIS) were significantly different, which results in an uncertainty dependent on the photometric model for radiance comparisons.
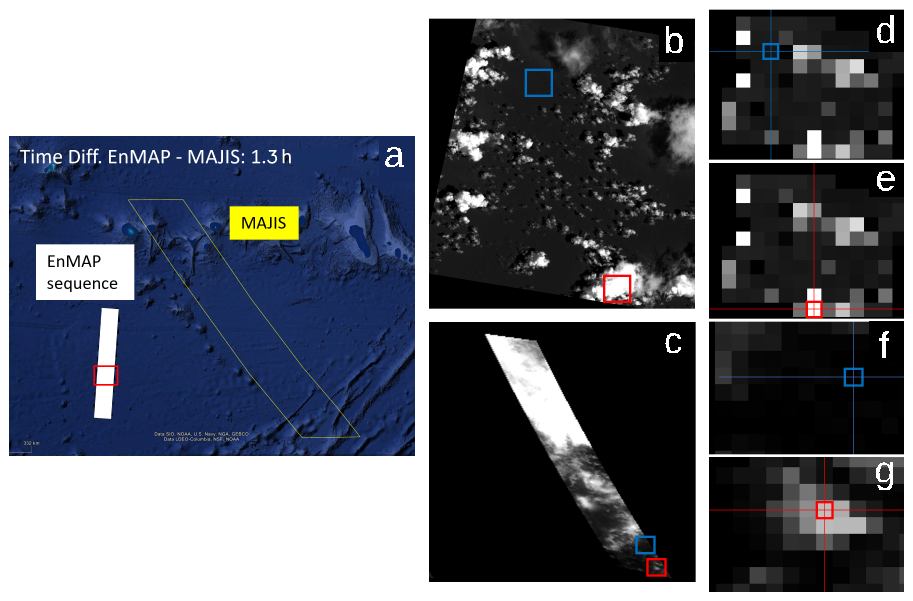
Figure 17Panel (a): location of the ENMAP observation (white area) and the MAJIS observation (C17, yellow outline) over the Pacific Ocean; Panel (b): ENMAP radiance map at 0.75 µm for the red rectangle in panel A, with the locations of the areas selected as representative of cloudy (red) and cloud-free (blue) ENMAP data; Panel (c): Radiance map at 0.750 µm for the full MAJIS swath, with areas selected for cloudy (red) and cloud-free (blue) representative spectra. Panels (d), (e): Panel (b) resampled at the MAJIS resolution with the resampled pixels selected as representative of cloudy (red) and cloud-free (blue) areas; Panels (f), (g): Zoom on the red and blue areas in panel (c), indicating the MAJIS pixels selected as representative of cloud-free (blue) and cloudy (red) areas.
Figure 17 shows how ENMAP and MAJIS data representative of cloud-free (ocean) and cloudy areas were selected. The ENMAP data (IFOV: 30 m per pixel) was averaged over an area corresponding to a MAJIS IFOV (1.4 × 3 km for C17). The red area in panel (c) was selected as representative of a patchy cloud cover similar to that of ENMAP (panel b). In addition, the brightest pixel in this area (selected as representative of clouds) reached signal levels very close to by not exceeding the saturation limit, contrary to brighter regions farther north, making it possible to compare spectra over the full overlapping spectral range of ENMAP and MAJIS. As shown by panel (b) (ENMAP high resolution image), sub-pixel variability with partial cloud coverage can be expected at the MAJIS pixel scale, so that absolute radiance comparisons must be considered with caution. Sub-pixel variability at the MAJIS pixel scale is much less likely for cloud-free areas (ocean). A uniform high cloud cover (cirrus) cannot be excluded for areas labeled as “ocean”, but it should exhibit less time and space variability than low altitude clouds, so that radiance comparisons are more reliable for areas with no low altitude clouds.
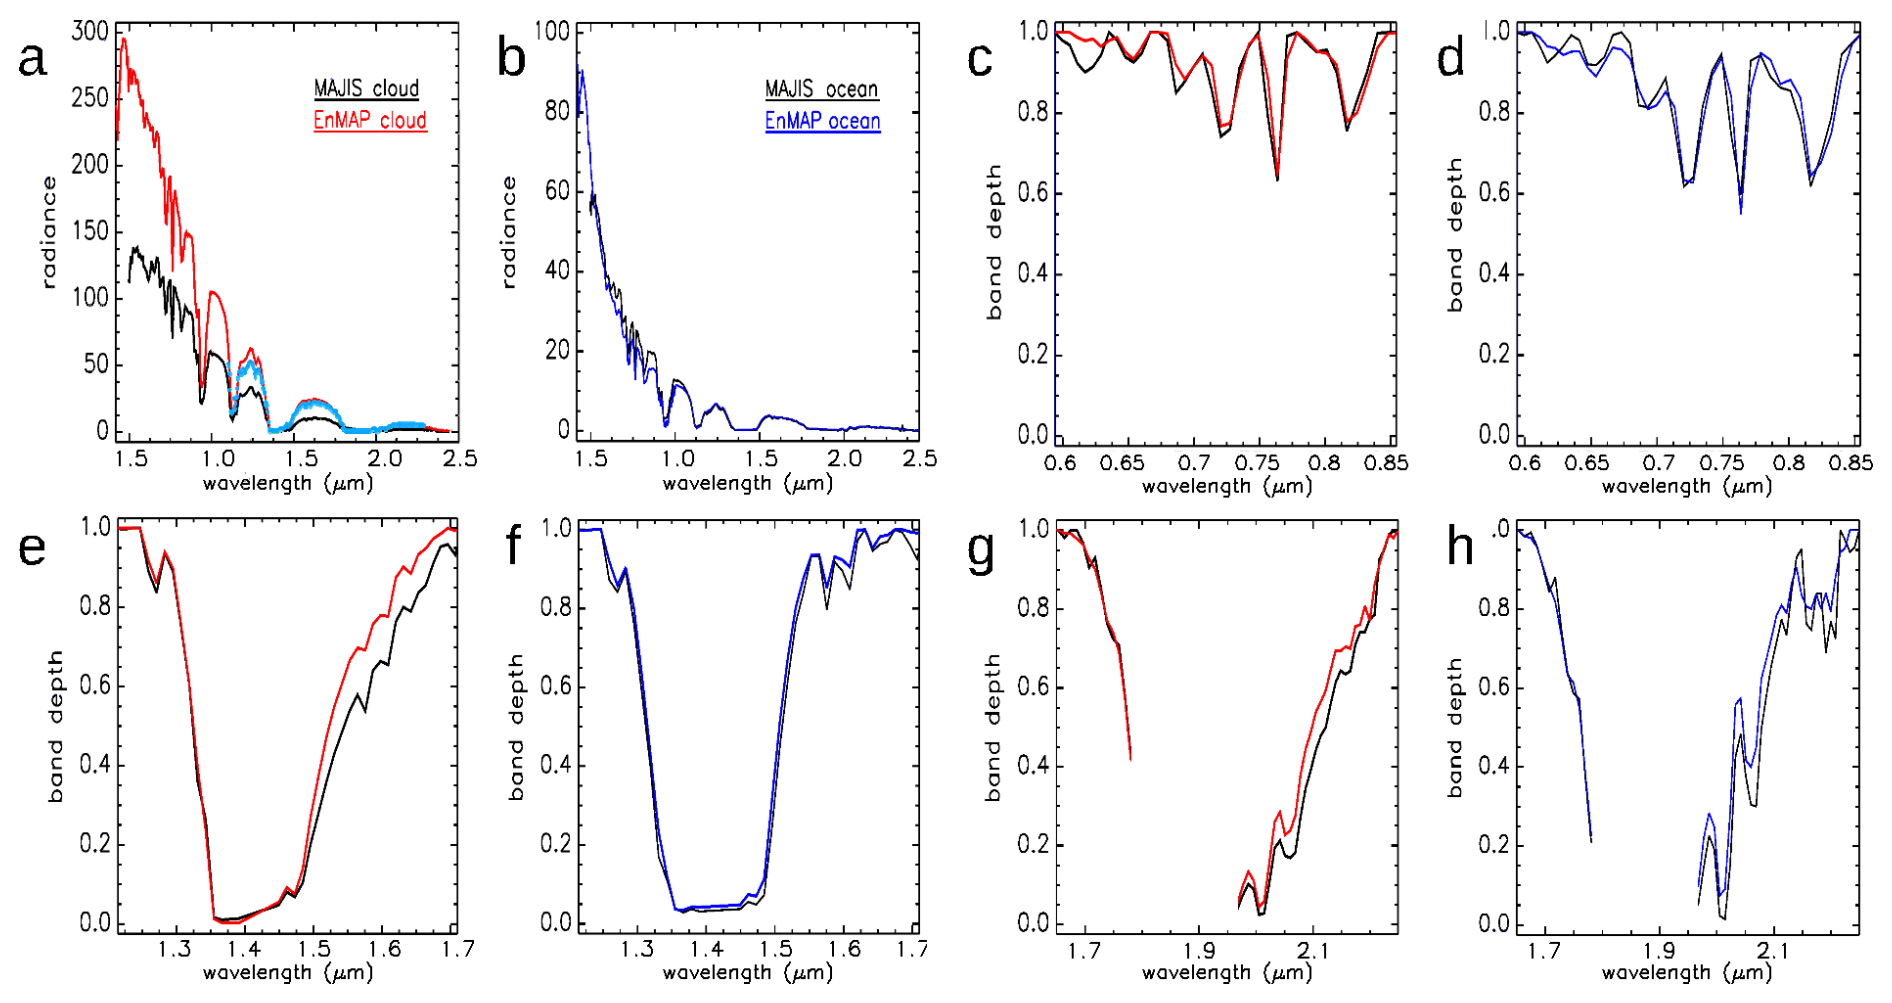
Figure 18Panel (a): Radiance measured for the resampled ENMAP pixels and the MAJIS pixels selected as representative of cloudy areas; panel (b): Same as panel (a) for cloud-free areas. The light blue radiance spectrum in panel (a) is that of a MAJIS pixel farther North, with a continuous cloud cover, for wavelengths larger than 1.1 µm (at shorter wavelengths, it reaches saturation); panel (c): Continuum removed spectra from ENMAP and MAJIS in the 0.750 µm spectral range for cloudy areas; panel (d): Same as panel (c) for cloud-free areas; panels (e), (f): Same as panels (c), (d) for the 1.5 µm H2O absorption band; panels (g), (h): Same as panels (c), (d) for the 2 µm H2O absorption band (only wavelengths sampled by ENMAP have been displayed).
Figure 18 presents the radiance spectra and continuum removed spectra in three spectral ranges for the resampled ENMAP pixels and MAJIS pixels. The SNR for MAJIS spectra is dominated by the photon noise, ranging from 50 in the deepest absorption bands up to 500 for cloudy areas at short wavelengths and the SNR for ENMAP is in the same range (150 to 500, Storch et al., 2023) so that no error bars are displayed on Fig. 18. The match in terms of radiances for cloud-free areas (panel b) is remarkably good considering the 400 km distance, the 1.3 h difference in timing and the different phase angles for the ENMAP and MAJIS areas. This good match supports the view that the albedo of the ocean and a possible high cloud cover were relatively uniform with only minor changes in 1.3 h in this area of the Pacific Ocean. With all the provisos of such radiance comparisons (it should be noted that photometric corrections were applied neither to ENMAP data nor to MAJIS data in Fig. 18), the good match for two instruments radiometrically calibrated independently supports the validity of the two radiometric calibrations.
The radiance for cloudy areas (Fig. 18, panel a) is twice higher for ENMAP than for MAJIS. This can however be attributed to sub-pixel variability, as MAJIS pixels with continuous cloud cover (light blue spectrum in panel a) exhibit similar radiances as ENMAP for wavelengths larger than 1.1 µm. They were not selected for the comparison of spectral features as the MAJIS data for these pixels is saturated for most of the 0.5–1.1 µm spectral range.
Panels (c) to (h) of Fig. 18 compare ENMAP and MAJIS spectra normalized to a continuum with the same approach for both instruments within three spectral areas of interest: 0.6–0.85, 1.25–1.7, 1.65–2.25 µm. The normalized spectral features as observed by ENMAP and MAJIS (after correction from straylight) are remarkably consistent for both the cloudy areas (panels c, e, g) and the cloud-free areas (panels d, f, h). The MAJIS band strengths in the 0.75 µm wavelength range, where the straylight contribution is significant, are 10 % to 20 % weaker for data not corrected for straylight. A similar level of straylight contribution is expected for science observations in the Jupiter system, so that it will be possible to reliably identify spectral features at wavelengths shorter than 1.2 µm even for MAJIS observations which cannot be corrected for straylight, but with limitations for quantitative modeling. The slightly different profiles at the edges of the 1.5 µm and 2 µm H2O absorption bands as observed by ENMAP perfectly align with what can be seen in the MAJIS spectra after straylight correction (Fig. 18, panels e to h). This good match of the spectroscopic information from MAJIS and ENMAP data sets supports the validity of the post-launch spectral calibration of MAJIS as presented in Sect. 2.
4.2.4 TROPOMI observations of the Earth
The TROPOspheric Monitoring Instrument (TROPOMI) is a push-broom spectrometer (Veefkind et al., 2012) on board the Sentinel-5P Precursor spacecraft (S5P), providing global daily coverage with a local overpass time of 13:30 from an altitude of 824 km. The spacecraft, part of the Copernicus Program, was launched into a polar orbit on 13 October 2017.
When assessing MAJIS Earth observation results, TROPOMI and ENMAP are very complementary as ENMAP has a lower spectral resolution and a much higher spatial resolution than MAJIS (ENMAP IFOV: 30 m to be compared to 0.9–3 km for MAJIS) while TROPOMI has a lower spatial resolution than MAJIS (7 × 3.5 km) and a much higher spectral resolution (NIR: 0.25 nm; SWIR: 0.55) that MAJIS (sampling: 3.4 nm for the VISNIR channel, 6.5 nm for the IR channel, Haffoud et al., 2024).
TROPOMI acquires a very wide swath (2600 km) on every orbit, with incidences ranging from 11 to 34° at the same latitude as that of the subsolar point (12° N on the 20th of August). Therefore, the two MAJIS observations selected for comparison were those with the lowest incidences, C15, acquired on the 20th of August (incidence: 36 to 41°, latitude: 24 to 29° N), and C17 (20h48, incidence: 23 to 30°, latitude: 20 to 27° N). C17 was also selected for comparisons with ENMAP (see Sect. 4.2.3). It should be noted that for C15 (i=36–41°, e=49–53°), the MAJIS radiance could be larger than expected from the incidence angle due to a glint contribution. The differences in spatial and spectral resolution and the lack of contemporaneous overlap makes inter-comparison challenging. However, thanks to its wide swath, TROPOMI was able to observe the area covered by the selected MAJIS observations with a similar incoming solar flux (larger than for MAJIS by a factor of 1.03 to 1.2, see Table 3) and a time difference of only ∼ 3 h. Therefore, TROPOMI data could provide spatial context to the MAJIS scans, and it could contribute to the validation of radiometric and spectral calibration of MAJIS.
Table 3Photometric angles for MAJIS cubes C15 and C17 compared to that of the TROPOMI observations.

For comparing TROPOMI and MAJIS data, we selected the 4 TROPOMI spectral bands (out of 8) that overlap with the MAJIS spectral range: bands 5 and 6 (NIR, 675–725 and 725–775 nm), and bands 7 and 8 (SWIR, 2.305–2.345 and 2.345–2.385 µm). The NIR bands have a spectral resolution of 0.25 nm, whereas the SWIR band has a spectral resolution of 0.55 nm. Bands 5 and 6 are covered by the VISNIR channel of MAJIS (0.495–2.37 µm). Bands 7 and 8 are covered by both the VISNIR channel and IR channel. The MAJIS spectral sampling is 3.5 nm for the VISNIR and 6.5 nm for the IR, but the signal is much better defined at these wavelengths with the IR channel (SNR: 100 to 400) than with the VISNIR channel (SNR: 20 to 80), with additional uncertainties from the residuals of the VISNIR straylight correction and dark subtraction. Therefore, TROPOMI bands 7 and 8 have been compared with the IR channel of MAJIS.
The first step for the MAJIS-TROPOMI inter-comparisons was to degrade the spatial resolution of MAJIS to that of TROPOMI. TROPOMI Pixel corners are provided with the Level 1b TROPOMI data products, defining a projected polygon for each TROPOMI IFOV. MAJIS pixel centers are then tested to check whether they fall within the polygons. For each TROPOMI pixel, the list of MAJIS pixels which are co-located with it (14 to 24 for TROPOMI pixels fully within the MAJIS FOV) and the time difference between MAJIS and TROPOMI (from 3 to 3.18 h for all co-located pixels) are registered.
For each TROPOMI pixel, the corresponding signal for each MAJIS spectral sample was evaluated as a weighted average of overlapping MAJIS pixels, the weights corresponding to the inverse of the distance between the TROPOMI and MAJIS pixel centers. The weight is set to 0 for MAJIS spectra flagged as saturated. The outcome of this procedure is presented in Fig. 19 for MAJIS C17.
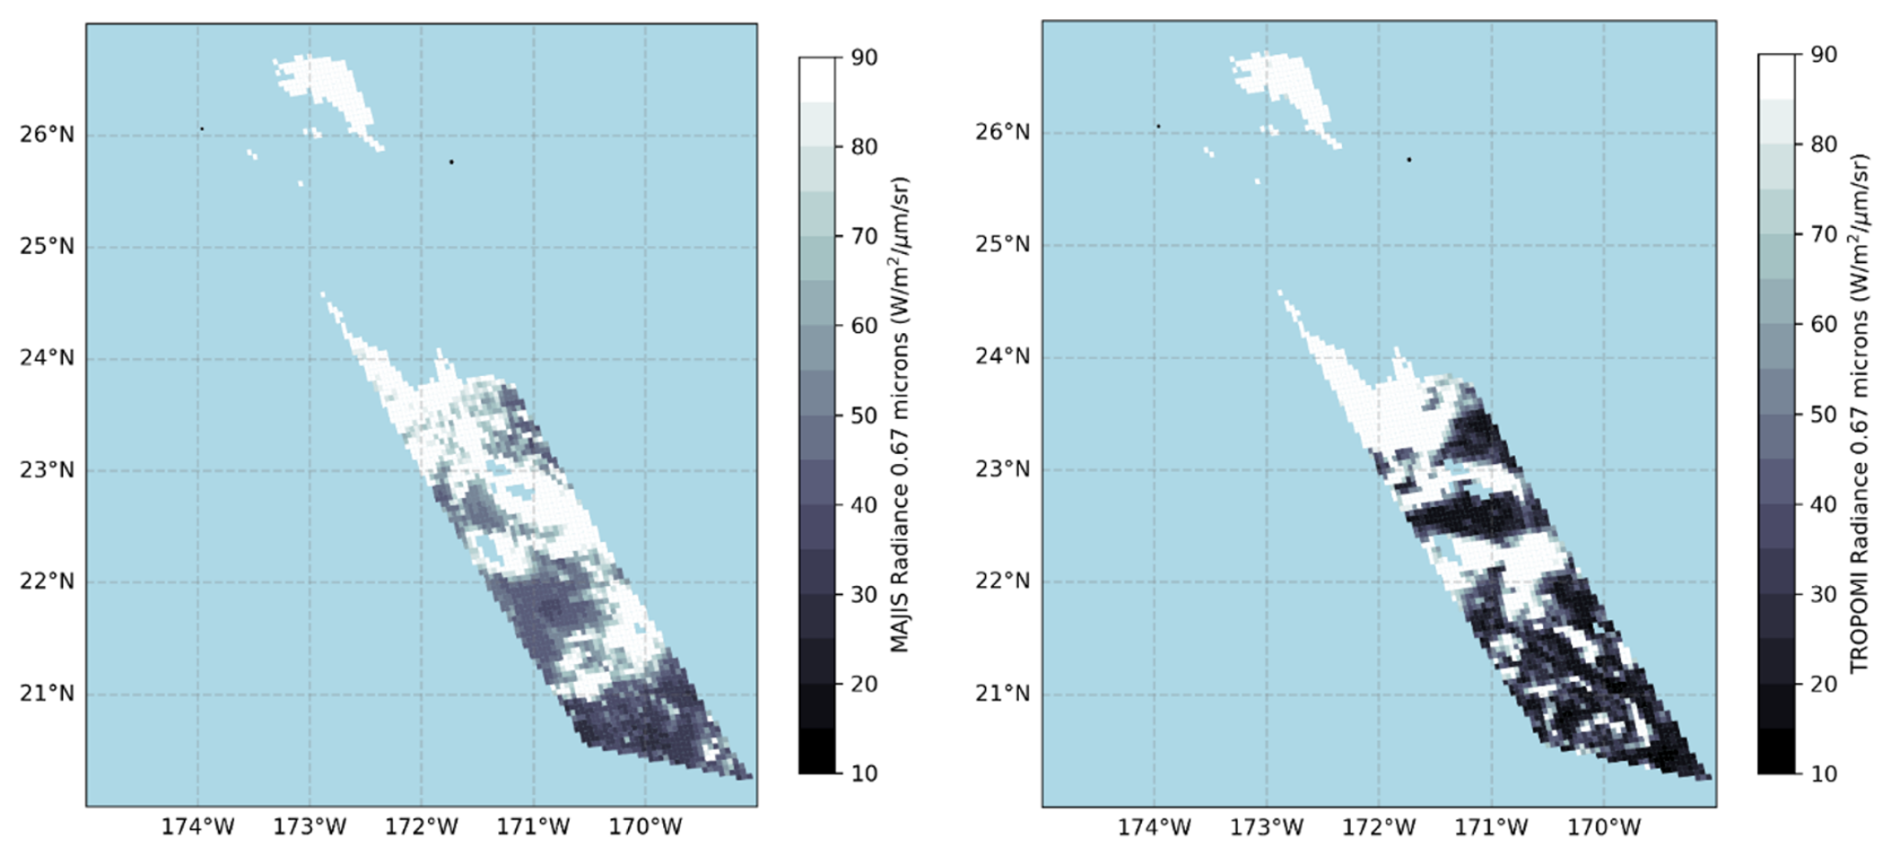
Figure 19Weighted mean MAJIS radiances (left panel) and TROPOMI radiances (right panel) for the areas covered by MAJIS observation C17 (20 August 2024, 21:48 UTC) in the TROPOMI band 5 wavelength range. The TROPOMI data was collected 3 h later. MAJIS and TROPOMI radiances corresponding to MAJIS saturated pixels have not been displayed. The solar incidence at latitudes 20 to 24° (non-saturated MAJIS pixels) ranged from 24 to 27° for MAJIS and from 22.17 to 23.68° for TROPOMI.
As expected with a time lag of 3 h between the MAJIS and TROPOMI observations, the cloud patterns as shown in Fig. 19 for a wavelength of 0.67 µm are significantly different. However, the overall balance between cloudy and cloud-free areas is similar, with less cloud cover from 20 to 22° N than from 22 to 24° N (further North, most MAJIS pixels are saturated at wavelengths shorter than 1.2 µm). The MAJIS radiances are similar to the TROPOMI radiances, with less contrast between cloudy and cloud-free areas. As we are close to the edge of the FOV, the MAJIS VISNIR straylight contribution (which reduces spatial and spectral contrasts) should be reliably subtracted (see Langevin et al., 2024). This loss of contrast could result from time variability of a high-altitude cloud layer or from the different spectral resolutions of TROPOMI and MAJIS.
In order to compare spectral features observed by MAJIS and TROPOMI, the TROPOMI spectra (with a resolution 10 to 20 times better than that of MAJIS) have been resampled to the MAJIS resolution by averaging the TROPOMI radiances within each MAJIS spectral sample. This makes it possible to investigate how narrow spectral features as measured by TROPOMI show up in the lower resolution MAJIS spectra.
Both MAJIS (mean emergence: 51° for C15, 65° for C17) and TROPOMI (mean emergence: 39° for C15, 69° for C17) observed away from nadir and the time difference between MAJIS and TROPOMI was 3 to 3.2 h. Therefore, we employed the regional averaging approach used for intercalibration of microwave sounders (John et al., 2013) as it can be implemented with drifting orbits, hence with large time differences. This method is applied to all overlapping TROPOMI and MAJIS pixels for C15 and C17 so as to obtain a single set of mean cross-calibration results from both MAJIS C15 and MAJIS C17.
Once all overlapping observations have been put on to the same spectral and spatial resolutions, data elements with quality issues are filtered out. The following tests are applied:
-
2 or more good MAJIS observations need to be co-located with the TROPOMI pixel;
-
The normalized TROPOMI noise level needs to be 5 % or less, so as to filter out TROPOMI pixels impacted by spikes
-
The normalized weighted standard deviation for MAJIS radiances for the colocated set of pixels needs to be 10 % or less: The SNR for MAJIS data elements is very high (100 to 400 at 0.75 µm), but large variations can be observed within the set if there is significant sub-pixel variability of the cloud cover within the TROPOMI pixel.
Once filtered, mean radiances were calculated for MAJIS and TROPOMI and uncertainties are propagated. The errors were evaluated as the sum of the standard error from averaging of the radiances and the propagated measurement noise after applying the resampling and intercalibration procedure.
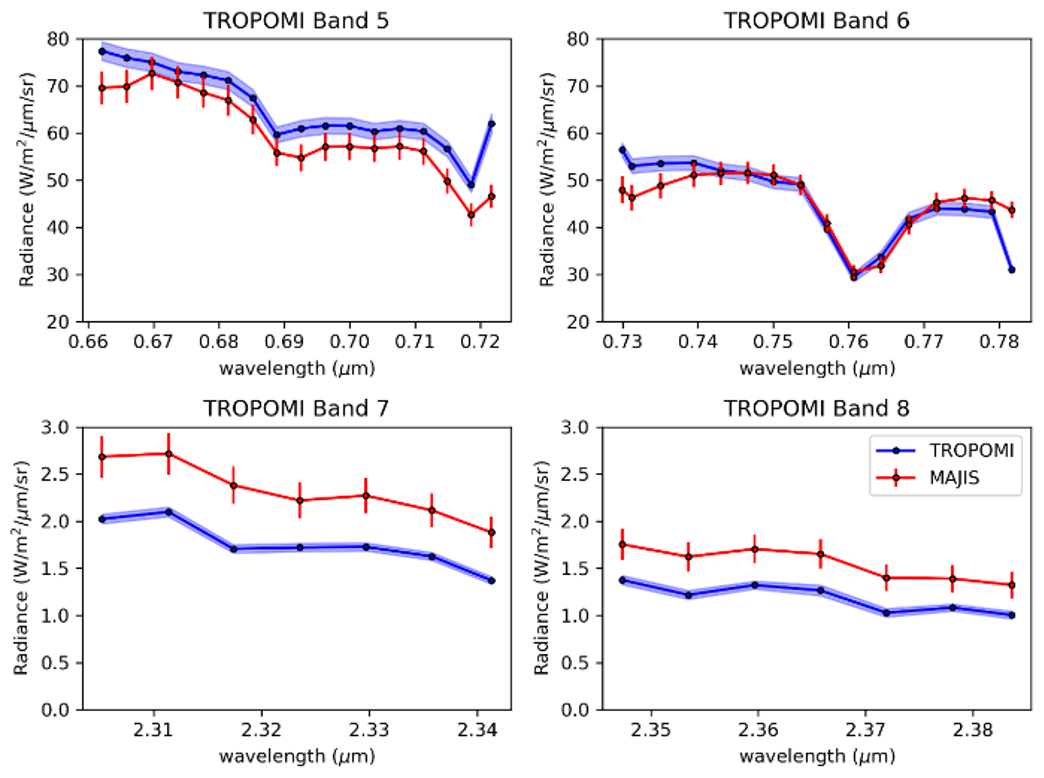
Figure 20Averaged results of collocated TROPOMI and MAJIS radiances for MAJIS observations C15 and C17. The blue shaded area represents the TROPOMI total uncertainty, and the red error bars represent the MAJIS total uncertainty, the largest contribution resulting from the variability within sets of co-located MAJIS pixels corresponding to a single TROPOMI pixel.
Figure 20 shows the results of the intercalibration procedure for MAJIS and TROPOMI for bands 5 to 8 of the TROPOMI instrument. For bands 5 and 6 (MAJIS VISNIR channel) the match in radiances is very good when considering the time lag of 3 h and the different spatial/spectral resolutions of the two instruments: MAJIS radiances are lower than TROPOMI radiances by ∼ 10 % for band 5 and by less than 2 % for band 6 near the center of the band.
TROPOMI bands 7 and 8 have been compared to data from the MAJIS IR channel, with a larger spectral sampling (6.5 nm instead of 3.5 nm, see Fig. 20). The MAJIS radiances are ∼ 20 % higher than the TROPOMI radiances for these two bands. As this bias is not observed for bands 5 and 6, it is unlikely to result from a glint contribution for MAJIS observation C15. Even if it does not result from the time difference of 3 h between MAJIS and TROPOMI observations, a 20 % offset is still within the range of what can be expected between the absolute radiometric calibration of two instruments (as an example, a bias of +15 % for JANUS was observed when compared to MAJIS for observations of the Moon, see Sect. 4.2.1).
There is also an overall agreement in terms of spectral profiles. They do not exhibit sharp spectral contrasts with the spectral resolution of MAJIS, except for the main absorption feature at 0.762 µm (band 6) for which the match is quite good. This shows that the post-launch MAJIS spectral calibration presented in Sect. 2 is in line with that of TROPOMI in the band 6 wavelength range. The main discrepancies are observed near the boundaries of TROPOMI bands 5 and 6. Modelling with different spectral grids indicates that such discrepancies can result from edge effects introduced by the resampling of TROPOMI data to the MAJIS spectral sampling.
4.2.5 PRISMA observations of the Earth
The spectral range of PRISMA (0.4–2.5 µm) covers that of the VISNIR channel of MAJIS (0.495–2.37 µm) and it extends to the lower wavelengths of the IR channel (2.28–2.5 µm). The associated scientific analysis of several spectral features of the Pacific Ocean (ocean water and liquid/ice clouds) as measured by MAJIS and by of PRIMA is presented in a companion article (Oliva et al., 2026). Observations by PRISMA of the regions observed by MAJIS have been identified, but with time intervals between the PRISMA and MAJIS observations ranging from 2 h to more than 2 d, and the four identified overlaps correspond to MAJIS observations beyond or at the terminator (Oliva et al., 2026), with very little signal in the VISNIR channel or at short wavelengths in the IR channel. The PRISMA orbit is sun-synchronous, so that the local time is always 10:30 (solar incidence: ∼ 22° at low latitudes) when JUICE and MAJIS sweep the full range of local times from beyond the dusk terminator to 13:30 so that only C15, the latest of the three straylight corrected MAJIS observations has an incidence (24 to 30°) similar to that of PRISMA observations. The PRISMA observations are distant from this MAJIS observation both in position (>15° in longitude) and time (up to 2 d) which makes it difficult to reliably compare radiances. However, as shown in Sect. 2 and by Oliva et al. (2026), MAJIS spectra and PRISMA spectra are very consistent in terms of the position and strength of major spectral signatures, which provides a validation of the post-launch spectral calibration as presented in Sect. 2 and the post-launch relative radiometric calibration as presented in Sect. 4.
4.2.6 IASI observations of the Earth
The main data set for comparisons with the MAJIS IR channel was that obtained with IASI, an instrument on-board the METOP satellites of Eumetsat as the IASI spectral range (3.7 to 15.5 µm) overlaps more than half of the spectral range of the IR channel of MAJIS (2.28 to 5.57 µm). As indicated in Sect. 4.2.4, comparisons with TROPOMI provided complementary information for the lowest wavelengths of the IR channel of MAJIS, which are not covered by IASI.
The detailed results of the comparison of IASI data and MAJIS data are presented in Guerlet et al. (2026). The spectral resolution of IASI is higher than that of MAJIS, as the spectral sampling (0.25 to 0.5 cm−1) corresponds to 0.34–0.68 nm at 3.7 µm and 0.77–1.54 nm at 5.5 µm, to be compared to 6.5 nm for MAJIS. As discussed in Sect. 2, the high spectral resolution and large spectral coverage from IASI was also used for consolidating the absolute spectral calibration of the MAJIS IR channel.
In the wavelength range of IASI, the radiance is dominated by thermal emission modulated by atmospheric bands, so that the main expected impacts of differences in observation geometry angles are that on the column density and that of possible cloud interference for very high emergences. After selecting matching observations and filtering for possible glint effects, the results presented in Guerlet et al. (2026) show that the match in radiance is outstanding (see also Fig. 4, top panel), which supports the validity of the post-launch radiometric calibration of the IR channel of MAJIS as presented in Sect. 3.2.3.
The very good results obtained by Guerlet et al. (2026) when comparing MAJIS IR channel data with IASI spectra were made possible by the very high operability and high SNR from MAJIS when observing the Earth. Contrary to the VISNIR detector, warm and hot pixels of the IR detector have a major impact on operability, with up to 5 % of non-operable data elements for long integration times and/or operating temperatures larger than 95 K (Langevin et al., 2024). The temperature of the IR detector for the first Moon observation (88 K) was that used for ground calibration. It rose to 89.6 K for the first Earth observation (the 1-day interval was too short for a full recovery of the thermal impact of the Moon flyby), rising to 91.8 K (3.8 K higher than the nominal temperature for ground calibration) for the last Earth observation (C17, see Poulet et al., 2026). A higher operating temperature results in a larger dark signal. However, this was more than offset by the very short integration time (11 ms) compared to ground calibration (100 ms), so that less than 0.2 % of spectels were not operable.
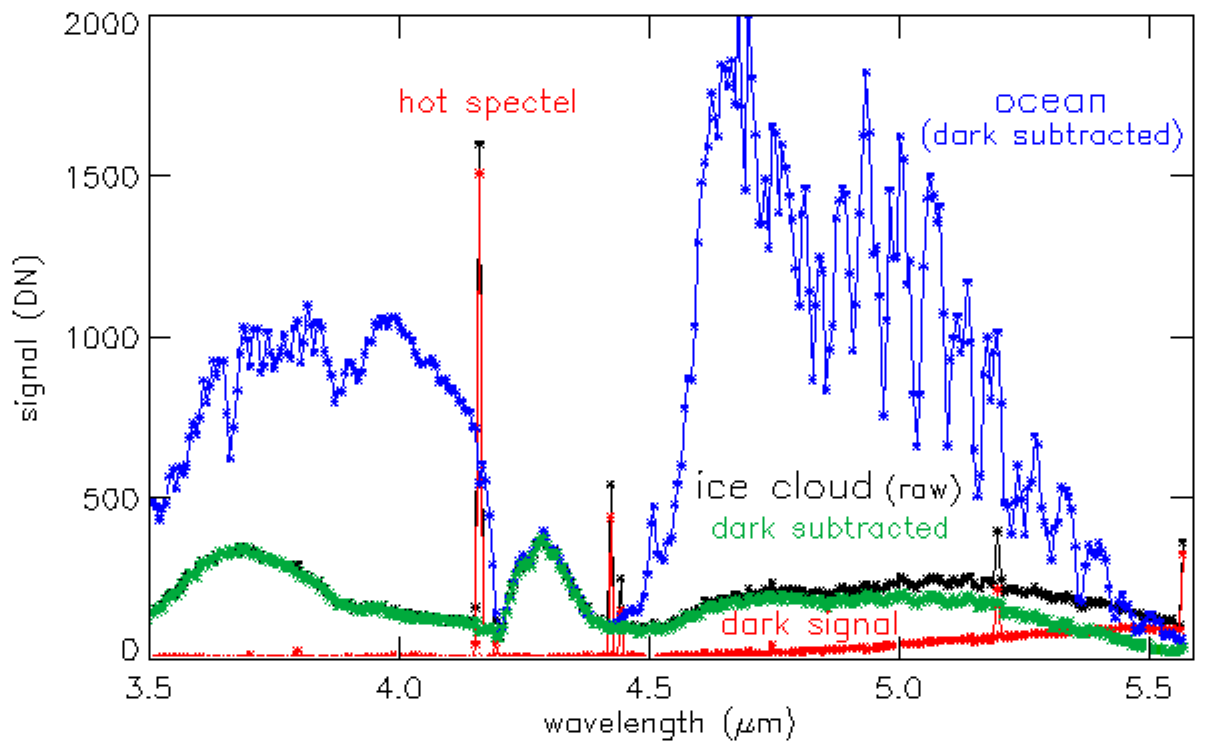
Figure 21MAJIS signals in DN during observation C17 in the wavelength range (3.6–5.56 µm) overlapping that of IASI for areas covered by an ice cloud and cloud-free areas with larger thermal radiances and much stronger atmospheric bands. The dark signal is very low with a 11 ms integration time except for 4 warm or hot spectels (stars).
MAJIS implements in-flight dark subtraction which much reduces the impact of warm and hot pixels. As shown in Fig. 21, with an integration time of 11 ms at 91.8 K, even very warm spectels with a dark signal up to 1500 DN for H1RG pixels (∼ 6300 e−, 13 % of the full well) align with their neighbors after dark subtraction, so that for most pixels all the 300 MAJIS spectels in the wavelength range overlapping that of IASI provided reliable data. It should however be noted that while the dark signal can be effectively subtracted, its shot noise still dominates the total noise of spectels with high dark signal and low actual signal (black and red stars in Fig. 21). As a result, the SNR for the warmest spectel dropped from 24 to 9 for the very cold ice cloud (green spectrum). The blue spectrum in Fig. 21 is representative of those used for comparing MAJIS with IASI. The SNR of MAJIS was 80 to 180 for signals ranging from 500 to 2000 DN. The SNR was also impacted by the high dark current of the “worst case” spectel but by a smaller factor, remaining high enough (∼ 50) to be used for comparison purposes.
The observations of the Earth atmosphere in the IR with MAJIS provide an interesting preview of the capabilities of MAJIS for observations of the atmosphere of Jupiter in the methane window from 4.5 to 5.5 µm. An integration time of ∼ 100 ms will be nominal (C17: 11 ms), with a corresponding increase in the dark signal. However, Jupiter will be observed far from thermal sources (“cold case”), with temperatures of the IR detector at least 8 K colder than for C17. The dark signal in 100 ms should be in the same range as that in 11 ms for C17, the operability of the IR detector should also be close to 100 % and the SNR for hot spots should reach up to 1000 with the stacking planned for the Jupiter observations.
4.2.7 Thermal emission from the Moon
In the wavelength range of the IR channel (2.28–5.56 µm), lunar spectra are dominated by thermal emission at wavelengths longer than 3.5 µm. This makes it possible to directly compare brightness temperatures and emittances derived from radiometrically calibrated MAJIS spectra with models of the temperature of the lunar surface as a function of solar incidence. These results are presented in Tosi et al. (2026). MAJIS observations of the thermal emission from the Moon had a very high SNR (up to 450) as the signal was close to saturation, even reaching it for the hottest surface elements over part of the spectral range.
In terms of radiometry, the main conclusion of this article is that the MAJIS lunar surface temperatures, as derived from three independent model derivations, are both self-consistent and in agreement within ±10 K with temperatures measured by a thermal mapper on-board LRO and a model of lunar surface temperatures as a function of solar incidence. This indicates that the post-launch radiometric calibration of the IR channel as presented in Sect. 3.2.3 cannot be off by more than a few % at long wavelengths (4 to 5.57 µm), in line with the conclusions of the comparisons of MAJIS data with IASI data for Earth observations.
The Earth and Moon flybys of August 2024 provided a very useful set of data for consolidating the spectral and radiometric calibration of MAJIS. The observations of the internal calibration unit (ICU) performed immediately after launch showed that there were significant changes in the response of the instrument, in particular a small spectral shift (3.8 nm for the VISNIR channel, 5.4 nm for the IR channel) reported in Haffoud et al. (2024) and a spatial shift by 4 H1RG pixels (2 MAJIS pixels) to the right for the VISNIR channel, by 3 H1RG pixels (1.5 MAJIS pixels) to the left for the IR channel. As shown in Sect. 2.1, the spatial profile of the ICU signal changed after launch, with more signal on the right of the FOV and less signal to the left of the FOV. The ICU observations also revealed a significant aliphatic contamination of the left part of the IR detector, with a decrease by up to 37 % of the response for a narrow spectral range (∼ 3.4 µm) corresponding to the C-H sp3 stretch. There was no evidence for a significant evolution of the spectral and radiometric response of MAJIS between post-launch commissioning (early June 2023) and a check-out in March 2025. No further evolution is expected until Jupiter Orbit Insertion (July 2031) as the closest approach of JUICE to the Sun (0.64 AU, corresponding to the most severe thermal stress) occurred in January 2025.
The Earth observations were the main data set of interest for the absolute spectral calibration of MAJIS, as the Earth atmosphere presents narrow absorption lines over most of the spectral ranges covered by the VISNIR channel (0.5–2.35 µm) and the IR channel (2.28–5.56 µm). The results of Sect. 2 showed that the spectral shift reported by Haffoud et al. (2024) applied to the whole VISNIR channel within 1 nm (to be compared to a sampling of 3.4 nm), confirming the absolute spectral calibration as updated from ground calibration with a constant shift of 3.8 nm. For the IR channel, the Earth observations confirmed the absolute spectral calibration as updated from ground calibration with a constant shift of 5.4 nm for wavelengths ranging from 2.28 to 3.5 µm. These analyses provided a reliable absolute spectral calibration for wavelengths larger than 3.5 µm, which were in part model dependent for ground calibration due to set-up limitations. In the IR, evaluations of the spectral FWHM from atmospheric absorption lines were also consistent with ground calibration. The absolute spectral calibration of the IR channel has been updated on this basis. It can be considered as quite reliable from comparisons with models and spectra obtained by other instruments (Sects. 2 and 4) and it has been incorporated in the MAJIS data pipeline. New versions of the already acquired MAJIS radiance cubes have been prepared and the updated spectral calibration will be used for forthcoming data sets.
As discussed in Sect. 3, the radiometric response has been updated primarily on the basis of the evolution of the ICU signal, which can be attributed to a change in the geometric relationship between the ICU sources (lamp and black body) and the scattering screen, combined with the spatial and the spectral shifts relevant for each detector. This analysis resulted in updated 2D ITF response maps for both the VISNIR and IR channel. MAJIS observed the Moon and the Earth in a very specific configuration, with a phase angle always close to 90° and a wide range of emergences and solar incidences This makes comparisons with other instruments in part model dependent, and caution is needed for the Earth due to the evolution of the cloud cover and the “glint effect” (when the solar incidence and emergence are both close to 45°). However, the MAJIS radiances as derived from the updated ITF are overall in line with that of other instruments, in particular with IASI (see Guerlet et al., 2026).
With its blue spectral slope from 0.5 to 3.5 µm and its deep H2O absorption bands, the Earth is more representative of the spectral characteristics of Jupiter and icy satellites than the Moon. This reduces the relative contribution of the VISNIR straylight, up to 15 % of the total signal at wavelengths shorter than 1.3 µm. This level of contribution is significant for radiometry and it will need to be carefully assessed, but the MAJIS Earth spectra show that there will be a relatively minor impact on the capability of MAJIS for identifying spectral signatures. The results obtained by MAJIS during the Earth flyby with a very short integration time (11 ms) confirm the excellent MAJIS performances to be expected in the Jupiter system in terms of operability and SNR with much smaller solar fluxes but longer integration times and colder operating temperatures for the IR detector.
The ICU signal will continue to be monitored during cruise, and two additional flybys of the Earth-Moon system (E2, September 2026, E3, January 2029) will provide additional checks of the MAJIS performances. A final adjustment of the spectral and radiometric response will be performed if needed on the basis of the first resolved data of Jupiter and icy moons during approach in 2031.
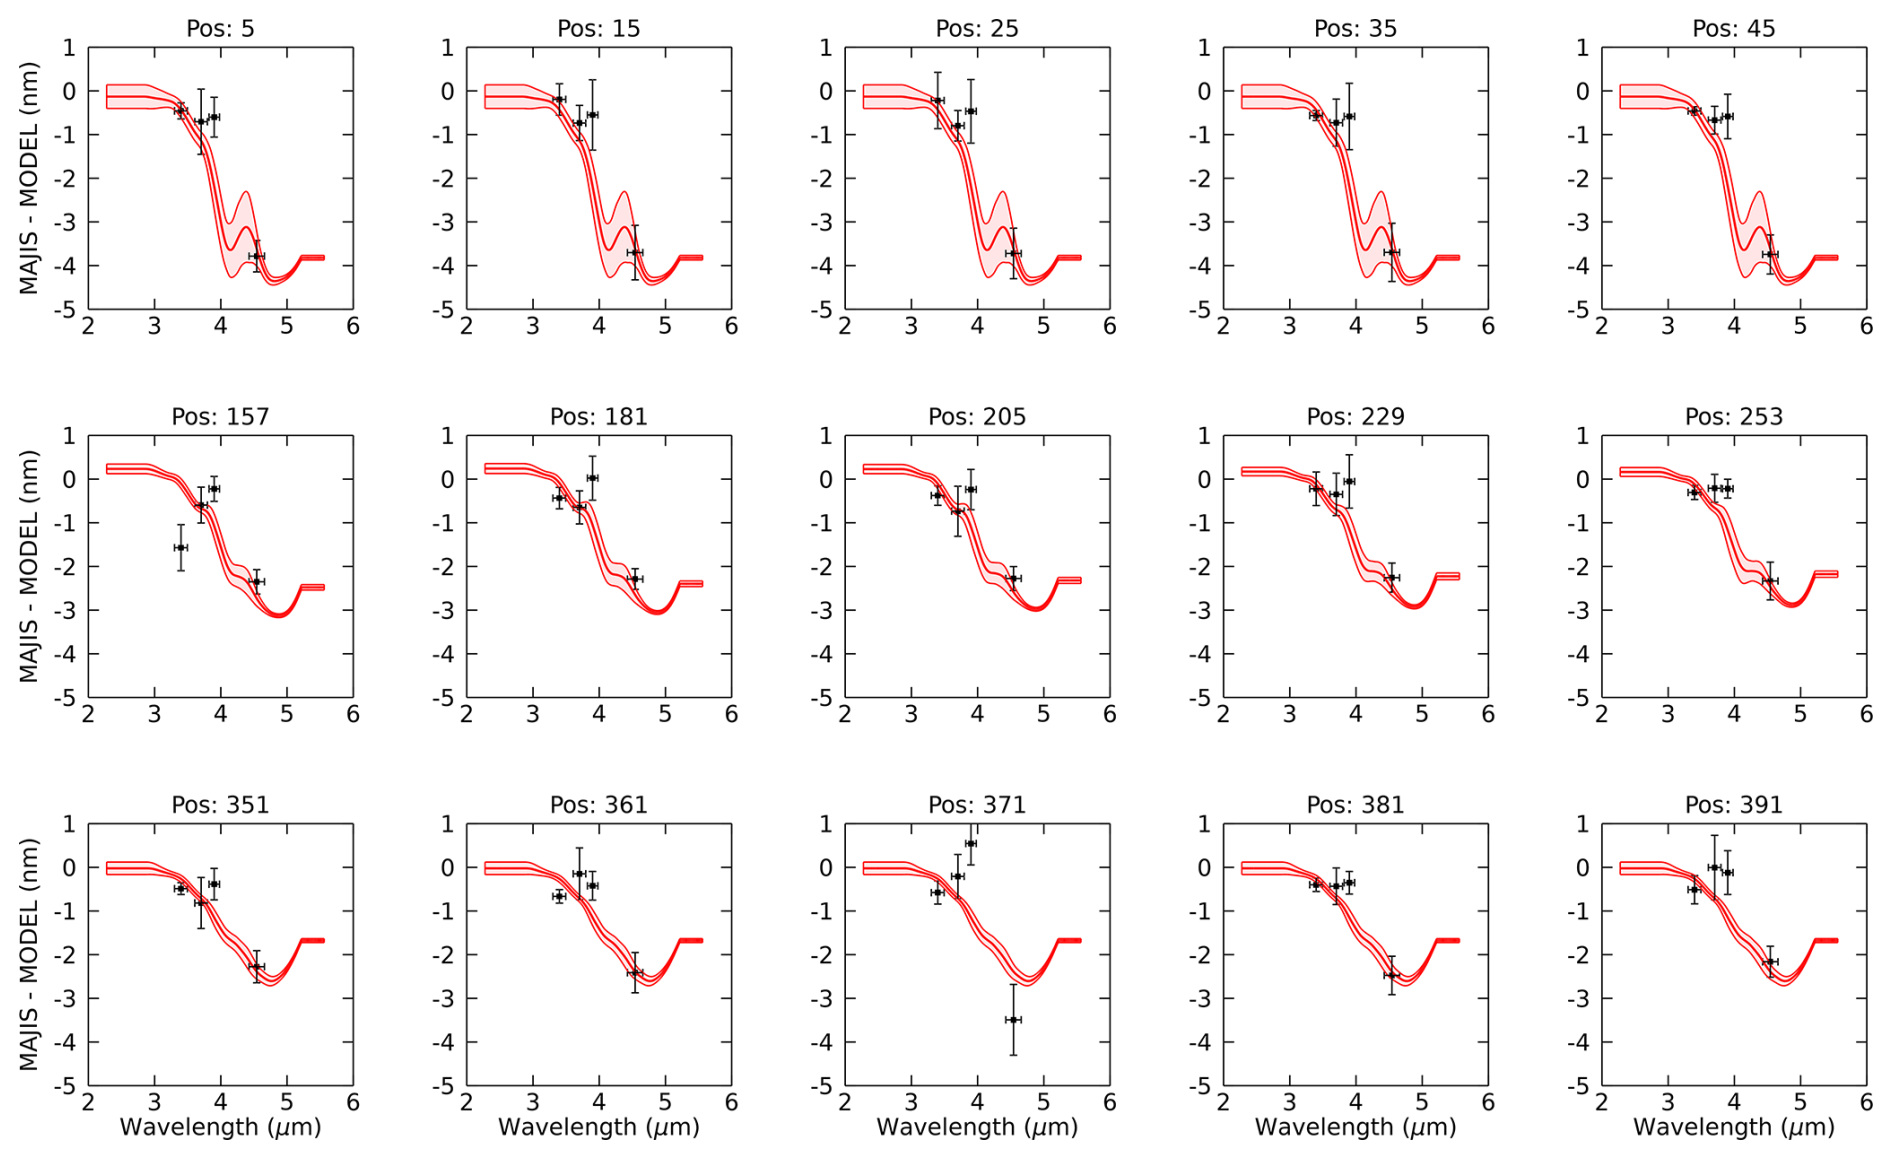
Figure A1The spectral residuals from the joint retrievals of the spectral residuals and FWHM in the 4 spectral ranges detailed in the main text are presented as black squares, along with their 1σ-uncertainties, for the 26 positions along the MAJIS slit indicated in nominal pixels on top of each panel (see also Table 1). Error bars along the wavelengths dimension indicate the width of the spectral interval over which the retrievals have been performed. These retrievals are compared with the estimation of the spectral residuals using the entire MAJIS IR channel presented in Sect. 2.1.1 and in Fig. 4 (red curve with 1σ-uncertainty envelop).
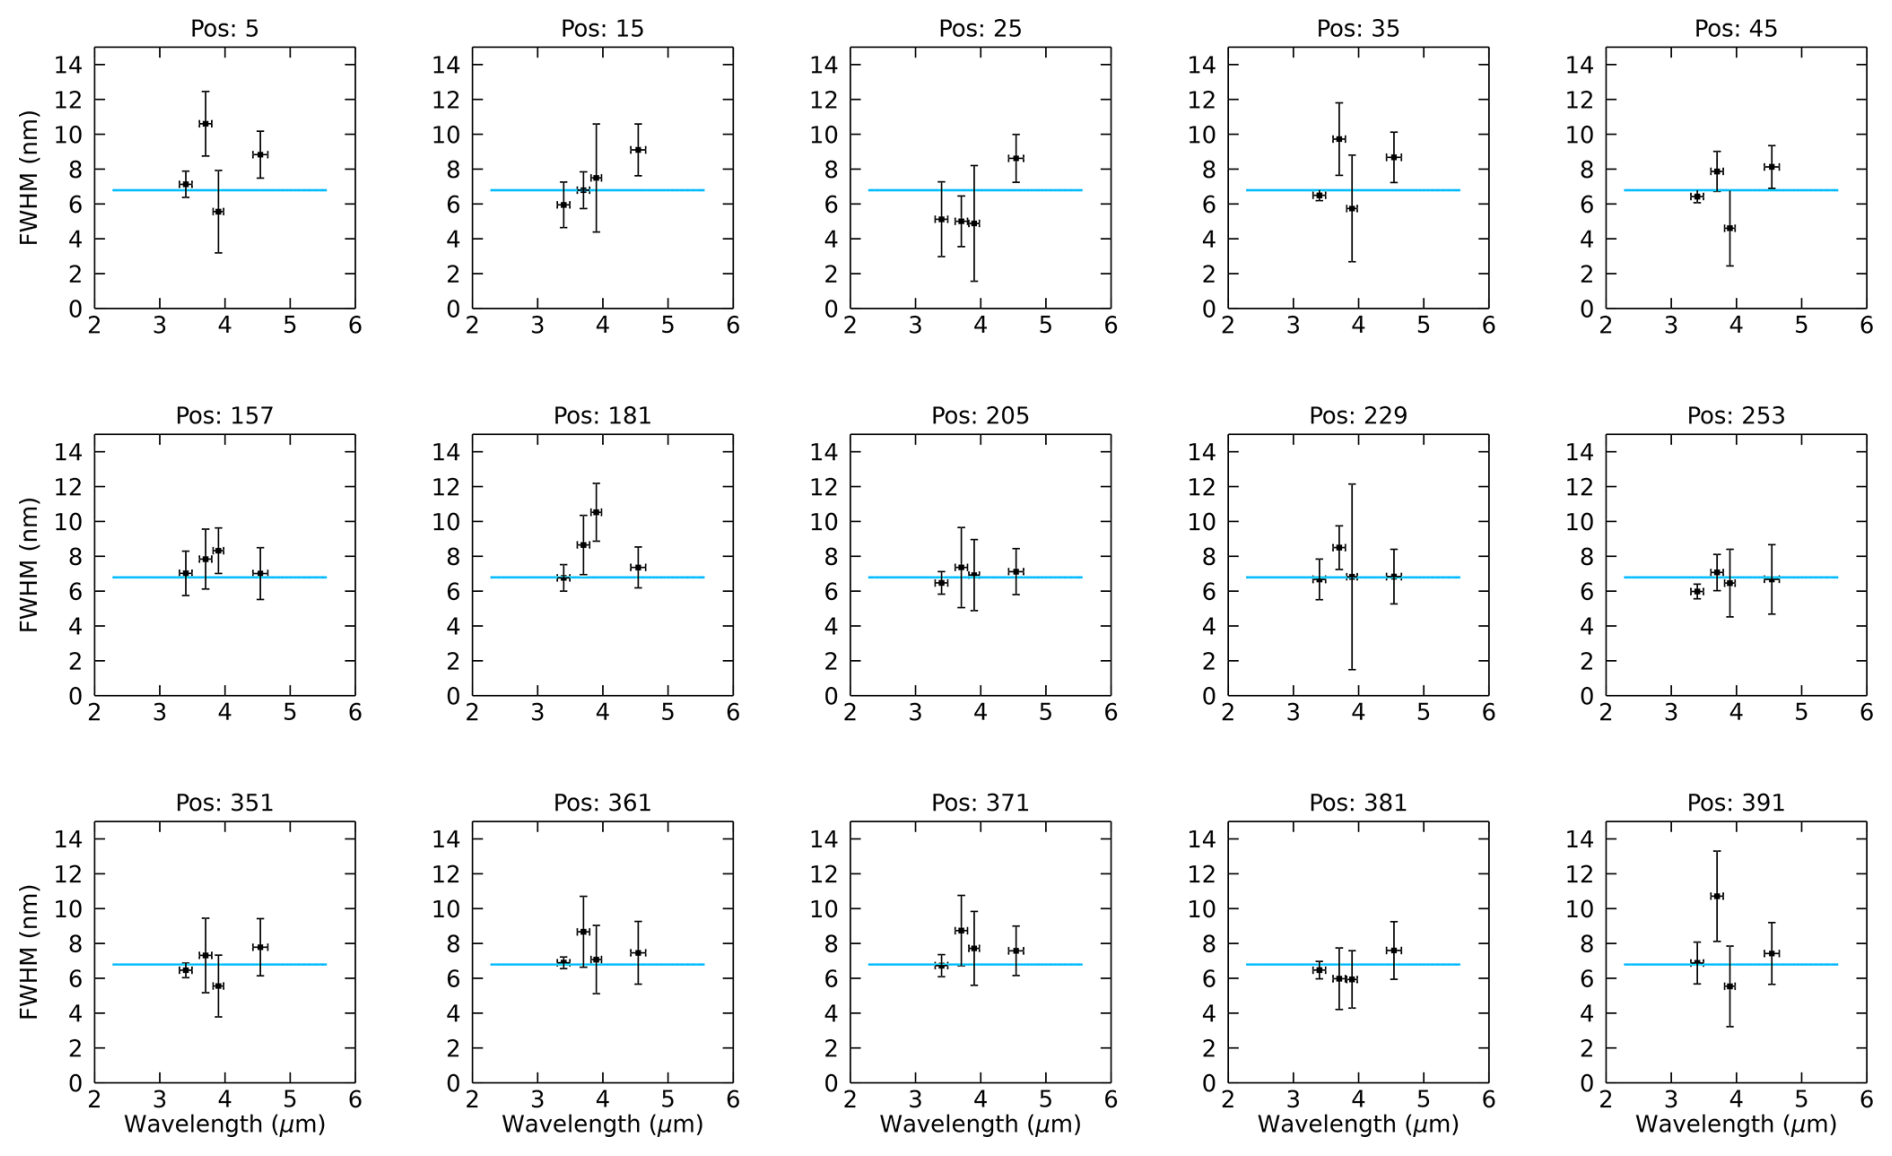
Figure A2Same as Fig. A1 but for the FWHM estimation from the joint retrievals of the spectral residual and FWHM. The blue line shows the reference FWHM in the IR channel (a constant 6.8 nm value in the case of nominal pixels) as recommended by Haffoud et al. (2024) from on-ground calibration measurements.
MAJIS calibrated data acquired during the JUICE Moon–Earth flyby in August 2024 are available through the following Guest Storage Facility: https://doi.org/10.57780/esa-2bb387d (European Space Agency, 2026).
YL, SR and FP made major contributions to the analysis of data from MAJIS and the redaction of the article. SG, GP, LA, RA, ED'A, GF, LF, FO, CR, BS, KS, FT and TT contributed to the analysis of data from MAJIS and instruments to which MAJIS Earth and Moon data was compared (IASI, JANUS, PRISMA, ENMAP, TROPOMI) and through comments to the final version of the manuscript.
The contact author has declared that none of the authors has any competing interests.
Publisher's note: Copernicus Publications remains neutral with regard to jurisdictional claims made in the text, published maps, institutional affiliations, or any other geographical representation in this paper. The authors bear the ultimate responsibility for providing appropriate place names. Views expressed in the text are those of the authors and do not necessarily reflect the views of the publisher.
This article is part of the special issue “The first-ever lunar–Earth flyby: a unique test environment for Juice”. It is not associated with a conference.
JUICE is a mission under ESA leadership with contributions from its Member States, NASA, JAXA and the Israel Space Agency. It is the first large-class mission in ESA's Cosmic Vision programme.
The authors acknowledge financial support from CNES (ROR: https://ror.org/04h1h0y33, last access: 24 August 2026) within the framework of the JUICE space mission, ASI (implementation agreement ASI–INAF n. 2023-6-HH.0), CNRS, INAF and universities for personnel and support costs.
This paper was edited by Stephanie C. Werner and reviewed by Benjamin Bultel and Jason W. Barnes.
Bugiolacchi, R., Mall, U., Bhatt, M., McKenna-Lawlor, S., and Ullaland, K.: From the Imbrium basin to crater Tycho: The first regional spectral distribution map derived from SIR-2 near-infrared data, Icarus, 223, 804–818, https://doi.org/10.1016/j.icarus.2013.01.018, 2013.
Chabrillat, S., Foerster, S., Segl, K., Beamish, A., Brell, M., Asadzadeh, S., Milewski, R., Ward, K. J., Brosinsky, A., Koch, K., Scheffler, D., Guillaso, S., Kokhanovsky, A., Roessner, S., Guanter, L., Kaufmann, H., Pinnel, N., Carmona, E., Storch, T., Hank, T., Berger, K., Wocher, M., Hostert, P., van der Linden, S., Okujeni, A., Janz, A., Jakimow, B., Bracher, A., Soppa, M. A., Alvarado, L. M. A., Buddenbaum, H., Heim, B., Heiden, U., Moreno, J., Ong, C., Bohn, N., Green, R. O., Bachmann, M., Kokaly, R., Schodlok, M., Painter, T. H., Gascon, F., Buongiorno, F., Mottus, M., Brando, V. E., Feilhauer, H., Betz, M., Baur, S., Feckl, R., Schickling, A., Krieger, V., Bock, M., La Porta, L., and Fischer, S.: The EnMAP spaceborne imaging spectroscopy mission: Initial scientific results two years after launch, Remote Sens. Environ., 315, 114379, https://doi.org/10.1016/j.rse.2024.114379, 2024.
Cheruy, F., Scott, N. A., Armante, R., Tournier, B., and Chedin, A.: Contribution to the development of radiative transfer models for high spectral resolution observations in the infrared, J. Quant. Spectrosc. Ra., 53, 597–611, https://doi.org/10.1016/0022-4073(95)00026-H, 1995.
Clark, R. N., Pearson N. C., McCord, T. B., Domingue, D. L., Livo, K. E., Boardman, J. W., Moriarty, D. P., Hendrix, A. R., Kramer, G., and Banks, M. E.: The global distribution of water and hydroxyl on the Moon as seen by the Moon Mineralogy Mapper (M3), Planet. Space Sci., 5, 198, https://doi.org/10.3847/PSJ/ad5837, 2024.
Clerbaux, C., Boynard, A., Clarisse, L., George, M., Hadji-Lazaro, J., Herbin, H., Hurtmans, D., Pommier, M., Razavi, A., Turquety, S., Wespes, C., and Coheur, P.-F.: Monitoring of atmospheric composition using the thermal infrared IASI/MetOp sounder, Atmos. Chem. Phys., 9, 6041–6054, https://doi.org/10.5194/acp-9-6041-2009, 2009.
D'Aversa, E., Oliva, F., Piccioni, G., Poulet, F., Kolmašová, I., Seignovert, B., Migliorini, A., Filacchione, G., Fletcher, L., Mura, A., Langevin, Y., Grassi, D., Rodriguez, S., Tosi, F., Ligier, N., Sindoni, G., Giardino, M., and Plainaki, C.: Spectroscopic detection of terrestrial lightning from space by JUICE-MAJIS during Earth Gravity Assist, Ann. Geophys., 44, 435–460, https://doi.org/10.5194/angeo-44-435-2026, 2026.
European Space Agency: ESA-JUICE_LEGA-Special-Issue_v1.0, European Space Agency [data set], https://doi.org/10.57780/esa-2bb387d, 2026.
Filacchione, G., Haffoud, P., Poulet, F., Piccioni, G., Langevin, Y., Tommasi, L., Barbis, A., Carter, J., Guerri, I., Dumesnil, C., De Angelis, S., Vincendon, M., Stefani, S., Pilorget, C., Tosi, F., and Rodriguez, S.: Calibration of MAJIS (Moons and Jupiter Imaging Spectrometer): II. Spatial calibration, Rev. Sci. Instrum., 95, 041301, https://doi.org/10.1063/5.0203872, 2024.
Galeazzi, C., Labate, D., and Loizzo, R.: The PRISMA payload optomechanical design, a high-performance instrument for a new hyperspectral mission, Acta Astronaut., 65, 1429–1437, https://doi.org/10.1016/j.actaastro.2009.05.022, 2009.
Guerlet, S., Armante, R., Lauzanne, N., Poulet, F., Langevin, Y., Rodriguez, S., Fletcher, L., Fouchet, T., Piccioni, G., and Migliorini, A.: MAJIS performances in the infrared during the JUICE 2024 Earth fly-by: comparisons with IASI measurements and sensitivity to trace species, EGUsphere [preprint], https://doi.org/10.5194/egusphere-2026-805, 2026.
Haffoud, P., Poulet, F., Vincendon, M., Filacchione, G., Barbis, A., Guiot, P., Lecomte, B., Langevin, Y., Piccioni, G., Dumesnil, C., Rodriguez, S., Carter, J., Stefani, S., Tommasi, L., Tosi, F., and Pilorget, C.: Calibration of MAJIS (Moons and Jupiter Imaging Spectrometer): III. Spectral calibration, Rev. Sci. Instrum., 95, 031301, https://doi.org/10.1063/5.0188944, 2024.
John, V. O., Allan, R. P., Bell, W., Buehler, S. A., and Kottayil, A.: Assessment of intercalibration methods for satellite microwave humidity sounders, J. Geophys. Res.-Atmos., 118, 4906–4918, https://doi.org/10.1002/jgrd.50358, 2013.
Kieffer, H. H. and Stone, T. C.: The spectral irradiance of the Moon, Astron. J. 129, 2887–2901, https://doi.org/10.1086/430185, 2005.
Langevin, Y., Poulet, F., Piccioni, G., Filacchione, G., Dumesnil, C., Tosi, T., Carter, C., Barbis, A., Haffoud, P., Tommasi, L., Vincendon, M., De Angelis, S., Guerri, I., Pilorget, S., Stefani, S., Bolsée, D., Cisneros, M., Van Laeken, L., Pereira, N., and Carapelle, A.: Calibration of MAJIS (Moons And Jupiter Imaging Spectrometer): IV. Radiometric calibration, Rev. Sci. Instrum., 95, 111301, https://doi.org/10.1063/5.0202702, 2024.
Li, S. and Milliken, R. E.: An empirical thermal correction model for Moon Mineralogy Mapper data constrained by laboratory spectra and Diviner temperatures, J. Geophys. Res.-Planet., 121, 2081–2107, https://doi.org/10.1002/2016JE005035, 2016.
Marquardt, D.: An Algorithm for Least-Squares Estimation of Nonlinear Parameters, J. Soc. Ind. Appl. Math., 11, 431–441, 1963.
Matsunaga, T., Ohtake, M., Haruyama, J., Ogawa, Y., Nakamura, R., Yokota, Y., Honda, C., Torii, M., Abe, M., Nimura, T., Hiroi, T., Arai, T., Saiki, K., Takeda, H., Hirata, N., Kodama, S., Sugihara, T., Demura, H., Asada, N., Terazono, J., and Otake, H.: Discoveries on the lithology of lunar crater central peaks by SELENE Spectral Profiler, Geophys. Res. Lett. 35, L23201, https://doi.org/10.1029/2008GL035868, 2008.
Ohtake, M., Haruyama, J., Matsunaga, T., Kodama, S., Morota, T., and Yokota, Y.: Scientific objectives and specification of the SELENE Multiband Imager, Adv. Space Res., 42, 301-304, https://doi.org/10.1016/j.asr.2007.04.041, 2008.
Ohtake, M., Pieters, C. M., Isaacson, P. Besse, S., Yokota, Y., Matsunaga, T., Boardman, J., Yamomoto, S., Haruyama, J., Staid, M., Mall, U., and Green, R. O.: One moon, many measurements 3: Spectral reflectance, Icarus, 226, 364–374, https://doi.org/10.1016/j.icarus.2013.05.010, 2013.
Oliva, F., D'Aversa, E., Migliorini, A., Piccioni, G., Poulet, F., Langevin, Y., Filacchione, G., Ciarniello, M., Rodriguez, S., Seignovert, B., Mura, A., Fletcher, L. N., Guerlet, S., Zinzi, A., Giardino, M., Lopinto, E., Sindoni, G., and Plainaki, C.: JUICE-MAJIS Earth observations during the 2024 gravity assist: first analysis and comparison with PRISMA data, Ann. Geophys., 44, 511–545, https://doi.org/10.5194/angeo-44-511-2026, 2026.
Palumbo, P., Roatsch, T., Lara, L. M., Castro-Marin, J. M., Della Corte, V., Hviid, S., Jaumann, R., Michaelis, H., Patel, M. R., Portyankina, G., Schmitz, N., Amoroso, M., Mugnuolo, R., Aboudan, A., Agostini, L., Althaus, C., Álvarez, F., Bartolomei, M., Behnke, T., Bilotta, T., Colombatti, G., Colosimo, A., Coustenis, A., Cremonese, G., Crews, C., Dattolo, A., Debei, S., Denk, T., Fiethe, B., Herranz, M., Hoffmann, H., Hueso, R., Koncz, A., Jiménez-Ortega, J., Lichopoj, A., Livi, L., Llamas, X., Lopes, R., Lucchetti, A., Martinez-Navajas, I., Mazzotta Epifani, E., Mertens, V., Pajola, M., Sarti, F., Schroedter, R., Stephan, K., Tosi, F., Tubiana, C., Wendler, B., Wendler, D., Williams, D., Wolff, F., Zusi, M., Chiodini, S., Ficai Veltroni, I., Galeotti, A., García-Segura, A., Greggio, D., Holland, A. D., Kenkmann, T., Leese, M. R., Magrin, D., Michalik, H., Munari, M., Noci, G. E., Paolinetti, R., Schipani, P., Soman, M., Stefanov, K. D., Turella, A., Aharonson, O., Bell, J. F., Bertini, I., Coates, A. J., Di Achille, G., Grassi, D., Groussin, O., Gwinner, K., Haruyama, J., Hauber, E., Hiesinger, H., Langevin, Y., Lainey, V., Marchi, S., Marinangeli, L., Marzari, F., Massironi, M., Mitri, G., Mottola, S., Oberst, J., Postberg, F., Poulet, F., Preusker, F., Schmidt, J., Schneider, N. M., Simon, A., Takahashi, Y., Tirsch, D., Vincendon, M., Balme, M. R., Bettanini, C., Borin, P., Capria, M. T., Elgner, S., Esposito, F., Ferranti, L., Ferrari, S., Fornasier, S., Galluzzi, V., Giacomini, L., Guzzetta, L., Jones, G. H., Kersten, E., Ledeit, L., Martellato, E., Matz, K.-D., Mennella, V., Murray, C., Otto, K. A., Pelizzo, M. G., Penasa, L., Politi, R., Popa, C., Pozzobon, R., Prieto Ballesteros, O., Re, C., Rotundi, A., Sato, M., Schmedemann, N., Shoji, D., Simioni, E., Sindoni, G., Trauthan, F., and Yair, Y.: The JANUS (Jovis Amorum ac Natorum Undique Scrutator) VIS-NIR Multi-Band Imager for the JUICE Mission, Space Sci. Rev., 221, https://doi.org/10.1007/s11214-025-01158-6, 2025.
Pieters, C. M., Goswami, J. N., Clark, R. N., Annadurai, M., and Boardman, J.: Character and spatial distribution of on the surface of the Moon seen by M3 on Chandrayaan-1, Science, 326, 568–572, https://doi.org/10.1126/science.1178658, 2009.
Poulet, F., Piccioni, G., Langevin,Y., Dumesnil, C., Tommasi, L., Carlier, V., Filacchione, G., Amoroso, M., Arondel, A., D'Aversa, E., G., Barbis, A., Bini, A., Bolsée, D., Bousquet, P., Caprini, C., Carter, J., Dubois, J.-P., Condamin, M., Couturier, S., Dassas, K., Dexet, M., Fletcher, L., Grassi, D., Guerri, I., Haffoud, P., Larigauderie, C., Le Du, M., Mugnuolo, R., Pilato, G., Rossi, M., Stefani, S., Tosi, F., Vincendon, M., Zambelli, M., Arnold, G., Bibring, J.-P., Biondi, D., Boccaccini, A., Brunetto, R., Carapelle, A., Cisneros-Gonzalez, M., Hannou, C. Karatekin, O., Le Cle'ch, J.-C., Leyrat, C., Migliorini, A., Nathues, A., Rodriguez, S., Saggin, B., Sanchez-Lavega, A., Schmitt, B., , Seignovert, B., Sordini, R., Stefan, K., Tobie, G., Zambon, F., Adriani, A., Altieri, F., Bockelée, D., Capaccioni, F., De Angelis, S., De Sanctis, M.-C., Drossart, P., Fouchet, T., Gérard, J-C., Grodent, D., Igniatiev, N., Irwin, P., Ligier, N., Manaud, N., Mangold, N., Mura, A., Pilorget, C., Quirico, E., Renotte, E., Strazzulla, G., Turrini, D., Vandaele, A.-C., Carli, C., Ciarnello, M., Guerlet, S., Lellouch, E., Mancarella, F., Morbidelli, A., Le Mouélic, S., Raponi, A., Sindoni, G., and Snels, M.: Moon and Jupiter Imaging Spectrometer (MAJIS on Jupiter Icy Moons Explorer (JUICE), Space Sci. Rev., 220, https://doi.org/10.1007/s11214-024-01057-2, 2024.
Poulet, F., Piccioni, G., Langevin, Y., Dumesnil, C., Carlier, V., Seignovert, B., Dexet, M., Fletcher, L. N., Leyrat, C., Altieri, F., Carter, J., D'Aversa, E., De Sanctis, M., Grassi, D., Guerlet, S., Le Mouélic, S., Migliorini, A., Oliva, F., Royer, C., Rodriguez, S., Stephan, K., Tosi, F., Zambon, F., Adriani, A., Arnold, G., Bibring, J.-P., Bockelée, D., Brunetto, R., Capaccioni, F., Carli, C., Cavalié, T., Cisneros González, M., Ciarnello, M., De Angelis, S., Drossart, P., Filacchione, G., Fouchet, T., Gérard, J.-C., Grodent, D., Irwin, P., Jacquinod, S., Karatekin, O., Lellouch, E., Ligier, N., Mangold, N., Mebsout, M., Merlin, F., Morbidelli, A., Mura, A., Nathues, A., Palumbo, M. E., Pilorget, C., Poch, O., Quirico, E., Raponi, A., Robert, S., Roussos, E., Sanchez-Lavega, A., Schmitt, B., Sindoni, G., Snels, M., Sordini, R., Stefani, S., Strazzulla, G., Trent, T., Tobie, G., Turrini, D., Vandaele, A.-C., Vincendon, M., Witasse, O., Vallat, C., and Moraino, A.: ESA/JUICE encounters Earth/Moon in 2024: overview of the Moons And Jupiter Imaging Spectrometer (MAJIS) observations, Ann. Geophys., 44, 163–193, https://doi.org/10.5194/angeo-44-163-2026, 2026.
Rodriguez, S., Vincendon, M., Haffoud, P., Langevin, Y., Poulet, P., Quirico, E., Pilorget, P., Filacchione, G., Carter, J., Brunetto, R., Lecomte, B., Guiot, P., Dumesnil, C., and Piccioni, G.: The on-ground calibration of the JUICE/MAJIS instrument: V. Validation with mineral samples and reference materials, Rev. Sci. Instrum., 95, 101301, https://doi.org/10.1063/5.0215249, 2024.
Scott, N. A. and Chedin, A.: A Fast Line-by-Line Method for Atmospheric Absorption Computations: The Automatized Atmospheric Absorption Atlas, J. Appl. Meteorol., 20, 802–812, 1981.
Seignovert, B., Poulet, F., Langevin, Y., D'Aversa, E., Ligier, N., Dumesnil, C., Mesbout, M., Leyrat, C., Jacquinod, S., Le Mouélic, S., Tobie, G., Mangold, N., Piccioni, G., Tosi, F., Stephan, K., Palumbo, P., Agostini, L., Penasa, L., Le Deit, L., Cornet, T., Belgacem, I., Costa-Sitja, M., Escalante Lopez, A., and Schmauß, S.: Geometric in-flight calibration of MAJIS (JUICE) during early cruise phase and LEGA flyby, EGUsphere [preprint], https://doi.org/10.5194/egusphere-2026-2655, 2026.
Stefani, S, Piccioni, G., Poulet, F., Filacchione, G., Vincendon, M., Barbis, A., Tommasi, L., Guerri, I., Langevin, Y., Dumesnil, C., Haffoud, P., Rodriguez, S., Carter, J., Biondi, D., Boccacini, A., De Angelis, S., Tosi, F., Pilorget, C., Guiot, P., and Lecompte, B.: Calibration of MAJIS (Moons And Jupiter Imaging Spectrometer): VI. The Internal Calibration Unit (ICU), Rev. Sci. Instr., 011301, 96, https://doi.org/10.1063/5.0221810, 2025.
Storch, T., Honold, H.-P., Chabrillat, S., Habermeyer, M., Tucker, P., Brell, M., Ohndorf, A., Wirth, K., Betz, M., Kuchler, M., Mühle, H., Carmona, E., Baur, S., Mücke, M., Löw, S., Schulze, D., Zimmermann, S., Lenzen, C., Wiesner, S., Aida, S., Kahle, R., Willburger, P., Hartung, S., Dietrich, D., Plesia, N., Tegler, M., Schork, K., Alonso, K., Marshall, D., Gerasch, B., Schwind, P., Pato, M., Schneider, M., de los Reyes, R., Langheinrich, M., Wenzel, J., Bachmann, M., Holzwarth, S., Pinnel, N., Guanter, L., Segl, K., Scheffler, D., Foerster, S., Bohn, N., Bracher, A., Soppa, M. A., Gascon, F., Green, R., Kokaly, R., Moreno, J., Ong, C., Sornig, M., Wernitz, R., Bagschik, K., Reintsema, D., Porta, L., Schickling, A., and Fischer, S.: The EnMAP imaging spectroscopy mission towards operations, Remote Sens. Environ., 294, 113632, https://doi.org/10.1016/j.rse.2023.113632, 2023.
Tosi, F., Royer, C., Colaiuta, F., Poulet, F., Powell, T. M., Greenhagen, B. T., Langevin, Y., Mura, A., Piccioni, G., Pilorget, C., Carli, C., and Zambon, F.: The JUICE 2024 close flyby of the Moon: thermal assessment from MAJIS, Ann. Geophys., 44, 547–576, https://doi.org/10.5194/angeo-44-547-2026, 2026.
Veefkind, J. P., Aben, E. A. A., McMullan, K., Förster, H., de Vries, J., Otter, G., Claas, J., Eskes, H. J., de Haan, J. F., Kleipool, Q., van Weele, M., Hasekamp, O., Hoogeveen, R., Landgraf, J., Snel, R., Tol, P. J. J., Ingmann, P., Voors, R., Kruizinga, B., Vink, R., and Visser, H.: TROPOMI on the ESA Sentinel-5 Precursor: A GMES mission for global observations of the atmospheric composition for climate, air quality and ozone layer applications, Remote Sens. Environ., 120, 70–83, 2012.
Zambon, F., Altieri, F., De Sanctis, M. C., Le Mouélic, S., Piccioni, G., Poulet, F., Langevin, Y., Royer, C., Tosi, F., Karatekin, O., Mura, A., and Carli, C.: Spectral analyzes of lunar regions observed by MAJIS during the JUICE Earth-Moon flyby, EGUsphere [preprint], https://doi.org/10.5194/egusphere-2026-876, 2026.
- Abstract
- Introduction
- Spectral calibration and its post-launch evolution
- Radiometric calibration: status after ground calibration and post launch evolution
- Comparison of the MAJIS data on the Moon and Earth with other data sets
- Conclusion
- Appendix A
- Data availability
- Author contributions
- Competing interests
- Disclaimer
- Special issue statement
- Acknowledgements
- Financial support
- Review statement
- References
- Abstract
- Introduction
- Spectral calibration and its post-launch evolution
- Radiometric calibration: status after ground calibration and post launch evolution
- Comparison of the MAJIS data on the Moon and Earth with other data sets
- Conclusion
- Appendix A
- Data availability
- Author contributions
- Competing interests
- Disclaimer
- Special issue statement
- Acknowledgements
- Financial support
- Review statement
- References