
the Creative Commons Attribution 4.0 License.
the Creative Commons Attribution 4.0 License.
 | 24 Aug 2026
High latitude, dayside rapid geomagnetic variations observed with ground-based magnetometers in Greenland
Marie Vigger Eldor
Magnar Gullikstad Johnsen
Nils Olsen
Anna Naemi Willer
We identify a previously unrecognized population of rapid geomagnetic variations associated with cusp dynamics. These variations produce distinct summertime signatures in the high–latitude ground magnetometer observations near the cusp. In this study, we apply four years of data from the high time resolution West Greenland magnetometer chain and perform a statistical analysis of rapid geomagnetic variations in the ultra low frequency (ULF) regime as a function of season, magnetic latitude, magnetic local time, and interplanetary magnetic field parameters. The magnetic perturbations are characterised using a broadband metric that integrates variability in the 10–600 s period range. This metric captures geomagnetic responses to transient, impulsive, and wave-like magnetospheric phenomena as well as ULF wave activity.
We find that rapid geomagnetic variability at the highest latitudes, in the cusp and beyond, is sensitive to seasonal change, indicating that the ionospheric currents generating the observed ground magnetic signatures depend on solar illumination to obtain sufficient conductivities. This effect, in concert with dipole tilt, was investigated, and a clear cusp-related population during summer was found. In winter, this population weakens owing to a lack of sunlight and merges with other signals such as ULF waves associated with Alfvénic interhemispheric bouncing further south, and, thus, becomes indiscernible. Furthermore, we discuss other aspects of our statistical analysis and briefly address relationships between our detected signals and other known cusp phenomena.
- Article
(12244 KB) - Full-text XML
- BibTeX
- EndNote


Interaction between the solar wind and the magnetosphere, and the associated transfer of energy and momentum into the ionosphere, is highly variable and features a range of transient, impulsive, and oscillating phenomena. Under southward interplanetary magnetic field (IMF) conditions, the solar wind is in its most geoeffective state. Magnetic reconnection, occurring somewhere in the subsolar region on the magnetopause, allows for the accumulation of magnetic flux in the lobes and for plasma of magnetosheath origin to enter deeper into the magnetosphere. Under northward IMF, less energy is transferred from the solar wind; nevertheless, reconnection occurs in the high latitude lobes either in one or both of the hemispheres, driving ionospheric dynamics at high latitudes. Magnetopause reconnection is pulsed in nature, and is observed as flux transfer events (FTEs) (Russell and Elphic, 1978, 1979; Elphic et al., 1990). Identified repetition rates of FTEs range between a few to about 15 min (Lockwood and Wild, 1993), multiple reconnection X-lines, theorised by Lee et al. (1988) and observed e.g. by Hasegawa et al. (2010) and Fuselier et al. (2022), allow for the variability of observed FTE rates. The ionospheric manifestation of magnetopause reconnection, i.e., the dynamics observed under the magnetospheric cusps, is diverse and has a wide range of transient features. Generally, the north-south component of the IMF determines the latitudinal location of the ionospheric cusp, where the location is fairly static under northward conditions. IMF By modulates the MLT location, with signatures on the morning (afternoon) side of magnetic noon for By<0 (>0). This applies to the cusp convection throat region location and direction of the east-west ionospheric flow immediately poleward of it (Svalgaard-Mansurov effect (Svalgaard, 1968; Mansurov, 1969; Newell et al., 2004)), the location of cusp precipitation (Newell and Meng, 1989), motion of poleward moving auroral forms (PMAFs) (Sandholt and Farrugia, 1999), and the cusp ionospheric current system (DPY current) behaviour (Friis-Christensen and Wilhjelm, 1975; Øieroset et al., 1997). FTEs generate PMAFs, associated reversed flow events (RFEs) (Rinne et al., 2007), and flow channels produced by very strong electric fields (Pinnock et al., 1993) in the cusp. Such poleward moving structures have also been identified in imaging riometers as propagating absorption events (Stauning, 1996, 1998). Travelling convection vortices (TCVs) are another transient phenomenon seen in the dayside high latitude ionosphere (Friis-Christensen et al., 1988). TCVs are the Hall-current induced ground magnetic signatures, associated with systems of Birkeland currents connecting the near magnetopause on the magnetospheric flanks with the ionosphere, propagating along the poleward edge of the auroral oval, from the dayside in the anti-sunward direction. The above mentioned phenomena give rise to impulsive and transient signatures of energy transfer from the solar wind to the magnetosphere. Another class of such phenomena is signatures of ultra low frequency (ULF) waves in the magnetosphere, which are also present in the vicinity of the ionospheric cusp. ULF signals have been studied extensively using ground-based magnetometers over the last century (Eschenhagen, 1897; Rolf, 1931; Harang, 1932; Jacobs et al., 1964; Jacobs, 1970; Brekke et al., 1987, e.g.,). The International Geophysical Year (1958–59) saw a tremendous increase in reports of geomagnetic pulsations, and soon thereafter, the International Association of Geomagnetism and Aeronomy (IAGA) put forward a scheme (Jacobs et al., 1964) for their classification into continuous (Pc) and irregular (Pi) pulsations. Pc and Pi are further divided into numbered subcategories according to the frequency bands: Pc 1 (200–5000 mHz), Pc 2 (100–200 mHz), Pc 3 (22.2–100 mHz), Pc 4 (6.67–22.2 mHz), Pc 5 (1.67–6.67 mHz), Pi 1 (25–1000 mHz), Pi 2 (6.67–25 mHz). With the advent of the space age, satellites could verify the magnetospheric origins of the magnetic signatures on the ground (e.g., Sonett et al., 1959; Greenstadt et al., 1967; Heppner et al., 1967; Sonnerup et al., 1969).
Substorm studies have established a clear relationship between Pi 2 signatures and substorm onset. These are waves that are generated in relation to the westward travelling surge that propagates across magnetic local times (MLTs) and thus have a global signature (Sakurai and McPherron, 1983; Kepko and Kivelson, 1999). The review paper by Glassmeier (1989) details ULF distribution and occurrence as a function of latitude and MLT; however, due to low sampling and poor data coverage, only a limited amount of high-latitude studies have been conducted. One of these is the study by Rostoker et al. (1972) who investigated the occurrence of Pc 4 and Pc 5 pulsations throughout Canada (58.7–77.7° magnetic latitudes). They found one population of narrow-band ULF signals in the cusp vicinity that increased in frequency with decreasing magnetic latitude, which is consistent with an Alfvén wave bouncing between the hemispheres on closed field lines. Furthermore, another wideband ULF population was discovered north of ∼ 75° magnetic latitude that was attributed to processes in the polar cusp, and thus they suggested it could be used as a proxy for the open closed fieldline boundary (OCB).
McHarg and Olson (1992) and McHarg et al. (1995) were the first to associate observed dayside, broadband ULF signatures with auroral particle precipitation at cusp latitudes from Svalbard. They proposed a categorisation based on daily changes in the cusp signature as the observing station rotates with the Earth. This was later challenged by Engebretson et al. (1995), who applied the magnetometer array for cusp and cleft studies (MACCS) network of search coil magnetometers to show that the signatures observed by McHarg et al. (1995) occur simultaneously over a large portion of the dayside, high latitude, ionosphere. In a more recent study Pilipenko et al. (2015) used SuperDARN data to show how ULF signals occur several degrees lower than the polar cusp location, further supporting the findings of Engebretson et al. (1995). However, due to the lack of high–latitude climatological studies of the ULF signal occurrence, its origin is still not fully established.
Although dayside observations of ULF waves have been studied for many years, the bulk of work has been focused on wintertime cusp dynamics and magnetic latitudes up to 75°. Owing to the general inaccessibility on the ground to magnetic latitudes above ∼75°, fewer studies, using the MACCS magnetometer network and the Automated Geophysical Observatories in Antarctica (e.g., Engebretson et al., 2006), have focused on very high latitudes. E.g. Vennerstrøm (1999), performed a statistical study of Pc 5 signals using the Greenland magnetometer chain. Recent upgrades enhance the potential of the Greenland magnetometers as a high cadence, dense magnetometer chain available for statistical investigations of ULF waves above these frequencies, covering auroral oval to polar cap latitudes.
In this paper, we present statistical results of rapid, geomagnetic variations from the Greenland magnetometer chain, with a focus on covering magnetic latitudes from the auroral zone to the polar cap. We found the existence of a distinct population of variations poleward of the statistical cusp region, with a clear minimum separating it from the region of activity associated with dynamics along the auroral oval, on closed field lines. After presenting the used data and their processing in Sect. 2, we report on the results in Sect. 3 and discuss them in relation to potential driving mechanisms, magnetospheric dynamics, and other parameters such as solar wind in Sect. 4. The paper finishes with a conclusion and outlook in Sect. 5.
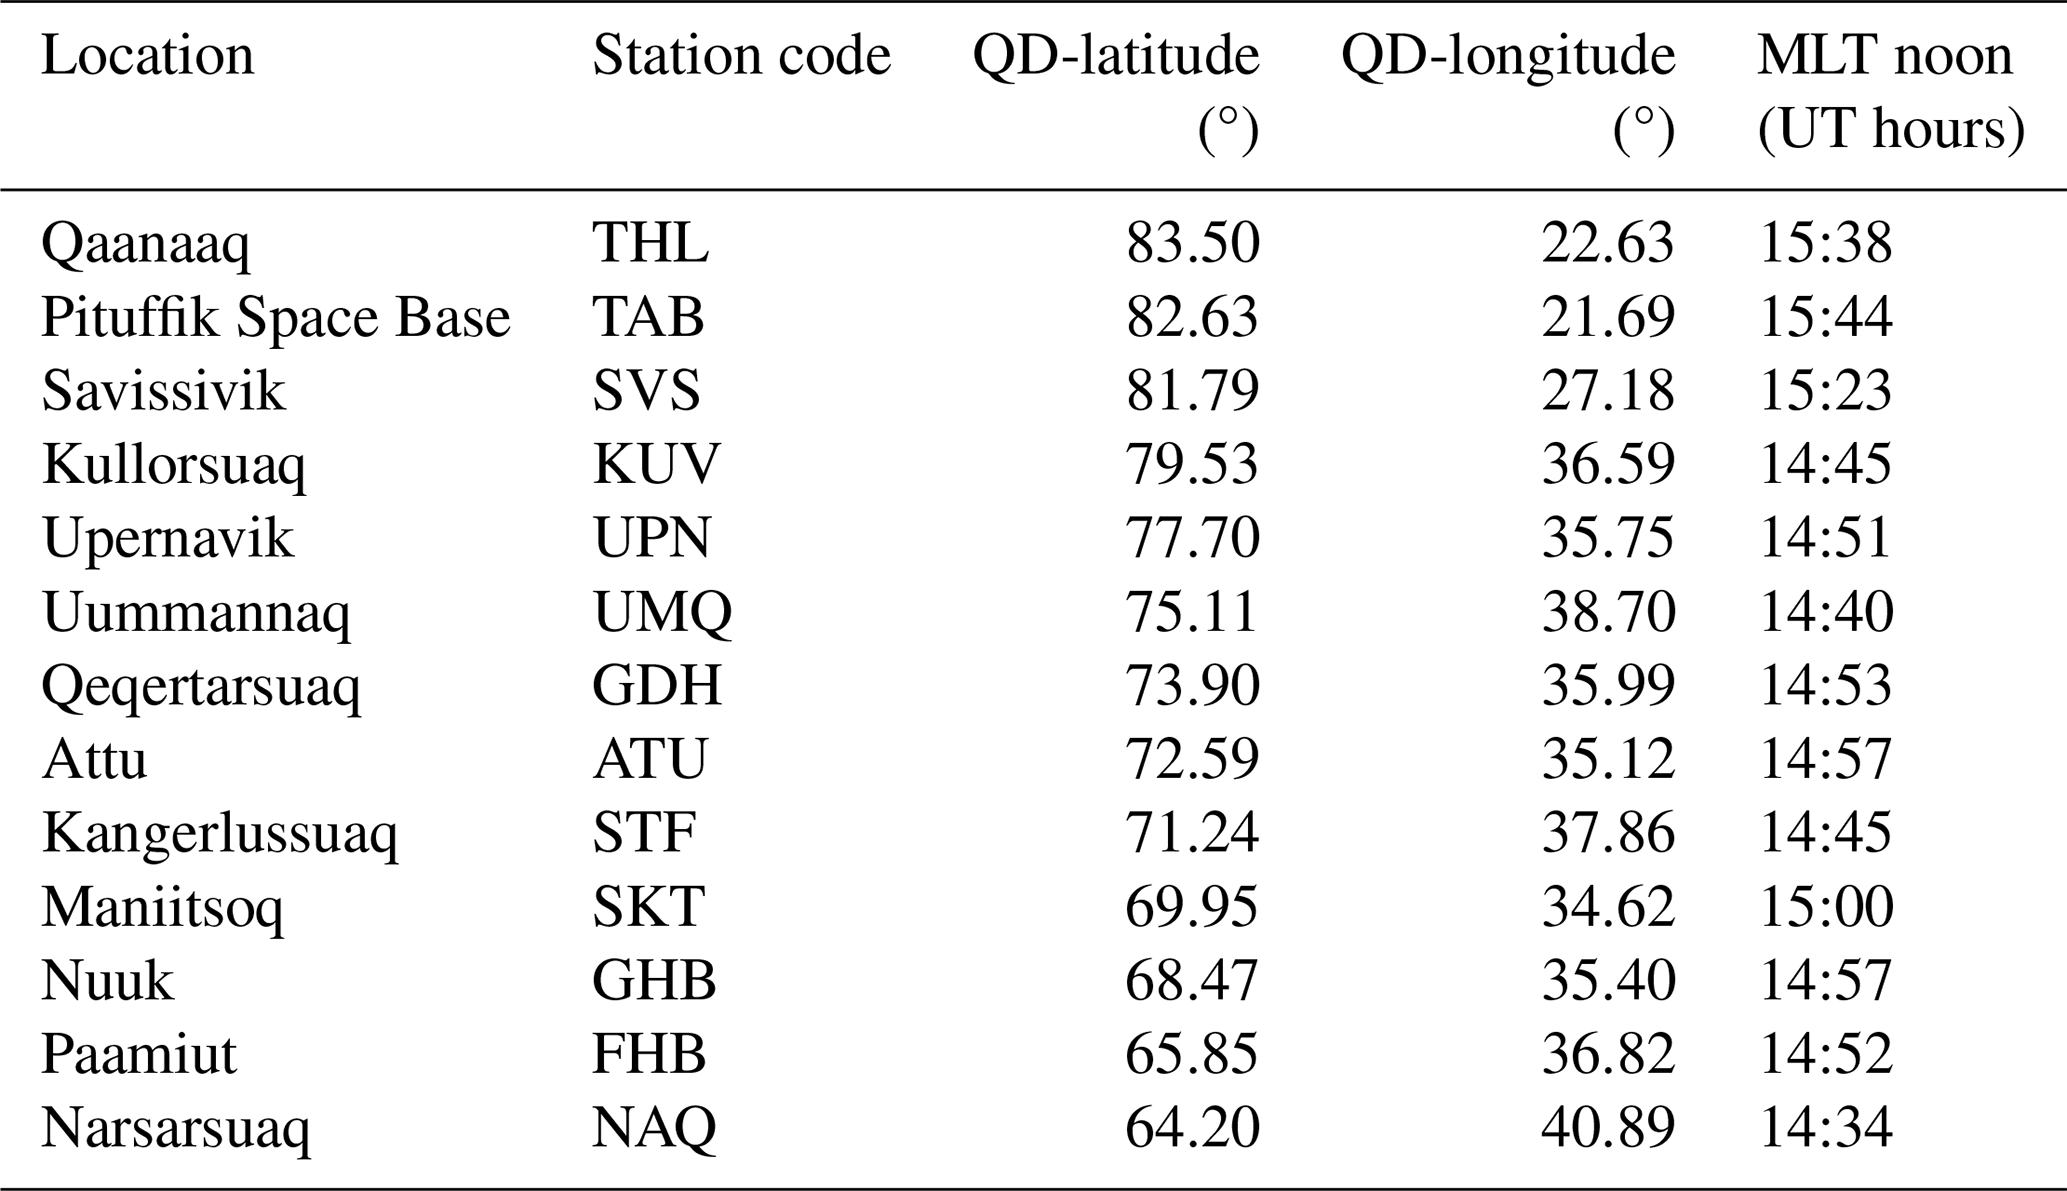
We use 1 s magnetometer data from the four years 2020–2023 obtained from ground stations along the west coast of Greenland. The quasi-dipole (QD) latitude and longitude (Richmond, 1995) of the stations, listed in Table 1, show that the stations cover auroral, cusp, and polar cap regions. We extract the magnetic signal in the ULF range, denoted as XULF, by applying a Butterworth bandpass filter (10–600 s period corresponding to Pc 3–5 and Pi 2) to the northward component X. With this approach, we will not be able to make a distinction between discrete or broadband ULF signals, but rather their average strength. Since the bandpass filter returns all magnetic signals within the chosen frequency band, we here use the terminology “signal/signature” when referring to the magnetic response of an oscillation, transient, or impulse measured at a ground magnetometer station.
In Fig. 1a–d, we present data from the polar cap station TAB covering 24 h. In panel (a), we show the magnetometer X-component as a line plot overlaying the power spectrum of the same curve at 256 s cadence with a 128 s overlap. In panels (b)–(d), we show the bandpass filtered signal for different bands. For context, we show time shifted IMF data in panel (f) and the complete power spectrum for the whole day in panel (g).
The grey curve in panel (e) shows the Butterworth bandpass filtered signal XULF. As illustrated, the filtered signal oscillates around zero. To ensure continuity and avoid spurious zero values caused by bandpass filtering and obtain a representative measure of signal amplitude, a 10 min boxcar filter is applied to the absolute values (orange curve). The resulting metric, the smoothed signal , is presented as the red curve in Fig. 1e and is calculated as follows:
where M is 600 s corresponding to the 10 min boxcar window and n is the time in seconds. Later, an averaged version of denoted is used, calculated by averaging over four years.
As is seen from Fig. 1, dayside signals (10:00–20:00 UT) are present across multiple frequencies, and in our ULF metric, they are, thus, not narrow band ULF signals or discrete ULF wave signatures.
Table 1West Greenland magnetometer chain with corresponding QD-coordinates and MLT noon times computed for 2024.
2.1 Interpretation of the XULF metric
The “ULF” tag indicates the frequency band from which our metric extracts its information. In order to avoid confusion, it should be emphasised that it is not possible to separate ULF waves from other transient phenomena solely by using . Although an oscillation associated with a wave phenomenon is easy to identify by visual inspection, a more complex ensemble of oscillations and other transient phenomena will be more challenging to identify. Since we are bandpass filtering our signal, the frequency components of any step-like or impulsive feature in our signal, which exist within that band, will remain. Therefore, it is not possible to declare that a non-zero value of is due to a ULF wave; it could just as well be caused by a sudden change in IMF By and associated response in DPY, the establishment of a strong flow channel, or merely the presence of a series of FTEs. All of them would introduce broadband signals in our band, and could, in principle, erroneously be interpreted as the presence of ULF wave signatures. In fact, many of the spectra investigated, e.g., the one shown in Fig. 1g, take the shape of that of a Heaviside function, which is precisely how a step-like change in the ionospheric current, caused by an FTE, would look. We therefore emphasise that, in this work, we interpret our XULF metric as a geomagnetic response to transient, impulsive, and wave-like magnetospheric phenomena, and not as a pure signature of ULF wave activity.
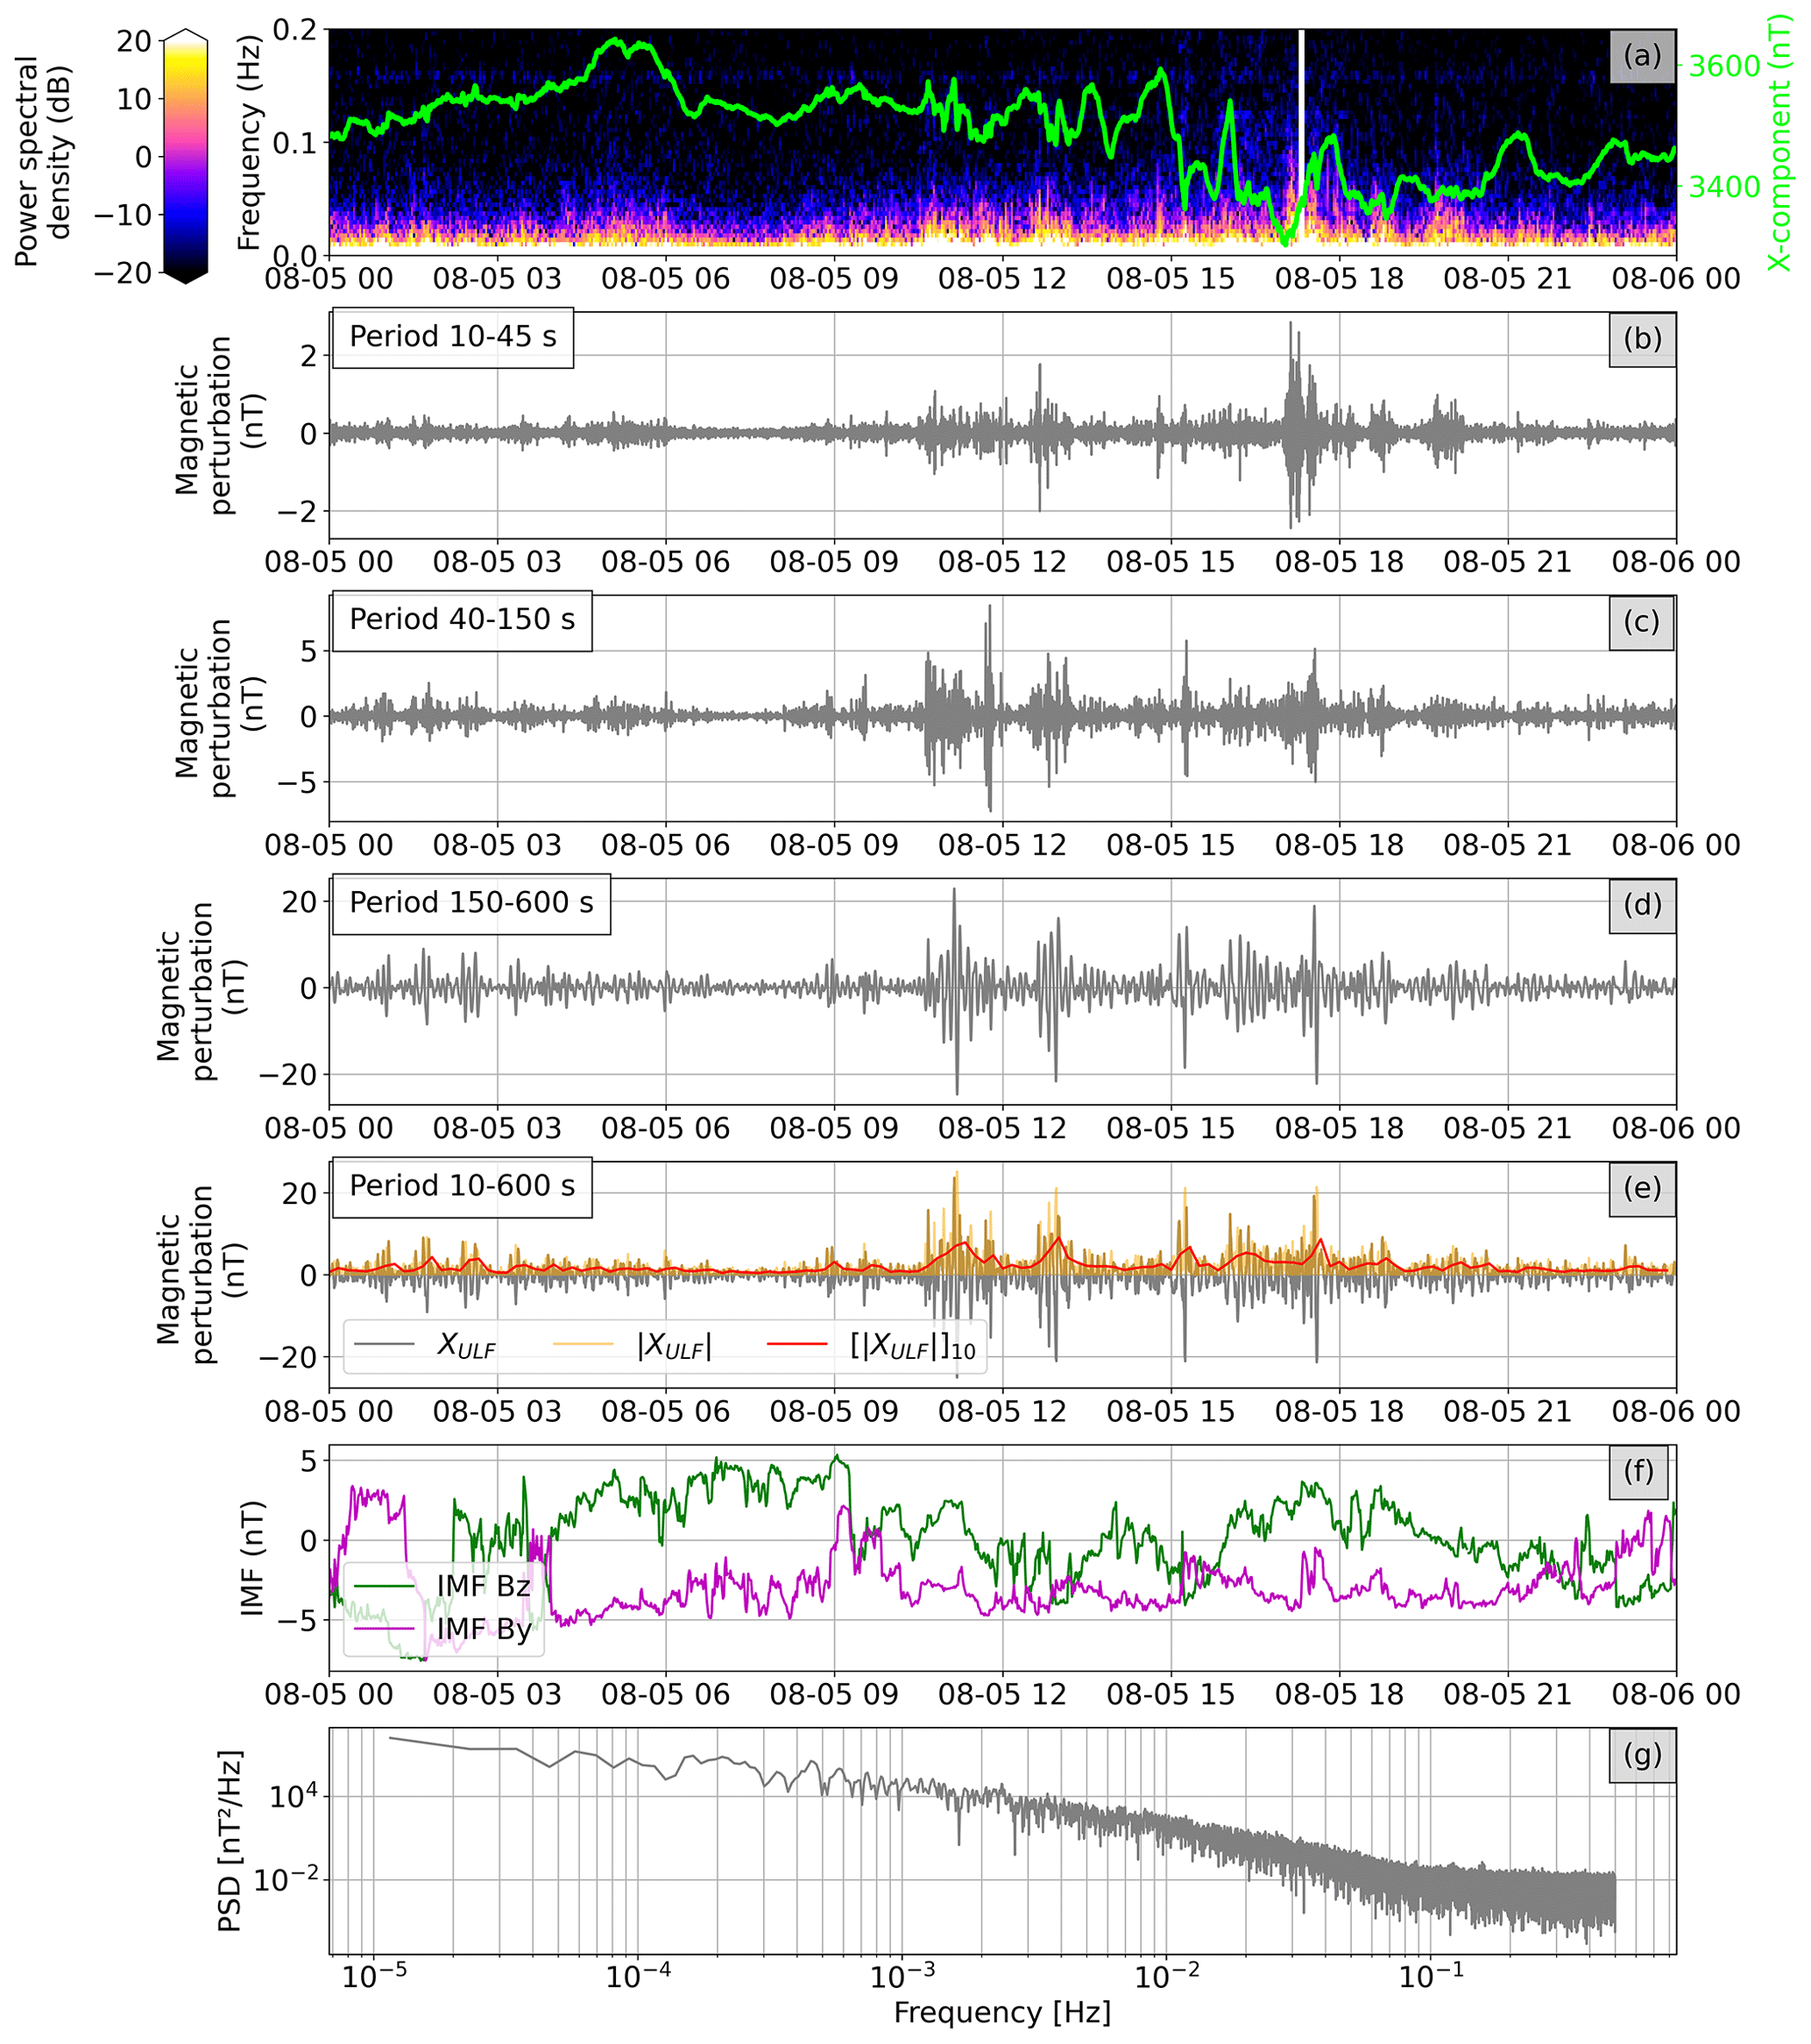
Figure 1(a) Plot of the spectrum at TAB on the 5 August 2022, where the green curve represents the magnetic northward component (X). (b)–(d) outputs of a bandpass filter in the period range stated in the top left corner for Pc 3 (b), Pc 4/Pi 2 (c), and Pc 5 (d). (e) The output of the bandpass filter, used in the paper (XULF), the absolute values (), and the 10 min smoothed signal (). (f) IMF parameters for the given date. (g) The power spectral density w.r.t. frequency for the given day at TAB.
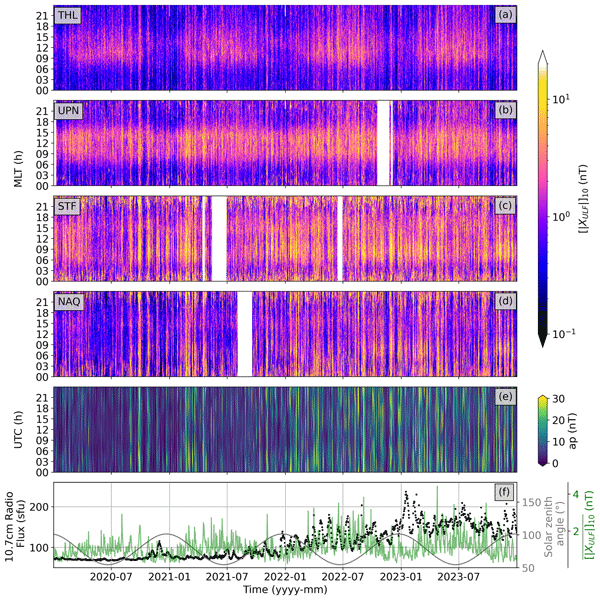
Figure 2a–d shows four years of for four stations, from north to south, THL, UPN, STF, and NAQ. They are approximately located along the same magnetic meridian on the west coast of Greenland. The panels are plotted with respect to MLT and time of year; the colour code indicates the strength of the signal. In Fig. 2e, we display the ap index. Since this index attempts to describe global geomagnetic activity without a local longitude component, we display it using universal time on the vertical axis. Figure 2f displays the daily mean at THL and solar zenith angle at magnetic noon, as well as F10.7 solar flux.
At THL in the polar cap, a population of enhanced centred around magnetic local noon is seen during the summer months, with increasing amplitude as F10.7 increases, displaying a clear solar cycle dependence. The seasonal variation in is anti-correlated with that of the solar zenith angle. At UPN, a similar but slightly stronger population is found around magnetic local noon, but with a smaller seasonal variation compared to THL. At both THL and UPN, dominant signals across all MLTs occur simultaneously during increased values of ap, suggesting a relation to global geomagnetic activity.
Moving southwards to auroral latitudes, signals at STF are seen both at night and during the day. The nighttime signals are likely due to substorm activity, as supported by the ap index seen in Fig. 2e. The enhanced values of at daytime span from 04:00 to 16:00 MLT and increase in amplitude with F10.7, indicating a solar irradiance dependence, with the highest amplitudes during dawn. Furthermore, a weak local minimum is seen around noon. Some of the daytime signals at STF occur during high ap, displaying a strong response to geomagnetic storms. During times with low ap values, the daytime signal is not as prominent at STF, setting it apart from the daytime signals at THL and UPN, which occur independently of geomagnetic storms.
At NAQ, in the southern part of the auroral zone, the majority of elevated values occur during nighttime, likely associated with substorm activity. However, daytime signals occur during times of increased ap values and become more frequent as F10.7 increases, further indicating an association with geomagnetic storms. Field line resonances (FLRs) are often observed in the 45–600 s period range and are caused by compressional plasma waves (e.g., Samson et al., 1992 and references therein). Considering that the station NAQ is in the very southern part of the auroral zone (64° geomagnetic latitude), we do not expect this location to see the bulk of FLRs. They would appear more frequently deeper inside the auroral zone, towards the poleward edge of the aurora oval, where field lines map to regions close to the magnetopause in the dawn and dusk sectors. Only during enhanced geomagnetic activity would we see them, and by scrutinizing Fig. 2d, we in fact see a weak indication of this at around 06:00 and 18:00 MLT. At STF (Fig. 2c), we do observe a candidate signal of FLRs around this window more frequently.
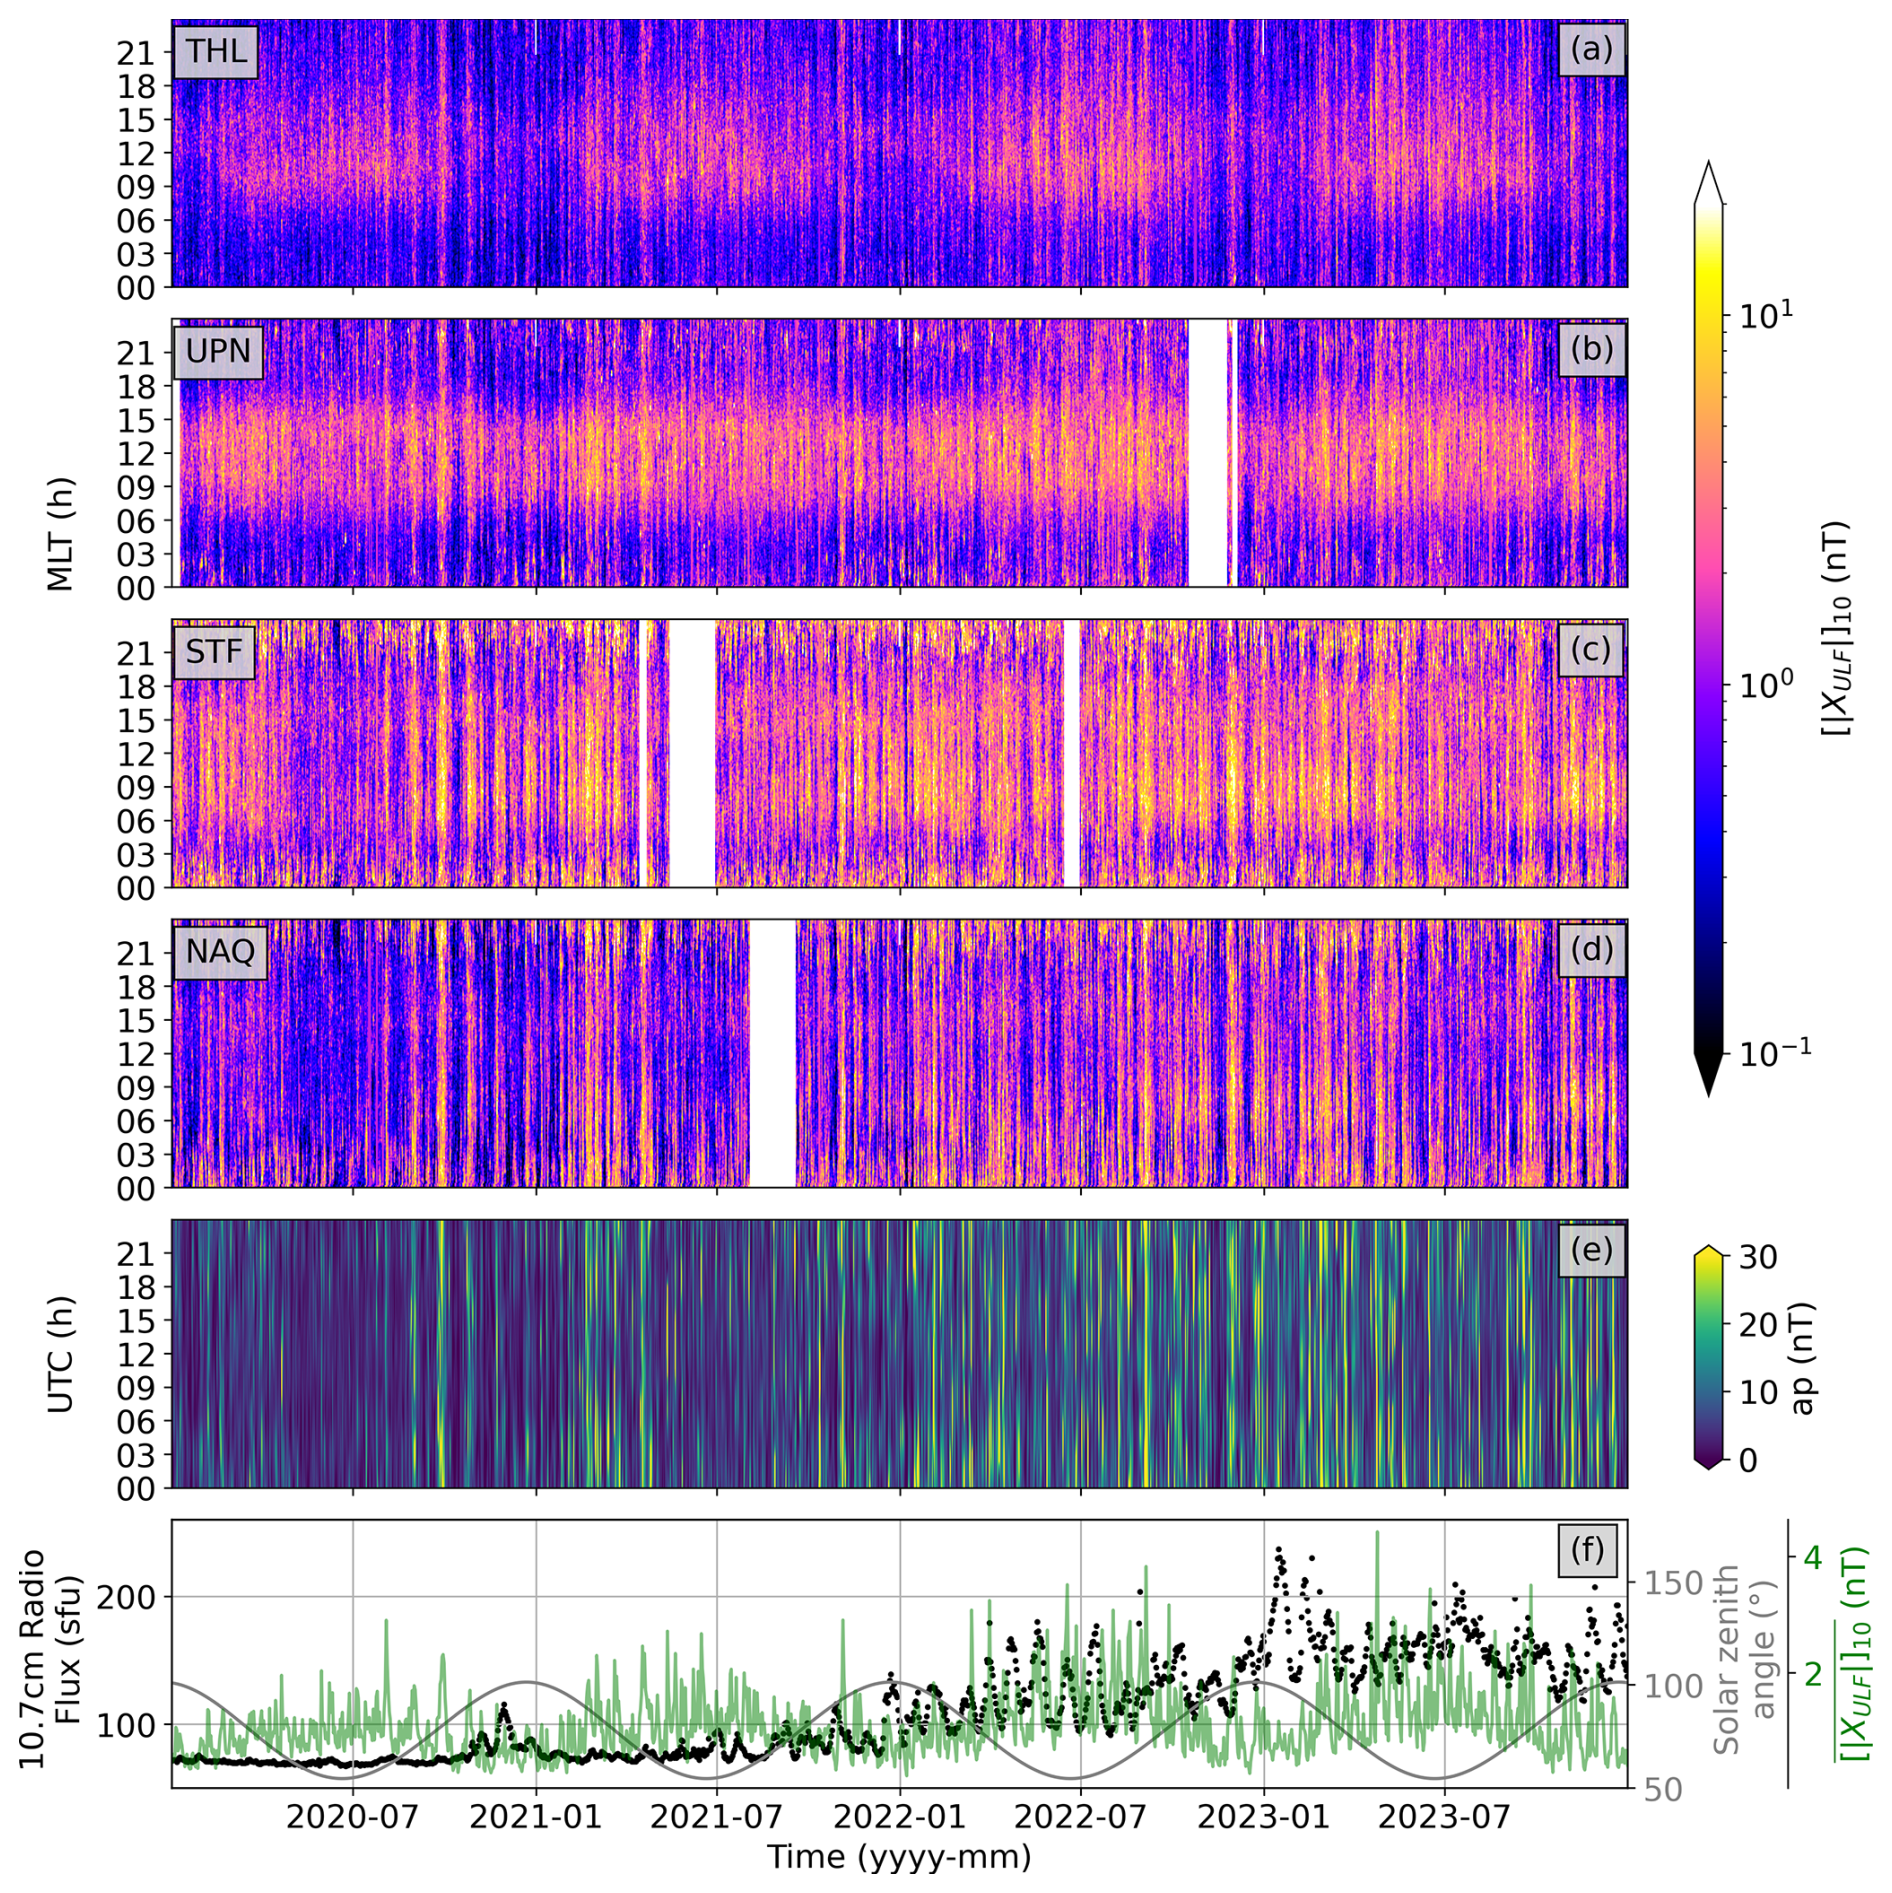
Figure 2(a)–(d) at the four stations THL, UPN, STF, and NAQ for four years, as a function of MLT. (e) Geomagnetic activity ap index as a function of UTC. (f) The daily average ULF signal measured at THL (green), the solar zenith angle (grey), and the daily solar flux F10.7 (black).
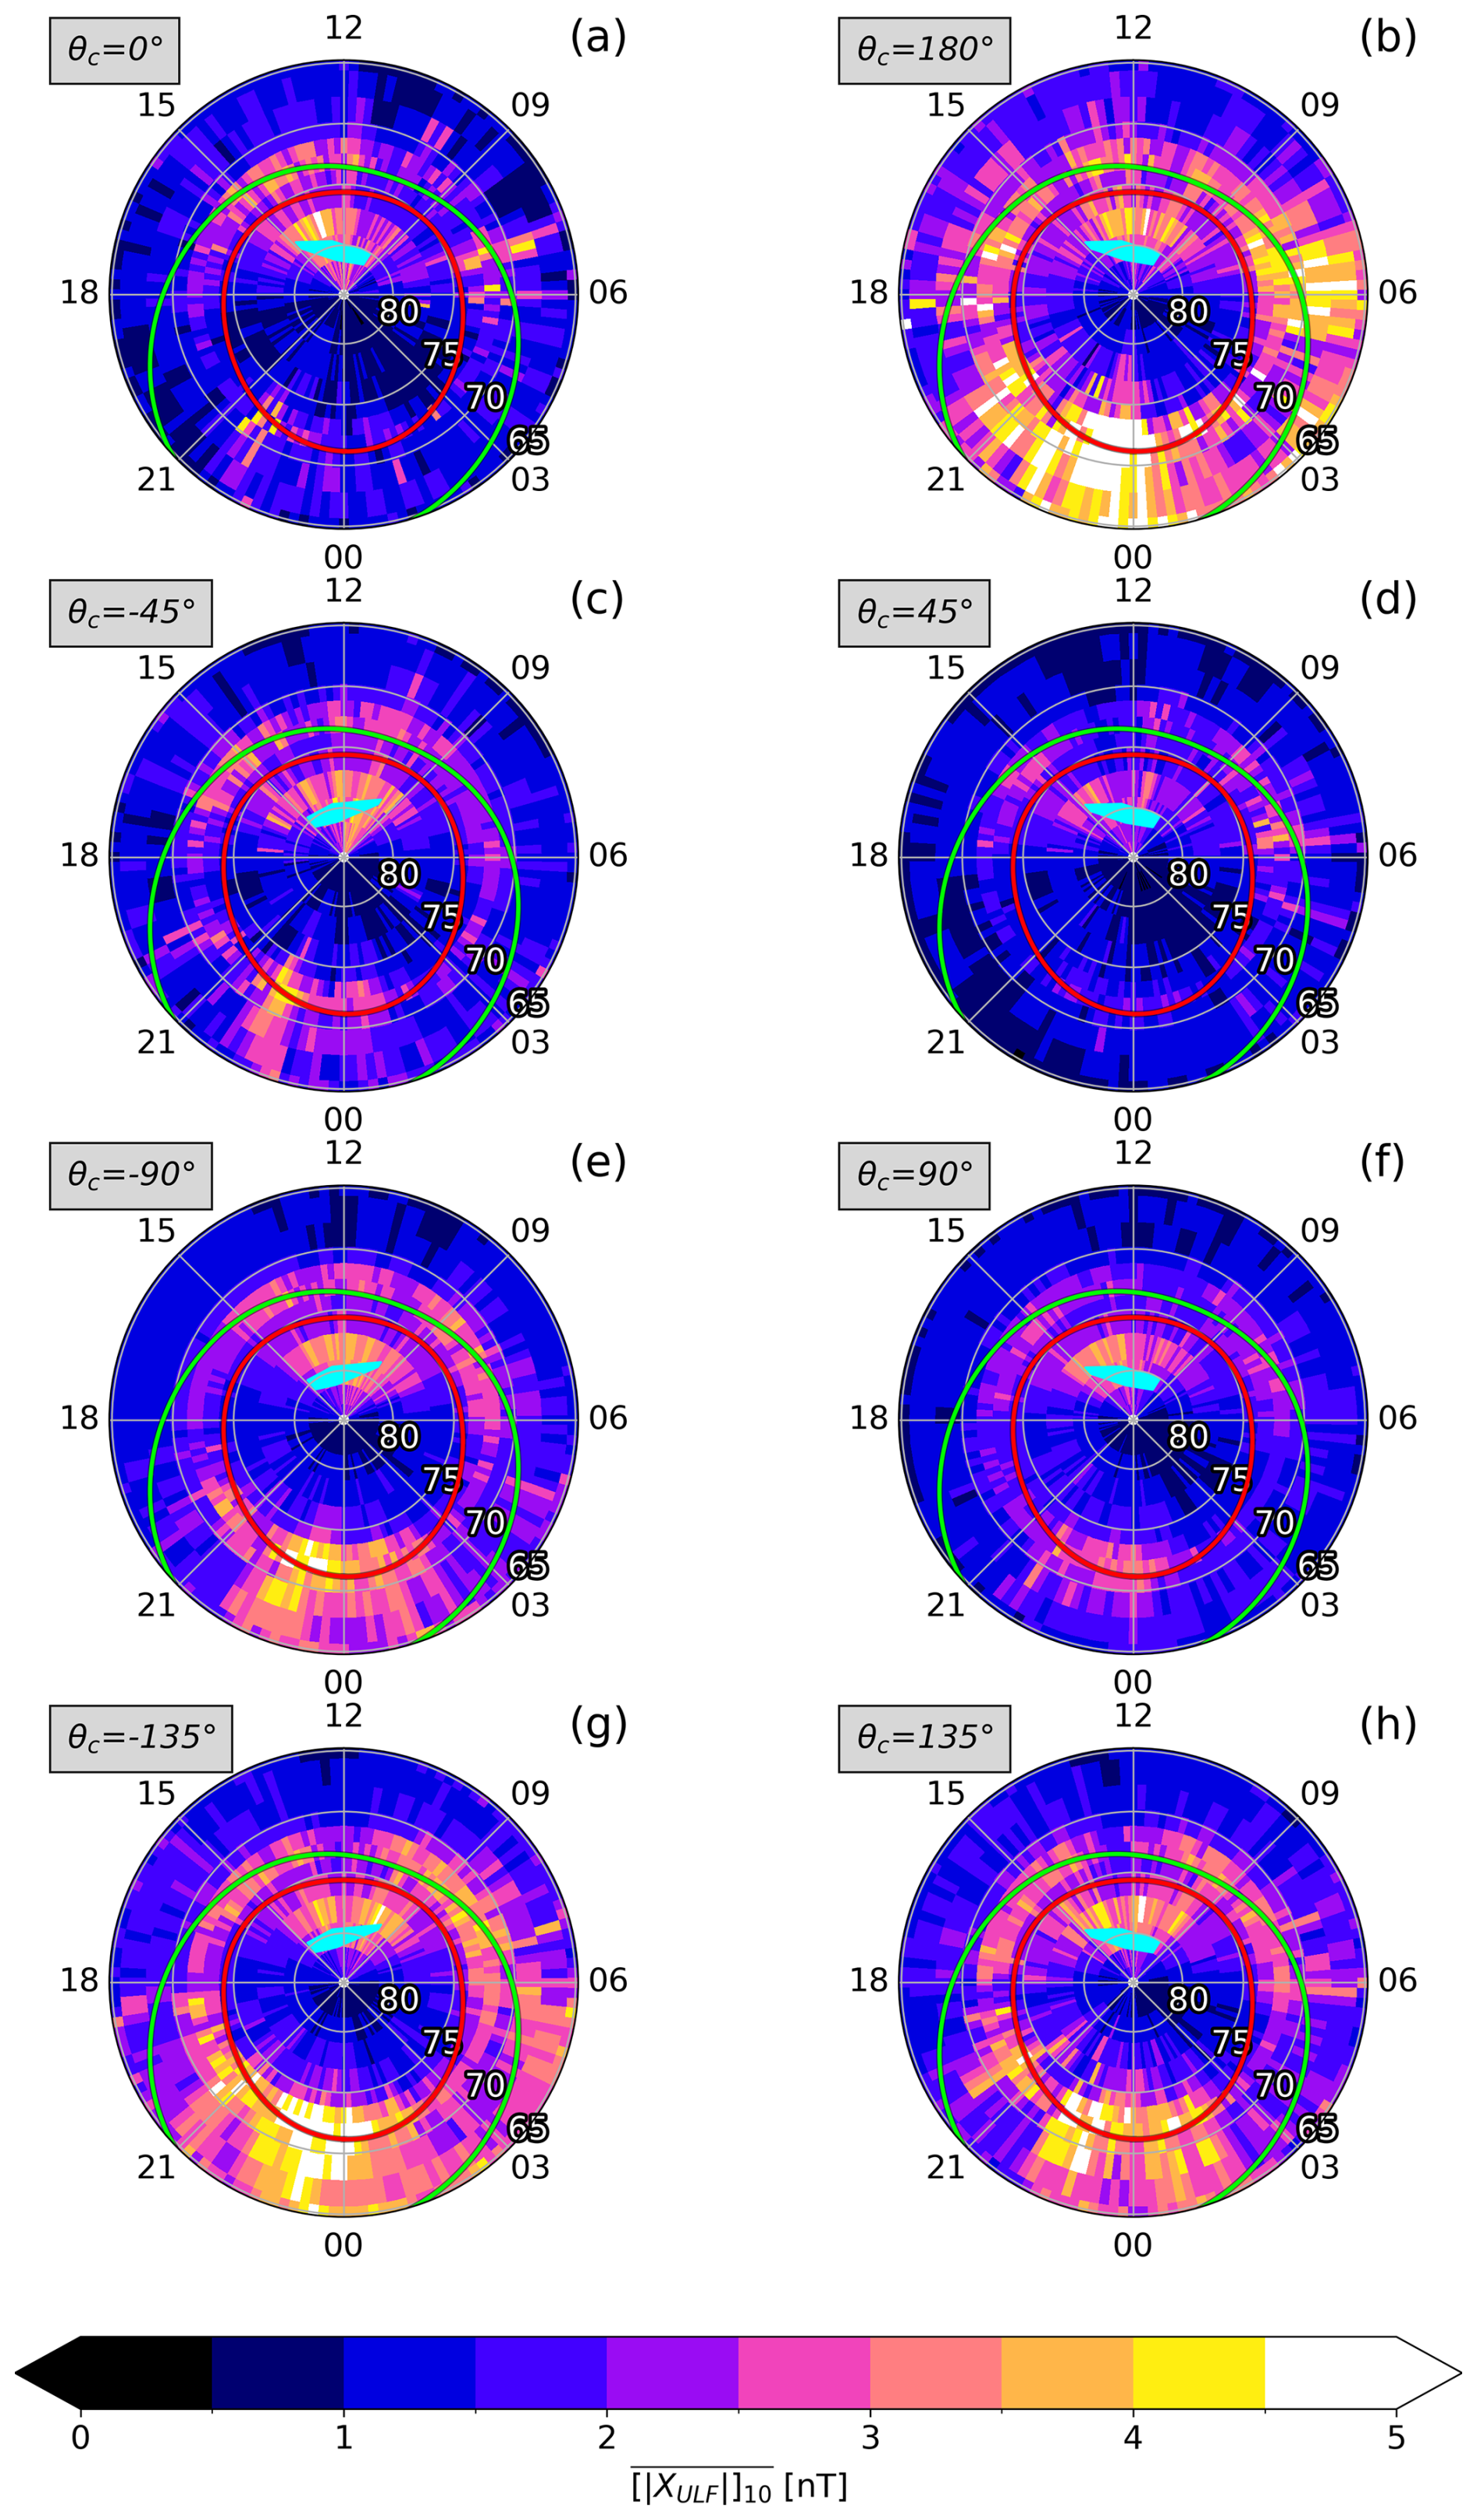
Figure 3Average amplitudes during summer (May–July) in 2020–2023 for the Greenland west-coast magnetometer chain with respect to QD-latitude and MLT for different IMF clock angles (θc). The green and red curves represent the equatorward and poleward boundaries of the auroral oval, respectively, as computed from the Feldstein model. The statistical location of the cusp is marked with a cyan-coloured area computed using the equations set forth by Anderson and Bukowski (2024).
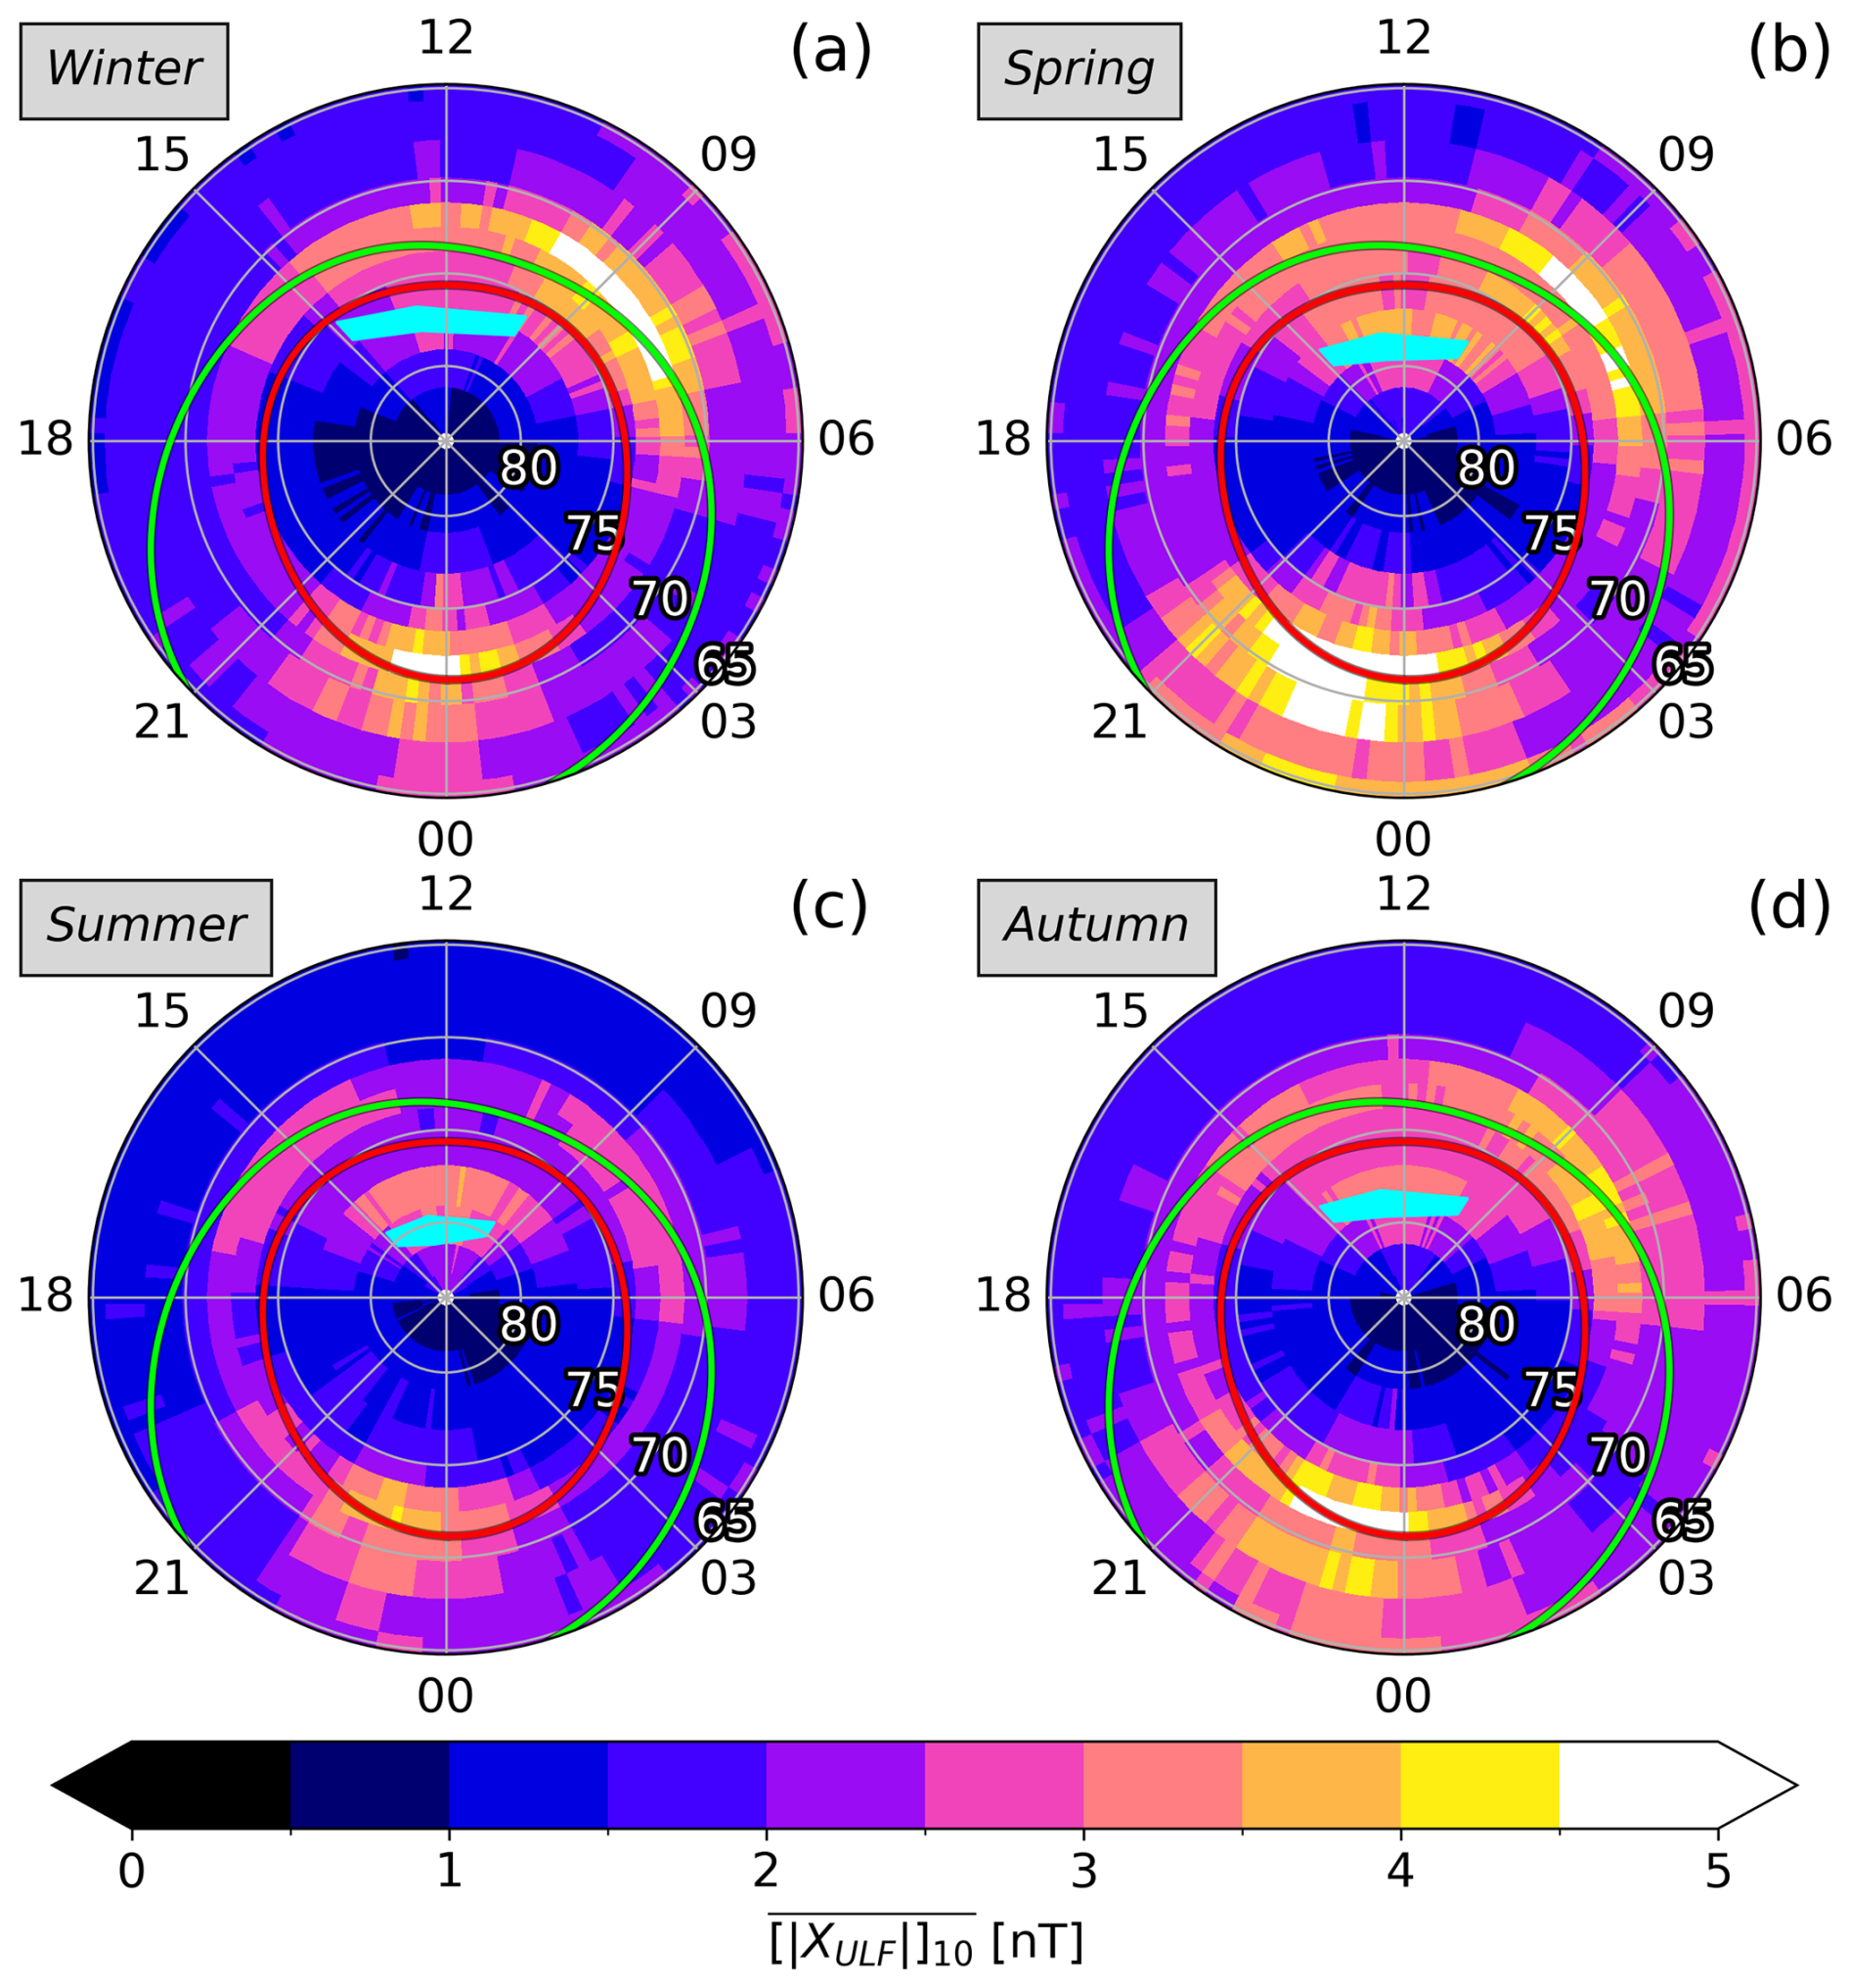
Figure 4Polar plots of the average 10 min amplitudes for different seasons (a) winter (November–January), (b) spring (February–April), (c) summer (May–July), and (d) autumn (August–October). The Feldstein model is represented by red (polar boundary) and green (equatorward boundary) lines. The statistical location of the cusp is marked with a cyan-coloured area computed using the equations set forth by Anderson and Bukowski (2024).
The average amplitudes, , during summer (May to July) as a function of MLT and QD-latitude are displayed in Fig. 3 for different IMF clock angles. Equatorward and poleward boundaries of the Feldstein model (Feldstein and Starkov, 1967; Holzworth and Meng, 1975) of the statistical auroral oval are shown by red, resp. green, curves (computed for moderate activity Q=3; Q refers to the 15 min geomagnetic activity index as introduced by Bartels, 1957). We note here that the Feldstein model is derived from wintertime data and, thus, does not depend on dipole tilt angle. One therefore needs to be extra cautious when comparing it to summertime conditions. At ∼73° QD-latitude, a signal exists for all MLTs (drawing a circle in the plots), although it is most pronounced during daytime for all clock angles. It is most pronounced on the dayside near the equatorward boundary of the statistical auroral oval, i.e., on closed magnetic field lines, and amplified for IMF Bz<0, suggesting a relation to subsolar reconnection or, less specifically, enhanced energy transfer to the ionosphere. The relation between high ap values and strong dayside signals at STF is supported by Fig. 2 panels (c) and (e). Nightside signals related to substorm activity are seen at QD-latitudes 65–75° during all clock angles but noticeably amplified for IMF Bz<0. The bulk of this activity is in the pre-midnight sector, suggesting that it is related to the westward travelling surge and/or upward Birkeland current in the substorm current wedge.
Poleward of the statistical auroral oval (red curves in Fig. 3), an enhanced signal occurs in the 08:00–16:00 MLT time interval during all IMF clock angles. This indicates that signals here are generated by sources not directly associated with substorm activity, but rather with direct, dayside solar wind magnetosphere interaction and dynamics on open magnetic field lines. Furthermore, the greatest amplitudes are more dominant in the dawn (dusk) sector during IMF By<0 (By>0), indicating that the high-latitude dayside signal is controlled by processes in the solar wind independent of IMF Bz but adjusted by IMF By.
Figure 4 displays as a function of MLT and QD-latitude separated into seasons. During summer (Fig. 4c), two separate populations are clearly seen, one poleward of 75° QD-latitude and one southward of 75° QD-latitude, as is also seen in Fig. 3. The ∼73° circle also appears clearly. During winter (Fig. 4a), the poleward population moves southward, and the two populations merge. This, as will be discussed below, as well as the fact that the statistical cusp location moves with the poleward population according to season, fits well into the expected dipole tilt control over cusp latitude.
The results presented in Fig. 3 reveal some systematic features. At the two northernmost stations, there is primarily activity centred on magnetic noon, while moving southwards, the situation changes to the opposite, with the bulk of activity occurring during nighttime. This can easily be understood by the diurnal variation in these stations' location with respect to the auroral oval and associated geophysical processes. Around nighttime, THL is located deep in the polar cap, with magnetic field lines mapping to the magnetospheric lobes and far into the magnetotail, far away from the auroral oval, while at noon, the station will be closer to the cusp footprint with field lines mapping to the magnetopause.
UPN is somewhat similar to THL, since both are closer to the cusp than the nightside auroral oval. At STF, we clearly see the presence of activity around midnight; this station is close enough to the auroral oval that the poleward excursion associated with the substorm expansion phase will reach this latitude. The presence of ULF wave activity in conjunction with the establishment of the substorm current wedge and upward Birkeland current is well studied in the literature (e.g. Sakurai and McPherron, 1983, Lester et al., 1983, Takahashi and Liou, 2004), and can in addition to the strong step-like negative bay in the X-component indicating substorm onset, explain high values of . Although we still see a signal around noon at STF, it is split into two local maxima with a local minimum at noon. This can be explained by the station being briefly sub-auroral, but encounters the oval at fairly late and early hours around noon. The signals associated with this double hump may then be attributed to travelling convection vortex (TCV) activity (Friis-Christensen et al., 1988), where irregularities/pressure transients along the magnetospheric flanks create sets of Birkeland currents that move along the poleward edge (i.e., the part that maps to the equatorial magnetopause) of the auroral oval in an anti-sunward direction.
At NAQ, which is in the nightside auroral oval, only nightside substorm-related signals are seen. Generally, the effect of geomagnetic storms is seen at all stations, where the activity lasts throughout the whole day. The combination of enhanced solar wind magnetosphere coupling, as well as enhanced electrojet power and substorm activity, is clearly seen in the ap index.
Another striking feature is the seasonal variation, which increases towards high latitudes. Using the empirical formulas found by Moen and Brekke (1993), we calculated the Hall conductance above the same stations as those presented in Fig. 2. Assuming that the conductivity is not modulated by particle precipitation, the formulas take solar zenith angle and solar luminosity, using F10.7 as a proxy, into account. The resulting Hall conductances, presented in Fig. 5, show in particular great similarity with the ULF power plots of Fig. 2a and b (THL and UPN). The steady increase in the conductivity from year to year is caused by the simultaneous increase in the solar illumination as described by F10.7, which is a proxy of solar extreme ultra-violet radiation (EUV) (see Fig. 2f), as we approach solar maximum. Variations in F10.7 appear as vertical lines where this value peaks, and all are constrained by the solar zenith angle, only producing values when the Sun is above the horizon. Considering that the ground magnetic signals are caused by horizontal ionospheric currents, which depend on electric fields and ionospheric conductivity (Ohm's law); the Figure illustrates that presence of EUV from the Sun is a prerequisite to produce the observed signals in the case where particle precipitation is not energetic enough to enhance electron density (conductivity) in the ionospheric E-region. This is the case on open magnetic field lines in the cusp where electron precipitation is soft ( eV) (Newell and Meng, 1988), and, thus, energy is deposited in the F-region above ∼200 km, rather than lower in the ionosphere (Mantas and Walker, 1976; Banks et al., 1974). Furthermore, the similarity between the conductivity plots and plots at THL and UPN indicates that a varying ionospheric electric field generates the observed magnetic signal.
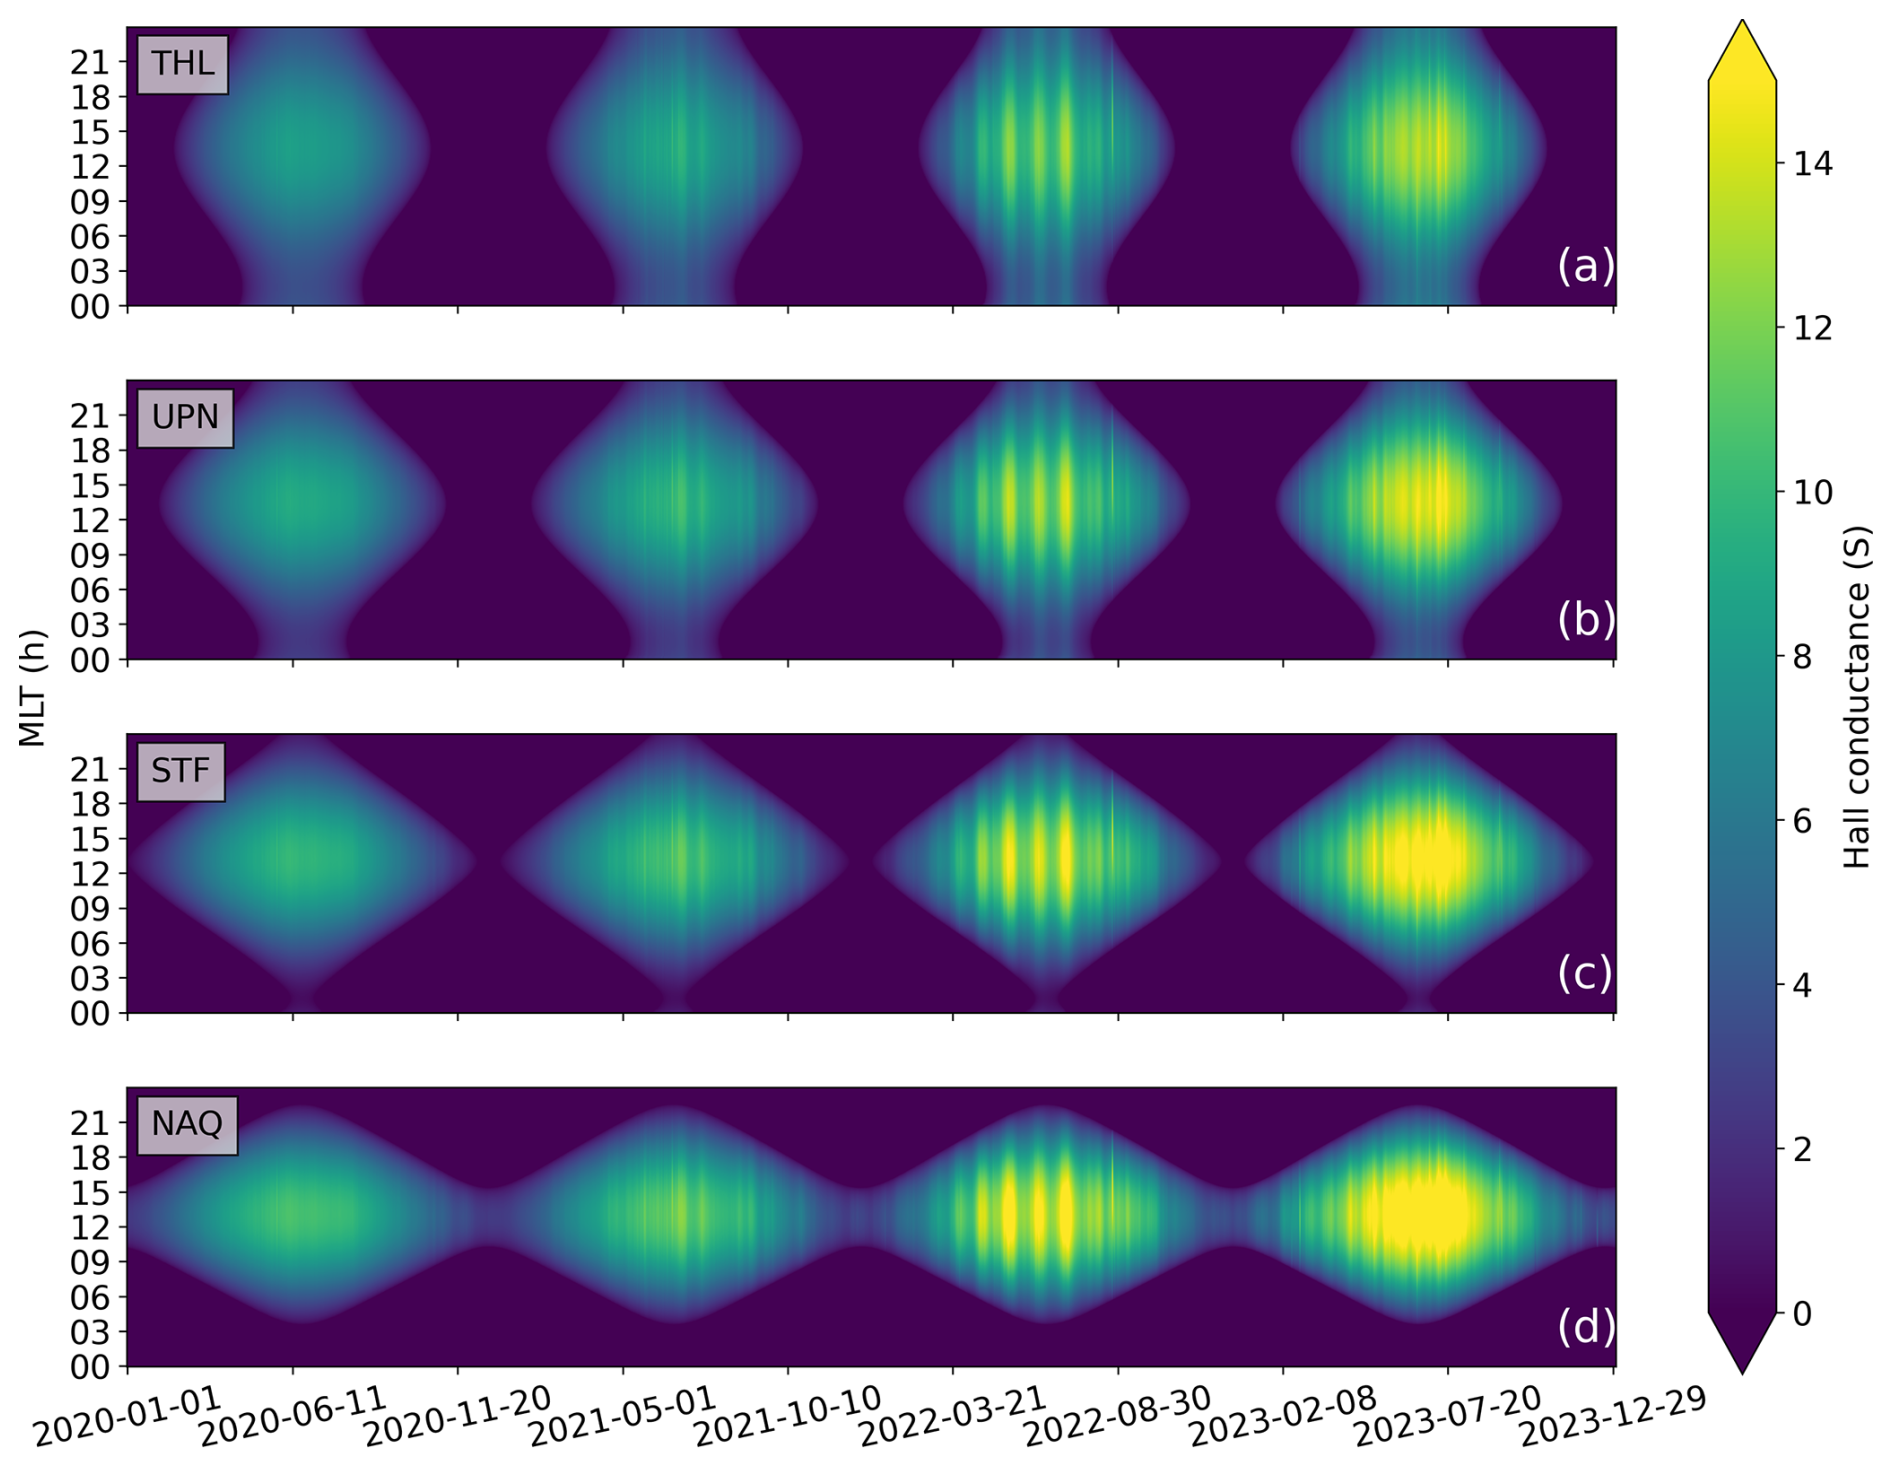
Figure 5Hall conductances at four stations, (a) THL, (b) UPN, (c) STF, and (d) NAQ, as given by the empirical formula of Moen and Brekke (1993), throughout four years, where the y-axis is given in MLT.
The situation is somewhat different when moving southward. Here, the similarity to the conductivity plot disappears, and there are distinct periods where elevated occur outside the region of high solar-induced conductivities, which is an indication of modulation in the conductivity by particle precipitation (potentially in concert with fluctuating electric fields). The distribution of signals at STF, which is at a latitude comparable to the Antarctic South Pole Station, is in very good accordance with the study of Motoba et al. (2019) where their ULF observations were accompanied by observed >1 keV electron precipitation and by modulations in auroral brightness, which again is a strong indicator of particle precipitation. The presence of >1 keV electrons is a strong indicator of particle precipitation on closed magnetic field lines and, thus, dynamics associated with sub-cusp particle populations. This underscores the fact that the signals observed at STF, which could, in general terms, be categorized as dayside, high latitude signals, mainly belong to a different mechanism compared to what is observed further poleward at UPN and THL.
As was shown by Rostoker et al. (1972), there are two populations of ULF signatures on the dayside, although for somewhat lower but overlapping frequencies than studied here. One is a fairly narrow band which increases in frequency by decreasing magnetic latitude – as expected for Alfvén waves bouncing between hemispheres – and the other, wideband, above ∼75° magnetic latitude, which cannot be explained by bouncing Alfvén waves. The two populations converge just below 75° magnetic latitude, and therefore, a station here would most likely see a mixture of both populations.
The signal strength yields a clear minimum around 75° QD-latitude in Fig. 3, separating a northern and southern population. Following the results of Anderson and Bukowski (2024) related to dipole tilt effect on cusp latitude, we find that the average equatorward edge of the (northern hemisphere) MLT noon cusp at 15:00 UT will be about 80° QD-latitude during summer and 77° QD-latitude during winter solstice. The statistical cusp location is indicated as a cyan area in the Figure. It should be noted here that we expect the seasonal motion of the cusp, associated with the dipole tilt, to contribute to the seasonal variation seen in Fig. 2, in particular at THL, which will be about 6° north of the cusp equatorward boundary during winter solstice. This is furthermore confirmed by the disappearance of the ∼75° minimum in winter. The movement of the poleward population is in accordance with the polar cusp movement (Anderson and Bukowski, 2024), suggesting these signatures are generated by cusp processes. Figure 3 also supports this notion, since intense signatures are more dominant further north during θc=0° and , i.e., when Bz>0, which mirrors the poleward movement of the cusp during those IMF conditions, (e.g. Newell et al., 1989; Johnsen and Lorentzen, 2012). No distinct ULF cusp signature was identified by Engebretson et al. (1995), while Pilipenko et al. (2015) reported on ULF signatures occurring several degrees south of the equatorward cusp boundary. However, most of the data analysed in Engebretson et al. (1995), and all of the data in Pilipenko et al. (2015), were collected during winter. As shown in Fig. 4, the two populations tend to merge and become indistinguishable in winter, which may explain why dayside ULF signatures are observed much farther equatorward than the expected cusp boundary, by these authors. The findings by e.g. Johnsen and Lorentzen (2012) show that the latitude of the OCB in the cusp is relatively stable during IMF northward conditions, but moves southwards during increasing negative values (by about 0.5° per IMF Bz nT). Thus, we would expect a signal associated with the cusp to be fairly constrained towards northern latitudes, while its latitude towards the south would be more dynamic as a function of negative IMF Bz values and to be smeared out in our statistical treatment (in Fig. 4). In light of this, it is no surprise that the identified noon-time, northern signal also exists south of the indicated statistical equatorward boundary of the cusp. We conclude that the observed signals centred on noon are, indeed, associated with open cusp field lines. The dayside signals seen further southward are, as discussed above, the ones described in the study by Motoba et al. (2019), which are related to more energetic particle precipitation than expected for the cusp. The presence of a minimum between the northern and southern ULF signals at noon during summer and the fact that they differ in their seasonal dependency (i.e., solar or precipitation produced conductivity and different response to changes in dipole tilt) indicates that different dynamic processes are at play.
The signal north of 75° QD-latitude is a separate population of dayside magnetic signals associated with dynamics on open magnetic field lines, which has not, to the best of our knowledge, been identified or isolated in a statistical study before.
The existence of the local minimum at 75° QD-latitude, and the poleward signals' dependence on solar illumination, strongly indicate that this signal has a different source than the ones to the south. The MLT constraint of about 07:00–17:00 MLT also indicates that this is a pure dayside phenomenon associated with dynamics at the magnetopause, regardless of IMF orientation. Especially at very high latitudes (at THL), the physical distance in the ionosphere along the Sun-Earth line between magnetic noon and midnight is small. Although we do not have more stations north of THL, this station at midnight could be viewed as an extension of the magnetometer chain at noon in a statistical treatment; the absence of signals close to magnetic midnight at this latitude indicates that the ionosphere north of the station stops receiving such signals when the local magnetic field lines map into the magnetospheric plasma mantle. We should therefore, at noon, expect a relatively fast decay of dayside signals north of this latitude.
Figure 3 shows, as mentioned above, that the northern signal around noon exists for all clock angles, indicating that the associated dynamics do not favour either subsolar or lobe reconnection. Nightside activity at relatively low latitudes is stronger during southward IMF, as expected for substorm activity, where loading of energy into the magnetosphere is a prerequisite. For clock angles of ±90°, i.e., when the IMF By dominates over Bz, the bulk of high latitude activity moves towards post/pre-noon. This is very much in accordance with the notion of how the magnetopause location of the reconnection X-lines moves with IMF By, and underpins that these signals actually are on open field lines.
Kozyreva et al. (2019) suggest that Pc 5 pulsations observed above Svalbard are related to magnetopause processes, but cannot exclude “the possibility that the observed ULF signature is caused by heavily damped Alfvénic oscillations of the last closed field lines”. The cusp aurora is located north of zenith and accompanied by a green-dominated aurora to the south in the cases presented by these authors, with the highest power of their Pc 5 signal south of their obtained OCB. During winter conditions, the expected signal on open field lines is weak, as discussed above and shown in Figs. 2 and 5. Considering that only one or two magnetometer stations constitute their ULF observations north of the OCB and that Rostoker et al. (1972) shows that the two different types of ULF waves converge near the cusp, we are inclined to support their suspicion of Alfvénic oscillations on closed field lines, which is very similar to the observations by Motoba et al. (2019).
The observed seasonal variation in at high latitudes depends on the Hall conductivity, i.e., the waves incident on the ionosphere will create a Hall current in the ionospheric E-region, generating magnetic signals on the ground. If the Hall conductivity is close to zero, the presence of an alternating electric field associated with the wave activity will not disappear. This means that, even though not driving a current, the dynamic activity will drive an alternating E×B motion in the F-region.
In this work, we show for the first time the existence of an isolated population of rapid geomagnetic variations at cusp latitudes, which are most likely on open magnetic field lines or associated with cusp dynamics and separated from other dayside magnetic variations. Although the metric includes a wide variety of geomagnetic variations, including signatures of step-like changes to ionospheric dynamics, our result contrasts with earlier investigations, which concluded that there are no identifiable cusp ULF wave signatures on open field lines, but rather a population located in the vicinity of the cusp. Where earlier studies have been performed during wintertime, where ULF activity is expected to be weaker and closer in latitude to other (closed field line) populations of ULF waves, our results motivate renewed investigations of cusp–related ULF waves. We find that the cusp population crystallises out of the data during the summer months. This can be explained by the combination of the following points:
-
During the summer period, Earth's dipole axis tilts toward the Sun, which pushes the dayside OCB, i.e., the cusp, to higher latitudes (see, e.g. Anderson and Bukowski, 2024). This moves it away from the equatorward dipole-like field lines that contain standing Alfvénic waves that bounce between the hemispheres (Pi 2 waves), which have their source from substorms on the nightside, and other internal magnetospheric processes. Our study shows a clear minimum in signal activity around 75° QD-latitude during summer, which separates signals at cusp latitudes from those at relatively lower latitudes.
-
Electron precipitation in the cusp, which originates from the magnetosheath, is very soft, typically below ∼ 220 eV (Newell and Meng, 1988). With such low energies, energy is deposited in the F-region above, say 200 km, rather than lower in the ionosphere (Mantas and Walker, 1976; Banks et al., 1974). This will inhibit this precipitation to modulate Hall and Pedersen conductivities in the E-region. Therefore, the signatures observed on the ground, which are the result of alternating/oscillating Hall currents in the E-region, are the result of an alternating E-field, rather than an alternating conductivity. In order for this E-field to modulate currents in the E-region, the conductivity as produced by solar EUV needs to be sufficiently high, a condition which is only achieved during the summer months.
Although tempting to combine dayside auroral observations with ULF ground-based measurements, to investigate their relationship, this proves impossible since one requires complete darkness (winter conditions), while the other requires sunlight (summer conditions). There is, however, no reason why the E-fields driving observable ULF signals during summer are not present during winter. Dedicated high cadence radar and/or satellite measurements would reveal this and should be attempted in the future.
An interesting feature of our identified cusp population is that its presence does not rely on the IMF orientation. Both for northward and southward IMF conditions, it is clearly present, while the population immediately equatorward is much clearer during southward IMF. IMF By modulates the MLT location, with the bulk of signatures on the morning (evening) side of magnetic noon for By<0 (>0), this is in accordance with the cusp convection throat region (Svalgaard-Mansurov effect (Svalgaard, 1968; Mansurov, 1969; Newell et al., 2004)), location of cusp precipitation (Newell and Meng, 1989), motion of PMAFs (Sandholt and Farrugia, 1999), and DPY behaviour (Friis-Christensen and Wilhjelm, 1975), which again confirms the notion of dealing with a cusp related population. We also observe that the dayside equatorward (sub-cusp) population has a minimum at magnetic local noon, most likely due to the fact that TCVs and associated Birkeland currents, which are generated along the flanks of the magnetosphere, occur away from the bow-shock nose.
We have identified several features connected to the presence of ULF-like signals at very high latitudes in the vicinity of the cusp. These deserve further investigation using ground-based radars and satellite data.
The magnetic data used in this paper are available by request at DTU Space.
MVE performed the data analysis, generated all the figures, and wrote parts of and coordinated the evolution of the manuscript. MGJ interpreted the results and wrote most of the manuscript. NO initiated the study, supervised the work, and provided feedback on the manuscript. MVE, MGJ, and NO all contributed to the discussion of the results and the final editing of the manuscript. ANW provided the magnetic data and gave feedback on the manuscript. All authors have read and approved the manuscript.
The contact author has declared that none of the authors has any competing interests.
Publisher's note: Copernicus Publications remains neutral with regard to jurisdictional claims made in the text, published maps, institutional affiliations, or any other geographical representation in this paper. The authors bear the ultimate responsibility for providing appropriate place names. Views expressed in the text are those of the authors and do not necessarily reflect the views of the publisher.
We are grateful to the Space Weather Forecasting for Arctic Defence Operations (SWADO) team at DTU Space for providing the magnetic data and operating the magnetometer stations in Greenland. The authors also thank the Danish Ministry of Defence Acquisition and Logistics Organisation (DALO) for funding the research presented in this paper. The magnetic data used in this paper are available for request at DTU Space.
We thank the providers of the F10.7 and ap indices that enabled the analysis presented in this paper. The F10.7 index was provided by the National Research Council Canada, in partnership with Natural Resources Canada, and obtained via https://www.spaceweather.gc.ca/forecast-prevision/solar-solaire/solarflux/sx-5-en.php (last access: 10 September 2024), and the ap index was provided by GFZ (Matzka et al., 2021a, b).
OMNI data were obtained via GSFC/SPDF OMNIweb (https://omniweb.gsfc.nasa.gov/form/omni_min.html, last access: 22 August 2024). We thank the ACE MAG and SWEPAM instrument teams, the ACE Science Center, the DSCOVR PlasMag instrumentation team, and the Wind MFI and SWE instrument teams for providing the ACE, DSCOVR, and Wind data.
This work was supported by the Co-financing Scheme of the Danish Defence Acquisition and Logistics Organization (DALO) (contract no. 4600005418A).
This paper was edited by Keisuke Hosokawa and reviewed by two anonymous referees.
Anderson, P. C. and Bukowski, A. L.: Magnetic Local Time and Interplanetary Magnetic Field By Variation of Cusp Location Dependence on Dipole Tilt, J. Geophys. Res.-Space, 129, https://doi.org/10.1029/2023ja031886, 2024. a, b, c, d, e
Banks, P. M., Chappell, C. R., and Nagy, A. F.: A new model for the interaction of auroral electrons with the atmosphere: Spectral degradation, backscatter, optical emission, and ionization, J. Geophys. Res., 79, 1459–1470, https://doi.org/10.1029/JA079i010p01459, 1974. a, b
Bartels, J.: Annals of The International Geophysical Year, Vol. 4,, chap. 4, The technique of scaling indices K and Q of geomagnetic activity, Pergamon Press, London, New York, Paris, 215–226, https://doi.org/10.1016/B978-1-4832-1304-0.50006-3, 1957. a
Brekke, A., Feder, T., and Berger, S.: Pc4 giant pulsations recorded in Tromso, 1929–1985, J. Atmos. Terr. Phys., 49, 1027–1032, https://doi.org/10.1016/0021-9169(87)90109-7, 1987. a
Elphic, R. C., Lockwood, M., Cowley, S. W. H., and Sandholt, P. E.: Flux transfer events at the magnetopause and in the ionosphere, Geophys. Res. Lett., 17, 2241–2244, https://doi.org/10.1029/gl017i012p02241, 1990. a
Engebretson, M. J., Hughes, W. J., Alford, J. L., Zesta, E., Cahill, L. J., Arnoldy, R. L., and Reeves, G. D.: Magnetometer array for cusp and cleft studies observations of the spatial extent of broadband ULF magnetic pulsations at cusp/cleft latitudes, J. Geophys. Res.-Space, 100, 19 371–19 386, https://doi.org/10.1029/95ja00768, 1995. a, b, c, d
Engebretson, M. J., Posch, J. L., Pilipenko, V. A., and Chugunova, O. M.: ULF waves at very high latitudes, American Geophysical Union, 137–156, https://doi.org/10.1029/169gm10, 2006. a
Eschenhagen, M.: On minute, rapid, periodic changes of the Earth’s magnetism, Terrestrial Magnetism, 2, 105–114, https://doi.org/10.1029/tm002i003p00105, 1897. a
Feldstein, Y. and Starkov, G.: Dynamics of auroral belt and polar geomagnetic disturbances, Planet. Space Sci., 15, 209–229, https://doi.org/10.1016/0032-0633(67)90190-0, 1967. a
Friis-Christensen, E. and Wilhjelm, J.: Polar cap currents for different directions of the interplanetary magnetic field in the Y-Z plane, J. Geophys. Res., 80, 1248–1260, https://doi.org/10.1029/ja080i010p01248, 1975. a, b
Friis-Christensen, E., McHenry, M. A., Clauer, C. R., and Vennerstrøm, S.: Ionospheric traveling convection vortices observed near the polar cleft: A triggered response to sudden changes in the solar wind, Geophys. Res. Lett., 15, 253–256, https://doi.org/10.1029/gl015i003p00253, 1988. a, b
Fuselier, S. A., Kletzing, C. A., Petrinec, S. M., Trattner, K. J., George, D., Bounds, S. R., Sawyer, R. P., Bonnell, J. W., Burch, J. L., Giles, B. L., and Strangeway, R. J.: Multiple Reconnection X-Lines at the Magnetopause and Overlapping Cusp Ion Injections, J. Geophys. Res.-Space, 127, e30354, https://doi.org/10.1029/2022JA030354, 2022. a
Glassmeier, K. H.: ULF pulsations in the polar cusp and cap, in: Electromagnetic Coupling in the Polar Clefts and Caps, edited by: Sandholt, P. E. and Egeland, A., 167 pp., https://doi.org/10.1007/978-94-009-0979-3_12, 1989. a
Greenstadt, E. W., Inouye, G. T., Green, I. M., and Judge, D. L.: Vela 3 magnetograms at 18 RE structure and pulsations in the magnetosheath, J. Geophys. Res., 72, 3855–3876, https://doi.org/10.1029/jz072i015p03855, 1967. a
Harang, L.: Observations of micropulsations in the magnetic records at Tromsø, Terrestrial Magnetism and Atmospheric Electricity, 37, 57, https://doi.org/10.1029/TE037i001p00057, 1932. a
Hasegawa, H., Wang, J., Dunlop, M. W., Pu, Z. Y., Zhang, Q. H., Lavraud, B., Taylor, M. G. G. T., Constantinescu, O. D., Berchem, J., Angelopoulos, V., McFadden, J. P., Frey, H. U., Panov, E. V., Volwerk, M., and Bogdanova, Y. V.: Evidence for a flux transfer event generated by multiple X-line reconnection at the magnetopause, Geophys. Res. Lett., 37, L16101, https://doi.org/10.1029/2010GL044219, 2010. a
Heppner, J. P., Sugiura, M., Skillman, T. L., Ledley, B. G., and Campbell, M.: OGO-A magnetic field observations, J. Geophys. Res., 72, 5417–5471, https://doi.org/10.1029/jz072i021p05417, 1967. a
Holzworth, R. H. and Meng, C.: Mathematical representation of the auroral oval, Geophys. Res. Lett., 2, 377–380, https://doi.org/10.1029/gl002i009p00377, 1975. a
Jacobs, J. A.: Geomagnetic micropulsations, vol. 1, Springer Verlag, https://doi.org/10.1007/978-3-642-86828-3, 1970. a
Jacobs, J. A., Kato, Y., Matsushita, S., and Troitskaya, V. A.: Classification of geomagnetic micropulsations, J. Geophys. Res., 69, 180–181, https://doi.org/10.1029/jz069i001p00180, 1964. a, b
Johnsen, M. G. and Lorentzen, D. A.: A statistical analysis of the optical dayside open/closed field line boundary, J. Geophys. Res.-Space, 117, https://doi.org/10.1029/2011ja016984, 2012. a, b
Kepko, L. and Kivelson, M.: Generation of Pi2 pulsations by bursty bulk flows, J. Geophys. Res.-Space, 104, 25021–25034, https://doi.org/10.1029/1999ja900361, 1999. a
Kozyreva, O., Pilipenko, V., Lorentzen, D., Baddeley, L., and Hartinger, M.: Transient Oscillations Near the Dayside Open‐Closed Boundary: Evidence of Magnetopause Surface Mode?, J. Geophys. Res.-Space, 124, 9058–9074, https://doi.org/10.1029/2018ja025684, 2019. a
Lee, L. C., Shi, Y., and Lanzerotti, L. J.: A mechanism for the generation of cusp region hydromagnetic waves, J. Geophys. Res., 93, 7578–7585, https://doi.org/10.1029/JA093iA07p07578, 1988. a
Lester, M., Hughes, J. W., and Singer, H. J.: Polarization patterns of Pi 2 magnetic pulsations and the substorm current wedge, J. Geophys. Res.-Space, 88, 7958–7966, https://doi.org/10.1029/ja088ia10p07958, 1983. a
Lockwood, M. and Wild, M. N.: On the quasi-periodic nature of magnetopause flux transfer events, J. Geophys. Res., 98, 5935–5940, https://doi.org/10.1029/92JA02375, 1993. a
Mansurov, S. M.: New evidence of the relationship between magnetic field in space and on the Earth, Geomagn. Aeron., 768–773, ISSN 0016-7932, 1969. a, b
Mantas, G. P. and Walker, J. C.: The penetration of soft electrons into the ionosphere, Planet. Space Sci., 24, 409–423, https://doi.org/10.1016/0032-0633(76)90085-4, 1976. a, b
Matzka, J., Bronkalla, O., Tornow, K., Elger, K., and Stolle, C.: Geomagnetic Kp index, https://doi.org/10.5880/KP.0001, 2021a. a
Matzka, J., Stolle, C., Yamazaki, Y., Bronkalla, O., and Morschhauser, A.: The Geomagnetic Kp Index and Derived Indices of Geomagnetic Activity, Space Weather, 19, https://doi.org/10.1029/2020sw002641, 2021b. a
McHarg, M. G. and Olson, J. V.: Correlated optical and ULF magnetic observations of the winter cusp – Boundary layer system, Geophysical Res. Lett., 19, 817–820, https://doi.org/10.1029/92gl00117, 1992. a
McHarg, M. G., Olson, J. V., and Newell, P. T.: ULF cusp pulsations: Diurnal variations and interplanetary magnetic field correlations with ground‐based observations, J. Geophys. Res.-Space, 100, 19729–19742, https://doi.org/10.1029/94ja03054, 1995. a, b
Moen, J. and Brekke, A.: The solar flux influence on quiet time conductances in the auroral ionosphere, Geophys. Res. Lett., 20, 971–974, https://doi.org/10.1029/92gl02109, 1993. a, b
Motoba, T., Ebihara, Y., Ogawa, Y., Kadokura, A., Engebretson, M. J., Angelopoulos, V., Gerrard, A. J., and Weatherwax, A. T.: On the Driver of Daytime Pc3 Auroral Pulsations, Geophys. Res. Lett., 46, 553–561, https://doi.org/10.1029/2018gl080842, 2019. a, b, c
Newell, P. T. and Meng, C.: The cusp and the cleft/boundary layer: Low‐altitude identification and statistical local time variation, J. Geophys. Res.-Space, 93, 14549–14556, https://doi.org/10.1029/ja093ia12p14549, 1988. a
Newell, P. T. and Meng, C.-I.: Dipole tilt angle effects on the latitude of the cusp and cleft/low-latitude boundary layer, J. Geophys. Res.-Space, 94, 6949–6953, https://doi.org/10.1029/JA094iA06p06949, 1989. a, b
Newell, P. T., Meng, C., Sibeck, D. G., and Lepping, R.: Some low‐altitude cusp dependencies on the interplanetary magnetic field, J. Geophys. Res.-Space, 94, 8921–8927, https://doi.org/10.1029/ja094ia07p08921, 1989. a
Newell, P. T., Ruohoniemi, J. M., and Meng, C.: Maps of precipitation by source region, binned by IMF, with inertial convection streamlines, J. Geophys. Res.-Space , 109, https://doi.org/10.1029/2004ja010499, 2004. a, b
Pilipenko, V., Belakhovsky, V., Engebretson, M. J., Kozlovsky, A., and Yeoman, T.: Are dayside long-period pulsations related to the cusp?, Ann. Geophys., 33, 395–404, https://doi.org/10.5194/angeo-33-395-2015, 2015. a, b, c
Pinnock, M., Rodger, A. S., Dudeney, J. R., Baker, K. B., Newell, P. T., Greenwald, R. A., and Greenspan, M. E.: Observations of an enhanced convection channel in the cusp ionosphere, J. Geophys. Res., 98, 3767–3776, https://doi.org/10.1029/92JA01382, 1993. a
Richmond, A. D.: Ionospheric Electrodynamics Using Magnetic Apex Coordinates, J. Geomagn. Geoelectr., 47, 191–212, https://doi.org/10.5636/jgg.47.191, 1995. a
Rinne, Y., Moen, J., Oksavik, K., and Carlson, H. C.: Reversed flow events in the winter cusp ionosphere observed by the European Incoherent Scatter (EISCAT) Svalbard radar, J. Geophys. Res.-Space, 112, A10313, https://doi.org/10.1029/2007JA012366, 2007. a
Rolf, B.: Giant micropulsations at Abisko, Terrestrial Magnetism and Atmospheric Electricity, 36, 9, https://doi.org/10.1029/TE036i001p00009, 1931. a
Rostoker, G., Samson, J. C., and Higuchi, Y.: Occurrence of Pc 4, 5 micropulsation activity at the polar cusp, J. Geophys. Res., 77, 4700–4706, https://doi.org/10.1029/JA077i025p04700, 1972. a, b, c
Russell, C. T. and Elphic, R. C.: Initial ISEE Magnetometer Results: Magnetopause Observations, Space Sci. Rev., 22, 681–715, https://doi.org/10.1007/BF00212619, 1978. a
Russell, C. T. and Elphic, R. C.: ISEE observations of flux transfer events at the dayside magnetopause, Geophys. Res. Lett., 6, 33–36, https://doi.org/10.1029/gl006i001p00033, 1979. a
Sakurai, T. and McPherron, R. L.: Satellite observations of Pi 2 activity at synchronous orbit, J. Geophys. Res.-Space, 88, 7015–7027, https://doi.org/10.1029/ja088ia09p07015, 1983. a, b
Samson, J. C., Harrold, B. G., Ruohoniemi, J. M., Greenwald, R. A., and Walker, A. D. M.: Field line resonances associated with MHD waveguides in the magnetosphere, Geophys. Res. Lett., 19, 441–444, https://doi.org/10.1029/92gl00116, 1992. a
Sandholt, P. E. and Farrugia, C. J.: On the dynamic cusp aurora and IMF By, J. Geophys. Res.-Space, 104, 12461–12472, https://doi.org/10.1029/1999ja900126, 1999. a, b
Sonett, C. P., Judge, D. L., and Kelso, J. M.: Evidence concerning instabilities of the distant geomagnetic field: Pioneer I, J. Geophys. Res., 64, 941–943, https://doi.org/10.1029/jz064i008p00941, 1959. a
Sonnerup, B. U. Ö., Cahill, L. J., and Davis, L. R.: Resonant vibration of the magnetosphere observed from Explorer 26, J. Geophys. Res., 74, 2276–2288, https://doi.org/10.1029/ja074i009p02276, 1969. a
Stauning, P.: Investigations of ionospheric radio wave absorption processes using imaging riometer techniques, J. Atmos. Terr. Phy., 58, 753–764, https://doi.org/10.1016/0021-9169(95)00072-0, 1996. a
Stauning, P.: Polar convection-related ionospheric radiowave absorption processes observed by imaging riometers, Adv. Space Res., 22, 1279–1288, https://doi.org/10.1016/S0273-1177(98)00172-0, 1998. a
Svalgaard, L.: Sector structure of the interplanetary magnetic field and daily variation of the geomagnetic field at high latitudes, Danish Meteorological Institute, Geophysical Papers, Preprint R-6, 1968. a, b
Takahashi, K. and Liou, K.: Longitudinal structure of low-latitude Pi2 pulsations and its dependence on aurora, J. Geophys. Res.-Space, 109, A12206, https://doi.org/10.1029/2004JA010580, 2004. a
Vennerstrøm, S.: Dayside magnetic ULF power at high latitudes: A possible long-term proxy for the solar wind velocity?, J. Geophys. Res.-Space, 104, 10145–10157, https://doi.org/10.1029/1999ja900015, 1999. a
Øieroset, M., Sandholt, P. E., Lühr, H., Denig, W. F., and Moretto, T.: Auroral and geomagnetic events at cusp/mantle latitudes in the prenoon sector during positive IMF By conditions: Signatures of pulsed magnetopause reconnection, J. Geophys. Res.-Space, 102, 7191–7205, https://doi.org/10.1029/96ja03716, 1997. a