the Creative Commons Attribution 4.0 License.
the Creative Commons Attribution 4.0 License.
 | 23 Jun 2026
Equatorial ionospheric plasma bubbles during intense geomagnetic storms of Solar Cycle 25
Andres Calabia
Chukwuma Anoruo
Aqsa Zahid
Christine Amory-Mazaudier
Binod Adhikari
This study examines the low-latitude ionospheric response to four intense geomagnetic storms during Solar Cycle 25 (March, April, November 2023, and May 2024), focusing on Equatorial Ionization Anomaly (EIA) variations and post-sunset plasma irregularities. We used the Weimer (2005) model for Joule Heating (JH), Madrigal total electron content (TEC) maps, and GNSS-derived ROTI to analyze storm-time changes in EIA structure and equatorial plasma bubbles (EPBs). The May 2024 storm exhibited the strongest post-sunset JH, particularly near the June solstice, while March and April storms showed moderate JH and November the lowest. Equinox storms produced nearly symmetric JH patterns, while solstice storms revealed interhemispheric asymmetries. Following JH thresholds are used for the classification of storms: weak (20–30 mW m−2, November), moderate (30–50 mW m−2, March/April) and strong (>50 mW m−2, May). JH, together with storm-time electric fields and equatorial meridional winds, influence the location, strength, hemispheric asymmetry, and the generation or suppression of plasma irregularities of the EIA crest. The generation of ionospheric plasma irregularities and their geographical distribution strongly depend on EIA's density gradients and general structure. Well-developed double-crest EIAs with steep density gradients favor post-sunset irregularities, while single-crest or merged EIAs are less favorable. Fluctuations in the IMF Bz drive east-west prompt penetration electric fields that dynamically modulate the F region, altering the plasma fountain effect, the EIA structure, and the distribution of plasma bubbles after sunset. These results suggest that during geomagnetic storms, the combined effects of storm-driven electrodynamics and neutral winds modulate low-latitude ionospheric variability, influencing EIA dynamics and the formation of plasma irregularities.
- Article
(14347 KB) - Full-text XML
-
Supplement
(22836 KB) - BibTeX
- EndNote


The study of ionospheric properties, particularly the equatorial ionosphere, is critical because of its influence on radio signal transmission, such as those from Global Navigation Satellite Systems (GNSS). The ionosphere, an ionized layer of the upper atmosphere extending from about 60 to 1000 km. It comprises three main regions – D (50–90 km), E (90–150 km), and F (150–500 km) – whose boundaries vary with local time, season, and geomagnetic activity. During magnetic storms, thermospheric and ionospheric parameters such as neutral wind, composition, and electric fields deviate from their normal patterns, driving upper-atmosphere variability (Balan et al., 2018) and causing disturbances in the GNSS signal (Zhang et al., 2020). Geomagnetic storms strongly impact low-latitude ionospheric phenomena such as the equatorial plasma fountain (EPF), the equatorial ionization anomaly (EIA) and plasma irregularities (Kelley, 2009; Kassa et al., 2015). The EPF arises from the upward E×B drift that lifts plasma from the magnetic equator and its subsequent field-aligned diffusion. The resulting EIA exhibits enhanced electron density at about 15° magnetic latitude north and south, with a trough near the magnetic equator (Balan et al., 2018). Both the EPF and the EIA are highly sensitive to variations in zonal electric fields during geomagnetic storms.
Storm-time electric fields can emerge from either a short-lived prompt penetration electric field (PPEF) or a disturbance dynamo electric field (DDEF). The southward turning of the Interplanetary Magnetic Field (IMF) Bz component causes a rapid increase in high-latitude convection and substorm activity. Convective electric fields at high latitudes can expand much faster than the magnetosphere can respond, enabling them to rapidly penetrate the low-latitude ionosphere. The PPEF polarity is east during the day and west during the night. When the IMF Bz component turns northward, the Region 2 currents intensify and create a shielding layer in response to the previously enhanced magnetospheric convection. Region 2 currents are field-aligned currents flowing at lower latitudes (equatorward of the auroral zone) that connect the inner magnetosphere to the ionosphere and play a key role in shielding the inner magnetosphere from external electric fields. This shielding layer is a configuration of currents and electric fields that normally prevents external magnetospheric electric fields from penetrating to low latitudes. However, when the Region 2 currents overcompensate, they produce an overshielding electric field with polarity opposite to the PPEF, which rapidly penetrates to low latitudes during the initial phase of enhanced convection when IMF Bz turns southward. This overshielding electric field penetrates into the low-latitude ionosphere (near the equator, roughly ±30° magnetic latitude), and this overshielding penetration can be as efficient as the electric field penetration that occurs when the IMF Bz turns southward. The DDEF is a manifestation of disturbed thermospheric circulation and equatorial winds. High-latitude heating during storms improves meridional neutral winds, resulting in strong equatorial winds. At low latitudes, these disturbance winds generate a westward/eastward electric field on the dayside and nightside, contradicting their quiet-time tendencies. Compared to PPEF, DDEF takes hours to form and usually lasts several hours (Astafyeva et al., 2018; Blanc and Richmond, 1980; Huang et al., 2005; Kikuchi et al., 2008). Moreover, vertical equatorial plasma drifts associated with PPEF and DDEF exhibit seasonal and longitudinal dependence (Fejer et al., 1999).
In addition to storm-time electric fields, equatorward thermospheric neutral winds transport plasma between hemispheres, modifying the low-latitude ionosphere. The input of high-latitude storm energy rapidly expands the neutral atmosphere, altering the global ratio and, in turn, affecting the plasma densities of the EIA (Li et al., 2018; Rishbeth, 2000; Kassa et al., 2015). Thermospheric circulation also drives EIA hemispheric asymmetry, enhancing the winter-hemisphere crest via trans-equatorial winds (Huang et al., 2005; Tulasi Ram et al., 2009). Seasonal and orbital effects, such as increased solar EUV near perihelion, can further raise density by 20 % in the northern EIA crest compared to the southern crest (Lin et al., 2005). Storm-time perturbations in electric fields, neutral winds, and composition strongly influence the evolution of the EIA. PPEFs in the east and disturbed meridional winds can expand the EIA to mid-latitudes and induce significant density changes (Balan et al., 2009; Tsurutani et al., 2004). Although the EIA typically exhibits a double-crest structure, single or merged crests may develop under specific conditions. A stronger fountain effect produces extended, pronounced crests, whereas weaker fountains can suppress them, leading to a single crest, as observed during extremely low solar activity over 110° E (Huang et al., 2013). In contrast, merging of daytime EIA crests during storm recovery can result from neutral equatorward winds, with minor contributions from downward E×B drift and increased ratio (Balan et al., 2013).
Plasma depletions, or Equatorial Plasma Bubbles (EPBs), are localized reductions in F region plasma density caused by post-sunset Rayleigh-Taylor (R–T) instabilities, leading to significant radio signal disruptions. Most depletions occur in the EIA region (Cueto et al., 2012). Post-sunset plasma depletions, or EPBs, develop via R–T instabilities, with onset controlled by pre-reversal enhancement (PRE), terminator alignment, and seasonal factors, and are further enhanced during geomagnetic storms (Araujo-Pradere et al., 2006; Liu et al., 2010; Seba and Nigussie, 2016; Amaechi et al., 2018). Morphological and spectral studies show that the irregularities in the E region are rod-shaped along the field lines, whereas the irregularities in the F region extend along and across the field (Vaggu et al., 2023). Statistical analysis from Swarm observations reveal that EPB occurrence varies with longitude, season, local time, latitude, solar and geomagnetic activity, and is influenced by vertical E×B drift, thermospheric winds, and atmospheric gravity waves (Aa et al., 2020; Fuller-Rowell et al., 1997). Overall, the complex interplay of electric fields, neutral winds, thermospheric composition, and geomagnetic activity governs the spatiotemporal variability of the low-latitude ionosphere, particularly the EIA and post-sunset plasma irregularities, highlighting the need for combined modeling and observational studies to understand ionospheric responses during geomagnetic storms.
In low-latitude and equatorial regions, intense geomagnetic storms can generate nighttime ionospheric plasma irregularities, ranging from centimeters to thousands of kilometers (Abdu et al., 2009). The storm-time uplift of the F layer enhances vertical drift E×B and plasma density gradients, favoring R–T instability and post-sunset irregularity formation (González, 2022; Calabia et al., 2024; Imtiaz et al., 2024; Tahir et al., 2024; Kassa et al., 2024). Eastward (westward) storm-time electric fields promote (suppress) irregularities by raising (lowering) the F region, with PRE providing additional uplift conducive to R–T instability (Aarons, 1991, 1997; Tulasi Ram et al., 2009). Vertical plasma transport, driven by PPEF and DDEF, is a primary mechanism for irregularity formation (Abdu, 2006), while suppression can result from westward PPEFs during northward IMF Bz or storm-induced DDEFs (Huang, 2019; Kassa et al., 2023; Imtiaz et al., 2024; Kassa et al., 2024). For example, long-term eastward PPEFs can enhance upward ion drift by up to 180 m s−1 (Huang, 2019), and simulations and observations during the 3–4 November 2023 storm show that eastward/westward fields correspond to upward/downward ion drifts (Wu et al., 2024). Overall, the occurrence and characteristics of ionospheric irregularities depend on solar and geomagnetic activity, latitude, longitude, local time, and season (Abdu, 1997; Dugassa et al., 2019; Araujo-Pradere et al., 2006).
To better understand and model their variability, it is essential to analyze the occurrence characteristics of EPBs under varying geomagnetic conditions. In this study, we examine storm-time ionospheric conditions that influence EIA structures and the formation of post-sunset plasma irregularities or EPBs. Madrigal TEC maps are used to characterize EIA features, such as separated or merged crests, during the main phases of intense geomagnetic storms in Solar Cycle 25. Post-sunset ionospheric irregularities are analyzed using the GNSS-based Rate of Change TEC index (ROTI), while PPEF observations are used to assess the role of low-latitude electric fields in shaping EIA structures favorable for R–T instability. The paper is structured as follows: Section 2 describes the data and analysis methods, Sect. 3 presents the results and interpretations, and Sect. 4 summarizes the findings and conclusions.
Solar Wind Data. We employ 1 min and hourly data of solar wind parameters such as the IMF Bz, the solar wind speed (Vsw), the eastward zonal component Ey of the interplanetary electric field (IEF), the ring current proxy index SYM-H, the geomagnetic activity index (Kp), and the solar radio flux at 10.7 cm (F10.7). The data is freely available at https://omniweb.gsfc.nasa.gov/form/omni_min.html (last access: 6 October 2025) in the NASA OMNIWeb database. The SYM-H index is preferred over Dst due to its 1 min cadence, allowing better resolution of rapid geomagnetic variations. Although both indices represent the symmetric component of the ring current, the higher temporal resolution of SYM-H enables a more accurate depiction of the rapid variations and short-term dynamics of geomagnetic variations. Information concerning the sudden storm commencement (SSC), the end of the main phase (MPE), the minimum values of the SYM-H index, the sunspot number (R) and the magnetic quiet days (Q) during different geomagnetic storms is also given in Table 1.
Joule Heating Model. High-latitude ionospheric electrodynamics are analyzed using the CCMC-hosted Weimer (2005) model, available at https://ccmc.gsfc.nasa.gov/models/Weimer~2005/ (last access: 15 May 2024), driven by ACE solar wind data (Weimer, 2005). This empirical model estimates magnetic field-aligned currents (FACs) and electric potentials as functions of solar wind proxies. FACs and potentials, expressed via Fourier series of longitude at discrete latitudes, allowing calculation of Joule Heating (JH) and total Poynting flux. Conductivity variations are implicitly included, enabling the derivation of ionospheric currents and JH without a separate conductivity model.
Madrigal TEC Maps. Madrigal TEC maps, commonly utilized in ionospheric studies, are developed from comprehensive, global, and distributed geodetic receiver data (Rideout and Coster, 2006). The CEDAR Madrigal database provides worldwide TEC maps with 1° × 1° resolution that are updated every 5 min, available at http://cedar.openmadrigal.org/ (last access: 23 June 2023). Using Madrigal TEC maps, the EIA structures can be characterized by analyzing the latitudinal spread of plasma density around ±10–20° magnetic equator. These structures appear as double crests (two peaks with a central trough), single crests (one peak dominant, the other weak/missing), or merged crests (a broad, blended enhancement lacking distinct sides).
GNSS Data-based ROTI. Ionospheric irregularities are quantified using the Rate of TEC Index (ROTI), derived from over 9300 GNSS phase observations at 30 s intervals and averaged into 5 min values at ionospheric pierce points (Aarons, 1997; Basu et al., 1999; Pi et al., 1997). The 2D ROTI maps have a grid 0.25° × 0.25°, with ROTI≥0.5 TECU min−1 indicating disturbances and ROTI≥1.0 TECU min−1 marking significant irregularities. GNSS-TEC software by Seemala (2011) solves for receiver biases and estimates the TEC from satellites with elevation angles ≥30° to minimize multi-path errors. Given TEC data at discrete intervals, the rate of change of TEC (ROT) can be computed as:
In this equation, dTEC is the difference between TEC(ti+1) and TEC(ti) values at times ti+1 and ti, respectively. ROTI is then calculated as the standard deviation of ROT over a specified period, usually 5 min,
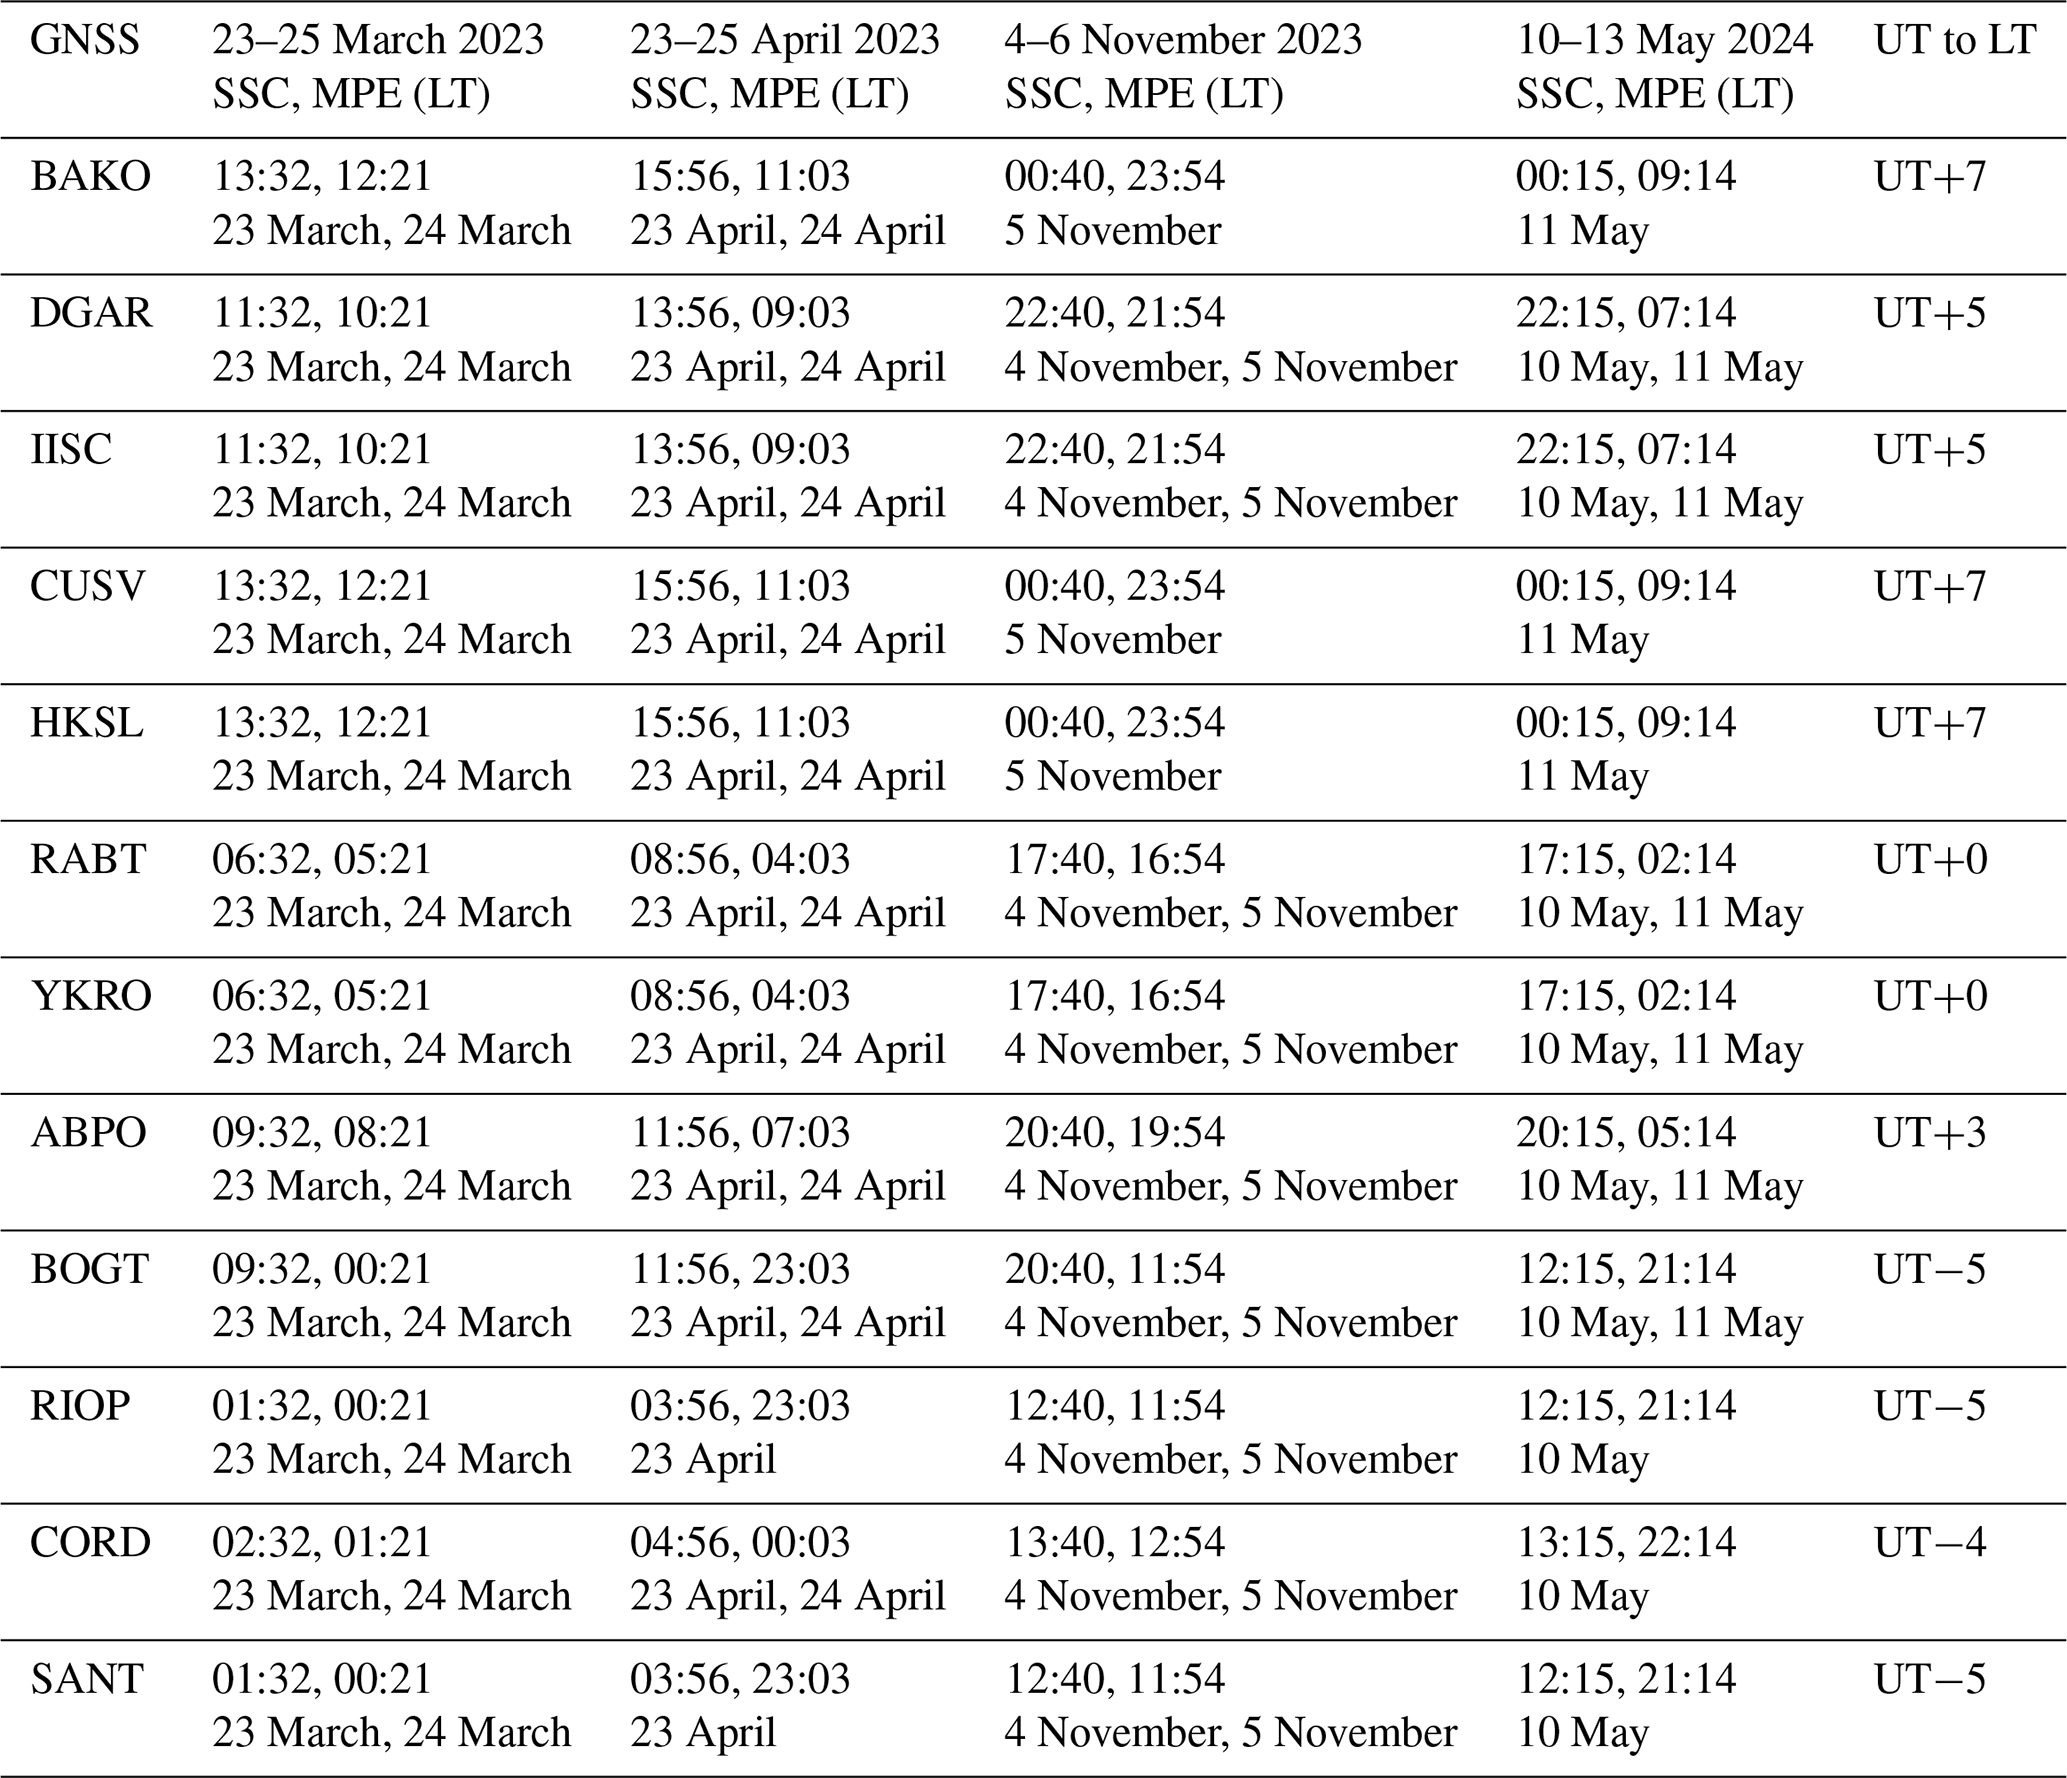
Table 2 shows the geographic and geomagnetic coordinates of equatorial and low-latitude GNSS receivers in the Asian, African and American sectors, which are used to examine the ROTI temporal patterns. Geomagnetic coordinates are obtained using model calculations provided by British Geological Survey-Geomagnetism at https://geomag.bgs.ac.uk/data_service/models_compass/coord_calc.html (last access: 12 May 2026). The GNSS TEC data to estimate ROTI is obtained from https://gage-data.earthscope.org/archive/gnss/rines/obs/2024/131/ (last access: 1 October 2024). Table 3 also includes information on the Local Time (LT) of SSCs and MPEs for the locations of these GNSS receivers. For the categorization of ionospheric irregularities, we used ROTI values as follows: a ROTI value less than 0.25 TECU min−1 indicates the absence of irregularities; a weak irregularity is identified when ROTI ranges from 0.25 to 0.5 TECU min−1; a moderate irregularity is observed when ROTI falls between 0.5 and 1 TECU min−1; and a strong irregularity is present when ROTI exceeds 1 TECU min−1 (Vankadara et al., 2022; Imtiaz et al., 2024).
Table 1Information concerning the Sudden Storm Commencement (SSC), the MPEs, the minimum values of the SYM-H index, the number of Sunspot (R), and Quiet days (Q) with Kp≤3 during different geomagnetic storms of the solar cycle 25.
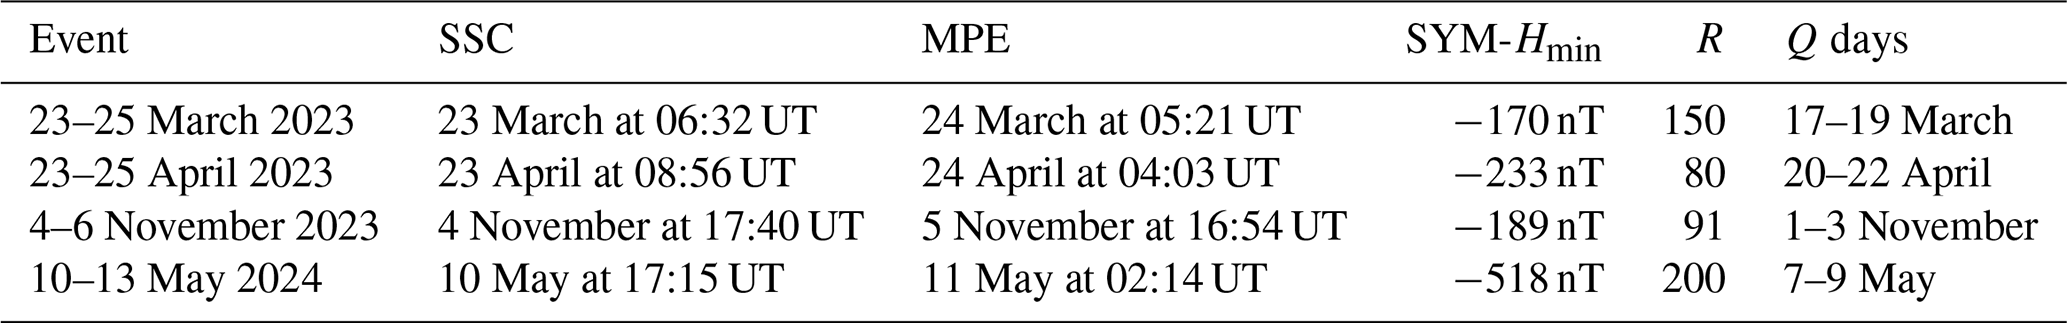
The information given in this table is obtained from OMNI web database.
Table 2Location of GNSS stations used in the analysis. Geographic and geomagnetic coordinates are given in degrees.
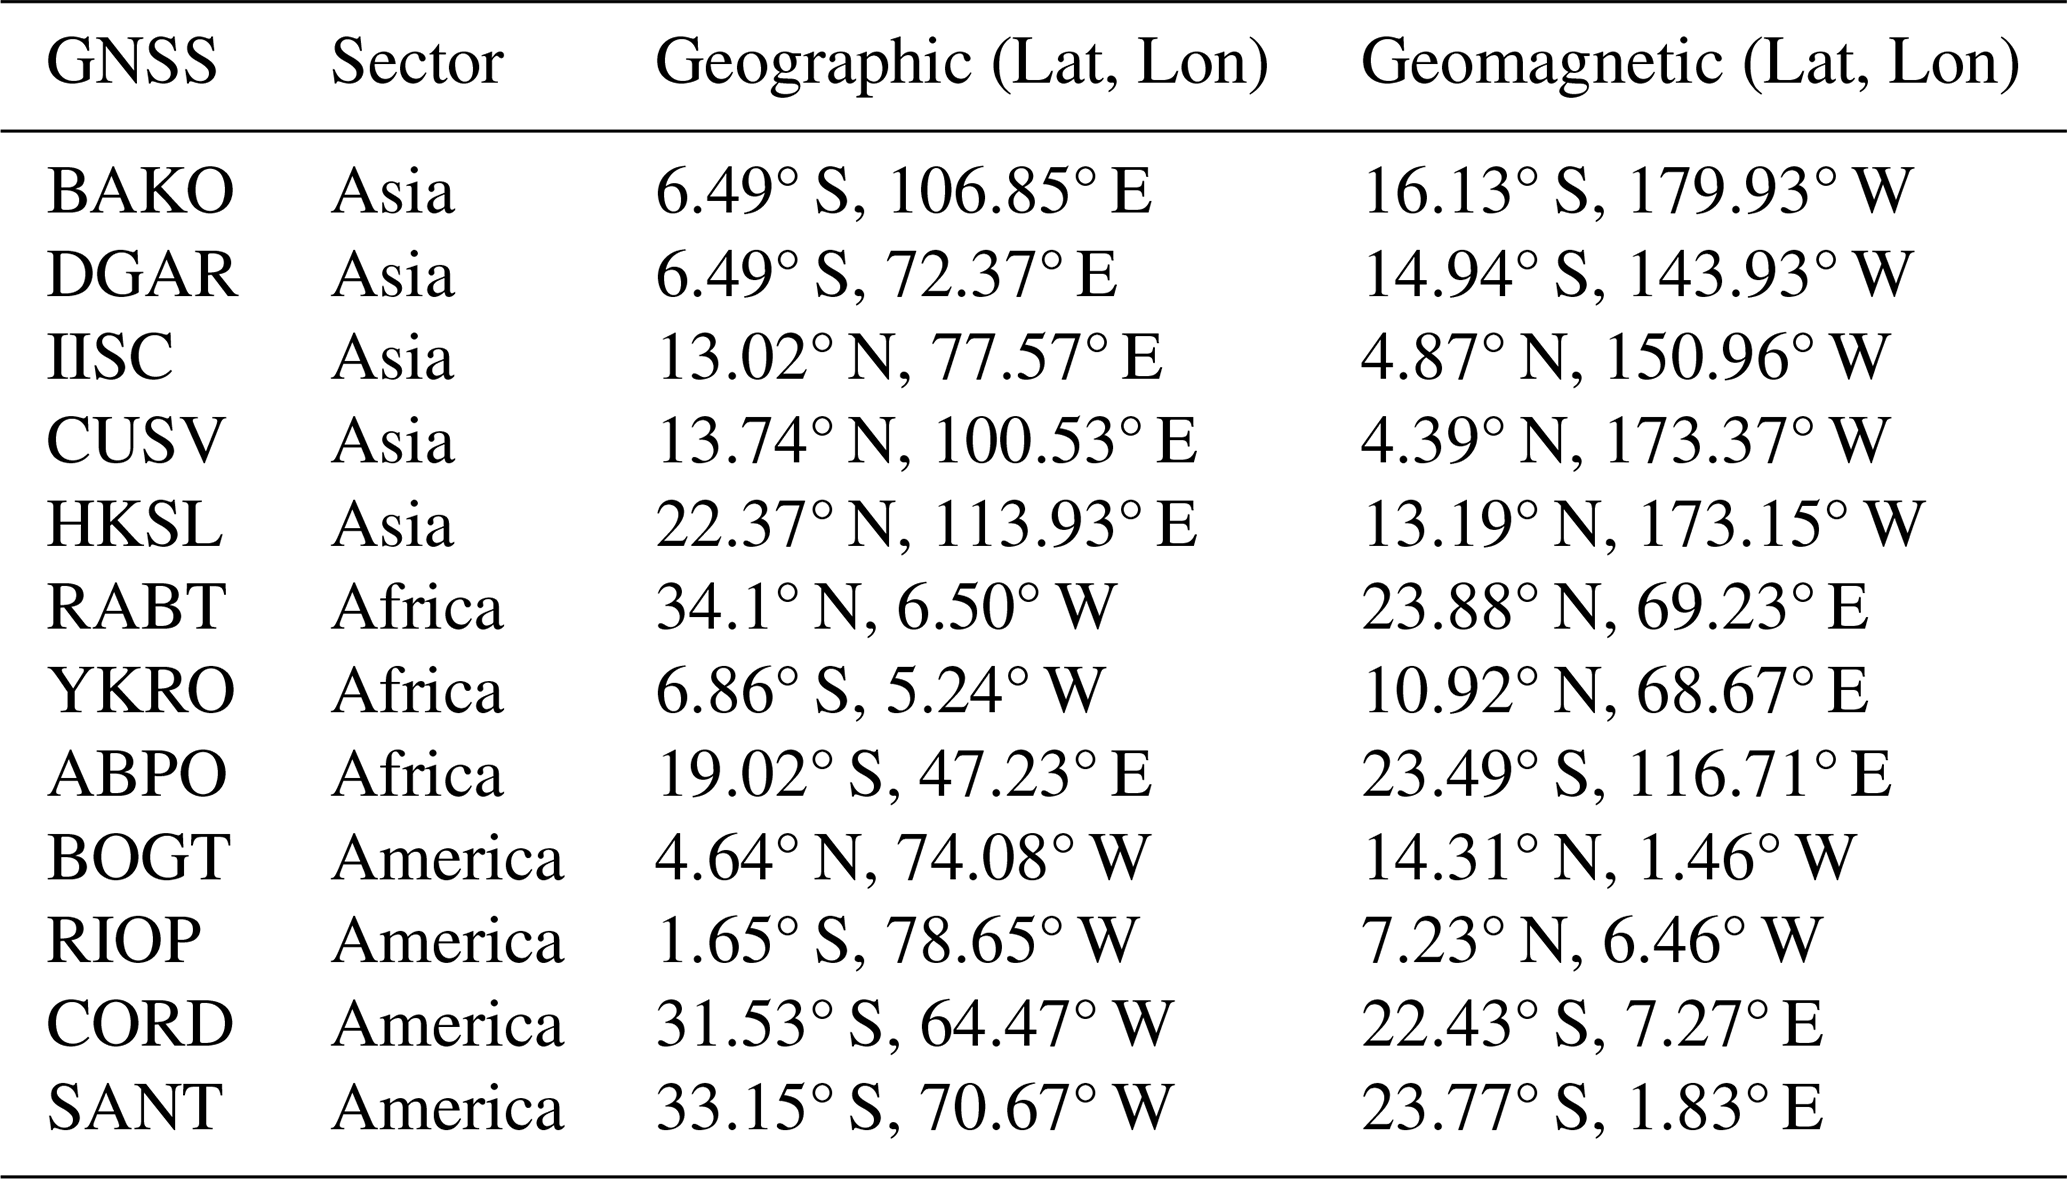
Table 3Local time (LT) of SSC and MPE at the analyzed GNSS stations. UT to LT conversion is given in the last column.
PPEF Model. During geomagnetic storms, the zonal electric field can be expressed as , where Q(t) is the quiet-time field and PPEF(t) is the prompt-penetration electric field. Depending on IMF Bz polarity and local time, PPEFs can enhance or reverse the eastward daytime field, producing significant storm-time variability. The temporal profile of the equatorial electric field at a given longitude is obtained from the real-time PPEF model (https://geomag.colorado.edu/online-calculators/real-time-model-ionospheric-electric-fields, last access: 20 March 2024), which uses solar wind data and a climatological quiet-time model to compute the total eastward electric field (QP), i.e., the sum of background quiet-time electric field (Q) and the PPEF, as a function of time and longitude.
3.1 Solar and magnetosphere conditions
The investigation of the ionospheric response to geomagnetic storms reveals insight into the complex interplay between solar wind and Earth's atmosphere. Here, we investigate the four geomagnetic storms that occurred during the ascending phase of Solar Cycle 25. Figures 1–4 show (a) the Bz and Vsw, (b) the Ey and SYM-H, (c) the AE and AU, and (d) Kp and F10.7 during the storm events considered. In these figures, the SSC and MPE are indicated by vertical red lines, while the yellow rectangles highlight the time interval from 18:00 to 00:00 UT. The following is a brief overview of the geomagnetic conditions during these storms:
23–25 March 2023 storm. As shown in Fig. 1a, the IMF Bz shows two large southward turns throughout the main phase of the storm. The first southward turn occurs on 23 March, at approximately 06:32 UT (Universal Time). Between 06:32 and 12:00 UT, the value of IMF Bz decreased from 2 to −10 nT. The second long-term southward turn of the IMF Bz is seen on 23 March, at 17:22 UT. During this turn, the IMF Bz decreased from 10 nT to approximately −18 nT. The IMF Bz remains south for approximately 9 h before increasing approximately at 05:21 UT on 24 March. During the main phase of this storm, the Vsw fluctuated between 400 and 500 km s−1. During the recovery phase of this storm, Vsw increased and reached maximum value of 600 km s−1 on 25 March. An IMF northward Bz generates an electric field westward during the day and eastward at night. Figure 1b shows IEF Ey reached approximately 4 mV m−1 after the first southward excursion of the IMF Bz. From 12:00 to 18:00 UT, on 23 March, it fluctuated rapidly between +5 and −5 mV m−1. During the second southward excursion, it again increases and reached the maximum value of 8.22 mV m−1 at 17:22 on 23 March. After that, it started to decrease to normal conditions. Figure 1b shows main phase of this storm started soon after SYM-H reached a value of 28 nT at the time of SSC. During the extended southward turning of IMF Bz (Bz<0), enhanced ring current caused by magnetic reconnection dropped the SYM-H index to −170 nT on 24 March, at 05:21 UT (end of the main phase).
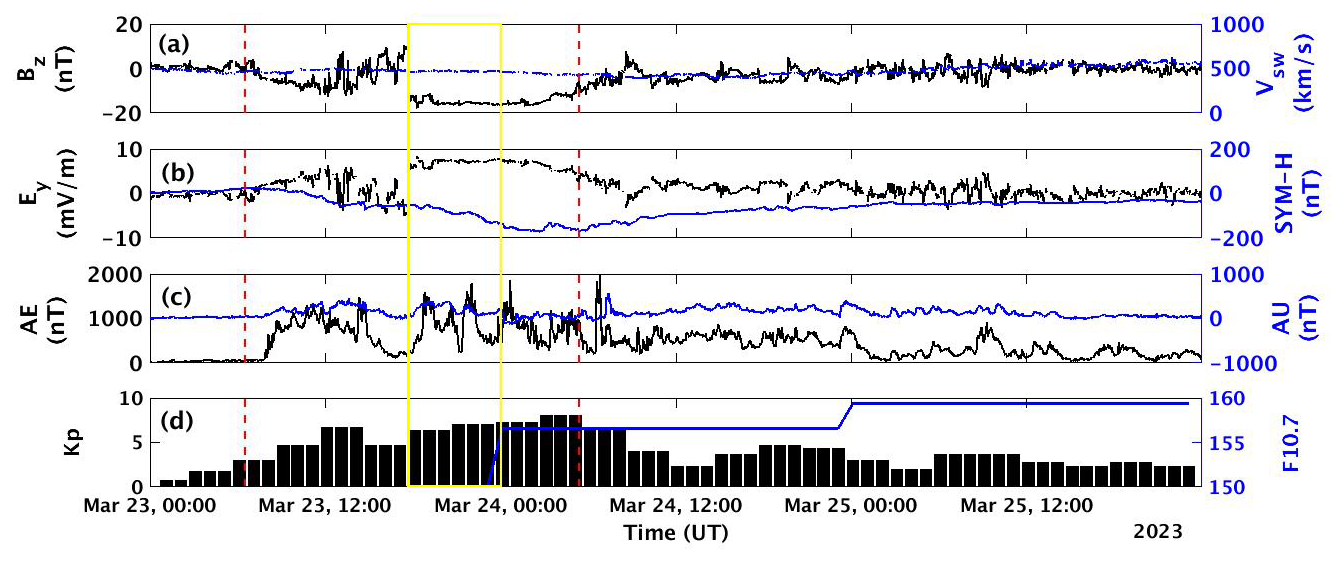
Figure 1Temporal variation of: (a) solar wind speed (Vsw) and Bz component of IMF, (b) Ey component of IMF and SYM-H, (c) the auroral electrojet indices AE and AU, and (d) the magnetic index (Kp) during 23–25 March 2023 storm.
The SYM-H increases during the recovery phase until it reaches quiet time value. As illustrated in Fig. 1c, the AE index fluctuates during the main phase of this storm. Specifically, three peaks of approximately 1000 nT in the midnight sector highlight the intensification of auroral substorms. Figure 1d shows that before SSC, Kp was lower than 4+. On 24 March, approximately at 04:00 UT, the Kp value peaked at 8+ and then began to decrease as the storm recovery began approximately at 05:21 UT. The F10.7 index fluctuated between 157.7 and 159.4 sfu indicating moderate solar activity during this storm.
23–25 April 2023 storm. Figure 2a–d show the solar wind and geomagnetic conditions during the period 22–26 April 2023. The interval between the vertical red lines indicates the main phase of the storm, which started at SSC on 23 April at 08:56 UT. At the time of the SSC, the IMF Bz is at 0 nT which turned southward, and then later reached the value of −20 nT between 18:00 to 21:00 UT. During this time, Vsw increased from 400 km s−1 and reached the maximum value of 751 km s−1 at 21:39 UT on 23 April.
After 3 h, the IMF Bz turned northward and fluctuated between 0 and 20 nT until 01:20 UT before a second strong southward excursion on 24 April. This second long-term southward turn of IMF Bz is seen on 24 April at 01:21 UT. During this turn, a sharp decrease in the IMF Bz from 20 nT to approximately −34 nT is observed in Fig. 2a.
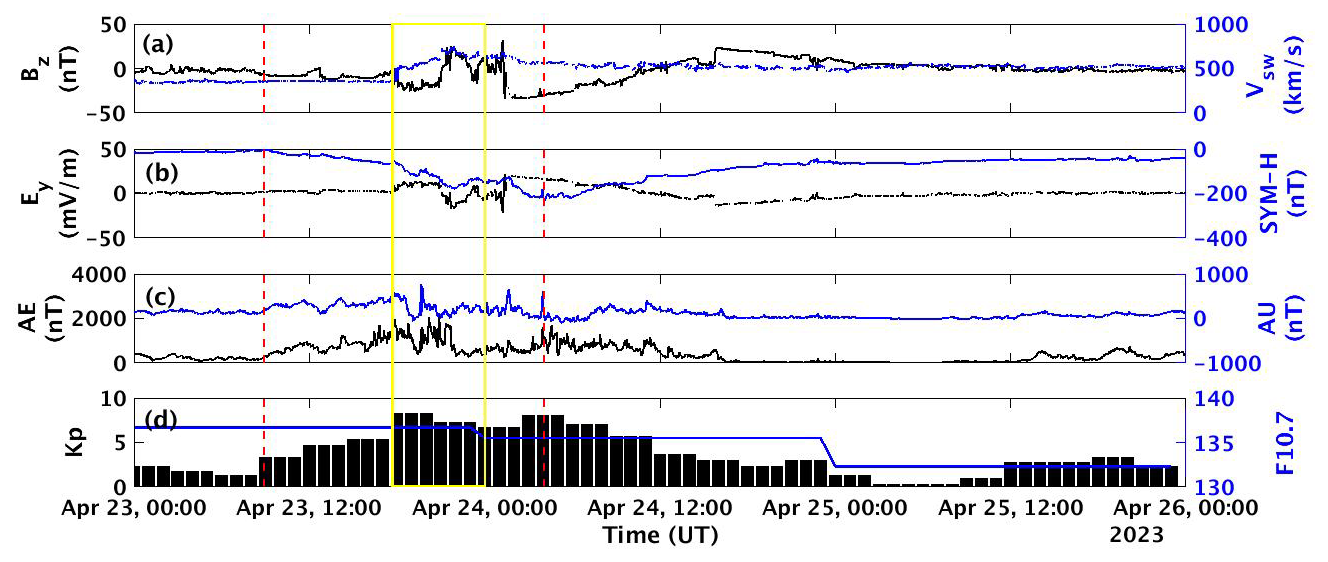
Figure 2Temporal variation of: (a) solar wind speed (Vsw) and Bz component of IMF, (b) Ey component of IMF and SYM-H, (c) the auroral electrojet indices AE and AU, and (d) the magnetic index (Kp) and the solar radio flux at 10.7 cm (F10.7) during 23–25 April 2023 storm.
The IMF Bz remains southward for approximately 3 h until the end of the main phase at 04:03 UT on 24 April. During this period, Vsw remained at approximately 600 km s−1 until the main phase ended at 04:03. Figure 2b shows a two-step geomagnetic storm, with SYM-H minima values of −179 nT (at 21:59 UT) and −233 nT (at 04:03 UT) on 23 and 24 April, respectively. During the main phase, the IEF Ey oscillates rapidly between −21 and 21 mV m−1. As shown in Fig. 2c, the AE index shows dramatic peaks after dusk during the storm's main phase. These rapid variations in the dusk sector highlight intensified auroral substorms, which inject massive energy into the auroral ionosphere. During the solar wind-magnetosphere interaction process, the Kp index increased to 8.3, indicating intense geomagnetic storm conditions. Following the strong geomagnetic storm, the Kp index dropped from 8.3 to 6.7, then surged to 8, before returning to a calm state. During this time, the solar activity level F10.7 remained steady at approximately 135 sfu as shown in Fig. 2d. The recovery phase began with the northward turn of the IMF Bz and returned to 0 nT after 24 h. During the recovery phase, Vsw also gradually decreased to normal conditions.
4–7 November 2023 storm. The main phase of this storm began with a southward turn of the IMF Bz, reaching a lowest value of approximately −24.9 nT at 11:31 UT on 5 November. Then at 12:00 UT it turned northward and reached maximum value of approximately 40.1 nT at 13:56 UT on the same day. Afterward, the IMF Bz shows a second long-term southward turn reaching −20 nT until the end of the main phase at 16:54 UT. The IMF Bz gradually increases to attain normal values on 5 November. During the main phase, the Vsw is at moderate level at approximately 500 km s−1 and it increased to 600 km s−1 at 12:00 UT on 6 November. Figure 3b shows the IEF Ey and SYM-H, respectively. During the compression phase, the SYM-H sharply increased to 23 nT at 17:09 UT on 4 November and shortly after this the main phase of the storm begins with decrease in SYM-H.
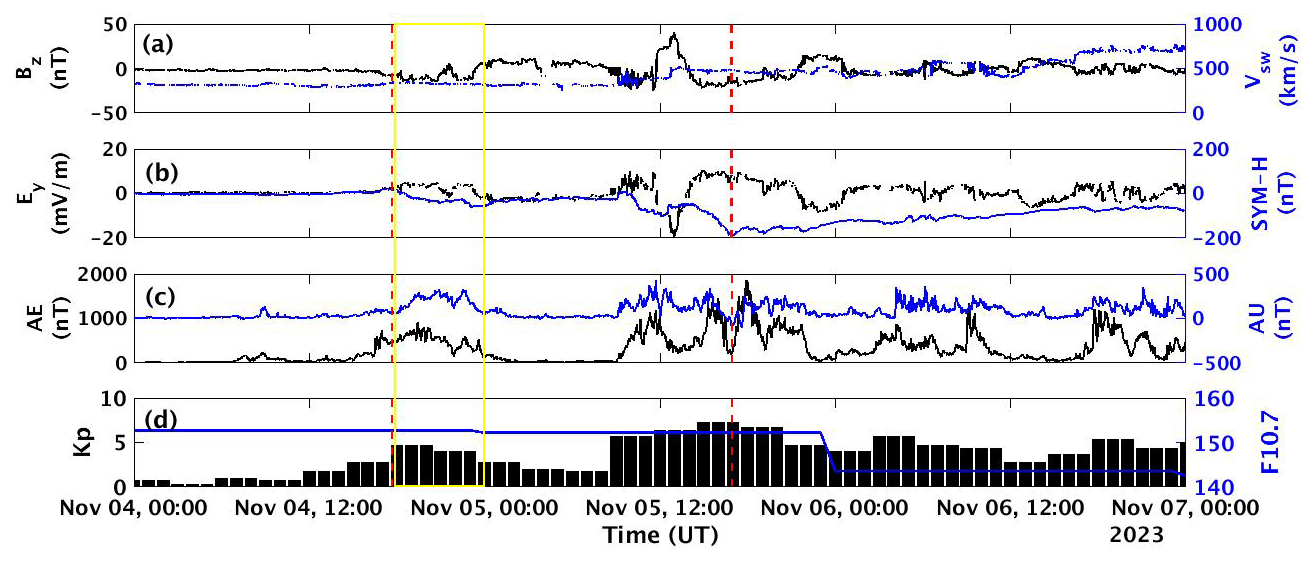
Figure 3Temporal variation of parameters shown as: (a) solar wind speed (Vsw) and Bz component of IMF, (b) Ey component of IMF and SYM-H, (c) the auroral electrojet indices AE and AU, and (d) the magnetic index (Kp) and the solar radio flux at 10.7 cm (F10.7) during 4–7 November 2023.
It was also a double step storm with minimum SYM-H value of approximately −100 nT (at 12:00 UT) and −189 nT (at 16:54 UT) observed on 5 November. Following the polarity of the IMF Bz, the IEF Ey also showed fluctuations between −19.5 and 10.5 mV m−1. As shown in Fig. 3c, the AE index exhibits several sharp peaks ranging from 500 to 800 nT, which signifies a decrease in auroral activity around sunset during the main phase of this storm. Before the SSC, Kp was lower than 3+, indicating quiet conditions, but as the storm begins, it rapidly increased to 5+ due to the initial effect of solar wind shock at 17:40 UT on 4 November. From 00:00 to 08:00 UT on 5 November, the Kp decreased to normal levels before rapidly increasing to 7+, predicting an intense geomagnetic storm between 12:00 and 19:00 UT on November 5. The solar radio flux remained in the range sfu during this period. The recovery phase started at 16:54 UT with a northward turning of the IMF Bz on 5 November.
10–13 May 2024 storm. Figure 4a displays the temporal changes in Vsw and the IMF Bz during 10 to 13 May 2024. The main phase began approximately at 17:15 UT on 10 May, with a sharp southward swing in the IMF Bz, reaching −30 nT, and an increase in Vsw, reaching approximately 700 km s−1. Figure 4b shows variations in SYM-H and IEF Ey between 10 and 13 May. Initially, the SYM-H index increases sharply to 88 nT as the Earth's magnetosphere compresses approximately at 17:15 UT on 10 May. Following this initial increase, the main phase begins with a reduction of SYM-H due to increased ring current in the magnetosphere. The main phase lasted until 02:14 UT on 11 May, when the SYM-H index reached a maximum low of roughly −518 nT. During this phase, the IEF Ey fluctuates rapidly between −37 and 35 mV m−1. As seen in Fig. 4c, the AE index shows extreme spikes that exceed 3000 nT after dusk during the main phase of the storm. This reflects the occurrence of extreme super substorms characterized by substantial energy injection into the magnetosphere. The Kp index indicated substantial geomagnetic activity on 10 May between 12:00 and 15:00 UT, reaching a value of 5. shortly after the SSC, Kp reached to 8 and then began fluctuating between 8 and 9 until the main phase ended at 02:14 UT on 11 May. Following storm recovery, the IMF Bz shows rapid North-South oscillations, while the SYM-H increases gradually to reach normal level. During this phase, Vsw increased to 998 km s−1 and the Kp index varied between 7 and 9 until late evening on 11 May. The F10.7 remained at approximately 220 and 226 sfu indicating strong solar activity during this storm as shown in Fig. 4d.
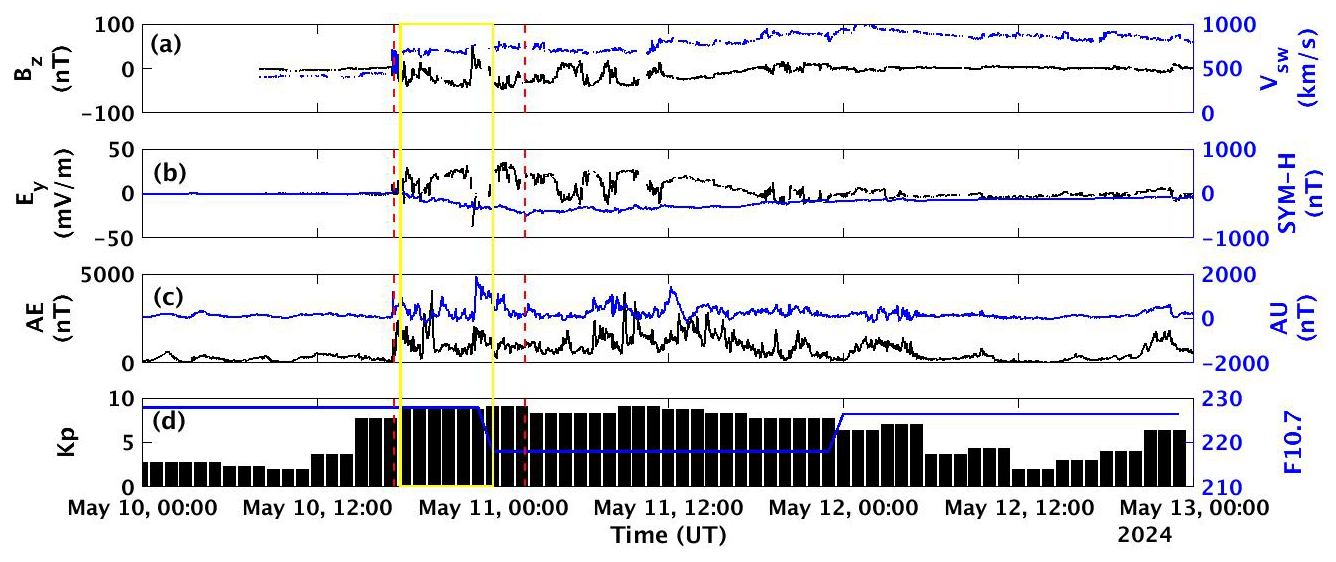
Figure 4Temporal variation of: (a) solar wind speed (Vsw) and Bz component of IMF, (b) Ey component of IMF and SYM-H, (c) the auroral electrojet indices AE and AU, and (d) the magnetic index (Kp) and the solar radio flux at 10.7 cm (F10.7) during 10–13 May 2024.
3.2 High-latitude ionosphere
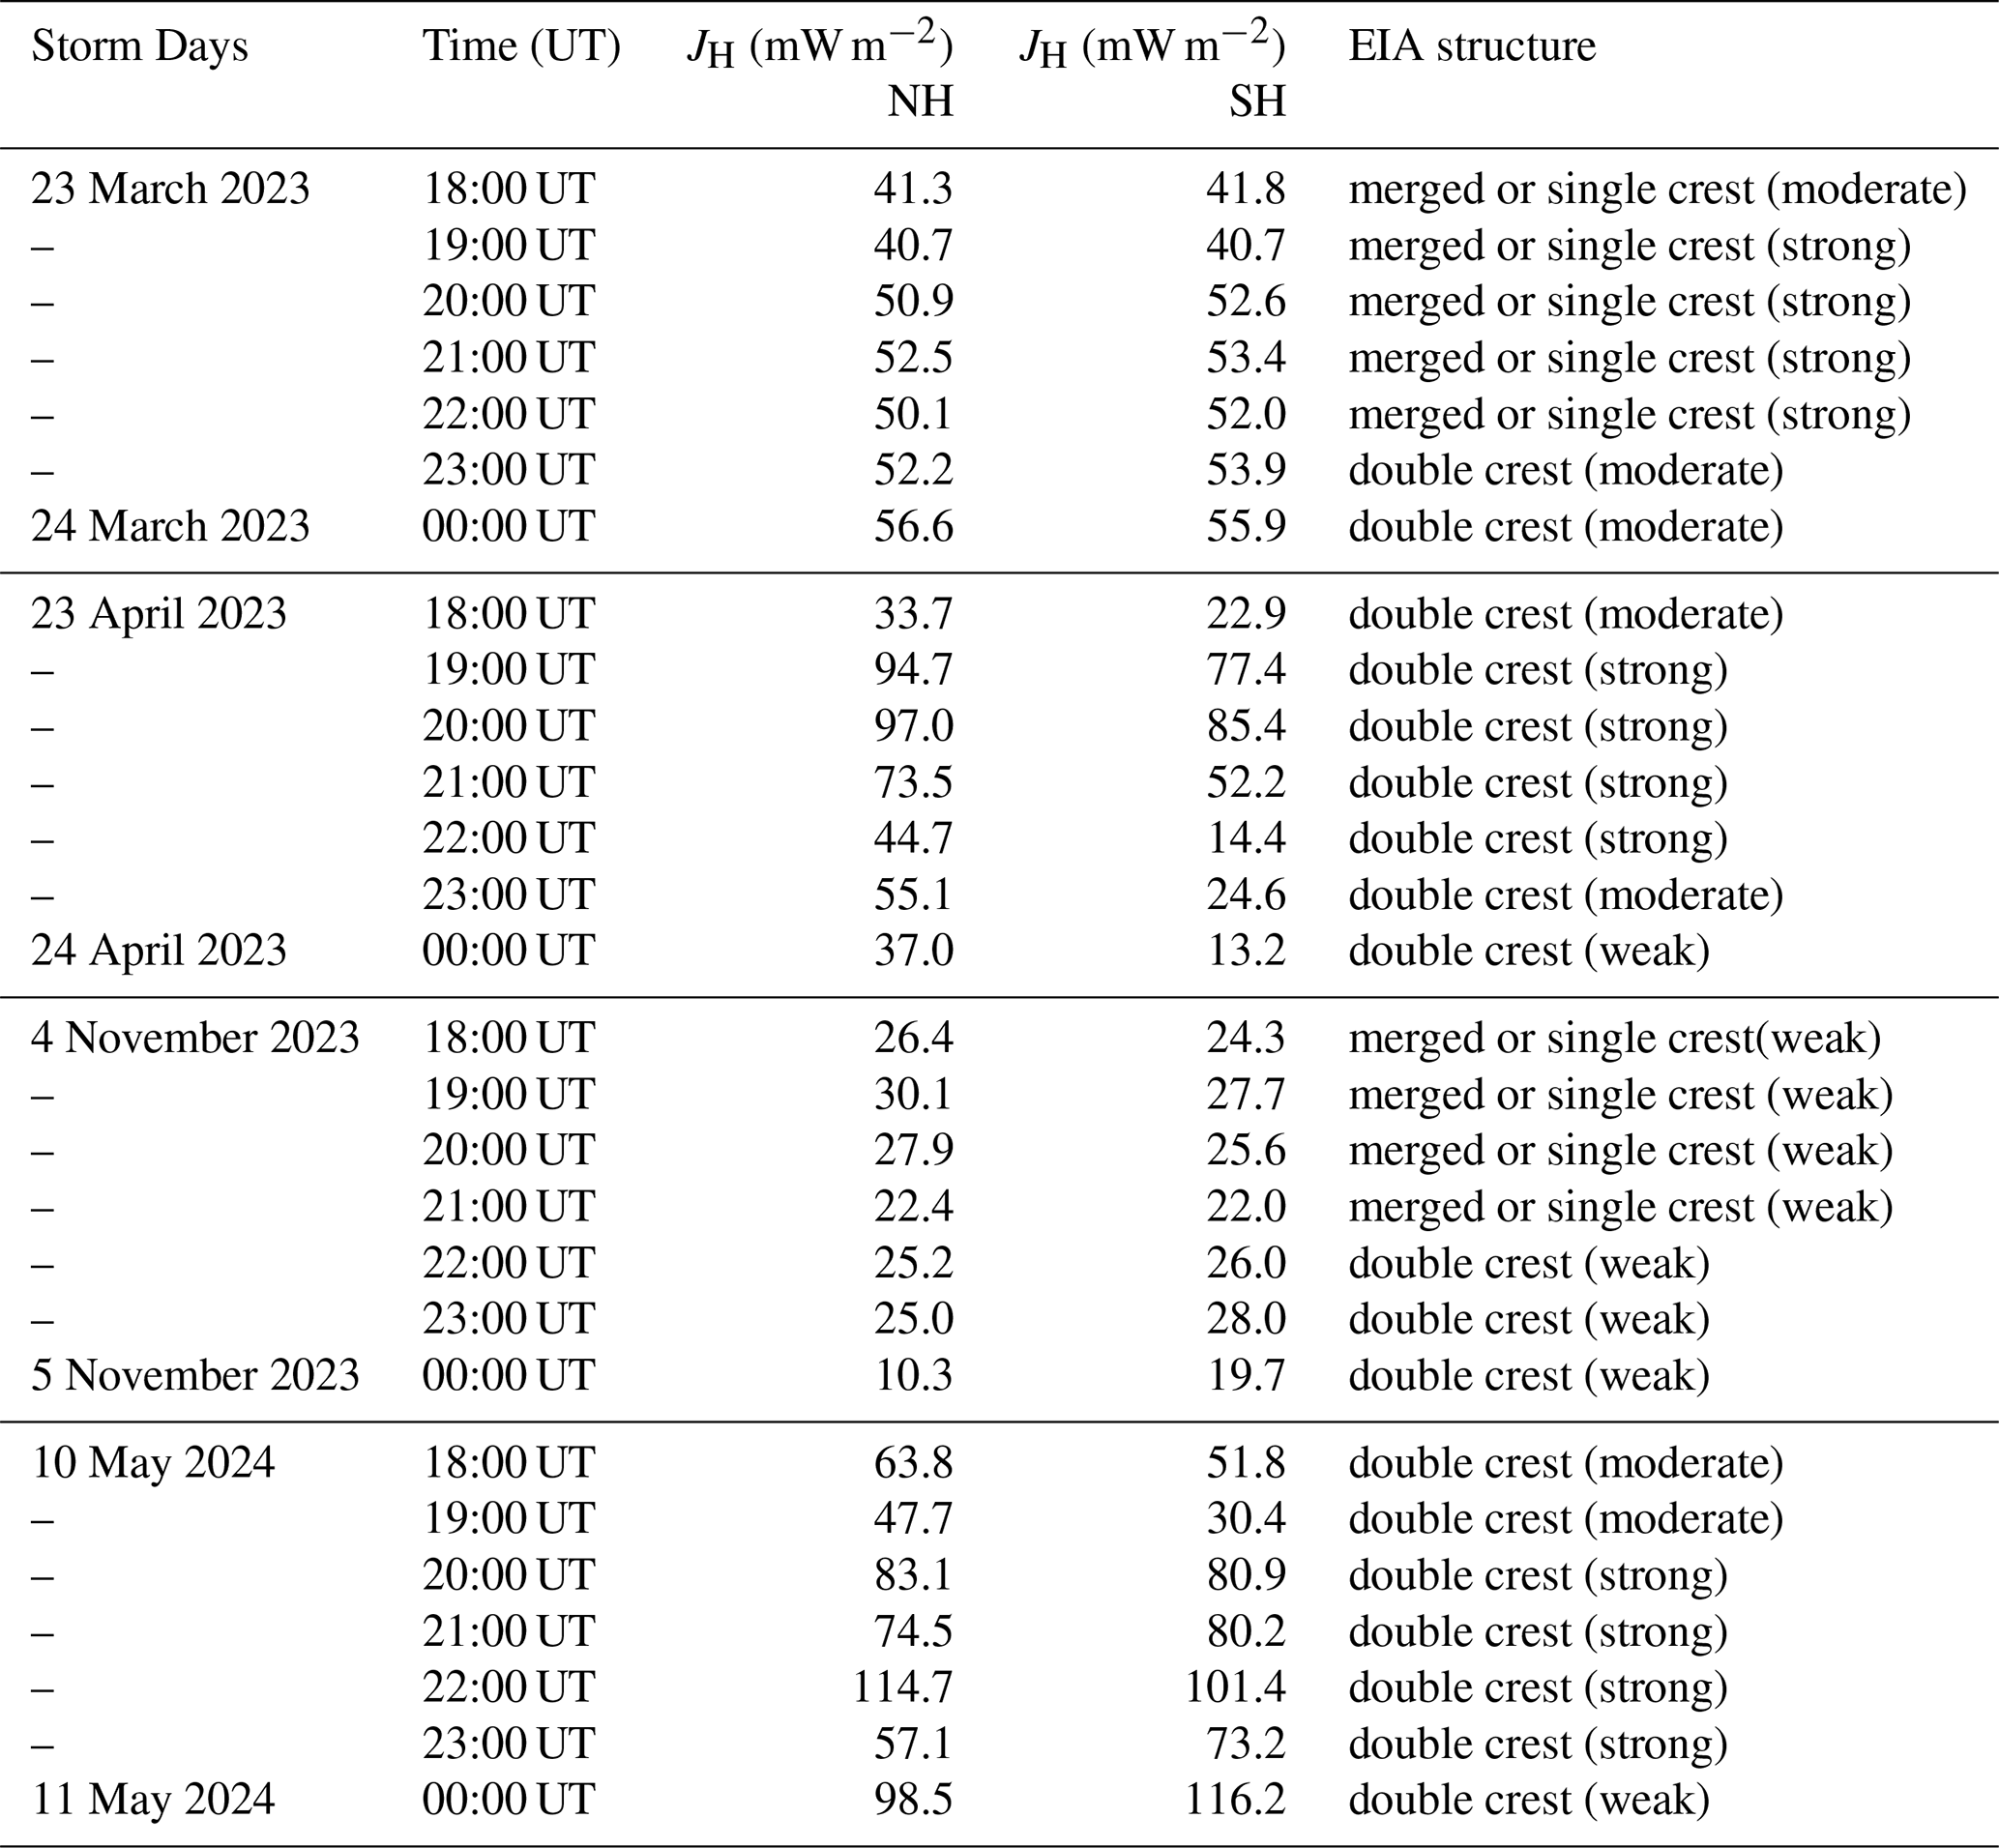
During geomagnetic storms, enhanced convective electric fields and energetic particle injections increase Pedersen currents and ionospheric conductivity (Buonsanto, 1999; Lukianova, 2020; Dungey, 1961; Axford, 1964). This intensifies JH, particularly in the auroral regions where particle precipitation occurs. The resulting thermal expansion of the neutral atmosphere drives equatorward winds and generates traveling atmospheric and ionospheric disturbances (Richmond and Matsushita, 1975; Fuller-Rowell et al., 1994). The solar wind energy dissipated into the magnetosphere–ionosphere system through JH was estimated for four major geomagnetic storms using the Weimer (2005) model hosted at CCMC. Under quiet conditions, JH ranges from 1 to 10 mW m−2, but increases substantially during disturbed periods. Table 4 and Fig. 5 present JH values between 18:00 and 00:00 UT during the main phase of each event.
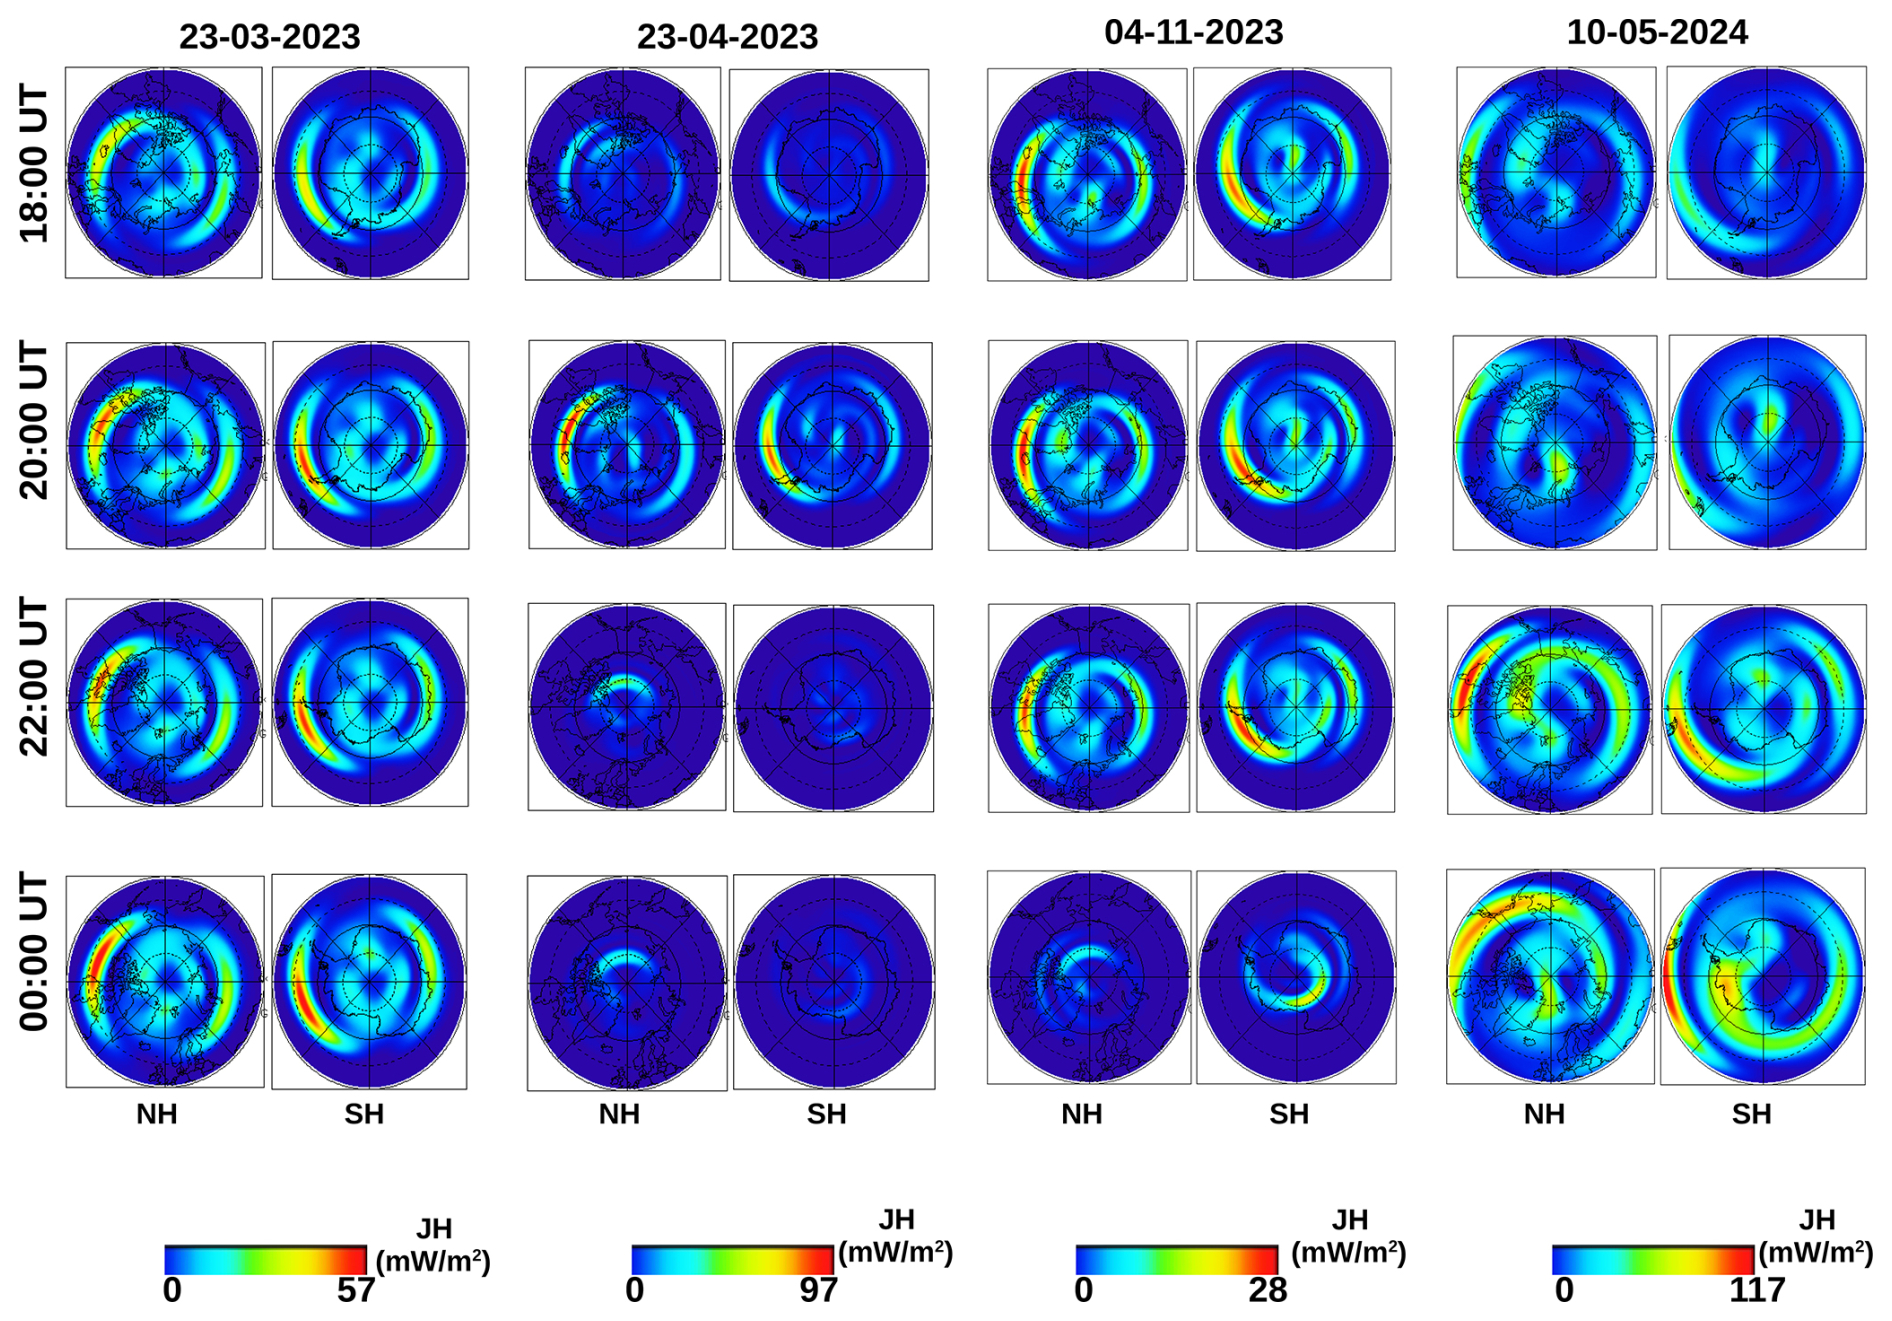
The March 2023 storm ( nT, Vsw=600 km s−1) produced symmetric JH peaks of ∼57 mW m−2. The April 2023 two-step storm (SYM-H =−179, −233 nT) exhibited strong interhemispheric asymmetry with a northern peak near 97 mW m−2. The November 2023 storm showed weaker, nearly symmetric heating, while the May 2024 event ( nT, Vsw=700 km s−1) reached 115 mW m−2 at 22:00 UT, indicating extreme energy deposition. The relative intensity of post-sunset JH follows: May > March > April > November. The following JH thresholds are used for the classification of storms: weak (20–30 mW m−2, November), moderate (30–50 mW m−2, March/April) and strong (>50 mW m−2, May). Hemispheric asymmetries in JH arise from differences in conductivity, magnetic dipole tilt, and IMF orientation, particularly By (Fuller-Rowell et al., 1997; Smith et al., 2023). Enhanced auroral JH modifies global thermospheric circulation (Blanc and Richmond, 1980), redistributing mass density and influencing equatorial plasma transport, thereby contributing to modulation of post-sunset ionospheric irregularities (Jin et al., 2022).
3.3 Low-latitude ionosphere response
During magnetic storms, the low latitude ionosphere exhibits different features due to the complicated interplay of geomagnetic activity, solar radiation, and ionospheric dynamics. Some of these features are discussed here.
3.3.1 Structure of Equatorial Ionization Anomaly (EIA)
JH has a considerable and primarily indirect effect on the post-sunset EIA during the main phase of geomagnetic storms, which is mainly forced by storm-time neutral winds, thermospheric upwelling, and electric field modulation. The strong JH causes an equatorward wind surge, which uses neutral drag to drive plasma along magnetic field lines to higher altitudes. This decreases the downward plasma diffusion and elevates ionospheric heights, reducing chemical loss and supporting positive ionospheric storm effects, which strengthen the EIA intensity. However, the EIA's structure typically undergoes the most significant changes in the evening, at the local sunset. After sunset, the equatorial ionosphere experiences PRE and vertical plasma drifts because of enormous Cowling conductivity and rapid changes in zonal winds. The combination of PPEF and PRE can significantly increase ambipolar diffusion and upward E×B drift, resulting in poleward extension of EIA crests. In contrast to poleward expansion, geomagnetically quiet or disturbed conditions can lead EIA crests to merge into a single peak across the geomagnetic equator. The electrodynamics, vertical plasma drift, neutral winds, and an increase in the low-latitude ratio all contribute to the structuring of EIA crests (Balan et al., 2018; Luan, 2021).
Figure 6 (1–8) shows the temporal variation of the ionospheric TEC during the main phase of the 23–24 March 2023 geomagnetic storm, from 18:00 to 00:00 UT. During the 23–25 March 2023 storm, TEC values showed notable inter-hemispheric asymmetries, with higher values in the Southern Hemisphere during the main phase. Initially, EIA showed well-separated crests, but between 18:00 and 20:00 UT, a significant increase in ionization can be observed in both the crest and trough regions. This behavior differs from the normal EIA structure, in which the trough near the magnetic equator usually has lower ionization than the crests. The deviation from the usual fountain effect is most likely caused by the combined effects of storm-time electric fields and neutral wind dynamics, resulting in unusual plasma redistribution (Luan, 2021). At 22:00 UT, the TEC decreases in the equatorial zone, leading to the formation of the double crests in the EIA. On 24 March, from 00:00 to 06:00 UT, high TEC values (about 90 TECU) were observed at equatorial and low latitudes, indicating geomagnetic disturbances towards the Asian sector. At 12:00 UT, the double crest in the Northern Hemisphere became a single crest and the TEC values slightly decreased. starting from 14:00 UT, ionospheric TEC values began to increase again, marking the beginning of a second phase of ionospheric irregularities. The increase in TEC values towards the Northern Hemisphere indicated a period of geomagnetic disturbance until 22:00 UT. The decreasing TEC values are observed during the recovery phase of the geomagnetic storm from 06:00 UT onward (see figure in the Supplement of madrigal TEC maps for 23–24 March 2023).
Figure 6 (9–14) shows the temporal evolution of ionospheric TEC during the strong geomagnetic storm of 23–24 April 2023. During the main phase of this storm, a well-defined crest EIA can be observed on 23 April, with asymmetric EIA over the pre-midnight sector (America) and expanding poleward at approximately ±25° geomagnetic latitude (Aa et al., 2024). The observed EIA asymmetry in this sector is due to strong southward trans-equatorial wind surges induced by storm-time JH. For example, in the Northern Hemisphere, equatorial (southward) meridional winds restrict plasma downward movement, resulting in plasma concentration at higher altitudes and strong EIA crests. In contrast, poleward (southward) meridional winds increase plasma diffusion and prevent plasma accumulation at high altitudes in the Southern Hemisphere, causing EIA crests to gradually dissipate. After achieving the peak value for the day, the TEC begins to decrease from 22:00 UT forward. The EIA's strength and latitudinal range had significantly decreased, as evidenced by the global ionospheric TEC distribution on 24 April. The main phase of this geomagnetic storm terminates at 04:00 UT, with the EIA's double crest over the Southern Hemisphere merging to a single crest (see the figure in the Supplement of madrigal TEC maps for 23–24 April 2023). Following the peak TEC value in the southern crest, a recovery phase begins at 04:03 UT and persisted until 22:00 UT. During the recovery phase, the ionospheric TEC returns to normal state.
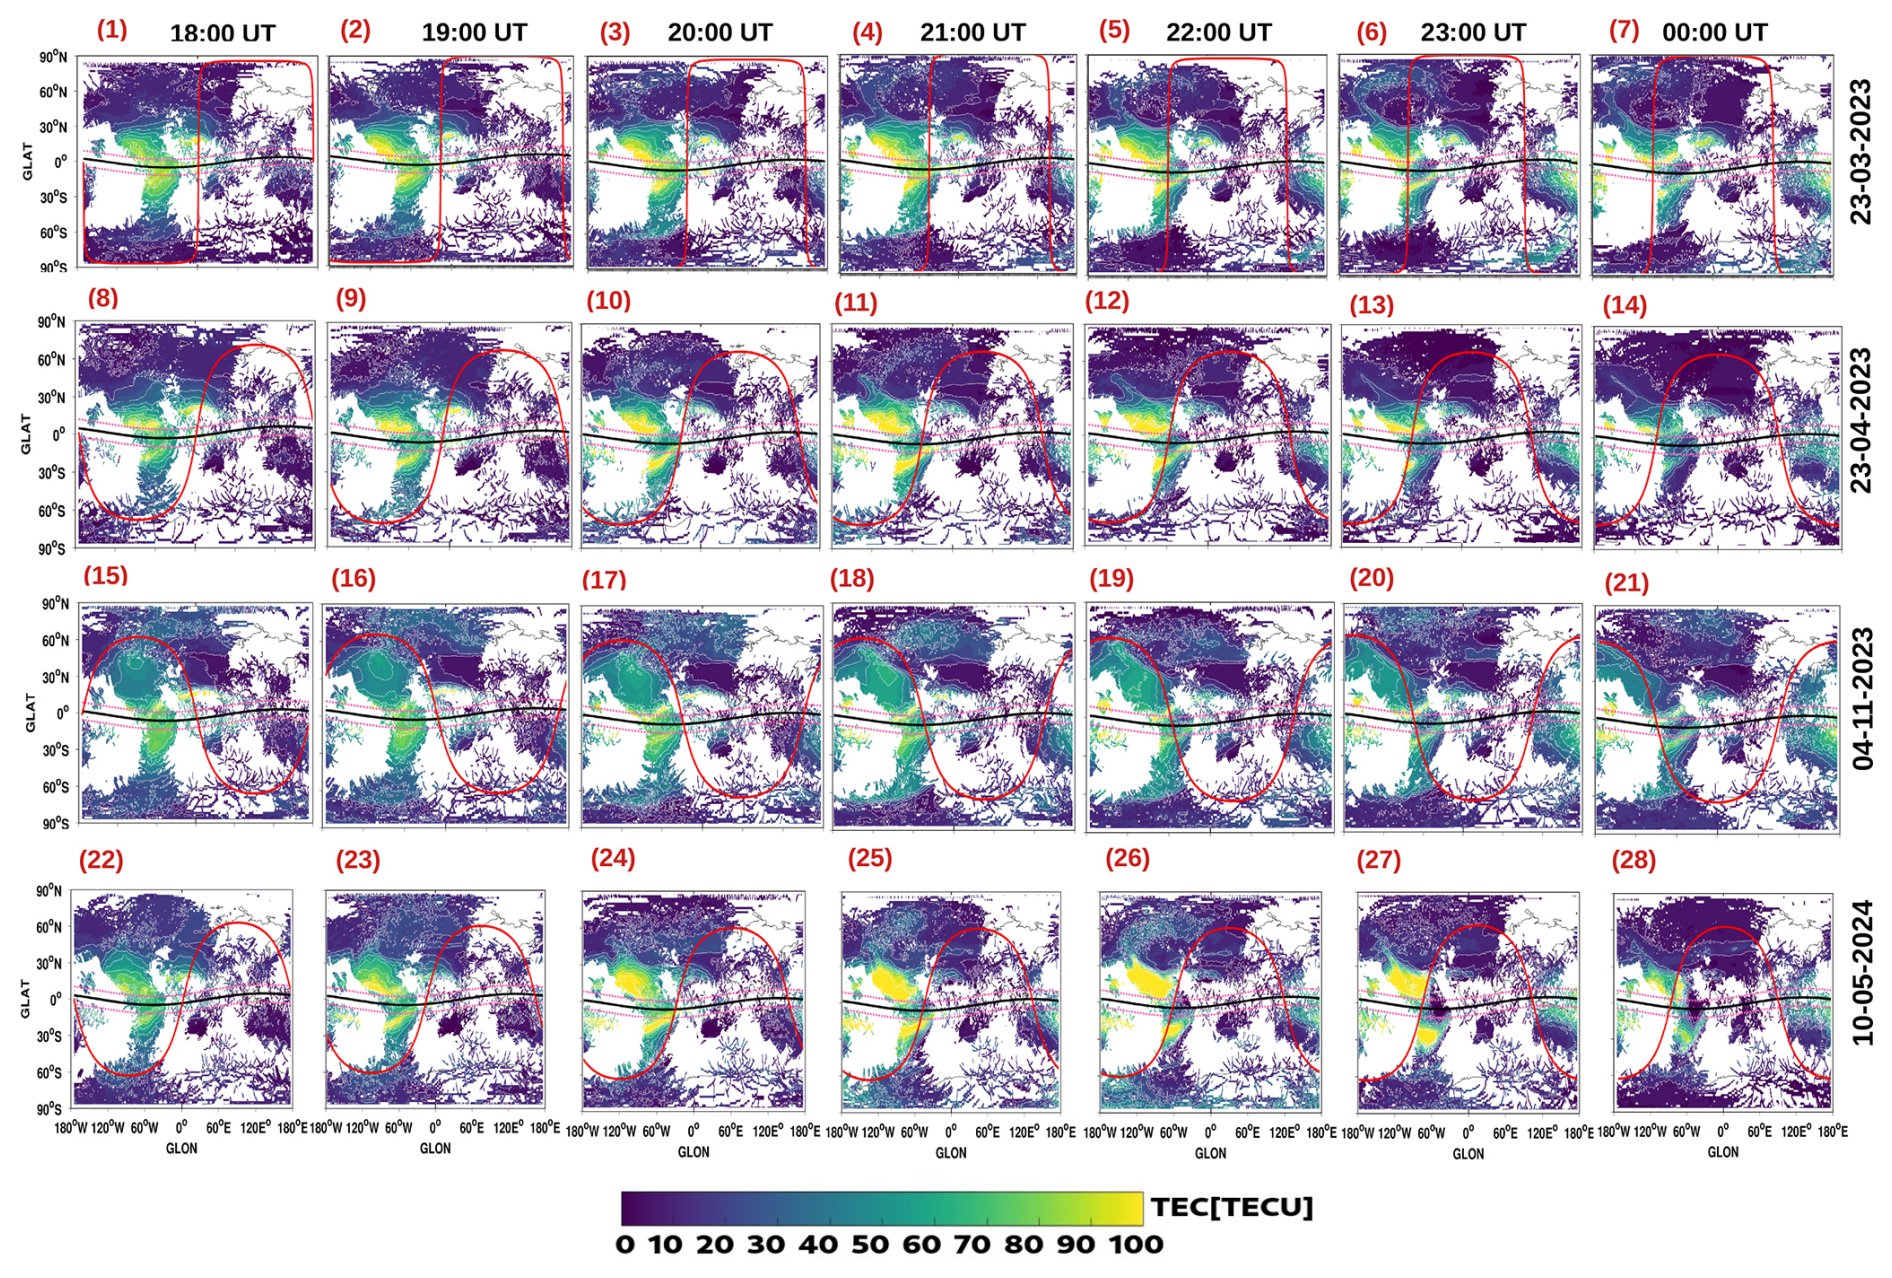
Figure 6Madrigal-based global ionospheric TEC maps during the main phase of the four geomagnetic storms, from 18:00 to 00:00 UT shown as: (1–7) 23–24 March 2023, (8–14) 23–24 April 2023, (15–21) 4–5 November 2023, and (22–28) 10–11 May 2024. In each plot, the two pink dashed lines represent the northern and southern crests of the EIA, the black solid line represents the magnetic equator, and the red outlined region denotes a solar terminator the longitude sector associated with the post-sunset ionospheric response.
Figure 6 (15–21) shows ionospheric TEC maps during the main phase of the 4–5 November 2023 geomagnetic storm, from 18:00 to 00:00 UT. During this period, storm-time ionization was initially confined to the equatorial region, resulting in underdeveloped EIA crests. However, by 20:00 UT, ionization increased in the northern and southern low latitudes, forming a weak EIA with smaller latitudinal extent. Storm-time electrodynamics and variations in thermospheric winds and composition influence the EIA, resulting decrease in TEC at typical crest latitudes. This unusual EIA pattern reflects the complex interaction of disrupted electric fields, neutral winds, and plasma movement during the storm's main phase over the America.
On 10 May 2024, a double crest EIA structure at the equator containing normal TEC values with minor variations observed in other regions until 18:00 UT (see the figure in the Supplement of madrigal TEC maps for 10–11 May 2024). The global ionospheric maps in Fig. 6 (22–28) illustrate the temporal variation of the ionospheric TEC during the main phase of the 10–11 May 2024 geomagnetic storm, from 18:00 to 00:00 UT. The 10–11 May 2024 storm was particularly intense, with substantial increase in TEC in the EIA crests over American longitudes and significant poleward shifting of the EIA crests up to approximately ±35° geomagnetic latitude, during the main phase of this storm. In pre-midnight sector, the meridional wind with large southward (poleward) component in Southern Hemisphere during the main phase of the storm greatly enhanced the ambipolar diffusion in the Southern Hemisphere through neutral drag, resulting in the poleward expansion of the EIA crests between 22:00 to 00:00 UT. Meanwhile, the zonal winds of the storm-time exhibited large surges to the west opposite to the zonal winds of the prevailing quiet-time to the east at the same time. The mid-latitude westward wind surge caused by Coriolis-induced deflection of equatorial wind surges, as well as the ion drag effect of the intense westward subauroral polarization stream that coincided with the primary ionospheric trough. A significant westward wind surge builds up DDEF in the low- and mid-latitude ionosphere, which is typically westward during the day until local dusk. This alters the equatorial zonal electric field, which can minimize upward plasma drifts and reduce the intensity of the EIA. It is very unlikely that the disturbance dynamo was responsible for the excessive poleward expansion observed of the EIA crests during the main phase of the storm (Aa et al., 2024). The recovery phase showed negative with a strong reduction in TEC along with EIA crests suppression and merging into a single equatorial band (see the figure in the Supplement of madrigal TEC maps for 10–11 May 2024). This can be attributed to the effect of composition changes and DDEF that are dominant during the storm recovery phase (Aa et al., 2024).
As reported in previous studies, both positive and negative storm phases have an impact on the latitudinal density gradients at the EIA crests and the background ionospheric density, both of which are essential for the growth of equatorial spread F (ESF) through the R–T instability (Sripathi and Singh, 2020; Singh and Sripathi, 2020). These gradients are modified by storm-time electric fields such as PPEF and DDEF, which change the positions and intensities of ESF events. The ESF formation can also be further shaped by low-latitude sporadic E (Es) layers, which can locally increase densities and initiate localized irregularities (Singh and Sripathi, 2020). The observed dependency of plasma irregularities on the storm phase and the underlying ionospheric structures can be explained by these mechanisms. Furthermore, atmospheric waves and tides play a crucial role in the diurnal variability of the PRE, EIA, and the generation of plasma irregularities. Tidal and gravity wave perturbations originating in the lower atmosphere modify neutral winds, which in turn influence the equatorial dynamo and the vertical E×B drift (Sripathi and Singh, 2020). This variability alters the magnitude and timing of the PRE, modifies the EIA density gradients, and sustains the R–T instability, thereby controlling the occurrence and intensity of equatorial spread F (ESF) (Singh and Sripathi, 2020). Even under geomagnetically disturbed conditions, these processes highlight the importance of lower atmosphere-ionosphere coupling in regulating plasma irregularities.
In each case, the variations in TEC were influenced by the intensity and duration of geomagnetic activity, driven by solar wind parameters and enhanced JH, which affected the distribution and magnitude of ionospheric disturbances at low latitudes. Also, the F10.7 index also serves as a key indicator of solar activity. Moderate solar flux values () are recorded during the equinox (March–April) and winter solstice (November) storms, while enhanced solar activity (F10.7 >200) characterized the May solstice storm (Mother's Day event). Such elevated F10.7 levels correspond to increased solar EUV irradiance, resulting in a denser and more variable ionosphere due to intensified ionization particularly during the mother's day storm. Previous studies have reported that the seasonal variation of EPBs is primarily governed by the angle between the magnetic meridian and the solar terminator. Their occurrence probability is generally higher during equinoctial months (March and April) and minimal around the summer solstice (as seen during the May storm). In our study, the occurrence of EPBs during equinox storms can therefore be attributed mainly to seasonal effects. In contrast, the suppression of post-sunset EPBs during the main phase of the November storm can be explained by the fact that the prompt penetration electric field (PPEF) arrived after midnight local time, when post-sunset conditions were no longer favorable for bubble development. The unseasonal generation of post-sunset EPBs during the Mother's Day storm appears to result from the combined influence of strong solar flux and a significant eastward PPEF near local sunset.
Table 4Joule Heating (JH) in Northern and Southern Hemispheres (NH and SH) and the Equatorial Ionization Anomaly (EIA) over the American longitudes during the main phase of the four geomagnetic storms, from 18:00 to 00:00 UT.
3.3.2 Ionospheric Plasma Bubbles (EPBs)
Figures 7–10 show LT variations of EPBs in the three longitudes that are America, Africa, and Asia during the four geomagnetic storms. Each storm's unique solar wind conditions, geomagnetic activity, and JH distribution which can influence the extent and location of ionospheric disturbances and plasma irregularities. The storm-time ring current is critical for both the development and suppression of EPBs. For instance, EPBs are generated if the greatest excursion of the ring current (minimum SYM-H index) occurs between midnight and postmidnight. However, plasma irregularities are suppressed when the maximum excursion of the ring current occurs in the early afternoon (Aarons, 1991). Table 3 shows the LT of maximum excursion of ring current or MPE at each GNSS location. During geomagnetic storms in March, April, and May, the ring current has the greatest excursion after midnight in American sector, indicating the highest likelihood of plasma irregularities in the evenings following the storms' main phases in this sector. For instance, the maximum ring current excursions at the GNSS stations: BOGT, RIOP, and SANT (LT = UT−5) occurred at approximately 00:21, 23:03, 11:54, and 21:14 LT on 24 March, 24 April, 5 November, and 11 May, respectively. On the same days, the CORD station (LT = UT−4) reported the highest excursions at 01:21, 00:03, 12:54, and 22:14 LT. Notably, the highest excursions during the storms of March, April, and May occurred predominantly during the night to midnight which is the most ideal time for the growth of post-sunset EPBs. During November storm, the maximum ring current excursion occurred at approximately 11:54, and 12:54 LT which is the least favorable time for EPBs to occur. However, the intensity of post-sunset plasma irregularities varies between these storms due to complex interaction of important factors such as storm-time electric fields, meridional winds, background ionospheric conditions, local time and seasons. The largest excursion of the ring current in the November storm occurred before dusk, indicating that post-sunset plasma irregularities were unlikely during the main phase of this storm.
During the main phase of 23–25 March 2023 storm, strong post-sunset plasma irregularities were observed near magnetic equator (BOGT and RIOP) in the American sector. However, plasma irregularities reduced over the stations CORD and SANT in the EIA crests region of South America. The unusual EIA structure consisting of high electron density in the crests and moderate in the trough results in a non-uniform vertical distribution. A steep vertical density gradient at the bottomside F layer, when combined with equatorward trans-equatorial neutral winds and vertical plasma drifts, can provide favorable conditions for the development of strong plasma irregularities over BOGT and RIOP. During the main phase of 23 April 2023 storm, ionospheric plasma conditions supported post-sunset plasma irregularities to develop near the magnetic equator while inhibiting plasma irregularities over crest regions (CORD and SANT) highlighting the localized impact of weaker crests. The 4–6 November 2023 storm showed highly suppressed post-sunset EPBs across all sectors due to lower ionospheric conductivity and weak electric fields, which reduced vertical plasma drifts and prevented irregularities from growing. The severe 10–13 May 2024 storm had a significant impact on the ionosphere, causing intense post-sunset plasma irregularities, particularly over southern low latitude stations (CORD and SANT) in the American sector. The supper-fountain effect due to large uplift resulted in intensified EIA crests with steeper plasma density gradients, supporting the formation of strong post-sunset EPBs in the crest region. Overall, post-sunset EPBs occur primarily over the American sector during the main phases of storms in March, April, and May. While, no signs of EPBs were observed during the main phase of the November storm. Throughout the recovery phase of these storms, EPBs remained highly suppressed at these locations. The seasonal behavior of EPBs depends on magnetic declination (alignment of the Earth's magnetic field with the solar terminator) and trans-equatorial meridional winds (Seba and Nigussie, 2016; Tsunoda, 1985). Lloyd's season classification includes winter (January, February, November, December), summer (May to August), and equinox (March, April, September, and October) (Liu et al., 2010). During equinotical months, the Sun's greater elevation and minimal trans-equatorial thermospheric winds can result in significant ionization and steeper plasma gradients, which can sustain EPBs (Rastogi, 1980; Maruyama, 1988). Intense EPBs can significantly disturb GNSS-based navigation and communication systems by causing amplitude and phase scintillations. These scintillations cause fast fluctuations in signal power and carrier phase, which reduces positioning precision and reliability. During seasons conducive to the formation of EPBs, notably at the equinoxes, GNSS receivers may encounter large range errors, cycle slipping, or even loss of lock, particularly for single-frequency users. As a result, understanding the seasonal and regional variability of EPBs is crucial in forecasting scintillation impacts and creating mitigation solutions, including the use of multi-frequency receivers, real-time monitoring, and augmentation systems (Aarons, 1997; Basu et al., 1999).
During geomagnetic storms, equatorial ionospheric plasma density distribution is influenced by electric fields, including DDEF from storm-time neutral winds and PPEF of magnetospheric origin (Astafyeva et al., 2018). According to Abdu (1997), Abdu et al. (2009), the presence of eastward/westward PPEF after sunset during the main phase of a storm can affect the vertical drift of plasma over the equatorial region either strengthening or disturbing the favorable conditions for EPBs. During a storm's recovery phase, the westward DDEF in the sunset terminator may cause the plasma to move downward, and the normal PRE is reversed, reducing EPBs (Abdu, 1997). Figure 11a–d depict the temporal fluctuations of the PPEF during geomagnetic storms on 22–25 March 2023, 22–25 April 2023, 4–7 November 2023, and 10–12 May 2024. Several northward and southern turnings of the IMF Bz occurred during the main phase of these storms. As the IMF Bz turns southward (northward), the convection electric field and polar cap potentials grow or decrease. The overshielding (under-shielding) electric field caused by the IMF Bz northward (southward) turning can suppress/trigger EPBs by reversing/enhancing the PRE in the local evening regions. The difference in the pattern of the ionospheric EPBs over the three sectors depends on the local timing of IMF Bz southward, the disturbed electric field and longitudinal variability of vertical drift (Amaechi et al., 2018; Fejer, 1997; Fejer et al., 1999). At 18:00 UT during the main phase of the 23 March storm, a westward PPEF of magnitude approximately −0.55 mV m−1 was seen in the Asian sector. At the same time, an eastward PPEF of approximately 0.5 mV m−1 can be observed in the American and African sectors before dusk.
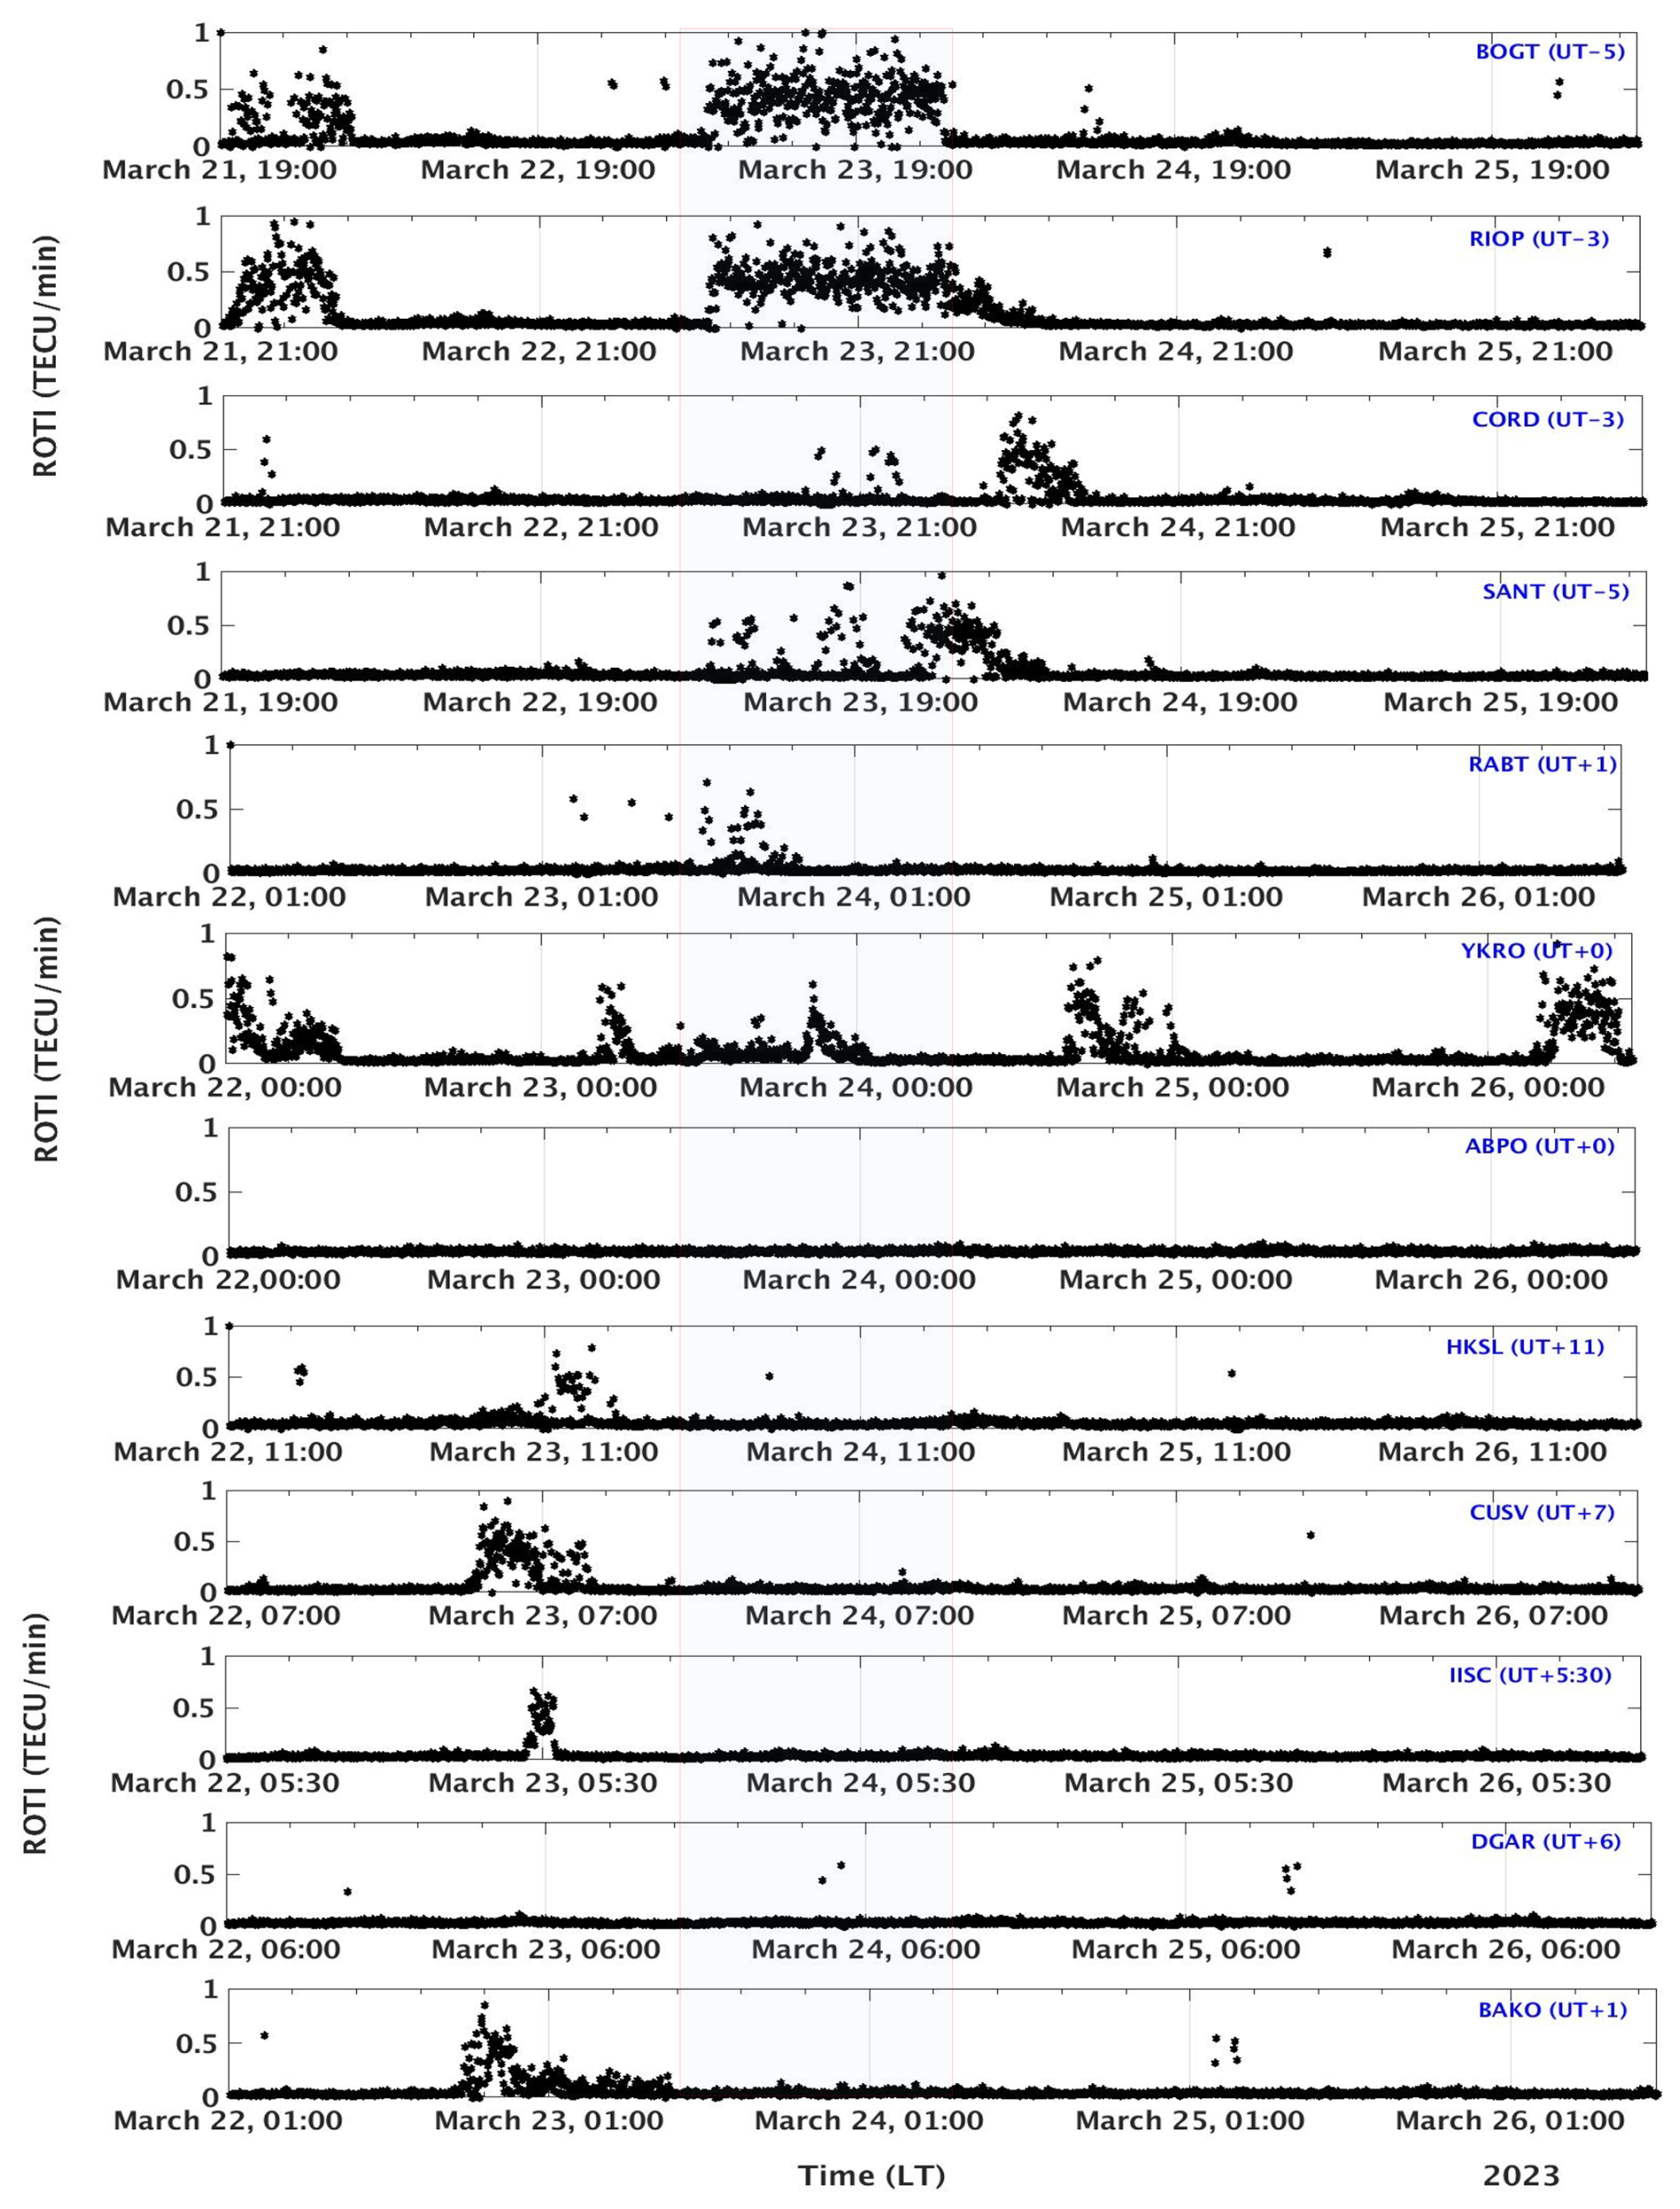
Figure 7Local time variation of ionospheric ROTI during 22–25 March 2023 storm. The red rectangle highlight the main phase of the storm.
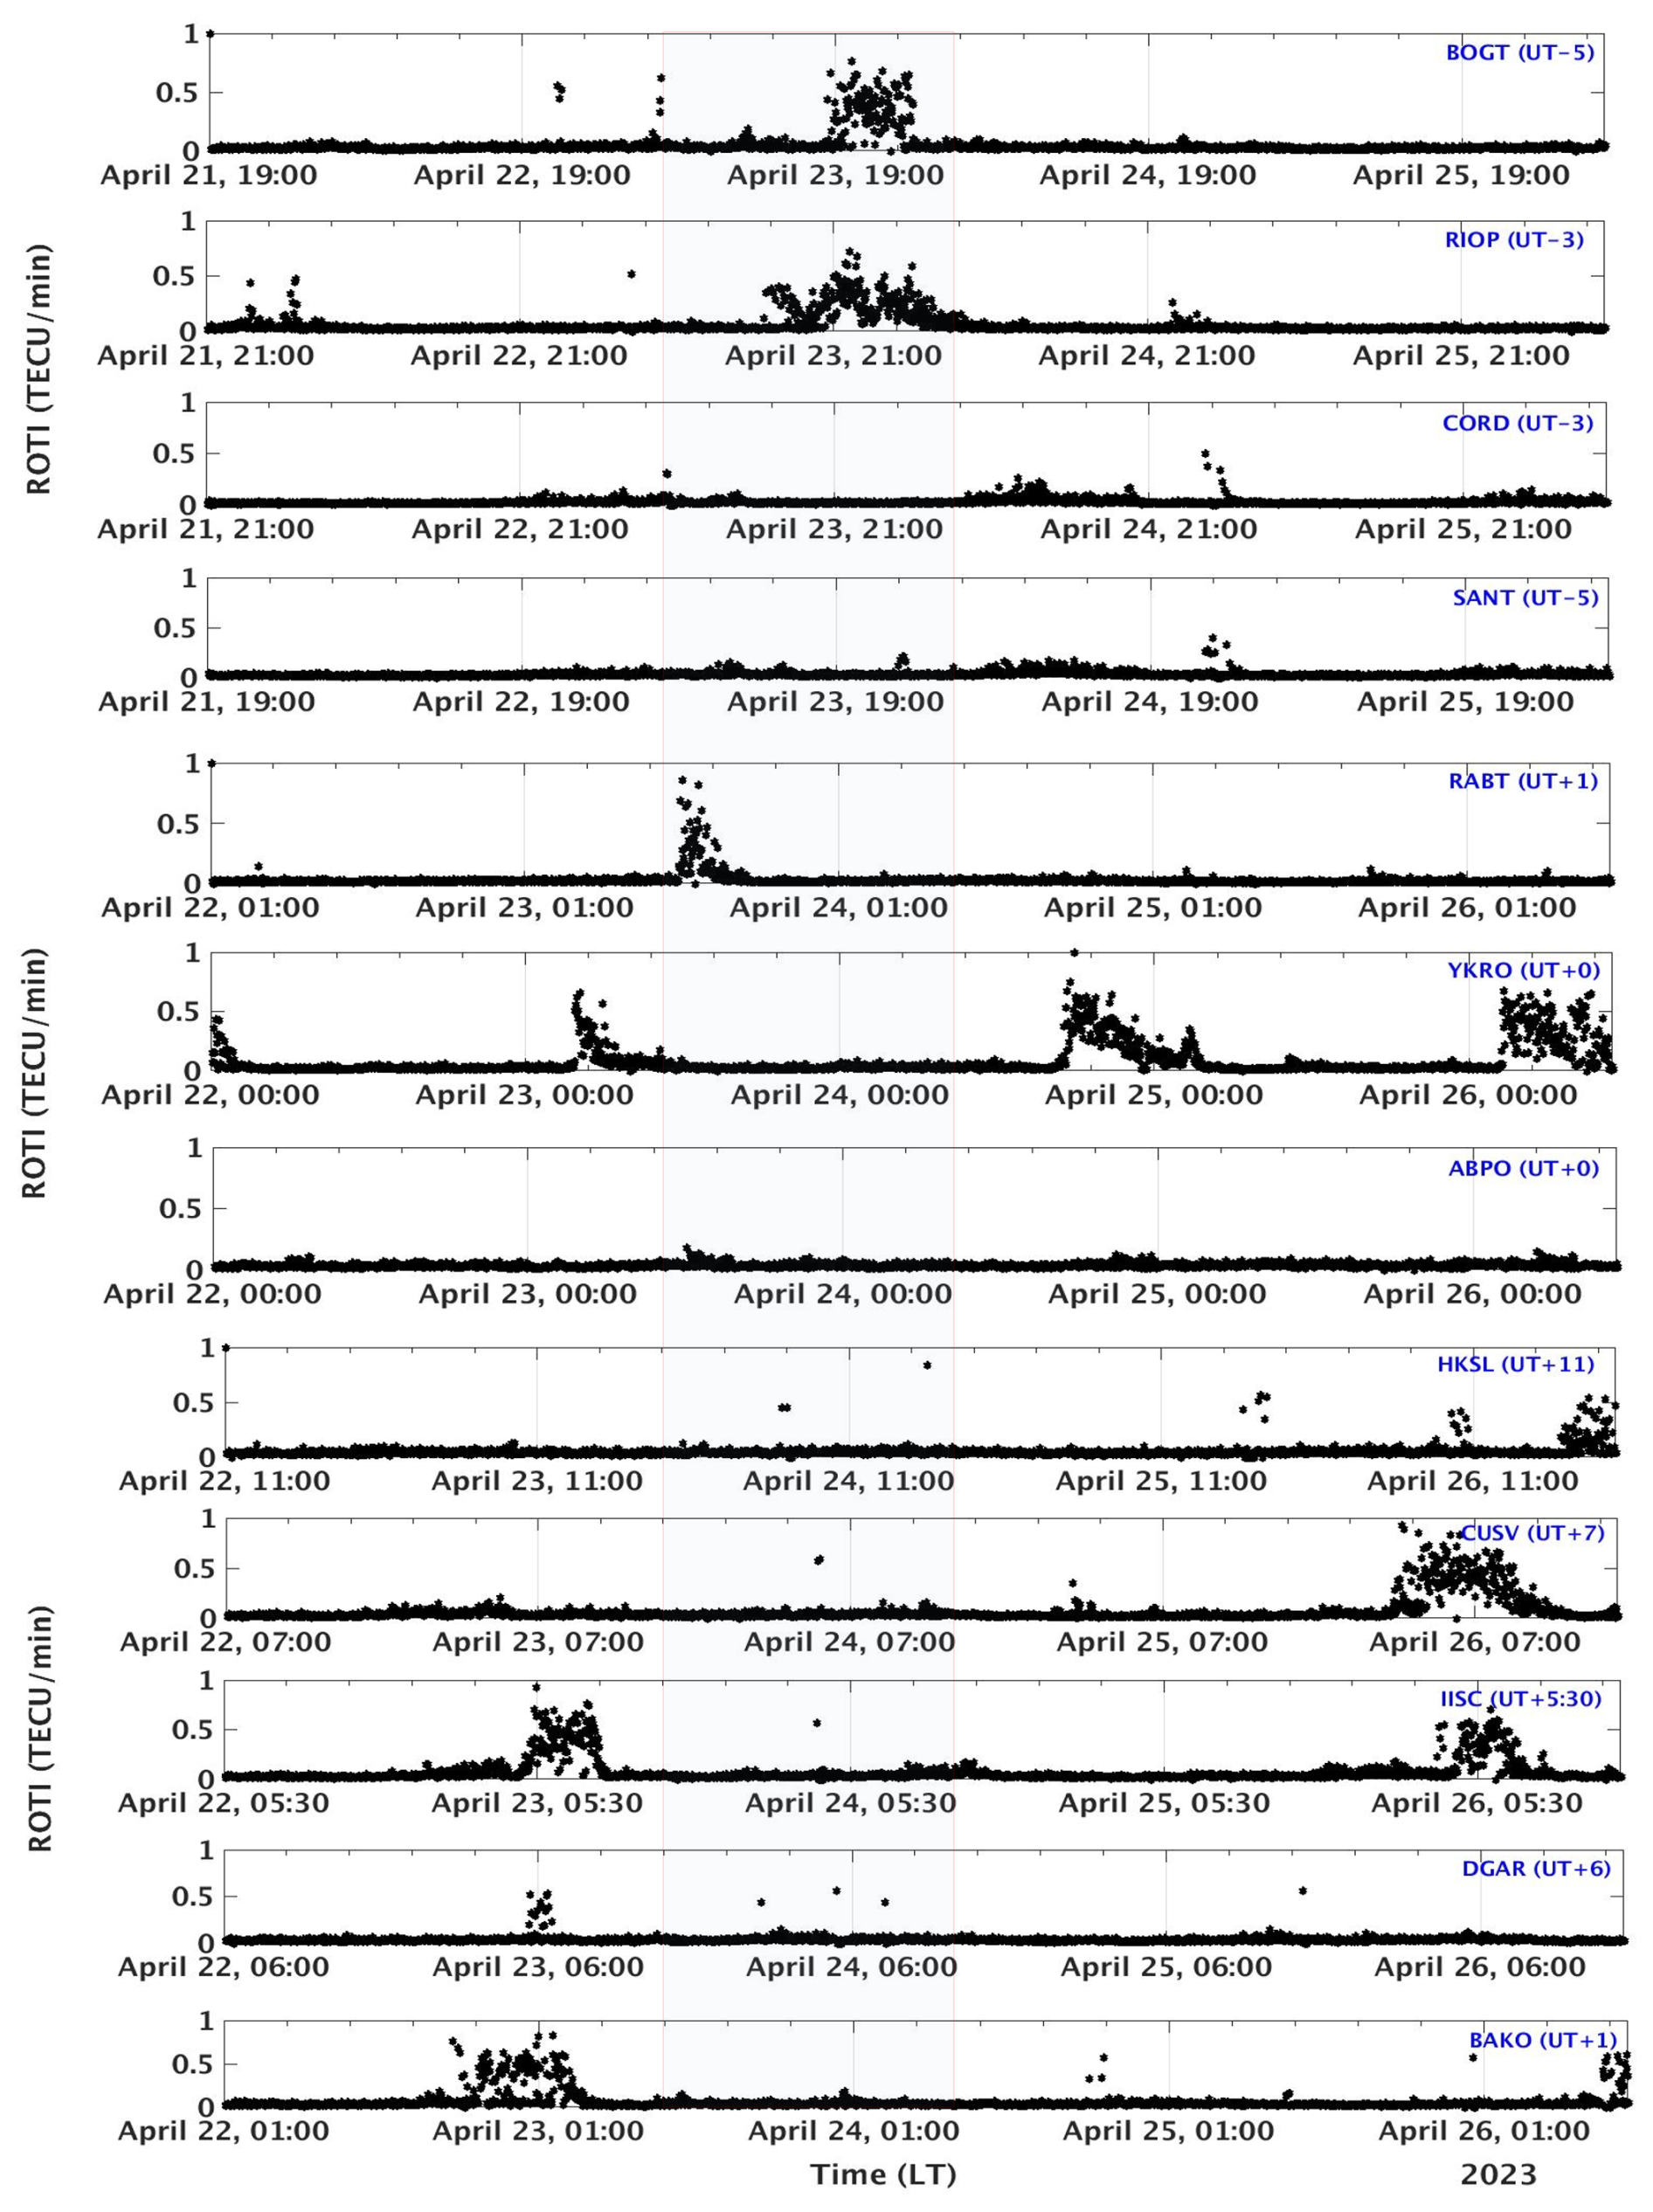
Figure 8Local time variation of ionospheric ROTI during 22–25 April 2023 storm. The red rectangle highlight the main phase of the storm.
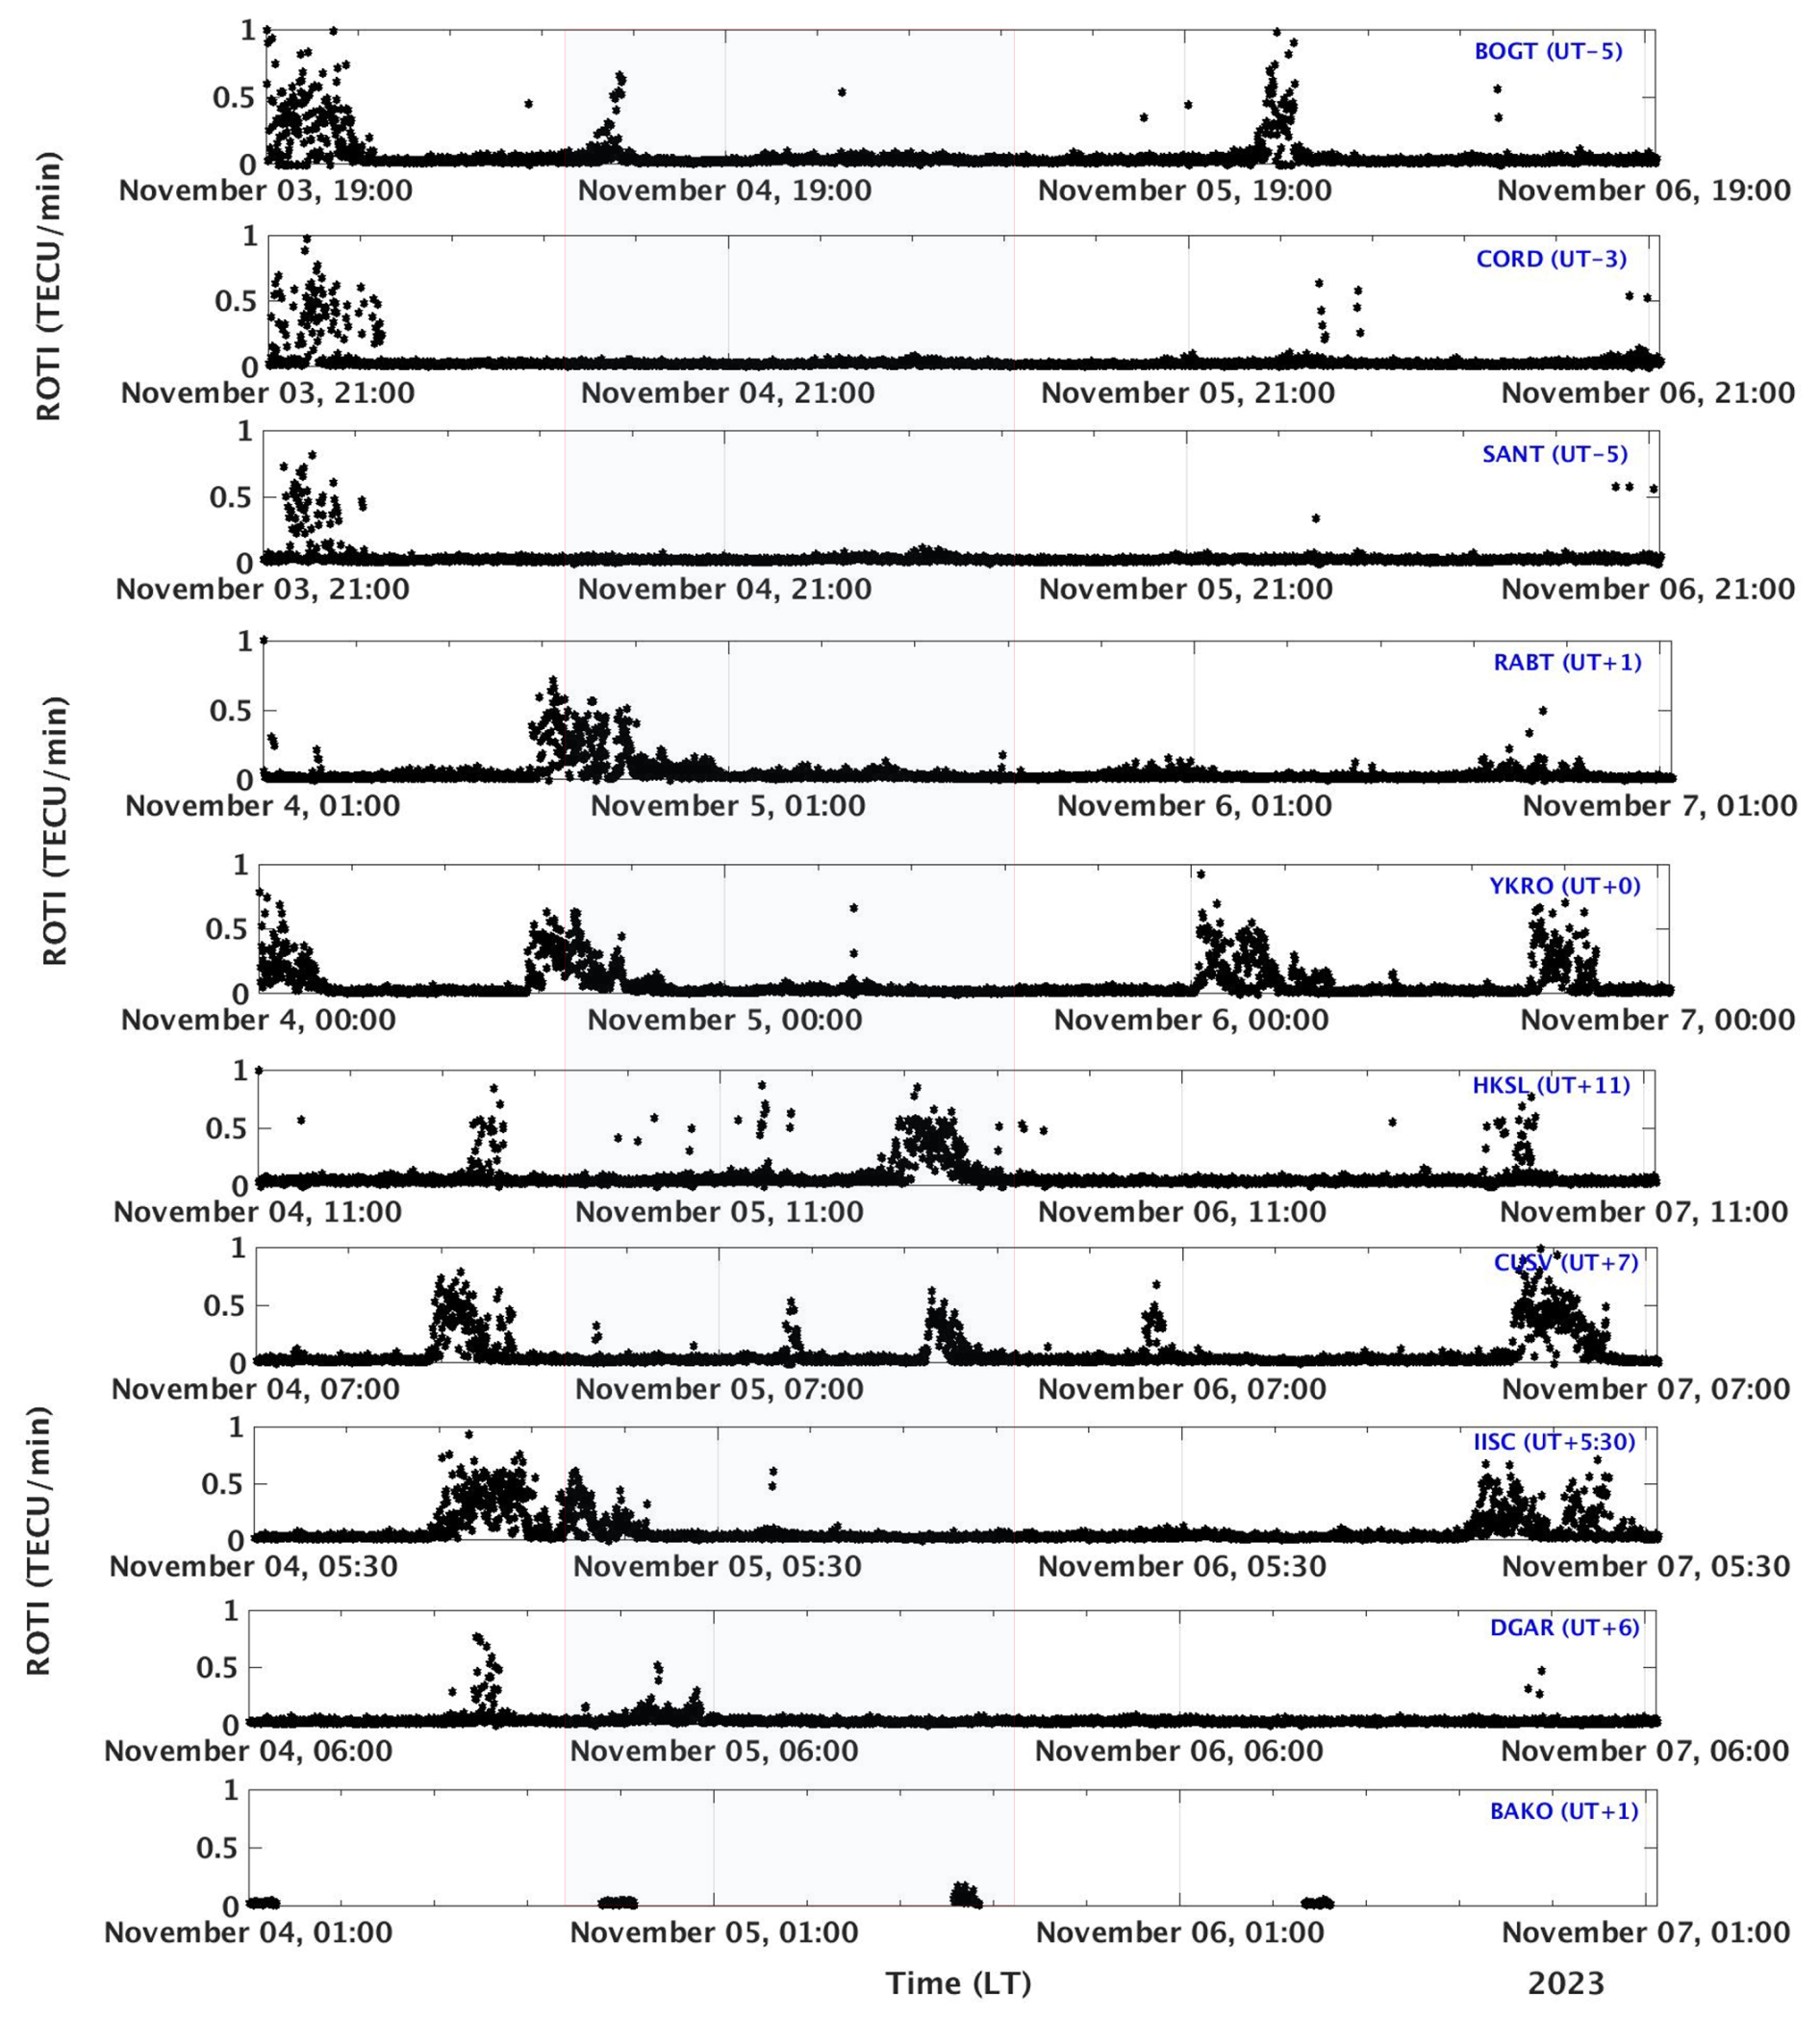
Figure 9Local time variation of ionospheric ROTI during 4–7 November 2023 storm. The red rectangle highlight the main phase of the storm.
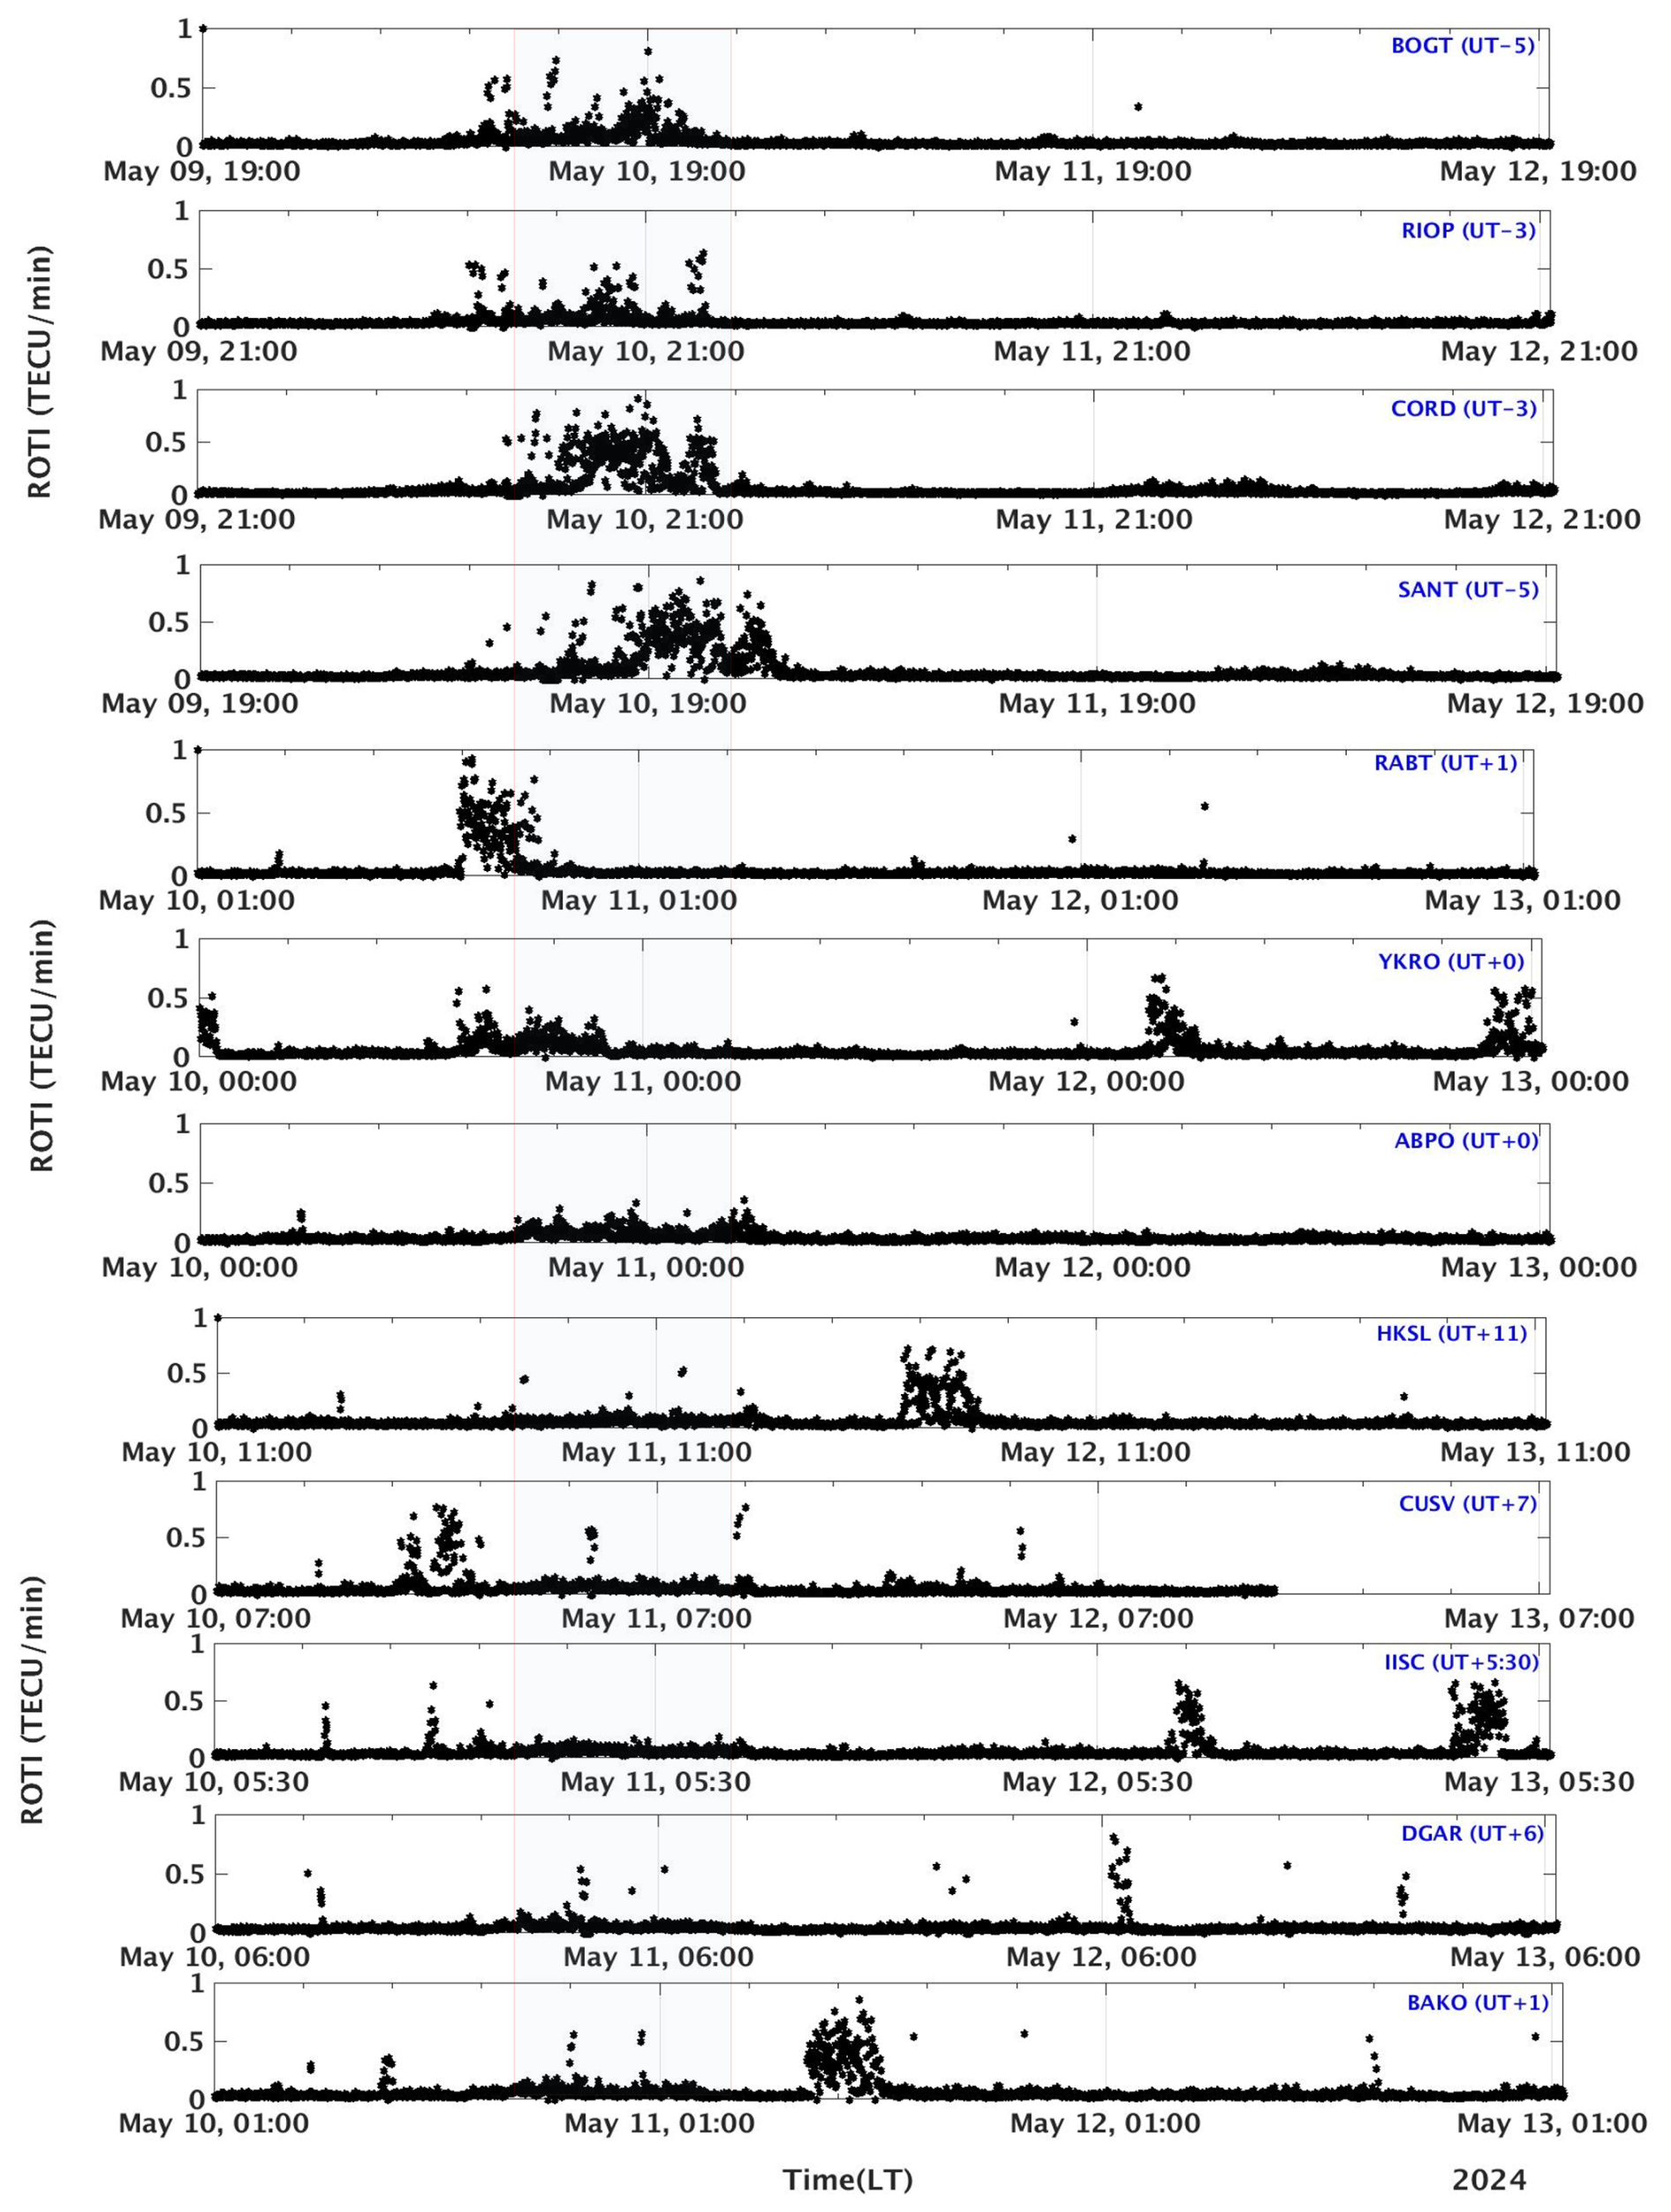
Figure 10Local time variation of ionospheric ROTI during 10–13 May 2024 storm. The red rectangle highlight the main phase of the storm.
Following sunset on 23 April, multiple variable duration PPEFs are visible in the three sectors. In America, the four PPEFs are noticeable. The first peak value is 0.33 mV m−1 from 18:05 to 20:05 UT, the second is −0.78 mV m−1 from 18:05 to 20:05 UT, the third is 0.61 mV m−1 from 23:05 to 23:55 UT, and the fourth is 0.45 mV m−1 from 00:40 to 03:15 UT. In the African sector, two PPEFs of varied duration with maximum values of roughly 0.60 mV m−1 and −0.65 mV m−1 are observed before midnight from 21:00 to 23:00 UT and 23:05 to 23:55 UT. A strong long-duration westward PPEF with a peak value of approximately −1.36 mV m−1 is also detected after midnight, between 01:45 and 04:35 UT. In Asia, the first westward PPEF with a peak value of −0.54 mV m−1 occurs from 18:05 to 20:05 UT, the second eastward is 0.94 mV m−1 from 21:10 to 23:00 UT, and the third long duration eastward PPEF with a peak value of 0.66 mV m−1 occurs from 01:45 to 04:35 UT on 24 April. During the main phase of 4–7 November 2023 storm, the PPEFs of different polarities and duration reach the equatorial ionosphere during the day. In America, the first westward PPEF with maximum value of approximately −0.32 mV m−1 occurred in the morning hours from 08:30 to 10:25 UT, and the second eastward penetrating field of magnitude approximately 0.44 mV m−1 is observed at local noon from 12:05 to 13:25 UT. In Africa, two notable PPEFs with peak values of −0.53 and 0.34 mV m−1 are observed at local noon. In Asia, there is one noticeable westward penetrating field with a peak value of approximately −0.42 mV m−1 from 12:05 to 13:35 UT. During the mother's day geomagnetic storm on 10–12 May 2024, we observed significant storm-time PPEFs after sunset. For instance, intense eastward-directed PPEFs of different durations between 18:00 and 22:00 UT cause super-fountain effect in the American sector. This results in a noticeable ionospheric electron density variation and the positioning of EIA crests as shown in madrigal TEC maps. We can also see eastward penetrating electric fields with maximum values of 2.59 and 1.80 mV m−1 in Africa and Asia, respectively, and westward PPEF with a peak value of roughly −2.73 mV m−1 in America between 22:50 and 23:25 UT. America and Africa experience an eastward PPEF with a peak value of 1.39 mV m−1 and a westward PPEF with a peak value of −1.95 mV m−1, respectively, between 23:30 and 02:00 UT. During the 23–25 March 2023 storm, a westward PPEF of approximately −0.55 mV m−1 was observed in the Asian sector at 18:00 UT, while an eastward PPEF of approximately 0.5 mV m−1 was observed in the American and African sectors before dusk. These PPEFs contributed to the merging of EIA crests and increased TEC in the equatorial zone, leading to strong post-sunset EPBs in the American sector. The 23–25 April 2023 storm exhibited multiple PPEFs of varying magnitudes and durations across different sectors, with significant eastward and westward PPEFs in America, Africa, and Asia. These PPEFs influenced the expansion of EIA crests and increased TEC, particularly in the Northern Hemisphere, and caused noticeable post-sunset EPBs in the American sector. The 4–6 November 2023 storm had PPEFs of different polarities and durations, with westward and eastward PPEFs observed in America, Africa, and Asia. However, lower ionospheric conductivity and weak electric fields suppressed post-sunset EPBs across all sectors. The 10–13 May 2024 storm featured intense eastward-directed PPEFs between 18:00 and 22:00 UT, causing the super fountain effect in the American sector, leading to significant TEC variations and poleward shifting of EIA crests. Strong eastward and westward PPEFs were also observed in Africa and Asia, contributing to enhanced post-sunset EPBs, particularly in the southern low latitude stations.
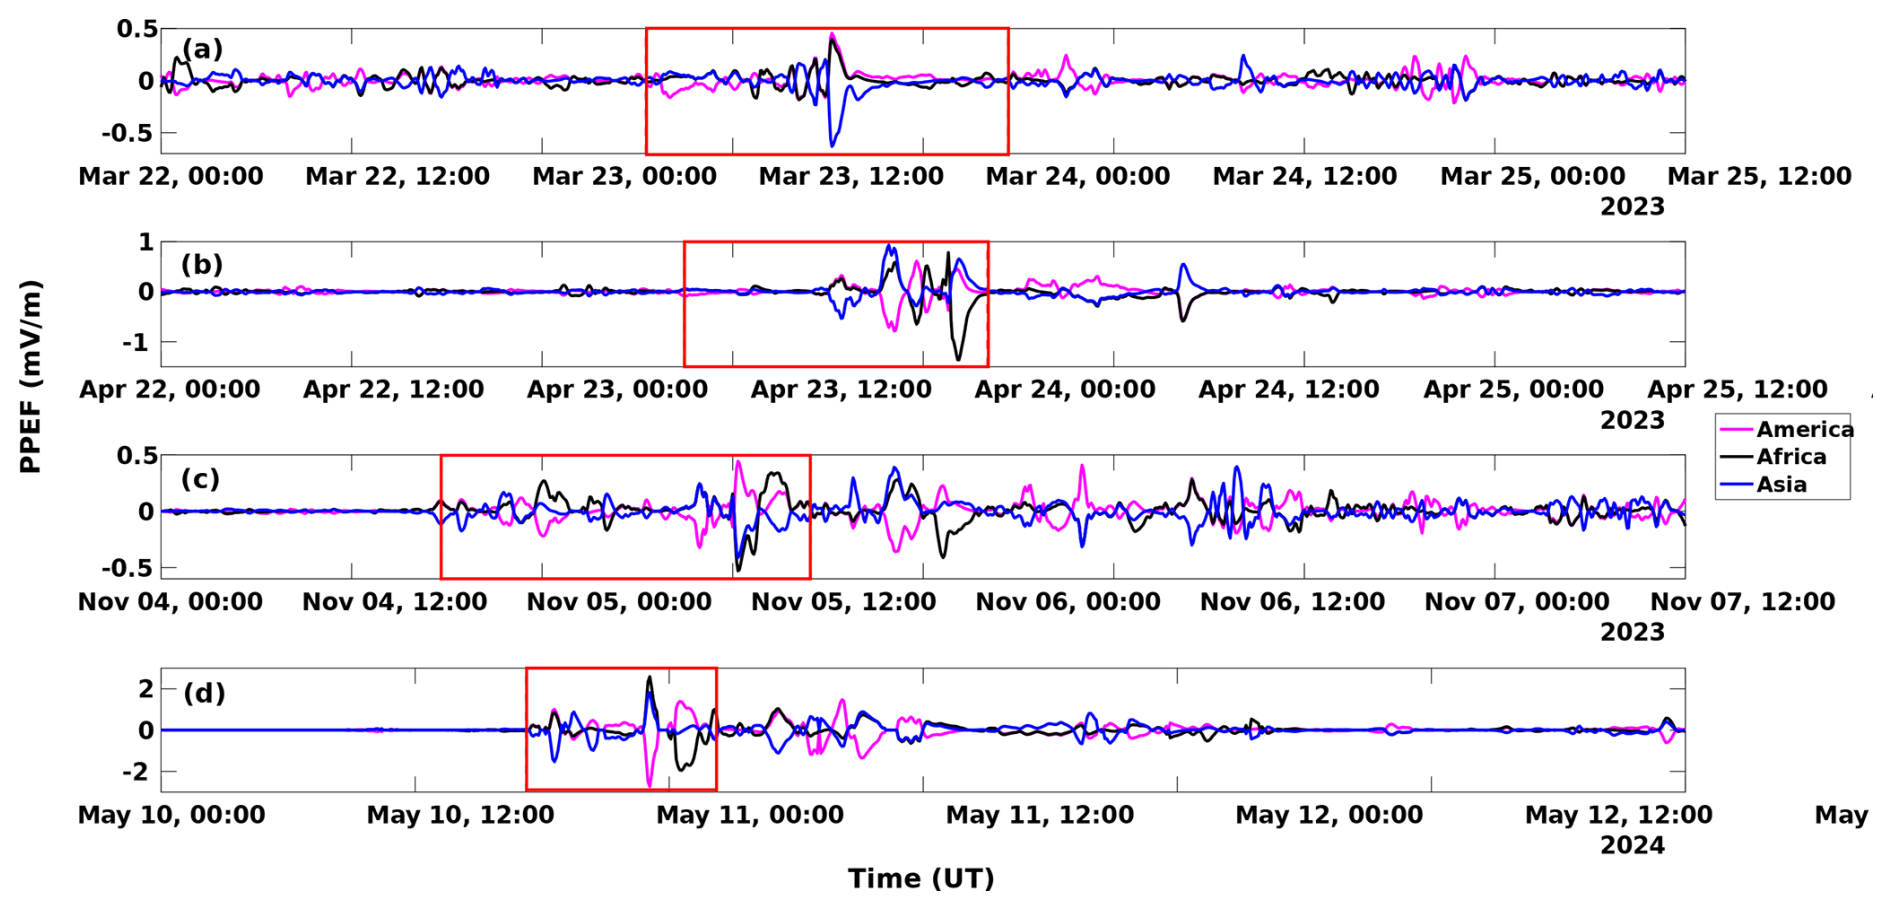
Figure 11Variations in the ionospheric prompt penetration electric fields (PPEFs) over the three longitudes during the three intense geomagnetic storms of SC 25.
We presented a comprehensive analysis of four geomagnetic storms (23–25 March, 23–25 April, and 4–6 November 2023, and 10–13 May 2024) to understand storm-time coupling between solar wind forcing, Joule heating, thermospheric dynamics, and low-latitude ionospheric responses. This multi-event, multi-season comparison provides one of the first systematic characterizations of how high-latitude energy input through Joule heating modulates equatorial ionospheric structures and post-sunset plasma irregularities.
-
The magnitude and spatial distribution of Joule heating varied significantly with storm intensity, local time, duration, and season. A clear solstice–equinox contrast was observed, with the May 2024 storm exhibiting the most intense post-sunset Joule Heating and the November 2023 storm showing the weakest. Nearly symmetric Joule heating patterns were observed during equinoctial storms, whereas solstice events exhibited pronounced hemispheric asymmetries.
-
Distinct electrodynamic pathways were identified linking Joule heating-driven equatorward winds to the evolution of the EIA. The combined influence of storm-time electric fields and thermospheric winds determined whether single- or double-crest EIAs developed, with asymmetric winds amplifying or suppressing the anomaly in opposite hemispheres.
-
The seasonal variation of post sunset EPBs was consistent with previous findings, being primarily controlled by the angle between the magnetic meridian and the solar terminator. Their occurrence probability was highest during equinoctial storms (March and April) and minimal during the summer solstice (May storm). In our analysis, the EPBs observed during equinox storms reflect seasonal effects, while their suppression during the November 2023 storm is attributed to a delayed PPEF arriving after midnight, when post-sunset conditions were no longer favorable for instability growth. Conversely, the unseasonal generation of post-sunset EPBs during the Mother's Day storm resulted from the combined influence of elevated solar flux and a strong eastward PPEF near local sunset.
-
The results further highlight the dynamic interplay between overshielding and undershielding PPEFs and thermospheric winds in modulating the PRE that further affects the post-sunset plasma uplift and EPBs onset. Variations in EIA gradients and vertical plasma drifts control EPB intensity and occurrence, exhibiting clear seasonal and hemispheric dependencies.
Overall, these findings demonstrate a strong coupling between high-latitude Joule heating and low-latitude ionospheric variability, providing new observational evidence that storm-time thermospheric forcing plays a critical role in shaping the global electrodynamic response. The results strengthen the physical basis for forecasting the impact of space weather on GNSS and satellite communication systems. Future work will integrate multi-instrument observations and physics-based modeling to quantify the relative contributions of Joule Heating, PPEFs, and neutral dynamics to storm-time ionospheric variability.
Solar wind parameters and magnetic indices are obtained from the GSFC/SPDF OMNIWeb interface (https://omniweb.gsfc.nasa.gov/form/omni_min.html, last access: 6 October 2025). Geomagnetic coordinates are determined using model calculations provided by British Geological Survey-Geomagnetism at https://geomag.bgs.ac.uk/data_service/models_compass/coord_calc.html (last access: 12 May 2026). MIT-TEC maps are obtained from the MIT Haystack website (https://cedar.openmadrigal.org/single, last access: 26 March 2023). The GNSS TEC data to estimate ROTI is available at https://gage-data.earthscope.org/archive/gnss/rines/obs/2024/131/ (last access: 1 October 2024). Equatorial electric fields over a specific longitude are obtained from the real-time Prompt Penetration Equatorial Electric Field Model (PPEEFM) available at https://geomag.colorado.edu/online-calculators/real-time-model-ionospheric-electric-fields (last access: 20 March 2024). Weimer model simulations are provided by the Community Coordinated Modeling Center (CCMC) at NASA Goddard Space Flight Center through (https://ccmc.gsfc.nasa.gov/models/Weimer~2005/, last access: 15 May 2024).
The supplement related to this article is available online at https://doi.org/10.5194/angeo-44-489-2026-supplement.
Conceptualization: NI and AC; methodology: NI and CA; software and validation: NI, CA, and AZ; data curation: NI, CA and AZ; formal analysis and investigation: NI and AC; writing – original draft preparation: NI; writing – review and editing: NI, AC, CA and CAM; visualization: all authors. All authors have read and agreed to the published version of the manuscript.
The contact author has declared that none of the authors has any competing interests.
Publisher's note: Copernicus Publications remains neutral with regard to jurisdictional claims made in the text, published maps, institutional affiliations, or any other geographical representation in this paper. The authors bear the ultimate responsibility for providing appropriate place names. Views expressed in the text are those of the authors and do not necessarily reflect the views of the publisher.
The authors acknowledge the use of free online tools like Grammarly and ChatGPT for grammar check and language editing to improve the readability of the manuscript. We also acknowledge Editor and Referees for their time and valuable suggestions in improving the content of this manuscript.
This paper was edited by Dalia Buresova and reviewed by Ephrem Seba, Samireddipalle Sripathi, Teshome Dugassa, and one anonymous referee.
Aa, E., Zhu, S., and Liu, S.: Statistical Analysis of Equatorial Plasma Irregularities Retrieved From Swarm 2013–2019 Observations, J. Geophys. Res.-Space Phys., 125, https://doi.org/10.1029/2019JA027022, 2020. a
Aa, E., Chen, Y., and Luo, B.: Dynamic Expansion and Merging of the Equatorial Ionization Anomaly During the 10–11 May 2024 Super Geomagnetic Storm, Remote Sens., 16, https://doi.org/10.3390/rs16224290, 2024. a, b, c
Aarons, J.: The role of the ring current in the generation or inhibition of equatorial F layer irregularities during magnetic storms, Radio Sci., 26, 1131–1149, 1991. a, b
Aarons, J.: Global positioning system phase fluctuations at auroral latitudes, J. Geophys. Res.-Space Phys., 102, 17219–17231, 1997. a, b, c
Abdu, M. A.: Major phenomena of the equatorial ionosphere-thermosphere system under disturbed conditions, J. Atmos. Sol.-Terr. Phy., 59, 1505–1519, 1997. a, b, c
Abdu, M. A.: Equatorial F region, in: The Dynamical Ionosphere, edited by: Sojka, J. J. and Schunk, R. W., 257–278, American Geophysical Union, Washington, D.C., https://doi.org/10.1029/GM181, 2006. a
Abdu, M. A., Batista, I. S., Reinisch, B. W., Souza, J. R. D., Sobral, J. H. A., Pedersen, T. R., Medeiros, A. F., Schuch, N. J., Paula, E. R. D., and Groves, K. M.: Conjugate Point Equatorial Experiment (COPEX) campaign in Brazil: Electrodynamics highlights on spread F development conditions and day-to-day variability, J. Geophys. Res.-Space Phys., 114, https://doi.org/10.1029/2008JA013749, 2009. a, b
Amaechi, P. O., Oyeyemi, E. O., and Akala, A. O.: Geomagnetic storm effects on the occurrences of ionospheric irregularities over the African equatorial/low-latitude region, Adv. Space Res., 61, 2074–2090, https://doi.org/10.1016/j.asr.2018.01.035, 2018. a, b
Araujo-Pradere, E. A., Fuller-Rowell, T. J., Codrescu, M. V., and Bilitza, D.: Characteristics of the ionospheric variability as a function of season, latitude, local time, and geomagnetic activity, Radio Sci., 40, RS5009, https://doi.org/10.1029/2004RS003179, 2006. a, b
Astafyeva, E., Zakharenkova, I., Hozumi, K., Alken, P., Coïsson, P., Hairston, M. R., and Coley, W. R.: Study of the Equatorial and Low-Latitude Electrodynamic and Ionospheric Disturbances During the 22–23 June 2015 Geomagnetic Storm Using Ground-Based and Space-borne Techniques, J. Geophys. Res.-Space Phys., 123, 2424–2440, https://doi.org/10.1002/2017JA024981, 2018. a, b
Axford, W. I.: Viscous interaction between the solar wind and the earth’s magnetosphere, Planet. Space Sci., 12, 45–53, https://doi.org/10.1016/0032-0633(64)90067-4, 1964. a
Balan, N., Alleyne, H., Otsuka, Y., Lekshmi, D. V., Fejer, B. G., and McCrea, I.: Relative effects of electric field and neutral wind on positive ionospheric storms, Earth Planets Space, 61, 1209–1221, https://doi.org/10.1186/BF03352971, 2009. a
Balan, N., Otsuka, Y., Nishioka, M., Liu, J. Y., and Bailey, G. J.: Physical mechanisms of the ionospheric storms at equatorial and higher latitudes during the recovery phase of geomagnetic storms, J. Geophys. Res.-Space Phys., 118, https://doi.org/10.1002/jgra.50275, 2013. a
Balan, N., Liu, L., and Le, H. J.: A brief review of equatorial ionization anomaly and ionospheric irregularities, Earth Planet. Phys., 2, 257–275, https://doi.org/10.26464/epp2018025, 2018. a, b, c
Basu, S., Groves, K. M., Quinn, J. M., and Doherty, P.: A comparison of TEC fluctuations and scintillation at Ascension Island, J. Atmos. Solar-Terr. Phy., 61, 1219–1226, 1999. a, b
Blanc, M. and Richmond, A. D.: The ionospheric disturbance dynamo, J. Geophys. Res., 85, 1669–1686, https://doi.org/10.1029/JA085iA04p01669, 1980. a, b
Buonsanto, M. J.: Ionospheric storms: A review, Space Sci. Rev., 88, 563–601, 1999. a
Calabia, A., Imtiaz, N., Altadill, D., Yasyukevich, Y., Segarra, A., Prol, F. S., Adhikari, B., del Peral, L., Frias, M. D. R., and Molina, I.: Uncovering the Drivers of Responsive Ionospheric Dynamics to Severe Space Weather Conditions: A Coordinated Multi-Instrumental Approach, J. Geophys. Res.-Space Phys., 129, e2023JA031862, https://doi.org/10.1029/2023JA031862, 2024. a
Cueto, M., Magdaleno, S., Cezon, A., and Sardon, E.: Characterization of equatorial ionospheric features on the verge of the next solar cycle maximum, J. Geophys. Res., 110, 3055–3065, https://doi.org/10.1029/2004JA010884, 2012. a
Dugassa, T., Habarulema, J. B., and Nigussie, M.: Longitudinal variability of occurrence of ionospheric irregularities over the American, African and Indian regions during geomagnetic storms, Adv. Space Res., 63, 2609–2622, 2019. a
Dungey, J. W.: Interplanetary Magnetic Field and the Auroral Zones, Phys. Rev. Lett., 6, 47–48, https://doi.org/10.1103/PhysRevLett.6.47, 1961. a
Fejer, B. G., Scherliess, L., and de Paula, E. R.: Effects of the vertical plasma drift velocity on the generation and evolution of equatorial spread F, J. Geophys. Res., 104, 19854–19869, 1999. a, b
Fejer, D. J.: The electrodynamics of the low-latitude ionosphere: Recent results and future challenges, J. Atmos. Solar-Terr. Phy., 59, 1465–1482, https://doi.org/10.1016/S1364-6826(96)00149-6, 1997. a
Fuller-Rowell, T. J., Codrescu, M. V., Moffett, R. J., and Quegan, S.: Response of the Thermosphere and Ionosphere to Geomagnetic Storms, J. Geophys. Res., 99, 3893–3914, 1994. a
Fuller-Rowell, T. J., Codrescu, M. V., Roble, R. G., and Richmond, A. D.: How does the thermosphere and ionosphere react to a geomagnetic storm?, in: Geophysical Monograph Series, 98, 203–225, American Geophysical Union, 1997. a, b
González, G.: Storm-time variability of ionospheric irregularities over South America, J. Atmos. Solar-Terr. Phy., 241, 105980, https://doi.org/10.1016/j.jastp.2022.105980, 2022. a
Huang, C. S.: Long-Lasting Penetration Electric Fields during Geomagnetic Storms: Observations and Mechanisms, J. Geophys. Res.-Space Phys., 124, 9640–9664, https://doi.org/10.1029/2019JA026793, 2019. a, b
Huang, C. S., Foster, J., and Kelley, M.: Long-duration penetration of the interplanetary electric field to the low-latitude ionosphere during the main phase of magnetic storms, J. Geophys. Res., 110, A09308, https://doi.org/10.1029/2005JA011202, 2005. a, b
Huang, L., Huang, J., Wang, J., Jiang, Y., Deng, B., Zhao, K., and Lin, G.: Analysis of the north–south asymmetry of the equatorial ionization anomaly around 110°E longitude, J. Atmos. Solar-Terr. Phy., 102, 354–361, https://doi.org/10.1016/j.jastp.2013.06.010, 2013. a
Imtiaz, N., Dugassa, T., Calabia, A., Anoruo, C., and Kashcheyev, A.: Westward PPEF plays important role in the suppression of post-midnight plasma irregularities: A case study of the November 2021 geomagnetic storm, J. Geophys. Res.-Space Phys., 129, e2023JA032367, https://doi.org/10.1029/2023JA032367, 2024. a, b, c
Jin, H., Yan, C., Fang, G. Y., He, H., Xu, X., Zhang, W., Sun, Y., Li, K., Hu, J., and Jiang, J.: Interaction Between Equatorial to Low-Latitude Postmidnight F-Region Irregularities and LSTIDs in China During Geomagnetic Disturbances Based on Ground-Based Instruments, J. Geophys. Res.-Space Phys., 127, e2022JA030XXX, https://doi.org/10.1029/2022JA030XXX, 2022. a
Kassa, T., Damtie, B., Bires, A., Yizengaw, E., and Cilliers, P.: Storm-time characteristics of the equatorial ionization anomaly in the East African sector, Adv. Space Res., 56, 57–70, https://doi.org/10.1016/j.asr.2015.04.002, 2015. a, b
Kassa, Y., Damtie, B., and Tebabal, A.: Ionospheric and magnetic signatures of extreme space weather events of 17 March and 23 June 2015 over the African sector, J. Atmos. Solar-Terr. Phy., 243, 106003, https://doi.org/10.1016/j.jastp.2023.106003, 2023. a
Kassa, Y., Tebabal, A., and Damtie, B.: Nighttime ionospheric irregularity during intense geomagnetic storm events over the Europe-African longitudinal sector, Heliyon, 10, e38138, https://doi.org/10.1016/j.heliyon.2024.e38138, 2024. a, b
Kelley, M. C.: The Earth's Ionosphere: Plasma Physics and Electrodynamics, 2nd edn., Academic Press, Burlington, MA, USA, 2009. a
Kikuchi, T., Hashimoto, K. K., and Nozaki, K.: Penetration of magnetospheric electric fields to the equator during a geomagnetic storm, J. Geophys. Res., 113, A05214, https://doi.org/10.1029/2007JA012628, 2008. a
Li, K. F., Lin, L. C., Bui, X. H., and Liang, M. C.: The 11 year solar cycle response of the equatorial ionization anomaly observed by GPS radio occultation, J. Geophys. Res.-Space Phys., 123, https://doi.org/10.1002/2017JA024634, 2018. a
Lin, C. H., Richmond, A. D., Heelis, R. A., Bailey, G. J., Lu, G., Liu, J. Y., and Su, S. Y.: Theoretical study of the low- and midlatitude ionospheric electron density enhancement during the October 2003 superstorm: Relative importance of the neutral wind and the electric field, J. Geophys. Res., 110, https://doi.org/10.1029/2005JA011304, 2005. a
Liu, J., Zhao, B., and Liu, L.: Time delay and duration of ionospheric total electron content responses to geomagnetic disturbances, Ann. Geophys., 28, 795–805, https://doi.org/10.5194/angeo-28-795-2010, 2010. a, b
Luan, X.: Equatorial Ionization Anomaly Variations During Geomagnetic Storms, Chap. 13, pp. 301–312, American Geophysical Union (AGU), https://doi.org/10.1002/9781119815617.ch13, 2021. a, b
Lukianova, R.: Swarm field-aligned currents during a severe magnetic storm of September 2017, Ann. Geophys., 38, 191–206, https://doi.org/10.5194/angeo-38-191-2020, 2020. a
Maruyama, T.: A diagnostic model for equatorial spread F, 1, Model description and application to electric field and neutral wind effects, J. Geophys. Res., 93, 14611–14622, https://doi.org/10.1029/JA093iA12p14611, 1988. a
Pi, X., Mannucci, A., Lindqwister, U. J., and Ho, C. M.: Monitoring of global ionospheric irregularities using the worldwide GPS network, Geophys. Res. Lett., 24, 2283–2286, 1997. a
Rastogi, R. G.: Seasonal variation of equatorial spread F in the American and Indian zones, J. Geophys. Res., 85, 722–726, https://doi.org/10.1029/JA085iA02p00722, 1980. a
Richmond, A. D. and Matsushita, S.: Thermospheric Response to a Magnetic Substorm, J. Geophys. Res., 80, 2839–2850, 1975. a
Rideout, W. and Coster, A.: Automated GPS processing for global total electron content data, GPS Solutions, 10, 219–228, 2006. a
Rishbeth, H.: The equatorial F-layer: progress and puzzles, Ann. Geophys., 18, 730–739, https://doi.org/10.1007/s00585-000-0730-6, 2000. a
Seba, E. B. and Nigussie, M.: Investigating the effect of geomagnetic storm and equatorial electrojet on equatorial ionospheric irregularity over East African sector, Adv. Space Res., 58, 1708–1719, https://doi.org/10.1016/j.asr.2016.06.037, 2016. a, b
Seemala, G.: GPS-TEC analysis application, Technical report, Institute for Scientific Research, 2011. a
Singh, R. and Sripathi, S.: A statistical study on the local time dependence of equatorial spread F (ESF) irregularities and their relation to low‐latitude Es layers under geomagnetic storms, J. Geophys. Res.-Space Phys., 125, e2019JA027212, https://doi.org/10.1029/2019JA027212, 2020. a, b, c
Smith, A. R., Ozturk, D. S., Delamere, P., Lu, G., and Kim, H.: Investigating the interhemispheric asymmetry in Joule heating during the 2022 geomagnetic storm, J. Geophys. Res.-Space Phys., 128, e2023JA031872, https://doi.org/10.1029/2023JA031872, 2023. a
Sripathi, S. and Singh, R.: A study on the response of the ionosphere to the three major space weather events of 2015 using meridional chain of ionosondes and GPS receivers over India, Journal of Sun and Geosphere, 13/2, 169–172, https://doi.org/10.31401/SunGeo.2018.02.08, 2020. a, b
Tahir, A., Wu, F., Shah, M., Amory-Mazaudier, C., Jamjareegulgarn, P., Verhulst, T. G. W., and Ameen, M. A.: Multi-instrument observation of the ionospheric irregularities and disturbances during the 23–24 March 2023 geomagnetic storm, Remote Sens., 16, 1594, https://doi.org/10.3390/rs16091594, 2024. a
Tsunoda, R. T.: High-latitude F-region irregularities: A review and synthesis, Rev. Geophys., 23, 577–582, https://doi.org/10.1029/RG023i005p00577, 1985. a
Tsurutani, B., Mannucci, A., Iijima, B., Abdu, M. A., Sobral, J. H. A., Gonzalez, W., Guarnieri, F., Tsuda, T., Saito, A., Yumoto, K., Fejer, B., Fuller-Rowell, T. J., Kozyra, J., Foster, J. C., Coster, A., and Vasyliunas, V. M.: Global dayside ionospheric uplift and enhancement associated with interplanetary electric fields, Geophys. Res., 109, 08302, https://doi.org/10.1029/2003JA010342, 2004. a
Tulasi Ram, S., Su, S. Y., and Liu, C. H.: FORMOSAT-3/COSMIC observations of seasonal and longitudinal variations of equatorial ionization anomaly and its interhemispheric asymmetry during the solar minimum period, J. Geophys. Res.-Space Phys., 114, https://doi.org/10.1029/2008JA013880, 2009. a, b
Vaggu, P. R., Deshpande, K. B., Datta-Barua, S., Bust, G. S., Hampton, D. L., López Rubio, A., and Conroy, J. P.: Morphological and spectral features of ionospheric structures at E- and F-region altitudes over Poker Flat analyzed using modeling and observations, Sensors, 23, https://doi.org/10.3390/sym15101940, 2023. a
Vankadara, R. K., Panda, S. K., Amory-Mazaudier, C., Fleury, R., Devanaboyina, V. R., Pant, T. K., Jamjareegulgarn, P., Haq, M. A., Okoh, D., and Seemala, G. K.: Signatures of Equatorial Plasma Bubbles and Ionospheric Scintillations from Magnetometer and GNSS Observations in the Indian Longitudes during the Space Weather Events of Early September 2017, Remote Sens., 14, 652, https://doi.org/10.3390/rs14030652, 2022. a
Weimer, D. R.: Improved ionospheric electrodynamic models and application to calculating Joule heating rates, J. Geophys. Res., 110, A05306, https://doi.org/10.1029/2004JA010884, 2005. a, b, c, d, e
Wu, Q., Wang, W., Lin, D., Huang, C., and Zhang, Y.: Penetrating electric field during the Nov 3–4, 2021 geomagnetic storm, J. Atmos. Solar-Terr. Phy., 257, 106219, https://doi.org/10.1016/j.jastp.2024.106219, 2024. a
Zhang, X., Wan, W., and Yue, X.: Storm-time development of the equatorial ionization anomaly in the East Asian sector, J. Geophys. Res.-Space Phys., 125, e2020JA027973, https://doi.org/10.3390/s20071805, 2020. a