the Creative Commons Attribution 4.0 License.
the Creative Commons Attribution 4.0 License.
 | 04 Jun 2026
Spectroscopic detection of terrestrial lightning from space by JUICE-MAJIS during Earth Gravity Assist
Emiliano D'Aversa
Fabrizio Oliva
Giuseppe Piccioni
François Poulet
Ivana Kolmašová
Benoît Seignovert
Alessandra Migliorini
Gianrico Filacchione
Leigh Fletcher
Alessandro Mura
Yves Langevin
Davide Grassi
Sébastien Rodriguez
Federico Tosi
Nicolas Ligier
Giuseppe Sindoni
Marco Giardino
Christina Plainaki
A lightning event was detected by the MAJIS imaging spectrometer onboard the Jupiter Icy Moons Explorer (JUICE) spacecraft during its first Earth gravity assist maneuver. This serendipitous observation represents the first space-based spectroscopic measurement of lightning for any planetary atmosphere. The event, composed of four flashes, was registered on 2024, August, 20th in an area offshore of Sumatra island, during local nighttime, near to optically thick clouds probed by MAJIS thermal wavelengths. No coincident detection has been obtained by ground-based lightning sensor networks, yet MAJIS observations provide unambiguous evidence of neutral atomic oxygen and nitrogen emissions, identified through several diagnostic lines. A faint Hα signature may also tentatively be associated with lightning flashes.
As MAJIS is not optimized for such observations, a number of caveats related to spectral and temporal resolutions have been considered when deriving absolute quantities, such as lightning energy and temperature. Retrieved energies are overall consistent with known emission by lightning of average strength, ranging from (0.7±0.2) to (1.3±0.3) MJ in the 777 nm O I line and from (0.5±0.2) to (1.5±0.4) MJ in the 870 nm N I line. Estimates of the temperature of the lightning channel yield a broad range of values, spanning between 5000 and 20 000 K, with standard uncertainties of the order of 2000–3000 K depending on the retrieval method. This is ascribed to a higher sensitivity to biases induced by the limited measurement resolutions.
Overall, this observation represents a useful benchmark for guiding detection and interpreting possible lightning events on Jupiter, a primary target of the JUICE mission. A preliminary extrapolation of the terrestrial case to the conditions of Jovian atmosphere suggests that H I emissions in the 650 and 1870 nm spectral ranges are the most promising for identifying lightning on Jupiter with the MAJIS instrument.
- Article
(10482 KB) - Full-text XML
- BibTeX
- EndNote


In its journey to the Jovian system, the JUICE spacecraft performed a close flyby at Earth (Earth Gravity Assist, EGA) on 20 August 2024, about 1 d after a similar close encounter with the Moon (Lunar Gravity Assist, LGA). Despite the very low flyby altitude (6100 km at minimum), and the consequent high velocity profile, the maneuver allowed the scientific instruments onboard to acquire several datasets, mainly aimed at testing their performances as well as those of the ground-segment. During EGA, the onboard Moon And Jupiter Imaging Spectrometer (MAJIS) collected 19 scans (data cubes) covering the spectral range 500–5560 nm. An extensive overview of the full sequence from both technical and scientific point of views can be found in Poulet et al. (2026).
In the present work we only focus on the first cube of the EGA sequence, where unexpected emissions were found at visible wavelengths on Earth's nightside. These signals suggest a serendipitous detection of lightning flashes originated in a thunderstorm cloud, whose location and thickness are appreciable in simultaneous thermal imaging.
In the following Sect. 2 we describe in detail the observations and the adopted methods of analysis. Although the observations are not optimal for physical studies of lightning, we attempt to derive the energies and temperatures involved, by applying specific corrections, assessing a useful framework for investigating possible other similar observations by imaging spectrometers. Main results are mostly presented in Sect. 3 and discussed in Sect. 4. An overview of lightning spectroscopy on Earth and other planets is presented at the beginning of Sect. 4. To our knowledge, MAJIS lightning observations presented in this work constitute the first case of an unambiguous direct spectroscopic observation of lightning from space, on any planet. Conclusions are summarized in Sect. 5.
2.1 Data description and processing
The Moon And Jupiter Imaging Spectrometer (MAJIS) is an imaging spectrometer covering the spectral range 500–5560 nm in two separate channels (VISNIR and IR), with a boundary at a wavelength around 2300 nm. Spectral bands' characteristics are variable depending on instrument setting, with nominal VISNIR Full Widths at Half Maximum (FWHMs) of the order of 3.5–5.6 nm and sampling of 3.6–3.7 nm per band, and slightly larger values for IR channel (FWHM 6.6–8.5 nm and sampling 6–7 nm per band) (Haffoud et al., 2024). Both channels work with 2-dimensional detectors that, sharing the same field of view, can acquire a variety of spectral scans of a target in a push-broom acquisition scheme. The direction of the field of view during a scan is controlled by either changing the whole spacecraft pointing or by rotating an internal mirror, or both. Descriptions of the instrument, its operations and calibration are detailed in Poulet et al. (2024a), Filacchione et al. (2024), Haffoud et al. (2024), Langevin et al. (2024), Rodriguez et al. (2024), Vincendon et al. (2024), and Stefani et al. (2025). Observing geometry reconstruction is based on NAIF-SPICE libraries and tools (Acton, 1996; Acton et al., 2018) and kernels provided by ESA (ESA SPICE Service, 2019).
While we refer the reader to Poulet et al. (2026) for a detailed overview of the MAJIS EGA observations, here we only focus on the first data cube of the sequence (UTC start time 20 August 2024, 21:25:09 UTC), where unexpected emissions are seen in the VISNIR channel. No other similar emissions have been found in other data cubes of the same sequence.
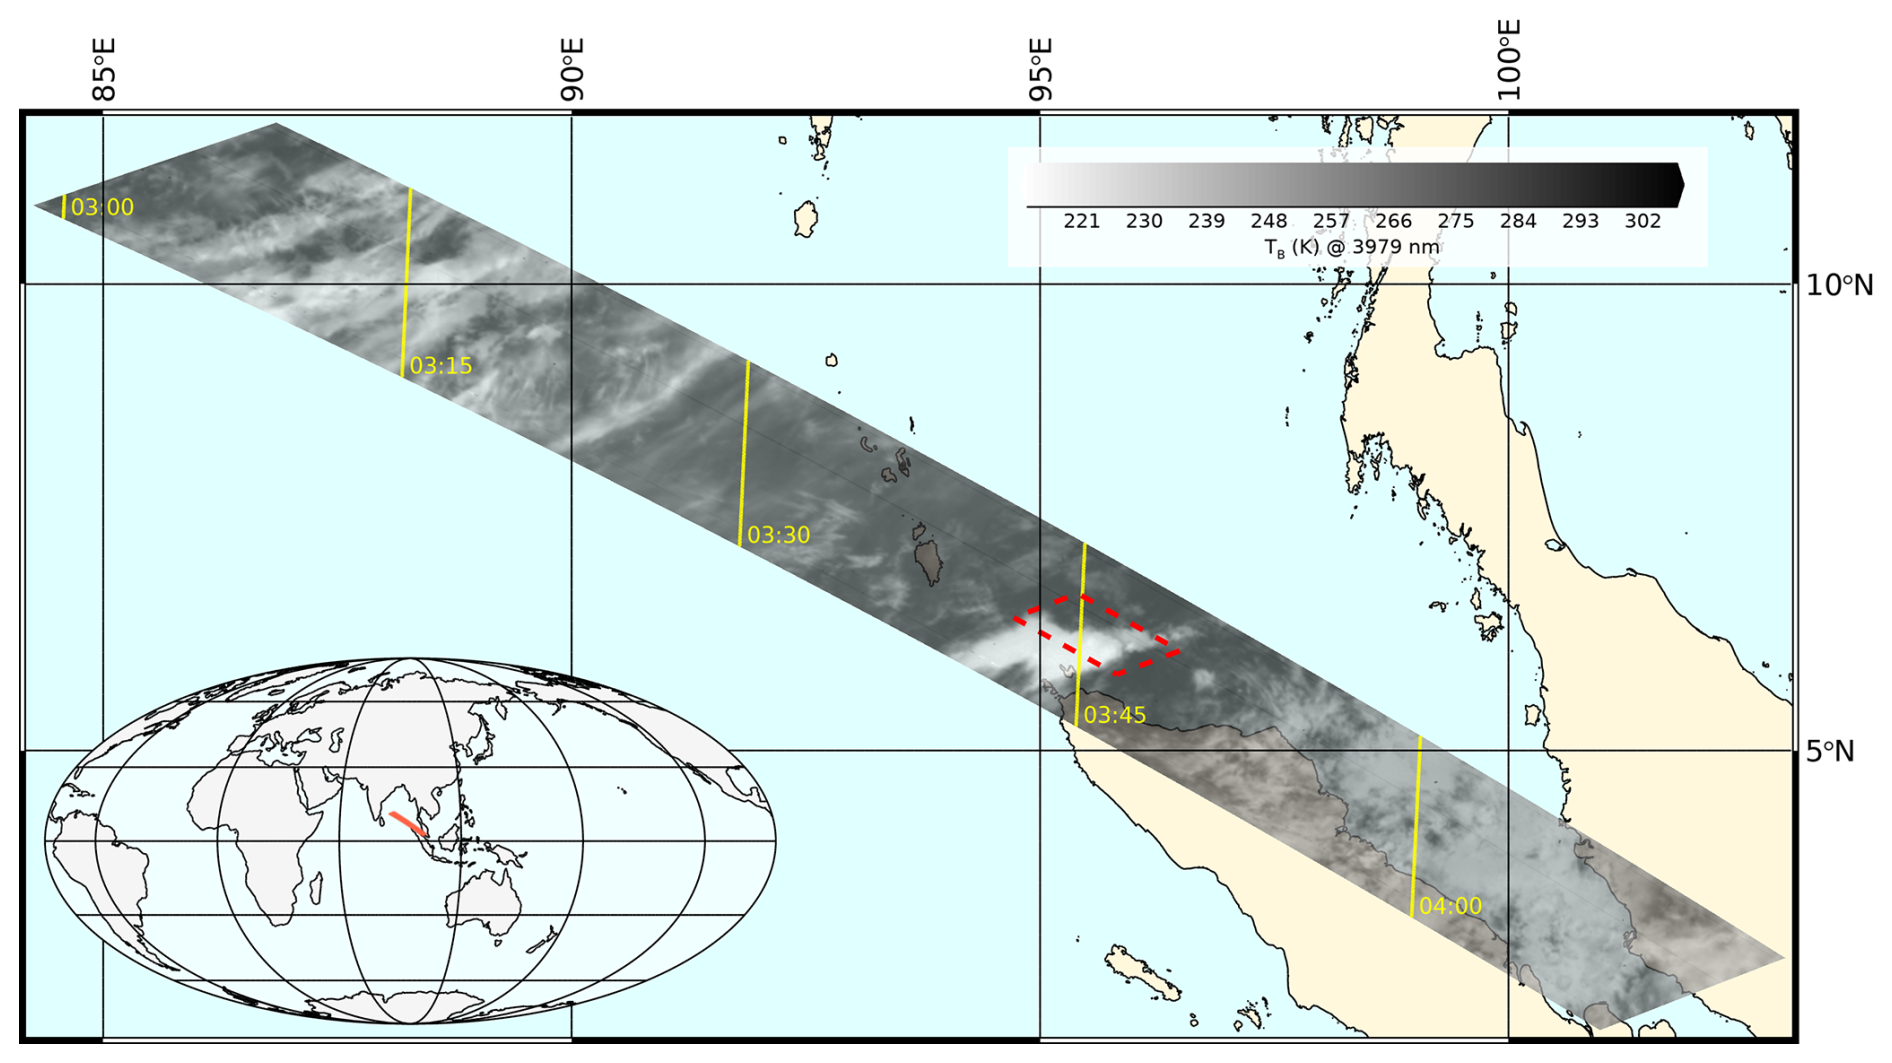
Figure 1Projection of the first MAJIS scan of the EGA sequence, where visible lightning emissions are detected. The covered area extends over the Andaman Sea and partially over Sumatra island, and Nicobar Archipelago. The gray-scale map represents the brightness temperature as registered by MAJIS at 4611 nm wavelength. The red box indicates the area of potential lightning detection, detailed in Fig. 2. Coastlines are obtained from OpenStreetMap and are available under Open Database License (OpenStreetMap).
The cube under investigation covers an area offshore northern Sumatra island, across the Andaman Sea (Fig. 1). It is fully registered at nighttime (local time ∼03:30) hence the presence of clouds can only be appreciated at thermal wavelengths, simultaneously covered by MAJIS IR channel (shown in terms of brightness temperature in the figure). Although the footprint extends over some land areas, no evident variations of thermal emission appear in association with coastlines, suggesting overall cloudy conditions thick enough to prevent land detection.
The scan is composed of 128 samples (pixels along slit direction), 865 frames (pixels across slit direction) and 1016 bands (spectral dimension, equally distributed between VISNIR and IR channels), with nominal spatial and spectral binning implemented. It has been obtained by rotating the line of sight by about 4° (2° of rotation of the internal mirror) in 865 steps for a total time of 173 s. At every step (i.e. every 200 ms), a 128-pixels spectral frame encompassing 1016 wavelengths has been acquired, with an integration time of 22 ms. The mirror movement caused the ground footprint to move at about 9.4 km s−1, spanning almost 10° in latitude (from 11.7 to 2.0° N). At the same time, the spacecraft was rapidly moving eastward, with a ground projected velocity component of about 6.6 km s−1. Since no spacecraft active pointing could be implemented, the resulting MAJIS boresight motion at the ground was at about ∼11.5 km s−1 in the southeast direction, explaining the slant footprint projection shown in Fig. 1.
The area where lightning is detected is near the middle of the MAJIS scan (red box in Fig. 1), acquired when the spacecraft was flying at about 11 500 km above the surface. In this condition, the MAJIS instantaneous field of view (150 µrad) is projected to a spatial resolution of about 1.7 km per pixel. However, the motion smearing accumulated during the 22 ms integration yields a slight enlargement of the pixel area (f) by an amount of ∼10 % (and an average linear resolution degrading to ∼2 km per pixel).
As the data were acquired at nighttime, the signal registered at VISNIR wavelengths outside the lightning area is instrumental noise. The search for potential signatures of known diffuse sources of emission from the Earth atmosphere, like airglows (e.g. the auroral-triggered O I green line at 557.7 nm, Ievenko et al., 2019) yields no significant results. This fact simplifies the study of the background fluctuations statistics which is very helpful for deriving absolute intensities and suitable detection thresholds (Noise Equivalent Spectral Radiance, NESR) for lightning emissions. As we can see in Fig. 2, the background noise is enhanced at both spectral edges of the VISNIR channel. The subtraction from the data cube of the average spectral background is effective in reducing this issue, narrowing the overall background distribution and allowing lightning signals to emerge more clearly as a statistical anomaly (Fig. 2). This analysis yields an average detection limit (NESR) for this observation, after background correction, of W m−2 sr−1 µm−1. It is worth stressing that a significant residual background pattern is still present after correction at the edges of the VISNIR channel, even if limited to the ranges below 700 nm and above 2200 nm.
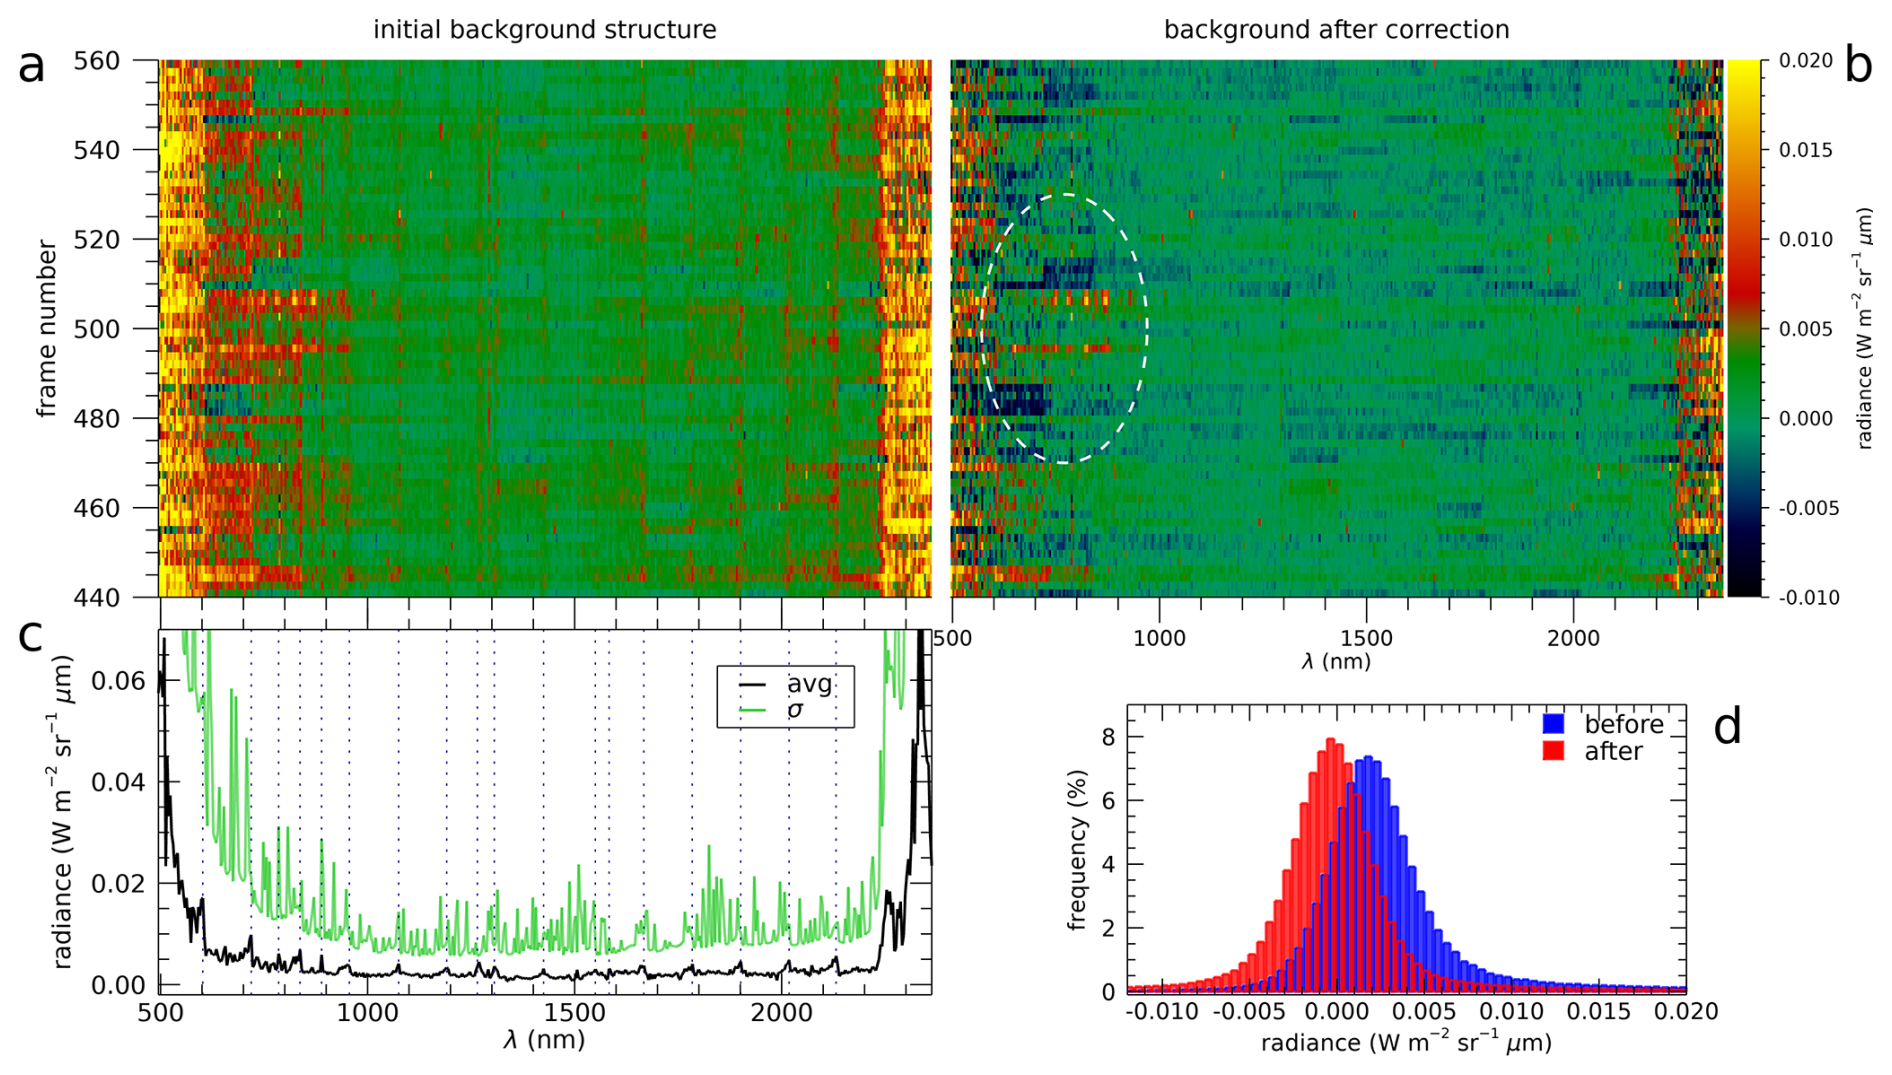
Figure 2Data preprocessing for background correction. The VISNIR background for a cube subset encompassing lightning signatures (frames 400–600 and averaged over the samples 60–70) are shown in the upper panels, before (a) and after (b) background correction. Lightning emissions are located near frame 500, highlighted by the dashed ellipse in the upper right panel. Panel (c) shows the spectrum of the average background before correction (black curve), which is used for the cube correction, with its associated standard deviation (green curve), not affected by background removal. Finally, Panel d shows the comparison of the whole cube background distribution before/after the correction.
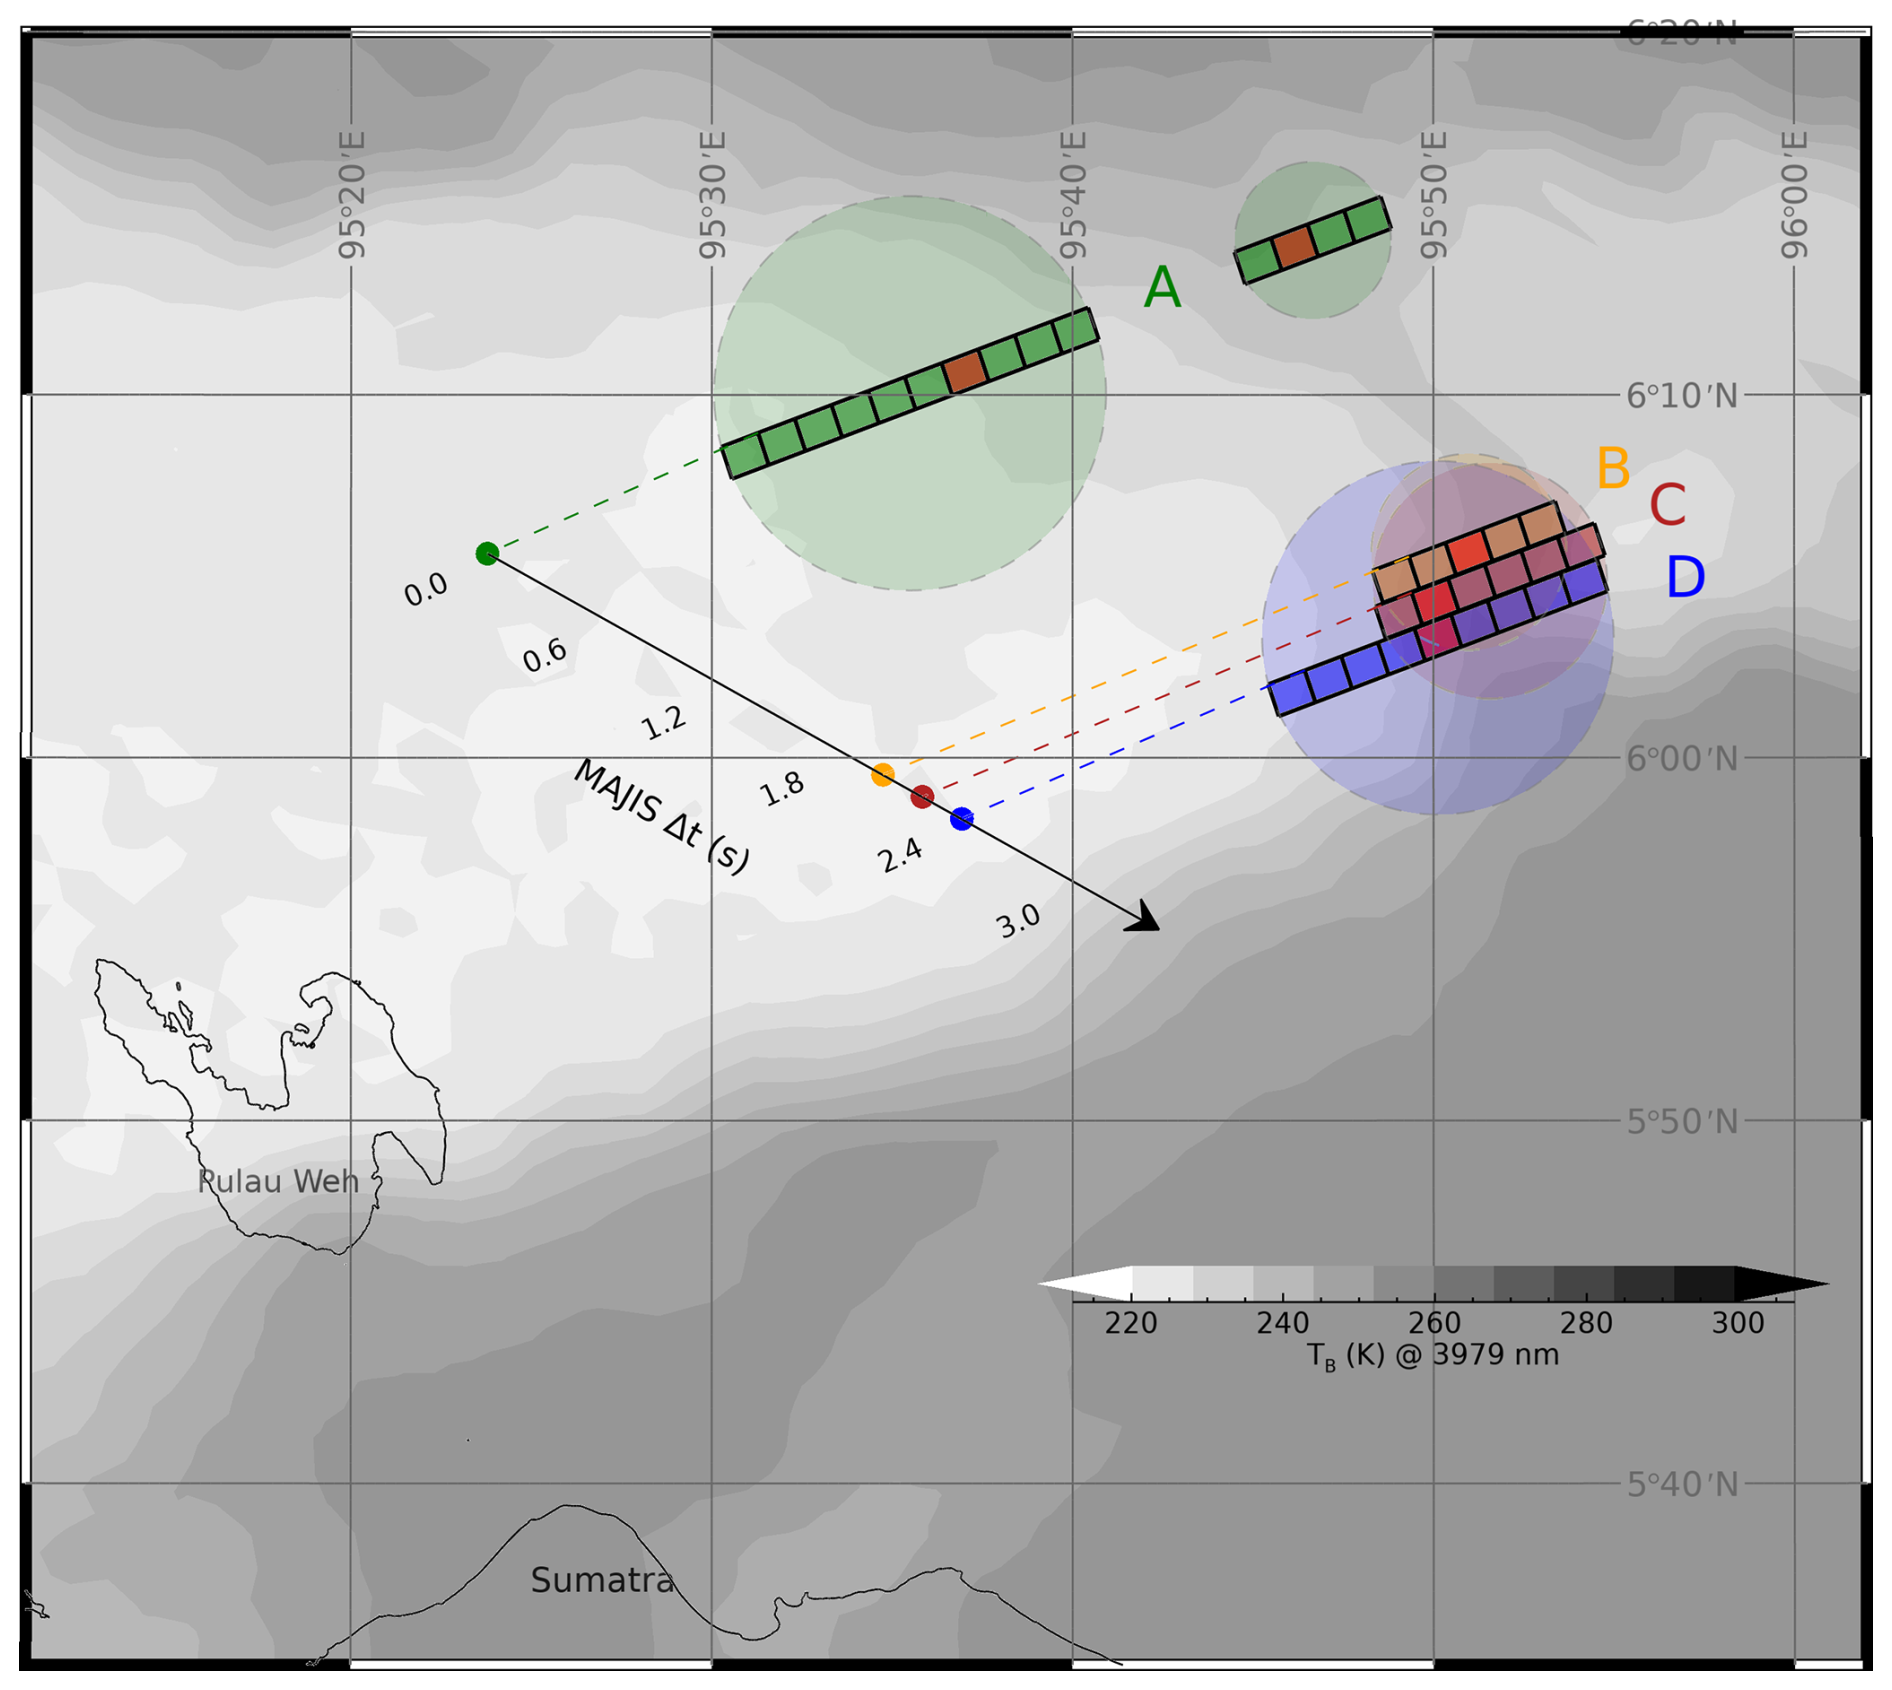
Figure 3The footprints of MAJIS lightning pixels are indicated by the colored squares, shown against a brightness temperature map (same of Fig. 1). Shaded circles represent the possible lightning flash areas associated with each MAJIS frame (A, B, C, D labels corresponding to frame numbers 494, 504, 505, 506). The red-filled pixels indicate the location of maximum emission at 777 nm for each frame. The arrow highlights the direction of motion of MAJIS boresight and the time delay between detections.
2.2 Lightning location and spatial considerations
The exact locations of lightning signatures are identified by using the radiance thresholds derived from background analysis (see previous Sect. 2.1). Figure 3 shows the footprints of those pixels where a signal exceeding 3-times the NESR has been found in more than one spectral band. They are shown projected on the Earth surface against the same thermal image displayed in Fig. 1. The pushbroom acquisition scheme implies that, while the instrument boresight moves (in the arrow direction in Fig. 3), all pixels along the same spectral frame (A, B, C, D labels in Fig. 3) are simultaneously acquired. Therefore, these aligned pixels can actually represent a portion of a larger flash area, whose extension could be guessed from the total length of the illuminated portion of the slit. Assuming a circular shape, the corresponding flash areas extrapolated from the involved MAJIS frames are shown color-shaded in Fig. 3. Basic properties of these flashes are given in Table 1. The significant overlapping in the case of B, C and D frames in Fig. 3 opens the possibility that MAJIS observed a unique lightning flash sequence there.
Table 1Properties of the frame-averaged MAJIS lightning spectra. Flash length represents the projected length of the MAJIS slit where lightning emissions are found.
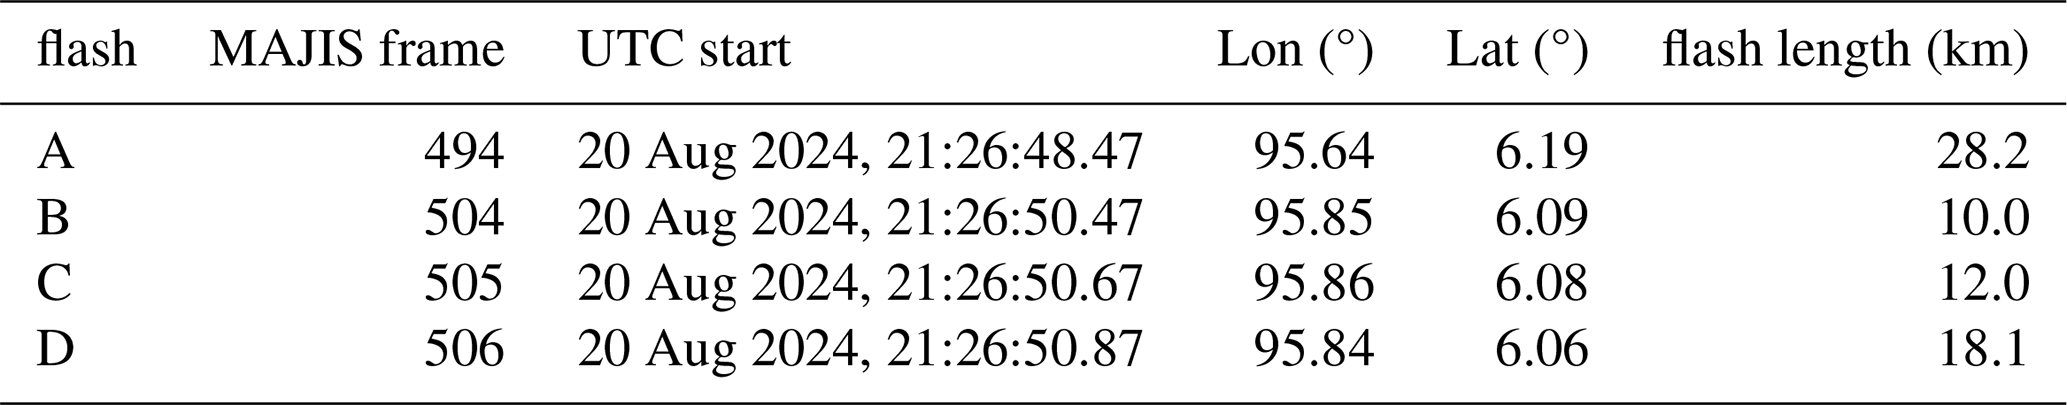
It is worth stressing that this kind of observation cannot resolve the light directly emitted by the lightning channel, which is a few centimeters thick, but is rather sensitive to the light scattered by the surrounding clouds, known to spread for several kilometers from the source. Global statistics report average sizes of scattered lightning flash of about 25 km (e.g. Rudlosky et al., 2019, give mean areas of 454 km2 over land and 570 km2 over ocean), close to the lengths measured in MAJIS flash observations (Table 1), which can therefore be considered as spatially resolved.
The coverage of thermal emission by simultaneous MAJIS IR measurements enables understanding the context where lightning is observed. As highlighted in the papers by Poulet et al. (2026) and Oliva et al. (2026, this issue), thermal wavelengths can be used to evaluate optical thickness and top altitude of cloud systems. In our case, lightning appears located close to a region having the lowest thermal emission in the whole data cube (i.e. the brightest feature in Figs. 1 and 3), revealing the presence of a very thick cloud. Although ice diagnostic signatures are mostly at solar-reflected wavelengths and hence not accessible in this case, the levels of brightness temperatures measured over this cloud is very similar to those found over ice-rich thick cloud systems in other daylight EGA cubes (Oliva et al., 2026, this issue), supporting its interpretation as a thunderstorm cloud. By using a representative nighttime vertical thermal profile (taken on 20 August 2024 in the nearest station at Banda Aceh1), the brightness temperature measured by MAJIS (at a wavelength of 3979 nm, poorly absorbed by water vapour), can be converted into an estimate of the cloud top altitude. The result of this analysis is shown in Fig. 4. This indicates that most of the visible emission is concentrated just along the eastern edge of the thick cloud, whose top lies about 12 km above the surface. The detection near a cloud edge is easily explained by the differential absorption of scattered light inside the cloud, since the reduced optical thickness makes it easier for the lightning's light to escape into space through the cloud boundaries. As a possible analogue, we can refer to lightning images like that in the inset of Fig. 4, captured from the orbiting International Space Station, at a spatial scale similar to MAJIS' one.
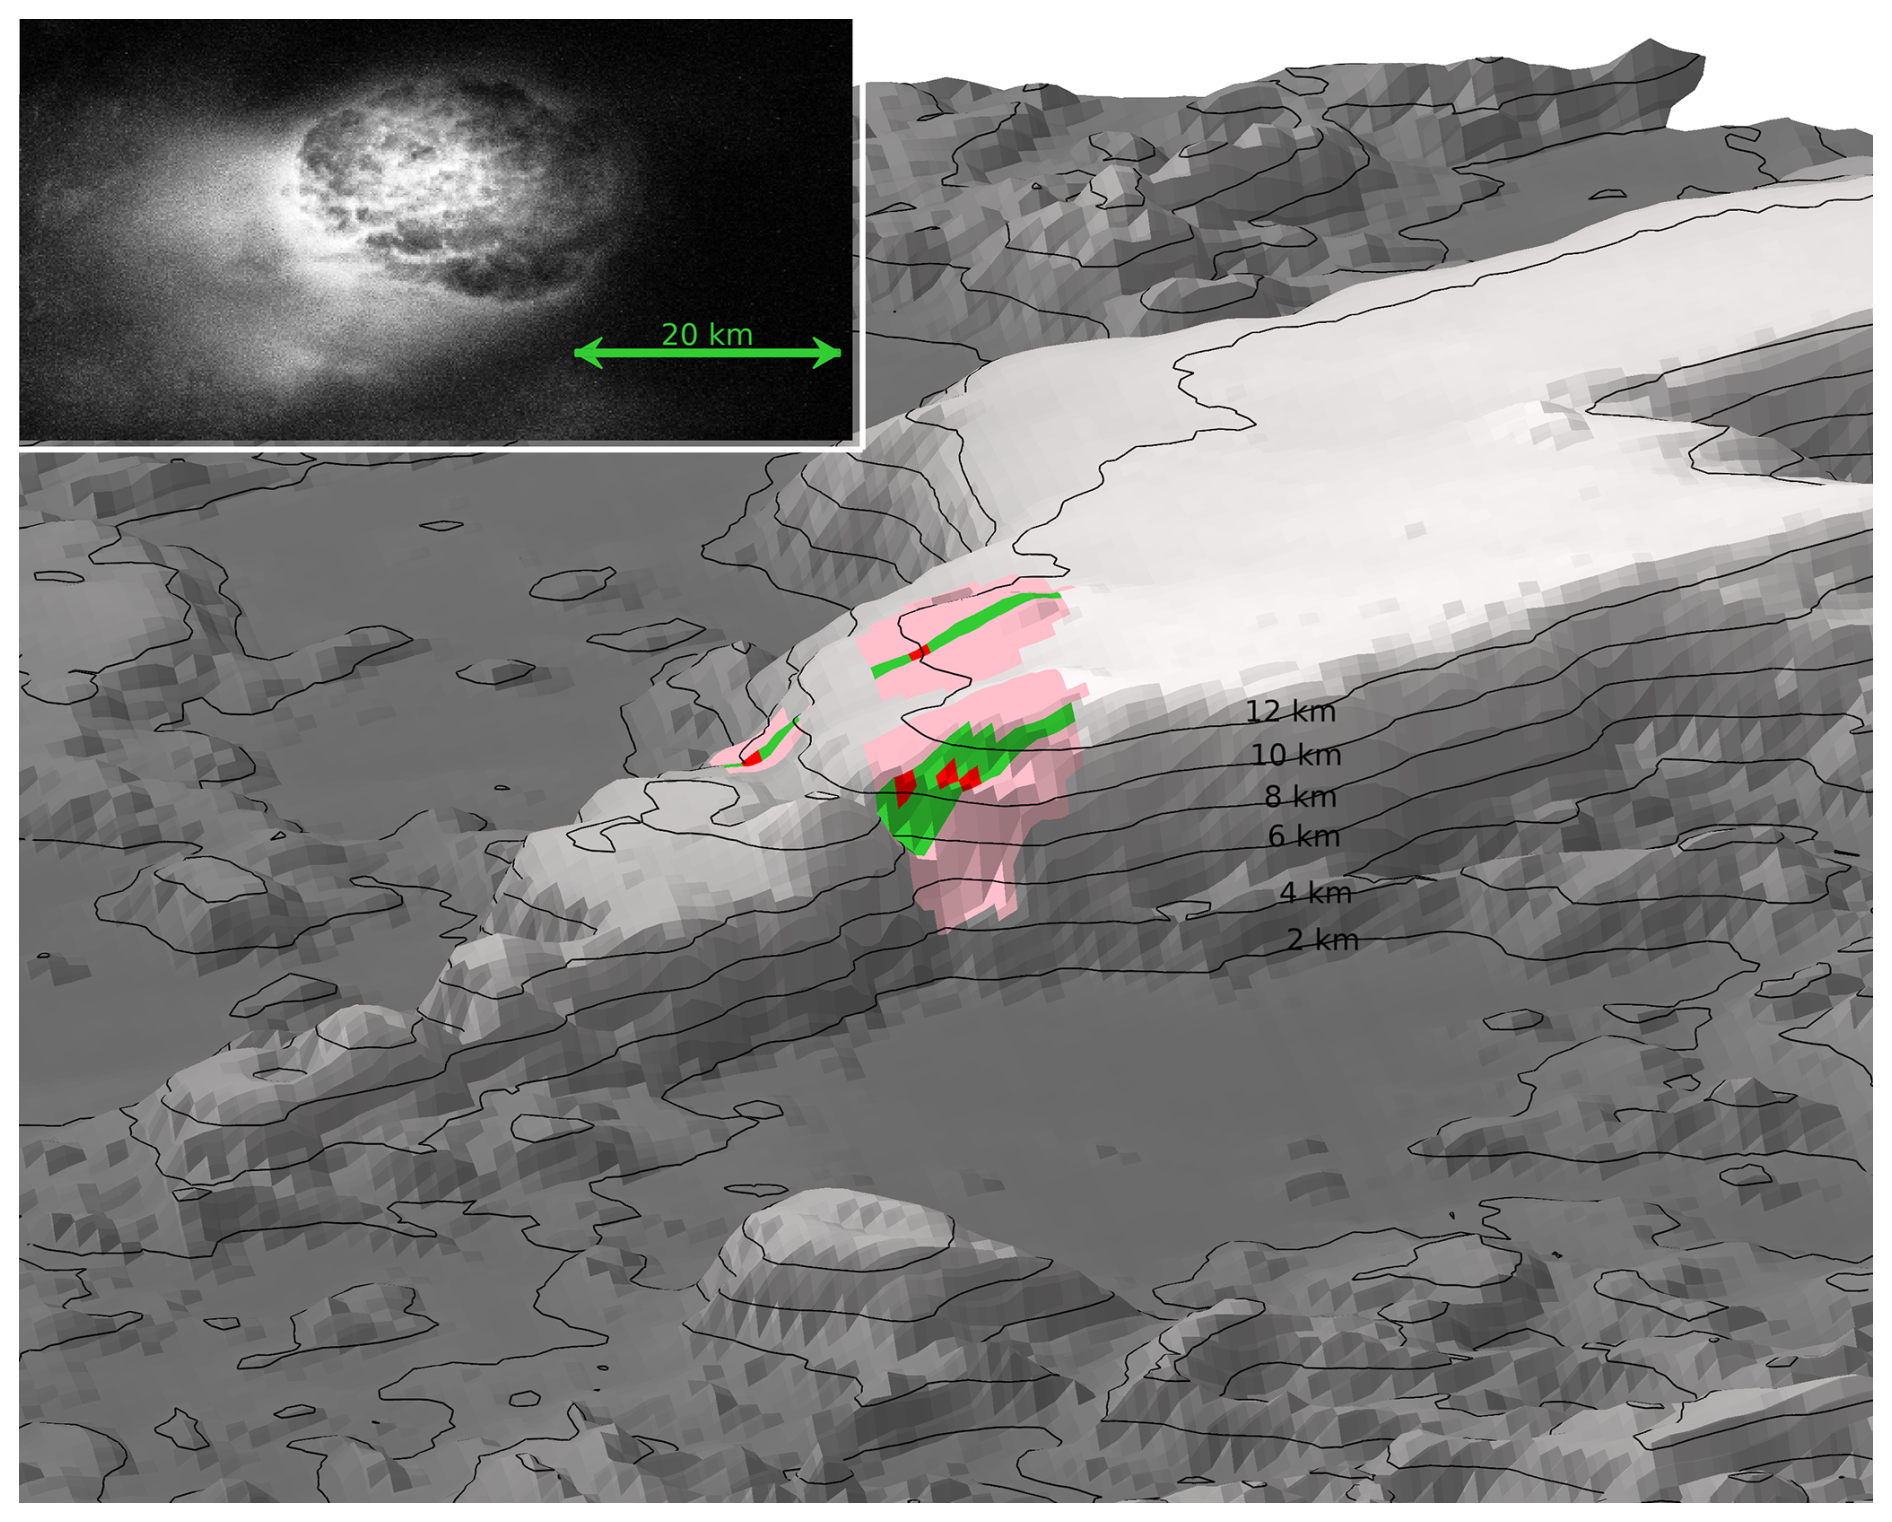
Figure 4MAJIS lightning emissions in the context of the clouds seen by MAJIS-IR. Grayscale surface shows the cloud top altitude retrieved from thermal emission at 3979 nm, labeled using black contour lines. Green regions indicate the MAJIS pixels with lightning signatures (maximum intensity in red areas), while pink shades are the corresponding circular areas (same as in Fig. 3). In the inset, a lightning flash imaged in 2021 from the International Space Station, is used as an analogue of the MAJIS observation (Earth Science and Remote Sensing Unit, NASA Johnson Space Center, Photo ID ISS066-E-24707). The horizontal spatial scale (as indicated by the green arrow) is nearly the same in the two images.
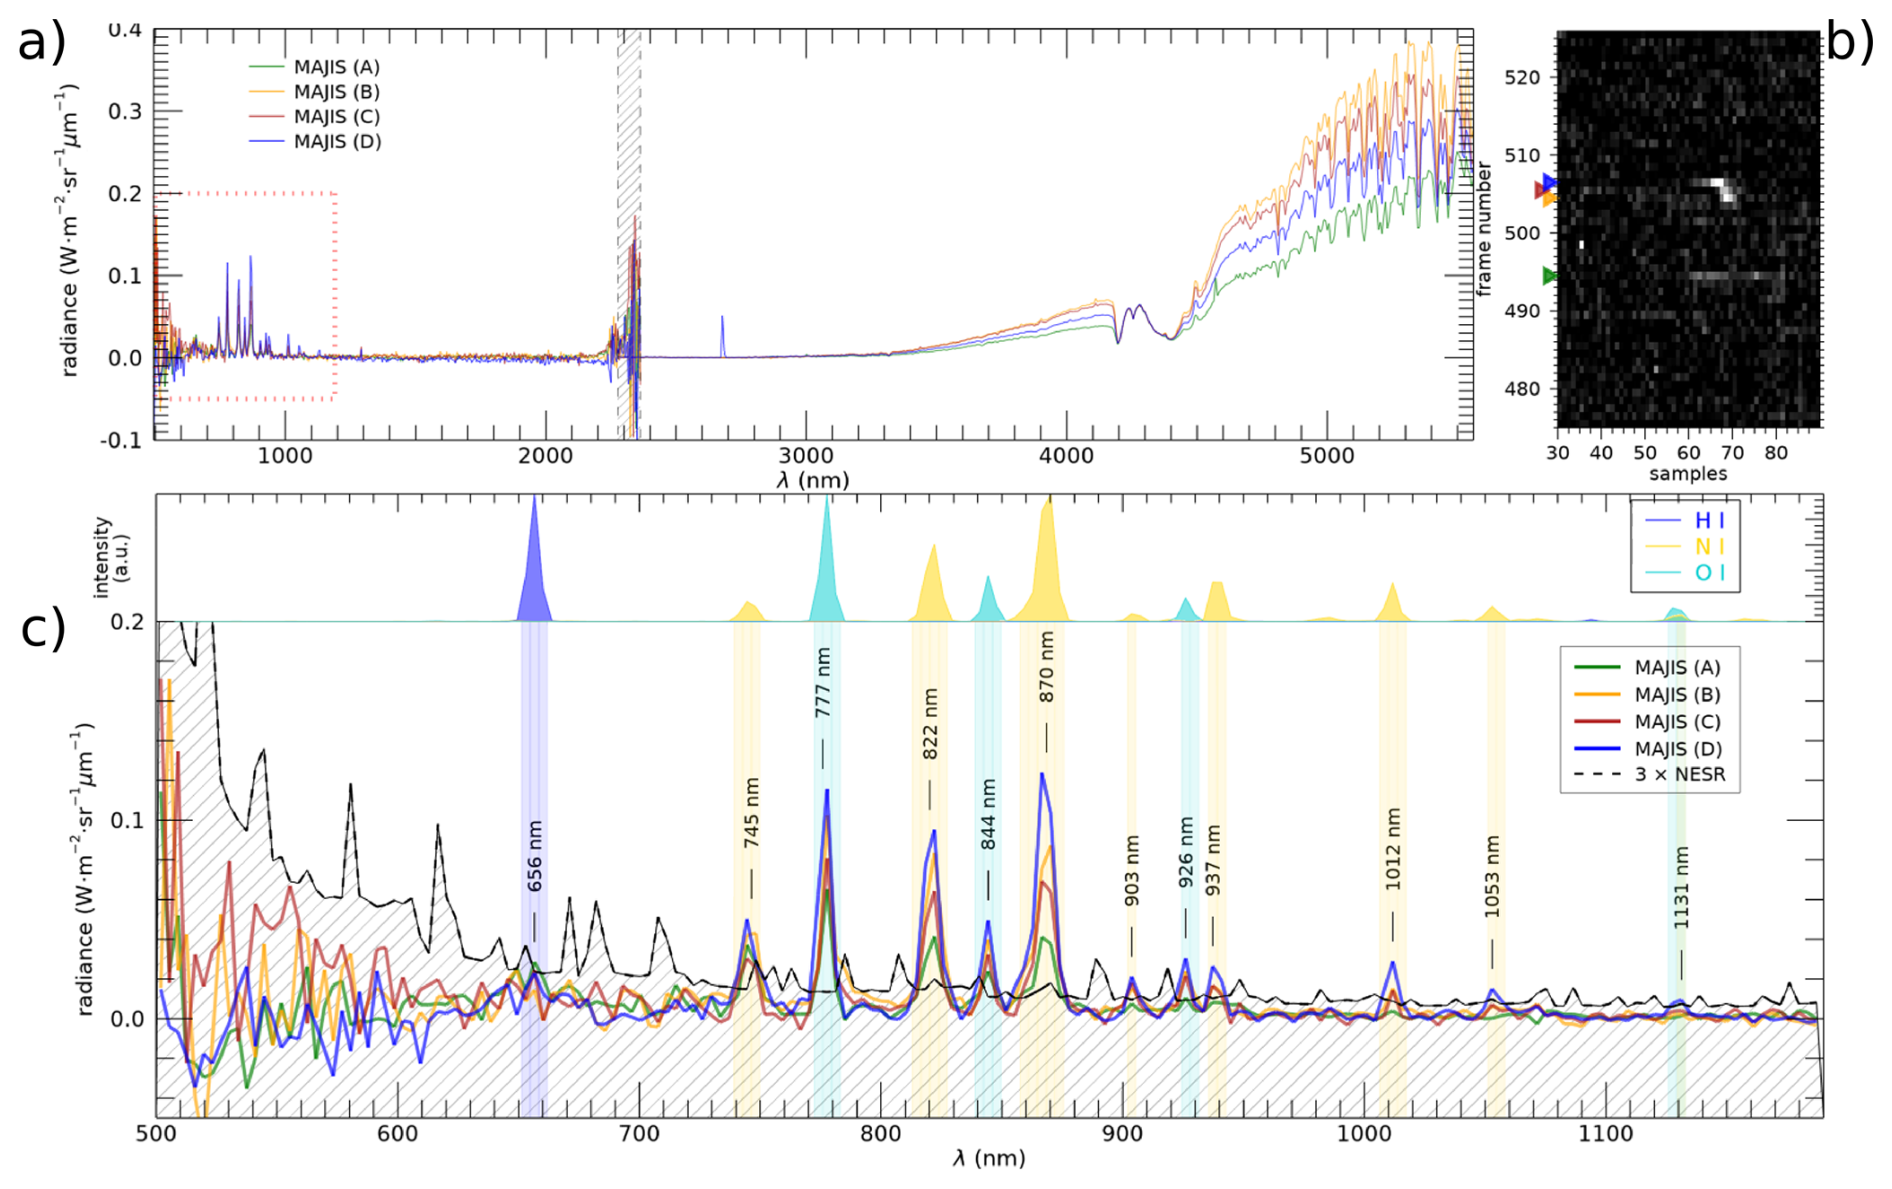
Figure 5(a) MAJIS spectra averaged over the lightning pixels of the same frames (A, B, C, D), in the whole MAJIS spectral range. Emissions diagnostic of lightning are inside the dotted red box at left, blown up in panel (c). The vertical dashed stripe around 2300 nm indicates the regions of spectral overlap between MAJIS VISNIR and IR channels. (b) Section of the MAJIS visible image around lightning pixels (spectral average between 765 and 885 nm), with lightning frames highlighted by triangles at left. (c) Lower part: Identification of emission lines detected in frame-averaged MAJIS lightning spectra. The labels highlight the wavelengths where the average signal exceeds the 3σ level above noise (line-filled grey area). Upper part: Locations of the transitions expected by atomic nitrogen, oxygen and hydrogen, shown as a normalized intensity calculated in LTE condition at 6000 K (line parameters taken from NIST Atomic Spectra Database, version 5.12).
2.3 Lightning spectral identification
By averaging the spectra of different pixels within the same frame we obtain the 4 average spectra shown in Fig. 5, corresponding to the parameters listed in Table 1. It is worth stressing that, although small, the motion smearing has been taken into account when summing adjacent spectra. In this case, a correction factor of is applied to the radiance averaged along the slit, in order to avoid double-counting the signal coming from the overlapped regions.
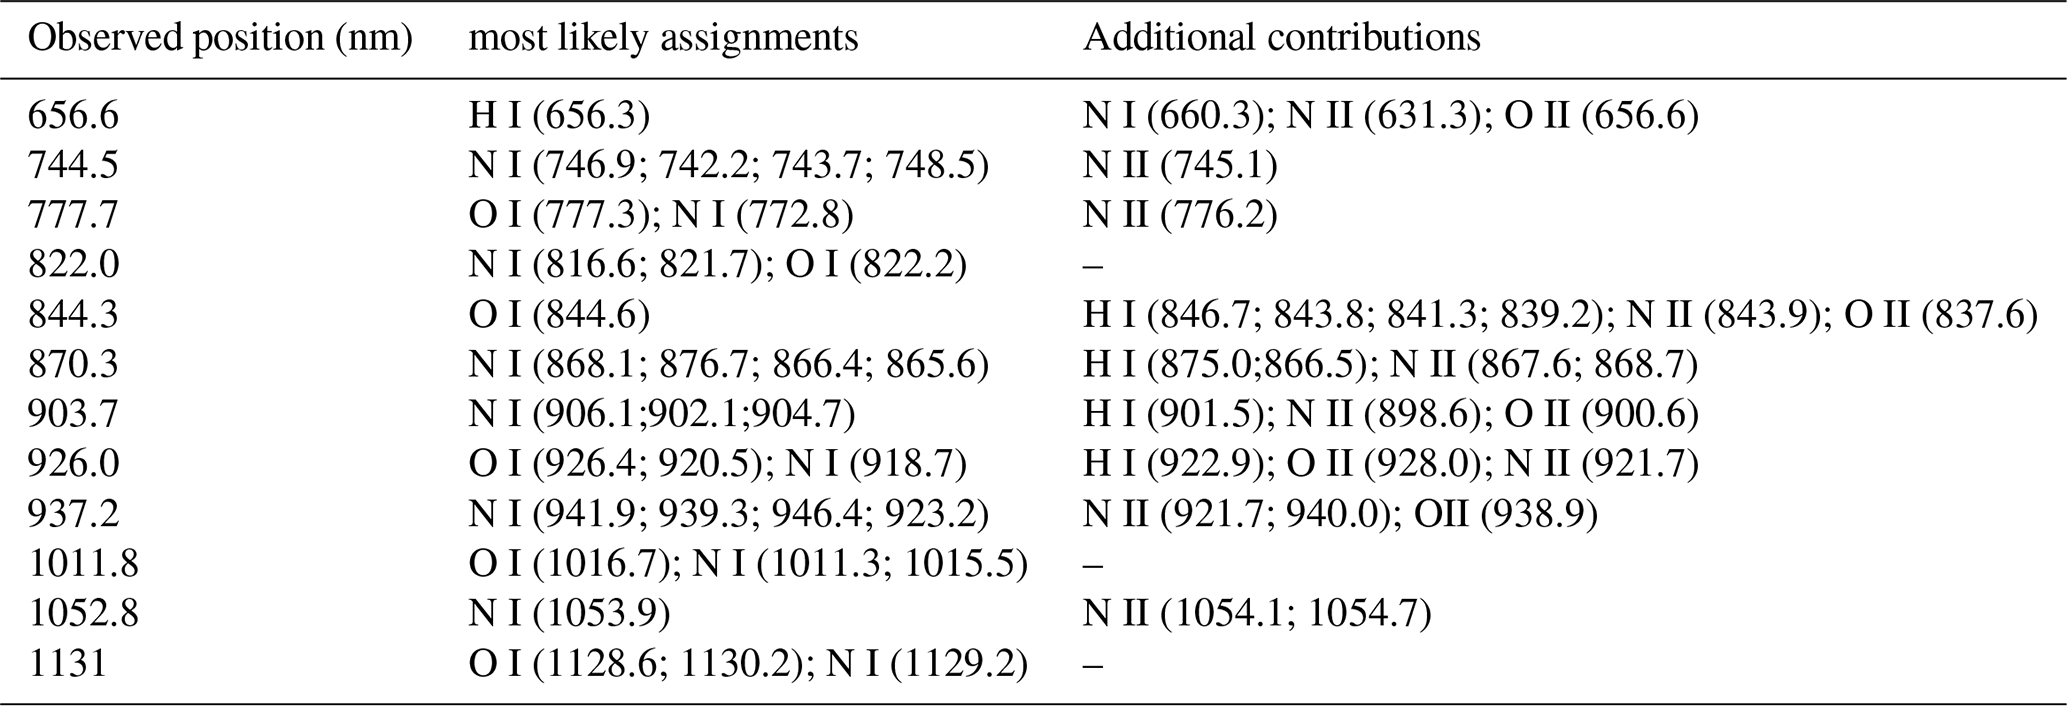
In Fig. 5a the spectra are shown in the full MAJIS wavelength range, with the boundary between the VISNIR and IR channels indicated around 2300 nm. Terrestrial thermal emission dominates the signal longward ∼3300 nm, spectrally shaped by the vertical profiles of temperature and cloud/aerosols and water opacities, by the broad 4300 nm CO2 band and by a number of narrower water absorption bands in the 5000 nm range. The 500–1200 nm range, blown up in Fig. 5c, is characterized by a sequence of rather narrow lines, whose intensity is quite variable from pixel to pixel. The main spectral feature in all spectra is represented by a group of three lines (at 777, 822, and 870 nm), diagnostic of the presence of atomic oxygen and nitrogen typical of terrestrial lightning (e.g. Orville, 1966). A series of weaker but clear peaks is also observable at 745, 844, 903, 926, 937, 1012, 1053 and 1131 nm, but with a more variable intensity. The spectra in Fig. 5c are compared with a 3σ noise level (black curve), derived from background fluctuations after the correction described above (Sect. 2.1), which is used as a threshold for selecting the most significant emission lines (labeled marks). A list of these lines along with the possible species contributing to them is compiled in Table 2. Given the non-optimal resolutions (see Sect. 3), the presence of other minor emission lines altering the spectral shapes cannot be totally excluded, but in principle no other species/lines are needed to explain these observations. It is worth noting here that, although the MAJIS instrument implements a powerful embedded despiking algorithm in its acquisition pipeline (Langevin et al., 2020; Poulet et al., 2024b), it has not been used in these EGA observations, meaning that the data can be affected by several spikes. This circumstance proved favorable in our case, since the despiking processing could have erased or strongly altered lightning signatures. In our case, the coexistence of several emission lines in the same spectrum is the primary factor supporting the interpretation of the observations as lightning emissions, intrinsically transient and localized, rather than ascribing them to spurious instrumental spikes.
Table 2Emission lines detected in MAJIS spectra. The species most likely contributing to the observed lines are listed along other possible weaker contributors. The selection only includes the strongest transitions of main atmospheric constituents,on the basis of the closeness of an atomic transition to the MAJIS spectral band. Wavelengths in brackets, in nanometers, indicate the multiplet centers and are taken from the NIST database.
The largest SNR values, of the order of 20–25, are obtained for the O I 777 nm and N I 870 nm lines. As shown in the upper part of Fig. 5c, the observed lines overall correlate with those expected from atomic neutral nitrogen and oxygen, once they are calculated at temperatures as high as thousands of kelvin. In this panel, the lines (shown for helping position matching) are modeled on the basis of NIST Atomic Spectra Database (Kramida et al., 2024), at a temperature of 6000 K in Local Thermal Equilibrium (LTE) conditions and then convolved with the instrument line shape of the MAJIS VISNIR channel (gaussian response with 3.5–5.6 nm FWHMs and 3.6–3.7 nm per band sampling).
It is interesting to note that a faint peak, barely exceeding the 3σ level, is also observed in MAJIS spectra at 656 nm, coincident with the atomic hydrogen Hα. Even if this line is well known associated with lightning phenomena (Uman and Orville, 1964), its low SNR level prevents definite conclusions about the presence of hydrogen in MAJIS spectra. We cannot even rely on the presence of other lines of the Balmer series, all falling outside the MAJIS spectral range (e.g. Hβ at 486 nm). Further details on this analysis are given in Sect. 4.4.
The intensity of the emission lines depends on gas temperature and density within the lightning discharge channel. Assuming an optically thin LTE plasma, the intensity of an emission line due to a transition between states j→i can be modeled using the Saha equation (see e.g. Boggs et al., 2021):
where λji and Aji are respectively the wavelength and the spontaneous emission Einstein coefficient of the j→i transition, gj and the Ej are respectively the statistical weight and the excitation energy of the upper level, kB is the Boltzmann constant and T the temperature. The factor encloses all the quantities that are wavelength-independent, like the total number density n0 of the atomic species and a scaling factor γ related to the observing geometry (h is the Planck constant, c the light speed and Q(T) the partition function sum of the involved species).
Equation (1) represents the baseline for physically interpreting MAJIS lightning spectral features. Given that the factor β is independent of the transition, it cancels out in intensity ratios between lines of the same species.
It is important to note that MAJIS was not designed to measure lightning spectra, particularly in terms of spectral and temporal resolutions. Therefore, further considerations are presented in the following sections to better determine which quantities can be reliably retrieved from observations and their associated uncertainties (see Sect. 3.3 to 3.5).
3.1 Line widths and broadening
The presence of a rather strong electrical field makes the shape of the spectral lines emitted in lightning mainly broadened by the Stark effect (e.g. Gosse et al., 2025). In principle, this fact might offer a way for measuring the electron density in the lightning channel (Uman and Orville, 1964). However, Stark-broadened FHWMs in lightning are estimated to be 0.3 nm (see e.g. Walker and Christian, 2019). Even if most of the emission lines are actually multiplets, i.e. they are composed of packed Stark-broadened lines slightly shifted with respect to each other, the expected multiplets width are usually 1 nm.
In the cube under study, the spectral response of MAJIS pixels (Instrument Line Shape, ILS) is well described by Gaussian functions (Haffoud et al., 2024), with FWHMs of ∼5.0–5.5 nm at wavelengths shorter than 1 µm. On the other hand, the spectral sampling used in the lightning observations is ∼3.7 nm, yielding a significant overlap between adjacent spectral bands. In any case, both quantities are larger than expected multiplet widths, which therefore fall well below the instrumental resolution capability.
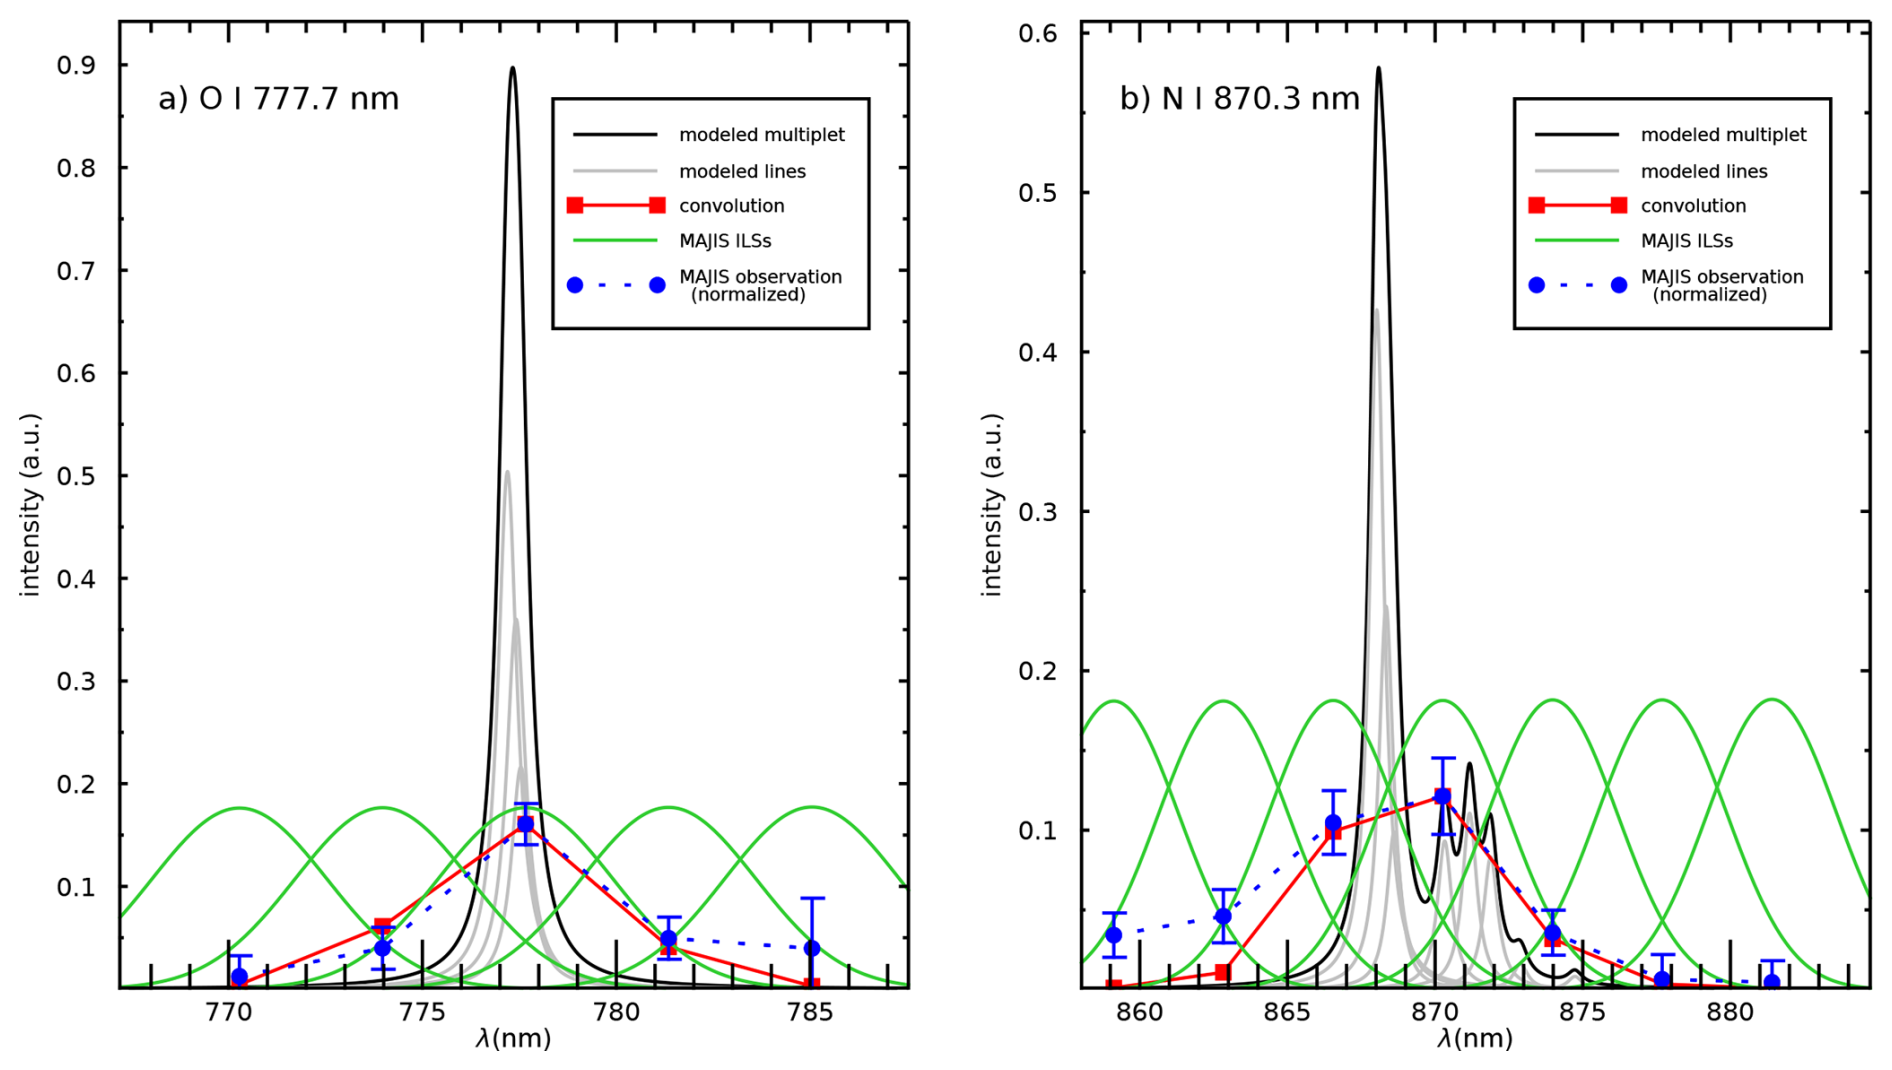
Figure 6Effect of the MAJIS spectral response on the shapes of emission lines, for the cases of O I 777 nm line (a) and N I 870 nm line (b). The initial, Stark-broadened, multiplet line (black curve) is modeled as a sum over individual lines (grey curves). Its convolution with MAJIS spectral response (Instrument Line Shapes, ILSs, shown as dashed green curves) yields a much broader line (red curve), explaining the wider signal seen in MAJIS lightning spectra (blue curves).
Nevertheless, some of the stronger lines in MAJIS lightning spectra appear wider than one spectral point, but this can be readily interpreted as a consequence of the spectral instrumental sampling. As shown in Fig. 6 for the cases of the two strongest lines (O I 777 nm and N I 870 nm), the convolution of a theoretical multiplet spectral shape (black curves), with the MAJIS ILSs (green curves) makes the signal appear in distinct spectral points (red curves). This effect explains the general shape of the observed spectra (blue lines), which is therefore driven by the instrumental parameters rather than being an indication of a true line width, confirming that MAJIS observations cannot be used for measuring line broadening (and therefore electron density).
3.2 Line intensity and spectral filling factors
MAJIS data have been calibrated in spectral radiance through Instrument Transfer Function (ITF), which provides the conversion between digital numbers and radiance values under the assumption that the whole spectral response width of a MAJIS pixel is fulfilled by the incident light. In the lightning case, dealing with unresolved lines, this standard calibration does not correctly represent the true emission flux.
As a general scheme, we can think the MAJIS spectral radiance in a given band b, Ib, characterized by a spectral width of Δλb, as the convolution of the source spectral radiance R(λ) with the MAJIS ILS Φb(λ) of that band:
where the normalization factor is .
If the source radiance is spectrally constant across the ILS spectral range, R(λ)=Rc, the MAJIS calibrated value is rigorous:
On the contrary, the lightning radiances are emitted in narrow lines, as already discussed in Sect. 3.1. We can think the radiance emitted by the source in a given line k as:
where the function ρk(λ) represents a normalized adimensional spectral shape characteristic of the line k, evaluable a priori from line parameters, and Rk,0 the peak multiplet radiance. In the case of a multiplet composed of M Stark-broadened Lorentzian lines it will be:
where w is the Stark HWHM, λl the central wavelengths of the lines and al normalized weights related to line parameters. The normalization factor ρM can be chosen such that , so that the quantity Rk,0 in Eq. (4) represents the peak radiance of the multiplet. In any case, by substituting Eq. (4) in Eq. (2), we can see that the source spectral radiance is proportional to the MAJIS calibrated value:
where a spectral filling factor δk,b is defined as:
This also allows to retrieve the total radiance (in W m−2 sr−1) emitted from the line k in the MAJIS spectral band b as:
The MAJIS filling factors δk,b evaluated for the main oxygen and nitrogen lines are reported in Tables 3 and 4 respectively, where we can see that most values fall in the range 0.1–0.3. It is important to stress that such factors depend on both indices k and b, being referred to the multiplet k viewed in MAJIS band b (adjacent bands can measure the same multiplet with different filling factors). Furthermore, these correction factors are of course model-dependent. In particular, they are dependent on the intrinsic line broadening assumed in modeling multiplets (we adopted a constant value w=0.3 nm for all lines). On the other hand, the dependence on temperature is mitigated by the fact that the transitions inside the same multiplet take place between atomic configurations very similar in terms of energy, resulting in a negligible variation of δk,b factors with respect to T.
Table 3MAJIS emission features identified as O I emission lines, associated with the atomic transition expected to mainly contribute to the MAJIS line. The selection is based on the largest spectral overlap of an atomic line with the response of the given MAJIS spectral band (i.e. the largest spectral filling factor, last column), evaluated through Eq. (7) (line parameters from NIST database).
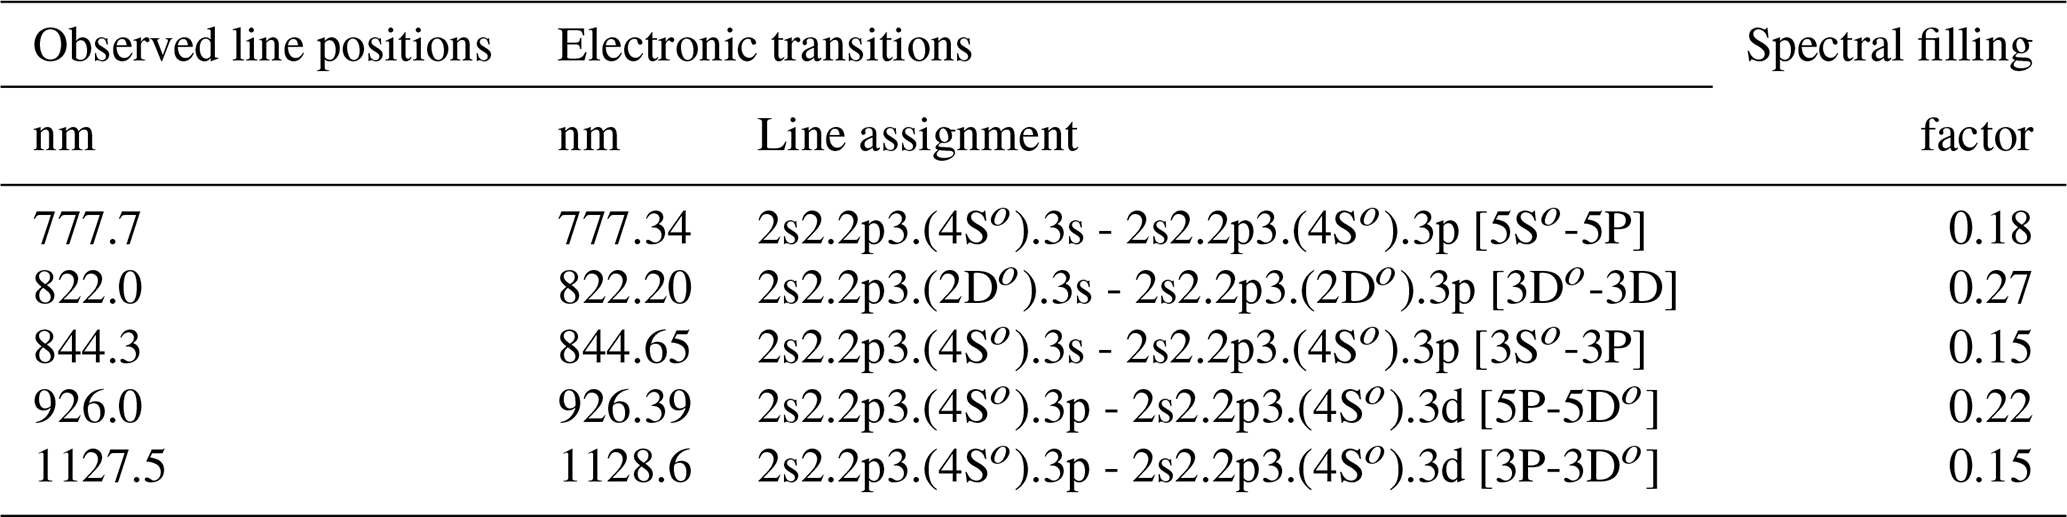
3.3 Oxygen lines
Emission lines diagnostic of atomic oxygen are clearly visible at 777.7 and 844.3 nm, in all MAJIS lightning spectra. A summary of the detected lines is reported in Table 3, including the values of spectral filling factors defined in the previous Sect. 3.2. They are both produced by oxygen de-excitation through transitions 3p→3s. The same levels are involved in the emission at 822 nm, also clearly observable, but not equally diagnostic being it overlapped with a strong nitrogen line. Another fainter oxygen line is seen at 926 nm, ascribed to 3d→3p transitions, that should also contribute to the even fainter feature seen at 1127.5 nm, yet uncertain in nature due to the closeness of a nitrogen line at 1129 nm.
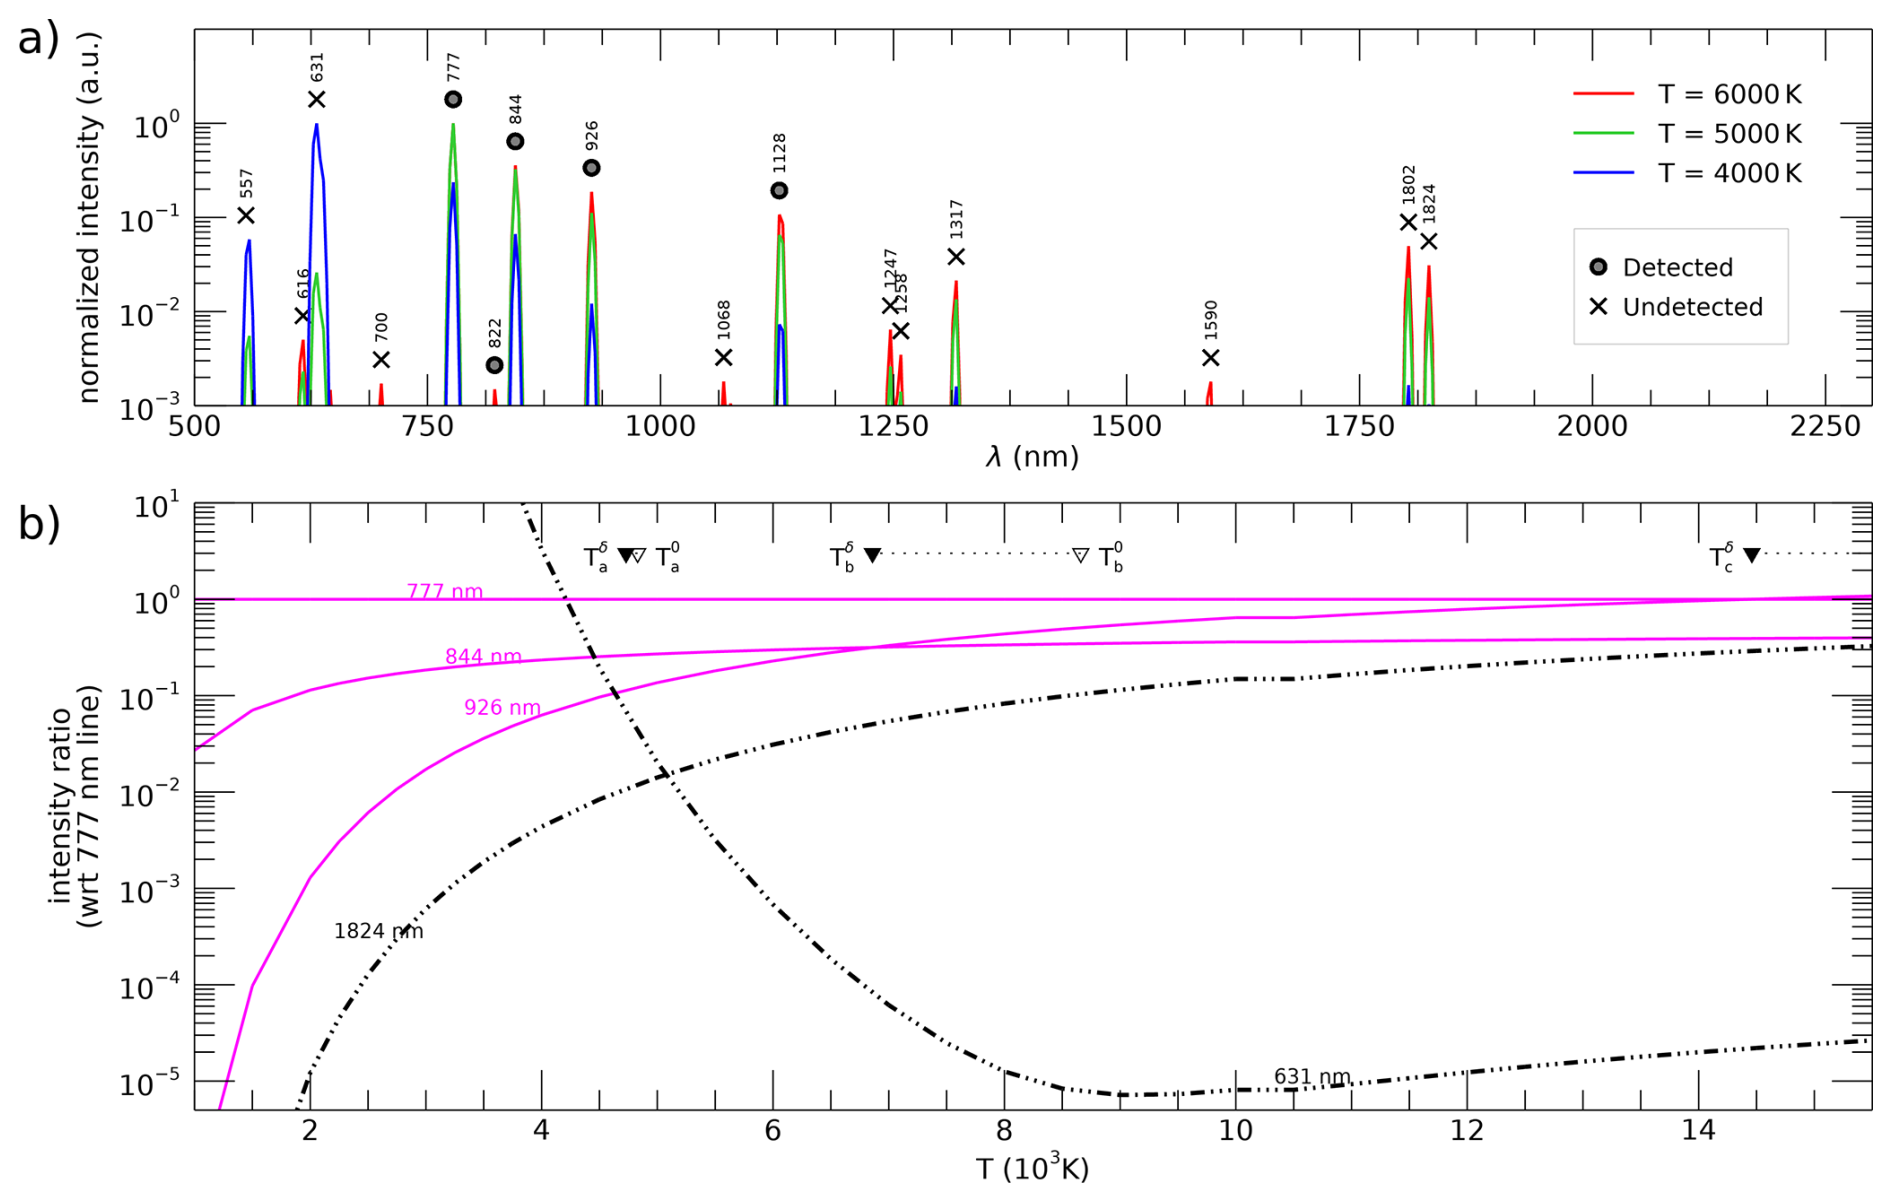
Figure 7Calculated intensities for O I lines in the MAJIS VISNIR range at different temperatures, normalized to that of 777 nm line and corrected for spectral filling factor. (a) Spectral distribution of strongest O I lines at three temperatures, labeled depending on their detectability in MAJIS spectra. (b) Intensity ratios as a function of temperature, for selected O I lines, showing relative changes in a wider range of temperatures. Solid magenta curves represent detected lines, while dot-dashed black curves undetected ones. Significant intersection points are indicated by black-filled triangles: Ta (4730 K) between 631 and 926 nm, Tb (6860 K) between 926 and 844 nm, Tc (13 500 K) between 777 and 926 nm (white-filled triangles indicate the corresponding values without applying spectral filling factor).
In Fig. 7a, we can see simulations of the relative intensity of oxygen lines (with respect to 777 nm line) obtained through Eq. (1). Temperatures of ∼5000 K are needed to populate the 3p and 3d levels enough to produce the observed emissions, but higher temperatures would increase the population of higher levels (in particular 4s, 4d, 4f, 5d, 5f) yielding stronger emissions at wavelengths where they are not observed at all (e.g. 616.6, 700.4, 1067.8, 1317.3, 1590.5, 1802.6, 1824.5 nm). On the other hand, a decrease in temperature would make stronger emissions related to low energy transitions, such the green line at 557.73 nm and the red line at 631 nm (common in auroral phenomena at lower temperature, e.g. Ievenko et al., 2019) that are equally not observed in MAJIS spectra.
A comprehensive framework for constraining the temperature is presented in Fig. 7b, where the relative intensities of the most significant emission lines are plotted as a function of temperature, also accounting for the spectral filling factors discussed in previous Sect. 3.2. The non-detection of the 631 nm line implies its intensity must fall below that of 926 nm line, a condition that occurs for T≳4700 K (labeled Ta in the plot). At higher temperatures, the 1824 nm line is expected to exceed in intensity the 844 nm line (at T≲22 000 K, not shown). Actually, a stronger upper constraint is provided by the crossing between the 777 and 926 nm lines, that implies T≲14 000 K (Tc in the plot) to preserve the dominance of the 777 nm line. As a consequence, the oxygen line intensities are overall consistent with a broad temperature range of 4700–14 000 K. It is noteworthy that neglecting the spectral filling factor correction would bias this conclusion, widening the confidence interval to 4800–20 000 K (white triangles in Fig. 7).
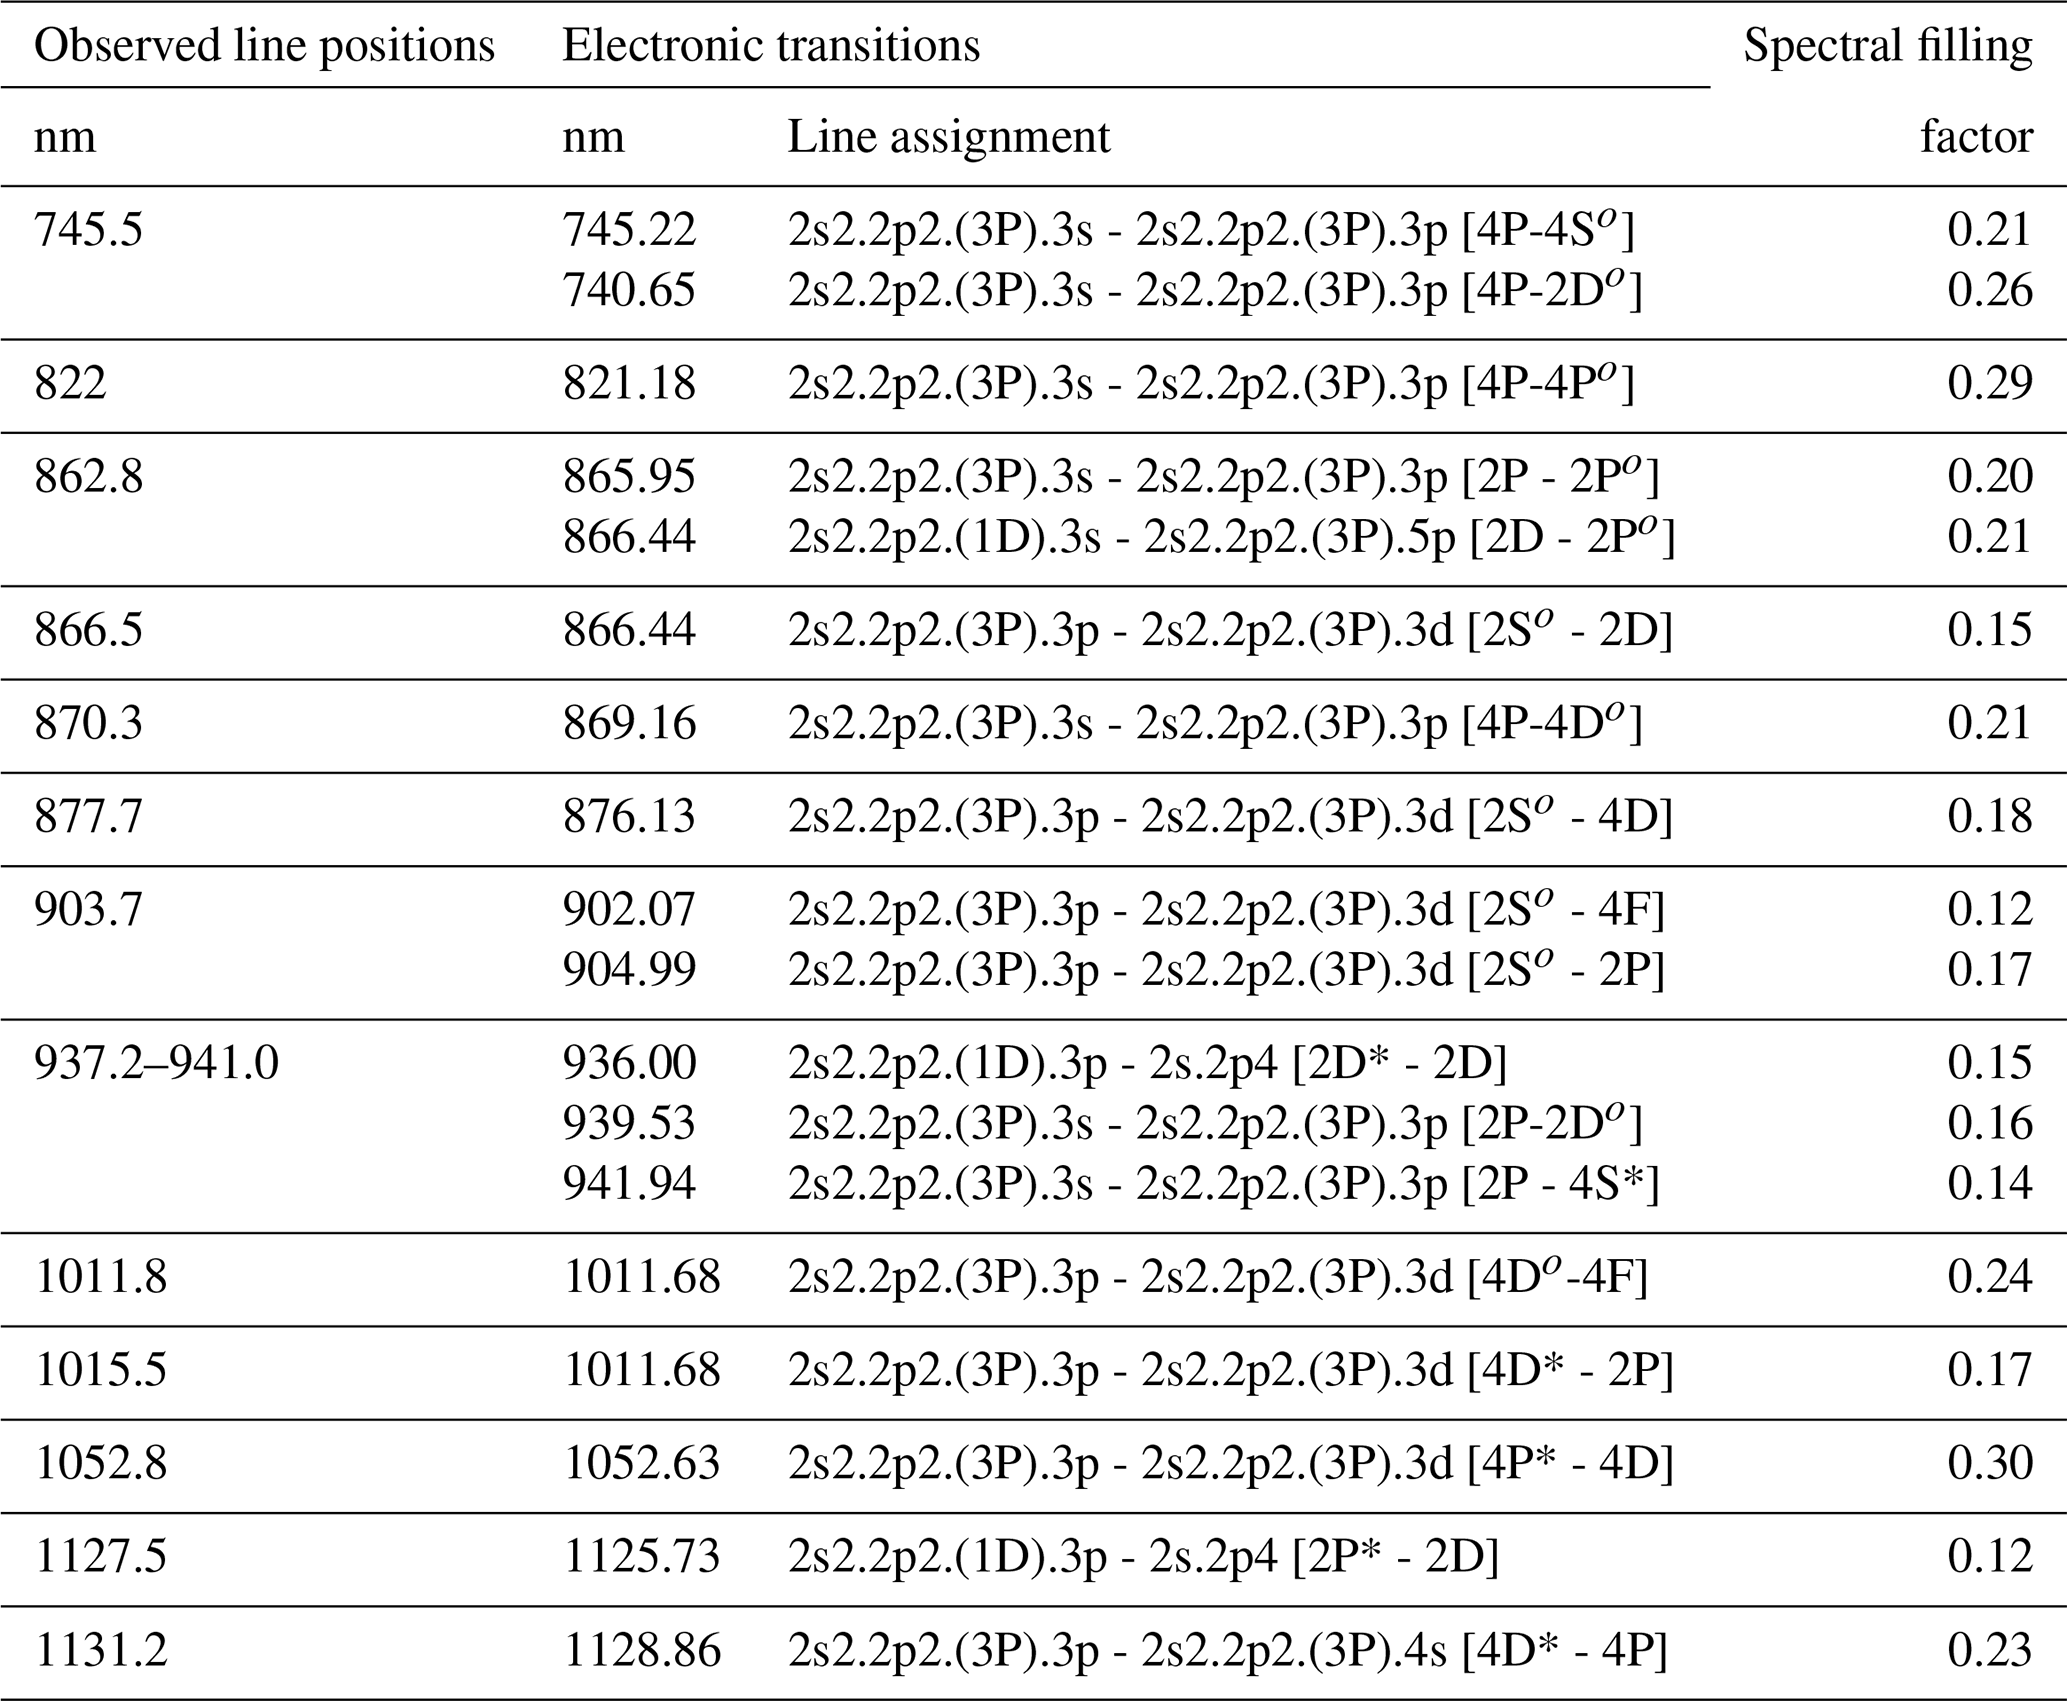
3.4 Nitrogen lines
Neutral atomic nitrogen is responsible for most features in MAJIS spectra as listed in Table 4. The stronger ones, found in all spectra, are at 745, 822, 870, 937 nm, and are all associated with transitions 3p→3s. Other shallower lines are centered at 903, 1012, 1053, 1131 nm, and should be ascribed to N I decay to the 3p level (3d→3p and 4s→3p).
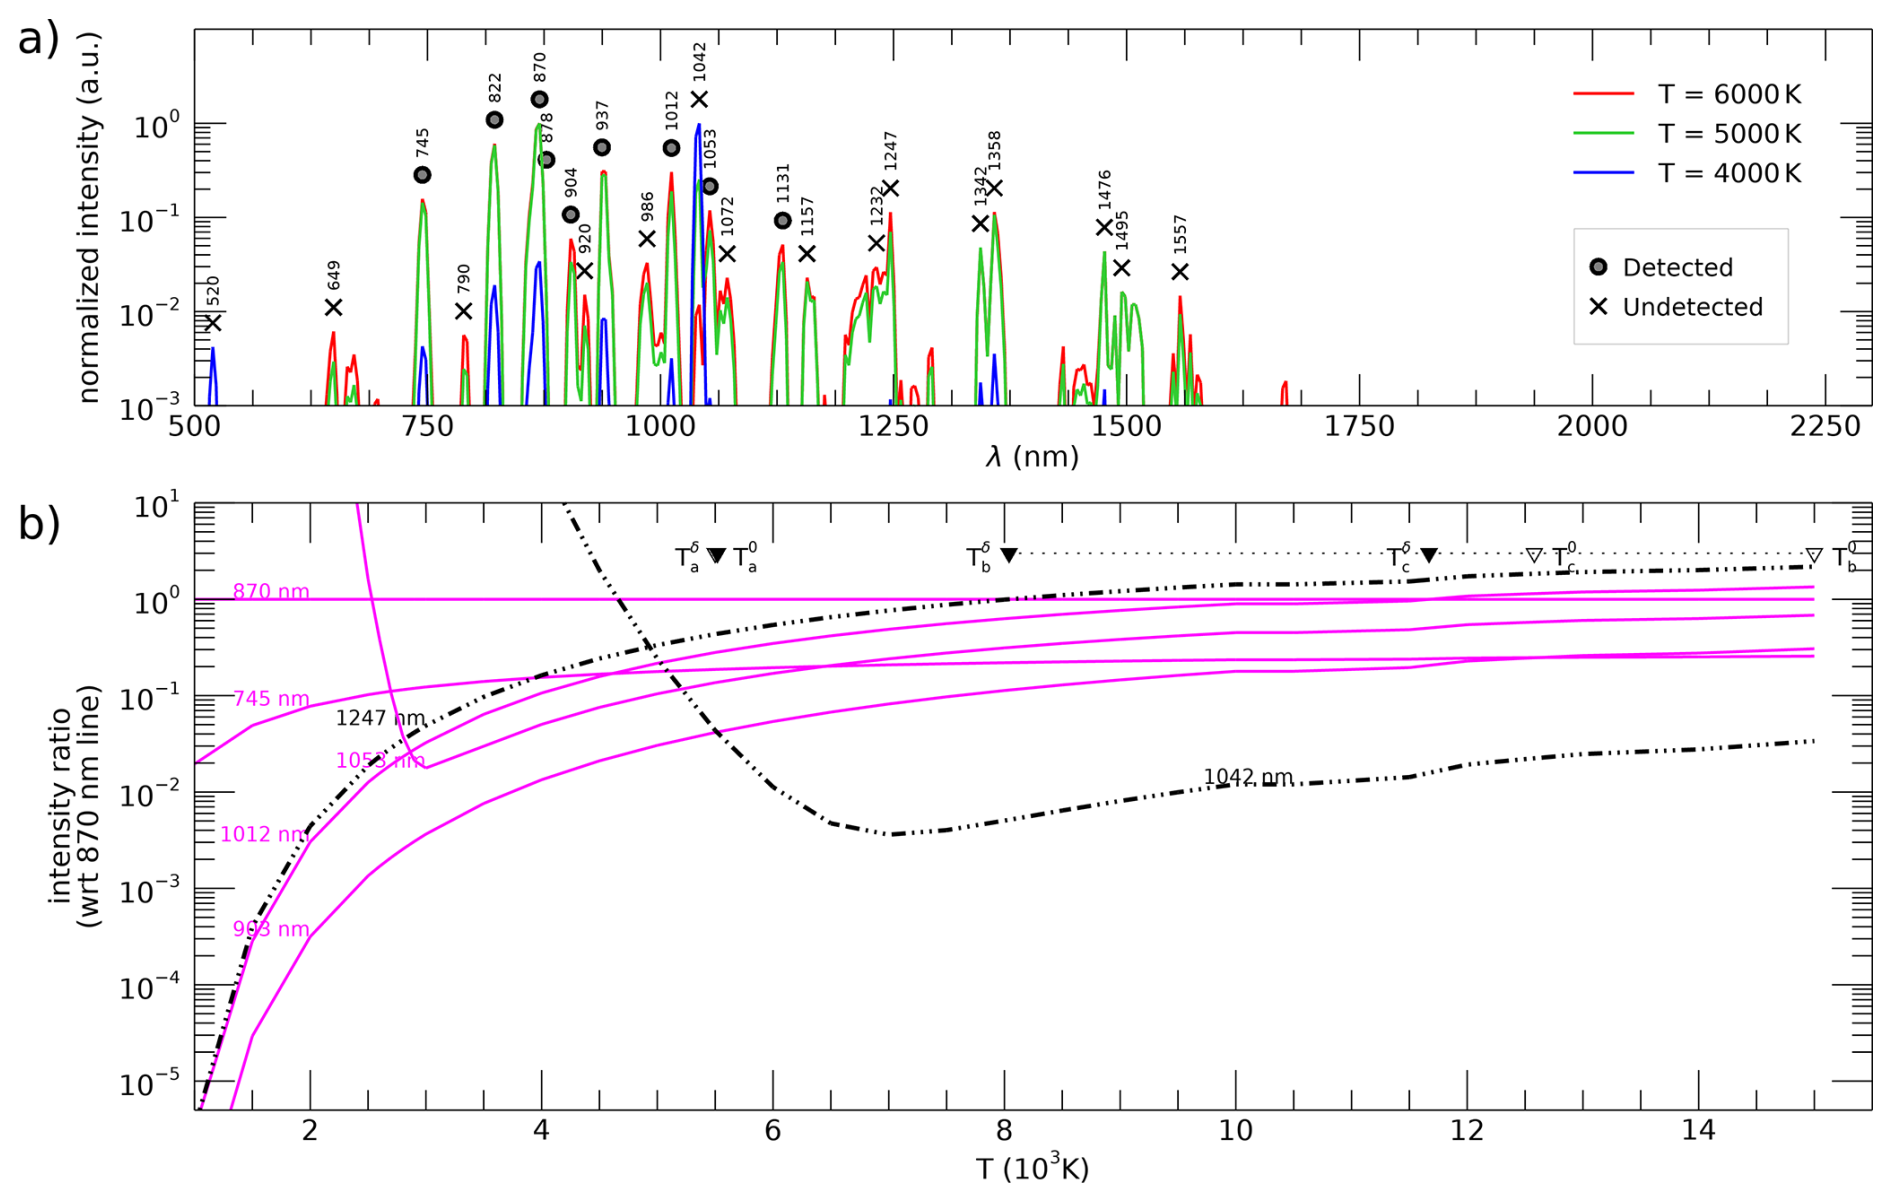
Figure 8Calculated intensities for N I lines in the MAJIS VISNIR range at different temperatures, normalized to that of 870 nm line and corrected for spectral filling factor. (a) Spectral distribution of strongest N I lines at three temperatures, labeled depending on their detectability in MAJIS spectra. (b) Intensity ratios as a function of temperature, for selected N I lines, showing relative changes in a wider range of temperatures. Solid magenta curves represent detected lines, while dot-dashed black curves undetected ones. Significant intersection points are indicated by black-filled triangles: Ta (5520 K) between 903 and 1042 nm, Tb (12 620 K) between 903 and 745 nm, Tc (11 670 K) between 1012 and 870 nm (white-filled triangles indicate the corresponding values without applying spectral filling factor).
As in the oxygen's case, a qualitative estimate of a temperature range compatible with the observations can be inferred by comparing them with model Eq. (1). Figure 8a indicates that increasing temperature yields stronger emissions at longer wavelengths, while no features are seen in MAJIS spectra for λ>1131 nm. Although pertaining to the same 3p→3s transition, no emission is found at 1353 nm, as well as at 790, 920 and 1073 nm. The same evidence applies to the missing 1232–1250 nm complex, related to other 3d→3p transitions. Finally, also in this case there are some lower-energy transitions, located near 520 and 1042 nm, whose non-detection can constrain the minimum temperature.
As also done for oxygen (see previous Sect. 3.3), a temperature plot for nitrogen is shown in Fig. 8b, including trends of relative intensities of most significant nitrogen lines (with respect to the 870 nm line). Again, a lower temperature boundary can be determined from the crossing of the 903 nm line with the undetected one at 1042 nm (labeled Ta in the plot), yielding T≳5500 K. Upper boundaries can be inferred from undetected lines at longer wavelengths, such as the 1247 nm, whose calculated intensity is larger than other detected lines. The crossing point between the 1247 nm line and the strongest 870 nm (Tb in the plot) would suggest T≲8000 K, but this estimate is highly sensitive to the value of spectral filling factor (shifting to 15 000 K if neglected). A more reliable upper boundary can be set by requiring that the intensity of the 1012 nm line remains below that of 870 nm one, yielding T≲12 000 K (Tc in the plot).
Hence, on this semiqualitative basis, the range of temperatures compatible with the nitrogen lines intensities (5500–12 000 K) is also compatible with that derived from oxygen in the previous Sect. 3.5 (4700–14 000 K).
3.5 Temporal resolution
As far as time is concerned, lab studies of triggered lightning show that light pulses raise to a maximum intensity in time scales of 0.5–1.5 µs, then to decrease exponentially with a longer decay time τ of the order of 10–100 µs (e.g. Walker and Christian, 2019; Kieu et al., 2020). Analogous to the spectral case discussed above (Sect. 3.2), the radiance value from the standard MAJIS calibration refers to an integration time (tint=22 ms) that is possibly much longer, and is therefore not representative of the true radiance emitted by the source. If we consider the simplest case of a single pulse event with a decay time τ, of the form:
the MAJIS radiance, given by the time integration up to tint, will be:
where last term holds if τ≪tint. The peak radiance can therefore be retrieved from MAJIS values by applying a temporal filling factor δt:
In this simplified model, no instrument noise has been accounted for, making the signal decay to zero. In a more realistic case, during the integration time the emission does not contribute anymore to the signal after dropping below the noise level, and the expression for Rpeak changes to:
Anyway, contrary to the spectral filling factor, the evaluation of δt is much more difficult since we do not know a priori the temporal behaviour of the lightning flash. Decay times for individual lines are provided by some lab measurements of triggered lightning, spanning a large range of values. E.g. Walker and Christian (2019) report values τ∼140 µs for the N I 745 nm line, while much shorter decay time (τ∼18 µs) can be inferred from data in Kieu et al. (2020) for the OI 777 nm line. If these times are considered in Eq. (11), the resulting peak radiance at 745 and 777 nm would be 160 and 1200 times larger than MAJIS standard ones, respectively. But lightning flashes are rarely composed of single pulses and they rather consist of clustered sequences of pulses, separated from dozens to hundreds of milliseconds, making the light emission to last as a whole for much longer times (>100–200 ms), possibly even larger than the MAJIS integration time (López et al., 2017; Peterson and Rudlosky, 2019).
A second order effect related to the poor temporal resolution can also occur for lines having the same decay time but different strength. In this case, during the integration time the contribution to the signal due to the weaker line drops below that due to background noise earlier in time with respect to a stronger line. Therefore, a different distance from the noise level can bias the lines ratio, and possibly temperature retrievals (see Sect. 4.2).
A further source of uncertainty is related to the large temporal gaps between MAJIS acquisitions: subsequent frames start 200 ms apart but the signal is integrated for 22 ms only, leaving 178 ms gaps in between. Therefore, we have no information not only on the number of strokes occurring but also if detectable flashes were shorter or longer than 22 ms and which portion of their lifetime is sampled by MAJIS acquisitions or fall in the gaps instead.
These considerations can imply large variations, even by orders of magnitude, in estimating the lightning emission intensity from MAJIS data. In order to better constrain these aspects, we attempted to find detections of the same lightning events from either on-ground stations networks or other satellites, eventually providing independent insights on timing and intensities, but without success (more details on this in Sect. 4.4).
Given the large amount of uncertainty related to this aspect, a value δt=1 has been used for the radiances previously reported in Figs. 7 and 8, while further consequences of temporal resolution will be discussed in Sect. 4.2.
4.1 The MAJIS observation in the context of lightning spectroscopy
After a few pioneering works in the 19th century (e.g. Joule, 1872), the spectroscopy of atmospheric lightning was boosted from the 1960s, when fast slitless spectroscopy enabled the identification of several spectral lines in the UV to visible range in individual flashes (e.g. Salanave et al., 1962; Salanave, 1964; Krider, 1965; Orville, 1966). These time-resolved observations succeeded in identifying atomic and singly-ionized nitrogen lines, as well as atomic oxygen and hydrogen, and in estimating temperature and electron density in the discharge channel (Prueitt, 1963; Krider, 1973; Li et al., 2016; Boggs et al., 2021; Xu et al., 2024). A number of lab experiments reproducing natural lightning conditions (triggered lightning) have also been conducted in the subsequent decades (e.g., Larigaldie et al., 1981; Barvir et al., 2004; Li et al., 2016; Carvalho et al., 2018; Walker and Christian, 2019; Kieu et al., 2020), allowing more accurate and controlled studies of the discharge processes. Other observations stressed the production of other chemical species triggered by lightning, such as nitrogen oxides or carbon compounds (Franzblau and Popp, 1989; Jadhav et al., 1996; Langford et al., 2004; Kieu et al., 2021). Overall, most recent investigations increased the relevance of lightning in atmospheric physics and chemistry, by stressing its triggering role for other transient events in the upper atmosphere (like sprites, blue jets, and gamma-ray flashes) and the subsequent non-equilibrium atmospheric chemistry providing a possible source of important greenhouse gases such O3 or N2O (see e.g. Gordillo-Vázquez and Pérez-Invernón, 2021, and references therein).
Modern spectroscopic techniques enabled lightning observations at frame rates as high as 1 MHz or more, with exposure times as short as 0.5 µs. Current knowledge assumes peak temperatures of the discharge channel around 40 000 K during the first few microseconds of the lightning return stroke, with a spectrum composed of hydrogen from disassociated water and singly/doubly ionized lines of atomic atmospheric constituents (i.e. nitrogen, argon, oxygen). Then, a cooling period follows, reaching temperatures in the 20 000 K range tens of microseconds after the onset, and with spectra only consisting of neutral atomic emission lines, followed by a slow decrease of line intensities and temperature until signal disappearance over the course of milliseconds. In the longer cooling phase, molecular reactions involving NOx can occur, even if some authors report anomalously high ratios for several minutes (Franzblau and Popp, 1989).
All the cited spectroscopic observations of terrestrial lightning have been conducted from the ground. On the other hand, space-based observations dedicated to lightning studies usually rely on large-field imaging in narrow spectral filters, often aimed at the 777 nm O I line in the visible spectrum, like the data provided by LIS (Lightning Imaging Sensor, Christian et al., 2003), ASIM (Atmosphere Space Interaction Monitor, Pérez-Invernón et al., 2022), or GLM (Geostationary Lightning Mapper, Goodman et al., 2013) instruments, to name a few. These datasets are optimal for either global or regional statistical studies, like lightning climatology and flash rates (e.g. Cecil et al., 2014), ratio of cloud-to-ground to intracloud flashes (e.g. Boccippio et al., 2001), their relationship with mixed-phase precipitation (e.g. Petersen et al., 2005), or their link with terrestrial gamma ray flashes (e.g. Barnes et al., 2015; Gjesteland et al., 2017). On the other hand, spectral extensions of space-based observations to the blue/ultraviolet spectral range (like the 180 and 337 nm spectral bands of ASIM) proved useful for improving the physical understanding of blue flashes and elves (Li et al., 2021; Bai et al., 2023; Bjørge-Engeland et al., 2024).
Lightning is also of great interest for other planetary atmospheres in the Solar System and beyond, with evidence having been accumulated over the years on many planets (see Aplin and Fischer, 2017, for a review). The first detection on Jupiter dates back to the Voyager 1 encounter (Gurnett et al., 1979), followed by confirmations by the Cassini (Dyudina et al., 2004) and Juno (Kolmašová et al., 2018; Brown et al., 2018; Imai et al., 2019; Becker et al., 2020; Kolmašová et al., 2023a) spacecrafts. Data from the Voyager probes allowed inference of lightning on the other giant planets, i.e. on Saturn (Warwick et al., 1982), then firmly assessed by Cassini spacecraft (Fischer et al., 2006), on Uranus (Zarka and Pedersen, 1986), and on Neptune (Gurnett et al., 1990). In many of these cases, electrical discharges have been identified thanks to their radio and microwave emissions, and sometimes through visible imaging of possible flashes associated with thick cloud structures. On Venus, preliminary insights of lightning processes were not confirmed by in-depth scrutiny of imaging spectrometry datasets by Venus Express (Cardesín Moinelo et al., 2016), leaving the occurrence of lightning on this planet still debated (Lorenz, 2018). The only evidence of transient luminous events registered by a spectrometer has been reported at Jupiter by the Juno UV spectrograph, although the observed spectra, dominated by H Lyman band emission at 160 nm and hence very similar to Jovian auroral emissions, could be ascribed to events occurring above the Jovian clouds, like sprites or elves (Giles et al., 2020).
4.2 Emitted energy
The strongest single-pixel intensities registered by MAJIS in lightning spectra are found in the oxygen line at 777 nm (max radiance of 0.418 W m−2 sr−1 µm−1) and in the nitrogen line at 870 nm (max radiance of 0.374 W m−2 sr−1 µm−1), both within the flash D (Fig. 5).
As discussed in Sect. 3, these radiance values do not represent the emitted source radiance, being biased by resolution effects. Dimensionless filling factors can be introduced to attempt recovering the emitted radiances:
Here Rkb is the radiance emitted in the line k and measured in MAJIS band b, Ib is the MAJIS standard-calibrated radiance, and δs, δt,kb, δλ,kb are the spatial, temporal and spectral filling factors respectively. However, spatial and temporal filling factors are only relevant if dealing with specific quantities such as radiance, but they are not needed to derive the total energy impinging the detector. As the lightning flashes are the only sources of photons, MAJIS signal is already proportional to the lightning flux integrated over the pixel's footprint and flash duration, and only the spectral filling factor δλ,kb has to be applied to retrieve the emitted radiance. In other words, by taking advantage of Eq. (8), if the emission line k is covered by the MAJIS band b, the measured energy density, per unit area and solid angle, is (in J m−2 sr−1), which is a quantity comparable with other observations being independent on instrumental parameters. In the further assumptions that this energy density is uniform over the whole flash area Σf (i.e. the circular regions introduced in Sect. 2.2) and that the light of the discharge, isotropically emitted by lightning, is fully backscattered by clouds towards the detector with negligible loss, we can evaluate the total energy Ek emitted by a lightning in the line k as:
The values of Dk and Ek obtained for the strongest lines O I 777 nm and N I 870 nm are summarized in Table 5, associated with statistical uncertainties, of the order of 25 %, derived from error propagation of MAJIS uncertainties.
Table 5Intensity of main oxygen and nitrogen emissions for the four flashes registered by MAJIS. Ib is the frame-averaged radiance from the standard calibration pipeline; Dk is the corresponding energy density, while Ek is the lightning emitted energy under the assumption of Eq. (14), extrapolated to a minimal flash area Σf. The last row reports the total energy emitted by B, C, D flashes as pertaining to a unique sequence, assuming their average energy density spread over the whole area of the largest frame D).
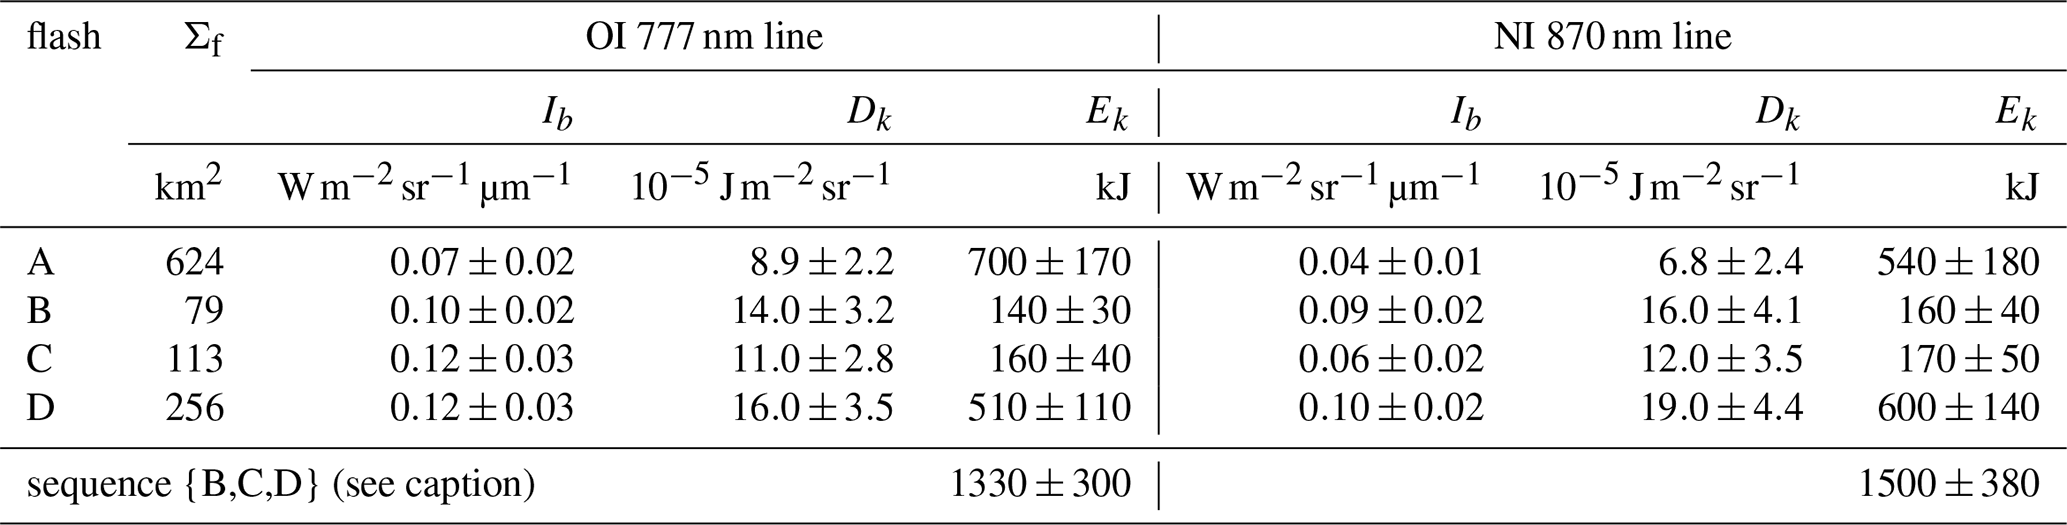
The values at 777 nm are particularly useful for comparing MAJIS observations with other datasets, since this line is routinely monitored by satellite observations devoted to lightning. Our derived energy densities are compatible with flash radiances reported in literature for average-intensity lightning. If early airborne observations reported 90 % flashes having energy larger than (Christian and Goodman, 1987), modal values obtained from LIS statistics range around 0.5 (corresponding to once a line width of the order of 1 nm is taken into account, see Köhn et al., 2024, their Fig. 8), which is a value only 5 times higher than those in Table 5. The total energy released through this line ranges between 140 and 700 kJ in MAJIS observations, but if we consider the frames B, C and D as part of a single flash (spread over the largest D area and spanning a total time of 422 ms, not far from the average 345 ms flash duration over ocean, see e.g. Rudlosky et al., 2019), the integrated energy rises to ∼1.3 MJ. These values reside near the lower boundary of global statistics, which spans from 1 MJ for small flashes to >10 GJ for superbolts (e.g. Peterson, 2023). Anyway, it is worth keeping in mind that the values we inferred depend on assumptions about areal and angular integration that are not well constrained and the Ek values can represent a lower limit of the actual flash energy. As stressed by systematic comparisons of ground- and space-based lightning observations, the energy seen from space can be significantly lower than that measured from ground, probably due to the fact that most of the optical energy emitted by a return stroke comes from its portion near the ground, hence considerably absorbed by overlying clouds (Wemhoner et al., 2025).
4.3 Temperature
In Sect. 3.3 and 3.4 we deduced broad ranges of temperatures compatible with MAJIS lightning observations (corrected for spectral resolution only) from qualitative considerations on oxygen and nitrogen emissions, appearing in agreement with each other at least on order of magnitude (4700–14 000 K from oxygen, 5100–11 700 K from nitrogen). We investigate here two alternative methods for constraining the temperature in a more quantitative way.
4.3.1 Method 1: intra-species line ratios
If we consider two multiplet transitions j→i and m→n of the same species, both described by Eq. (1), the radiance ratio of the two MAJIS bands covering them, Ib and Iq respectively, can be expressed as:
Here the radiances are expressed through Eq. (13), where only the spectral filling factors have been included.
This approach is widely adopted for measuring lightning channel temperature when dealing with spectrally- and temporally-resolved measurements of both natural and triggered lightning (e.g. Li et al., 2016; Kieu et al., 2021; Boggs et al., 2021). For MAJIS, the application of this equation is limited to bands covering one single multiplet, hence we selected the 844 and 926 nm lines in the case of oxygen, while the 870 and 1012 nm lines were chosen for nitrogen. Under the assumption that each pair of selected lines shares the same decay time (i.e. , we obtain the results summarized in Fig. 9 and Table 6. The associated uncertainties are largely dominated by MAJIS measurement errors, whereas uncertainties in the multiplet parameters are considered negligible in this context (see e.g. Kramida, 2024, for a comprehensive review on uncertainties of atomic spectral lines, while the NIST database can be consulted for complete references' list on the subject).
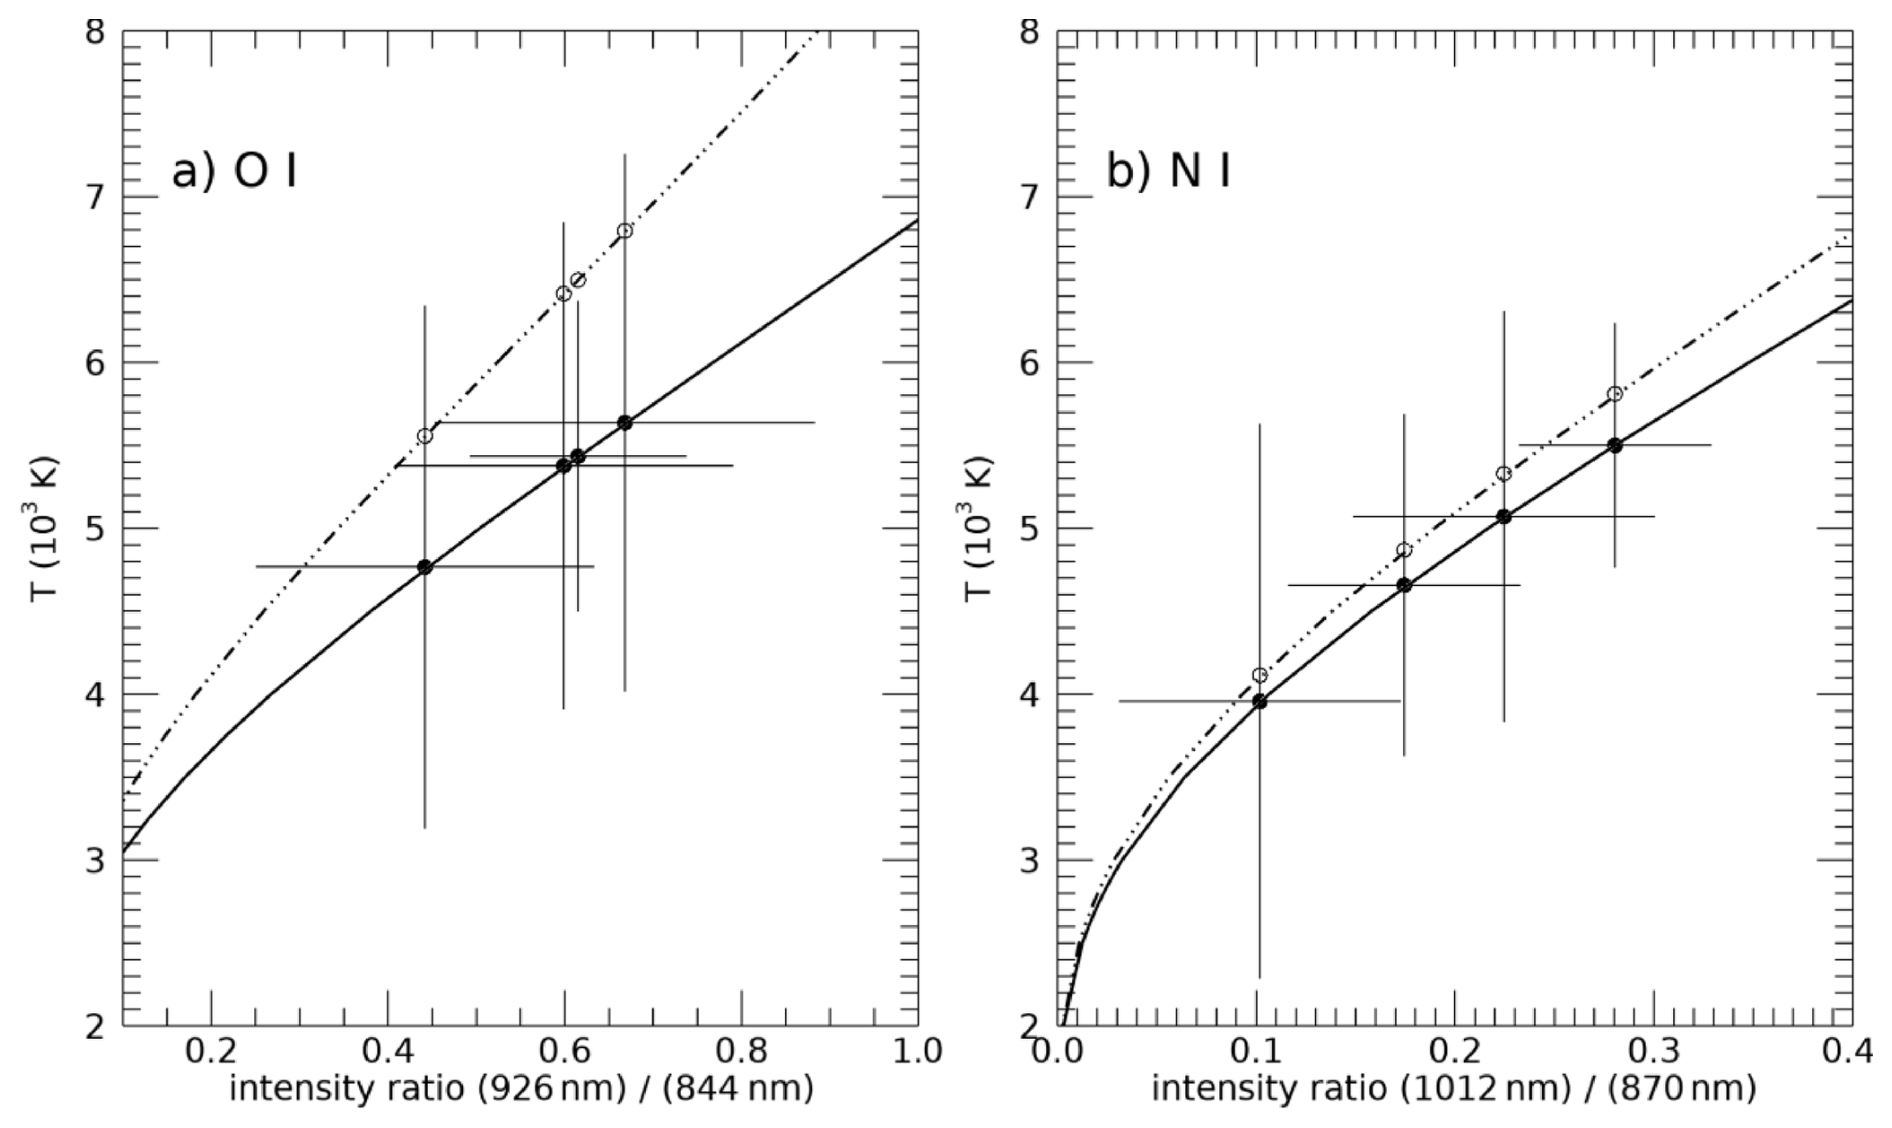
Figure 9Lightning channel temperatures for the 4 MAJIS flashes, retrieved from the ratios of lines 926 and 844 nm for oxygen (a) and 1012 and 870 nm for nitrogen (b). Solid points with error bars show the retrieved values accounting for the spectral filling factor correction, whose temperature values are reported in Table 6. White points on the dash-dotted curve refer to the uncorrected MAJIS radiance values.
Table 6Comparison of lightning temperatures retrieved with different methods. Values in the last column refer to a ratio of temporal filling factors .
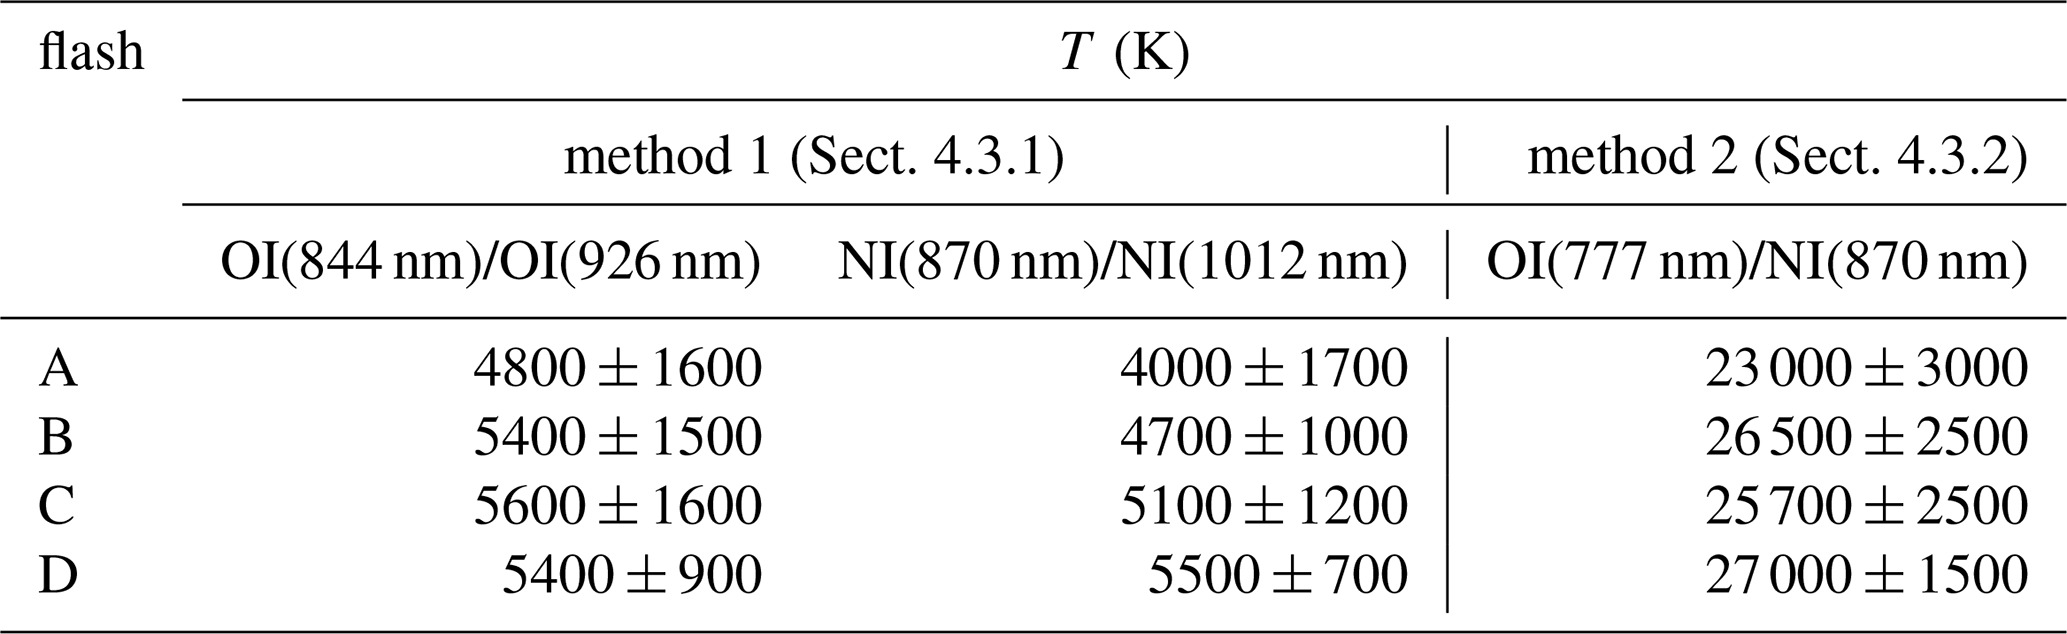
All the obtained temperatures are rather similar, given also the high uncertainty levels (∼20 %—30 %). Those retrieved from nitrogen (4800±1200 K on average) are systematically lower by a small amount (∼2 %–15 %, not statistically significant) than those from oxygen (5300±1400 K on average). In the same Fig. 9 the effect of spectral resolution is also shown (dash-dotted curve), revealing that the temperatures retrieved without correction are systematically higher. The effect is more pronounced in the oxygen case (usually characterized by narrower multiplets) where it amounts to ∼20 % (lower than 5 % for nitrogen), but still small with respect to uncertainties.
In any case, MAJIS observations suggest lightning channel temperatures of the order of 5000 K, on the lower edge of the range of temperatures for natural lightning reported in literature. For example, temperatures up to 15 000–25 000 K are found by Boggs et al. (2021) by using the ratio of oxygen lines at 777 and 716 nm (undetected by MAJIS). Temperatures up to 30 000 K were derived from observations of ionized nitrogen emissions (Orville, 1968), known to last for even shorter times at the beginning of a flash. Anyway, lightning channel temperature is related to its electrical current (Li et al., 2016), and colder events can occur on the top of the cloud, like streamer-like discharges and narrow bipolar events (Liu et al., 2021). Even if such events do not show evidence of emission at 777 nm, we cannot exclude that MAJIS observations encompassed different types of transient luminous events at different temperatures, further altering the ratios of observed line intensities.
A possible source of bias in our temperature estimation may be related to the uncertainty on the ratio of temporal filling factors in both oxygen and nitrogen cases. The inverse log dependence of the temperature on this ratio in Eq. (15) makes the retrieval very sensitive to this poorly constrained quantity. This sensitivity is represented in Fig. 10, where the large offset of temperatures resulting from rather small variation of can be appreciated for both oxygen and nitrogen cases.
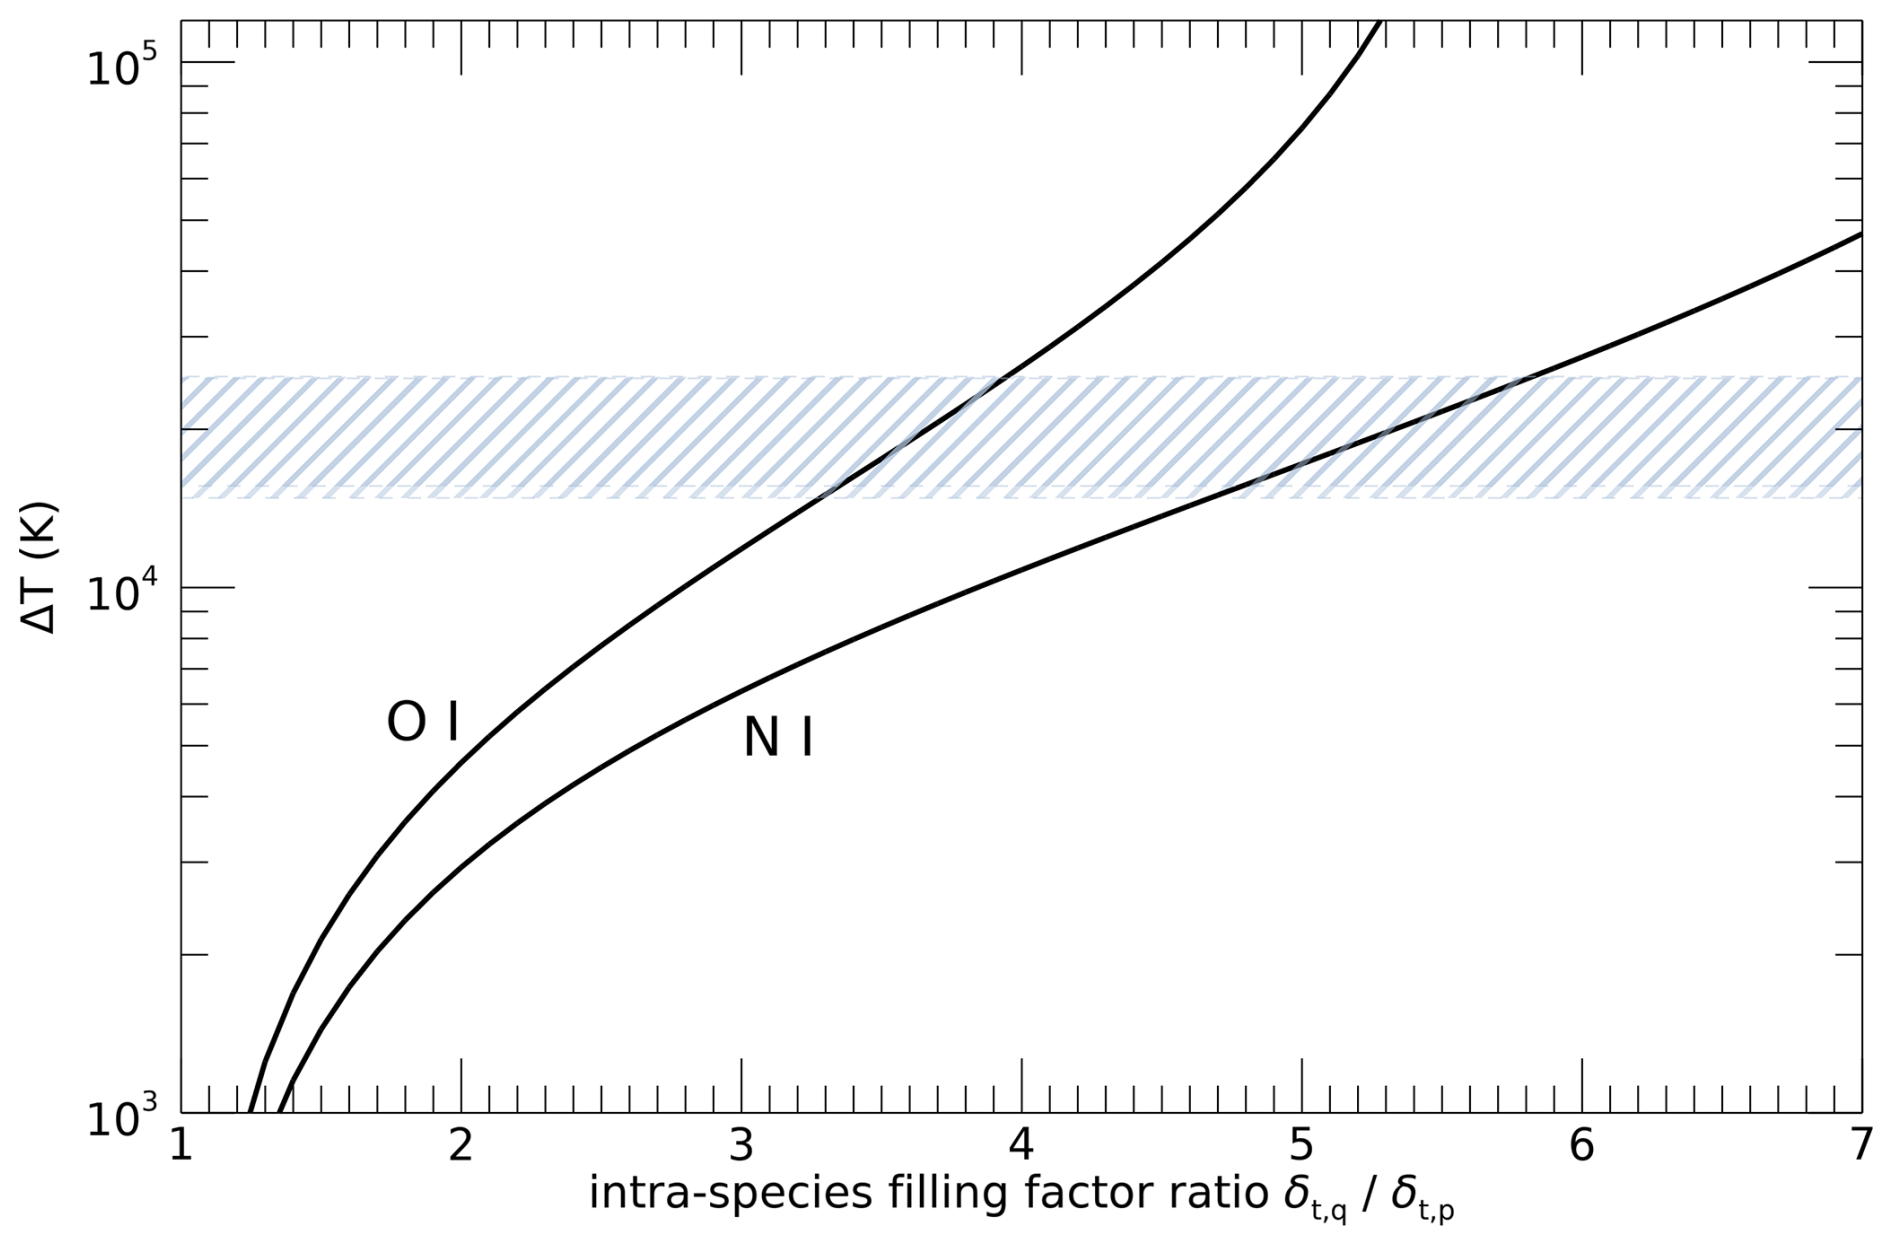
Figure 10Sensitivity of the temperature derived from Eq. (15) to the ratio of temporal filling factors, for both oxygen and nitrogen cases (same emission lines of Fig. 9). Y axis represents the offset of temperature with respect to the case . Line-filled area indicates the offset range needed to match the temperatures from method 2 (inter-species ratios, see Sect. 4.2.2).
4.3.2 Method 2: inter-species (oxygen to nitrogen) line ratios
Another way to infer lightning temperature involves modeling the intensity ratios of oxygen lines with respect to the nitrogen ones. In this case, the β factor in Eq. (1) does not cancel out, and the ratio of the number densities and partition function sums have to be treated explicitly. If we assign the j→i transition to an oxygen line (e.g. at 777 nm) and the m→n to a nitrogen line (e.g. 870 nm), we can keep the same notation of Eq. (15) and solve for the number density ratio to have:
In the Earth's atmosphere, atomic nitrogen and oxygen are dissociation products of molecular N2 and O2, the most abundant and stably mixed molecules. Further contribution to oxygen can also come from H2O dissociation. The ratio of atomic abundances can therefore be derived by evaluating the relative dissociation of these molecules at a given temperature. Including both O2 and water dissociation, we can write:
where and represent the molecular mixing ratios, while , , their dissociation energy. This equation provides a theoretical argument to be compared with the ratio derived from MAJIS observations in Eq. (16).
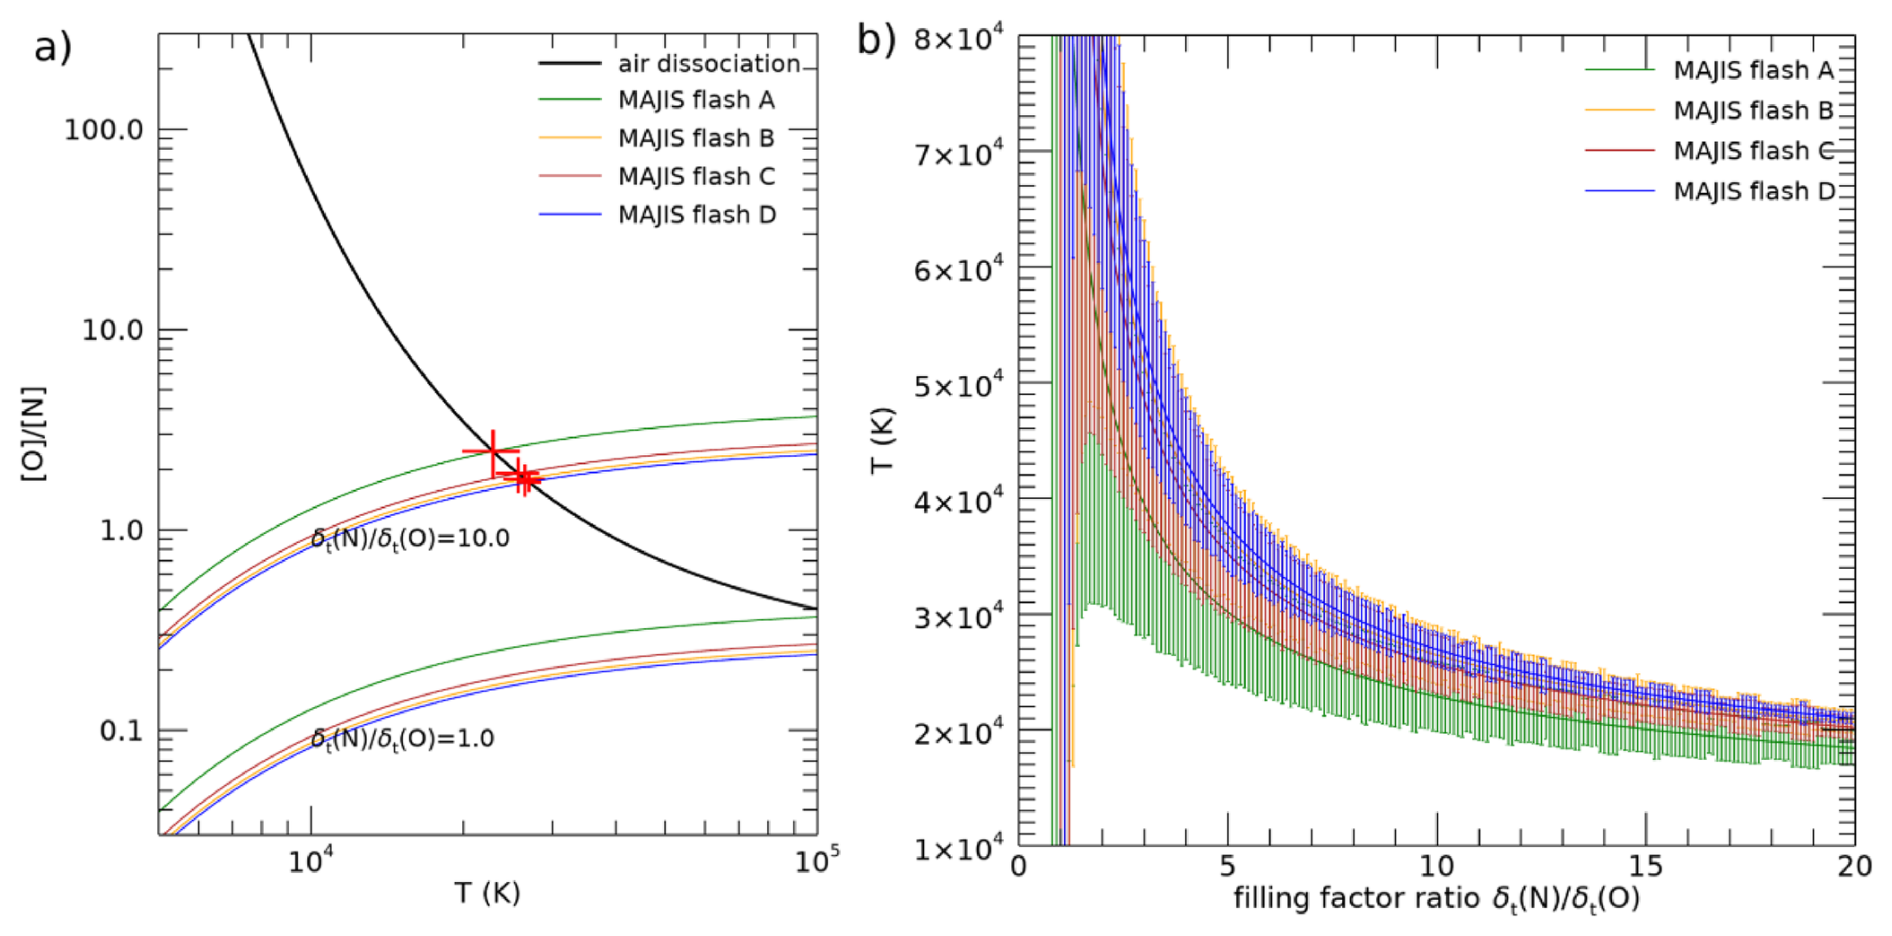
Figure 11Lightning temperature inferred from atomic density ratio. (a) the molecular dissociation model of Eq. (17) is shown as a black curve, while in colors are represented the families of curves inferred from MAJIS data with Eq. (16) with different ratio of temporal filling factors ). Red crosses indicate the solutions for the temperature, given by the curves' intersections. (b) Families of solution for temperature retrieved from MAJIS density ratios as a function of filling factor ratio.
By evaluating Eq. (17) with mixing ratios and (Cox, 2002) and dissociation energies kJ mol−1 (Frost and McDowell, 1956), kJ mol−1 (Wang et al., 2024), kJ mol−1 (Darwent, 1970) yields the black curve in Fig. 11a. This curve has to be compared with the ratio obtained through Eq. (16) by MAJIS data, shown in the same figure. In the calculation, a ratio of partition functions is assumed, constant in the temperature range of interest, while line parameters are still taken from the NIST database.
The intensity ratio in Eq. (16) implies the presence of the temporal filling factor ratio, , whose value cannot be easily constrained. If we let it as a free parameter, Eq. (16) provides a family of curves, as shown in Fig. 11a for two values of . Then, by solving for temperature (by equating Eqs. 16 and 17) we obtain a family of solutions for each flash detected, illustrated in Fig. 11b (error bars are derived from propagation of the MAJIS radiance uncertainties). We can see that, whatever is the value of , higher temperatures are retrieved, always larger than ∼20 000 K. By assuming an educated guess on decay times of ∼18 µs (from Kieu et al., 2020) and ∼140 µs (from Walker and Christian, 2019) for OI and NI respectively, we provide in Table 6 the temperature for a value .
4.3.3 Comparison between methods
It is evident that the two methods investigated do not agree with each other on the resulting lightning temperature. The ratio of temporal filling factors can play a key role in explaining such discrepancies since its values are poorly constrained and the results are quite sensitive to it. In both methods, line ratioing removes any dependence on the number of flashes encompassed by a single measurement. However, lines used in method 1 (of the same species) are of different intensity and are subject to the “line strength temporal bias” described in Sect. 3.5. Lines used in method 2 are instead of similar intensity (the strongest one for both oxygen and nitrogen) but affected by uncertainty of temporal filling factors ratio. Results of method 2 are somehow closer to those found in literature for peak temperatures of intra-cloud lightning (see Sect. 4.1), even if events generated by smaller electrical current are intrinsically colder (Liu et al., 2021). Average temperatures retrieved from ground observations of cloud to ground flashes are reported to lie around 17 600 K, in between the results from our two methods (Wemhoner et al., 2025). Actually, in order to assess which method is closer to the real temperatures, we should better understand the nature of the observed event and its unresolved characteristics (Sect. 4.4). In any case, we can note that, as stressed in Fig. 10, intra-species ratios of the order of 3.5 (for oxygen) and 5.5 (for nitrogen) would be sufficient to reconcile the results from method 1 to those of method 2.
4.4 Signatures of other species
Observations of ionized atomic emissions are often reported in the early phases of lightning processes, mainly due to N+, O+, N, O (Kieu et al., 2021). The best diagnostic features of these species fall at wavelengths shorter than those accessible by MAJIS, that might only cover their weaker lines taking place longwards of 500 nm.
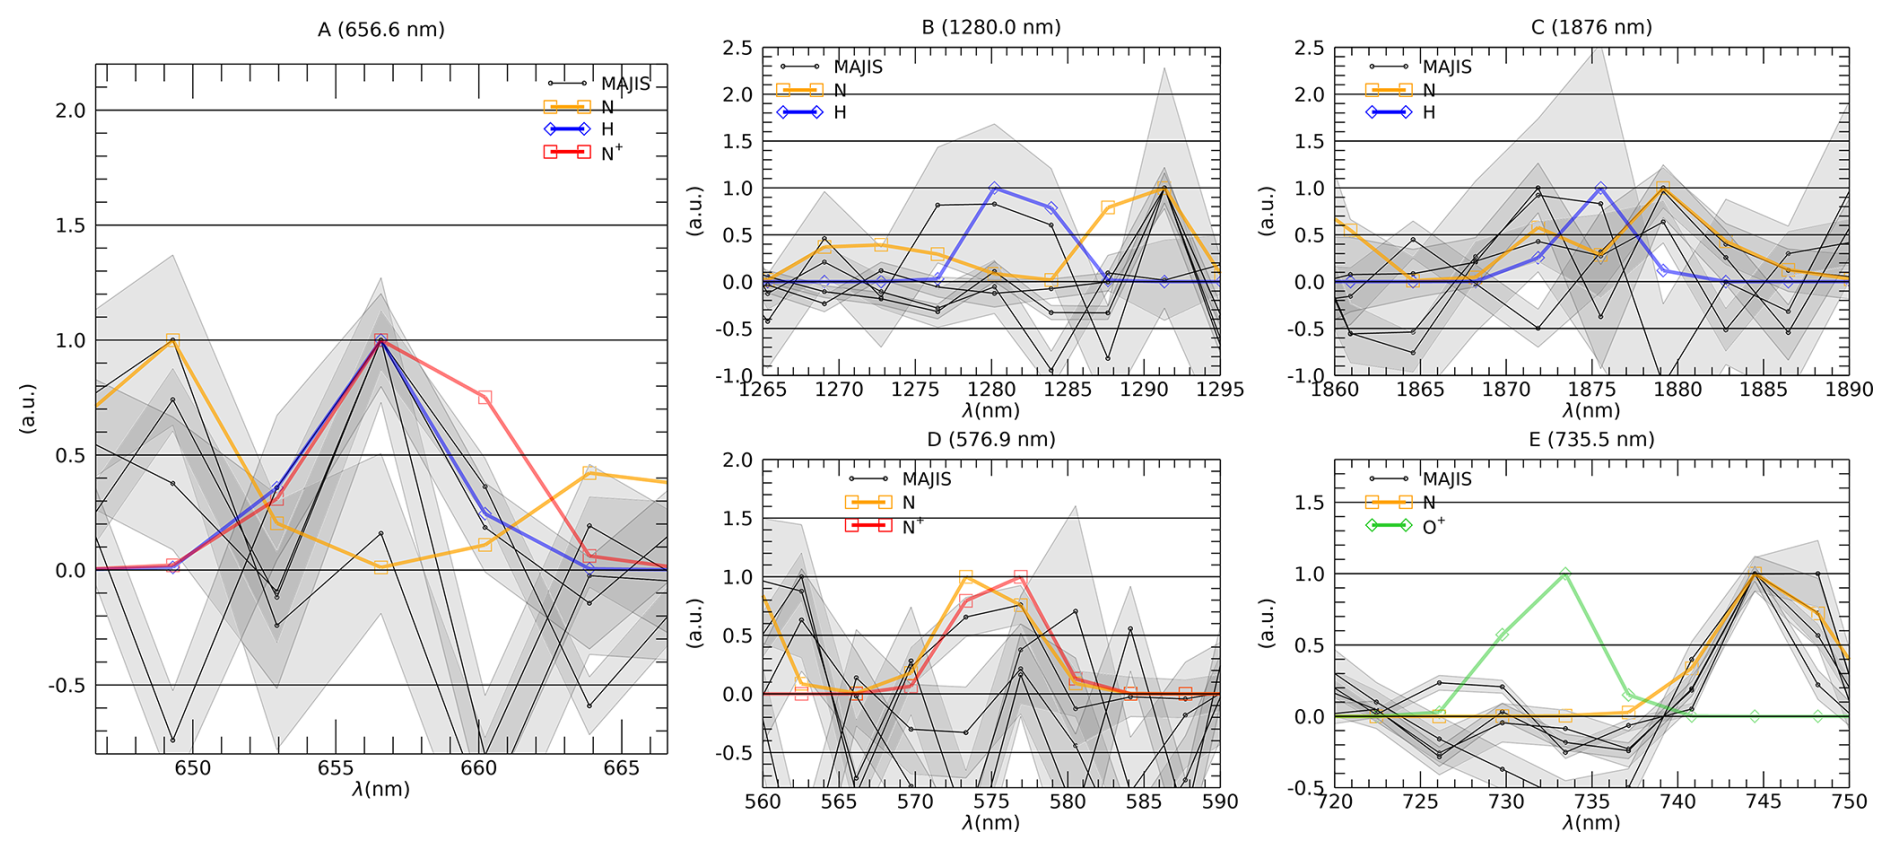
Figure 12Comparison of MAJIS spectral shapes (frame-averaged spectra) with modeled emissions at 6000 K in selected ranges. In order to highlight possible correlations in shape, all spectra are continuum-removed and normalized to unity in the shown spectral ranges. Positive correlation only in panel (A) for the 656.6 nm feature with either H and N+ emission.
The only significant signature present in almost all MAJIS spectra that is possibly not due to nitrogen or oxygen is found at 656.6 nm, as highlighted in Fig. 12a, where the four MAJIS lightning spectra are shown in black along with their uncertainties. This wavelength encompasses the Hα emission (656.3 nm, blue curve) which, besides being a minor component of non-LTE diffuse terrestrial exosphere emissions (e.g. Larigaldie et al., 1981), is also known to be produced in natural lightning flashes, where it can be efficiently exploited for measuring electron density (Uman and Orville, 1964). Furthermore, Hα intensity is enhanced in wet conditions (Yingying et al., 2025), and its presence can be useful for further discriminating low-altitude discharges from upper atmosphere events. The presence of other lines of the Balmer series might make the assignment of this line to hydrogen more robust, but unfortunately Hα is the only one falling within the MAJIS spectral range.
Moreover, N+ also emits at that wavelength, with a slightly different line width (red curve). Both species have other weaker lines at longer wavelengths, N+ at 575 nm and H at 1280 and 1876 nm, that can be used for discrimination. As shown in the other panels of Fig. 12, the level of noise prevents a clear detection, even if some of the MAJIS spectral shapes are slightly more correlated with H emissions rather than N+. Anyway, although the presence of a 656 nm peak is clear, observations are not conclusive on the nature of the emitter.
A search for other small signatures has been performed without success, as in the case of O+ shown in Fig. 12E.
In principle, MAJIS spectra in the thermal range cover several absorption bands of NOx molecules, whose production is known to be enhanced by lightning activity (so-called LNOx molecules, see e.g. Schumann and Huntrieser, 2007). Opacity of thunderclouds can strongly affect the retrieval of NOx (Beirle et al., 2019), but convection can transport NOx released near the surface to the upper troposphere, where it is mixed with freshly produced LNOx making detection from space possible. Even if MAJIS data may offer a further chance to check the LNOx production mechanism, their absorption bands in the IR are strongly overlapped with H2O ones, and even a qualitative analysis requires a complete modeling of atmospheric thermal emission which is beyond the purpose of the present work.
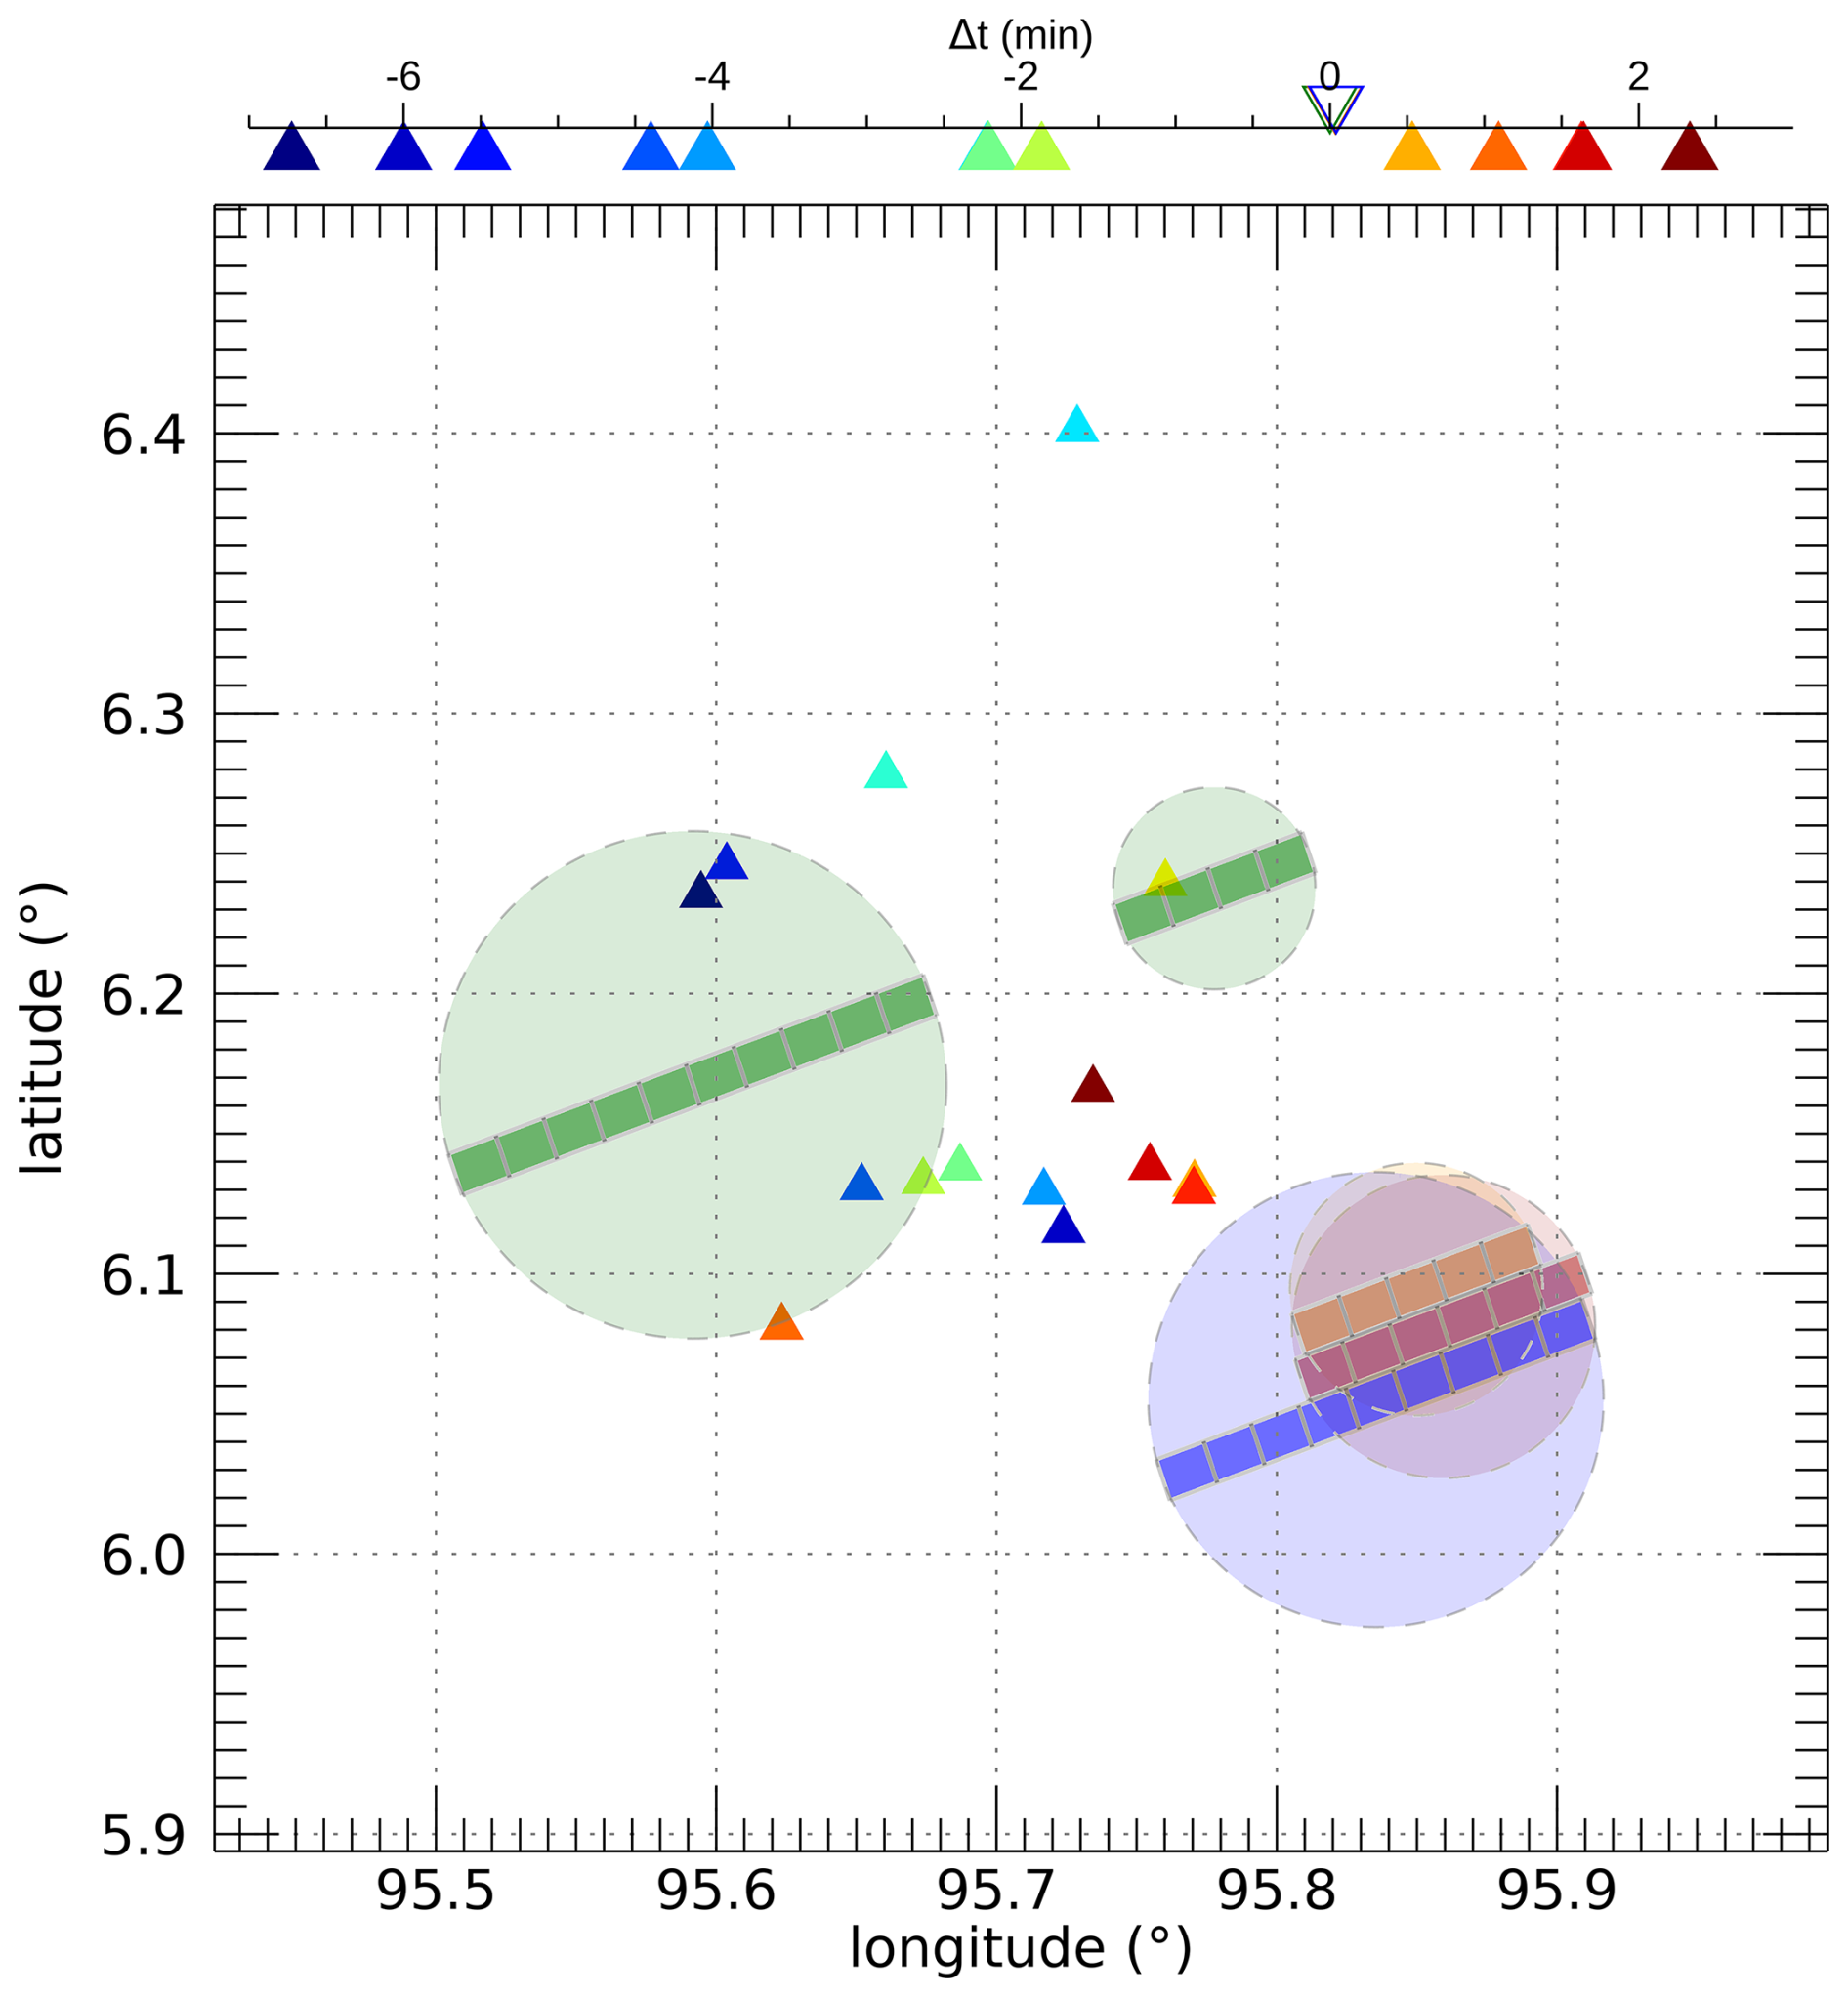
Figure 13Locations and timing of strokes detected by searched ground networks (triangles) with respect to MAJIS observations (shaded circles). Time differences of ground networks' strokes with respect to MAJIS are indicated in the upper axis.
4.5 Search for independent lightning detection
We have inspected the lists of detections provided by World Wide Lightning Location Network (WWLLN, Hutchins et al., 2012), the Earth Networks Total Lightning Network (ENTLN, Zhu et al., 2017) and the lightning system operated by the University of Hokkaido (Narita et al., 2018). As illustrated in Fig. 13, a sequence of ENTLN strokes is found in the proximity of the MAJIS detection, nevertheless within a few minutes before and after the MAJIS flashes, indicating an active lightning area. The location of some strokes fall within the area of the first MAJIS flash, but they took place ∼5 min before the MAJIS observation.
This negative result is not surprising, as all lightning location systems mentioned above are most sensitive to lightning return strokes. The return stroke lightning channels are several kilometers long and thus emit the electromagnetic signals in kHz frequencies, which can travel thousands of km in the waveguide formed by the surface of Earth and the bottom of the ionosphere. Such signals received at several network stations are used for the localization of lightning discharges by the time-of-flight method. The lightning events observed by MAJIS were clearly located at the cloud tops and could be associated with high-altitude in-cloud lightning phenomena as leaders, dart-leaders or streamer-like Compact Intracloud Discharges also called Narrow Bipolar Events (Petersen and Beasley, 2013; Kolmašová et al., 2023b, 2026; Nag and Rakov, 2010; Liu et al., 2021; see also Rakov et al., 2005, for an overview on different lightning phenomena). Unfortunately, the area of interest is not covered by any geostationary lightning imager, which could prove a lightning activity at the cloud tops.
Incidentally, it is worth noting that wavy structures possibly linked to thunderstorm events are observed in MAJIS images acquired during the same EGA campaign (see Oliva et al., 2026, this issue) and pointing to areas adjacent to that discussed in this work, further testifying to the existence of intense thunderstorm activity in the area observed by MAJIS during the EGA.
As accurately described in Hueso et al. (2026, this issue), lightning signatures have also been searched in the EGA dataset of JANUS (the multifilter camera of the JUICE scientific payload), without success (apart from a rather small flash, more than 2200 km far from MAJIS flashes, and probably too weak to be ascribed to lightning). JANUS acquired two images, 50 s apart, marginally covering the thunderstorm where MAJIS detects flashes (see Fig. 6 of Hueso et al., 2026) but, even if they are close in time to MAJIS (the second one only 2.1 s after MAJIS data), they did not cover the exact location of the MAJIS flashes, and cannot confirm their presence.
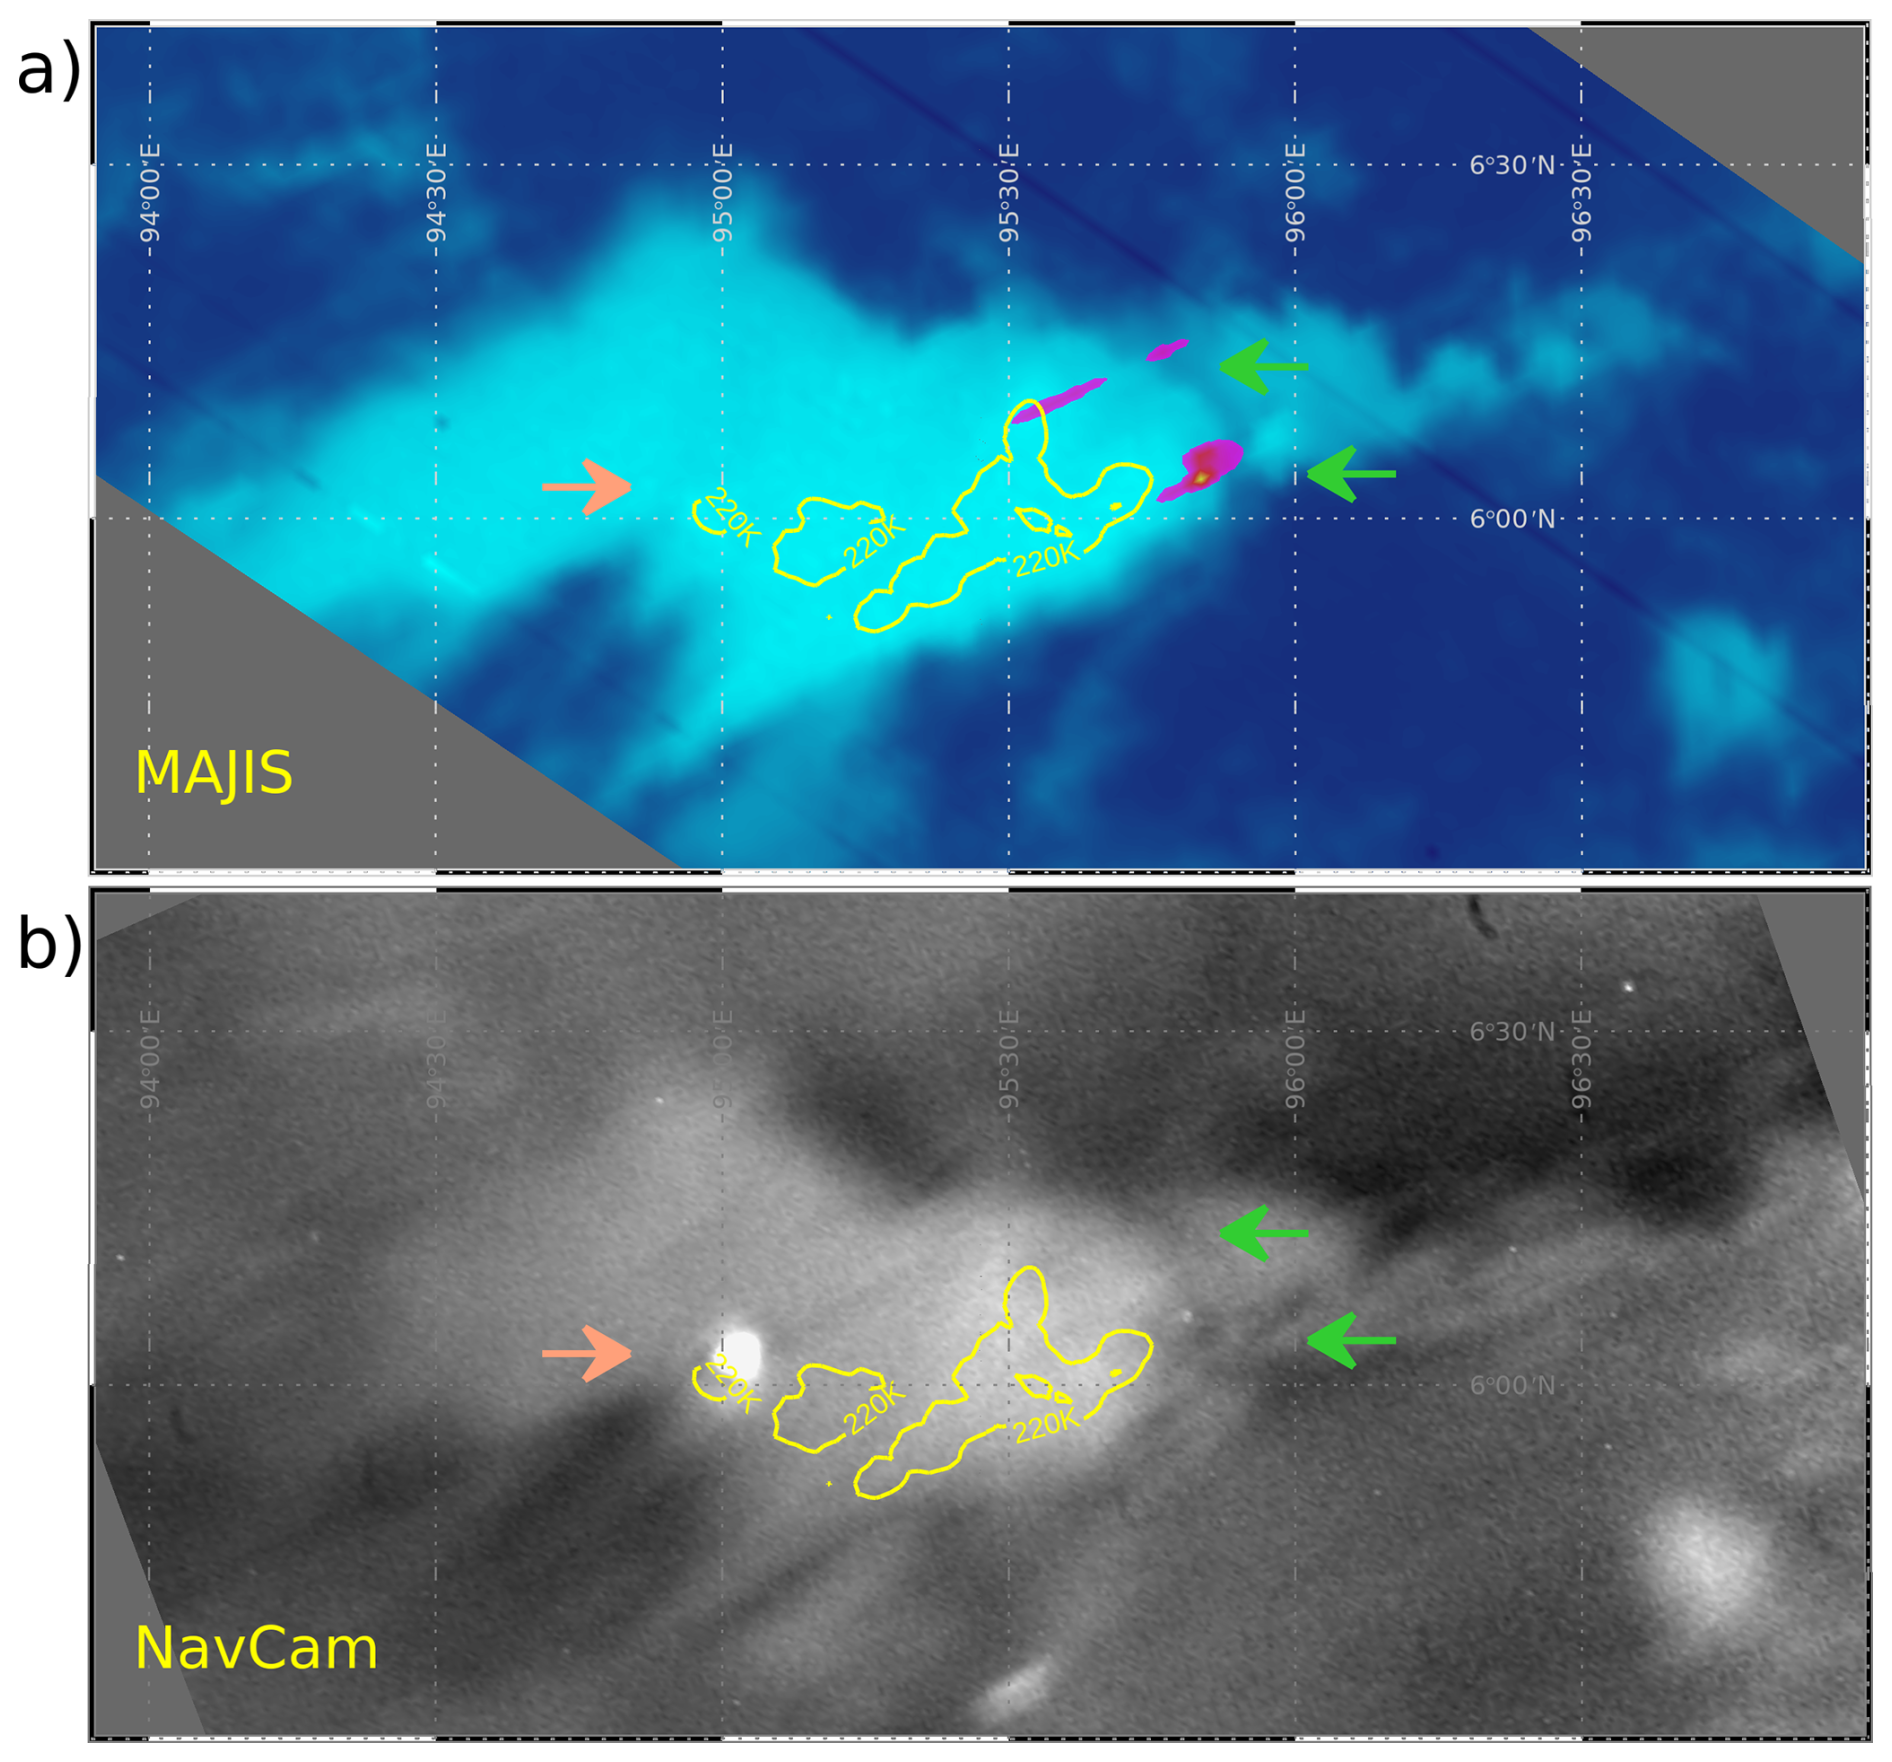
Figure 14The same cloud observed by MAJIS (a) and NavCam (b), showing lightning flashes separated by about 80 km. For helping reference, flashes' locations are indicated by arrows in both panels (in orange for NavCam detection, in green for MAJIS ones). Clouds contrast is provided by thermal emission in the MAJIS case (same as Fig. 3) and by reflected Moon-light in the NavCam case. In both panels the cloud regions with lowest MAJIS brightness temperatures (<220 K) are highlighted by yellow contours. The NavCam image has been taken about 19 s after the last MAJIS flash. (NavCam image credit: ESA/Juice/NavCam under ESA Standard Licence).
Nevertheless, an independent confirmation of the intense lightning activity occurring in the area of interest can be found in data of the navigation camera onboard JUICE spacecraft (NavCam, Gorog et al., 2019). An image covering the same region at nearly the same time (raw image 2E57C6B857BB00, starting 20 August 2024, 21:27:10.23 UTC with 2 s exposure) shows a clear detection of a lightning flash on exactly the same cloud as MAJIS, but on a different side (Fig. 14). While the MAJIS flashes can be put in the clouds context through the mapping of thermal emission, in the NavCam case the flash is seen as a very intense, slightly elliptical, light blob above clouds, which are seen in reflected moonlight. At the time of writing, calibrated NavCam products are not yet available, but we took advantage of the recognizable cloud shape to spatially co-registering the NavCam image to the MAJIS one. The linear spatial resolution of the NavCam data, dominated by motion smearing, is estimated at about 2.15 km per pixel, and the resulting flash diameter, between 23 and 30 km, is compatible with the flashes detected by MAJIS (Table 1). The NAVCAM image has been taken about 19 s after the last MAJIS flash and, on the other hand, the location of the NavCam flash (∼95° E, 6° N) has been covered by MAJIS about 21.5 s before NavCam. Hence no simultaneous detections were possible. Anyway, this observation certainly represents a confirmation of a high flashing rate taking place in that cloud.
The flash signal in the NavCam image is unfortunately saturated, so it cannot be used for quantitative energy analysis, even in the case the calibrated data had been available. Nevertheless, Fig. 14 shows that the detected flashes, in both MAJIS and NavCam cases, are close to the coldest regions of the cloud, where MAJIS registered brightness temperatures below 220 K, compatible with lateral light escape from areas of enhanced cloud top altitude due to local convection (see Fig. 4).
4.6 Extrapolation to lightning detection in Jupiter's atmosphere
This serendipitous observation during the very brief Earth flyby suggests that a similar opportunity could arise at Jupiter, one of the primary targets of the JUICE mission.
On Earth, the lightning flash rate is highly variable in space and time (e.g. Blakeslee et al., 2020). The Sumatra region is one of the areas where the flash rate is higher, quantifiable during summer in ∼30 flashes km−2 yr−1 (∼ 10−6 flashes km−2 s−1). This made the first cube of the EGA sequence the most likely to capture lightning. Taking into account the spatial and temporal coverages detailed in Sect. 2.1, this flash rate yields a probability of a lightning detection during this cube's acquisition of ∼0.6 ‰.
On Jupiter, lightning is also thought to be triggered by moist convective processes within water cloud layers, at pressure levels of a few bars. Galileo spacecraft recorded good statistics of optical flashes associated with lightning storms, with energy release estimated as high as ∼10 GJ (Little et al., 1999; Gierasch et al., 2000), while New Horizons spacecraft detected some lightning activity at polar latitudes as well (Baines et al., 2007). These optical observations, all relying on nightside imaging, suggested flash rates lower than on Earth, around 0.004 flashes km−2 yr−1, raised to ∼0.07 flashes km−2 yr−1 by Galileo probe dedicated analyses (Rinnert et al., 1998). However, more recent observations by Juno, based on microwave measurements, found on Jupiter a lightning rate comparable to Earth's one, ∼1–30 strokes km−2 yr−1 (Kolmašová et al., 2018). By considering a typical resolution of ∼150 km per pixel and an integration time of 0.1 s, these latter values translate to a probability of a lightning event in a single MAJIS pixel at Jupiter around 0.07 ‰–1 ‰. If the discrepancy in flash rate between optical and microwave observations is not sample-biased but is due to different atmospheric opacity, then the lower flash rates have to be assumed for MAJIS, lowering the detection probability per pixel to 10−6.
From the spectral point of view, since the composition of the Jovian atmosphere is very different from that of Earth, a possible detection of lightning should rely on totally different spectral signatures. To estimate the most likely emission lines detectable by MAJIS, we considered a unique gaseous layer with a standard Jovian atmosphere composition (populated by H2, He, H2O, CH4, NH3, Ne, H2S, Ar, Kr, Xe, with fixed mixing ratios 0.84, 0.16, , , , , , , respectively), then we evaluated the abundances of their dissociation products by using the simplified model of Eq. (17). Dissociation energies are set to the following values: D(O2)=498 kJ mol−1, D(H2)=431 kJ mol−1, D(CH4→H + CH3)=463.1 kJ mol−1, D(CH3→CH2+ H) =463.1 kJ mol−1, D(CH2→CH + H) = 422.6 kJ mol−1, D(CH→C + H) = 338.7 kJ mol−1, D(H2O) = 497.3 kJ mol−1 (Ruscic, 2015), D(NH3→NH2+H) = 3226 cm−1 (McCarthy et al., 1987), D(H2S→H2+ S) = 0.2 eV mol−1 (Gutsol et al., 2010). Finally the ratios of atomic abundances are used to estimate the relative intensities of potential lightning emission. Results of the calculation are shown in Table 7, for a lightning temperature of 1000 K.
Table 7Modeled ratios of line intensities for lightning emissions in Jupiter's atmosphere, relative to the Hα line, for a lightning temperature of 1000 K.
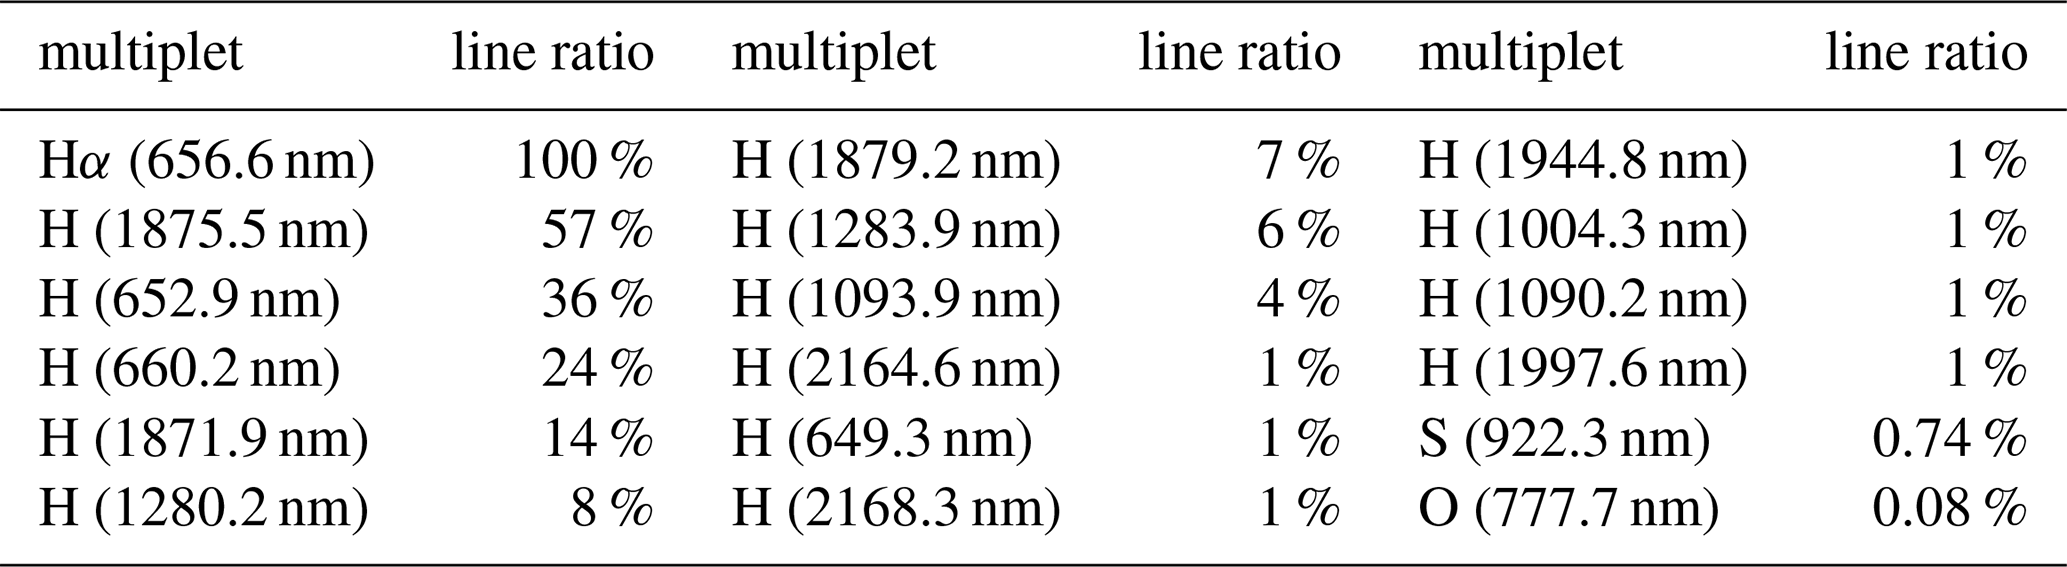
It is not surprising that hydrogen would dominate Jovian lightning spectra, being by far the most abundant species. The strongest line is the Hα, but several other hydrogen lines could reach a significant intensity. Most of the lightning energy (>60 % of the total) should escape through the 649–660 nm wavelength range, but a significant energy flux (∼30 %) may occur through the 1871–1879 nm window. Secondary but still possibly relevant ranges are 1280–1284 and 1090–1094 nm (∼5 % and ∼1 % of the total energy respectively).
The only other species reaching a comparable level of intensity within the MAJIS spectral range is sulphur, whose line at 922.3 nm could reach 1 % intensity of the Hα. All other atomic species are confined at lower intensities, starting from the oxygen line at 777 nm expected to reach a 0.08 % level.
For a more comprehensive simulation of the MAJIS signal from Jovian lightning, both instrumental response and scattering/absorbing spectral properties of overlying cloud layers have to be taken into account. For instance, the instrumental NESR derived by background fluctuations (see Fig. 2b) can be slightly larger near 650 nm than near 1870 nm, partially compensating the relative detection probability mentioned above. On the other hand, emission lines located inside strong methane absorption bands may have an enhanced detection probability due to reduced scattered light, increasing their visibility on the planet's dayside as well, as recently reported by JunoCam analyses (Fletcher et al., 2026). The full setting of instrumental parameters will be also crucial for optimizing both the probability of detection and interpretation of lightning events, and will be better assessed in future planning. Also, a quantitative estimation of SNR requirements, that would require more complex models to calculate the absolute abundances of potential emitters, is beyond the purpose of this work.
In case of detection, lightning temperature retrievals in Jupiter's case should rely solely on method 1 (Sect. 4.2.1), being signatures of species other than hydrogen unlikely. In this context, the coverage of both 650 and 1870 nm spectral ranges is effective for constraining temperature, as they probe a suitable variety of electronic level populations. However, issues related to spatially and temporally unresolved measurements will hold also in the jovian case, and a more accurate de-biasing, based on detailed models of atmospheric and instrumental processes, will be desirable.
The data acquired by MAJIS during the JUICE Earth Gravity Assist maneuver on 20 August 2024 revealed a serendipitous detection of lightning emissions, taking place at nighttime near Sumatra island. The detection consists of a few spectra in the visible range showing emission lines diagnostic of neutral atomic oxygen and nitrogen. Oxygen is clearly identified by the 777 nm line, routinely used in monitoring lightning activity by satellite, whereas nitrogen strongest emissions take place at 870 and 822 nm. An emission is also found at 656.6 nm, even though we cannot conclusively discriminate between contributions by H or N+. The observed four flashes can be localized near the edge of a thick thunderstorm cloud, but we did not find any independent detection of the same events neither by ground-based lightning networks nor by satellites.
Although the characteristics of MAJIS observations are not optimal for measuring such extreme phenomena, we attempt to model the MAJIS emission spectra in order to retrieve as much physical information as possible. In particular, MAJIS could not resolve the lightning flash features neither spectrally nor temporally, raising the need for specific corrections to the standard calibrated spectral radiance values, quantified where possible through spectral and temporal filling factors. Under these assumptions, we estimate the flashes emitted through the 777 nm oxygen line an energy of 140–700 kJ, and up to 1.3 MJ for the event considered as a whole.
The relative intensity of emission lines is a well-known proxy for measuring the temperature of the lightning channel. We attempt to apply this method to both ratios of oxygen lines and nitrogen lines, but the obtained temperatures, ranging between 4000 and 5600 K, with uncertainties of the order of 30 %, appear well below the peak temperatures of intra-cloud lightning reported in literature (20 000–35 000 K), but compatible with colder phenomena like streamer-like discharges and narrow bipolar events (Liu et al., 2021).
An alternative approach for temperature retrieval from ratios of oxygen to nitrogen lines has also been attempted. In this case much higher values are retrieved, around 23 000–27 000 K, closer to the highest peak temperature values. Both methods can yield temperatures biased by our incomplete knowledge of the temporal trend of individual lines within the lightning flashes. A more robust assessment in this regard is not possible without independent knowledge of the nature and unresolved characteristics of the event, since the MAJIS observation could have registered different types of transient luminous events occurring in short times at different temperatures.
The EGA data here discussed represent the first ones acquired by MAJIS on a planetary target. From this point of view, the analysis demonstrates the valuable performances of the instrument also on an unexpected finding. This is also true in the case of Jupiter's atmosphere, a primary target of the JUICE mission. Considering also that Jupiter's atmosphere is thought to host a high-energy lightning rate as high as on Earth (Kolmašová et al., 2018; Wong et al., 2026), repeated MAJIS observations of the Jovian night hemisphere have a non-zero chance to capture lightning flash spectra. Hence, this work is also intended to help planning and analysis of future Jupiter observations. In that case, several synergistic approaches with other JUICE instruments can be envisaged, like UVS for detecting shorter-wavelength emission lines, JANUS for higher spatial resolution context images, or RPWI for coincident radio signals. Even if the likelihood of simultaneous observations of the same event will decrease proportionally to the number of observing constraints to be satisfied, a comparison of events on a statistical basis at global scale could be achieved.
The MAJIS data acquired during the JUICE Moon–Earth flyby in August 2024 are currently under the mission's cruise-phase proprietary period. These data will be made available through the ESA Planetary Science Archive following the first Cruise Archive Delivery, which is currently scheduled for six months after Earth Gravity Assist #3 in 2029.
Simple scripts have been developed for data management and processing and for the implementation of the models described to MAJIS data. The codes will not be published but can be shared upon private request to the corresponding author.
ED carried out lightning data identification and processing, ED and FO developed data analysis, interpretation, and manuscript preparation, with significant contributions by FP, GP, AM, LF, BS. IK performed ground-based lightning counterparts search, BS provided NavCam flash detection, while FP, GP, YL, GF, SR, BS provided calibrated MAJIS data. All coauthors contributed to the discussion of results.
The contact author has declared that none of the authors has any competing interests.
Publisher's note: Copernicus Publications remains neutral with regard to jurisdictional claims made in the text, published maps, institutional affiliations, or any other geographical representation in this paper. The authors bear the ultimate responsibility for providing appropriate place names. Views expressed in the text are those of the authors and do not necessarily reflect the views of the publisher.
This article is part of the special issue “The first-ever lunar–Earth flyby: a unique test environment for Juice”. It is not associated with a conference.
The authors want to thank Thomas Cornet and the whole team at ESA Science Operation Centre for providing NavCam data and managing Juice mission operations. JUICE is a mission under ESA leadership with contributions from its Member States, NASA, JAXA and the Israel Space Agency. It is the first Large-class mission in ESA’s Cosmic Vision programme. NavCam instrument has been provided through an ESA Contract with Airbus.
The Italian participation in the JUICE mission is funded by the Italian Space Agency (ASI). In particular, this work has been developed under the ASI-INAF agreement no. 2023-6-HH.0. The work of IK was supported by the GACR Grant 24-11336S. The authors acknowledge financial support from the Centre national d'études spatiales (CNES), France (ROR: https://ror.org/04h1h0y33, last access: 4 June 2026), within the framework of the JUICE space mission.
This paper was edited by Stephanie C. Werner and reviewed by two anonymous referees.
Acton, C., Bachman, N., Semenov, B., and Wright, E.: A look towards the future in the handling of space science mission geometry, Planet. Space Sci., 150, 9–12, https://doi.org/10.1016/j.pss.2017.02.013, 2018.
Acton Jr., C. H.: Ancillary data services of NASA's Navigation and Ancillary Information Facility, Planet. Space Sci., 44, 65–70, https://doi.org/10.1016/0032-0633(95)00107-7, 1996.
Aplin, K. L. and Fischer, G.: Lightning detection in planetary atmospheres, Weather, 72, 46–50, https://doi.org/10.1002/wea.2817, 2017.
Bai, X., Füllekrug, M., Chanrion, O., Soula, S., Peverell, A., Mashao, D., Kosch, M., Husbjerg, L., Østgaard, N., Neubert, T., and Reglero, V.: Height determination of a blue discharge observed by ASIM/MMIA on the International Space Station, J. Geophys. Res.-Atmos., 128, e2022JD037460, https://doi.org/10.1029/2022jd037460, 2023.
Baines, K. H., Simon-Miller, A. A., Orton, G. S., Weaver, H. A., Lunsford, A., Momary, T. W., Spencer, J., Cheng, A. F., Reuter, D. C., Jennings, D. E., Gladstone, G. R., Moore, J., Stern, S. A., Young, L. A., Throop, H., Yanamandra-Fisher, P., Fisher, B. M., Hora, J., and Ressler, M. E.: Polar Lightning and Decadal-Scale Cloud Variability on Jupiter, Science, 318, 226–229, https://doi.org/10.1126/science.1147912, 2007.
Barnes, D. E., Splitt, M. E., Dwyer, J. R., Lazarus, S., Smith, D. M., and Rassoul, H. K.: A study of thunderstorm microphysical properties and lightning flash counts associated with terrestrial gamma-ray flashes, J. Geophys. Res.-Atmos., 120, 3453–3464, https://doi.org/10.1002/2014jd021495, 2015.
Barvir, P., Kubes, P., Krawarik, J., Scholz, M., Karpinski, L., Sadowska-Skladnik, E., and Malinowski, K.: Research of the discharge with parameters of lightning channel, Czechoslovak Journal of Physics, 54, C274–C278, https://doi.org/10.1007/bf03166412, 2004.
Becker, H. N., Alexander, J. W., Atreya, S. K., Bolton, S. J., Brennan, M. J., Brown, S. T., Guillaume, A., Guillot, T., Ingersoll, A. P., Levin, S. M., Lunine, J. I., Aglyamov, Y. S., and Steffes, P. G.: Small lightning flashes from shallow electrical storms on Jupiter, Nature, 584, 55–58, https://doi.org/10.1038/s41586-020-2532-1, 2020.
Beirle, S., Borger, C., Dörner, S., Li, A., Hu, Z., Liu, F., Wang, Y., and Wagner, T.: Pinpointing nitrogen oxide emissions from space, Sci. Adv., 5, eaax9800, https://doi.org/10.1126/sciadv.aax9800, 2019.
Bjørge-Engeland, I., Østgaard, N., Marisaldi, M., Luque, A., Mezentsev, A., Lehtinen, N., Chanrion, O., Fuglestad, A. N., Neubert, T., and Gordillo-Vazquez, F. J.: High peak current lightning and the production of elves. J. Geophys. Res.-Atmos., 129, https://doi.org/10.1029/2023jd039849, 2024.
Blakeslee, R. J., Lang, T. J., Koshak, W. J., Buechler, D., Gatlin, P., Mach, D. M., Stano, G. T., Virts, K. S., Walker, T. D., Cecil, D. J., Ellett, W., Goodman, S. J., Harrison, S., Hawkins, D. L., Heumesser, M., Lin, H., Maskey, M., Schultz, C. J., Stewart, M., Bateman, M., Chanrion, O., and Christian, H.: Three years of the lightning imaging sensor onboard the international space station: Expanded global coverage and enhanced applications, J. Geophys. Res.-Atmos., 125, https://doi.org/10.1029/2020jd032918, 2020.
Boccippio, D. J., Cummins, K. L., Christian, H. J., and Goodman, S. J.: Combined satellite- and surface-based estimation of the intracloud–cloud-to-ground lightning ratio over the continental United States, Mon. Weather Rev., 129, 108–122, https://doi.org/10.1175/1520-0493(2001)129<0108:csasbe>2.0.co;2, 2001.
Boggs, L. D., Liu, N., Nag, A., Walker, T. D., Christian, H. J., da Silva, C. L., Austin, M., Aguirre, F., and Rassoul, H. K.: Vertical temperature profile of natural lightning return strokes derived from optical spectra, J. Geophys. Res.-Atmos., 126, e2020JD034438, https://doi.org/10.1029/2020jd034438, 2021.
Brown, S., Janssen, M., Adumitroaie, V., Atreya, S., Bolton, S., Gulkis, S., Ingersoll, A., Levin, S., Li, C., Li, L., Lunine, J., Misra, S., Orton, G., Steffes, P., Tabataba-Vakili, F., Kolmašová, I., Imai, M., Santolík, O., Kurth, W., Hospodarsky, G., Gurnett, D., and Connerney, J.: Prevalent lightning sferics at 600 megahertz near Jupiter's poles, Nature, 558, 87–90, https://doi.org/10.1038/s41586-018-0156-5, 2018.
Cardesín Moinelo, A., Abildgaard, S., García Muñoz, A., Piccioni, G., and Grassi, D.: No statistical evidence of lightning in Venus night-side atmosphere from VIRTIS-Venus Express Visible observations, Icarus, 277, 395–400, https://doi.org/10.1016/j.icarus.2016.05.027, 2016.
Carvalho, F. L., Uman, M. A., Jordan, D. M., Wilkes, R. A., and Kotovsky, D. A.: Triggered lightning return stroke luminosity up to 1 km in two optical bands, J. Geophys. Res.-Atmos., 123, 9724–9740, https://doi.org/10.1029/2018jd028644, 2018.
Cecil, D. J., Buechler, D. E., and Blakeslee, R. J.: Gridded lightning climatology from TRMM-LIS and OTD: Dataset description, Atmos. Res., 135–136, 404–414, https://doi.org/10.1016/j.atmosres.2012.06.028, 2014.
Christian, H. J. and Goodman, S. J.: Optical observations of lightning from a high-altitude airplane, J. Atmos. Ocean. Tech., 4, 701–711, https://doi.org/10.1175/1520-0426(1987)004<0701:ooolfa>2.0.co;2, 1987.
Christian, H. J., Blakeslee, R. J., Boccippio, D. J., Boeck, W. L., Buechler, D. E., Driscoll, K. T., Goodman, S. J., Hall, J. M., Koshak, W. J., Mach, D. M., and Stewart, M. F.: Global frequency and distribution of lightning as observed from space by the Optical Transient Detector, J. Geophys. Res.-Atmos., 108, https://doi.org/10.1029/2002jd002347, 2003.
Cox, A. N. (Ed.): 11. Earth, Allen's Astrophysical Quantities, 4th edn., Springer New York, New York, NY, https://doi.org/10.1007/978-1-4612-1186-0, ISBN 978-1-4612-7037-9, 2002.
Darwent, B. de B.: Bond Dissociation Energies in Simple Molecules. U.S. National Bureau of Standards, NSRDS-NBS 31, Washington, DC, LCCN 70602101, https://lccn.loc.gov/70602101 (last access: 17 February 2025), 1970.
Dyudina, U., Delgenio, A., Ingersoll, A., Porco, C., West, R., Vasavada, A., and Barbara, J.: Lightning on Jupiter observed in the line by the Cassini imaging science subsystem, Icarus, 172, 24–36, https://doi.org/10.1016/j.icarus.2004.07.014, 2004.
ESA SPICE Service: JUICE Operational SPICE Kernel Dataset, Cosmos Portal [data set], https://doi.org/10.5270/esa-ybmj68p, 2019.
Filacchione, G., Haffoud, P., Poulet, F., Piccioni, G., Langevin, Y., Tommasi, L., Barbis, A., Carter, J., Guerri, I., Dumesnil, C., De Angelis, S., Vincendon, M., Stefani, S., Pilorget, C., Tosi, F., and Rodriguez, S.: Calibration of MAJIS (Moons And Jupiter Imaging Spectrometer). II. Spatial calibration, Rev. Sci. Instrum., 95, 041301, https://doi.org/10.1063/5.0203872, 2024.
Fischer, G., Desch, M., Zarka, P., Kaiser, M., Gurnett, D., Kurth, W., MacHer, W., Rucker, H., Lecacheux, A., and Farrell, W.: Saturn lightning recorded by Cassini/RPWS in 2004, Icarus, 183, 135–152, https://doi.org/10.1016/j.icarus.2006.02.010, 2006.
Fletcher, L. N., Zhang, Z., Brown, S., Oyafuso, F. A., Rogers, J. H., Wong, M. H., Mura, A., Eichstädt, G., Orton, G. S., Brueshaber, S., Sankar, R., Li, C., Levin, S. M., Biagiotti, F., Guillot, T., Ingersoll, A. P., Grassi, D., Hansen, C. J., Bolton, S., and Waite, J. H.: Structure of Jupiter's high-latitude storms: Folded filamentary regions revealed by Juno, J. Geophys. Res.-Planets, 131, e2025JE009315, https://doi.org/10.1029/2025JE009315, 2026.
Franzblau, E. and Popp, C. J.: Nitrogen oxides produced from lightning. J. Geophys. Res.-Atmos., 94, 11089–11104, https://doi.org/10.1029/jd094id08p11089, 1989.
Frost, D. C. and McDowell, C. A.: The dissociation energy of the nitrogen molecule, Proc. A, 236 , 278–284, https://doi.org/10.1098/rspa.1956.0135, 1956.
Gierasch, P., Ingersoll, A., Banfield, D., Ewald, S. P., Helfenstein, P., Simon-Miller, A., Vasavada, A., Breneman, H. H., Senske, D. A., and Galileo Imaging Team: Observation of moist convection in Jupiter's atmosphere, Nature, 403, 628–630, https://doi.org/10.1038/35001017, 2000.
Giles, R. S., Greathouse, T. K., Bonfond, B., Gladstone, G. R., Kammer, J. A., Hue, V., Grodent, D. C., Gérard, J., Versteeg, M. H., Wong, M. H., Bolton, S. J., Connerney, J. E. P., and Levin, S. M.: Possible transient luminous events observed in Jupiter's upper atmosphere, J. Geophys. Res.-Planets, 125, e2020JE006659, https://doi.org/10.1029/2020je006659, 2020.
Gjesteland, T., Østgaard, N., Bitzer, P., and Christian, H. J.: On the timing between terrestrial gamma ray flashes, radio atmospherics, and optical lightning emission, J. Geophys. Res.-Space Phys., 122, 7734–7741, https://doi.org/10.1002/2017ja024285, 2017.
Goodman, S. J., Blakeslee, R. J., Koshak, W. J., Mach, D., Bailey, J., Buechler, D., Carey, L., Schultz, C., Bateman, M., McCaul Jr., E., and Stano, G.: The GOES-R Geostationary Lightning Mapper (GLM), Atmos. Res., 125–126, 34–49, https://doi.org/10.1016/j.atmosres.2013.01.006, 2013.
Gordillo-Vázquez, F. J. and Pérez-Invernón, F. J.: A review of the impact of transient luminous events on the atmospheric chemistry: Past, present, and future, Atmos. Res., 252, 105432, https://doi.org/10.1016/j.atmosres.2020.105432, 2021.
Gorog, F., Arnolfo, M.-C., Belmana, S., Dervaux, S., and Gherardi, D.: JUICE navigation camera design, Proc. SPIE 11180, International Conference on Space Optics – ICSO 2018, 111804N (12 July 2019), https://doi.org/10.1117/12.2536086, 2019.
Gosse, L., Favre, A., Bultel, A., Morel, V., Djurović, S., Simić, N., and Gavanski, L.: In-depth Stark broadening study of neutral oxygen 777 nm triplet, Spectrochim. Acta Part B, 230, 107222, https://doi.org/10.1016/j.sab.2025.107222, 2025.
Gurnett, D. A., Shaw, R. R., Anderson, R. R., Kurth, W. S., and Scarf, F. L.: Whistlers observed by Voyager 1: Detection of lightning on Jupiter, Geophys. Res. Lett., 6, 511–514, https://doi.org/10.1029/gl006i006p00511, 1979.
Gurnett, D. A., Kurth, W. S., Cairns, I. H., and Granroth, L. J.: Whistlers in Neptune's magnetosphere: Evidence of atmospheric lightning, J. Geophys. Res.-Space Phys., 95, 20967–20976, https://doi.org/10.1029/ja095ia12p20967, 1990.
Gutsol, K., Nunnally, T., Rabinovich, A., Fridman, A., Starikovsky, A., Gutsol, A., and Potter, R. W.: Mechanisms of non-equilibrium dissociation of hydrogen sulfide in low-temperature plasma, 2010 Abstracts IEEE International Conference on Plasma Science, Norfolk, VA, USA, 2010, 1, https://doi.org/10.1109/plasma.2010.5534017, 2010.
Haffoud, P., Poulet, F., Vincendon, M., Filacchione, G., Barbis, A., Guiot, P., Lecomte, B., Langevin, Y., Piccioni, G., Dumesnil, C., Rodriguez, S., Carter, J., Stefania, S., Tommasi, L., Tosi, F., and Pilorget, C.: Calibration of MAJIS (Moons And Jupiter Imaging Spectrometer). III. Spectral calibration, Rev. Sci. Instrum., 95, https://doi.org/10.1063/5.0188944, 2024.
Hueso, R., Antuñano, A., Lara, L. M., Stephan, K., Zinzi, A., Coustenis, A., Yair, Y., Sato, M., Haruyama, J., Simon, A., Tubiana, C., Penasa, L., Agostini, L., Luchetti, A., Aboudan, A., Aye, M., Kersten, E., Matz, K.-D., Politti, R., Trauthan, F., Evill, R., Belgacem, I., Yukihiro, T., Castro-Marín, J. M., Della Corte, V., Hviid, S., Roatsch, T., Schmitz, N., Patel, M., Portyankina, G., and Palumbo, P.: JUICE-JANUS observations of Earth in preparation for the JANUS investigation of Jupiter’s atmosphere, EGUsphere [preprint], https://doi.org/10.5194/egusphere-2026-710, 2026.
Hutchins, M. L., Holzworth, R. H., Rodger, C. J., and Brundell, J. B.: Far-field power of lightning strokes as measured by the World Wide Lightning Location Network, J. Atmos. Ocean. Tech., 29, 1102–1110, https://doi.org/10.1175/jtech-d-11-00174.1, 2012.
Ievenko, I. B., Parnikov, S. G., and Alekseev, V. N.: Variations of the Nightglow 557.7 nm Emission Intensity during Solar Cycle 23, Geomag. Aeron, 59, 738–742, https://doi.org/10.1134/s0016793219050050, 2019.
Imai, M., Kolmašová, I., Kurth, W. S., Santolík, O., Hospodarsky, G. B., Gurnett, D. A., Brown, S. T., Bolton, S. J., Connerney, J. E. P., and Levin, S. M.: Evidence for low density holes in Jupiter's ionosphere, Nat. Commun., 10, https://doi.org/10.1038/s41467-019-10708-w, 2019.
Jadhav, D. B., Londhe, A. L., and Bose, S.: Observations of NO2 and O3 during thunderstorm activity using visible spectroscopy, Adv. Atmos. Sci., 13, 359–374, https://doi.org/10.1007/bf02656853, 1996.
Joule, J. P.: Spectrum of lightning. Nature, 6, 161, https://doi.org/10.1038/006161b0, 1872.
Kieu, N., Gordillo-Vázquez, F. J., Passas, M., Sánchez, J., Pérez-Invernón, F. J., Luque, A., Montanyá, J., and Christian, H.: Submicrosecond spectroscopy of lightning-like discharges: Exploring new time regimes, Geophys. Res. Lett., 47, https://doi.org/10.1029/2020gl088755, 2020.
Kieu, N., Gordillo-Vázquez, F. J., Passas, M., Sánchez, J., and Pérez-Invernón, F. J.: High-speed spectroscopy of lightning-like discharges: Evidence of molecular optical emissions, J. Geophys. Res.-Atmos., 126, https://doi.org/10.1029/2021jd035016, 2021.
Köhn, C., Heumesser, M., Chanrion, O., Reglero, V., Østgaard, N., Christian, H. J., Lang, T. J., Blakeslee, R. J., and Neubert, T.: Employing optical lightning data to identify lightning flashes associated to terrestrial gamma-ray flashes, Bull. Atmos. Sci. Technol., 5, https://doi.org/10.1007/s42865-024-00065-y, 2024.
Kolmašová, I., Imai, M., Santolík, O., Kurth, W. S., Hospodarsky, G. B., Gurnett, D. A., Connerney, J. E. P., and Bolton, S. J.: Discovery of rapid whistlers close to Jupiter implying lightning rates similar to those on Earth, Nat. Astron., 2, 544–548, https://doi.org/10.1038/s41550-018-0442-z, 2018.
Kolmašová, I., Santolík, O., Imai, M., Kurth, W. S., Hospodarsky, G. B., Connerney, J. E. P., Bolton, S. J., and Lán, R.: Lightning at Jupiter pulsates with a similar rhythm as in-cloud lightning at Earth, Nat. Commun., 14, https://doi.org/10.1038/s41467-023-38351-6, 2023a.
Kolmašová, I., Scholten, O., Santolík, O., Hare, B. M., Zacharov, P., Lán, R., Liu, N., and Dwyer, J. R.: A strong pulsing nature of negative intracloud dart leaders accompanied by regular trains of microsecond-scale pulses, Geophys. Res. Lett., 50, e2023GL103864, https://doi.org/10.1029/2023GL103864, 2023b.
Kolmašová, I., Soula, S., Santolík, O., Defer, E., Zhu, Y., Pédeboy, S., Lán, R., Kolínská, A., and Uhlíř, L.: Properties of positive narrow bipolar events observed in South-Eastern France, J. Geophys. Res.-Atmos., 131, e2025JD045415, https://doi.org/10.1029/2025JD045415, 2026.
Kramida, A.: Evaluation of uncertainties in atomic data on spectral lines and transition probabilities, Eur. Phys. J. D, 78, 36, https://doi.org/10.1140/epjd/s10053-024-00820-y, 2024.
Kramida, A., Ralchenko, Yu., Reader, J., and NIST ASD Team: NIST Atomic Spectra Database (version 5.12), National Institute of Standards and Technology, Gaithersburg, MD, https://physics.nist.gov/asd (last access: 29 December 2025), https://doi.org/10.18434/T4W30F, 2024.
Krider, E. P.: Time-resolved spectral emissions from individual return strokes in lightning discharges, J. Geophys. Res., 70, 2459–2460, https://doi.org/10.1029/jz070i010p02459, 1965.
Krider, E. P.: Lightning spectroscopy, Nuclear Instruments and Methods, 110, 411–419, https://doi.org/10.1016/0029-554x(73)90720-9, 1973.
Langevin, Y., Zambelli, M., and Guiot, P.: On-board de-spiking implemented by MAJIS, the VIS/NIR imaging spectrometer of JUICE, Proc. SPIE 11443, Space Telescopes and Instrumentation 2020, Optical, Infrared, and Millimeter Wave, 1144378, https://doi.org/10.1117/12.2562464, 2020.
Langevin, Y., Poulet, F., Piccioni, G., Filacchione, G., Dumesnil, C., Tosi, F., Carter, J., Barbis, A., Haffoud, P., Tommasi, L., Vincendon, M., De Angelis, S., Guerri, I., Pilorget, C., Rodriguez, S., Stefani, S., Bolsée, D., Cisneros, M., Van Laeken, L., Pereira, N., and Carapelle, A.: Calibration of MAJIS (Moons and Jupiter Imaging Spectrometer). IV. Radiometric calibration (invited), Rev. Sci.Instrum., 95, https://doi.org/10.1063/5.0202702, 2024.
Langford, A. O., Portmann, R. W., Daniel, J. S., Miller, H. L., and Solomon, S.: Spectroscopic measurements of NO2 in a Colorado thunderstorm: Determination of the mean production by cloud-to-ground lightning flashes, J. Geophys. Res.-Atmos., 109, https://doi.org/10.1029/2003jd004158, 2004.
Larigaldie, S., Labaune, G., and Moreau, J. P.: Lightning leader laboratory simulation by means of rectilinear surface discharges, J. Appl. Phys., 52, 7114–7120, https://doi.org/10.1063/1.328420, 1981.
Li, D., Luque, A., Gordillo-Vázquez, F. J., Liu, F., Lu, G., Neubert, T., Chanrion, O., Zhu, B., Østgaard, N., and Reglero, V.: Blue flashes as counterparts to narrow bipolar events: the optical signal of shallow in-cloud discharges, J. Geophys. Res.-Atmos., 126, https://doi.org/10.1029/2021jd035013, 2021.
Li, X., Zhang, J., Chen, L., Xue, Q., and Zhu, R.: Measuring method for lightning channel temperature, Sci. Rep., 6, https://doi.org/10.1038/srep33906, 2016.
Little, B. Anger, C. D., Ingersoll, A. P., Vasavada, A. R., Senske, D. A., Herbert, H. B., Borucki, W. J., and The Galileo SSI Team: Galileo Images of Lightning on Jupiter, Icarus, 142, 306–323, https://doi.org/10.1006/icar.1999.6195, 1999.
Liu, F., Lu, G., Neubert, T., Lei, J., Chanrion, O., Østgaard, N., Li, D., Luque, A., Gordillo-Vázquez, F. J., Reglero, V., Lyu, W., and Zhu, B.: Optical emissions associated with narrow bipolar events from thunderstorm clouds penetrating into the stratosphere, Nat. Commun., 12, https://doi.org/10.1038/s41467-021-26914-4, 2021.
López, J. A., Pineda, N., Montanyà, J., Velde, O. van der, Fabró, F., and Romero, D.: Spatio-temporal dimension of lightning flashes based on three-dimensional Lightning Mapping Array, Atmos. Res., 197, 255–264, https://doi.org/10.1016/j.atmosres.2017.06.030, 2017.
Lorenz, R. D.: Lightning detection on Venus: A critical review. Prog. Earth Planet. Sci., 5, https://doi.org/10.1186/s40645-018-0181-x, 2018.
McCarthy, M. I., Rosmus, P., Werner, H.-J., Botschwina, P., and Vaida, V.: Dissociation of NH3 to NH2+ H, J. Chem. Phys., 86, 6693–6700, https://doi.org/10.1063/1.452417, 1987.
Nag, A. and Rakov, V. A.: Compact intracloud lightning discharges: 1. Mechanism of electromagnetic radiation and modeling, J. Geophys. Res., 115, D20102, https://doi.org/10.1029/2010JD014235, 2010.
Narita, T., Wanke, E., Sato, M., Sakanoi, T., Kumada, A., Kamogawa, M., Hirohiko, I., Harada, S., Kameda, T., Tsuchiya, F., and Kaneko, E.: A study of lightning location system (Blitz) based on VLF sferics, 2018 34th International Conference on Lightning Protection (ICLP), 1–7, https://doi.org/10.1109/iclp.2018.8503311, 2018.
Oliva, F., D'Aversa, E., Migliorini, A., Piccioni, G., Poulet, F., Langevin, Y., Filacchione, G., Ciarniello, M., Rodriguez, S., Seignovert, B., Mura, A., Fletcher, L. N., Zinzi, A., Giardino, M., Lopinto, E., Sindoni, G., and Plainaki, C.: JUICE-MAJIS Earth observations during the 2024 gravity assist: first analysis and comparison with PRISMA data, EGUsphere [preprint], https://doi.org/10.5194/egusphere-2025-6455, 2026.
Orville, R. E.: High-speed, time-resolved spectrum of a lightning stroke, Science, 151, 451–452, https://doi.org/10.1126/science.151.3709.451, 1966.
Orville, R. E.: Spectrum of the lightning stepped leader. J. Geophys. Res., 73, 6999–7008, https://doi.org/10.1029/jb073i022p06999, 1968.
Pérez-Invernón, F. J., Gordillo-Vázquez, F. J., Passas-Varo, M., Neubert, T., Chanrion, O., Reglero, V., and Østgaard, N.: Multispectral optical diagnostics of lightning from space, Remote Sens., 14, 2057, https://doi.org/10.3390/rs14092057, 2022.
Petersen, D. A. and Beasley, W. H.: High-speed video observations of a natural negative stepped leader and subsequent dart-stepped leader, J. Geophys. Res.-Atmos., 118, 12110–12119, https://doi.org/10.1002/2013JD019910, 2013.
Petersen, W. A., Christian, H. J., and Rutledge, S. A.: TRMM observations of the global relationship between ice water content and lightning, Geophys. Res. Lett., 32, https://doi.org/10.1029/2005gl023236, 2005.
Peterson, M.: Making a Superbolt: Reconciling observations of the optically brightest lightning on Earth from different satellites, Earth Space Sci., 10, https://doi.org/10.1029/2023ea003001, 2023.
Peterson, M. and Rudlosky, S.: The time evolution of optical lightning flashes, J. Geophys. Res.-Atmos., 124, 333–349, https://doi.org/10.1029/2018jd028741, 2019.
Poulet, F., Langevin, Y., and Piccioni, G.: Calibration of the Moons And Jupiter Imaging Spectrometer (MAJIS): Introduction to the special collection and summary of the performances, Rev. Sci. Instrum., 95, https://doi.org/10.1063/5.0209679, 2024a.
Poulet, F., Piccioni, G., Langevin, Y., Dumesnil, C., Tommasi, L., Carlier, V., Filacchione, G., Amoroso, M., Arondel, A., D'Aversa, E., Barbis, A., Bini, A., Bolsée, D., Bousquet, P., Caprini, C., Carter, J., Dubois, J.-P., Condamin, M., Couturier, S., Dassas, K., Dexet, M., Fletcher, L., Grassi, D., Guerri, I., Haffoud, P., Larigauderie, C., Le Du, M., Mugnuolo, R., Pilato, G., Rossi, M., Stefani, S., Tosi, F., Vincendon, M., Zambelli, M., Arnold, G., Bibring, J.-P., Biondi, D., Boccaccini, A., Brunetto, R., Carapelle, A., Cisneros González, M., Hannou, C., Karatekin, O., Le Cle'ch, J.-C., Leyrat, C., Migliorini, A., Nathues, A., Rodriguez, S., Saggin, B., Sanchez-Lavega, A., Schmitt, B., Seignovert, B., Sordini, R., Stephan, K., Tobie, G., Zambon, F., Adriani, A., Altieri, F., Bockelée, D., Capaccioni, F., De Angelis, S., De Sanctis,M.-C., Drossart, P., Fouchet, T., Gérard, J.-C., Grodent, D., Ignatiev, N., Irwin, P., Ligier,N., Manaud, N., Mangold, N., Mura, A., Pilorget, C., Quirico, E., Renotte, E., Strazzulla, G., Turrini, D., Vandaele, A.-C., Carli, C., Ciarniello, M., Guerlet, S., Lellouch, E., Mancarella, F., Morbidelli, A., Le Mouélic, S., Raponi, A., Sindoni, G., and Snels, M.: Moons and Jupiter Imaging Spectrometer (MAJIS) on Jupiter Icy Moons Explorer (JUICE), Space Sci. Rev., 220, https://doi.org/10.1007/s11214-024-01057-2, 2024b.
Poulet, F., Piccioni, G., Langevin, Y., Dumesnil, C., Carlier, V., Seignovert, B., Dexet, M., Fletcher, L. N., Leyrat, C., Altieri, F., Carter, J., D'Aversa, E., De Sanctis, M., Grassi, D., Guerlet, S., Le Mouélic, S., Migliorini, A., Oliva, F., Royer, C., Rodriguez, S., Stephan, K., Tosi, F., Zambon, F., Adriani, A., Arnold, G., Bibring, J.-P., Bockelée, D., Brunetto, R., Capaccioni, F., Carli, C., Cavalié, T., Cisneros González, M., Ciarnello, M., De Angelis, S., Drossart, P., Filacchione, G., Fouchet, T., Gérard, J.-C., Grodent, D., Irwin, P., Jacquinod, S., Karatekin, O., Lellouch, E., Ligier, N., Mangold, N., Mebsout, M., Merlin, F., Morbidelli, A., Mura, A., Nathues, A., Palumbo, M. E., Pilorget, C., Poch, O., Quirico, E., Raponi, A., Robert, S., Roussos, E., Sanchez-Lavega, A., Schmitt, B., Sindoni, G., Snels, M., Sordini, R., Stefani, S., Strazzulla, G., Trent, T., Tobie, G., Turrini, D., Vandaele, A.-C., Vincendon, M., Witasse, O., Vallat, C., and Moraino, A.: ESA/JUICE encounters Earth/Moon in 2024: overview of the Moons And Jupiter Imaging Spectrometer (MAJIS) observations, Ann. Geophys., 44, 163–193, https://doi.org/10.5194/angeo-44-163-2026, 2026.
Prueitt, M. L.: The excitation temperature of lightning, J. Geophys. Res., 68, 803–811, https://doi.org/10.1029/jz068i003p00803, 1963.
Rakov, V. A., Uman, M. A., and Rambo, K. J.: A review of ten years of triggered-lightning experiments at Camp Blanding, Florida, Atmos. Res., 76, https://doi.org/10.1016/j.atmosres.2004.11.028, 2005.
Rinnert, K., Lanzerotti, L. J., Uman, M. A., Dehmel, G., Gliem, F. O., Krider, E. P., and Bach, J.: Measurements of radio frequency signals from lightning in Jupiter's atmosphere, J. Geophys. Res., 103, 22979–22992, https://doi.org/10.1029/98JE00830, 1998.
Rodriguez, S., Vincendon, M., Haffoud, P., Langevin, Y., Poulet, F., Quirico, E., Pilorget, C., Filacchione, G., Carter, J., Brunetto, R., Lecomte, B., Guiot, P., Dumesnil, C., and Piccioni, G.: Calibration of MAJIS (Moons and Jupiter Imaging Spectrometer): V. Validation with mineral samples and reference materials. Rev. Sci. Instrum., 95, https://doi.org/10.1063/5.0215249, 2024.
Rudlosky, S. D., Goodman, S. J., Virts, K. S., and Bruning, E. C.: Initial geostationary lightning mapper observations, Geophys. Res. Lett., 46, 1097–1104, https://doi.org/10.1029/2018gl081052, 2019.
Ruscic, B.: Active thermochemical tables: Sequential bond dissociation enthalpies of methane, ethane, and methanol and the related thermochemistry, J. Phys. Chem. A, 119, 7810–7837, https://doi.org/10.1021/acs.jpca.5b01346, 2015.
Salanave, L. E.: The optical spectrum of lightning, Adv. Geophys., 10, 83–98, https://doi.org/10.1016/s0065-2687(08)60006-0, 1964.
Salanave, L. E., Orville, R. E., and Richards, C. N.: Slitless spectra of lightning in the region from 3850 to 6900 Angstroms, J. Geophys. Res., 67, 1877–1884, https://doi.org/10.1029/jz067i005p01877, 1962.
Schumann, U. and Huntrieser, H.: The global lightning-induced nitrogen oxides source, Atmos. Chem. Phys., 7, 3823–3907, https://doi.org/10.5194/acp-7-3823-2007, 2007.
Stefani, S., Piccioni, G., Poulet, F., Filacchione, G., Vincendon, M., Barbis, A., Tommasi, L., Guerri, I., Langevin, Y., Dumesnil, C., Haffoud, P., Rodriguez, S., Carter, J., Biondi, D., Boccaccini, A., De Angelis, S., Tosi, F., Pilorget, C., Guiot, P., and Lecomte, B.: Calibration of MAJIS (Moons and Jupiter Imaging Spectrometer): VI. The inflight calibration unit (ICU), Rev. Sci. Instrum., 96, 011301, https://doi.org/10.1063/5.0221810, 2025.
Uman, M. A. and Orville, R. E.: Electron density measurement in lightning from stark-broadening of Hα, J. Geophys. Res., 69, 5151–5154, https://doi.org/10.1029/jz069i024p05151, 1964.
Vincendon, M., Guiot, P., Lecomte, B., Condamin, M., Poulet, F., Arondel, A., Barbay, J., Carter, J., De Angelis, S., Dumesnil, C., Filacchione, G., Haffoud, P., Hansotte, J., Langevin, Y., Mayeur, P.-L., Piccioni, G., Pilorget, C., Quirico, E., and Rodriguez, S.: Calibration of MAJIS (Moons And Jupiter Imaging Spectrometer). I. On-ground setup description and characterization, Rev. Sci. Instrum., 95, 121301, https://doi.org/10.1063/5.0226567, 2024.
Walker, T. D. and Christian, H. J.: Triggered lightning spectroscopy: 2. A quantitative analysis. J. Geophys. Res.-Atmos., 124, 3930–3942, https://doi.org/10.1029/2018jd029901, 2019.
Wang, P., Gong, S., and Mo, Y.: Bond dissociation energy of O2 measured by fully state-to-state resolved threshold fragment yield spectra, J. Chem. Phys., 160, 164302, https://doi.org/10.1063/5.0207288, 2024.
Warwick, J. W., Evans, D. R., Romig, J. H., Alexander, J. K., Desch, M. D., Kaiser, M. L., Aubier, M., Leblanc, Y., Lecacheux, A., and Pedersen, B. M.: Planetary radio astronomy observations from Voyager 2 near Saturn, Science, 215, 582–587, https://doi.org/10.1126/science.215.4532.582, 1982.
Wemhoner, J., da Silva, C. L., Leal, A. F. R., Bandara, S., Pantuso, J. G., and Sonnenfeld, R. G.: Near-infrared atomic oxygen photometry of lightning. J. Geophys. Res.-Atmos., 130, e2024JD042256, https://doi.org/10.1029/2024JD042256, 2025.
Wong, M. H., Kolmašová, I., Oyafuso, F. A., Imai, M., Mizumoto, S., Levin, S. M., Sankar, R. G., Simon, A. A., Brueshaber, S., Orton, G. S., Atreya, S. K., Li, C., and Bolton, S. J.: Radio pulse power distribution of lightning in Jupiter's 2021–2022 stealth superstorms, AGU Adv., 7, e2025AV002083, https://doi.org/10.1029/2025AV002083, 2026.
Xu, L., Gou, X., Yuan, P., An, T., Jiang, R., and Deng, H.: Spectral study of rare upward developing, circling, and branching cloud-to-ground lightning, J. Geophys. Res.-Atmos., 129, https://doi.org/10.1029/2023jd040696, 2024.
Yingying, A., Ping, Y., Tingting, A., Hong, D., and Shengxin, H.: Hydrogen concentration in lightning plasma channel and its effect on discharge characteristics, J. Appl. Phys., 138, 063302, https://doi.org/10.1063/5.0276142, 2025.
Zarka, P. and Pedersen, B. M.: Radio detection of uranian lightning by Voyager 2, Nature, 323, 605–608, https://doi.org/10.1038/323605a0, 1986.
Zhu, Y., Rakov, V. A., Tran, M. D., Stock, M. G., Heckman, S., Liu, C., Sloop, C. D., Jordan, D. M., Uman, M. A., Caicedo, J. A., Kotovsky, D. A., Wilkes, R. A., Carvalho, F. L., Ngin, T., Gamerota, W. R., Pilkey, J. T., and Hare, B. M.: Evaluation of ENTLN performance characteristics based on the ground truth natural and rocket-triggered lightning data acquired in Florida, J. Geophys. Res.-Atmos., 122, 9858–9866, https://doi.org/10.1002/2017jd027270, 2017.
Data downloaded from Wyoming Weather Web, Upperair Air Data, station WITT 96011, University of Wyoming, https://weather.uwyo.edu/upperair/ (last access: 17 February 2025).