
the Creative Commons Attribution 4.0 License.
the Creative Commons Attribution 4.0 License.
 | 13 Oct 2026
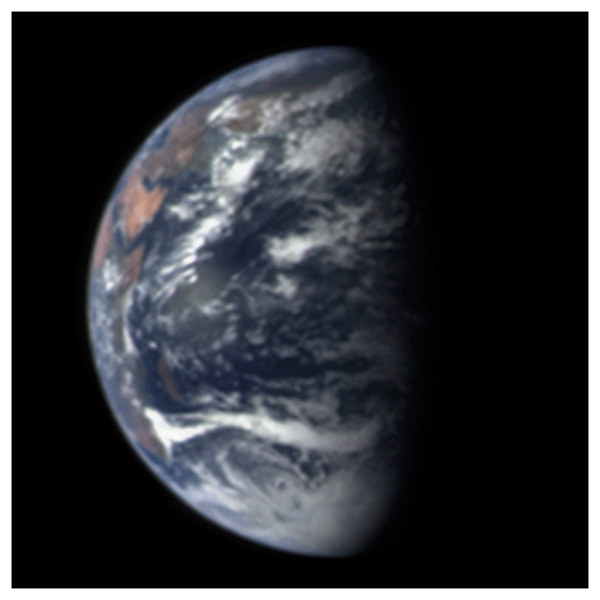
JUICE-JANUS observations of Earth in preparation for the JANUS investigation of Jupiter's atmosphere

Arrate Antuñano
Luisa María Lara
Katrin Stephan
Angelo Zinzi
Athena Coustenis
Yoav Yair
Mitsuteru Sato
Junichi Haruyama
Amy Simon
Cecilia Tubiana
Luca Penasa
Livio Agostini
Alice Lucchetti
Alessio Aboudan
Michael Aye
Elke Kersten
Klaus-Dieter Matz
Romolo Politi
Frank Trauthan
Ry Evill
Ines Belgacem
Takahashi Yukihiro
Jose María Castro-Marin
Vincenzo Della Corte
Stubbe Hviid
Thomas Roatsch
Nicole Schmitz
Manish Patel
Ganna Portyankina
Pasquale Palumbo
JANUS (Jovis, Amorum ac Natorum Undique Scrutator), the high-resolution camera on the JUICE mission (JUpiter ICy moons Explorer), obtained observations of the Earth during and short-after a Lunar and Earth Gravitational Assist maneuver (LEGA) that was run on 19–20 August 2024. We report on the observations of the Earth that were acquired on 20 August 2024 at a closest approach to the surface of 8408 km, and on 9 September 2024 at a distance of 564 300 km. The close approach observations covered a narrow strip of the Earth, starting in the night-side of the planet and moving over the terminator and day-side. The later observation provided a low spatial resolution portrait of the Earth and the Moon. Here we examine JANUS observations of the Earth as an example of the different science topics that will be addressed in future observations of Jupiter's atmosphere.
The Earth night-side images show atmospheric airglow, clouds illuminated by a full Moon, fires in rural areas, lights over the ocean from maritime traffic, city lights, no firm detections of lightning, and two meteor candidates compatible with meteoroids of 1–30 g entering Earth's atmosphere. The day-side images show crepuscular rays under high incidence angles, atmospheric gravity waves on elevated cirrus, sun glint on multi-filter images of the tropical Western Pacific, convective storms, internal waves in the ocean and multiple cloud systems at a variety of spatial resolutions. Some images acquired with the panchromatic filter showed islands such as Luzon and the Big Island of Hawaii. We compare broadband spectroscopic data from JANUS images of the ocean and various cloud systems with spectra from the EnMAP and PRISMA satellites. JANUS images acquired on 9 September 2024 allow to form a multi-spectral view of the Earth at low spatial resolution. The data confirm the expected instrument performance in terms of optical quality and multi-wavelength radiometry precision, and the ensemble of observations contains a wide variety of features that are good analogs to multiple systems in Jupiter's atmosphere.
- Article
(22748 KB) - Full-text XML
- BibTeX
- EndNote


The JUpiter ICy moons Explorer (JUICE) is the first large mission of the ESA Cosmic Vision program and will investigate the Jovian system and the potential habitability of its icy satellites (Grasset et al., 2013; Coustenis et al., 2021). JUICE was launched on 14 April 2023, and will arrive at the Jupiter system in July 2031 after a long orbital tour that includes several gravitational assist maneuvers (Boutonnet et al., 2024). The first of these maneuvers was a Lunar and Earth Gravitational Assist (LEGA) that was run on 19–20 August 2024. Additional Earth and moon images were acquired on 9 September 2024. Both data sets provided an excellent opportunity to test the scientific payload of the mission under a real operational scenario. Two more Earth Gravity Assist maneuvers will be occurring in September 2026 and January 2029, and LEGA observations allow to plan future observations with hindsight on the performance of the JUICE instruments for these targets.
This paper describes the observations of the Earth during and short-after LEGA acquired with the JANUS instrument. JANUS (Jovis, Amorum ac Natorum Undique Scrutator) is a multi-spectral camera operating in the 340–1080 nm spectral range, and is the high-resolution instrument on JUICE (Palumbo et al., 2025). The science planning of JANUS observations during LEGA is presented by Tubiana et al. (2026). Agostini et al. (2026) detail the calibration of the data. Lucchetti et al. (2026) show an analysis of JANUS observations of the Moon during LEGA and Poulet et al. (2025) summarize spectroscopic analyses of Earth data acquired with the MAJIS infrared spectrometer onboard JUICE. JUICE data concerning LEGA observations are released in the ESA-JUICE_LEGA-Special-Issue_v1.0 dataset through the Guest Storage Facility of the Planetary Science Archive (European Space Agency, 2026).
The observations presented here cover a broad range of phenomena observed under a variety of illumination conditions. The analysis of these data illustrates the instrument's capability to address diverse atmospheric investigations and serves as representative examples of the wide range of studies that JANUS will conduct of Jupiter's atmosphere. JUICE will perform a 3.5 years orbital tour of the Jupiter system in which multiple science themes of the Jovian atmosphere will be investigated. For JANUS, these encompass nightside investigations of lightning and auroras and dayside investigations of winds, vertical cloud structure, color distribution, convection, and the overall behavior of atmospheric systems of multiple sizes, together with the overall evolution of atmospheric phenomena during the Jupiter orbital tour. The JANUS investigation of the Jovian atmosphere is summarized by Palumbo et al. (2025), and the overall JUICE investigation of the Jovian atmosphere is described by Fletcher et al. (2023).
The structure of this paper is the following: Sect. 2 summarizes the characteristics of the Earth data acquired. Section 3 presents an analysis of nightside observations. Section 4 explores observations of the Earth under crepuscular illumination. Section 5 presents daytime observations of the Western Pacific. Section 6 shows broadband spectroscopic information from JANUS multi-spectral images of the ocean and cloud systems. These broadband spectra are compared with spectra of the same locations from near contemporary data acquired by Earth satellites. Section 7 presents a global view of the Earth obtained after LEGA observations and discusses what moderate spatial resolution can reveal for Earth. Each section contains a comparison with expected Jupiter observations. We summarize our conclusions on Sect. 8.
2.1 JANUS instrument
Palumbo et al. (2025) provide a detailed description of the JANUS instrument. Here we only give a short summary of the instrument characteristics.
JANUS is a camera with an effective focal length of 467 mm and is equipped with a 1504 × 2000 pixel CMOS detector, resulting in a plate scale of 15 µrad per pixel and a FOV of 1.29° × 1.72°. The rows of pixels are read out in rolling shutter mode with a line read-out time of 0.2215 ms. A filter wheel allows to select among 13 individual filters whose characteristics were selected to study the Jupiter system. Table 1 summarizes the wavelengths and band-passes of these filters.
Table 1Summary of JANUS filters. CMT stands for continuum near a methane absorption band, MT stands for filters in methane absorption bands. The filters have sharp cutoffs and are best described as bandpass filters with central wavelengths and bandwidths, rather than using a full-width at half-maximum (FWHM) description.
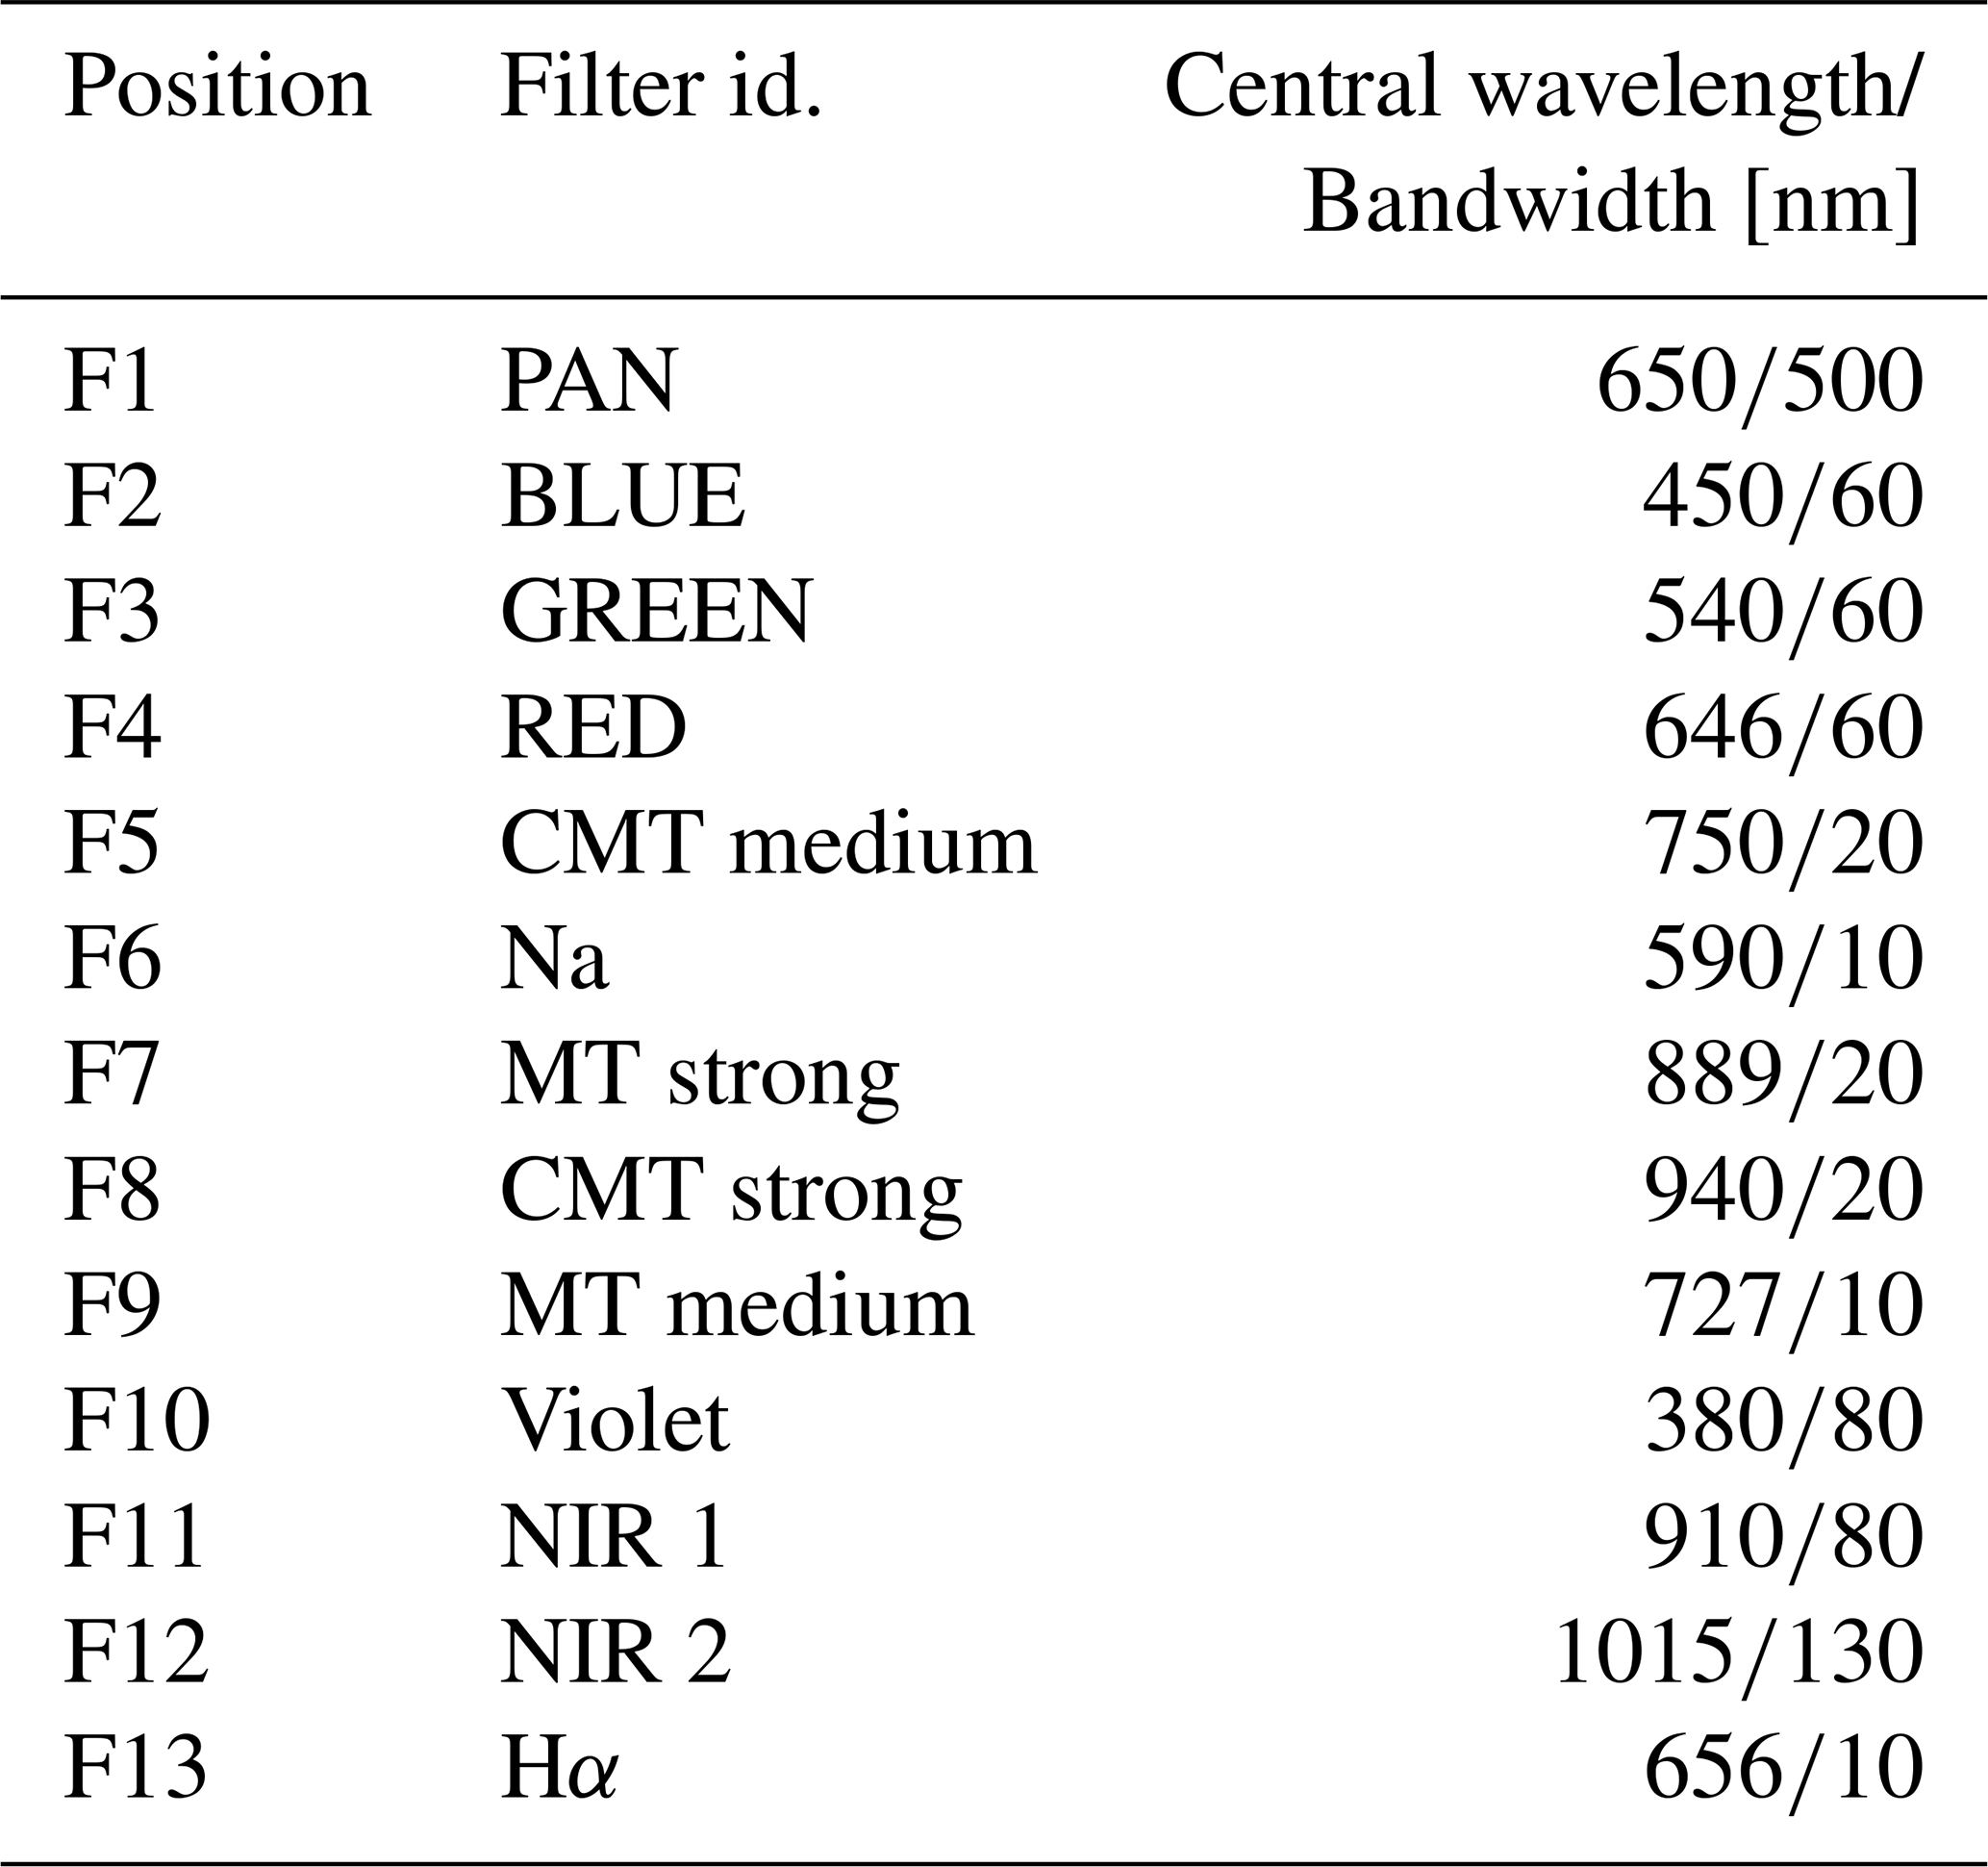
The JANUS panchromatic filter gives access to imaging under very low illumination conditions. Broad band filters are sensitive to color, and narrow band filters are sensitive to the vertical structure of Jovian clouds through the combination of filters inside methane absorption bands and at close spectral distances. Additional filters in JANUS were selected for investigations of the Jovian moons. A relevant filter for Earth observations is the JANUS F8 filter at 940 nm. This filter lies within a strong water-absorption band and provides sensitivity to vertical cloud heights on Earth. Observations of Earth clouds in this filter play a role comparable to that of the F7 filter on Jupiter, which probes Jupiter's atmosphere in the strong methane-absorption band at 889 nm. Additionally, filters F5, F6, F7, F11 and F12 are also weakly sensitive to water absorption bands.
2.2 LEGA Earth data
A total of 140 images of the Earth were acquired on 20 August 2024 between 21:19:03 and 21:50:03 UTC. At the closest approach, approximately at a distance of 8400 km from Earth's surface, the images achieved a spatial resolution of 125 m per pixel. During the imaging sequence, the spacecraft moved relative to Earth's center with a horizontal velocity of 5.02–6.82 kms−1. Exposure times ranged from 0.222 to 162 ms, generally shorter than the JANUS dwell time for those velocities. The time interval between the start of consecutive images varied from 0.46 to 50 s, depending on exposure duration and filter-change requirements. A few night-side test images acquired with narrow-band filters were smeared by 3–5 pixels due to spacecraft motion.
The high velocity flyby at a very short distance to the Earth's surface, together with other operational constraints on the attitude of JUICE, resulted in the acquisition of a small number of multi-filter sequences. These were acquired in the South China Sea and the West Pacific. Also, only a few locations were observed twice with the same filter. Those observations were separated in time by only a few tens of seconds, making wind retrievals from cloud tracking extremely challenging. Pointing was inertial and the observation sequence was constrained to phase angles of 90° due to thermal constraints on the spacecraft. The images were lossless compressed. Tables A1 to A3 in the Appendix provide a list of the LEGA images from 20 August 2024 selected for this study. Images are identified by an image ID composed of an image session ID with 10 digits, an image number during the observing sequence made from 4 digits, and two digits that code the filter used from 01 to 13.
2.3 Distant Earth data
The data acquired on 9 September 2024 consisted of a sequence of 84 images acquired at a distance of 564 300 km under a phase angle of 70.0° and with a spatial resolution of 84.66 km per pixel at the sub-spacecraft point. Images were obtained in the 13 filters available to JANUS using six exposure times from 0.222 to 28.795 ms. All the images kept the same pointing and included both the Earth and the Moon. We focus our attention on the portion of the images covering the Earth. Table A4 lists the distant Earth observations analyzed in this paper.
The inbound over the nightside of the Earth gave JANUS the opportunity to observe atmospheric airglow and search for lightning and potential meteor streaks over diverse areas. Most of these observations were obtained under the illumination of the target by a full Moon. Table A1 lists the selected JANUS nighttime observations discussed in this section.
3.1 Airglow and scattered light over the limb
The first image of the Earth was an observation of the limb of the planet during nighttime at a distance to the horizon of 18 010 km (Fig. 1a). The image was acquired with a exposure time of 36.1 ms with the F1 filter (panchromatic). The short-time exposure was selected due to the short dwell-time associated with the fast flyby and the unexpected nature of what the observation would show.
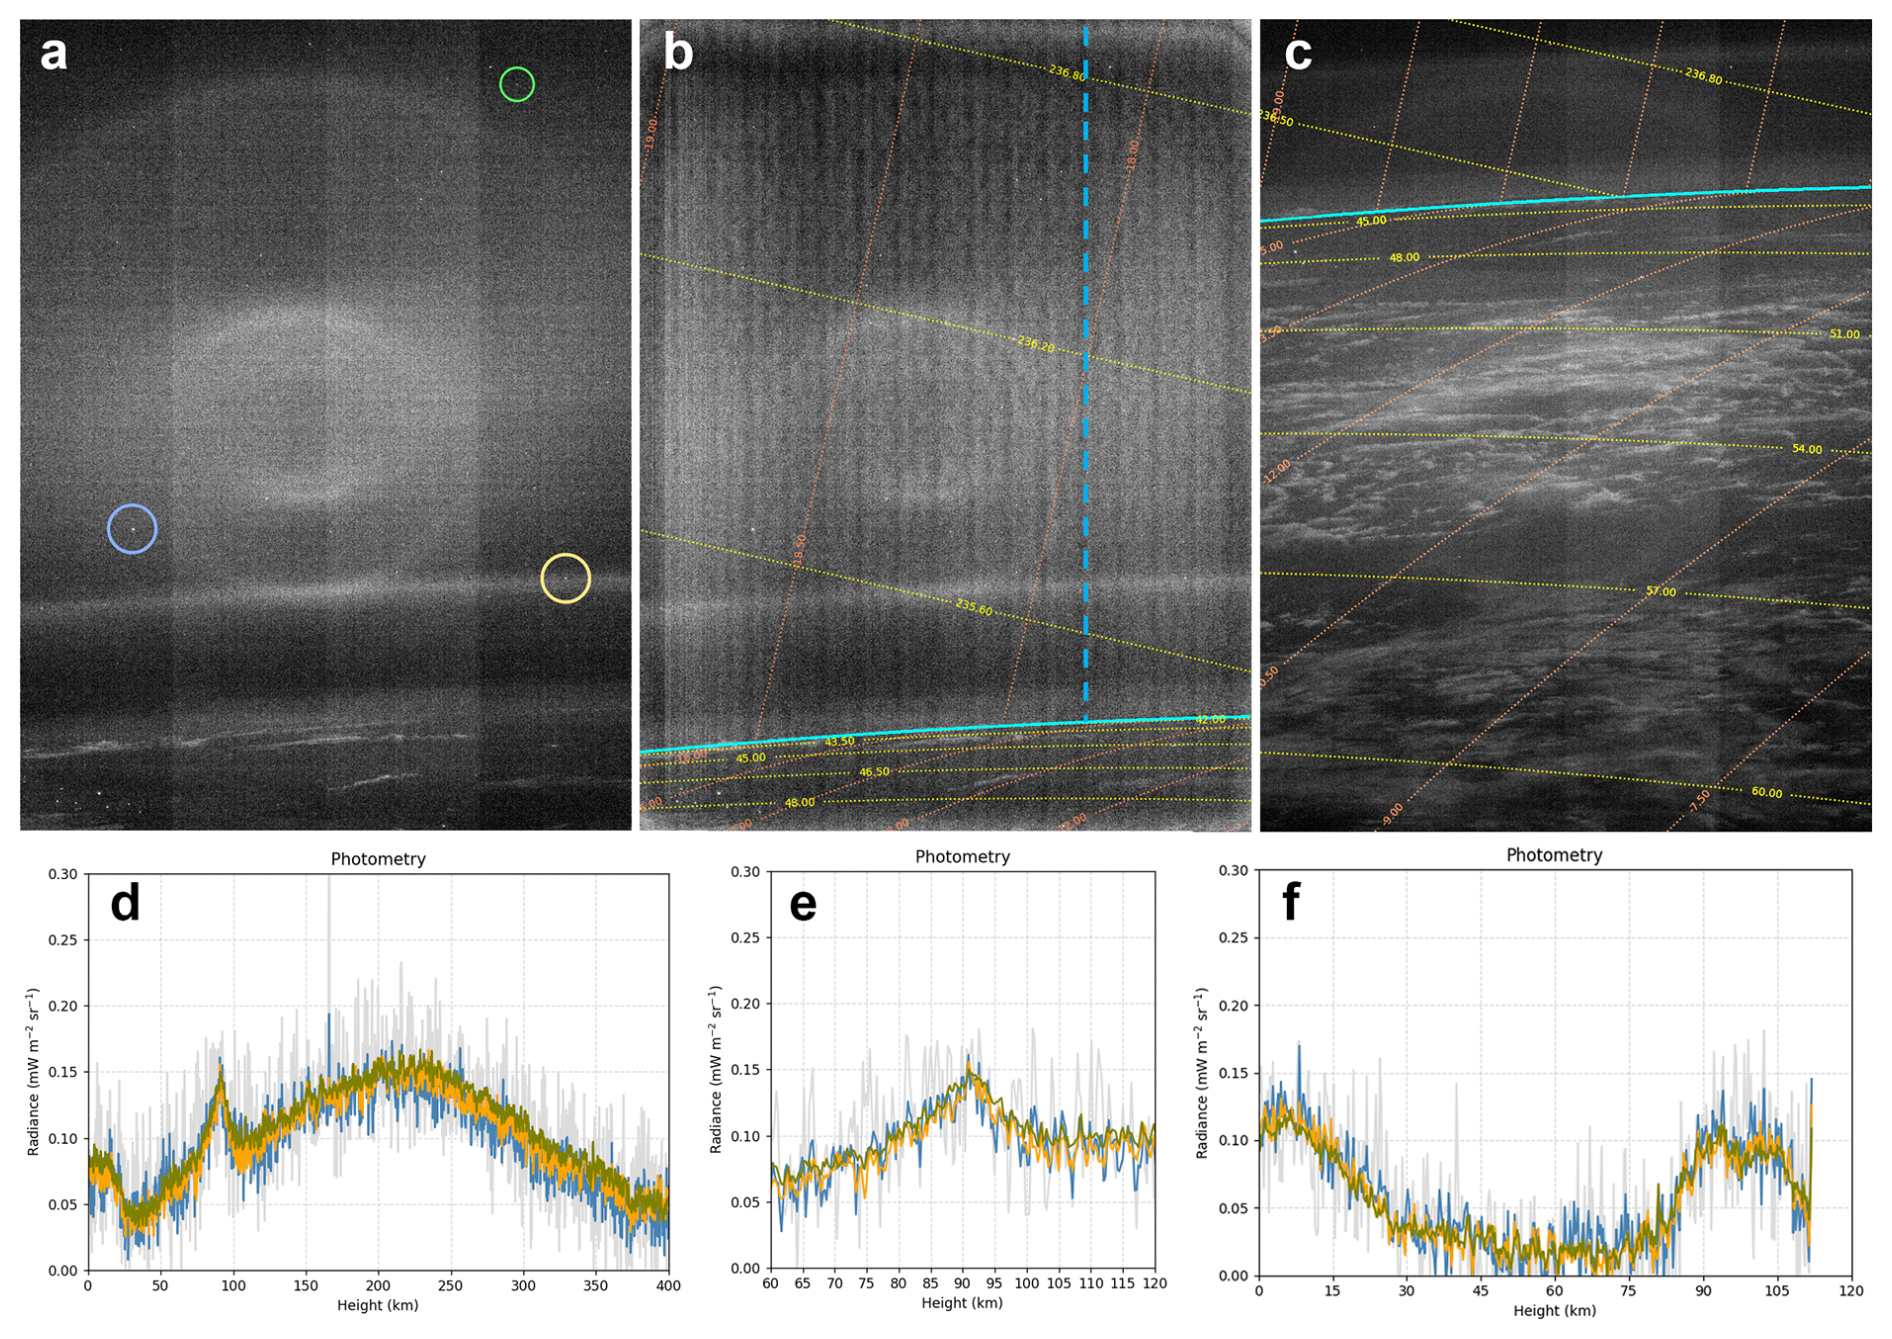
Figure 1JANUS images of Earth's limb during nighttime. (a) JANUS image 0777503922_0000_01 after dark subtraction. A prominent ring feature in the image is created by stray light likely created by internal reflections in the vanes of the long baffle. Representative stars with visual magnitudes of 8.12, 9.60 and 10.18 are highlighted with blue, yellow and green circles respectively. (b) Fully calibrated image after applying flat-fielding and conversion from DNs to radiance units. The current calibration pipeline does not correct stray light effects. The cyan solid line highlights the horizon over the surface. Longitude (yellow lines) latitude (orange lines) and RA (yellow lines) DEC (orange lines) coordinates are superimposed over the image demonstrating accurate image navigation and star identification. A vertical dashed line, outside the main ring artifacts in the image from stray light shows the location of photometric cuts shown in panels (d) and (e). (c) Full-size JANUS image 0777503922_0001_01 showing the same area over the horizon and clouds illuminated by the full Moon. (d) Photometric cut from the horizon to the first 400 pixels of the image. Grey lines are for a single vertical line illustrating pixel noise. Blue, yellow and green are photometric cuts averaging 30, 100 and 400 vertical lines respectively and reducing noise. (e) Zoom over the main airglow layer. (f) Photometric cut over the second image showing a similar structure of the scattered light over the horizon and of the main airglow layer.
Given the low-exposure of the image, stray light from sunlight resulted in a circular artifact likely created from the illumination of the internal vanes of the long external baffle. This artifact appears in most of the nighttime images with different contrast. Stray light reduction strategies are under evaluation (see for instance Munari et al., 2024), and additional data is being acquired during periodic checkouts of the instrument in the cruise to Jupiter. In the airglow image, the ring patterns created by stray light have an influence on the determined radiance of about 0.17 . In addition, the standard radiometric calibration process (see Agostini et al. 2026, this issue) results in the addition of a noisy regular pattern in the darkest regions of the images (see Fig. 1b). This is because of the behavior of the calibration algorithm that may introduce artifacts in case the signal is very low (less than 10 digital units in the original raw image). These effects are being studied for correction in future versions of the calibration pipeline, and efforts are being done to capture new data on stray light conditions to better characterize this effect.
Earth's airglow is the most notable feature in Fig. 1a. The airglow appears as a bright halo detached over the surface of the planet with a radiance level that peaks at 90 km above the surface with values of 0.15 . Additional airglow extends over altitudes around 250 km (Fig. 1d–f). Multiple stars of magnitudes 8.1–10.8 are visible inside and outside the mean airglow emissions. Photometric measurements of these stars, corrected for background contributions from airglow and stray light using aperture mask photometry results in an estimated surface brightness of 18 mag arcsec−2 for the main airglow layer at 90 km height. This value compares well with typical estimates of night-sky brightness observed from the ground, with brightness values of about 21.6 mag arcsec−2 for observations of the zenith (Patat, 2003). The extended emission at 250 km competes in brightness with stray light, and its spatial structure and overall brightness are more complex to characterize. In the wavelength range of the panchromatic filter, the most intense emissions of Earth's airglow come from atomic oxygen (OI) at 630 nm, sodium (NaD) at 588.9–589.6 nm, and hydroxyl (OH) (all peaking near 90 km). The extended emission around 250 km is most likely contributed by OI emissions at 630.0 and 636.4 nm (Leinert et al., 1998).
Besides airglow, the JANUS Earth observations in Fig. 1 show scattered light over the horizon from the surface to an altitude of about 25 km. However, the low radiance level and low signal to noise ratio of the image do not allow for further exploration of light scattering from the atmosphere on the nightside limb.
Finally, close to Earth's horizon, the image also shows clouds illuminated by the Moon and bright lights in the west coast of Madagascar. These bright lights are observed again at the same geographical positions in a JANUS image acquired 50.2 s later with more coverage of the ground and less coverage of the sky (Fig. 1c). In this second image, large cloud systems illuminated by the full Moon are visible over the Indian Ocean. From the calibrated JANUS panchromatic image, the radiance levels of these clouds and the overall Moonshine in this location is ∼0.3 , which is in overall agreements with expected values from typical ground measurements of lunar illumination (Kyba et al., 2017).
JANUS will image Jupiter's nightside limb several times on its orbital tour (Fletcher et al., 2023). The recent discovery of a widespread Jovian airglow in the near-IR by the James Webb Space Telescope (Sromovsky et al., 2022) opens the possibility to search for visible counterparts to those emissions. However, the key observational target on JANUS observations of nightside limb are auroras. Both, the Galileo orbiter and the Juno mission have been able to observe auroras on Jupiter in the visible range (Ingersoll et al., 1998; Vasavada et al., 1999; Becker et al., 2025). Galileo observations showed complex structures over extended arcs 250 km above the 1 bar level. The auroral emissions extended over vertical distances of 120 km, and were observed at a spatial resolution of 26 km per pixel. Juno observations of auroras and Jupiter's limb trace strong and weak emissions at multiple latitudes (Becker et al., 2025). JANUS will image Jupiter's limb at a pixel scale of 10–20 km in several perijoves over the JUICE mission. Thus, we expect to map not only the spatial extent of auroras, but also to characterize their vertical structure and obtain information about its variability at different time-scales. Jupiter auroral emissions in the visible observed by Galileo with near nadir viewing had intensities of ∼ 80 kR ∼ 300 kR (Ingersoll et al., 1998). These are about 10–30 brighter than the airglow emissions observed in JANUS images of the Earth. In addition, Jupiter Observations at perijove will have much larger dwell times than in the fast Earth flyby allowing for the acquisition of well exposed detailed views of the Jovian auroras.
Replicating nighttime observations of the scattering of moon light above the horizon observed on these images of Earth's limb might be difficult on Jupiter, where the Galilean moons receive ∼25 times less light. However, Jupiter's extended hazes in the equatorial and polar latitudes will increase light scattering effects, and equivalent observations of Jupiter by JANUS will be run under much longer integration times. Thus, detached haze layers as those observed by Galileo at high phase angles (Rages et al., 1999) might be observed on JANUS images of the nightside when JANUS frames include the limb of the planet.
Further, JANUS may be able to observe visible counterparts to the UV auroras of Ganymede detected by the Hubble Space Telescope and Juno (Saur et al., 2015; Greathouse et al., 2022), with auroras in the visible observable on Ganymede's nightside (de Kleer et al., 2023). These auroral observations might provide key information about Ganymede's internal ocean.
3.2 Searches for lightning, city lights, fires and maritime traffic
Nighttime images of the Earth were acquired over tropical latitudes from Madagascar to Thailand. Many of these night-time images contain bright sources from city lights, fires and ships, most of them much weaker than typical lightning events. Detailed analysis shows that only one of the images contains a potential candidate for lightning. However, the detection of these nighttime compact light sources illustrate the potential of the instrument to detect lightning on Jupiter, where images will cover much larger fields of view and lightning events encompass a wide range of optical powers (e.g. Becker et al., 2020). Thus, these observations, and calibration of the light sources detected, help us to guide the design of surveys of lightning on Jupiter.
Figure 2 contains a detailed view of a small section of the full JANUS image shown in Fig. 1. Several compact lights can be seen near the horizon. Their geographical position and brightness are repeated in the next JANUS image obtained 50 s later. Panel (b) shows a map of the original observation in terms of longitude and geodetic latitude. Some of these compact lights correspond to the city of Mamoudzou in the island of Mayotte, East of Madagascar, and potentially, also to the city of Andoany and villages around Cap D'Ambre in the north coast of Madagascar. Most other lights, including the most intense sources, correspond to fires in Madagascar (fires are common in the area at that time of the year due to farming activities). The nature of these lights as fires in rural and bush areas was verified using data from NASA's Fire Information for Resource Management System (FIRMS; see https://firms.modaps.eosdis.nasa.gov/, last access: 9 July 2026), which provides daily maps of hot spots on the surface of the Earth from IR observations by Earth monitoring satellites. Similar light sources were observed in JANUS images over Cambodia and Vietnam, and again were verified to be caused by surface fires from comparisons with FIRMS data.
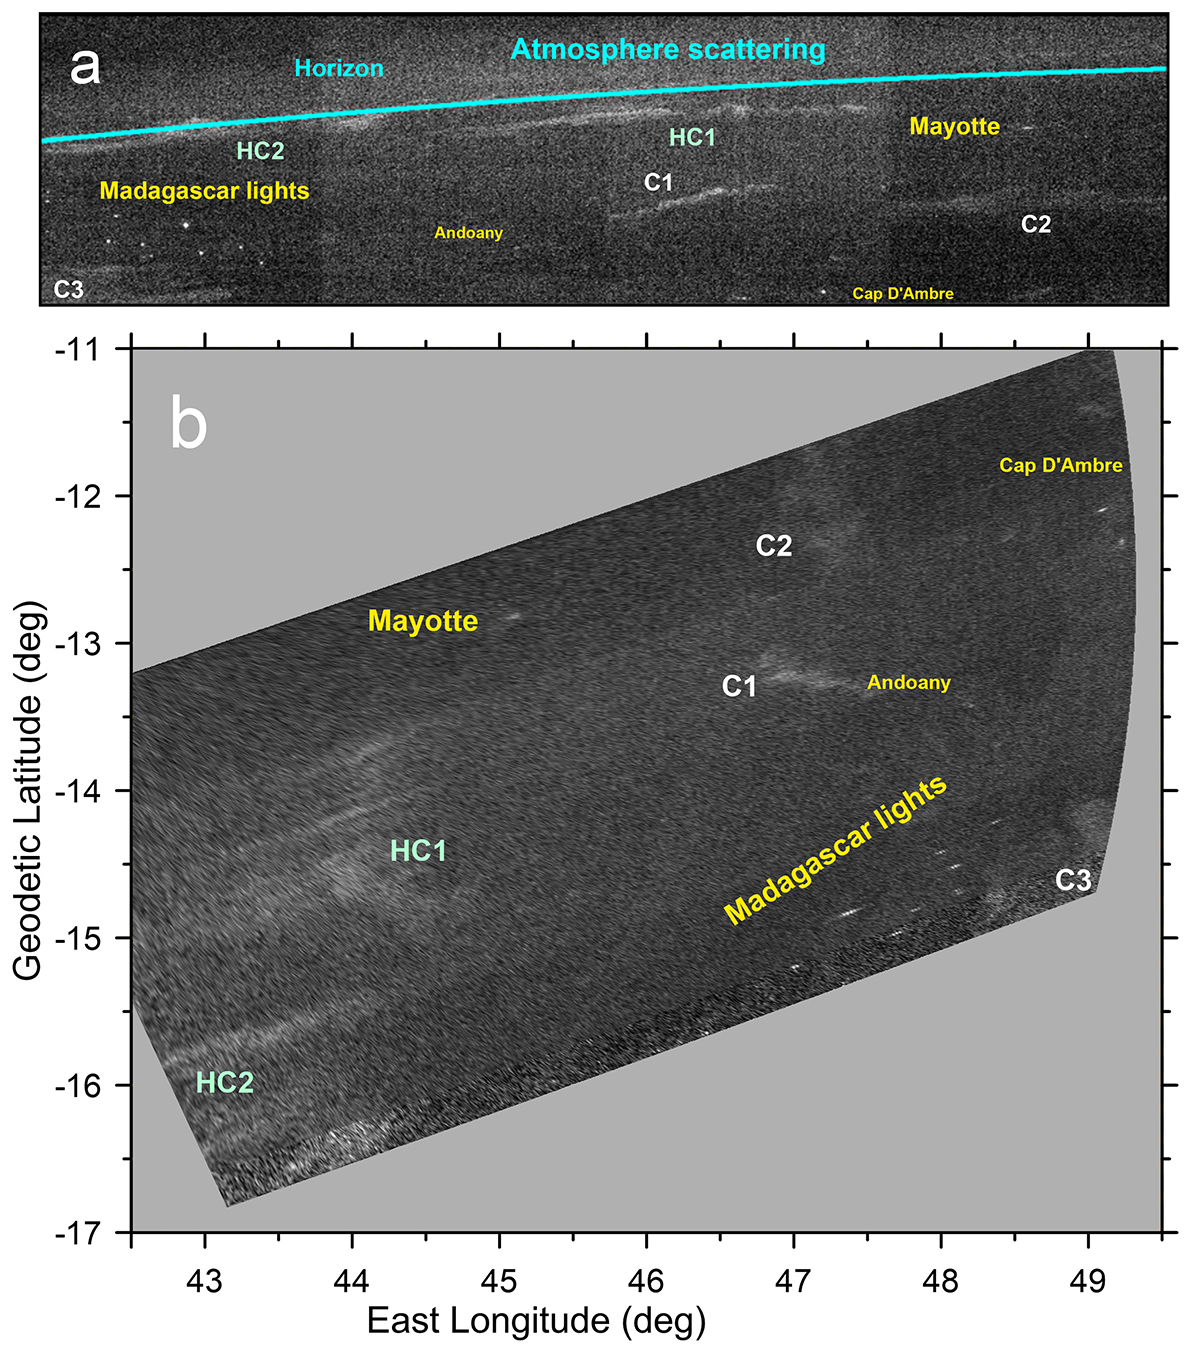
Figure 2Lights on Madagascar. (a) A small section of image 0777503922_0000_01 showing the horizon, clouds illuminated by the Moon, and several bright and compact light sources. (b) Cylindrical map projected image. Point sources in panel (a) spread on the map projection on (b) due to the nearly limb viewing geometry. Labels C1, C2 and C3 identify clouds, labels HC1 and HC2 identify high-altitude clouds. The position of Mayotte island, Andoany and Cap d'Ambre are indicated. The shape of the west coast of Madagascar can be seen in the image competing with the noise level. All compact light sources are inside Madagascar island and are repeated at the exact same geographic positions in a second image of the area obtained 50 s later.
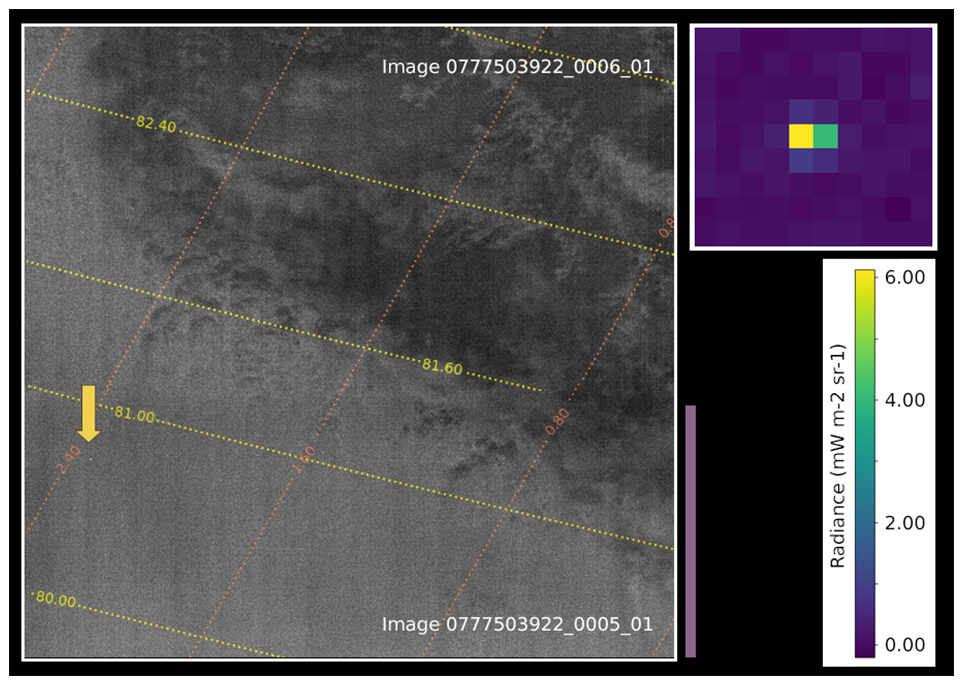
Figure 3Sections of JANUS images 0777503922_0005_01 and 0777503922_0006_01 combined in a single image. A purple vertical line shows the area in which both images superimpose (the original images have much larger FOVs). That region is shown in this figure from image 0777503922_0005_01 containing a lightning candidate highlighted with a yellow arrow. The illumination of this scene comes from the Moon. A magnified view of the light distribution over the area covered by the lightning candidate is shown in the upper right corner.
Nighttime observations of the Indian ocean showed an interesting case of a dim light spot over a convective cloud. Figure 3 shows a group of moderately bright pixels appearing on image 0777503922_0005_01 acquired at 21:23:13 UTC. This small light spot was located inside a convective system at 80.73° E, 2.32° N, south of Sri Lanka, and has a distribution of light close to the Point Spread Function (PSF) of the instrument for a punctual source. An image of the same area obtained 50 s later (image 0777503922_0006_01) does not show the same group of mildly bright pixels. Both images had a spatial resolution of 196 m and an exposure time of 36.1 ms. Meteorological satellites show the presence of a ∼ 4000-km long convective line at that region. In order to investigate the nature of this event, we examined lightning detections of the area captured by the Earth Networks Total Lightning Network (ENTLN). This network locates lightning activity from a global array of radio sensors capturing broadband radio-frequency emissions from lightning discharges (Zhu et al., 2022). We also examined data from the popular Blitzortung network operated by volunteers (Narita et al., 2018). However, none of these networks show any signature of a lightning event in the 4 s around the time of the JANUS image acquisition. Also, the World-Wide Lightning Location Network (WWLLN) detecting very-low-frequency radio waves (“sferics”) that can travel thousands of kilometers from their lightning origin (Rodger et al., 2009) did not observe lightning on that specific location over the 21:00–22:00 UTC time range. These negative detections imply that if there was a lightning event it should have been a very weak one.
Since all JANUS images are calibrated in radiance, the optical energy of the group of bright pixels can be estimated. To do that we integrate the total flux of the group of pixels in the image using aperture photometry to remove the background illumination (12 ), we multiply by the pixel area (1962 m2) and by the exposure time of the image (36 ms). A multiplication by a geometric correction factor 4π is also included assuming isotropic emission. This results in an estimated detection of optical energy for this event of 210 J. This evaluation of the optical energy does not take into account light extinction within the cloud. Since exposure time and lightning development time-scales are comparable, the energy associated with these bright pixels represent a lower energy limit to the energy of the lightning candidate.
The optical energies of lightning flashes in the visible wavelength range is typically on the order of 1.2–3.6×10⁶ J depending on lightning type (Quick and Krider, 2013; Peterson and Liu, 2013; Peterson et al., 2017), although substantially weaker flashes have also been reported. Thus, the energy detected in this event is about 4 orders of magnitude below typical values of optical energy of lightning in the visible and near-infrared. This order of magnitude estimate of the optical energy is also 2–4 orders of magnitude smaller than reported optical energies of sprites (Sentman et al., 1995; Wescott et al., 1995; Takahashi et al., 2010) and is also much smaller than other Transient Luminous Events (TLEs) like ELVES, Halos or Blue Jets (Pasko et al., 2012). The estimated read-out noise of this image is about 0.05 , or about two orders of magnitude smaller than the estimated radiance of this event.
Since noise from a cosmic ray or particle hit at the detector cannot be disregarded, this event highlights the difficulties to identify the nature of weak light sources on nightside images. For the future JANUS investigation of Jupiter lightning, defining a detection threshold for lightning can be problematic when analyzing observations acquired from large distances in the more energetic environment of the Jovian magnetosphere. Systematic observations will acquire enough detections to provide an identification threshold based on statistics on the events observed.
Since noise from cosmic rays or particle hits at the detector cannot be fully disregarded, this event highlights the difficulty of identifying weak light sources in nightside images. In principle, cosmic rays may be distinguished from lightning flashes by their sharper spatial profiles compared to the instrument small point spread function (PSF) (currently being analyzed from stellar observations during check-out operations). For future JANUS observations of Jupiter's nightside, defining a robust detection threshold for lightning remains challenging in the energetic Jovian magnetospheric environment and systematic observations will be required to build a robust statistical identification criteria based on detected events.
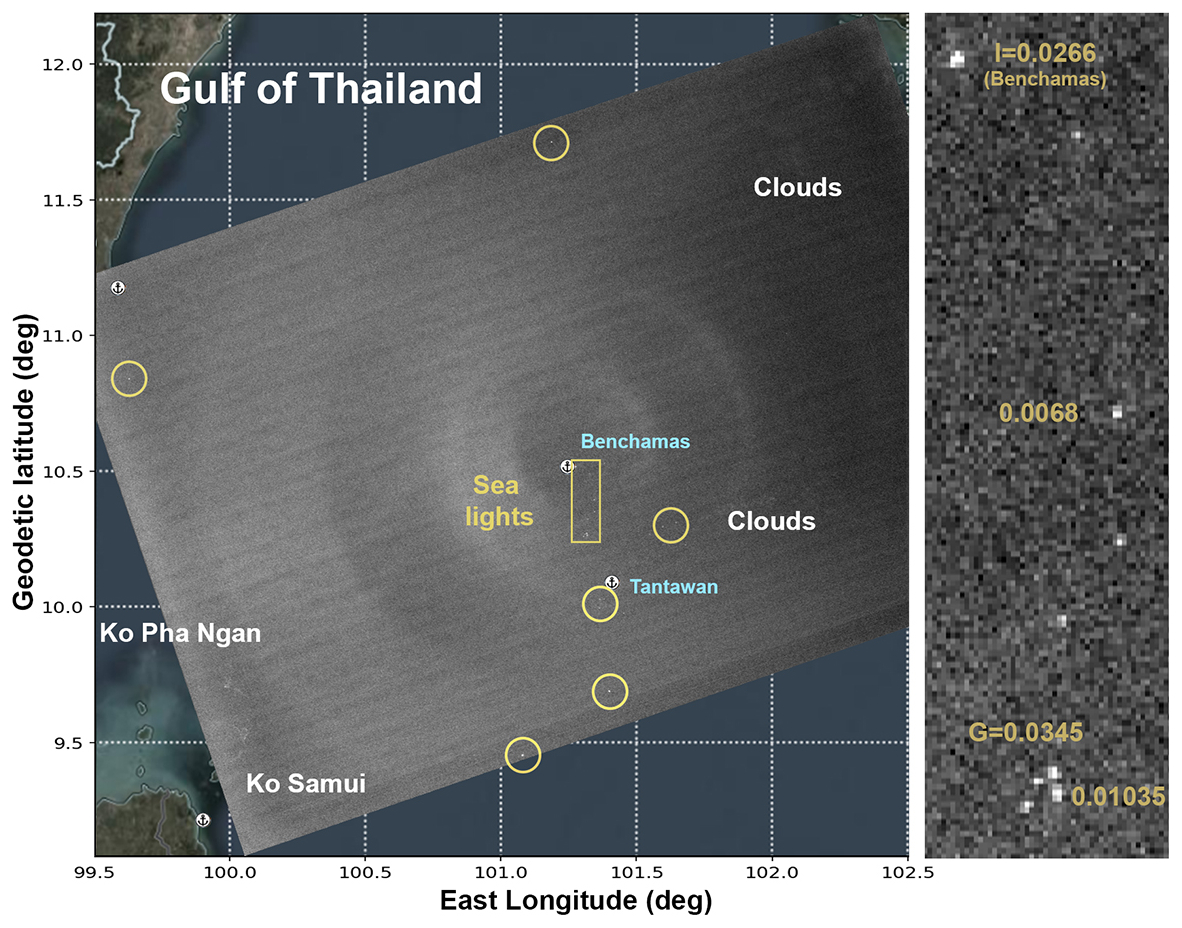
Figure 4Cylindrical map projection of JANUS image 0777503922_0014_01 showing the Gulf of Thailand. The image was obtained with the panchromatic filter with an exposure time of 25 ms, and the pixel scale 165 m. The image has been mapped and placed on top of a map of the area to provide context. Coastal lights around the Ko Pha Ngan and Ko Samui islands are clearly visible at the spatial resolution of the original images. Compact lights in the sea are highlighted with circles. The location of Benchamas and Tantawan offshore ports and oil gas fields are indicated. A zoom of the rectangular area highlighted in the map shows the strongest lights present in the image. Numbers in the figure correspond to radiance levels calculated for individual lights using aperture photometry and given in units of . G stands for the group of 4 individual light sources in the bottom part of this rectangle.
Another image with interesting compact light sources is an image of the Gulf of Thailand (Fig. 4). In the image showed in this figure, the scene is illuminated by the Moon, which is at low elevation on the WSW direction. Stray light effects create the large-scale circular pattern visible on the image. Several small and bright patches of light are observed over the sea and in coastal populations in two islands on the lower-left side of the image. The lights observed over the sea are located in densely traveled maritime routes, and the largest and brightest clusters of light are concentrated near the offshore Benchamas and Tantawan oil and gas fields, which suggest that the compact light sources are the industrial facilities of the offshore gas fields and large ships or groups of ships. The radiance of the spot identified at the geographical location of Benchamas is 27 , and individual spots likely associated with individual ships or cluster of ships have radiances of 3–10 (e.g. each of them are similar individually to the event shown on Fig. 3, but their alignment over a heavy traveled maritime route reveals their nature).
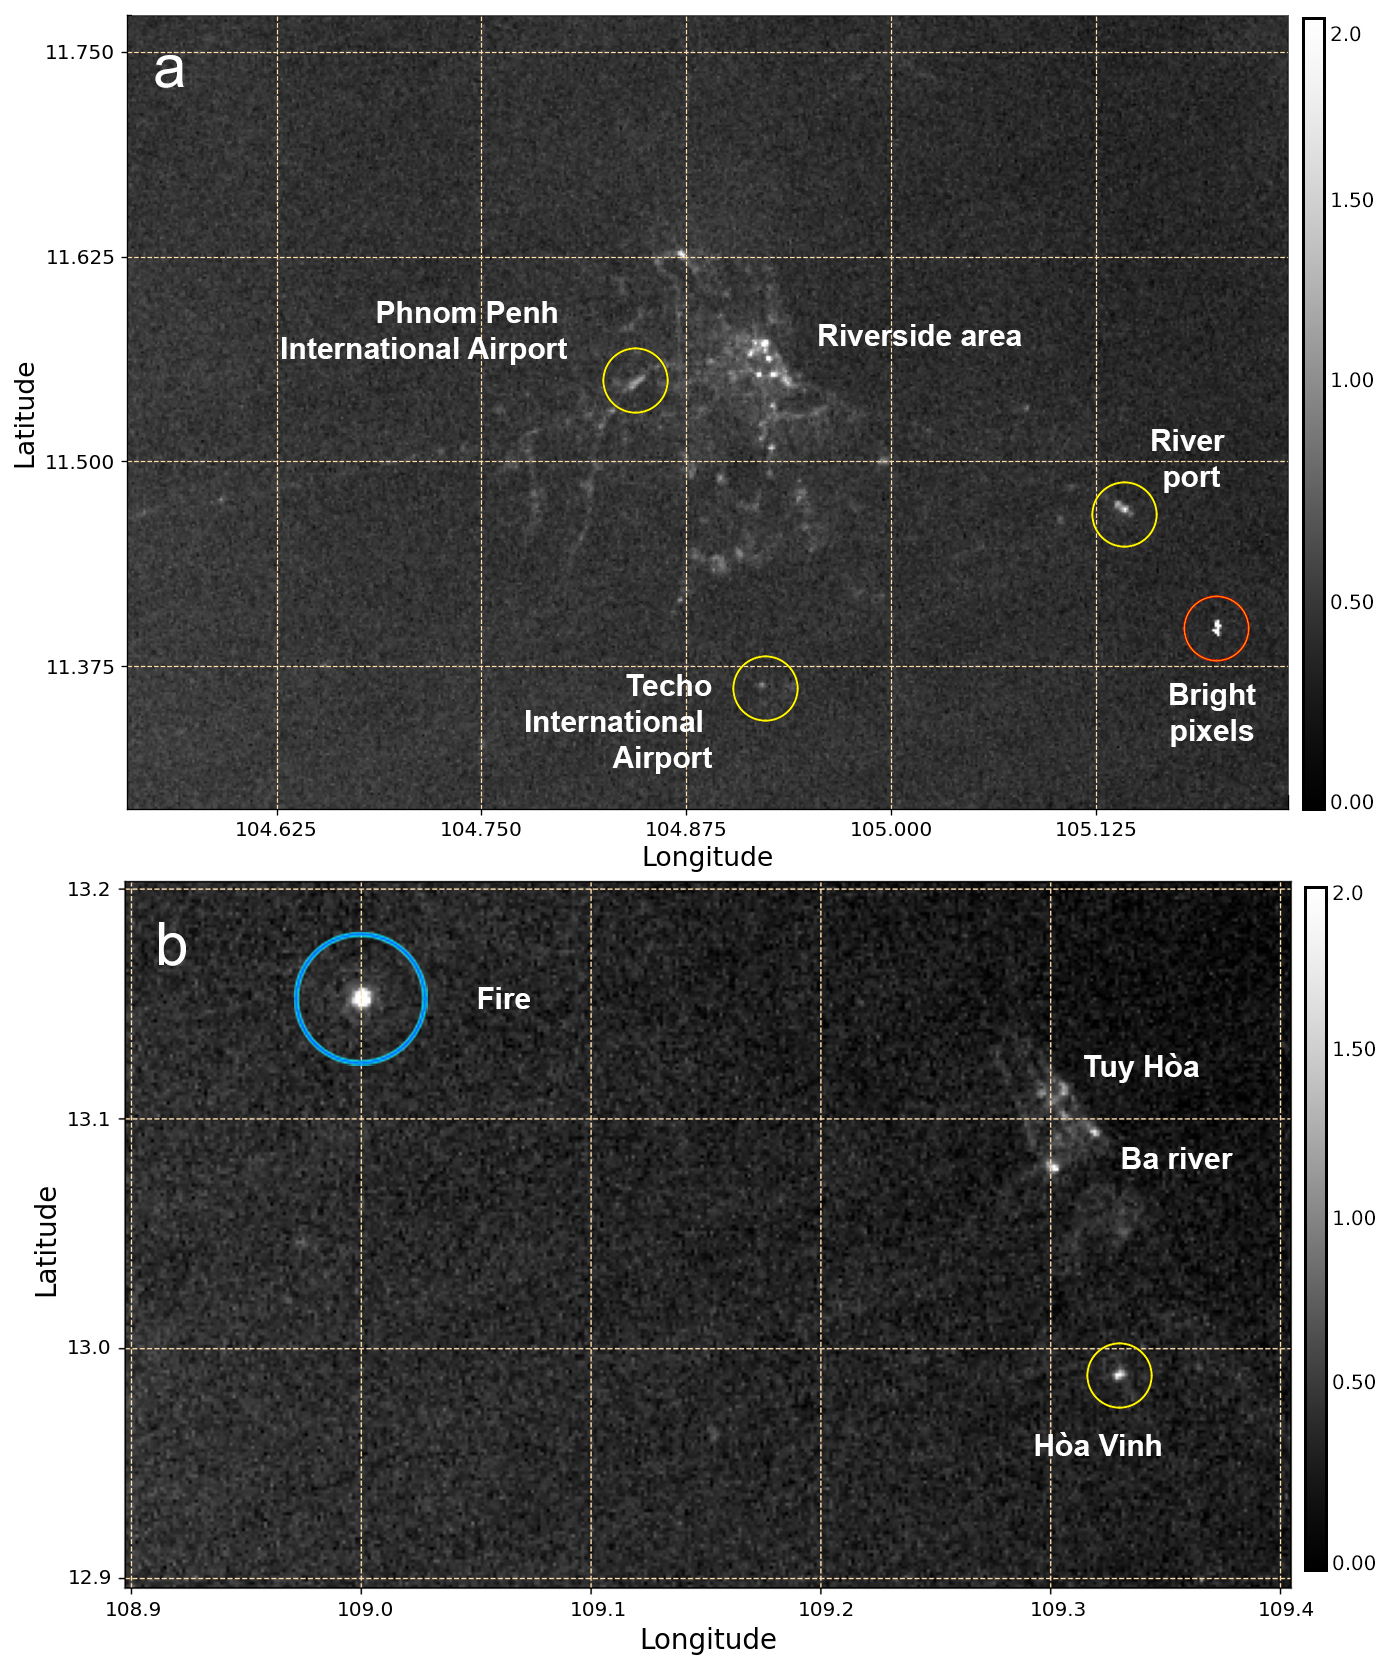
Figure 5Sections of cylindrical map projections of JANUS images 0777503922_0015_01 and 0777503922_0017_01. (a) Cambodia's capital, Phnom Penh. The image had a pixel scale of 160 m and a exposure of 25 ms. A group of bright pixels far from cities and villages is highlighted with a red circle and is discussed on Sect. 3.3. (b) Tuy Hòa and surrounding area in Vietnam's coast. The image had a pixel scale of 152 m and a exposure of 25 ms. A large and bright fire is observed at 13.15° N, 109.00° E.
JANUS also captured images of bright lights in different cities. Figure 5 shows Cambodia's capital Phnom Penh and the small city of Tuy Hòa in the coast of Vietnam. Phnom Penh and Tuy Hòa have populations of 2.0 million people and 160 000 people respectively. The city center near the riverside area in Phnom Penh and several large infrastructures can be identified in the JANUS image when comparing with maps of Phnom Penh. The Tuy Hòa image also shows a bright spot that corresponds to the most intense fire observed by JANUS, with its nature confirmed from a comparison with FIRMS data.
The image with Phnom Penh also shows two sets of bright pixels (one is highlighted with a red circle in Fig. 5 and the other is outside the FOV shown in this figure). The nature of these sources is discussed in the next subsection.
Values of the observed optical energy associated with the light sources observed in these images can be calculated following the same technique used for the lightning candidate previously discussed. Integrated energy from Phnom Penh and its city center are 8080 and 5570 J respectively (although these numbers are more uncertain than for compact light sources due to the extended source and background illumination from the Moon). The optical energy of the intense fire near Tuy Hóa is estimated as 1500 J, which is three orders of magnitude smaller than a typical lightning flash (Quick and Krider, 2013).
Most compact light sources observed on JANUS images of the Earth are created by fires or artificial sources, and the single lightning candidate observed over a convective cloud system had an estimated detected optical energy that even under conservative assumptions is several orders of magnitude lower than typical space-based detections of lightning flashes. However, we note that the intrinsic luminosity of the flash could be much larger if this were a low altitude lightning obscured by high opacity clouds.
When evaluating the lack of firm detections of lighning in these JANUS images, it is worthy to note that the efficiency of a camera-based lightning search depends on the total spatial and temporal coverage of the ensemble of observations (how much terrain has been observed and over how much time). The 20 JANUS nighttime images of the Earth covered a total area per time of ∼ 89 000 km2 s (assuming for simplicity nadir pointing for all images and multiplying the area covered by each image by their exposure time and adding their totals), or km2 yr. Extensive observations of lightning from space show a lightning flash frequency of 20–30 flashes km−2 yr−1 in strongly lightning active regions, and values of about 5 flashes km−2 yr−1 for tropical latitudes (Christian et al., 2003). Thus, the observational efficiency of the JANUS nighttime images is very small compared with lightning rates. For instance, image 0777503922_0014_01 (Fig. 4) of the Gulf of Thailand, which is known to be a very active site of lightning, covered 79 300 km2 and was acquired with a exposure time of 25 ms, meaning that it had an efficiency of km2 yr. This translates in a probability for this image of containing a lightning flash of only 0.2 %. For the whole set of nightside observations, and considering a representative value of 5 flashes km−2 yr−1, we get a probability for the JANUS nightside dataset of ∼ 1.5 % of containing a single lightning event. In addition, diurnal flash rates are found to be near their minimum values in the 03:00–06:00 local time (Blakeslee et al., 2014), further reducing the probability of observing lightning in the JANUS nocturnal data set, which was concentrated in that time range.
These aspects can be further examined observing the lightning activity over the area traversed by JANUS from networks of lightning detection based on radio receivers. Figure 6 shows the ensemble of lightning detections from spherics detected by the WWLLN and Blitzortung networks on the area of the Indian Ocean over the 21:00–22:00 UTC time range. For information on the coverage and detection efficiency of the WWLLN detections the reader can refer to Hutchins et al. (2012). Only a few lightning strokes occurred over a full hour on some of these JANUS short-exposure frames, confirming the low probability to observe lightning events. However, lightning activity was occurring very close to the JANUS images shown in Fig. 3, and the nature of the local meteorological activity indicates that electric activity was indeed possible on that location. The JANUS image 777503922_0011_01 covered also a region of strong convection with lightning activity over the 1 h time interval shown in Fig. 6. A close inspection of this image did not show any lightning candidate to brightness levels at least four times smaller than the weak candidate shown in Fig. 3.
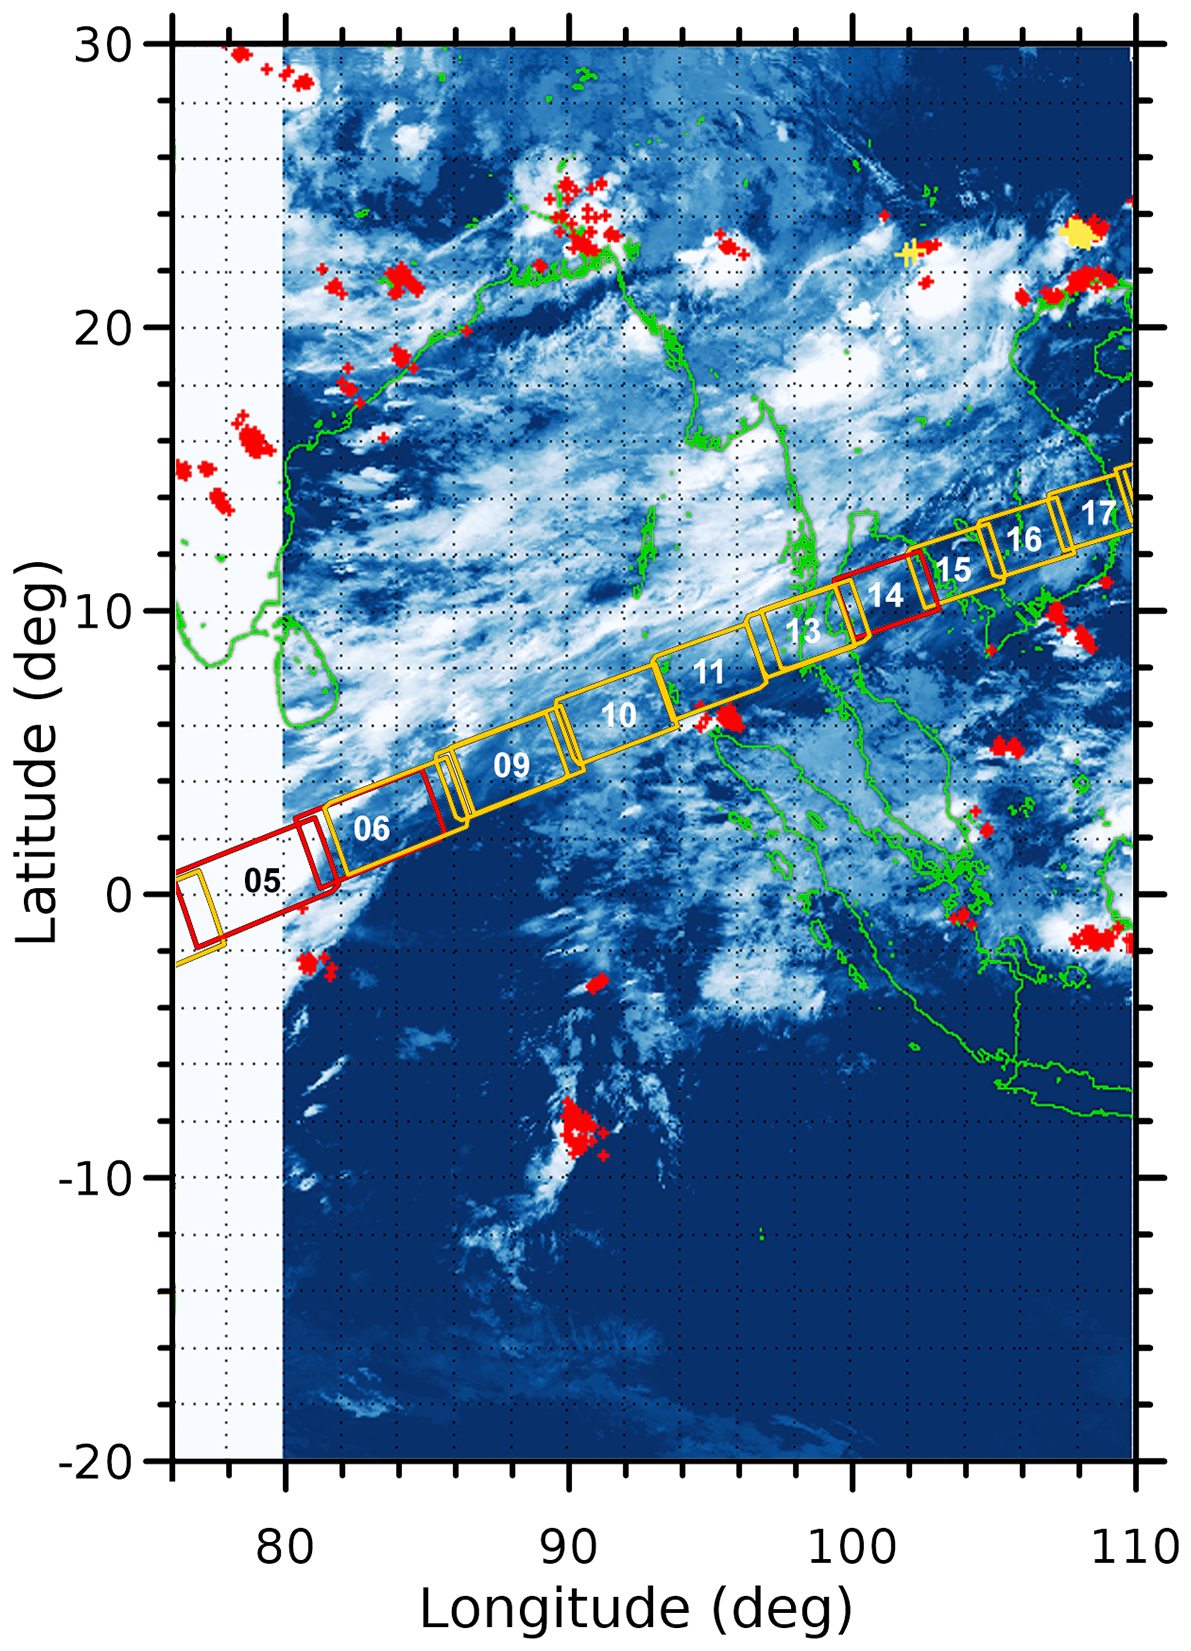
Figure 6Locations of lightning strokes on August 20th, 2024 in the interval of 21:00–22:00 UTC from the WWLLN data (red crosses) and Blitzortung (yellow crosses) networks of radio receivers. JANUS FOV of individual images from 0777503922_0004_01 to 0777503922_0017_01 are shown in color. Images discussed in the text, like 05 and 06 with a very weak lightning candidate, and 14, covering the Gulf of Thailand, are shown with red polygons. The background is an IR image from the Himawari satellite, operated by the Japan Meteorological Agency, and captured at 21:20 UTC on 20 August 2024.
JANUS will extensively characterize lightning events in Jupiter's atmosphere. Lightning observations will have a combination of long exposure times, accumulating several flashes over the same area, and short exposures to observe individual flashes. Jovian lightning is far more intense than lightning on Earth, but it will be observed from much larger distances allowing statistical mapping and determination of the size of lightning spot sizes which constrains lightning depth (Borucki and Magalhaes, 1992; Little et al., 1999; Gierasch et al., 2000; Dyudina et al., 2004). So far, the largest optical survey of lightning activity on Jupiter comes from the Galileo orbiter, which determined a flash rate above a given energy threshold of flashes km−2 yr−1, with lightning sources concentrating in cyclonic regions (Little et al., 1999). A lightning survey from the Stellar Reference Unit on Juno, which is a far more sensitive instrument than the ISS camera on Galileo, gave flashes km−2 yr−1 for lightning observations over high latitudes (Becker et al., 2020). In addition, the lightning activity detected by radio instruments can be significantly higher (Imai et al., 2020), indicating the difficulties to observe in the visible weak or deep atmosphere lightning events. Thus, for its survey of Jovian lightning, JANUS will obtain repeated observations of large and small areas of Jupiter using a combination of short and long time exposures to maximize the efficiency of those surveys and understand the weak light spots from statistics of the results. Observations of hot pixels, cosmic rays and energetic particles in the high-energy Jovian environment will characterize those effects on the detector, helping to understand the capability of the instrument to unambiguously characterize weak lightning sources. Observations conducted at a variety of spatial resolutions will give information about the spatial distribution of lightning events, their depth and energy release. Dayside and nightside observations of the same areas will be planned similarly to storms observed by Galileo (Gierasch et al., 2000) and will be a key part of the JANUS investigation of convective storms in Jupiter. In addition, synergetic observations with other JUICE instruments sounding the lower layers of the atmosphere with MAJIS (Poulet et al., 2024) and upper layers with the Ultraviolet Spectrometer instrument on JUICE (Davis et al., 2021), together with radio emissions with the RPWI (Wahlund et al., 2025) (e.g. similarly to recent multi-instrument analyses with Juno, see Brueshaber et al., 2025 or previous works in Saturn with Cassini, see Dyudina et al., 2010) will be particularly relevant to investigate the spatial distribution, energy output and impact of storms in the Jovian atmosphere.
3.3 Searches for meteor candidates
JANUS images of the Earth show two moderately bright events that we could not associate to surface features, were too weak to imply lightning, and occurred in regions not covered by clouds. These two events appear on the JANUS image 0777503922_0015_01 over Cambodia. The brightest of these features is highlighted with a red circle in Fig. 5. A detailed image of the structure of both features at pixel scale is shown in Fig. 7. The total flux of the brightest of these two events is a third of the total flux of the large fire visible in Fig. 5b.
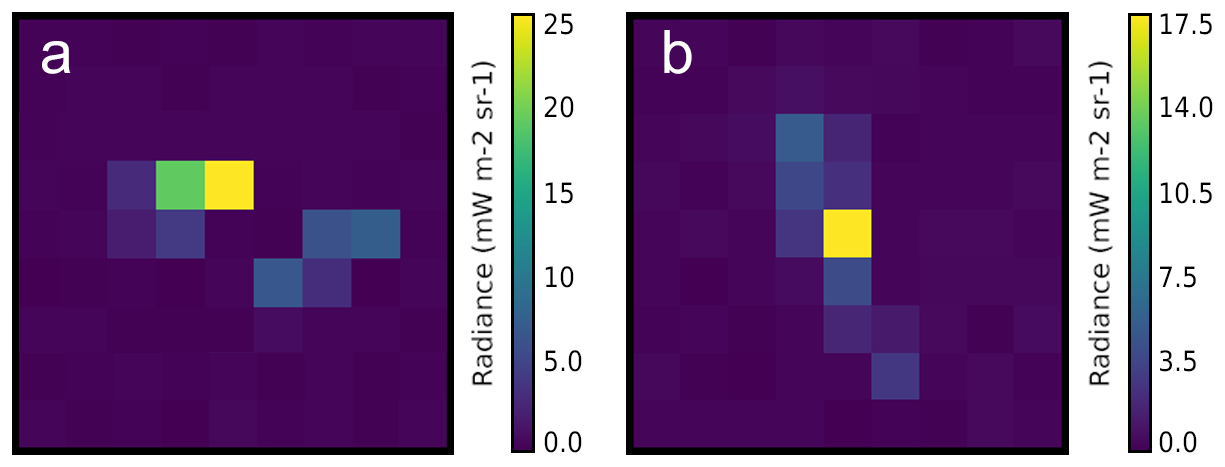
Figure 7Linear streaks of pixels in JANUS image 0777503922_0015_01. Panel (a) is centered at longitude 105.20° and latitude 11.40°. Panel (b) is centered at longitude 104.83° and latitude 12.07°. Note the two different color scales for these two features. Pixel scale is 158 m and exposure time is 25 ms.
If these events were true detections of transient light sources, the detected energy required to create these streaks would be compatible with meteor streaks from small objects entering Earth's atmosphere. From the radiance values, pixel scale of 158 m per pixel, and 25 ms exposure time, the integrated optical energy of the two events in Fig. 7 would be 549 and 266 J respectively. For luminous efficiencies of 1 %–10 % (Drolshagen et al., 2021), these values of optical energy can be released from meteors impacting Earth's atmosphere at speeds from 11–70 km s−1 with masses of 1–30 g.
However, a comparison of the sharpness of these bright features with the instrument PSF, which can be roughly approximated by a Gaussian with a FWHM of 1.6±0.4 pixels in the panchromatic filter from fits to stellar-sources imaged during check-out operations, suggests that these features might be created by cosmic rays or energetic particle hits on the detector. Thus, cosmic rays identification and rejection methods (e.g. van Dokkum, 2001) may need to be tested on JANUS images under a variety of observing conditions.
Even though these two events are most likely created by energetic particles or cosmic rays, there is a considerable interest to detect and characterize impacts in Jupiter from small-size objects leaving visible traces in the atmosphere that could be similar to these two groups of pixels. Jupiter receives a flux of impacts that is much greater than that of Earth. Voyager 1 observed one small impact in Jupiter from a distance of 555 000 km and at a pixel scale over Jupiter of 20 km from an object with an estimated size of 11 kg (Cook and Duxbury, 1981). The UVS instrument on the Juno mission detected a single bolide with an estimated mass of 250–5000 kg. The impact rate for objects of similar mass and size is considered to be around 24 000 yr−1 (Giles et al., 2021). Juno also observed several candidates to TLEs in a proportion of 10 to 1 with respect to impacts (Giles et al., 2020). Super bolides observed in Jupiter from Earth with sizes of 5–25 m in diameter are expected to hit Jupiter 10–65 times per year lighting the atmosphere at the impact location for only a few seconds (Hueso et al., 2018).
Planed JANUS observation of Jupiter's nightside will most likely observe dozens of impacts in the size category of the one observed by Voyager 1, and many more smaller given the more sensitive camera than the one in Voyager 1 and the larger coverage over the nightside of the planet over the 3.5 years orbital tour. It should also be able to observe several energetic impacts similar in size and energy to the one detected by Juno. Building a sufficiently large set of observations of impact events in Jupiter would help immensely in the determination of the current impact rate in the planet, the size distribution of meteoroids, and the role of these impacts in polluting the upper stratosphere. In order to efficiently identify small impacts from cosmic rays, JANUS will have to test or develop a cosmic-ray identification and rejection technique, appropriate to the characteristics of the JANUS detector and the energetic environment of the Jupiter observations.
4.1 Dawn images
JANUS images obtained near dawn show illumination effects created by tangent illumination close to the terminator. Figure 8 shows high cumulus clouds observed before sunrise, during the morning astronomical twilight. Here, scattered light from the distant dawn terminator travels over the upper atmosphere and illuminates the uppermost clouds in the scene half an hour before local sunrise. A comparison with later observations during morning hours over the tropical latitudes covered by JUICE suggests these cumulus clouds may have high cloud tops at heights of 10–14 km. Several cloud systems are observed in the lower troposphere with very low illumination and without projecting observable shadows.
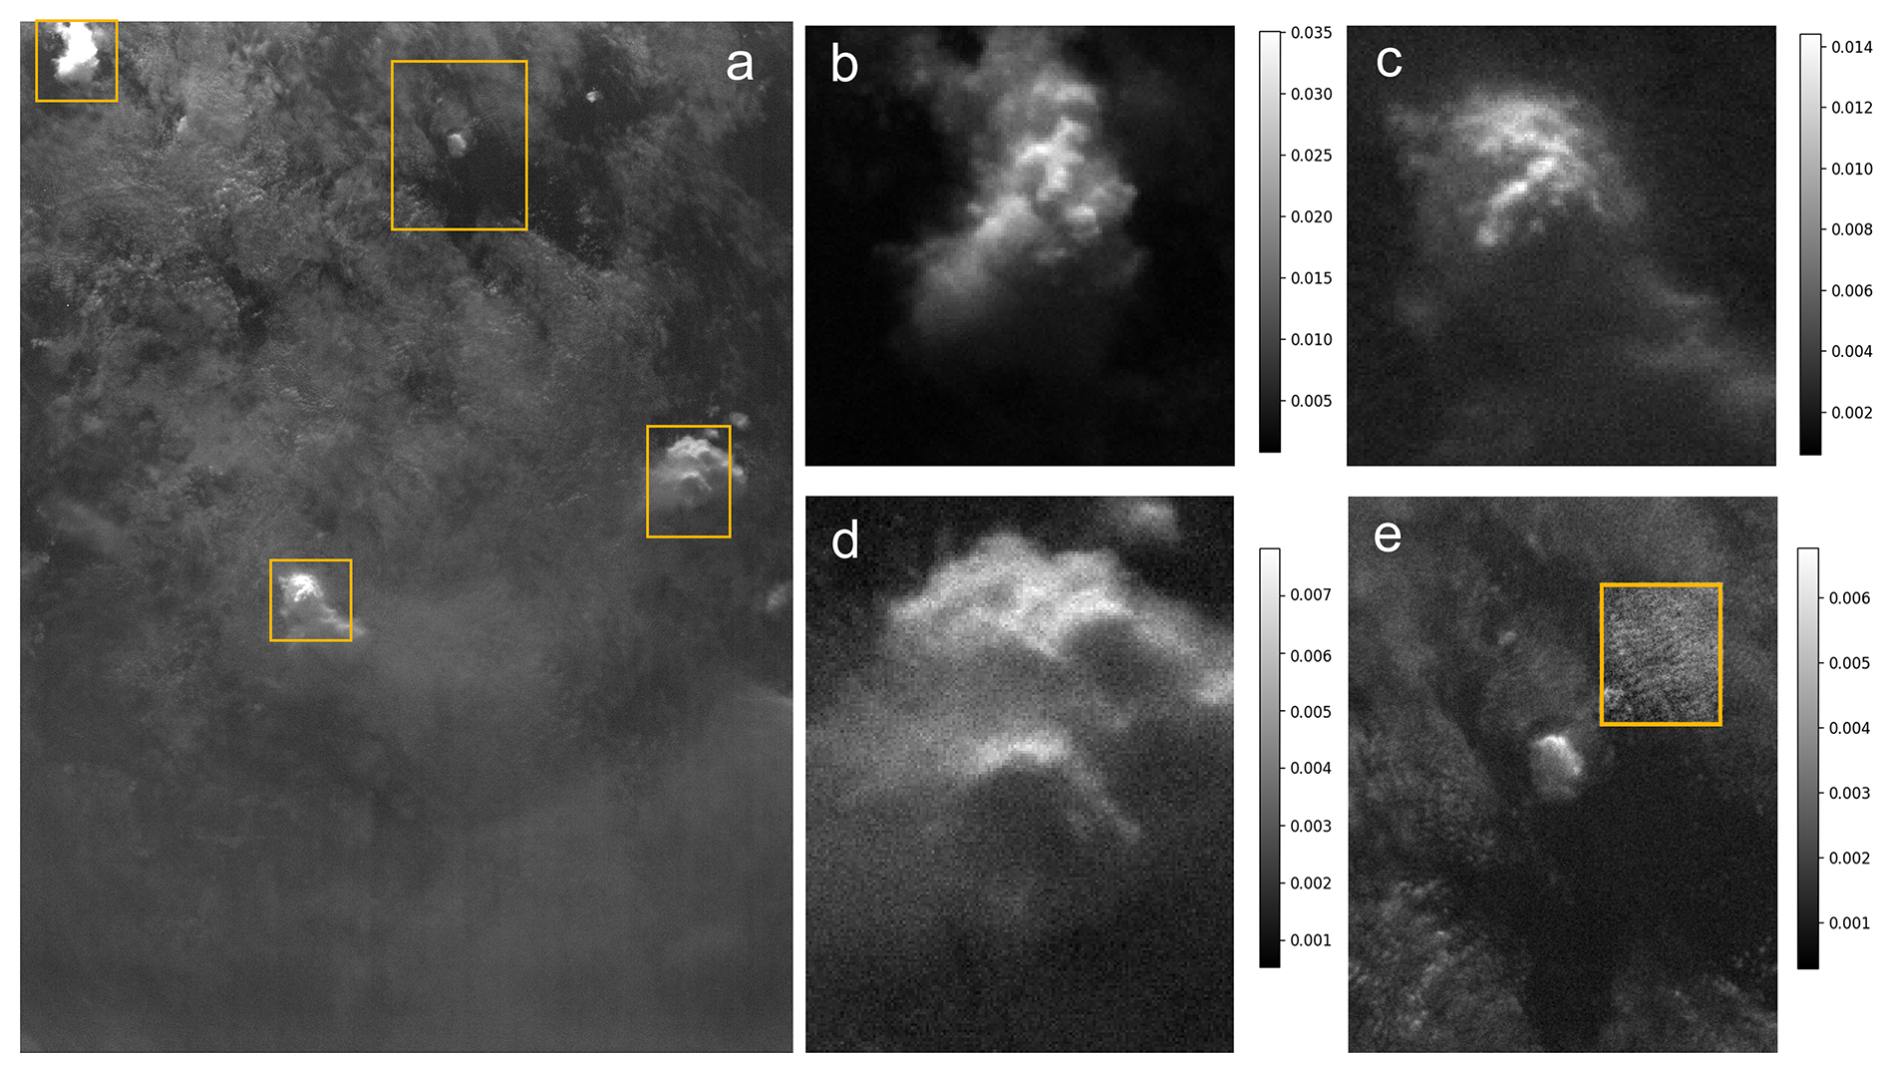
Figure 8JANUS image of the morning twilight. (a) JANUS image 0777503922_0020_1 showing elevated cumulus clouds illuminated from sun light refracted over the upper levels of the middle atmosphere. The illumination comes from top of the image (East). The moon is setting in the West. The image is displayed using a power-law γ stretch, (e.g. Gonzalez and Woods, 2018), with γ=0.4, to simultaneously show bright and dark features in the image. The lower clouds visible in the upper part of the image show a strong gradient in illumination, while the lower part is illuminated only by the Moon light and shows homogeneous lighting. The pixel scale is 144 mand the FOV is 288 km × 215 km centered at planetocentric latitude 16.131° and longitude 115.71° over the South China Sea. Gold boxes in (a) highlight regions shown in panels (b)–(e) with a zoom factor of about 6. (b) Cumulus cloud illuminated 26 min before local dawn. (c) Cumulus cloud at a location 32 min before local dawn. (d) Cumulus cloud 30 min before dawn. (e) Low elevation clouds 26 min before local dawn. Inset shows a contrast-enhanced subregion of the image where gravity waves can be observed in the background clouds. Panels (b)–(e) are shown in linear scale with no gamma correction. Color bars in (b)–(e) show radiance levels in units of .
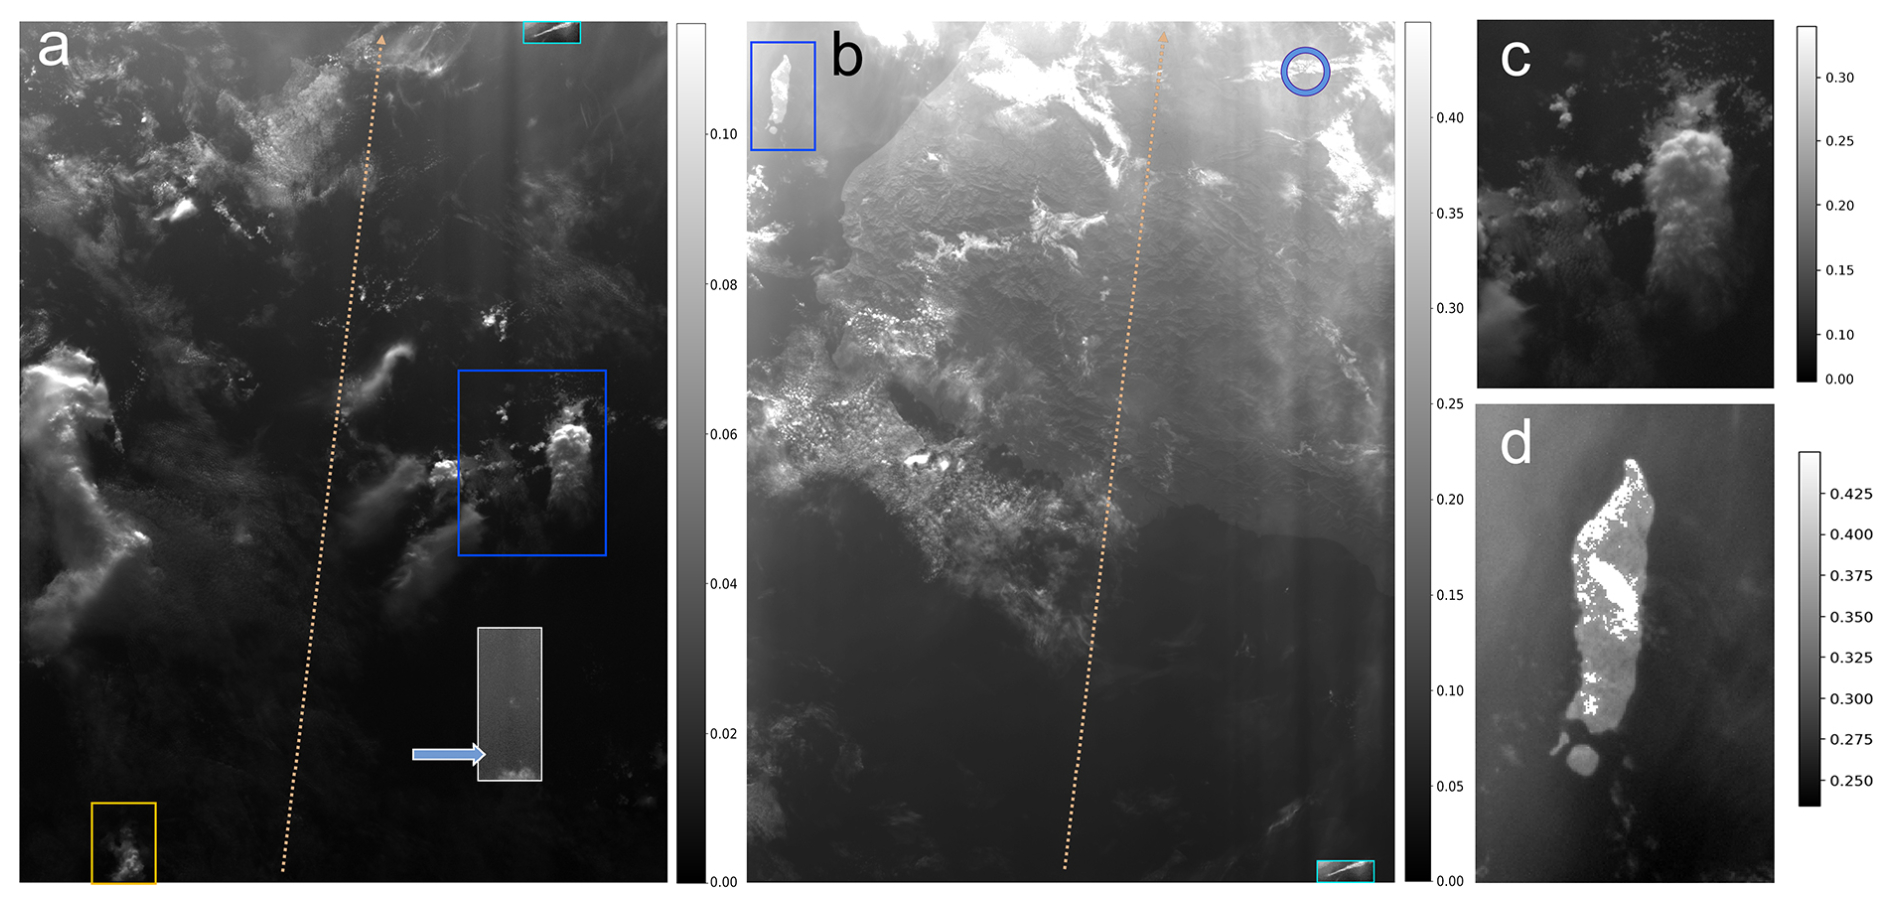
Figure 9JANUS images near sunrise. (a) Image 0777503920_0021_1 over the South China Sea. (b) Image 0777503920_0022_1 over Luzon island. A diagonal arrow in panels (a) and (b) shows the direction of the spacecraft motion from bottom to top. A small inset highlighted in cyan in panels (a) and (b) shows a common feature in both images illustrating spatial continuity between the two images. The orange box in (a) shows the cumulus cloud showed in Fig. 8b. Blue boxes in (a) and (b) indicate regions showed in higher detail in panels (c) and (d). A blue circle in (b) and a blue arrow in (a) show the start and end respectively of an extremely elongated shadow that traces the direction of the Sun illumination and reaches a length of 512 km. A white box in (a) shows a contrast-stretched inset of the image to show the end part of the elongated shadow (a). Crepuscular rays are observable in (a) and (b) parallel to this shadow. (c) Zoom version of the cumulus cloud highlighted in (a). (d) Fuga Island, north of Luzon, appears partially saturated 3 min before local sunrise. Color bars show radiance levels for each panel in units of . Saturated pixels on (a), (b) and (d) are shown in white.
As the spacecraft moved towards dawn, the illumination increased rapidly and elevated clouds started to receive direct illumination from the Sun refracted on the atmosphere. Figure 9 contains two consecutive images close to the dawn terminator showing a strong gradient in the illumination of the scene. The left panel shows that the light increases by a factor of 3.5 over a distance of 280 km approaching dawn. The next JANUS image acquired in the sequence and displayed in the center panel, shows an additional enhancement of brightness by a factor of 4.0 over the next 280 km. This image saturates near dawn (all elevated clouds and some low terrains appear saturated in the upper part of the image, closest to dawn). Both images show crepuscular rays, (CRs), which are alternating dark and light bands in the sky that take the form of light streaks as sunlight filters through cloud gaps (Minnaert, 1954; Lynch, 1987). The crepuscular rays in these two images are a combination of shadows and forward scattering on the elevated aerosols present in the images (Van Den Broeke et al., 2010). The long shadow highlighted in this figure reaches a length of 510 km.
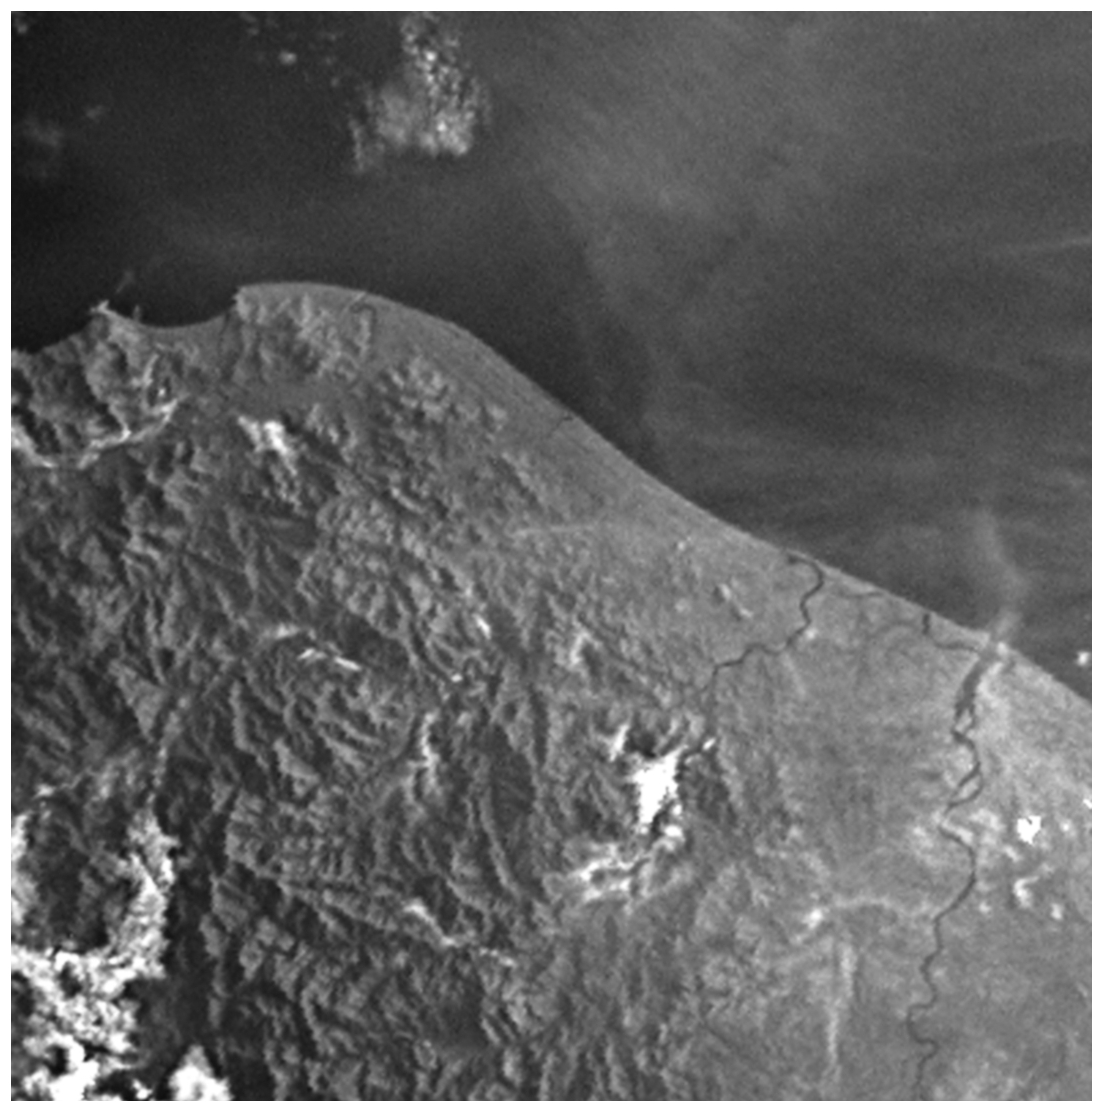
Figure 10Details over the Cagayan province in the north coast of Luzon island at dawn from image 0777503922_0022_01. A section of about 370×370 pixel in the original image has been mapped into a cylindrical projection with longitudes from 121.0 to 121.50° E longitudes and latitudes from 18.25 to 18.75° N. North is up and East is to the right. The image has been high-pass filtered. High clouds appear saturated.
Figure 10 shows details over the north coast of Luzon island. The lateral illumination by a rising sun shows strong contrasts associated with the mountainous terrain, visible rivers and the coast. Dense clouds appear saturated and thin cirrus with gravity waves are also visible in the image. A long-dark feature in the sea is probably an internal ocean wave, common in the Luzon strait (Yuan et al., 2006). This small portion of the original image demonstrates the high-resolution of the JANUS images, and the capacity to observe very faint contrasts as those coming from the cirrus clouds and from the linear features in the coast produced by the parallel alignment to the coast of local populations. It is remarkable that the high clouds in Fig. 10 do not project shadows over the terrain because of the almost total horizontal illumination, which contrasts with the CRs on Fig. 9 in which CRs propagate at altitudes near the elevation of the original clouds casting shadows and leaving gaps over thin layers of elevated aerosols. Because the terrain is mostly illuminated by diffuse dawn light, mountain shadows are not as strong as they would be if the Sun had fully risen.
Observations of the Earth terminator were acquired under a 90° phase angle. A similar illumination will be common in many JUICE perijoves in which images of the planet at spatial resolution of 15 km per pixel will be common. With Earth's terminator showing complex illumination effects over 500 km, and Jupiter's larger radius by a factor of 11, JANUS images of the terminator may observe similar extreme illumination conditions in Jupiter helping to identify and separate upper and lower clouds like those observed in Figs. 8 and 9. Such illumination effects at the terminator will cover a significant portion of the JANUS detector allowing to explore these effects if appropriate exposure times to the challenging illumination can be determined.
5.1 Cloud altitudes from shadows
Earth observations obtained soon after local dawn show a variety of cirrus and cumulus clouds that project long crepuscular rays and shadows.
Two sequences of multi-filter images were obtained minutes after local sunrise with nearly tangent illumination and nadir viewing. Figure 11 shows part of one of these sequences obtained about 12 min after local sunrise. The images show cumulus clouds and elevated cirrus in color and in the JANUS filter F8 centered at 940 nm. Observations in this filter are strongly affected by the wide H2O absorption band at 820–940 nm. The color image shows a bright convective cloud, most likely a cumulonimbus, elevated dense cirrus, and multiple bright clouds reaching lower heights. Long crepuscular rays dominate the scene in short wavelengths, and shadows projected by the central cumulus cloud are clearly observable in most filters. The F8 image shows much higher contrast associated with the high dense cirrus and the bright convective system, but most other bright clouds in the color image are almost invisible in the F8 image implying shallow cumulus over most of the image.
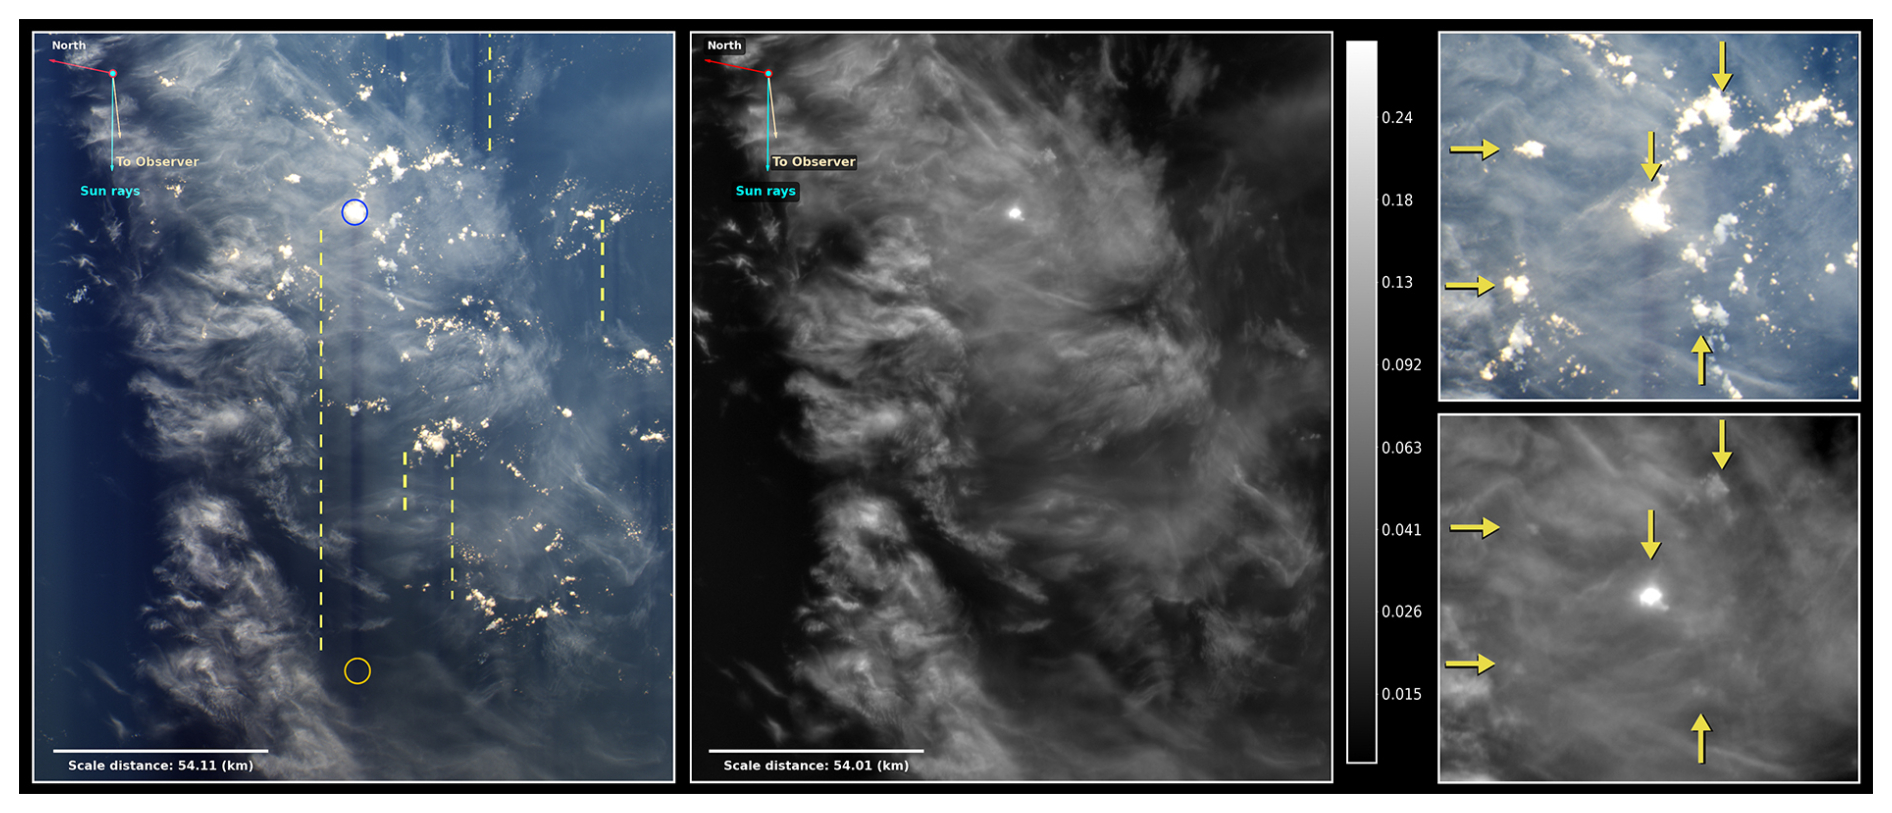
Figure 11JANUS images of clouds and shadows. (a) Color image from JANUS images 0777503922_0039_04, 0777503922_0038_03, and 0777503922_0037_02 in red, green and blue filters respectively. The figure legend shows the North direction and the position of the sun and observer. Yellow dashed lines are shown close to shadows cast from elevated clouds. From left to right these shadows extend over 118, 16, 38, > 36 and 26 km. From a geometric model of the observations these shadows lengths correspond to minimum altitudes of 5.4, 0.7, 1.7, > 2.2 and 1.4 km. (b) JANUS image 0777503922_0044_08 with the F8 filter ( nm) sensitive to water absorption. Only the elevated cirrus clouds and one of tallest cumulus clouds are apparent in the image. Because of the strong contrast the image is shown using a non-linear representation of the brightness levels. The gray bar shows values of radiance in units of . Panels (c) and (d) show zoom-up versions of the area around the tallest cumulus with arrows indicating common features between both images.
No shadows are observed in the image within the F8 filter. This implies that the massive large cloud system observed in the F8 image is at altitudes comparable to or above the convective bright cumulus. The low elevation of the Sun, combined with the homogeneous distribution of brightness in the F8 image, imply that water is concentrated in the lower part of the troposphere (an equivalent image of Jupiter's high clouds with tangential illumination using the JANUS F7 filter in a methane band would result in an image with a gradient in illumination from the vertically well-mixed atmospheric methane). When examining the full multi-filter sequence, the contrast of the shadow and crepuscular rays is maximum in blue and violet wavelengths (most likely because of the forward scattering effects of the crepuscular rays), and is much lower in the F7, F11 and F12 filters, which are centered at wavelengths of 889, 910 and 1015 nm respectively, which are wavelengths also sensitive to weak water absorption bands.
A quantitative interpretation of the altitudes associated with these cloud systems cannot be directly obtained from the multi-filter observations because water abundance probably varies over the scene and the observation does not provide access to different illumination conditions. However, the altitudes of the clouds can be investigated from the shadows casted by the elevated clouds. Figure 12 shows two geometrical analysis of shadows projections. The first one is a simplified version of the geometry assuming no parallax effects. This is correct for an observer at an infinite distance observing a small FOV over the planet under a plane-parallel approximation. Under these conditions, the height h of a cloud can be retrieved from the total extension of its shadow d as:
where i and e are the incidence and emission angles respectively.
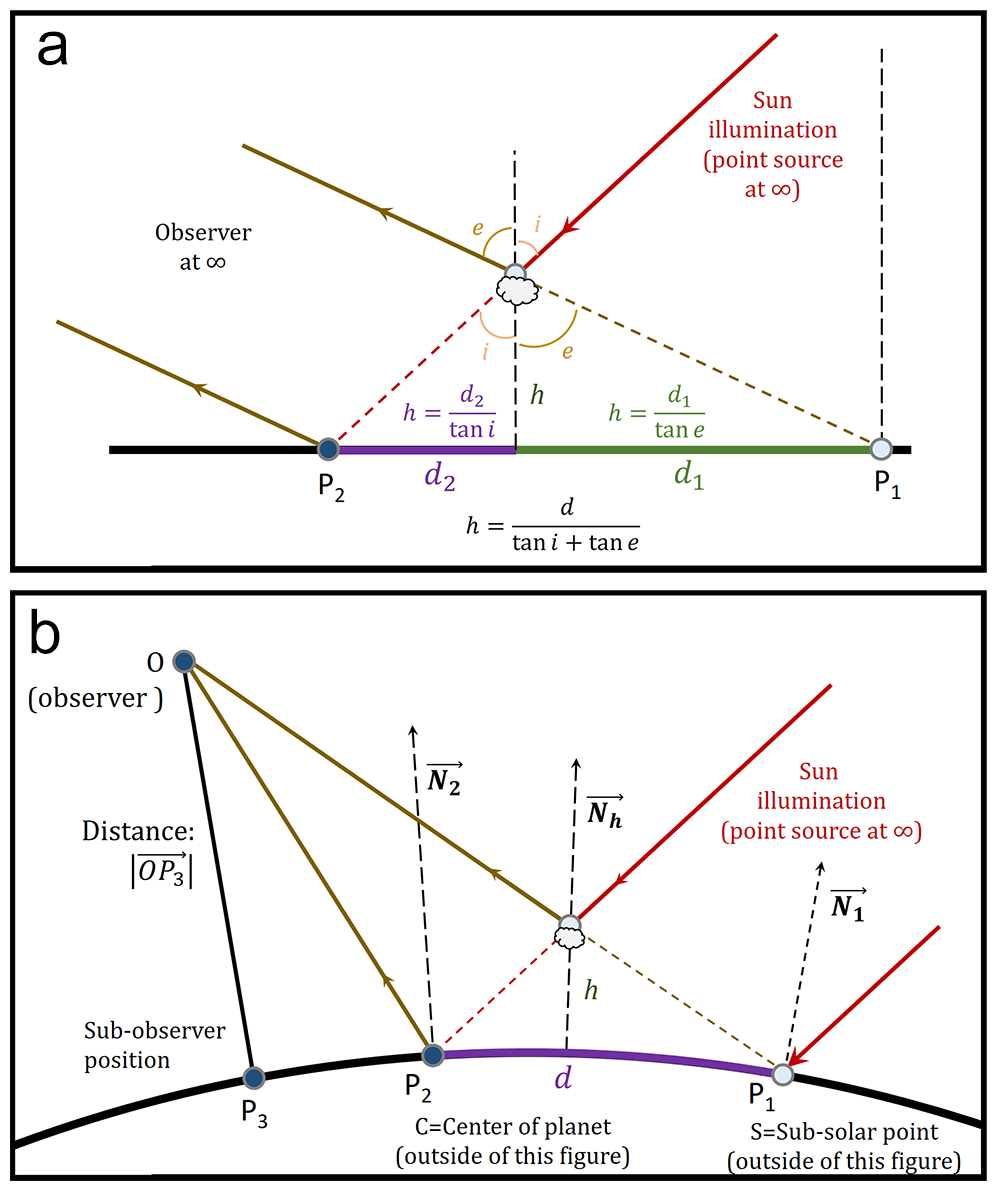
Figure 12Geometry associated with shadow projections under extreme conditions of inclination i and e emission angles. (a) Simple geometry with no effects from parallax. (b) Geometry based on vector calculus. P1 is the projected position of the bright cloud over the surface. P2 is the position of the tail of the shadow observed over the planet's surface. The distance between P1 and P2 is the horizontal extent of the shadow. The figure has been greatly exaggerated, note that e is a small angle in the JANUS observations and that the distance OP3 is larger than the planetary radius and several orders of magnitude larger than the height h of the cloud sketched.
For a close observer (in the images shown in Fig. 11 the sub-spacecraft altitude was 9060 km, the main incidence angle was 86.85° and the main emission angle was 3.56°), an evaluation of heights from shadows requires taking into account parallax and the ellipsoidal geometry of the surface. Figure 12b shows a sketch of the relevant geometry. The cloud altitude evaluation is solved by finding the intersection point between vectors P1O and P2S. Here, points O and S are the positions of the observer and the Sun respectively, and P1 and P2 are the position of the bright cloud and end of its tail respectively. Expressing vectors also with respect to the center of the planet, (i.e. transforming longitudes and latitudes of a point like P1 into the vector CP1) then:
For an ellipsoidal planet like Jupiter the method works in the same way by taking the coordinates of points P1, P2 and P3 referred to the center of the planet and considering the local radius.
For the geometry of the observations shown in Fig. 11, calculating cloud altitudes from shadows in this way results in an increase of altitudes of about 20 % with respect to the use of Eq. (1). It should also be noted that altitudes estimates from shadows in this image are minimum values, since the end of the shadows over the ocean are difficult to determine with the tangential illumination. Several additional calculations of cloud altitudes from shadows are showed in the next section.
5.2 Deep convection
Figure 13 shows a high resolution image of active convection on cumulus clouds imaged with a spatial resolution of 130 m per pixel and observed 1 h after the local sunrise. The cumulus are projecting clouds to distances of up to 65 km, and the cloud tops reach heights above the ocean of up to 14 km. Only observations in a green filter covered this region. No anvil clouds were observed, which suggest, when combined with the early local hour, that convection had initiated near sunrise and had not reached a fully developed mature stage. Because of the illumination and viewing geometry, the cumulus appears tilted towards the bottom part of the image, and the cloud tops and east side of the clouds can be observed simultaneously nearly down to the base of the convective towers. Patchy cloud structures at 1–5 km scales indicate stratocumulus and active boundary layer convection after sunrise.
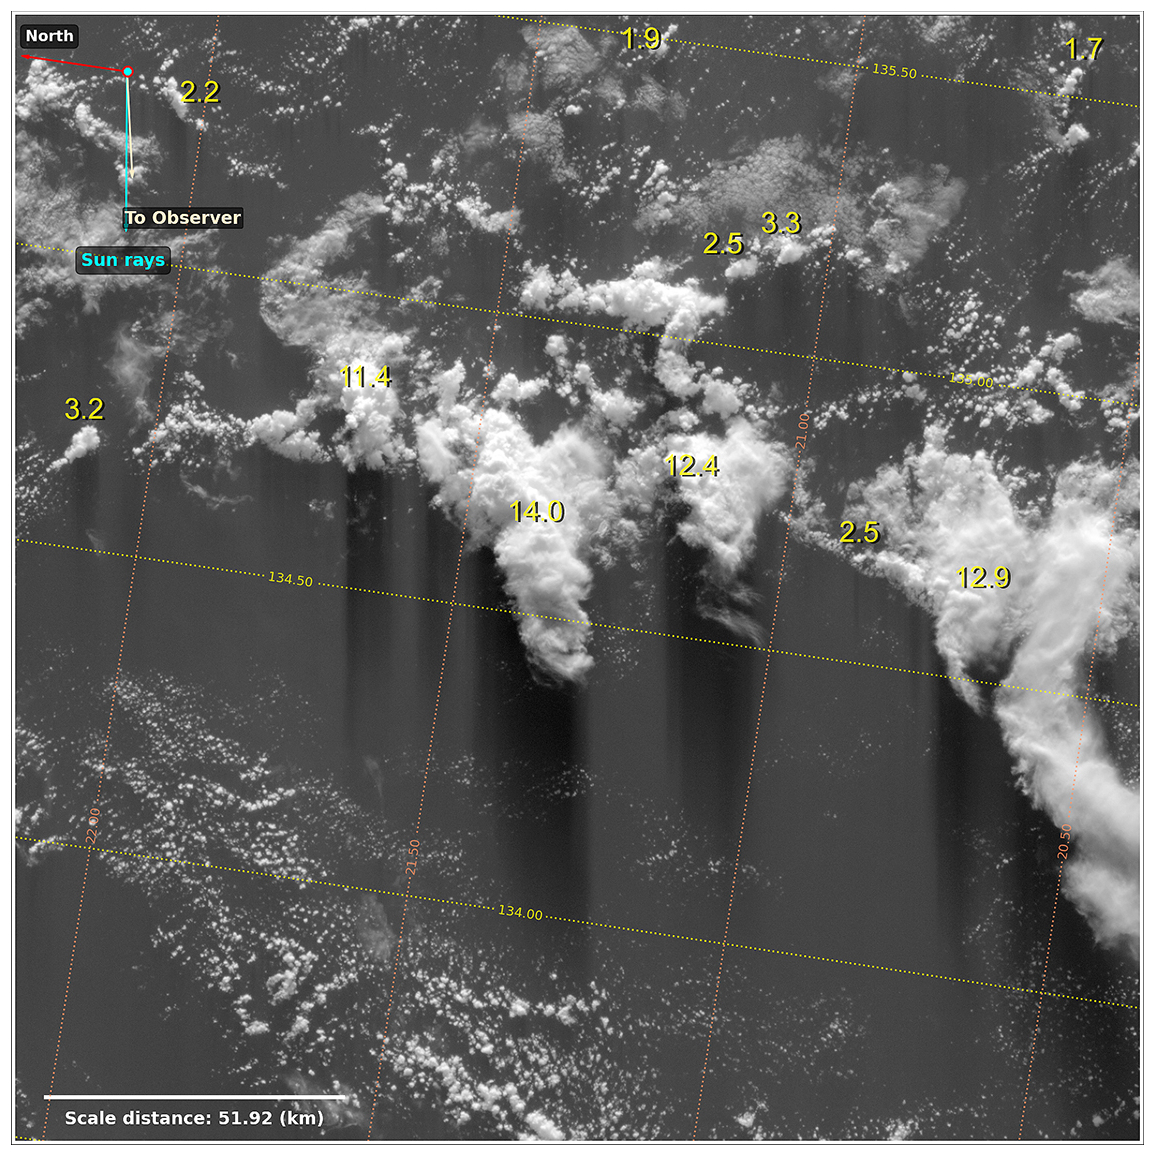
Figure 13Deep convective cumulus from JANUS image 0777504999_0003_03. The observation has an incidence angle of 78° and an emission angle of 12° and was obtained from a distance of 8700 km with a spatial resolution of 130 m. Numbers correspond to cloud top altitudes from shadow lengths and are centered just above the main cloud system measured in each case.
Figure 14 shows examples of mature cumulus developing active convection. The spatial resolution of these images is 126 m per pixel, and the field of view covers a location 3 h after the local sunrise. These storms are under a mature stage and show fully developed anvil clouds with longitudinal extensions of 20 to 85 km and cloud tops peaking at altitudes of 12–14 km. A multi-filter sequence of images of this area was obtained allowing to build color images. The apparent brown-red color of the ocean is due to Sun-glint conditions affecting these observations (i.e., near-specular reflection of sunlight; in these observations, the incidence angle of the central pixel was 51° and the emission angle was 40°, values close enough to induce glint effects).
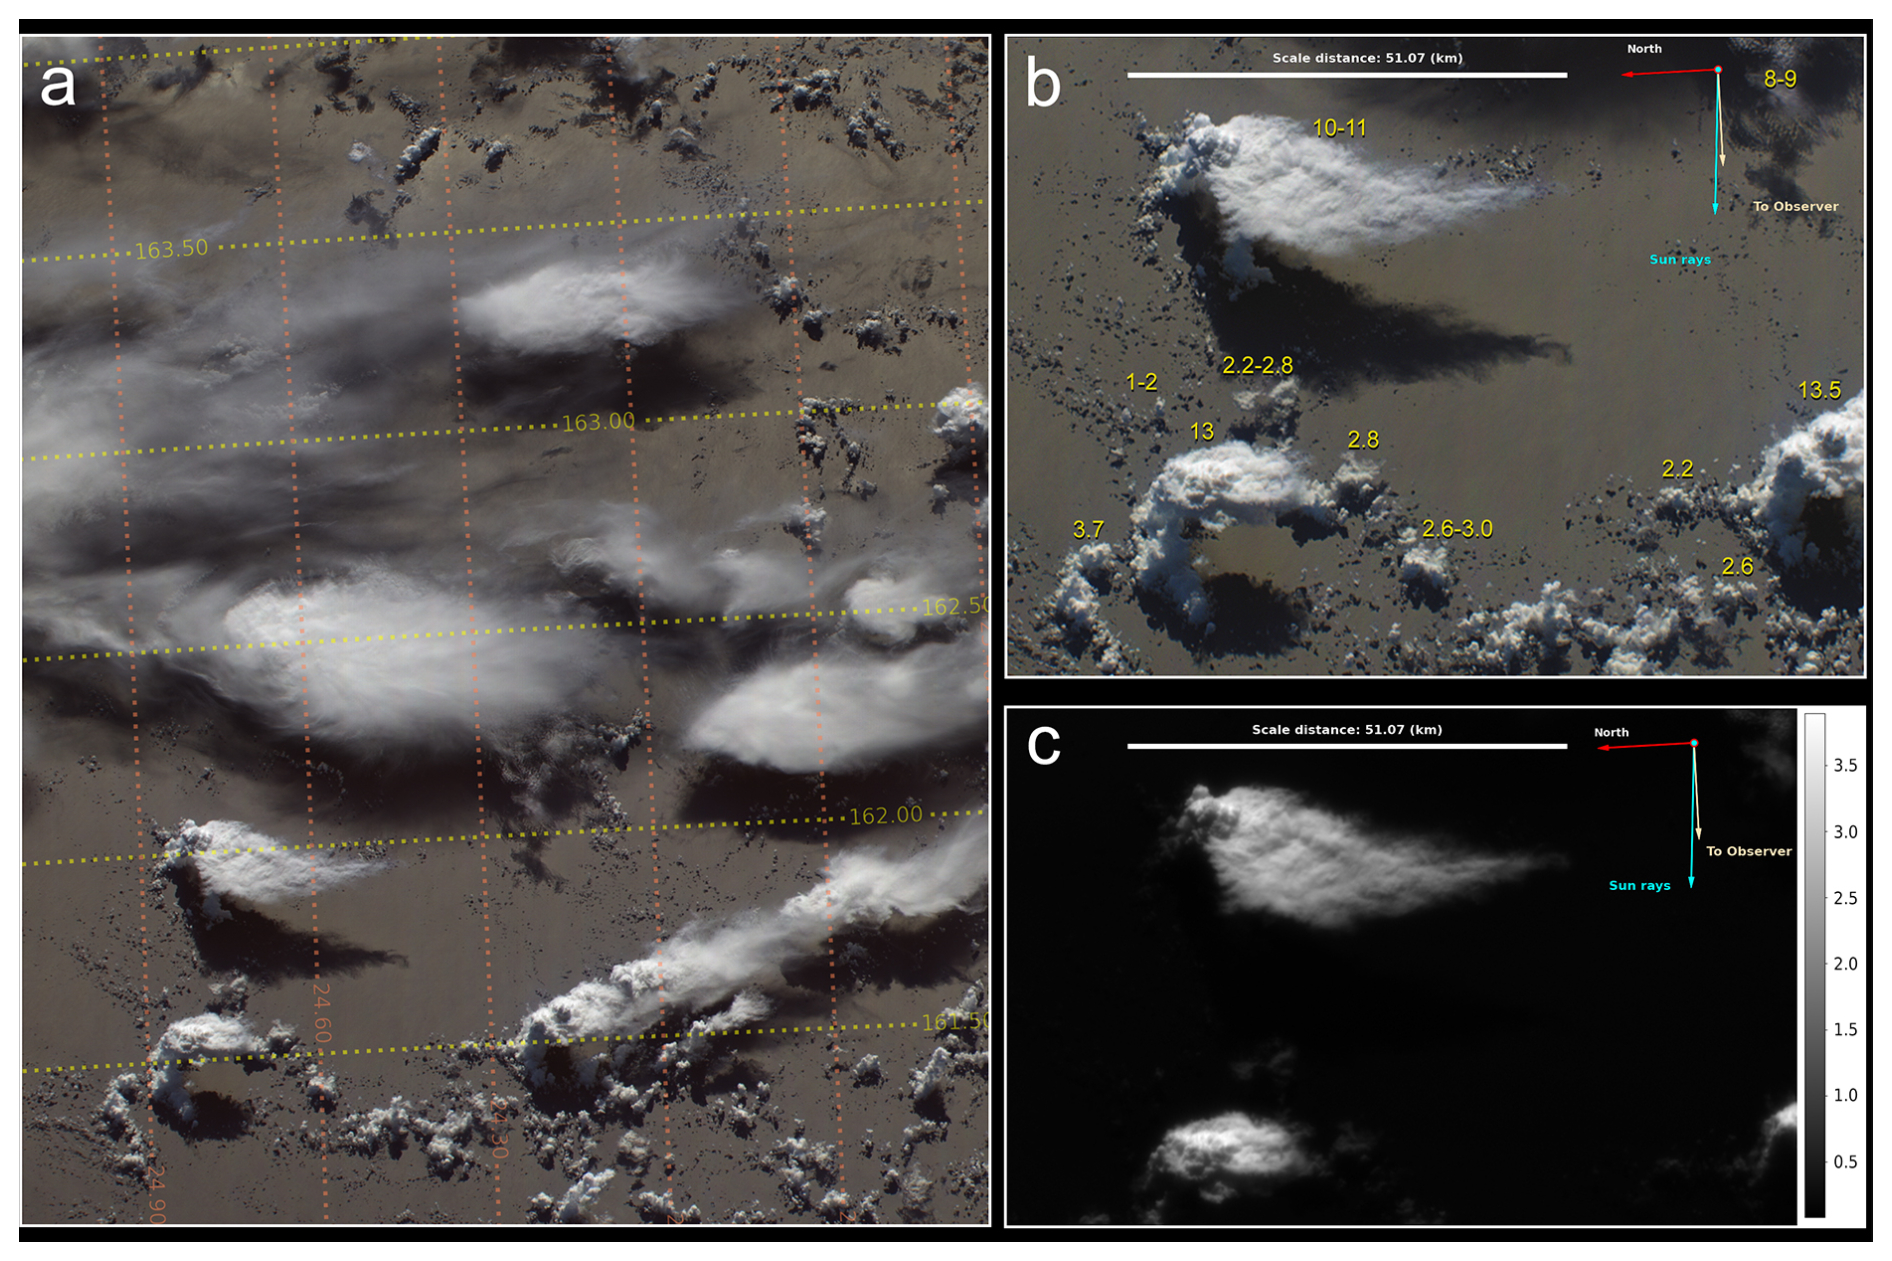
Figure 14JANUS images of convective storms over the Pacific ocean. (a) Composite color image from images 077750499_0025_02 (blue), 07750499_0026_03 (green) to 077750499_0027_04 (red) co-registered over the green image after correcting spacecraft motion and showing longitudes and latitudes of the green image. (b) Zoom over the full color image showing altitudes of the clouds from shadows in yellow numbers. (c) F8 image of the area above from image 077750499_0031_08. Radiances are given in units of .
In the image sequence that covered the area shown in Fig. 14, two images separated by 34 s overlap over the three large convective cumulus cloud at the bottom of the image. Map projections of these images show strong apparent motions in the highest clouds, while features at the base near the ocean remain stationary. Those motions could be indicative of divergence and expanding clouds. With the spatial resolution of these images and the time difference between both image acquisitions, a 1-pixel motion implies velocities of 3.7 m s−1. However, the strong parallax effects associated with the changing view point of the observations, and the combination of horizontal and vertical motion, do not allow to measure winds from cloud tracking, either manually or with image correlation software. The expansion of the anvil clouds appears very limited, and expansion rates larger than 30 m s−1 can be ruled out.
The comparison of these color observations with images in the F8 filter in the water absorption band at 940 nm shows bright clouds at the convective cores and large anvil clouds, dark clouds for moderately elevated cumulus and a dark ocean.
Figure 15 shows a more complex scene contiguous with the one in the previous figure. Here elevated cirrus extending over a horizontal distance of 190 km appear as wispy cloud systems close to active cumulus towers. The bottom panels in this figure show a magnified view of an isolated active cumulus observed in a nearby location in the image sequence. This cloud system corresponds to the brightest region in the F8 image, and the cloud morphology shows overshooting convection, with the F8 brightest part of the cloud ascending over the darker anvil cloud by about 2.0–2.5 km.
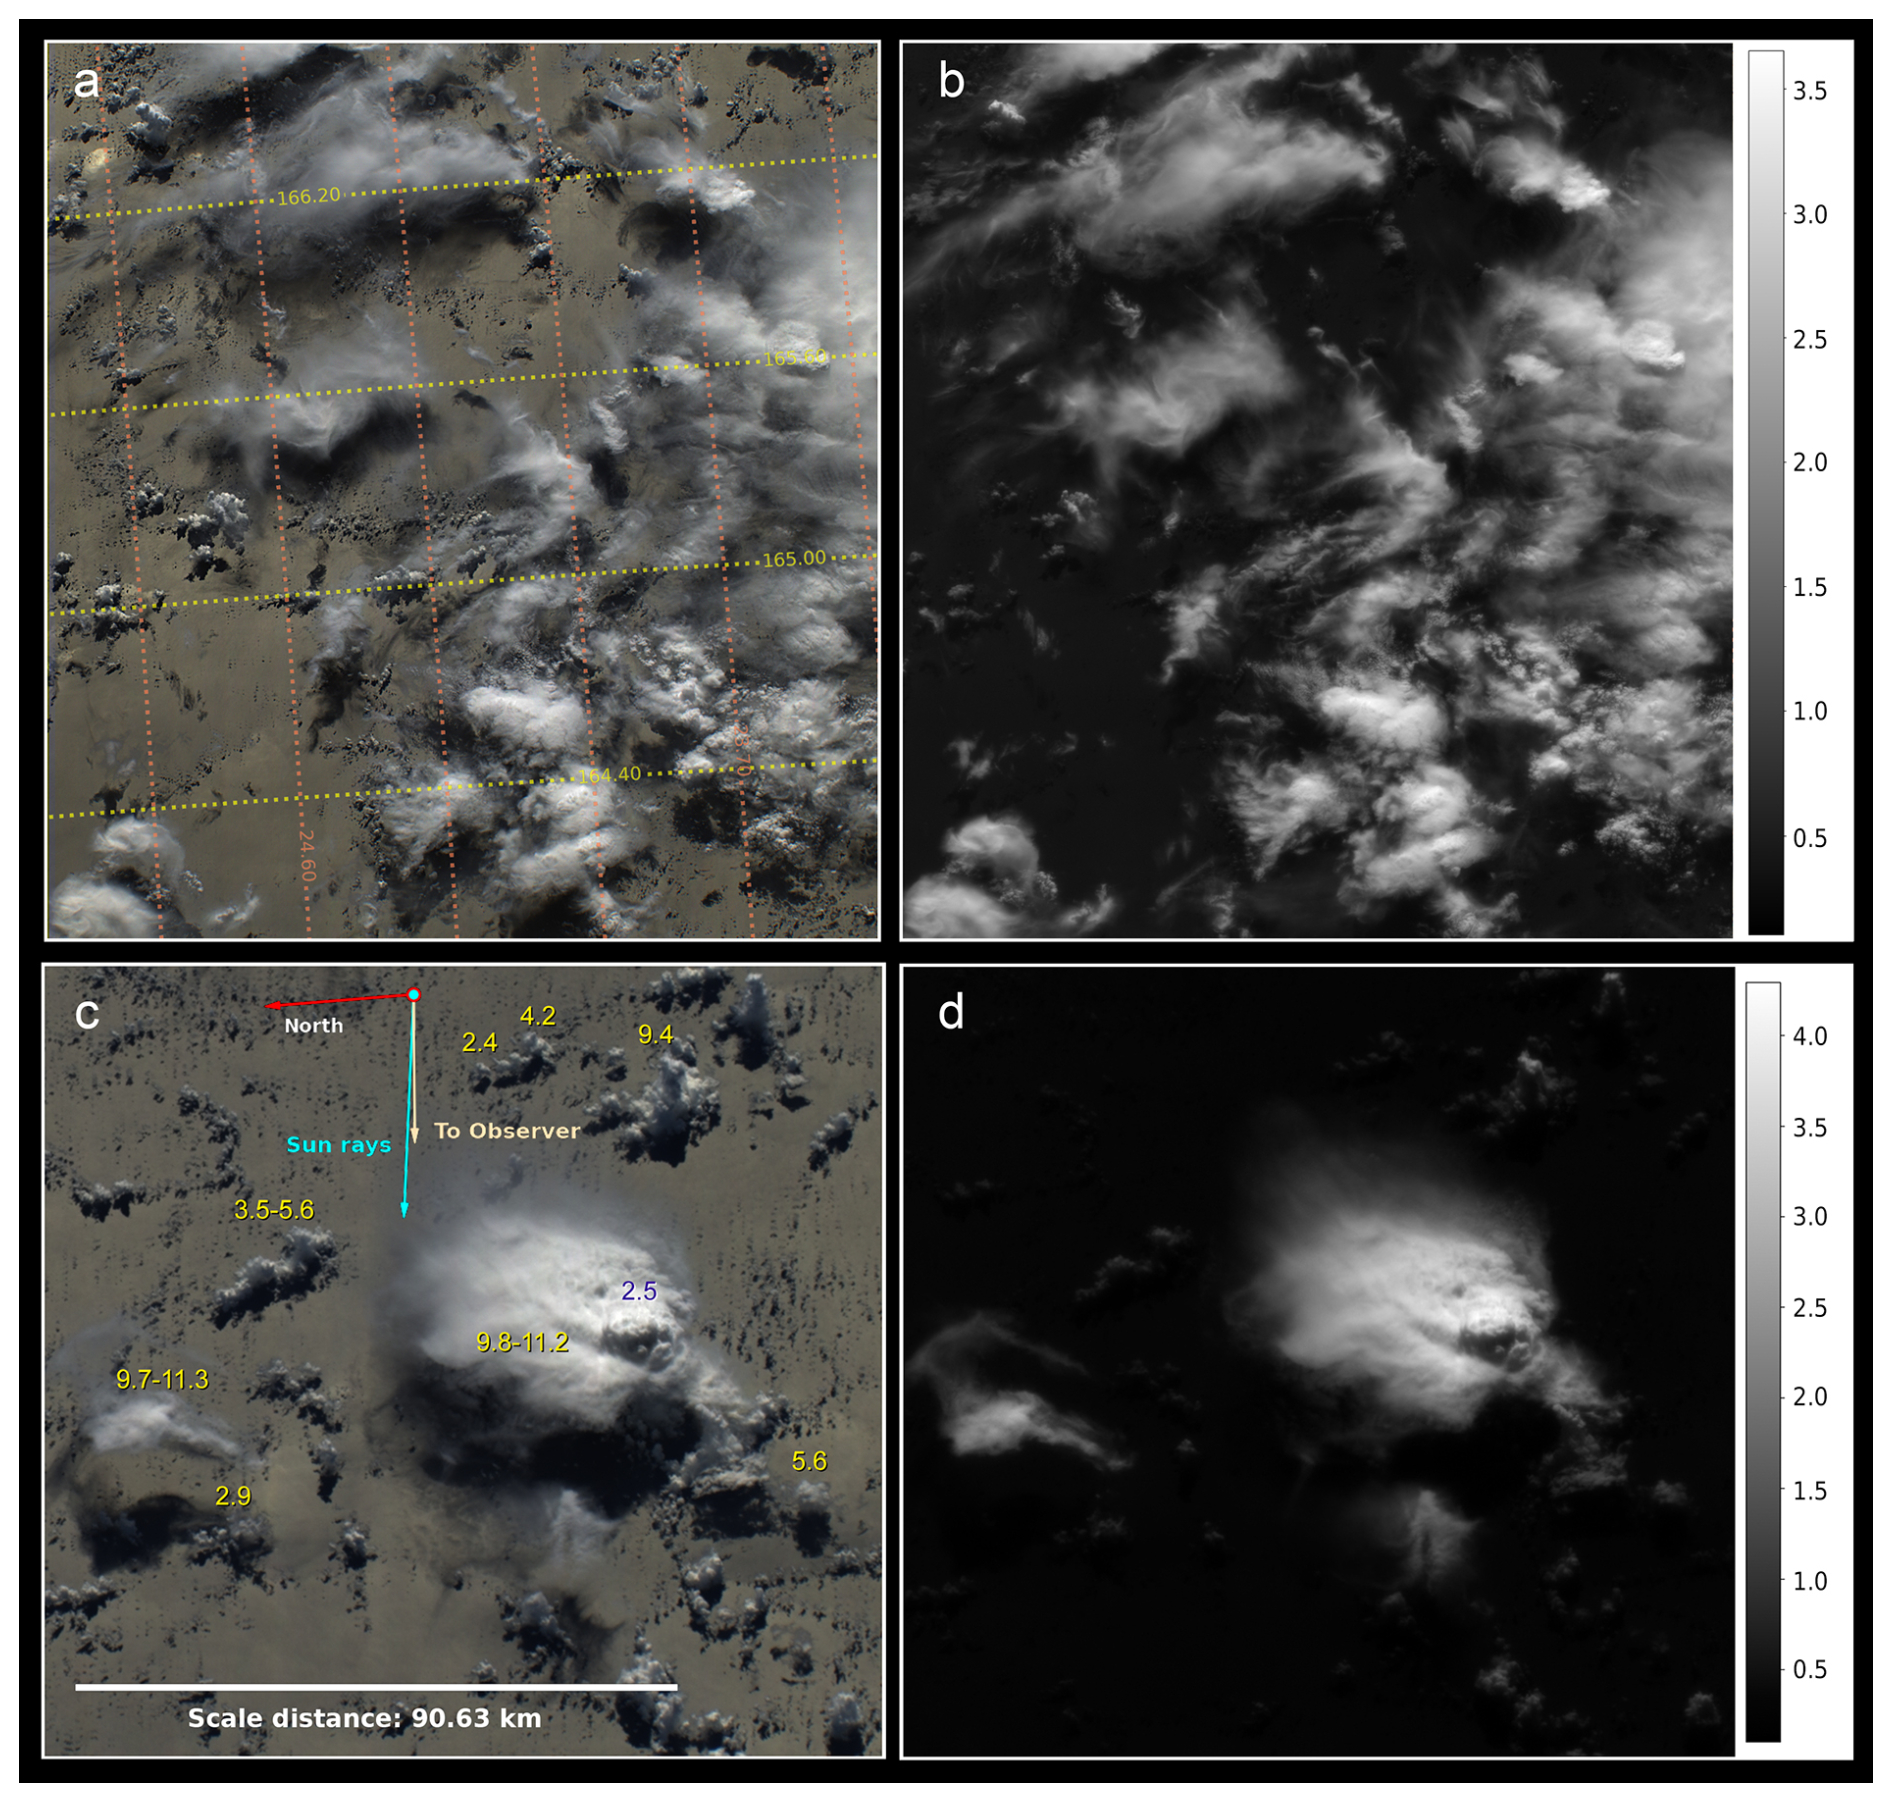
Figure 15JANUS images of convective storms over the Pacific ocean. (a) Composite color image from images 077750499_0038_02 (blue), 07750499_0039_03 (green) to 077750499_0040_04 (red) co-registered over the green image after correcting spacecraft motion and showing longitudes and latitudes of the green image. (b) F8 image 077750499_0044_08 covering the same area as in panel (a). (c) Composite color image from images 077750499_0051_02 (blue), 077750499_0052_03 (green) and 077750499_0053_04 (red). (d) F8 image 077750499_0055_08 covering the same area as in panel (c). Radiances in panels (b) and (d) are given in units of .
We were not able to identify changes in the brightness of the ocean in the F8 filter, which is strongly sensitive to water absorption. This suggests a very homogeneous distribution of water vapor over the tropics in the regions sampled by these images.
Large-scale storms powered by moist convection are a common feature in Jupiter's atmosphere (Vasavada and Showman, 2005) with a major role in the atmospheric dynamics (Ingersoll et al., 2000; Sánchez-Lavega et al., 2008; Siegelman et al., 2022; Fletcher et al., 2020). JANUS will study the occurrence rate and dynamics of convective storms of multiple scales in Jupiter allowing studies of their onset, development and cycle of activity (Hueso et al., 2022; Brueshaber et al., 2025). The combination of dayside and nightside observations will allow to determine their electric activity (Gierasch et al., 2000). Observations with filters sensitive to different altitudes, combined with radiative transfer models (e.g. West et al., 1986; Banfield et al., 1998; Vasavada et al., 1998; West et al., 2004; Sánchez-Lavega et al., 2008; Wong et al., 2023) will allow us to determine their vertical structure. JANUS observations of Jupiter acquired at sufficient spatial resolution will enable to measure divergence rates and turbulent fluxes through the atmosphere (Salyk et al., 2006), including convective storms and eddies. Thus, JANUS will perform a full investigation of the role of convective storms in shaping the atmospheric dynamics of the Jovian atmosphere.
5.3 Atmospheric and Ocean Waves
Some of the JANUS images show gravity waves over elevated cirrus. Figure 16 shows a long cirrus cloud system (>160 km in length), where several gravity wave packets with wavelengths of 1.6 to 2.2 km are observable. The waves are aligned perpendicularly to the elongated cirrus suggesting a main direction for the winds flow and strong stratification. The cirrus is not dense enough to project shadows that could be used to determine its height, and this area was only observed on images using the F3 (green) filter. The low-level clouds present in the image are indicative of stratocumulus in the early morning, and the absence of larger vertically extended cumulus over the area also indicates local stability.
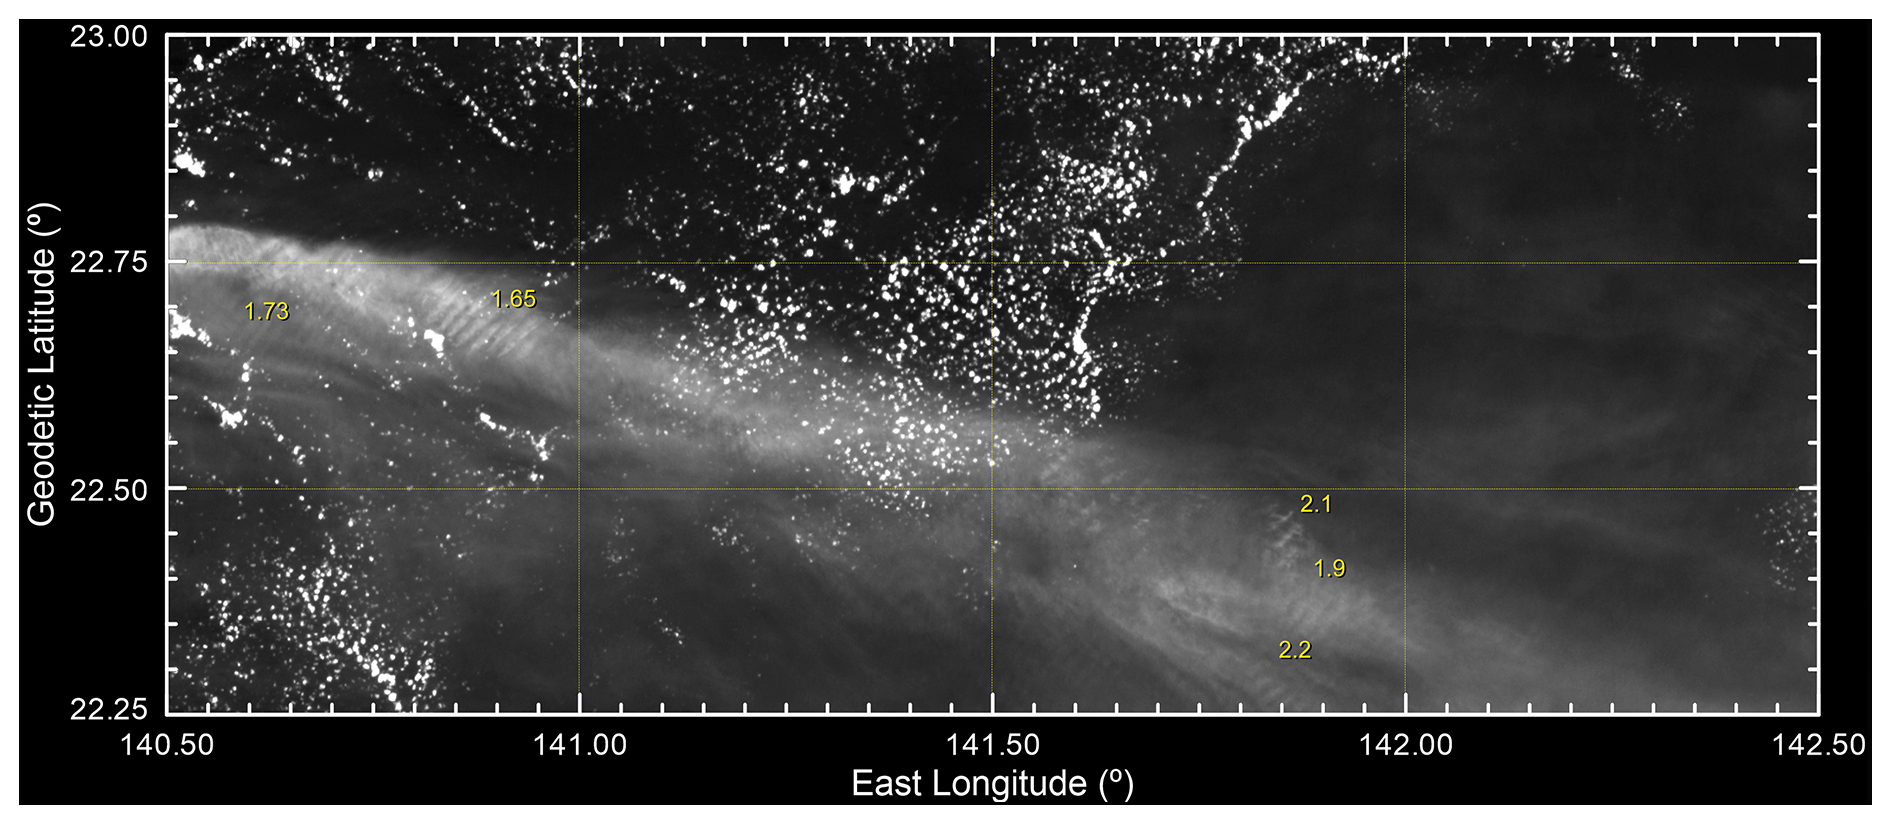
Figure 16Longitude latitude map from JANUS image 0777504999_0008_03 showing atmospheric gravity waves on elevated cirrus. The map uses a resampled equal-distance projections for a 22.5° latitude. Yellow numbers indicate wavelengths for wave packets close to each number.
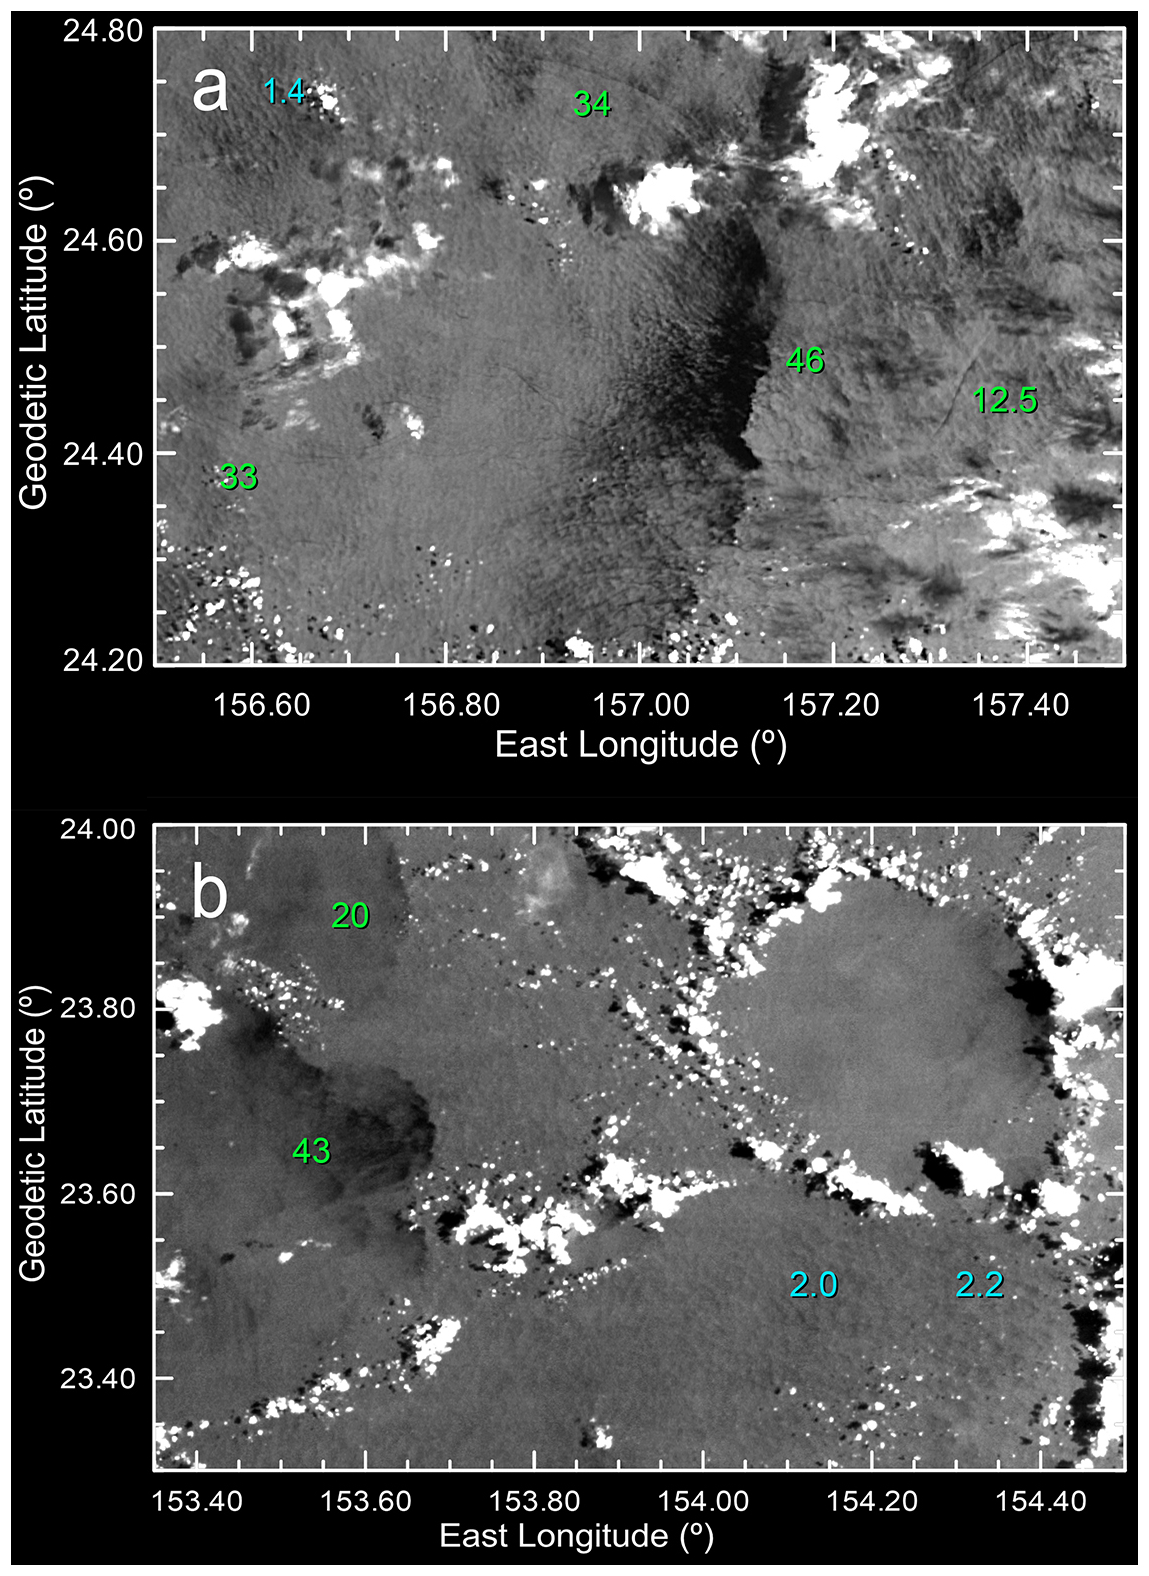
Figure 17Longitude latitude maps from JANUS images using resampled equal-distance projections for a 24° latitude. (a) 0777504999_0020_03, and (b) 0777504999_0018_03. The images are shown with a contrast enhanced scale after some slight high pass processing to enhance the visibility of features in the ocean. Blue numbers indicate the wavelengths of regular features in the ocean. Green numbers indicate lengths in km of internal waves observed in the images. The original resolution of these images was 125–126 m. The nearly perfect ring of clouds in (b) has a diameter of 41 km and is likely a cold pool contributing to form new convective systems. Note the presence of further internal waves in the east side of the ring of clouds separated from cloud shadows.
Figure 17 shows several dark features over the ocean with arc-shaped fronts, narrow elongated arcs and wavy dark and bright patterns. These type of features appear on multiple JANUS images of the ocean acquired with the F3 filter (none of these areas was also covered by additional filters to characterize their color). The elongated arcs with scales of 30-80 km, and the regularly spaced bands of features, are consistent with internal waves in the ocean (Alford et al., 2016). Internal waves can form from interactions of sea currents along the thermocline, and by tidal interactions with the bathymetry. They can also be formed from variations in sea surface roughness created by wave currents moving with different phase speeds (Jackson, 2007). The Izu-Ogasawara Trench in the western North Pacific, which is considered to be one location driving intense internal waves generation, is located at around 1000 km west of the location of the internal waves imaged by JANUS. In addition, the visibility of internal waves is also affected by sunglint effects and the location of these images also contains partial sunglint from differences between the incidence and emission angle of 20°.
We expect that JANUS will image several wave systems at Jupiter, characterizing their properties, physical origin, and influence on the atmosphere. Past observations show that gravity waves in the cloud fields of Jupiter can appear in the upper hazes of the planet in methane-band images (Reuter et al., 2007) and in the lower clouds in the ammonia cloud layer (Arregi et al., 2009; Fletcher et al., 2018; Simon et al., 2018). JANUS will be able to characterize their frequency, wavelength, and phase speeds allowing for several studies of atmospheric waves in Jupiter's atmosphere.
5.4 Earth's limb during dayside
At the end of the observation sequence, JANUS imaged the limb of the Earth illuminated by a nearly zenithal sun. Figure 18 shows a JANUS image of the dayside horizon with incidence angle varying from 12 to 2° over the full image. This geometry shows extensive cloud systems over the North-Central Pacific, and scattered light over the horizon, where the vertical spatial resolution is 0.177 km. The image also shows the south coast of the Big Island of Hawaii covered by dense clouds and with a dark coast.
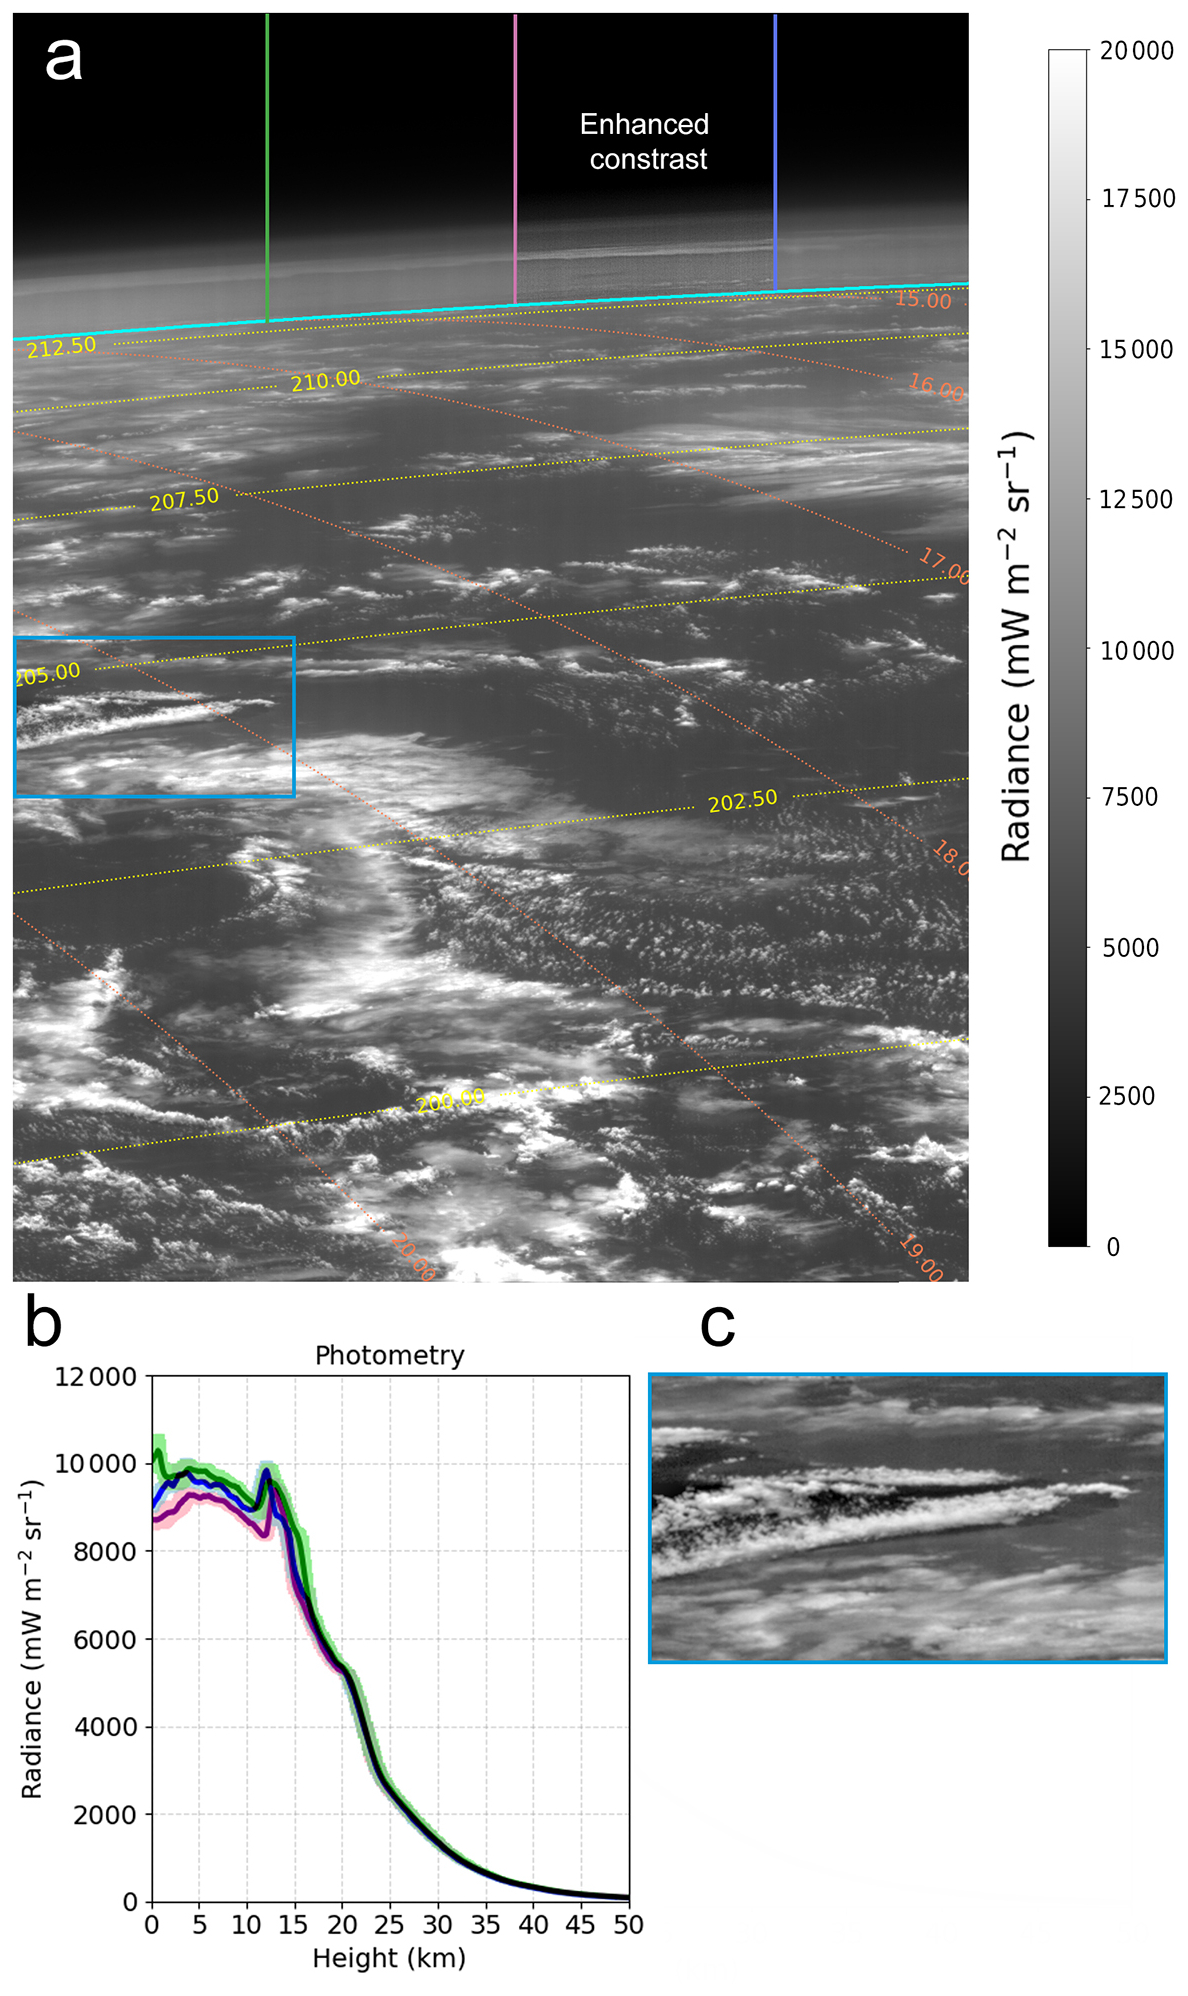
Figure 18JANUS image 0777504999_0075_03 showing Earth's limb in the Western Pacific using a green filter. (a) JANUS image with longitudes and latitudes. A blue line shows the position of the horizon over the planet's surface. Three vertical lines show the position of three photometric cuts shown in panel (b). The region between the pink and blue line shows the limb after contrast enhancement to highlight the underlying structure. A blue box highlights the position of the South coast of the Big island of Hawaii. (b) Photometric scans over the horizon obtained over vertical sections of the image at locations identified with color lines on panel (a). Error bars for each line correspond to the standard deviation over 100 nearby photometric scans. (b) Contrast-enhanced view of the South coast of Hawaii highlighted on (a).
The structure of the atmospheric limb in this image is particularly interesting. At the spatial resolution of this image, the limb reveals the vertical structure of Earth's atmosphere. Discrete low clouds above Earth's spheroid are visible at altitudes of 1–5 km. Above these lower clouds, scattered light shows the presence of a detached double layer of aerosols at altitudes of 12–15 km near the tropopause. This overall structure is observed all over the limb. Scattered light at altitudes above the tropopause rapidly diminishes with increasing altitude. Diffuse light is observed to vary suddenly at altitudes of about 20 km, showing evidences of atmospheric structure even at that height. These results are similar to those obtained by instruments specifically designed to profile the limb and investigate the vertical structure of aerosols (Letros et al., 2025).
Dayside limb observations of the Earth are similar to Galileo observations of Jupiter's hazes under limb viewing geometries (Rages et al., 1999). Galileo showed that at high phase angles near 140–150°, the equatorial and polar hazes can display their vertical structure when observed at sufficiently high spatial resolution (Galileo observed these effects with a spatial resolution of 15 km per pixel). JANUS will acquire a large number of similar observations of Jupiter's limbs in multiple filters at different latitudes and with different illumination conditions and with a sufficient spatial resolution to study the vertical distribution of aerosols. By combining these observations with radiative transfer models, we should obtain a very valuable dataset able to inform about the vertical distribution of clouds and aerosols and particle size at different heights through the planet. With a maximum spatial resolution of about 10 km in the closest perijoves, structures equivalent to one third of the vertical scale height H will be resolved. This will provide direct information on the extent and properties of the equatorial and polar hazes. If science operations planning allows it, similar JANUS observations could also determine the vertical structure above specific atmospheric systems covered by dense upper hazes like the Great Red Spot and other major ovals.
JANUS acquired three full multi-filter sequences of the Earth at high resolution. The first sequence covered the region shown in Fig. 11. However, this region was very close to dawn and was illuminated tangentially, making difficult to compare with spectra of the Earth acquired under similar illumination conditions. The other two sequences correspond to morning observations of a highly convective region over the Western Pacific as shown in Figs. 14 and 15. Except for the observations in the panchromatic filter, none of the images acquired in other filters present saturated pixels. These two multi-filter sequences were acquired at 21:44 UTC with all the images captured over a total time of 50 s with incidence and emission angles from 51–47 and 39–42° respectively under sun glint conditions increasing from west to east.
The area covered by these images was observed by two hyperspectral instruments aboard Earth-observing satellites operated by the German and Italian space agencies (DLR and ASI). These were the Environmental Mapping and Analysis Program (EnMAP) and the PRecursore IperSpettrale della Missione Applicativa (PRISMA) satellites carrying instruments with the same name. These instruments provide hyperspectral observations at high-spatial resolution in the visible to near infrared and short-wave infrared from 420 to 2350 nm and from 400 to 2500 nm respectively. Storch et al. (2023) describe the EnMAP mission and its instrument, and Cogliati et al. (2021) describe PRISMA. EnMAP obtained 15 observation tiles with data ID 888660 on 20 August 2024 at 00:19:40 to 00:20:46 UTC. These images were acquired 21 h before the JANUS data. PRISMA acquired similar data of a close area the same day but over 23:46:53 to 23:47:18 UTC. This is nearly 2 h after the JANUS observations and almost 1 full day after EnMAP observations of the same region. Both EnMAP and PRISMA had incidence angles lower than 30° and emission angles near zero values. PRISMA data has also been compared with data obtained by the MAJIS instrument during the Earth flyby over different locations to those covered by JANUS (Oliva et al., 2026).
Figure 19 shows the collocation of these observations with JANUS data. The figure also shows the very different morphologies of the cloud systems present in the observations over the three different times covered. JANUS observed massive convective clouds in a mostly cloud covered area. EnMAP and PRISMA observed a calmer atmosphere with much lower cloud activity and no massive convection.
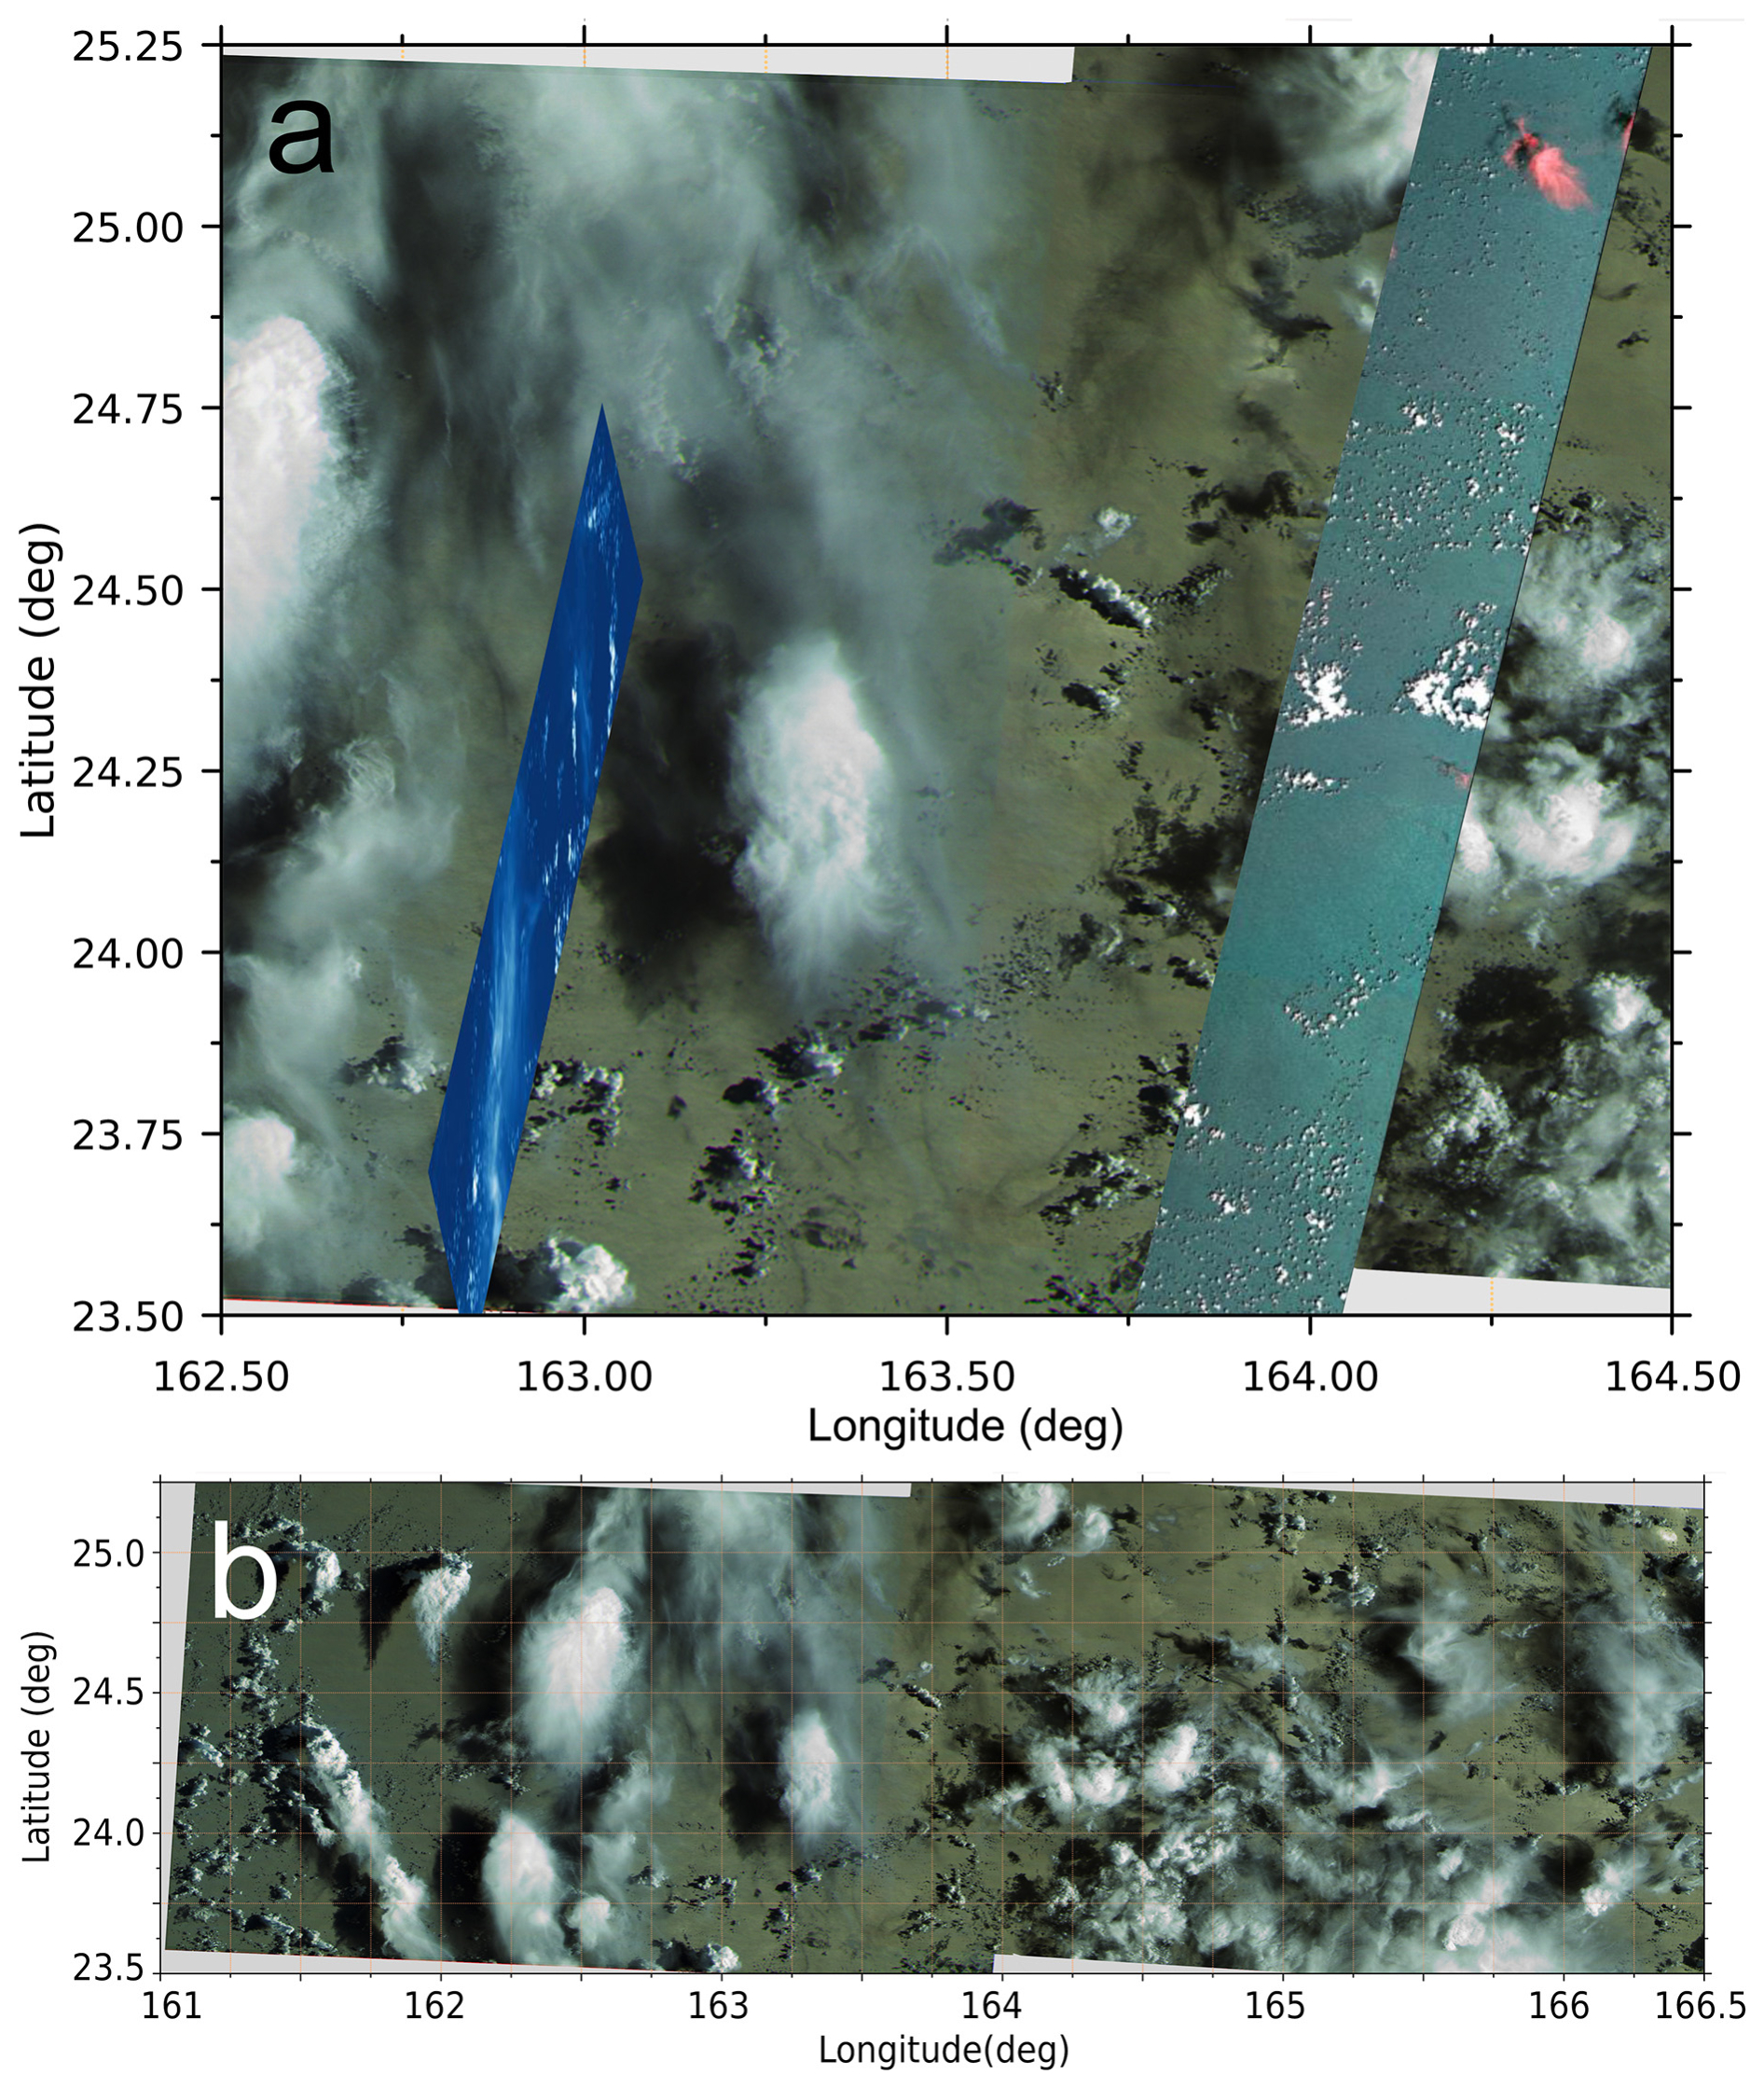
Figure 19Map from two JANUS hyperspectral sequences superposing at around longitude 163.50°. Images were built from red, blue and green filters, but the color is altered by the sun glint conditions of the observations. (a) Central region with PRISMA and EnMAP data. PRISMA data is shown in blue. EnMAP data is shown in color with RGB channels coming from observations at 940, 890 and 540 nm respectively. Red features in this image correspond to high thin clouds. (b) Full map showing the sun glint effects associated with the variation of color of the ocean over the images.
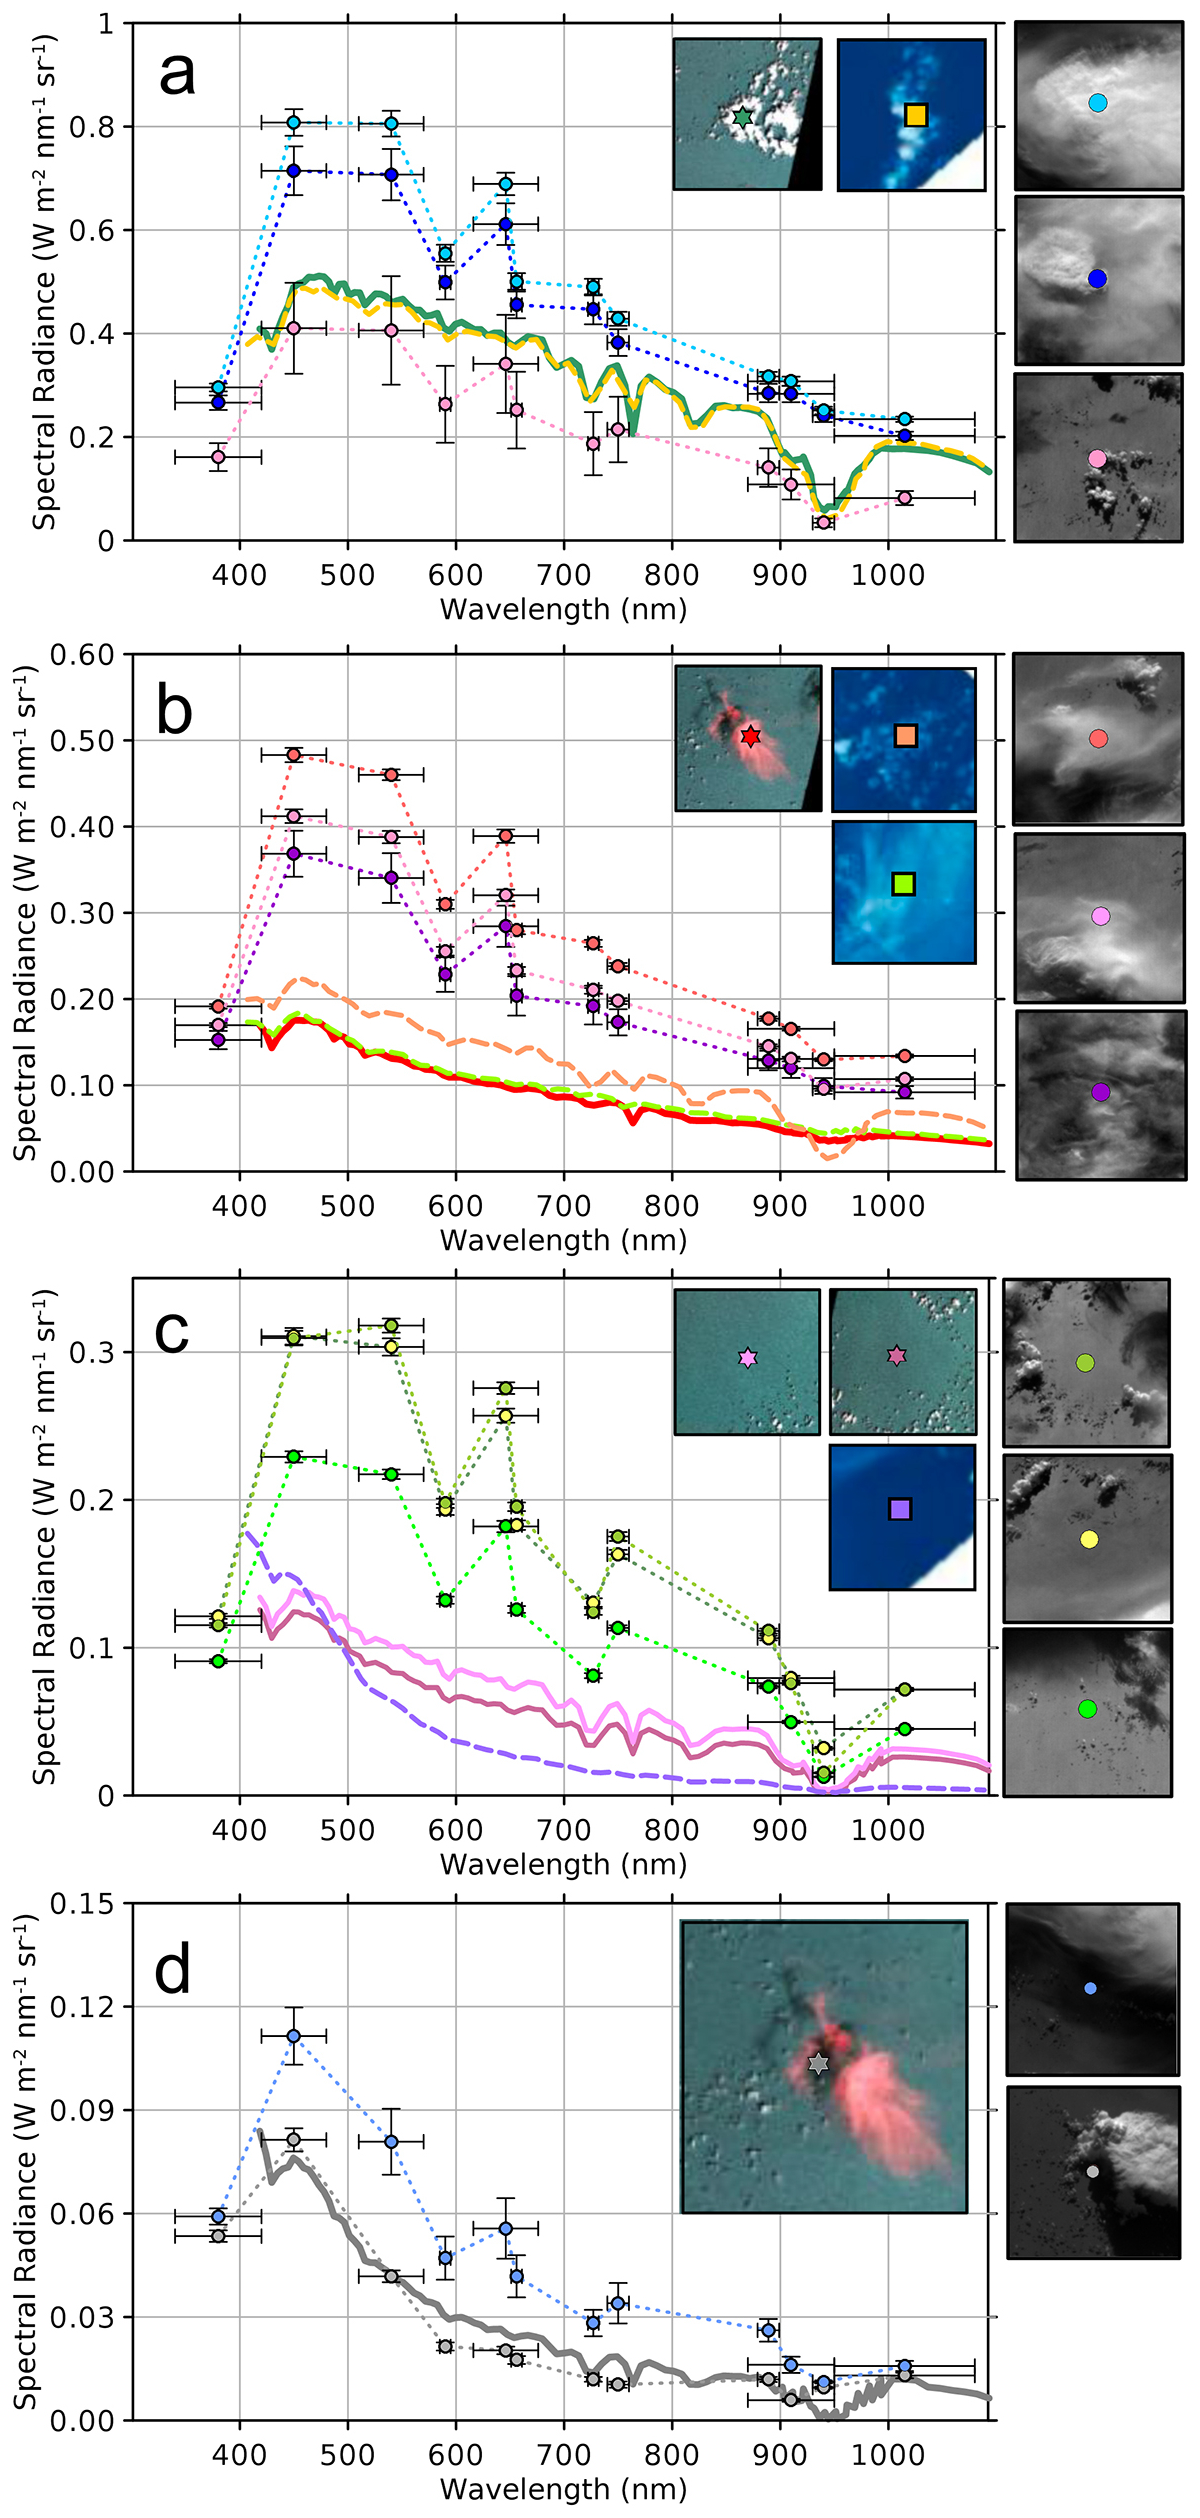
Figure 20JANUS broadband spectra and EnMAP and PRISMA spectra for various targets. (a) Bright clouds. (b) Elevated cirrus-like clouds. (c) Ocean. (d) Shadow regions. JANUS data are shown with data points and error bars. EnMAP spectra are shown with colored continuous lines. PRISMA spectra are shown with colored dashed lines. Insets show the regions where the spectra were obtained. Colored symbols highlight the locations from where the spectra were retrieved. EnMAP regions are shown in green. PRISMA regions are shown in blue. JANUS regions are shown in black and white. Error bars on JANUS spectra correspond to the filters effective width and the photometric variation in a circle of 8 pixels radius from where the spectra were extracted. Error bars on EnMAP and PRISMA data are comparable to the line width.
Figure 20 displays a comparison of spectra obtained from EnMAP and PRISMA with broadband spectra from JANUS multi-filter sequences for a selection of targets. For JANUS, spectral radiances for each target are obtained from the photometric radiance in each image divided by the effective filter width. EnMAP and PRISMA data are top of atmosphere radiances. All spectra have been corrected from geometric effects using a Lambert correction. Panels (a) and (b) show spectral data over a variety of cloud systems. Panels (c) and (d) show spectra of the ocean under different illumination conditions.
Figure 20a shows that JANUS broadband spectra of high cumulus clouds are much brighter than spectra of clouds observed in the EnMAP and PRISMA field of views. Clouds present in EnMAP and PRISMA data are mostly low-level stratocumulus clouds or cirrus and have very similar spectra. An interesting characteristic of the JANUS spectra is the correlation between the depth of the water absorption band at 940 nm in the JANUS F8 filter with cloud altitude (no absorption for the high clouds and strong absorption for low-altitude clouds). This correlation also holds for EnMAP and PRISMA data when examining low-elevation clouds in panel a that show a prominent absorption band at 940 nm. We can see in Fig. 20b that non-convective but high-elevation clouds observed by EnMAP and PRISMA have different spectral characteristics that the evolved cumulus present in the JANUS sequence. The JANUS elevated clouds are much more reflective indicating higher opacity of the clouds and higher elevations from low water absorption at 940 nm.
Spectra of the surface of the ocean are shown in Fig. 20c. Here, the strong water absorptions from high water abundance near the surface is clearly observable in the F8 filter at 940±20 nm. Water absorption is also evident in the weaker water absorption band at 727 nm sampled by the JANUS images in the F7 filter. It is also evident from this panel and the comparison with EnMAP and PRISMA data that the JANUS broadband spectra of the surface of the ocean are strongly affected by sun glints effects at all wavelengths. The sunglint effects in JANUS increase from west to east as sun glint conditions increase (see Fig. 19). Observations of the surface of the ocean in regions under shadows casted by the upper clouds and observed in JANUS and EnMAP data (Fig. 20d) show a stronger similarity between both data sources and agree in radiance values and spectral behavior of the ocean. This is because there is no sun glint in the shadow areas and the ocean is in both cases illuminated by light scattered in the atmosphere without the direct solar illumination and reflections.
Finally, JANUS narrow filters F6 at 590±10 nm (Na filter) and F13 at 656±10 nm (Hα filter) show abrupt changes in radiance compared with the nearby F3 filter at 540±60 nm (green), F4 filter at 646±60 nm (red), and F9 at 727±10 nm (MT medium). These changes are present in all JANUS spectra and are not associated with the characteristics of the targets. EnMAP and PRISMA data do not show equivalent strong variations at these wavelengths suggesting minor corrections in the radiometric calibration of these filters. JANUS radiometric data at these filters, and the effective width of the filters used in the computation of the spectral radiance will be examined with other data sources to improve the current radiometric calibration (see Agostini et al., 2026).
We selected Earth images obtained on 9 Sept. 2024 that had the maximum exposure time for each filter and did not saturate any single pixel. This was not possible for the panchromatic image, where most pixels over the Earth are saturated even at the smallest exposure time used of 0.222 ms. The images had a spatial resolution of 84.6 km per pixel at the sub-spacecraft point, and the Earth has a diameter in the original images of 152 pixel. The observations were acquired under a phase angle of 70.0°, and the time between the first and the last image was 340 s in which the planet rotated ∼ 1.4°. This corresponds to a relative shift of about 2 pixel at low latitudes for images acquired in different filters.
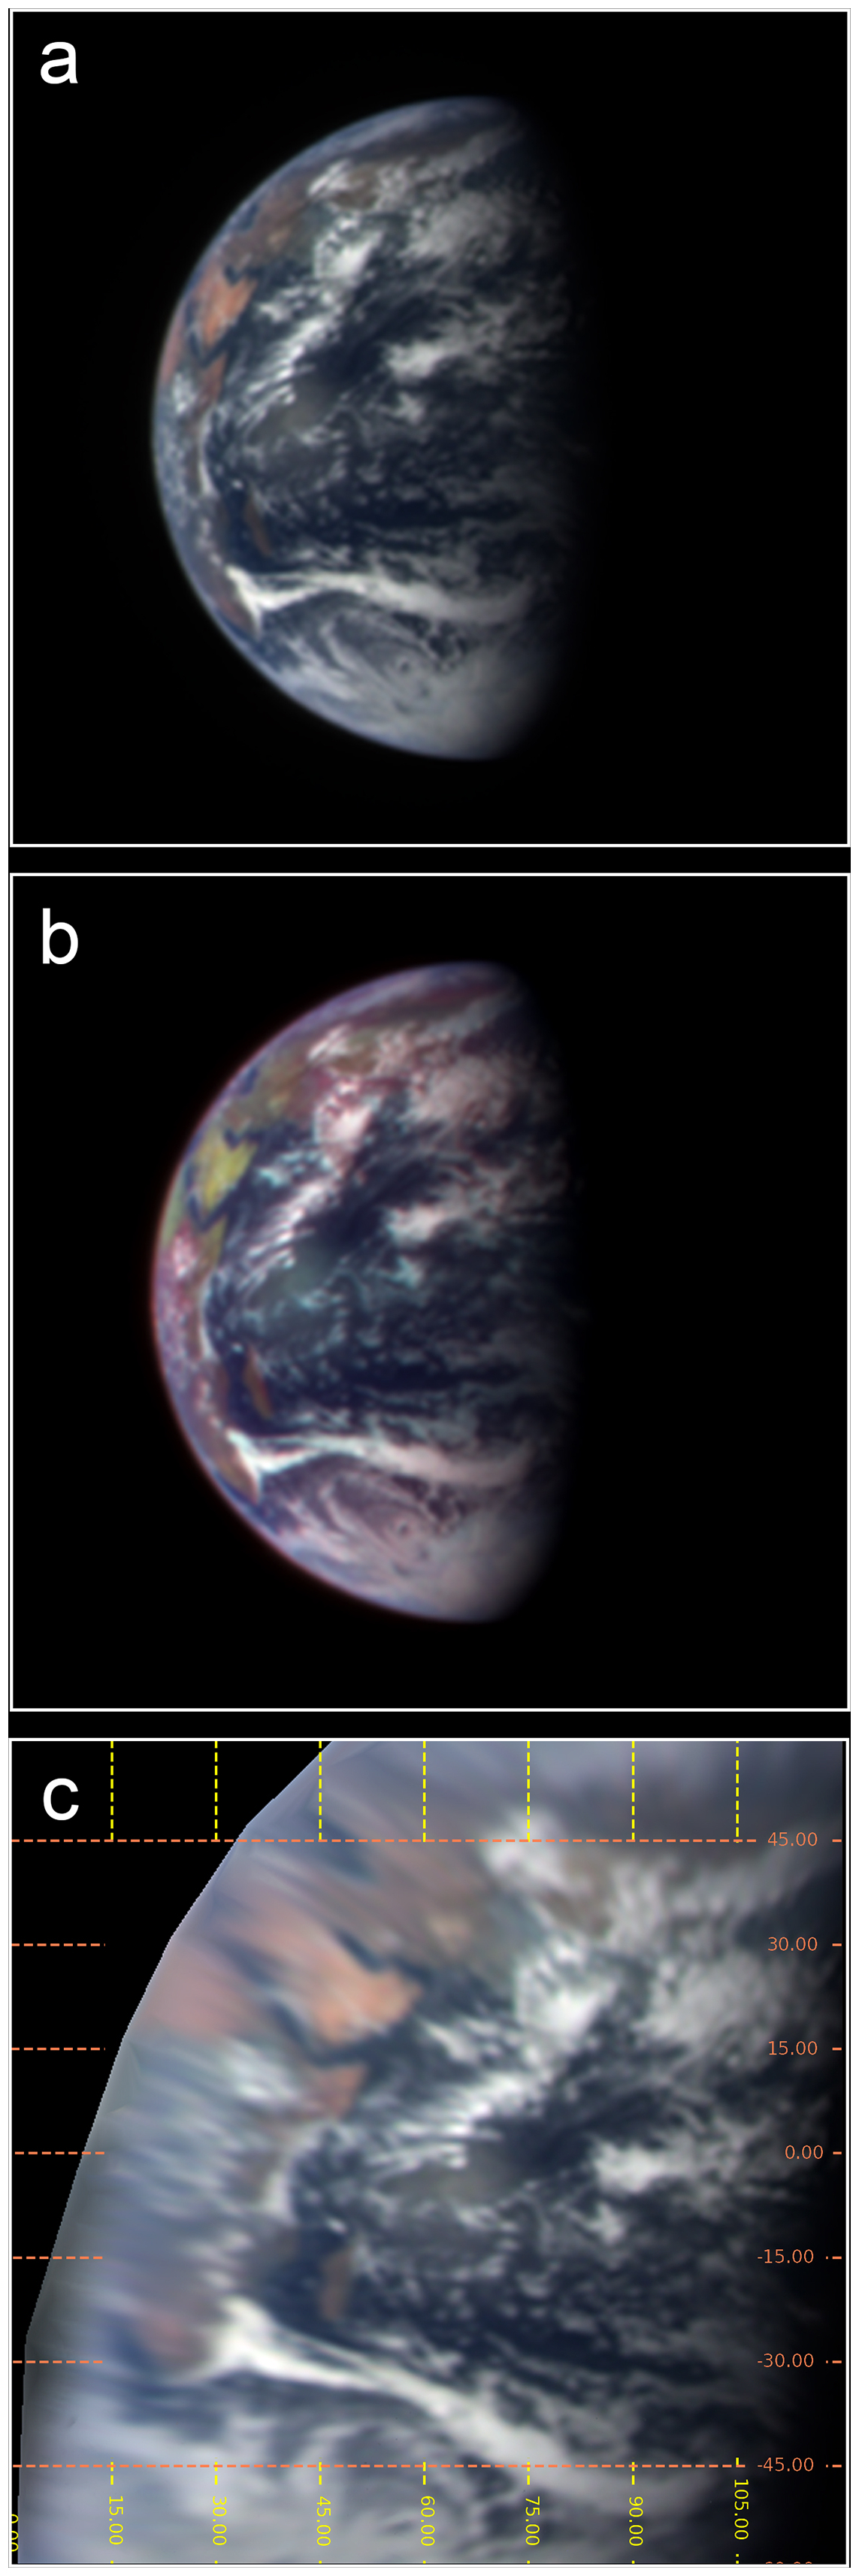
Figure 21JANUS images of the Earth. (a) Near true-color composition from filters F5 (red), F4 (green) and F2 (blue). (b) False-color image from filters F11 (as red), F4 (green) and F2 (blue). (c) Cylindrical projection of the Earth based on panel (a). A luminance layer has been added to all images based on a high SNR image obtained from adding JANUS images in multiple filters. See text for further details about these color compositions.
Two color compositions of the Earth are shown in Fig. 21. One of them is also mapped in cylindrical coordinates to facilitate the identification of geographical positions. The images were cubic interpolated to increase the size of the original images. The Earth image on Panel (a) is built from images in filters F4 (red), F3 (green) and F2 (blue), and is close to a true color view of the Earth. The Earth image in panel (b) is built similarly, but using image in filter F11 as the red channel resulting in a false-color image that separates better blue hues. In order to increase the image quality, in both cases a high SNR image has been added as a luminosity chanel to both color compositions. This luminosity chanel was calculated from the first principal component of a principal component analysis of the 12 non-saturated images available in JANUS filters F2 to F13 (see below). The high SNR of the luminosity channel contributes to the quality of the final Earth image when compared with the coarse resolution of the original images. While we did not correct rotation effects when stacking these images, similar analyses on Jupiter's atmosphere will be run after fully correcting rotational effects.
The JANUS Earth portrait covers East Africa, the Arabic peninsula, India and South East Asia. The Bay of Bengal is covered by dense clouds from a deep atmospheric depression, and Thailand and Malaysia are difficult to see in the cloud covered region. The region of Antarctica appearing in these images is also completely covered by clouds. In the false color image shown in Fig. 21b, there is a subtle cyan color over Antarctica that could be caused by water ice, as described in the investigation of the Galileo spacecraft images of the Earth (Sagan et al., 1993). The Indian Ocean covers a large part of the image and shows a variety of clouds in terms of sizes and brightness, as well as the sun glint at 60° E, 5° S. The continents are less visible in blue wavelengths (F2 and F8) and most visible in red and near infrared wavelengths (F5, F7, F9, F11 and F12). However, narrow filters like the F6 Na and F13 Hα filters did show the continents with lower contrasts. Sun glint was completely absent in the F8 filter due to the strong absorption by atmospheric water. The F12 filter showed a faint light scattering over the limb, slightly reducing the contrast in this image.
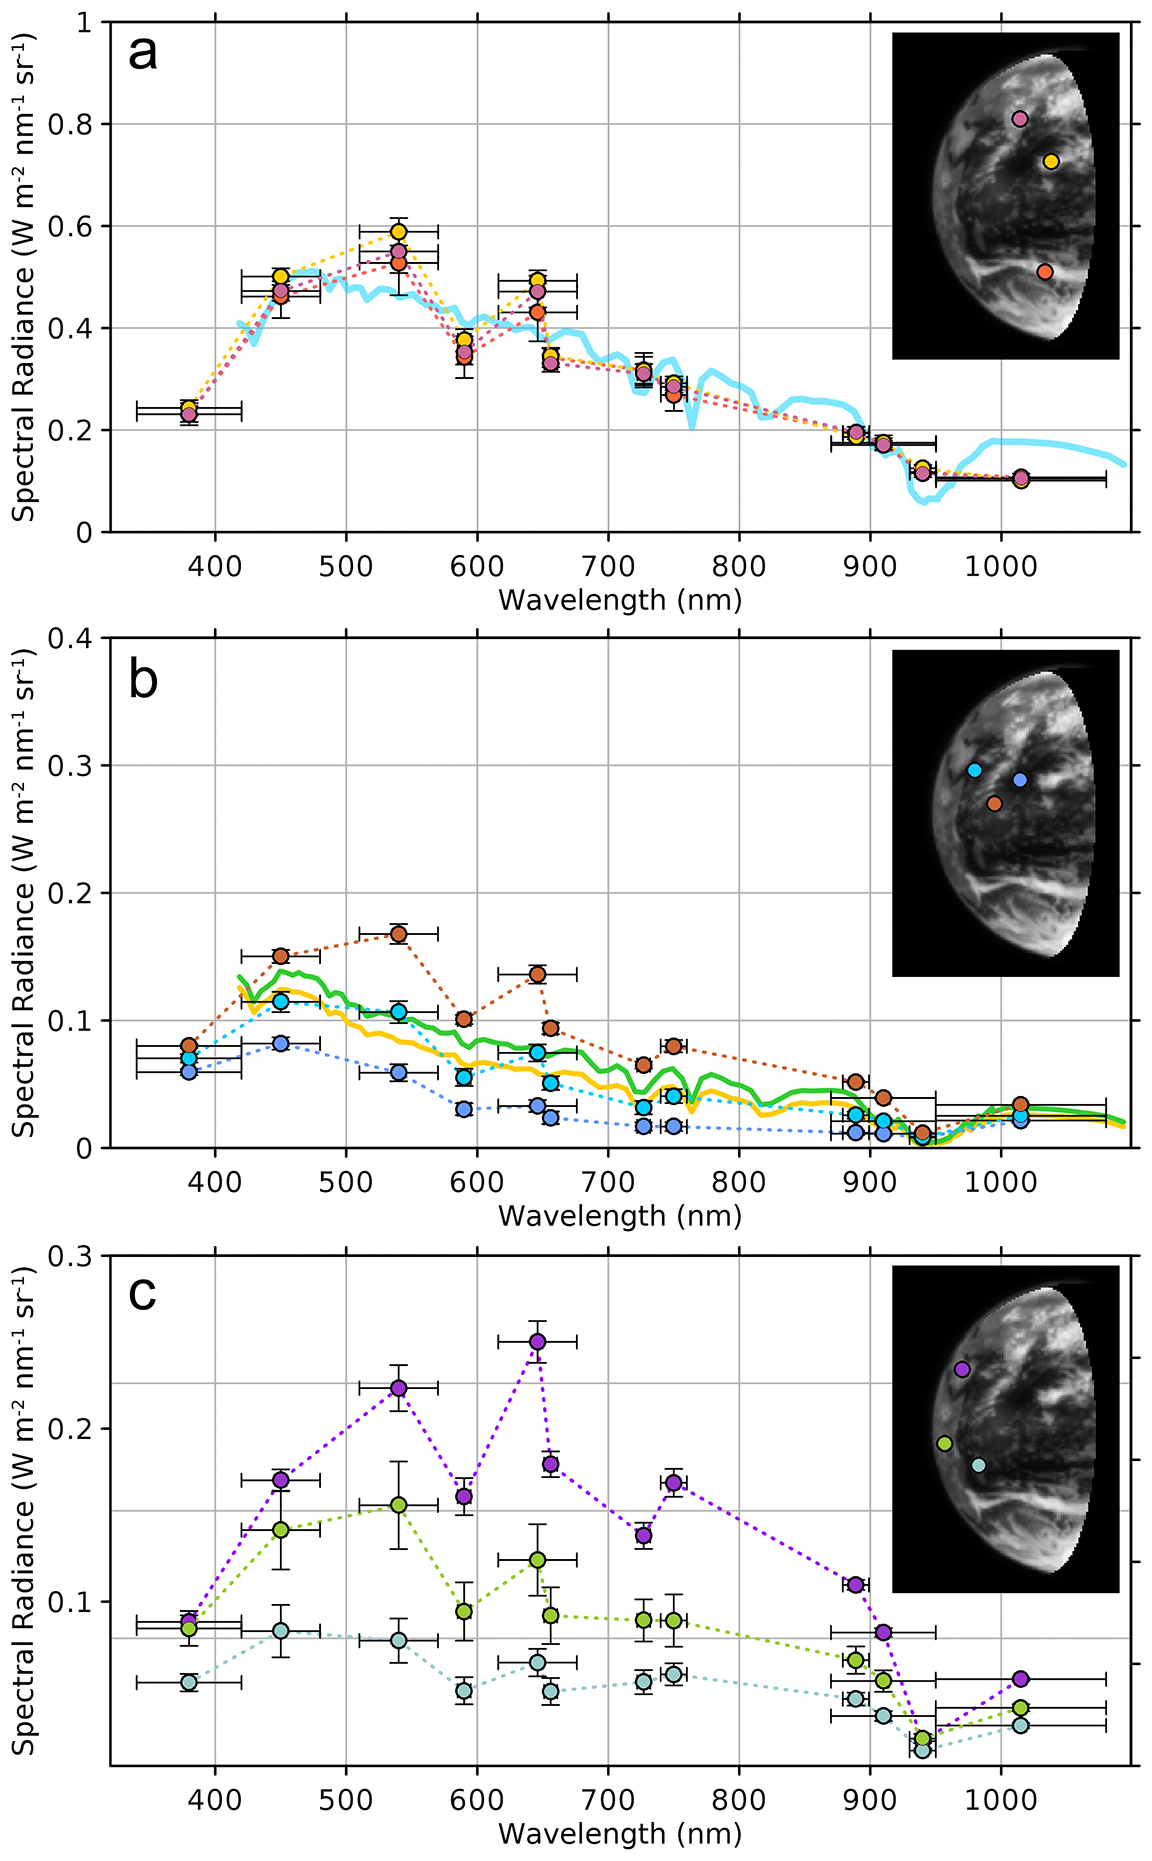
Figure 22JANUS brodadband spectra of various locations on the Earth. (a) Bright cloud systems. (b) Ocean. (c) Spectra over the Arabic peninsula, central Africa and Madagascar. Colored lines in (a) and (b) are EnMAP spectra of clouds and ocean shown previously. Insets show images of the Earth and specific locations from where each spectrum was obtained using colored circles. Spectra and images in this figure have been corrected from basic geometric effects using a Lambert correction. JANUS spectra was obtained from selected regions using a radius of 2 pixel in the Lambert corrected images.
Figure 22 shows various broadband spectra obtained over the Earth portrait. All these spectra have been corrected using a Lambert correction. Panel a in this figure shows JANUS spectra over different cloud systems. The EnMAP spectra obtained for the Western Pacific is also shown showing very good agreement between both images. The water absorption feature at 940 nm is almost completely absent in these JANUS spectra of high clouds. Spectra of the ocean on regions without significant cloud coverage are shown in panel b. These JANUS spectra also agree with the EnMAP spectra of the ocean and show the strong water absorption at 940 nm. Spectra of different locations on the Earth from the very red Arabic Peninsula, to central Africa and Madagascar are also shown in panel c and show a larger variability than spectra of high clouds and the ocean. The three spectra over land locations show strong absorption at 940 nm, implying water absorption from the lower atmosphere in regions not covered by clouds.
The low spatial resolution, high cloud cover and relatively low presence of continents near the central meridian reduced the capability to investigate whether JANUS filters could form relevant indexes to demonstrate or display geographical variations in vegetation. A synthetic image built from the (F4 − F7)(F4 + F7) filter composition can resemble the classical NDVI (normalized difference vegetation index) filter (red − near IR)(red + near IR) (Rouse et al., 1974). However, images obtained under this filter combination did not show relevant results in terms of spatial variability associated with vegetation. This was probably due to the small coverage of terrains with variable vegetation and low cloud content, since suitable areas for this experiment are only available near the limb of the Earth in this dataset.
The images of the Earth in the 12 JANUS filters offer several additional image combination possibilities. A general technique that has been applied to multi-spectral data of the Earth and Jupiter is Principal Component Analysis (Singh and Harrison, 1985; Murtagh and Heck, 1987; Dyudina et al., 2001; Simon et al., 2015; Ordonez-Etxeberria et al., 2016; Biagiotti et al., 2025). This technique redistributes the information present in the images into a new base of images where each new image or component is as uncorrelated with other images as possible, forming a new set of images. The new principal components are ordered in a way in which the first principal component (PC1) contains most of the information of the original images in terms of image variance. The other components are arranged in a way in which each new component contains less variance than all the previous components.
For the analysis of JANUS images, we performed a principal component (PC) analysis on images normalized to the range 0–1. Figure 23 shows the results. Figure 24 shows the relative distribution of information in each component and the coefficients of the original images that are used to form the Principal Components down to PC4. Here PC1 contains 97.667 % of the total information content of the 12 images, adding them with similar weights. This image provides a high SNR image that was used in Fig. 21 to improve the image quality. PC2 contains 0.979 % of the information and separates blue wavelengths from other images with a strong participation of the F8 filter, sensitive to clouds. Clouds appear bright, continents appear grey and the ocean appears dark. PC3, PC4 and PC5 contain 0.618 %, 0.459 % and 0.138 % of the total information respectively, and components 6 to 12 contain together 0.5 % of all the remaining information. When examining the images of these PCs in Fig. 23, PC3 is an image composition where the effect of high clouds is reduced and that contains most of the sun glint. PC4 roughly separates the continents from oceans. PC5 (not shown) contains strong effects from the rotation of the planet and higher order components are mostly noise with negligible information content.
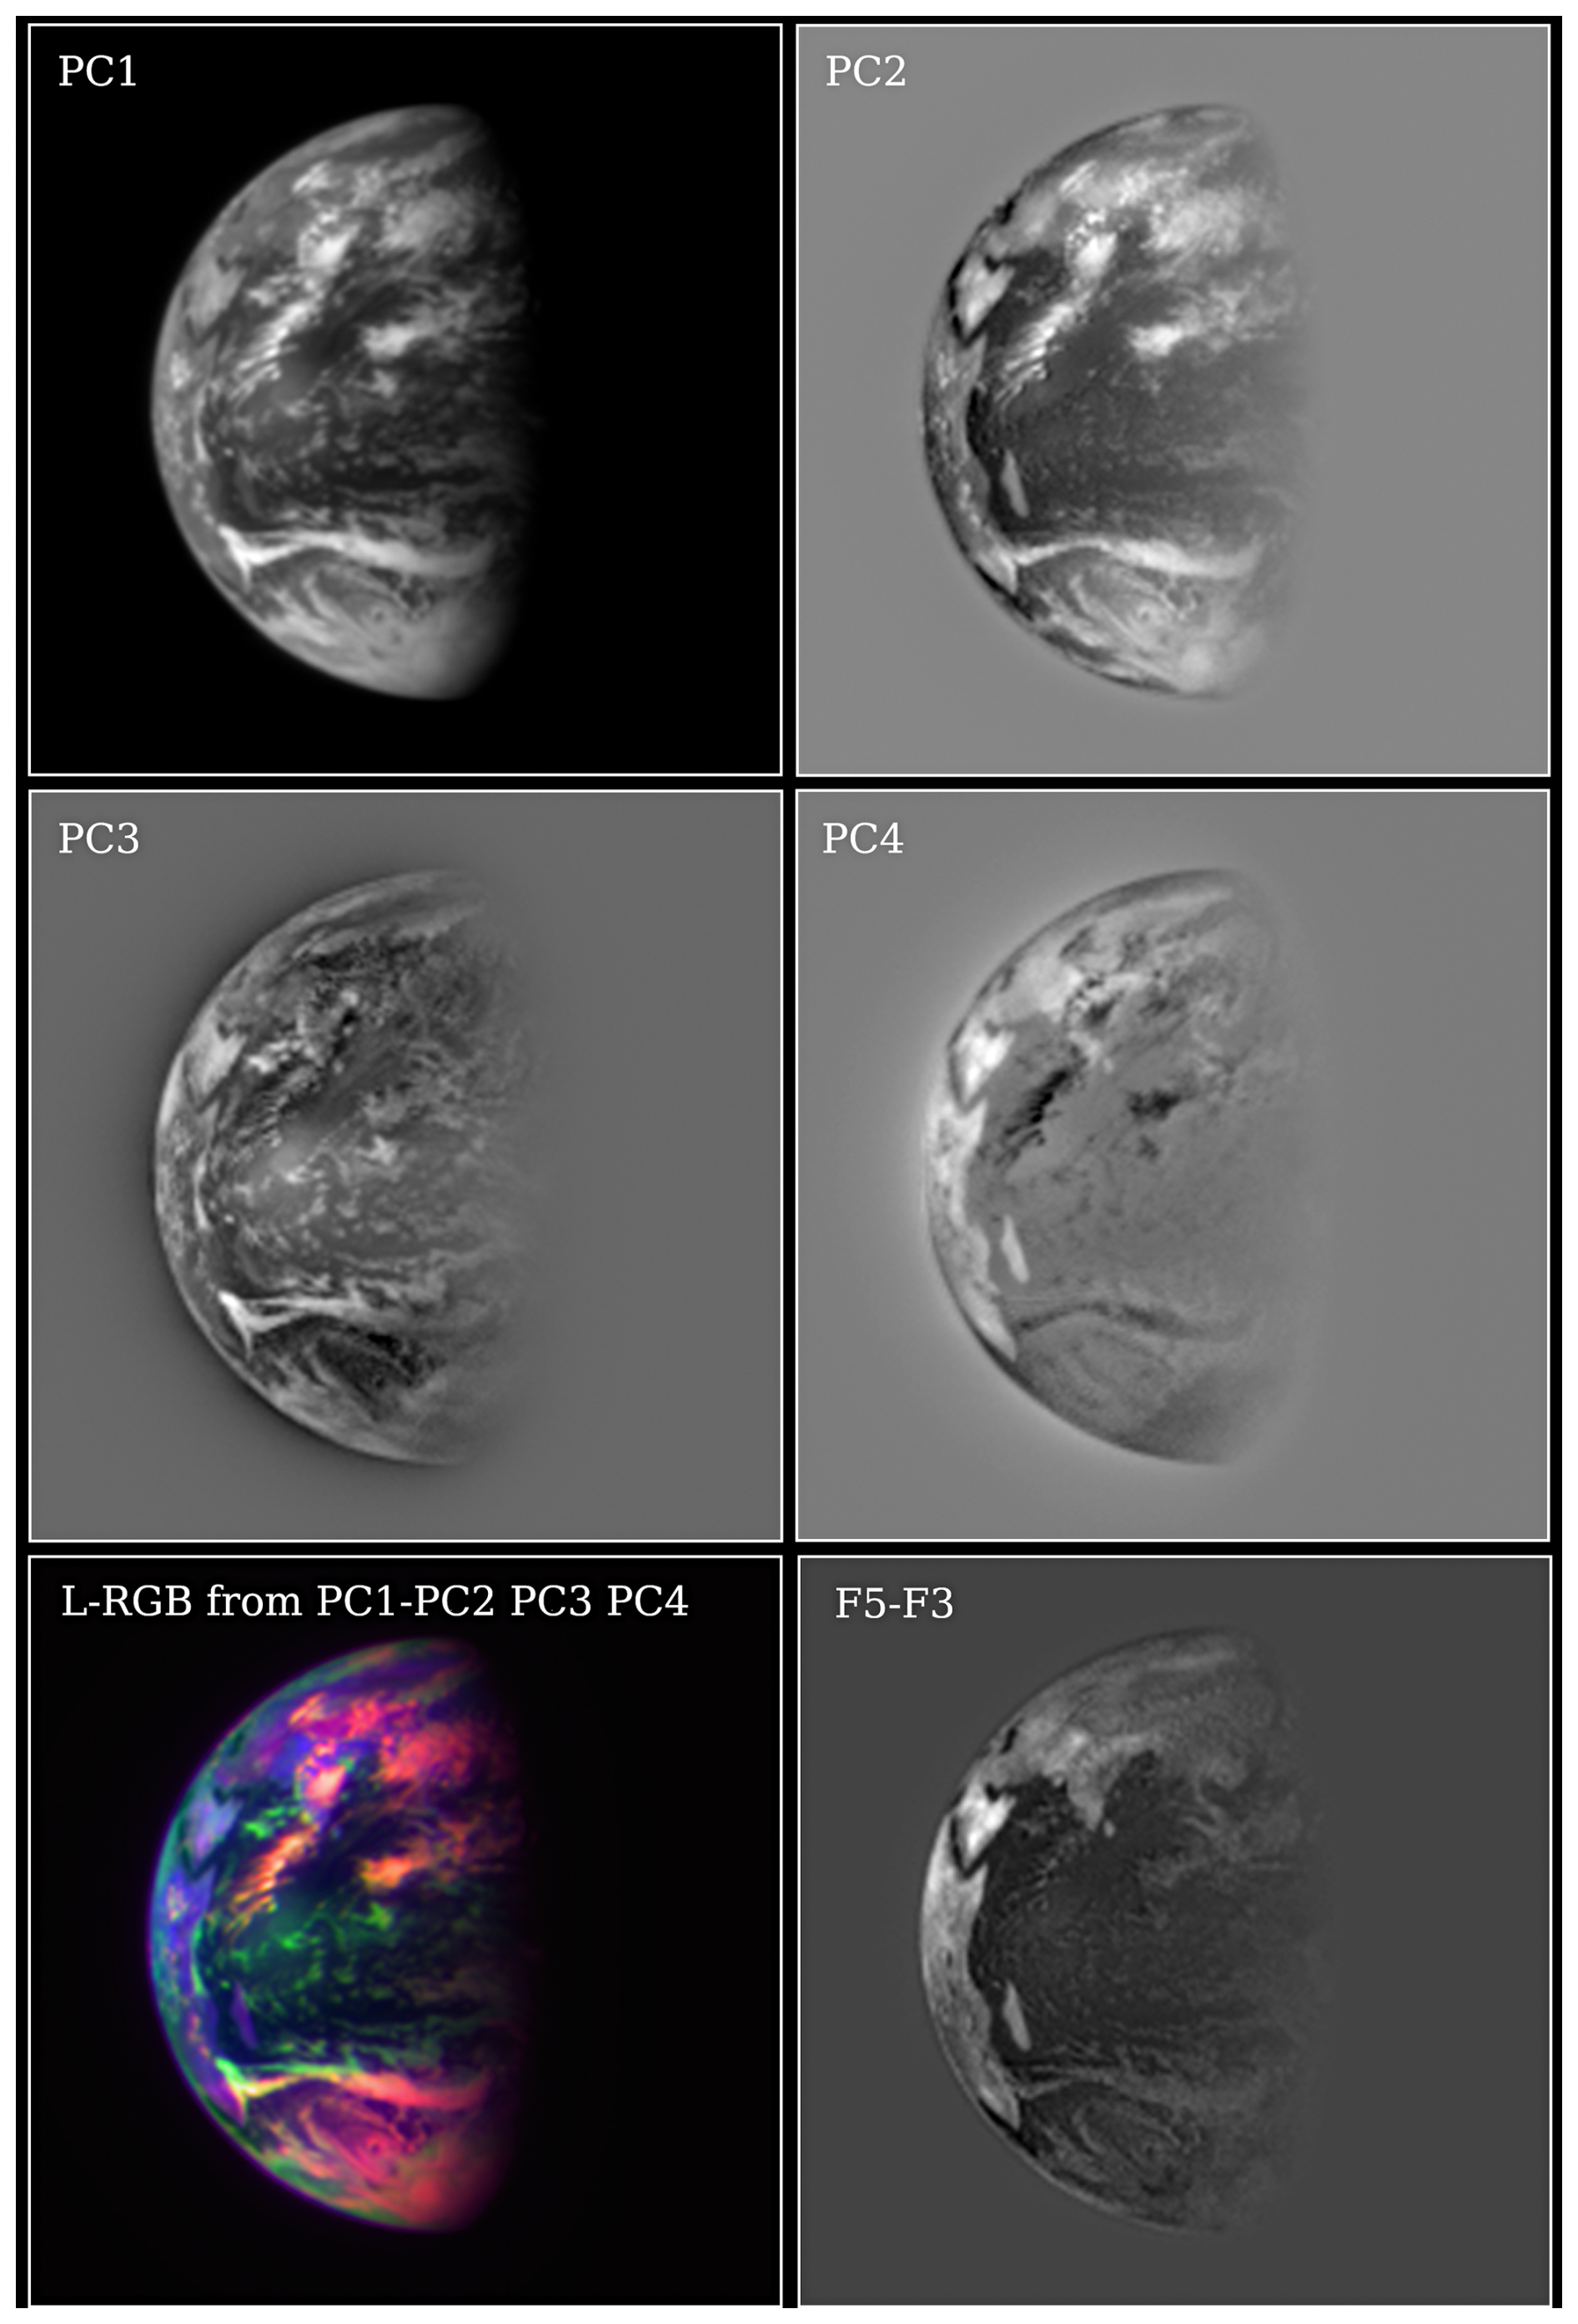
Figure 23PCA of JANUS images using all filters from F2 to F13. Different PCs are identified in the figure legend. The color image on the third row shows a color composition using PC1 as luminance and PC2, PC3 and PC4 as RGB channels. The RGB channels define chrominance information, while the luminance image is incorporated replacing the image luminance while preserving the RGB color ratios. The bottom right panel illustrates a more conventional image comparison from simply combining F5 (750 nm) and F3 (540 nm) as F5–F3. This combination removes most of the clouds present in the images.
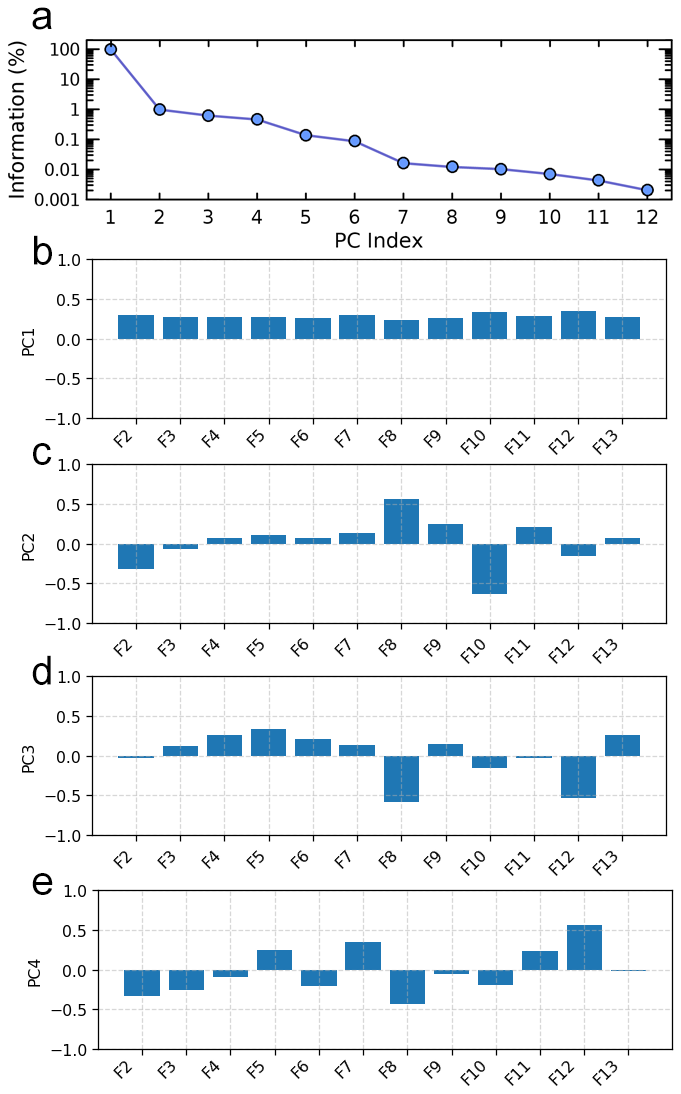
Figure 24Relative distribution of information in the PCA of Earth images together with PCs coefficients for the first 5 PCs.
A false color image was built from PC1, PC2, PC3 and PC4. An RGB image was built from PC2, PC3 and PC4 as chanels red, green and blue and a luminosity channel was added from PC1. This false color image summarizes most of the information available in the images. The image displays terrains with no clouds in purple-blue, dense clouds appear in different shades white to red, and thinner or less dense clouds appear in green hues.
The statistical approach used by PCA generally misses meaningful image combinations. A simple combination of the F5 (near-IR with weak water absorption) and F3 (green) filter simply computing F5–F3 produces the best visualization we could find of continents and land terrain including India, Indonesia and West Australia, even though most of India was covered by dense clouds. The image shows also clear views of large bodies of water like the Caspian sea, and the easternmost side of the Black sea. Three black spots in Africa correspond to lake Victoria, lake Tanganica and lake Malawi.
The sequence of observations of the Earth also contains the Moon, and the same techniques used here can be used to explore the overall spectral information of the Moon. However, the smaller number of pixels that cover the Moon does not result in compelling results.
The portrait of the Earth is analogous to images of the Earth obtained by the Galileo mission to Jupiter (Sagan et al., 1993; Geissler et al., 1995). Sagan et al. (1993) used the Galileo observations of the Earth to create a control experiment for the search for extraterrestrial life and understanding a complex object at a variety of spatial resolutions. JANUS images of the Earth show the capability to obtain relevant information of planetary targets even at small spatial resolution and demonstrate the feasibility of its filter set-up to provide spectroscopic data of interest even at modest spatial resolutions. Similar observations with Jupiter fitting inside one JANUS FOV will be accomplished in certain monitoring observations. Even though no specific flybys of Jupiter's moon Io will be run by JUICE, several opportunities to observe this volcanic moon at distances of around 500 000 km are possible throughout the mission.
The diversity of Earth phenomena captured by JANUS demonstrates the performance of the instrument and the range of scientific analyses that will be possible when JUICE arrives at Jupiter in 2031. Earth observations during LEGA were obtained with a spatial resolution that is roughly 80 times higher than the best spatial resolution expected for Jupiter images. Earth observations obtained during the farewell sequence are comparable to potential observations of Jupiter's inner moon Io and are much smaller than observations of Jupiter during monitoring observations on apojoves during the Jupiter tour in which Jupiter will be generally larger than the JANUS FOV.
Images of Earth's airglow are similar to expected observations of Jovian auroras in visible wavelengths (Ingersoll et al., 1998; Becker et al., 2025). At a large enough spatial resolution JANUS should contribute to understand the vertical structure of the auroras and their chemical impact in generating complex aerosols in the polar hazes (Hue et al., 2024). In addition, JANUS observations of Ganymede's nightside may also contribute to the characterization of Ganymede's aurora (de Kleer et al., 2023). Other potential weakly illuminated targets are Jupiter rings and Io's torus on the sodium filter (Bagenal and Dols, 2020).
Nightside images of the Earth illustrate the science goals associated with the investigations of lightning (Little et al., 1999), transient luminous events (Giles et al., 2020) and large meteors (Giles et al., 2021) on Jupiter's atmosphere. They also show the difficulties to identify the physical origin of weak light sources. While lightning and meteors should be orders of magnitude brighter than the weak light candidates for lightning and meteor on Earth's observations, appropriate detection thresholds, and cosmic rays and artifact rejection tools, will need to be used once JANUS starts to acquire Jupiter observations.
High-resolution observations at dawn show spectacular illumination results that depend on the vertical structure of aerosols and the geometry of the observations. Similar images of Jupiter's atmosphere will be obtained over a variety of phase angles and spatial resolutions. Elongated shadows created by a low elevation sun illumination might be able to produce direct measurements of relative cloud altitudes. Limb observations at spatial resolutions of about 10 km per pixel will also contribute to a direct determination of the vertical structure of clouds and aerosols on the Jovian atmosphere. Those observations will be very helpful to constrain radiative transfer models that will determine the vertical cloud structure derived from JANUS observations under less extreme illumination conditions and using different filters including methane absorption bands.
JANUS will observe many convective and complex meteorological systems producing a rich dataset to study atmospheric dynamics, derive winds from repeated observations and investigate the overall workings of Jupiter's atmosphere.
The distant observations of the Earth show a single multi-filter portrait of the Earth. JANUS monitoring observations of Jupiter atmosphere during apojoves will reach spatial resolutions of around 50 km per pixel, thus, showing a large portion of the Jupiter disk in a single JANUS frame and allowing global monitoring with relatively small resources (Fletcher et al., 2023).
Repetition of observations over the Jupiter orbiting time line or 3.5 years will be a key feature of the mission. That time line might be potentially longer if Jupiter can be observed during the last phases of the JUICE mission when the spacecraft will be orbiting Ganymede.
New Earth Gravity Assist maneuvers will be run on September 2026 and January 2029. Observations from 2024 play a significant role in the planning of these observations. Those new opportunities to observe the Earth will allow to improve the planning of JANUS observations of Jupiter's nightside and to better define the best combination of multi-filter images to reach the science goals of the instrument on its Jupiter investigation (Fletcher et al., 2023; Palumbo et al., 2025).
The following tables provide a brief description of the data. The start column refers to the start of the exposure and is given with a resolution of seconds (the precision of this parameter is known for each image with a precision of ms). Longitude (Lon) and latitude (Lat) refer to the center of the image and are given in degrees, with latitudes in the table using geodetic latitude instead of geocentric latitude given in the labels of the images. Images on Tables A1–A3 were all obtained on 20 August 2025. Images on Table A4 were acquired on 9 September 2025.
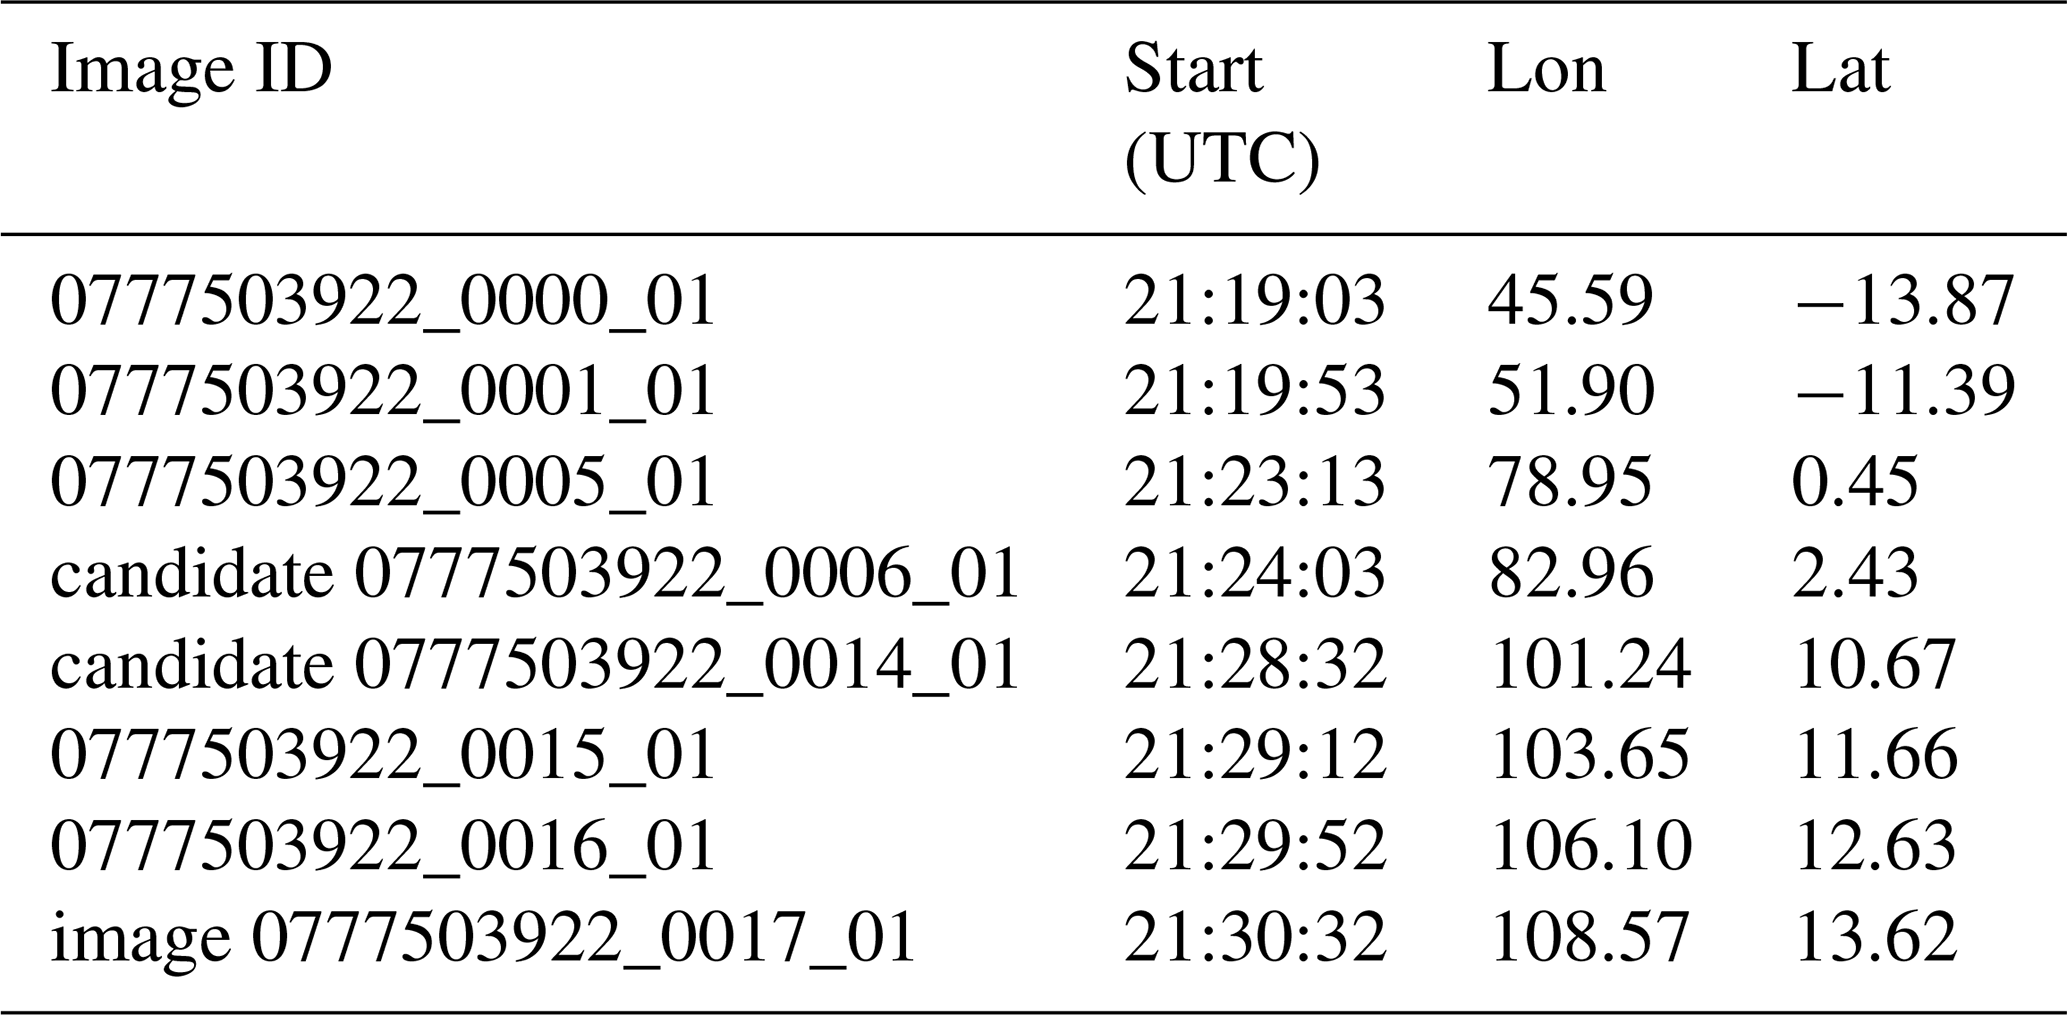
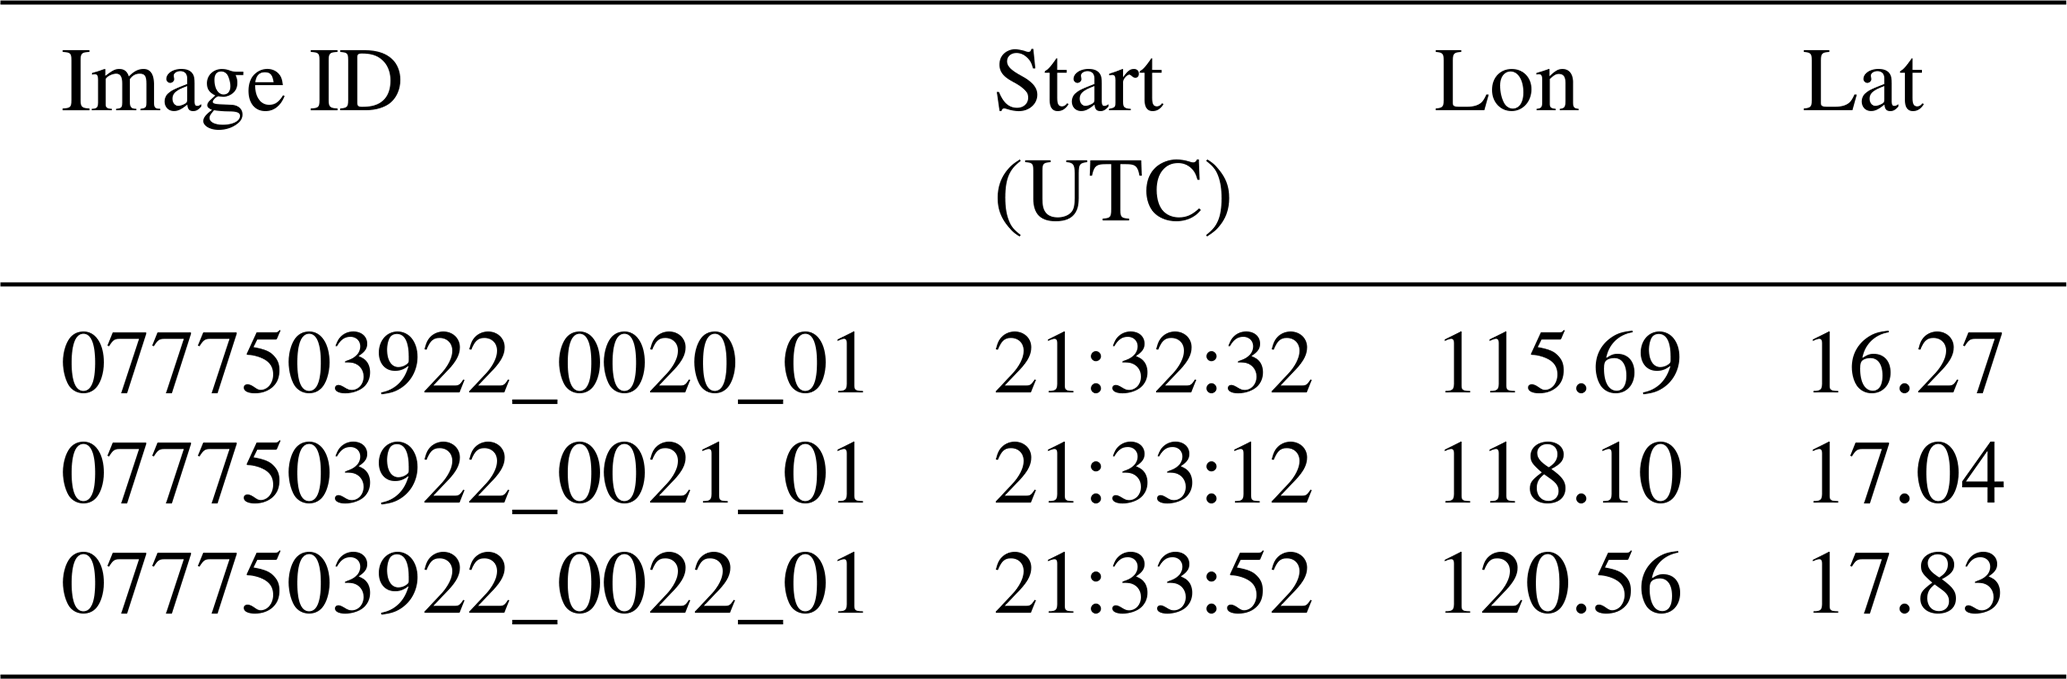
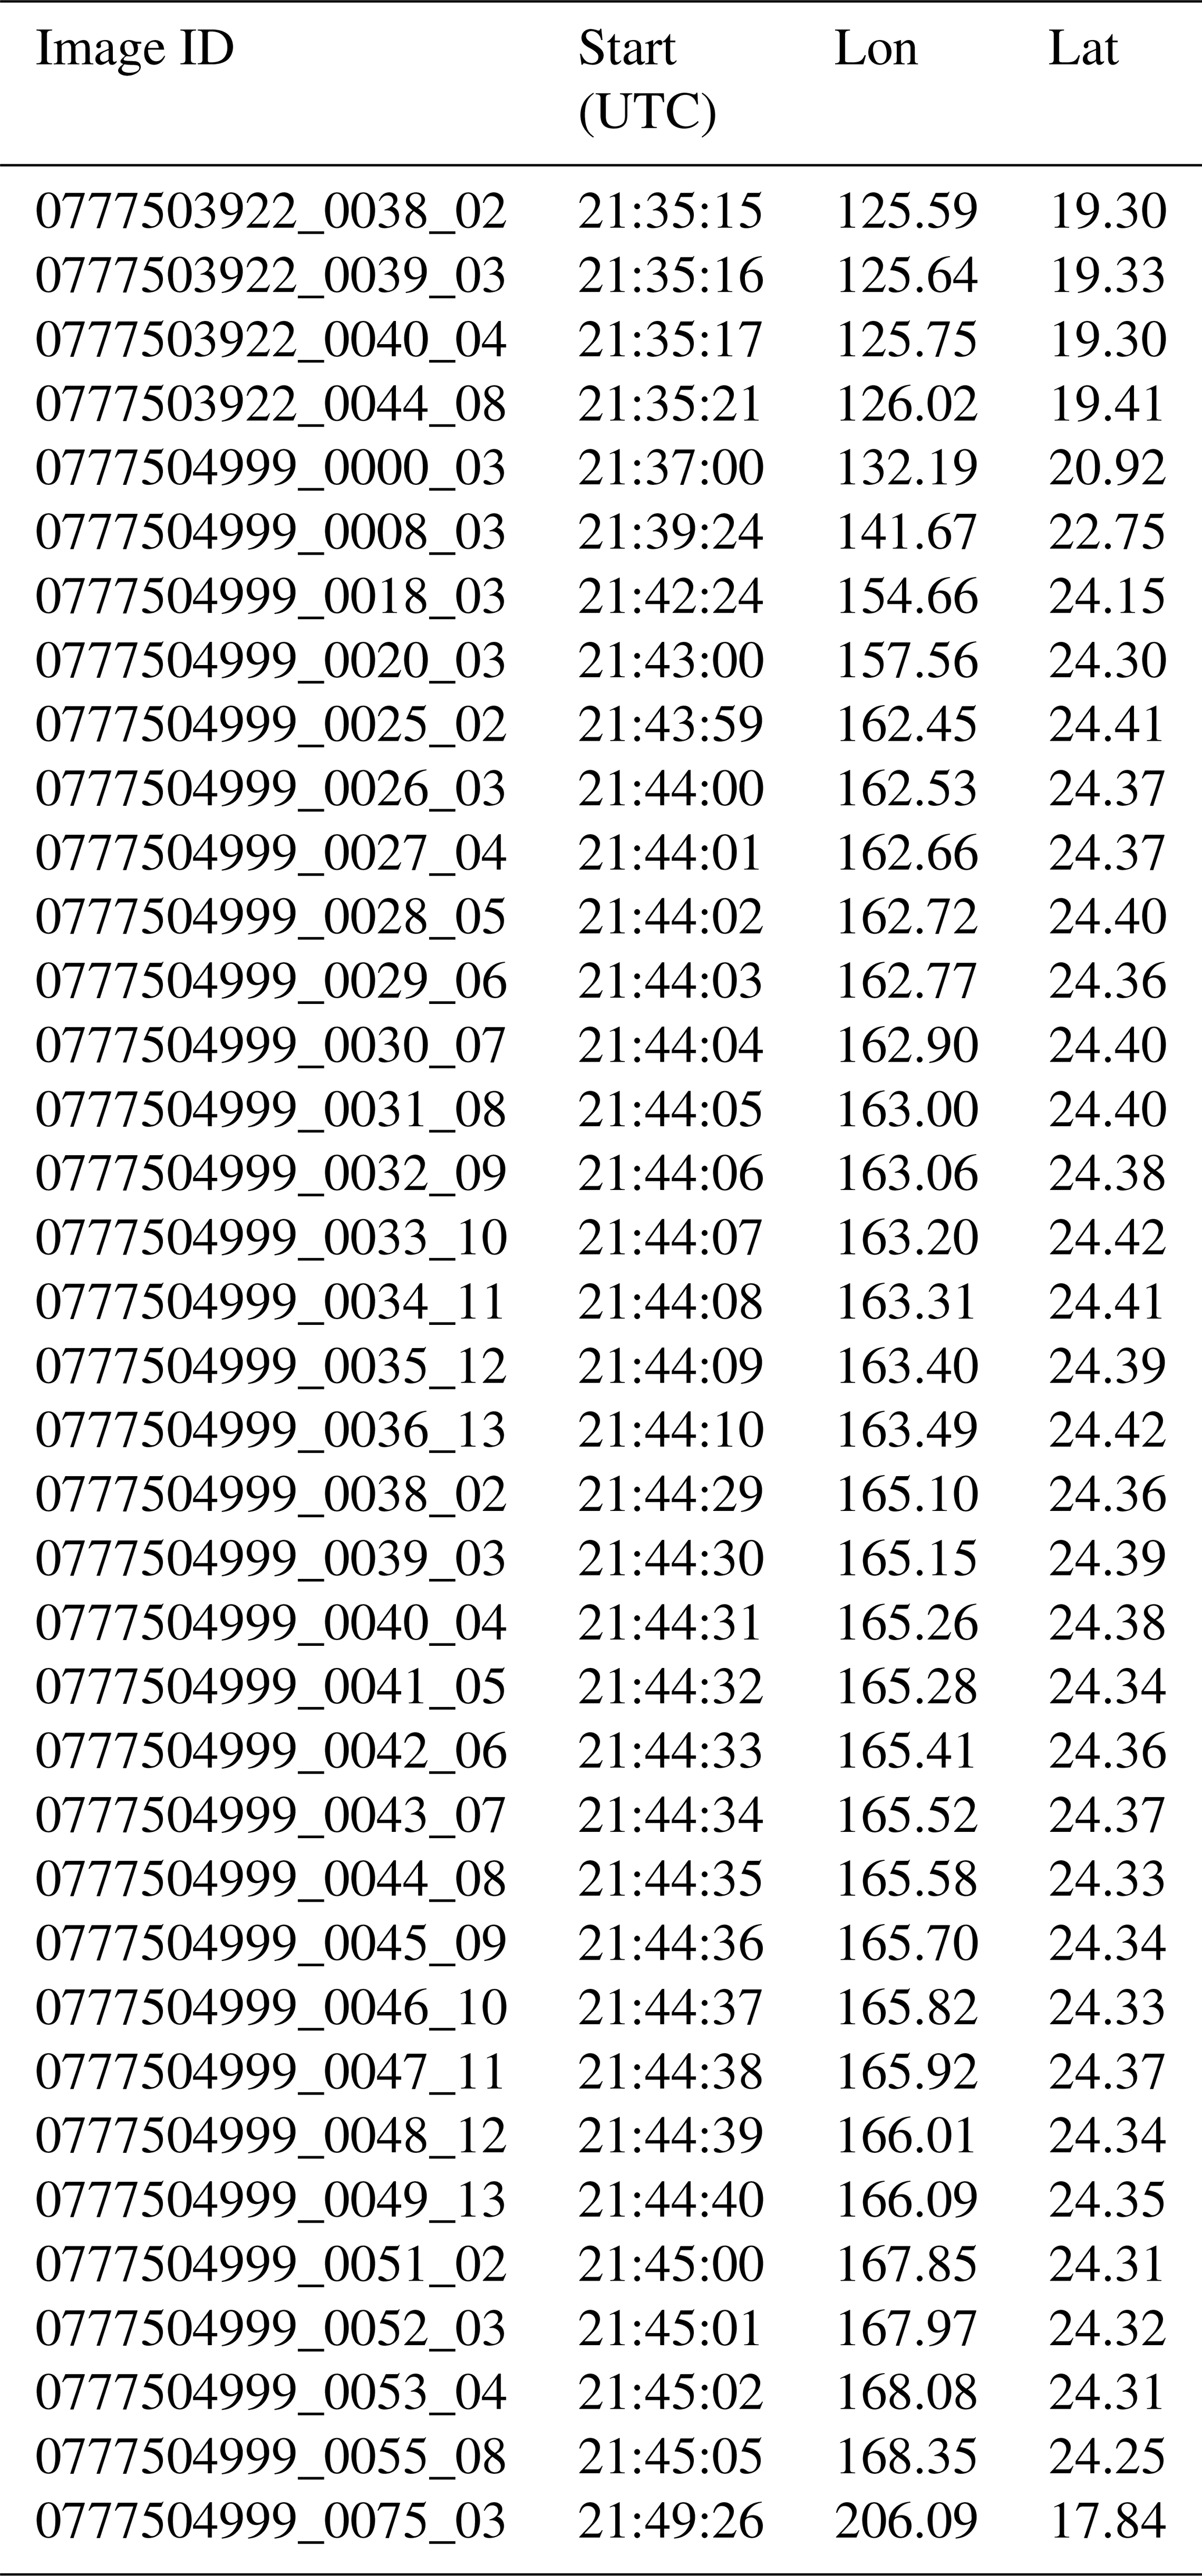
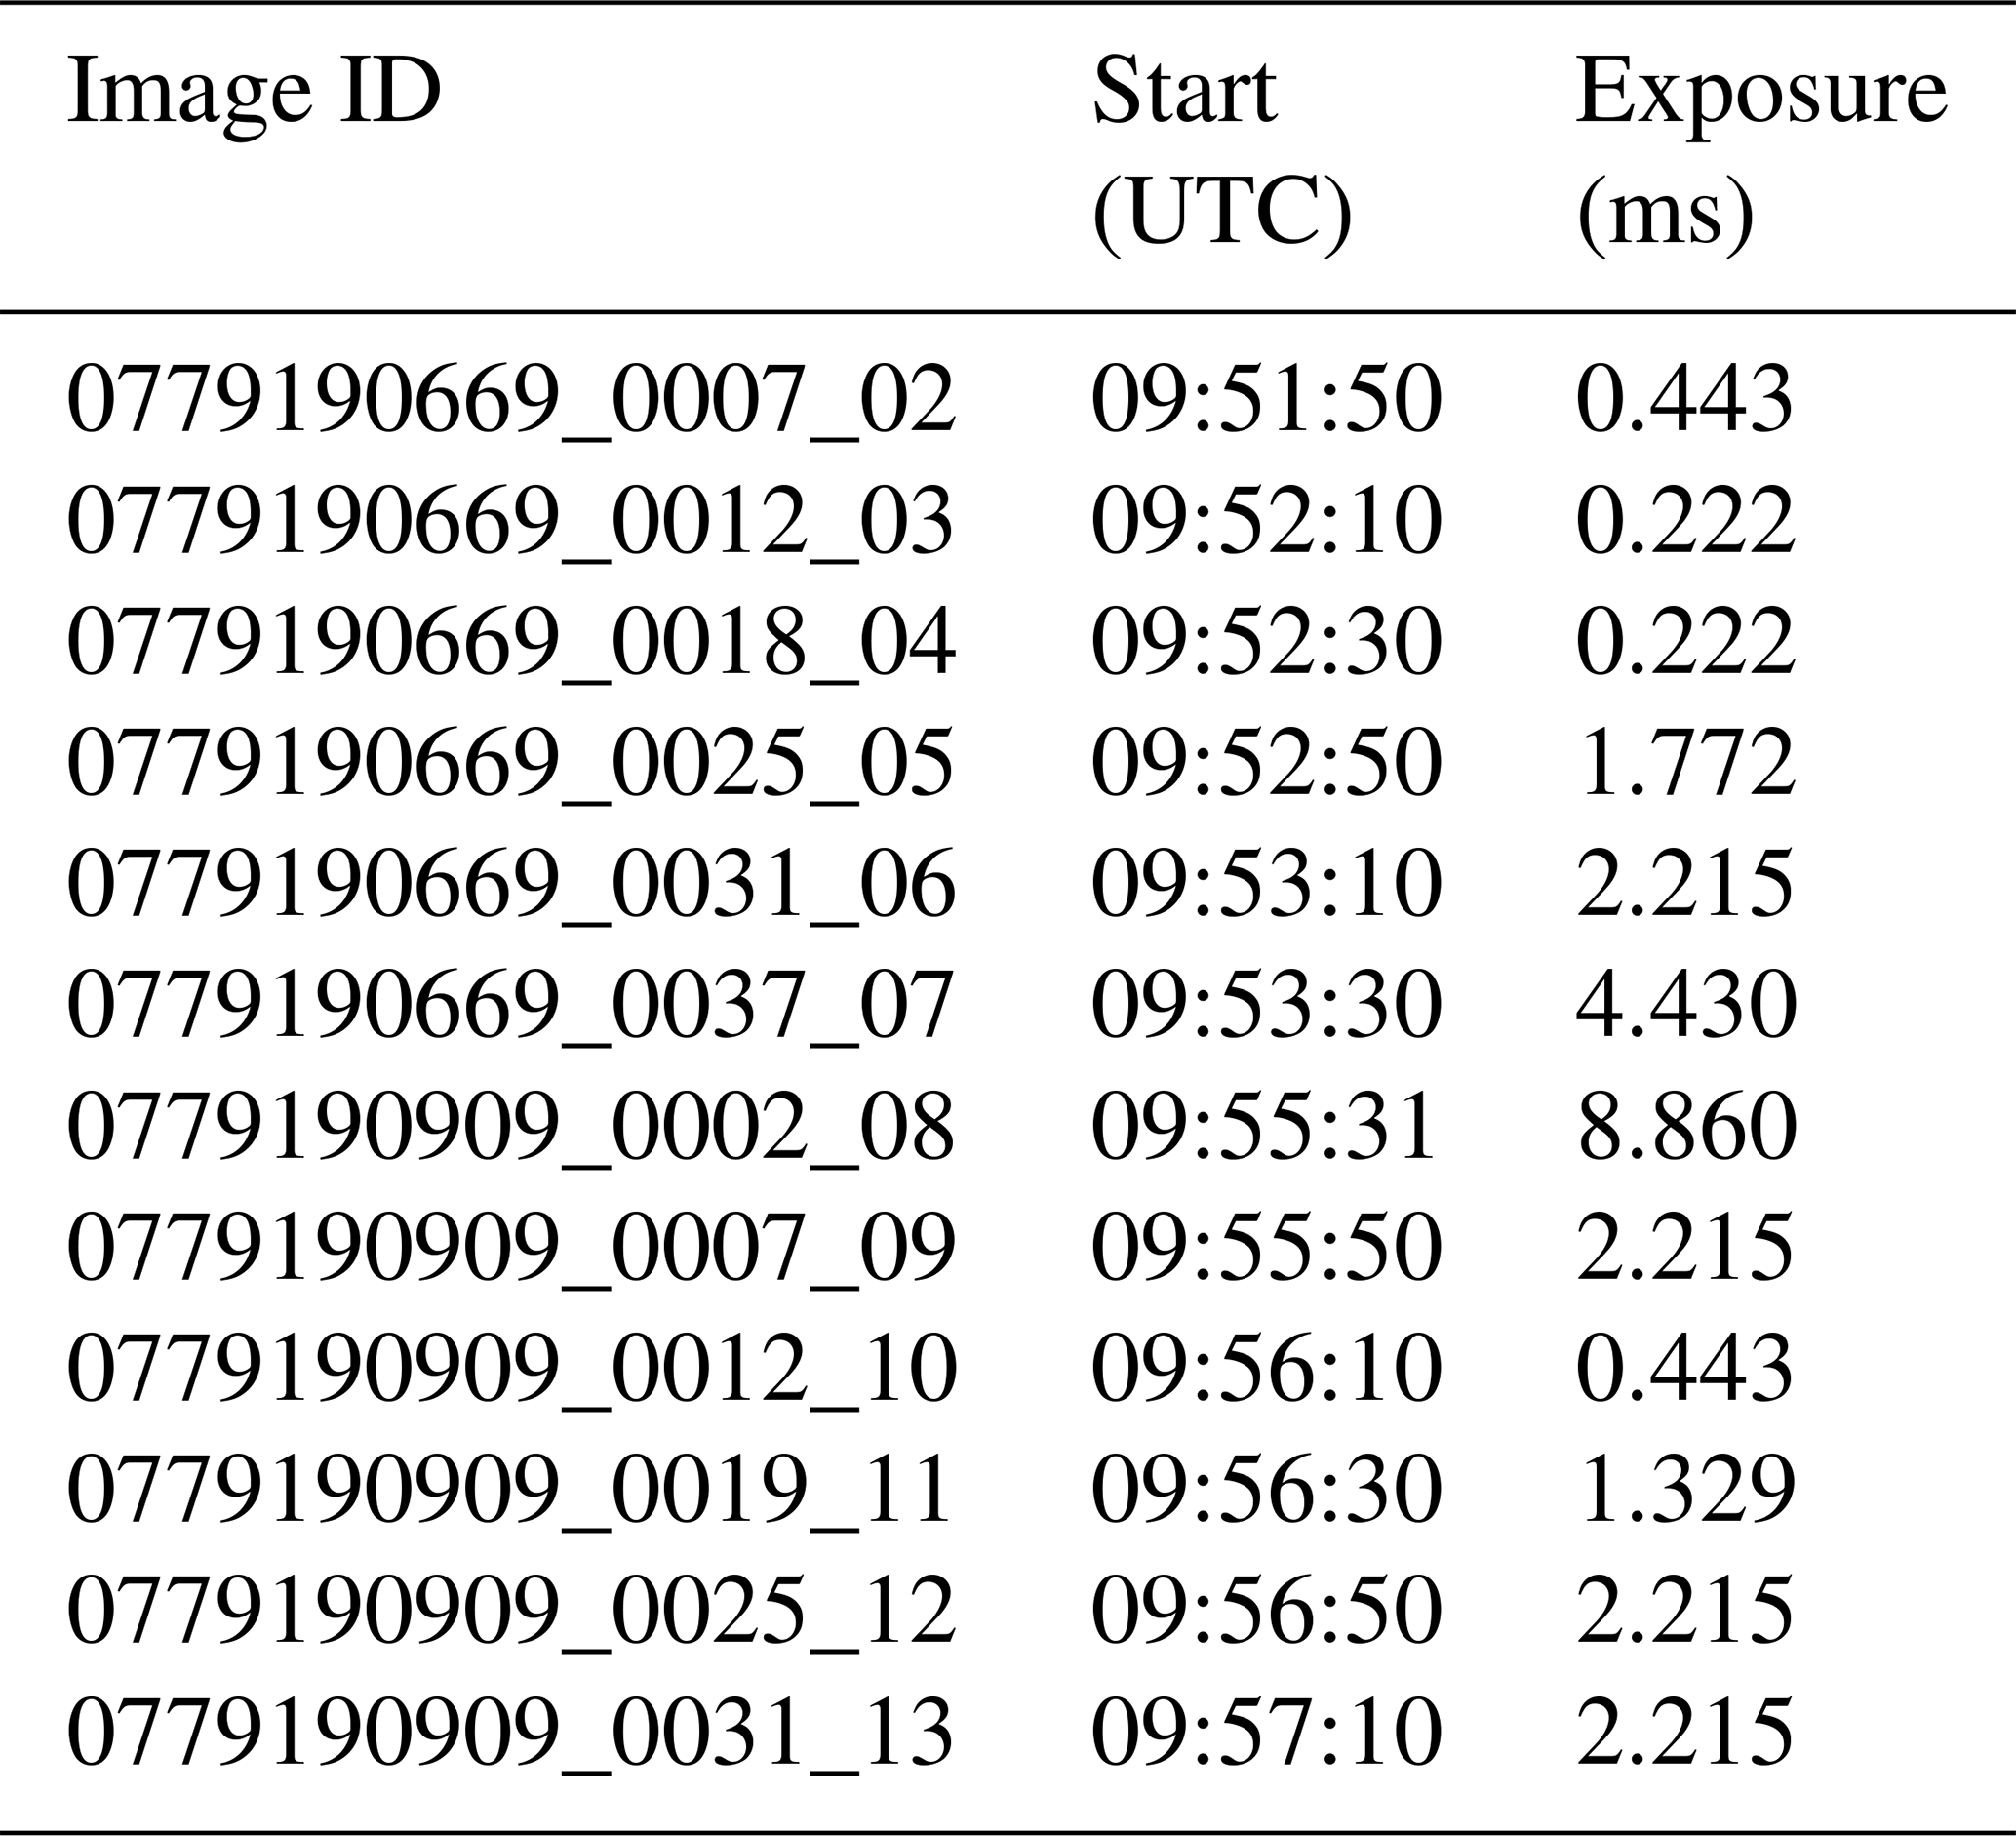
The JANUS data associated with this manuscript are published in the ESA-JUICE_LEGA-Special-Issue_v1.0 dataset (https://doi.org/10.57780/esa-2bb387d, European Space Agency, 2026). The PRISMA hyperspectral data used in this study are publicly available from the Italian Space Agency (ASI) PRISMA mission data archive. EnMAP hyperspectral data are publicly available from the EnMAP data archive operated by the German Aerospace Center (DLR). Access to both datasets is subject to user registration and acceptance of the respective data use policies.
R. Hueso led the analysis and writing of the manuscript. A. Antuñano, L. M. Lara, K. Stephan, A. Zinzi, A. Coustenis, A. Simon, Y. Yair, M. Sato, J. Haruyama and Y. Takahashi contributed to different analyses parts of the analysis. K. Stephan and A. Zinzi also provided external data and specific analyses of EnMAP and PRISMA data respectively. Y. Yair, M. Sato and J. Haruyama examined external sources of lightning information. C. Tubiana led the science operations. L. Penasa and A. Luchetti worked on the science plan. L. Agostini led the data calibration process. M. Aye led the calculation of exposure times. R. Evill and I. Belgacem worked on science operations. A. Aboudan, E. Kersten, K.-D. Matz, F. Trauthan, and M. Patel worked on image acquisition, navigation and calibration. R. Politi participated in the data analysis pipeline and data archival. J. M. Castro-Marín, V. Della Corte, S. Hviid, T. Roatsch and N. Schmitz worked on additional aspects of the investigation. G. Portyankina played a key role in team coordination. P. Palumbo led the conceptualization of the investigation, data acquisition and team coordination. All authors critically reviewed and revised the manuscript and approved the final version for publication.
The contact author has declared that none of the authors has any competing interests.
Publisher's note: Copernicus Publications remains neutral with regard to jurisdictional claims made in the text, published maps, institutional affiliations, or any other geographical representation in this paper. The authors bear the ultimate responsibility for providing appropriate place names. Views expressed in the text are those of the authors and do not necessarily reflect the views of the publisher.
This article is part of the special issue “The first-ever lunar–Earth flyby: a unique test environment for Juice”. It is not associated with a conference.
JUICE is a mission under ESA leadership with contributions from its Member States, NASA, JAXA and the Israel Space Agency. JANUS has been funded by the respective Space Agencies: ASI (lead funding agency), DLR, Spanish Research Ministry and the UK Space Agency. Main hardware-provider Companies and Institutes are Leonardo SpA (Prime Industry), DLR-Berlin, CSIC-IAA and Sener. We are very thankful to the two anonymous reviewers from their detailed review of this manuscript and their comments. The authors wish to thank Benoit Seignovert for useful discussions on the interpretation of nighttime and sun glint observations. They also thank Jorge Hernández-Bernal for discussions on geometric calculations of altitudes and Jeff Lapierre for help processing ENTLN data of candidate lightning events.
This research has been supported by the Agenzia Spaziale Italiana (ASI) in the framework of the ASI–INAF agreement no. 2023-6-HH.0, the Agencia Estatal de Investigación (grant nos. PID2023-149055NB-C31, PID2021-126365NB-C21, and Severo Ochoa CEX2021-001131-S), and the Grupos de Investigación del Gobierno Vasco (grant no. IT1742-22). Additional support was provided by the French Centre National d'Études Spatiales (CNES) and the German Federal Ministry of Research, Technology and Space (BMFTR) through the German Space Agency at DLR (Funding code: 50QJ2404).
This paper was edited by Stephanie C. Werner and reviewed by two anonymous referees.
Agostini, L., Matz, K.-D., Tubiana, C., Della Corte, V., Penasa, L., Bilotta, T., Sarti, F., Read, M., Hviid, S., Mottola, S., Aboudan, A., Trauthan, F., Politi, R., Aye, M., Hueso, R., Lucchetti, A., Kersten, E., Belgacem, I., Dietz, A., Evill, R., Bell III, J. F., Zinzi, A., Castro-Marin, J. M., Roatsch, T., Schmitz, N., Patel, M. R., Lara, L. M., Portyankina, G., and Palumbo, P.: Calibrating JANUS: an overview of the calibration pipeline and what we learned from the Moon-Earth flyby data, EGUsphere [preprint], https://doi.org/10.5194/egusphere-2026-2032, 2026. a, b, c, d
Alford, M. H., MacKinnon, J. A., Simmons, H. L., and Nash, J. D.: Near-Inertial Internal Gravity Waves in the Ocean, Annu. Rev. Mar. Sci., 8, 95–123, https://doi.org/10.1146/annurev-marine-010814-015746, 2016. a
Arregi, J., Rojas, J. F., Hueso, R., and Sánchez-Lavega, A.: Gravity waves in Jupiter's equatorial clouds observed by the Galileo orbiter, Icarus, 202, 358–360, https://doi.org/10.1016/j.icarus.2009.03.028, 2009. a
Bagenal, F. and Dols, V.: The Space Environment of Io and Europa, J. Geophys. Res.-Space, 125, e27485, https://doi.org/10.1029/2019JA027485, 2020. a
Banfield, D., Gierasch, P. J., Bell, M., Ustinov, E., Ingersoll, A. P., Vasavada, A. R., West, R. A., and Belton, M. J. S.: Jupiter's Cloud Structure from Galileo Imaging Data, Icarus, 135, 230–250, https://doi.org/10.1006/icar.1998.5985, 1998. a
Becker, H. N., Alexander, J. W., Atreya, S. K., Bolton, S. J., Brennan, M. J., Brown, S. T., Guillaume, A., Guillot, T., Ingersoll, A. P., Levin, S. M., Lunine, J. I., Aglyamov, Y. S., and Steffes, P. G.: Small lightning flashes from shallow electrical storms on Jupiter, Nature, 584, 55–58, https://doi.org/10.1038/s41586-020-2532-1, 2020. a, b
Becker, H. N., Brennan, M. J., Florence, M., Greathouse, T., Waite, J. H., Atreya, S. K., Bolton, S. J., and Alexander, J. W.: The Juno SRU's Unprecedented View of Jupiter's Upper Atmosphere and Aurorae at Visible Wavelengths, in: AGU Fall Meeting Abstracts, vol. 2025 of AGU Fall Meeting Abstracts, SM21A-02, https://ui.adsabs.harvard.edu/abs/2025AGUFMSM21A..02B/ (last access: 9 July 2026), 2025. a, b, c
Biagiotti, F., Fletcher, L. N., Grassi, D., Roman, M. T., Piccioni, G., Mura, A., de Pater, I., Fouchet, T., Wong, M. H., Hueso, R., King, O., Melin, H., Harkett, J., Toogood, S., Irwin, P. G. J., Tosi, F., Adriani, A., Sindoni, G., Plainaki, C., Sordini, R., Noschese, R., Cicchetti, A., Orton, G., Rodriguez-Ovalle, P., Bjoraker, G. L., Levin, S., Li, C., and Bolton, S.: Machine learning spectral clustering techniques: Application to Jovian clouds from Juno/JIRAM and JWST/NIRSpec, Astron. Astrophys., 701, A247, https://doi.org/10.1051/0004-6361/202554552, 2025. a
Blakeslee, R. J., Mach, D. M., Bateman, M. G., and Bailey, J. C.: Seasonal variations in the lightning diurnal cycle and implications for the global electric circuit, Atmos. Res., 135, 228–243, https://doi.org/10.1016/j.atmosres.2012.09.023, 2014. a
Borucki, W. J. and Magalhaes, J. A.: Analysis of voyager 2 images of Jovian lightning, Icarus, 96, 1–14, https://doi.org/10.1016/0019-1035(92)90002-O, 1992. a
Boutonnet, A., Langevin, Y., and Erd, C.: Designing the JUICE Trajectory, Space Sci. Rev., 220, 67, https://doi.org/10.1007/s11214-024-01093-y, 2024. a
Brueshaber, S. R., Zhang, Z., Rogers, J. H., Eichstädt, G., Orton, G. S., Grassi, D., Fletcher, L. N., Li, C., Mizumoto, S., Mura, A., Oyafuso, F., Sankar, R., Wong, M. H., Hansen, C. J., Levin, S., and Bolton, S.: Multi-instrument sounding of a Jovian thunderstorm from Juno, Icarus, 432, 116465, https://doi.org/10.1016/j.icarus.2025.116465, 2025. a, b
Christian, H. J., Blakeslee, R. J., Boccippio, D. J., Boeck, W. L., Buechler, D. E., Driscoll, K. T., Goodman, S. J., Hall, J. M., Koshak, W. J., Mach, D. M., and Stewart, M. F.: Global frequency and distribution of lightning as observed from space by the Optical Transient Detector, J. Geophys. Res.-Atmos., 108, 4005, https://doi.org/10.1029/2002JD002347, 2003. a
Cogliati, S., Sarti, F., Chiarantini, L., Cosi, M., Lorusso, R., Lopinto, E., Miglietta, F., Genesio, L., Guanter, L., Damm, A., Pérez-López, S., Scheffler, D., Tagliabue, G., Panigada, C., Rascher, U., Dowling, T. P. F., Giardino, C., and Colombo, R.: The PRISMA imaging spectroscopy mission: overview and first performance analysis, Remote Sens. Environ., 262, 112499, https://doi.org/10.1016/j.rse.2021.112499, 2021. a
Cook, A. F. and Duxbury, T. C.: A fireball in Jupiter's atmosphere, J. Geophys. Res., 86, 8815–8817, https://doi.org/10.1029/JA086iA10p08815, 1981. a
Coustenis, A., Witasse, O., and Erd, C.: The JUICE Mission: Expectations and Challenges, The Bridge, 51, 41–50, https://www.nae.edu/260902/The-JUICE-Mission-Challenges-and-Expectations (last access: 9 July 2026), 2021. a
Davis, M. W., Gladstone, G. R., Retherford, K. D., and Persyn, S. C.: The JUICE ultraviolet spectrograph: a next-generation compact UVS for ESA's JUICE mission, in: International Conference on Space Optics – ICSO 2020, edited by: Cugny, B., Sodnik, Z., and Karafolas, N., vol. 11852 of Society of Photo-Optical Instrumentation Engineers (SPIE) Conference Series, 1185226, https://doi.org/10.1117/12.2599357, 2021. a
de Kleer, K., Milby, Z., Schmidt, C., Camarca, M., and Brown, M. E.: The Optical Aurorae of Europa, Ganymede, and Callisto, Planet. Sci. J., 4, 37, https://doi.org/10.3847/PSJ/acb53c, 2023. a, b
Drolshagen, E., Ott, T., Koschny, D., Drolshagen, G., Vaubaillon, J., Colas, F., Zanda, B., Bouley, S., Jeanne, S., Malgoyre, A., Birlan, M., Vernazza, P., Gardiol, D., Nedelcu, D. A., Rowe, J., Forcier, M., Trigo-Rodriguez, J. M., Peña-Asensio, E., Lamy, H., Ferrière, L., Barghini, D., Carbognani, A., Di Martino, M., Rasetti, S., Valsecchi, G. B., Volpicelli, C. A., Di Carlo, M., Knapic, C., Pratesi, G., Riva, W., Stirpe, G. M., Zorba, S., Hernandez, O., Grandchamps, A., Jehin, E., Jobin, M., King, A., Sanchez-Lavega, A., Toni, A., Rimola, A., and Poppe, B.: Luminous efficiency based on FRIPON meteors and limitations of ablation models, Astron. Astrophys., 650, A159, https://doi.org/10.1051/0004-6361/202040204, 2021. a
Dyudina, U. A., Ingersoll, A. P., Danielson, G. E., Baines, K. H., Carlson, R. W., The Galileo NIMS, and SSI Teams: Interpretation of NIMS and SSI Images on the Jovian Cloud Structure, Icarus, 150, 219–233, https://doi.org/10.1006/icar.2000.6582, 2001. a
Dyudina, U. A., Del Genio, A. D., Ingersoll, A. P., Porco, C. C., West, R. A., Vasavada, A. R., and Barbara, J. M.: Lightning on Jupiter observed in the Hα line by the Cassini imaging science subsystem, Icarus, 172, 24–36, https://doi.org/10.1016/j.icarus.2004.07.014, 2004. a
Dyudina, U. A., Ingersoll, A. P., Ewald, S. P., Porco, C. C., Fischer, G., Kurth, W. S., and West, R. A.: Detection of visible lightning on Saturn, Geophys. Res. Lett., 37, L09205, https://doi.org/10.1029/2010GL043188, 2010. a
European Space Agency: ESA-JUICE_LEGA-Special-Issue_v1.0, Planetary Science Archive (PSA) Guest Storage Facility (GSF) [data set], https://doi.org/10.57780/esa-2bb387d, 2026. a, b
Fletcher, L. N., Melin, H., Adriani, A., Simon, A. A., Sanchez-Lavega, A., Donnelly, P. T., Antuñano, A., Orton, G. S., Hueso, R., Kraaikamp, E., Wong, M. H., Barnett, M., Moriconi, M. L., Altieri, F., and Sindoni, G.: Jupiter's Mesoscale Waves Observed at 5 µm by Ground-based Observations and Juno JIRAM, Astron. J., 156, 67, https://doi.org/10.3847/1538-3881/aace02, 2018. a
Fletcher, L. N., Kaspi, Y., Guillot, T., and Showman, A. P.: How Well Do We Understand the Belt/Zone Circulation of Giant Planet Atmospheres?, Space Sci. Rev., 216, 30, https://doi.org/10.1007/s11214-019-0631-9, 2020. a
Fletcher, L. N., Cavalié, T., Grassi, D., Hueso, R., Lara, L. M., Kaspi, Y., Galanti, E., Greathouse, T. K., Molyneux, P. M., Galand, M., Vallat, C., Witasse, O., Lorente, R., Hartogh, P., Poulet, F., Langevin, Y., Palumbo, P., Gladstone, G. R., Retherford, K. D., Dougherty, M. K., Wahlund, J.-E., Barabash, S., Iess, L., Bruzzone, L., Hussmann, H., Gurvits, L. I., Santolik, O., Kolmasova, I., Fischer, G., Müller-Wodarg, I., Piccioni, G., Fouchet, T., Gérard, J.-C., Sánchez-Lavega, A., Irwin, P. G. J., Grodent, D., Altieri, F., Mura, A., Drossart, P., Kammer, J., Giles, R., Cazaux, S., Jones, G., Smirnova, M., Lellouch, E., Medvedev, A. S., Moreno, R., Rezac, L., Coustenis, A., and Costa, M.: Jupiter Science Enabled by ESA's Jupiter Icy Moons Explorer, Space Sci. Rev., 219, 53, https://doi.org/10.1007/s11214-023-00996-6, 2023. a, b, c, d
Geissler, P., Thompson, W. R., Greenberg, R., Moersch, J., McEwen, A., and Sagan, C.: Galileo multispectral imaging of Earth, J. Geophys. Res., 100, 16895–16906, https://doi.org/10.1029/95JE01407, 1995. a
Gierasch, P. J., Ingersoll, A. P., Banfield, D., Ewald, S. P., Helfenstein, P., Simon-Miller, A., Vasavada, A., Breneman, H. H., Senske, D. A., and Galileo Imaging Team: Observation of moist convection in Jupiter's atmosphere, Nature, 403, 628–630, https://doi.org/10.1038/35001017, 2000. a, b, c
Giles, R. S., Greathouse, T. K., Bonfond, B., Gladstone, G. R., Kammer, J. A., Hue, V., Grodent, D. C., Gérard, J.-C., Versteeg, M. H., Wong, M. H., Bolton, S. J., Connerney, J. E. P., and Levin, S. M.: Possible Transient Luminous Events Observed in Jupiter's Upper Atmosphere, J. Geophys. Res.-Planet., 125, e06659, https://doi.org/10.1029/2020JE006659, 2020. a, b
Giles, R. S., Greathouse, T. K., Kammer, J. A., Gladstone, G. R., Bonfond, B., Hue, V., Grodent, D. C., Gérard, J.-C., Versteeg, M. H., Bolton, S. J., Connerney, J. E. P., and Levin, S. M.: Detection of a Bolide in Jupiter's Atmosphere With Juno UVS, Geophys. Res. Lett., 48, e91797, https://doi.org/10.1029/2020GL091797, 2021. a, b
Gonzalez, R. C. and Woods, R. E.: Digital Image Processing, Pearson, 4 edn., ISBN 9781292223049, 2018. a
Grasset, O., Dougherty, M. K., Coustenis, A., Bunce, E. J., Erd, C., Titov, D., Blanc, M., Coates, A., Drossart, P., Fletcher, L. N., Hussmann, H., Jaumann, R., Krupp, N., Lebreton, J.-P., Prieto-Ballesteros, O., Tortora, P., Tosi, F., and Van Hoolst, T.: JUpiter ICy moons Explorer (JUICE): An ESA mission to orbit Ganymede and to characterise the Jupiter system, Planet. Space Sci., 78, 1–21, https://doi.org/10.1016/j.pss.2012.12.002, 2013. a
Greathouse, T. K., Gladstone, G. R., Molyneux, P. M., Versteeg, M. H., Hue, V., Kammer, J. A., Davis, M. W., Bolton, S. J., Giles, R. S., Connerney, J. E. P., Gerard, J.-C., Grodent, D. C., Bonfond, B., Saur, J., and Duling, S.: UVS Observations of Ganymede's Aurora During Juno Orbits 34 and 35, Geophys. Res. Lett., 49, e2022GL099794, https://doi.org/10.1029/2022GL099794, 2022. a
Hue, V., Cavalié, T., Sinclair, J. A., Zhang, X., Benmahi, B., Rodríguez-Ovalle, P., Giles, R. S., Stallard, T. S., Johnson, R. E., Dobrijevic, M., Fouchet, T., Greathouse, T. K., Grodent, D. C., Hueso, R., Mousis, O., and Nixon, C. A.: The Polar Stratosphere of Jupiter, Space Sci. Rev., 220, 85, https://doi.org/10.1007/s11214-024-01119-5, 2024. a
Hueso, R., Delcroix, M., Sánchez-Lavega, A., Pedranghelu, S., Kernbauer, G., McKeon, J., Fleckstein, A., Wesley, A., Gómez-Forrellad, J. M., Rojas, J. F., and Juaristi, J.: Small impacts on the giant planet Jupiter, Astron. Astrophys., 617, A68, https://doi.org/10.1051/0004-6361/201832689, 2018. a
Hueso, R., Iñurrigarro, P., Sánchez-Lavega, A., Foster, C. R., Rogers, J. H., Orton, G. S., Hansen, C., Eichstädt, G., Ordonez-Etxeberria, I., Rojas, J. F., Brueshaber, S. R., Sanz-Requena, J. F., Pérez-Hoyos, S., Wong, M. H., Momary, T. W., Jónsson, B., Antuñano, A., Baines, K. H., Dahl, E. K., Mizumoto, S., Go, C., and Anguiano-Arteaga, A.: Convective storms in closed cyclones in Jupiter's South Temperate Belt: (I) observations, Icarus, 380, 114994, https://doi.org/10.1016/j.icarus.2022.114994, 2022. a
Hutchins, M. L., Holzworth, R. H., Brundell, J. B., and Rodger, C. J.: Relative detection efficiency of the World Wide Lightning Location Network, Radio Sci., 47, RS6005, https://doi.org/10.1029/2012RS005049, 2012. a
Imai, M., Wong, M. H., Kolmašová, I., Brown, S. T., Santolík, O., Kurth, W. S., Hospodarsky, G. B., Bolton, S. J., and Levin, S. M.: High-Spatiotemporal Resolution Observations of Jupiter Lightning-Induced Radio Pulses Associated With Sferics and Thunderstorms, Geophys. Res. Lett., 47, e88397, https://doi.org/10.1029/2020GL088397, 2020. a
Ingersoll, A. P., Vasavada, A. R., Little, B., Anger, C. D., Bolton, S. J., Alexander, C., Klaasen, K. P., Tobiska, W. K., and Galileo SSI Team: Imaging Jupiter's Aurora at Visible Wavelengths, Icarus, 135, 251–264, https://doi.org/10.1006/icar.1998.5971, 1998. a, b, c
Ingersoll, A. P., Gierasch, P. J., Banfield, D., Vasavada, A. R., and Galileo Imaging Team: Moist convection as an energy source for the large-scale motions in Jupiter's atmosphere, Nature, 403, 630–632, https://doi.org/10.1038/35001021, 2000. a
Jackson, C.: Internal wave detection using the Moderate Resolution Imaging Spectroradiometer (MODIS), J. Geophys. Res.-Oceans, 112, C11012, https://doi.org/10.1029/2007JC004220, 2007. a
Kyba, C. C. M., Mohar, A., and Posch, T.: How bright is moonlight?, Astron. Geophys., 58, 1.31–1.32, https://doi.org/10.1093/astrogeo/atx025, 2017. a
Leinert, C., Bowyer, S., Haikala, L. K., Hanner, M. S., Hauser, M. G., Levasseur-Regourd, A.-C., Mann, I., Mattila, K., Reach, W. T., Schlosser, W., Staude, H. J., Toller, G. N., Weiland, J. L., Weinberg, J. L., and Witt, A. N.: The 1997 reference of diffuse night sky brightness, Astron. Astrophys. Sup., 127, 1–99, https://doi.org/10.1051/aas:1998105, 1998. a
Letros, D., Graham, L., Bourassa, A., Degenstein, D., Loewen, P., Rieger, L., and Lloyd, N.: The Aerosol Limb Imager: multi-spectral polarimetric observations of stratospheric aerosol, Atmos. Meas. Tech., 18, 6185–6210, https://doi.org/10.5194/amt-18-6185-2025, 2025. a
Little, B., Anger, C. D., Ingersoll, A. P., Vasavada, A. R., Senske, D. A., Breneman, H. H., Borucki, W. J., and Galileo SSI Team: Galileo Images of Lightning on Jupiter, Icarus, 142, 306–323, https://doi.org/10.1006/icar.1999.6195, 1999. a, b, c
Lucchetti, A., Massironi, M., Gwinner, K., Kenkmann, T., Penasa, L., Baby, N. R., Rotzoll, L., Karagoz, O., Rizos, J. L., Pajola, M., Tosi, F., Fornasier, S., Tusberti, F., Stephan, K., Pozzobon, R., Suarez-Valencia, J. E., Cagnin, D., Zambon, F., Chiarolanza, G., Coustenis, A., Giacomini, L., Hauber, E., Marchi, S., Matteoni, P., Mitri, G., Rossi, C., Hueso, R., Aboudan, A., Agostini, L., Kersten, E., Matz, K. D., Politi, R., Trauthan, F., Tubiana, C., Aye, M., Zinzi, A., Evill, R., Belgacem, I., Castro-Marin, J. M., Della Corte, V., Hviid, S., Roatsch, T., Schmitz, N., Lara, L. M., Patel, M. R., Portyankina, G., Palumbo, P., and the JANUS team: Morphological and Spectrophotometric exploitation of JANUS LEGA Dataset: Langrenus impact crater characterization and evolution of the highland ”isthmus” between Mare Fecunditatis and Mare Tranquillitatis, EGUsphere [preprint], https://doi.org/10.5194/egusphere-2026-1901, 2026. a
Lynch, D. K.: Optics of sunbeams, J. Opt. Soc. Am. A, 4, 609–611, https://doi.org/10.1364/JOSAA.4.000609, 1987. a
Minnaert, M.: The Nature of Light and Colour in the Open Air, Dover Publications, New York, ISBN 0-486-20196-1, 1954. a
Munari, M., Magrin, D., Greggio, D., Agostini, L., Lucchetti, A., Paolinetti, R., Barilli, M., Turella, A., Dattolo, A., Colosimo, A., Sarti, F., Livi, L., Galeotti, A., Ficai Veltroni, I., and Palumbo, P.: StrayLight analysis update of Janus, the ESA mission JUICE camera, in: Space Telescopes and Instrumentation 2024: Optical, Infrared, and Millimeter Wave, edited by: Coyle, L. E., Matsuura, S., and Perrin, M. D., vol. 13092 of Society of Photo-Optical Instrumentation Engineers (SPIE) Conference Series, 130927I, https://doi.org/10.1117/12.3019738, 2024. a
Murtagh, F. and Heck, A.: Multivariate Data Analysis, vol. 131, Kluwer Academic Publishers Group, https://doi.org/10.1007/978-94-009-3789-5, 1987. a
Narita, T., Wanke, E., Sato, M., Sakanoi, T., Kumada, A., Kamogawa, M., Hirohiko, I., Harada, S., Kameda, T., Tsuchiya, F., and Kaneko, E.: A study of lightning location system (Blitz) based on VLF sferics, in: 2018 34th International Conference on Lightning Protection (ICLP), 1–7, https://doi.org/10.1109/ICLP.2018.8503311, 2018. a
Oliva, F., D'Aversa, E., Migliorini, A., Piccioni, G., Poulet, F., Langevin, Y., Filacchione, G., Ciarniello, M., Rodriguez, S., Seignovert, B., Mura, A., Fletcher, L. N., Guerlet, S., Zinzi, A., Giardino, M., Lopinto, E., Sindoni, G., and Plainaki, C.: JUICE-MAJIS Earth observations during the 2024 gravity assist: first analysis and comparison with PRISMA data, Ann. Geophys., 44, 511–545, https://doi.org/10.5194/angeo-44-511-2026, 2026. a
Ordonez-Etxeberria, I., Hueso, R., Sánchez-Lavega, A., and Pérez-Hoyos, S.: Spatial distribution of jovian clouds, hazes and colors from Cassini ISS multi-spectral images, Icarus, 267, 34–50, https://doi.org/10.1016/j.icarus.2015.12.008, 2016. a
Palumbo, P., Roatsch, T., Lara, L. M., Castro-Marin, J. M., Della Corte, V., Hviid, S., Jaumann, R., Michaelis, H., Patel, M. R., Portyankina, G., Schmitz, N., Amoroso, M., Mugnuolo, R., Aboudan, A., Agostini, L., Althaus, C., Álvarez, F., Bartolomei, M., Behnke, T., Bilotta, T., Colombatti, G., Colosimo, A., Coustenis, A., Cremonese, G., Crews, C., Dattolo, A., Debei, S., Denk, T., Fiethe, B., Herranz, M., Hoffmann, H., Hueso, R., Koncz, A., Jiménez-Ortega, J., Lichopoj, A., Livi, L., Llamas, X., Lopes, R., Lucchetti, A., Martinez-Navajas, I., Mazzotta Epifani, E., Mertens, V., Pajola, M., Sarti, F., Schroedter, R., Stephan, K., Tosi, F., Tubiana, C., Wendler, B., Wendler, D., Williams, D., Wolff, F., Zusi, M., Chiodini, S., Ficai Veltroni, I., Galeotti, A., García-Segura, A., Greggio, D., Holland, A. D., Kenkmann, T., Leese, M. R., Magrin, D., Michalik, H., Munari, M., Noci, G. E., Paolinetti, R., Schipani, P., Soman, M., Stefanov, K. D., Turella, A., Aharonson, O., Bell, J. F., Bertini, I., Coates, A. J., Di Achille, G., Grassi, D., Groussin, O., Gwinner, K., Haruyama, J., Hauber, E., Hiesinger, H., Langevin, Y., Lainey, V., Marchi, S., Marinangeli, L., Marzari, F., Massironi, M., Mitri, G., Mottola, S., Oberst, J., Postberg, F., Poulet, F., Preusker, F., Schmidt, J., Schneider, N. M., Simon, A., Takahashi, Y., Tirsch, D., Vincendon, M., Balme, M. R., Bettanini, C., Borin, P., Capria, M. T., Elgner, S., Esposito, F., Ferranti, L., Ferrari, S., Fornasier, S., Galluzzi, V., Giacomini, L., Guzzetta, L., Jones, G. H., Kersten, E., Ledeit, L., Martellato, E., Matz, K. D., Mennella, V., Murray, C., Otto, K. A., Pelizzo, M. G., Penasa, L., Politi, R., Popa, C., Pozzobon, R., Prieto Ballesteros, O., Re, C., Rotundi, A., Sato, M., Schmedemann, N., Shoji, D., Simioni, E., Sindoni, G., Trauthan, F., and Yair, Y.: The JANUS (Jovis Amorum ac Natorum Undique Scrutator) VIS-NIR Multi-Band Imager for the JUICE Mission, Space Sci. Rev., 221, 32, https://doi.org/10.1007/s11214-025-01158-6, 2025. a, b, c, d
Pasko, V. P., Yair, Y., and Kuo, C.-L.: Lightning Related Transient Luminous Events at High Altitude in the Earth's Atmosphere: Phenomenology, Mechanisms and Effects, Space Sci. Rev., 168, 475–516, https://doi.org/10.1007/s11214-011-9813-9, 2012. a
Patat, F.: UBVRI night sky brightness during sunspot maximum at ESO-Paranal, Astron. Astrophys., 400, 1183–1198, https://doi.org/10.1051/0004-6361:20030030, 2003. a
Peterson, M. and Liu, C.: Characteristics of lightning flashes with exceptional illuminated areas, durations, and optical powers and surrounding storm properties in the tropics and inner subtropics, J. Geophys. Res.-Atmos., 118, 11727–11740, https://doi.org/10.1002/jgrd.50715, 2013. a
Peterson, M., Deierling, W., Liu, C., Mach, D., and Kalb, C.: The properties of optical lightning flashes and the clouds they illuminate, J. Geophys. Res.-Atmos., 122, 423–442, https://doi.org/10.1002/2016JD025312, 2017. a
Poulet, F., Piccioni, G., Langevin, Y., Dumesnil, C., Tommasi, L., Carlier, V., Filacchione, G., Amoroso, M., Arondel, A., D'Aversa, E., Barbis, A., Bini, A., Bolsée, D., Bousquet, P., Caprini, C., Carter, J., Dubois, J.-P., Condamin, M., Couturier, S., Dassas, K., Dexet, M., Fletcher, L., Grassi, D., Guerri, I., Haffoud, P., Larigauderie, C., Le Du, M., Mugnuolo, R., Pilato, G., Rossi, M., Stefani, S., Tosi, F., Vincendon, M., Zambelli, M., Arnold, G., Bibring, J.-P., Biondi, D., Boccaccini, A., Brunetto, R., Carapelle, A., Cisneros González, M., Hannou, C., Karatekin, O., Le Cle'ch, J.-C., Leyrat, C., Migliorini, A., Nathues, A., Rodriguez, S., Saggin, B., Sanchez-Lavega, A., Schmitt, B., Seignovert, B., Sordini, R., Stephan, K., Tobie, G., Zambon, F., Adriani, A., Altieri, F., Bockelée, D., Capaccioni, F., De Angelis, S., De Sanctis, M.-C., Drossart, P., Fouchet, T., Gérard, J.-C., Grodent, D., Ignatiev, N., Irwin, P., Ligier, N., Manaud, N., Mangold, N., Mura, A., Pilorget, C., Quirico, E., Renotte, E., Strazzulla, G., Turrini, D., Vandaele, A.-C., Carli, C., Ciarniello, M., Guerlet, S., Lellouch, E., Mancarella, F., Morbidelli, A., Le Mouélic, S., Raponi, A., Sindoni, G., and Snels, M.: Moons and Jupiter Imaging Spectrometer (MAJIS) on Jupiter Icy Moons Explorer (JUICE), Space Sci. Rev., 220, 27, https://doi.org/10.1007/s11214-024-01057-2, 2024. a
Poulet, F., Piccioni, G., Langevin, Y., Dumesnil, C., Carlier, V., Seignovert, B., Dexet, M., N. Fletcher, L., Leyrat, C., Altieri, F., Carter, J., D’Aversa, E., De Sanctis, M., Grassi, D., Guerlet, S., Le Mouélic, S., Migliorini, A., Oliva, F., Royer, C., Rodriguez, S., Stephan, K., Tosi, F., Zambon, F., Adriani, A., Arnold, G., Bibring, J.-P., Bockelée, D., Brunetto, R., Capaccioni, F., Carli, C., Cavalié, T., Cisneros González, M., Ciarnello, M., De Angelis, S., Drossart, P., Filacchione, G., Fouchet, T., Gérard, J.-C., Grodent, D., Irwin, P., Jacquinod, S., Karatekin, O., Lellouch, E., Ligier, N., Mangold, N., Mebsout, M., Merlin, F., Morbidelli, A., Mura, A., Nathues, A., E. Palumbo, M., Pilorget, C., Poch, O., Quirico, E., Raponi, A., Robert, S., Roussos, E., Sanchez-Lavega, A., Schmitt, B., Sindoni, G., Snels, M., Sordini, R., Stefani, S., Strazzulla, G., Trent, T., Tobie, G., Turrini, D., Vandaele, A.-C., Vincendon, M., Witasse, O., Vallat, C., and Moraino, A.: ESA/JUICE encounters Earth/Moon in 2024: overview of the Moons And Jupiter Imaging Spectrometer (MAJIS) observations, EGUsphere [preprint], https://doi.org/10.5194/egusphere-2025-6191, 2025. a
Quick, M. G. and Krider, E. P.: Optical power and energy radiated by natural lightning, J. Geophys. Res.-Atmos., 118, 1868–1879, https://doi.org/10.1002/jgrd.50182, 2013. a, b
Rages, K., Beebe, R., and Senske, D.: Jovian Stratospheric Hazes: The High Phase Angle View from Galileo, Icarus, 139, 211–226, https://doi.org/10.1006/icar.1999.6103, 1999. a, b
Reuter, D. C., Simon-Miller, A. A., Lunsford, A., Baines, K. H., Cheng, A. F., Jennings, D. E., Olkin, C. B., Spencer, J. R., Stern, S. A., Weaver, H. A., and Young, L. A.: Jupiter Cloud Composition, Stratification, Convection, and Wave Motion: A View from New Horizons, Science, 318, 223, https://doi.org/10.1126/science.1147618, 2007. a
Rodger, C. J., Brundell, J. B., Holzworth, R. H., and Lay, E. H.: Growing Detection Efficiency of the World Wide Lightning Location Network, in: Coupling of Thunderstorms and Lightning Discharges to Near-Earth Space, edited by: Crosby, N. B., Huang, T.-Y., and Rycroft, M. J., vol. 1118 of American Institute of Physics Conference Series, AIP, 15–20, https://doi.org/10.1063/1.3137706, 2009. a
Rouse Jr., J. W., Haas, R. H., Schell, J. A., and Deering, D. W.: Monitoring Vegetation Systems in the Great Plains with Erts, NASA Special Publication, edited by: Freden, S. C., Mercanti, E. P., and Becker, M. A., 351, 309–317, https://ntrs.nasa.gov/citations/19740022614 (last access: 9 July 2026), 1974. a
Sagan, C., Thompson, W. R., Carlson, R., Gurnett, D., and Hord, C.: A search for life on Earth from the Galileo spacecraft, Nature, 365, 715–721, https://doi.org/10.1038/365715a0, 1993. a, b, c
Salyk, C., Ingersoll, A. P., Lorre, J., Vasavada, A., and Del Genio, A. D.: Interaction between eddies and mean flow in Jupiter's atmosphere: Analysis of Cassini imaging data, Icarus, 185, 430–442, https://doi.org/10.1016/j.icarus.2006.08.007, 2006. a
Sánchez-Lavega, A., Orton, G. S., Hueso, R., García-Melendo, E., Pérez-Hoyos, S., Simon-Miller, A., Rojas, J. F., Gómez, J. M., Yanamandra-Fisher, P., Fletcher, L., Joels, J., Kemerer, J., Hora, J., Karkoschka, E., de Pater, I., Wong, M. H., Marcus, P. S., Pinilla-Alonso, N., Carvalho, F., Go, C., Parker, D., Salway, M., Valimberti, M., Wesley, A., and Pujic, Z.: Depth of a strong jovian jet from a planetary-scale disturbance driven by storms, Nature, 451, 437–440, https://doi.org/10.1038/nature06533, 2008. a, b
Saur, J., Duling, S., Roth, L., Jia, X., Strobel, D. F., Feldman, P. D., Christensen, U. R., Retherford, K. D., McGrath, M. A., Musacchio, F., Wennmacher, A., Neubauer, F. M., Simon, S., and Hartkorn, O.: The search for a subsurface ocean in Ganymede with Hubble Space Telescope observations of its auroral ovals, J. Geophys. Res.-Space, 120, 1715–1737, https://doi.org/10.1002/2014JA020778, 2015. a
Sentman, D. D., Wescott, E. M., Osborne, D. L., Hampton, D. L., and Heavner, M. J.: Preliminary results from the Sprites94 Aircraft Campaign: 1. Red sprites, Geophys. Res. Lett., 22, 1205–1208, https://doi.org/10.1029/95GL00583, 1995. a
Siegelman, L., Klein, P., Ingersoll, A. P., Ewald, S. P., Young, W. R., Bracco, A., Mura, A., Adriani, A., Grassi, D., Plainaki, C., and Sindoni, G.: Moist convection drives an upscale energy transfer at Jovian high latitudes, Nat. Phys., 18, 357–361, https://doi.org/10.1038/s41567-021-01458-y, 2022. a
Simon, A. A., Sanchez-Lavega, A., Legarreta, J., Francisco Sanz-Requena, J., Perez-Hoyos, S., Garcia-Melendo, E., and Carlson, R. W.: Spectral comparison and stability of red regions on Jupiter, J. Geophys. Res.-Planet., 120, 483–494, https://doi.org/10.1002/2014JE004688, 2015. a
Simon, A. A., Hueso, R., Iñurrigarro, P., Sánchez-Lavega, A., Morales-Juberías, R., Cosentino, R., Fletcher, L. N., Wong, M. H., Hsu, A. I., de Pater, I., Orton, G. S., Colas, F., Delcroix, M., Peach, D., and Gómez-Forrellad, J.-M.: A New, Long-lived, Jupiter Mesoscale Wave Observed at Visible Wavelengths, Astron. J., 156, 79, https://doi.org/10.3847/1538-3881/aacaf5, 2018. a
Singh, A. and Harrison, A.: Standardized principal components, Int. J. Remote Sens., 6, 883–896, https://doi.org/10.1080/01431168508948511, 1985. a
Sromovsky, L., de Pater, I., Fouchet, T., Fletcher, L., Melin, H., Irwin, P., Fry, P., Hueso, R., Sanchez-Lavega, A., Holler, B., Stansberry, J., Rowe-Gurney, N., and Wong, M.: JWST Near-IR observations of a mysterious “detached haze layer” on Jupiter, in: AAS/Division for Planetary Sciences Meeting Abstracts #54, vol. 54 of AAS/Division for Planetary Sciences Meeting Abstracts, 306.08, https://baas.aas.org/pub/2022n8i306p08/release/1 (last access: 9 July 2026), 2022. a
Storch, T., Honold, H.-P., Chabrillat, S., Habermeyer, M., Tucker, P., Brell, M., Ohndorf, A., Wirth, K., Betz, M., Kuchler, M., Mühle, H., Carmona, E., Baur, S., Mücke, M., Löw, S., Schulze, D., Zimmermann, S., Lenzen, C., Wiesner, S., Aida, S., Kahle, R., Willburger, P., Hartung, S., Dietrich, D., Plesia, N., Tegler, M., Schork, K., Alonso, K., Marshall, D., Gerasch, B., Schwind, P., Pato, M., Schneider, M., de los Reyes, R., Langheinrich, M., Wenzel, J., Bachmann, M., Holzwarth, S., Pinnel, N., Guanter, L., Segl, K., Scheffler, D., Foerster, S., Bohn, N., Bracher, A., Soppa, M. A., Gascon, F., Green, R., Kokaly, R., Moreno, J., Ong, C., Sornig, M., Wernitz, R., Bagschik, K., Reintsema, D., La Porta, L., Schickling, A., and Fischer, S.: The EnMAP imaging spectroscopy mission towards operations, Remote Sens. Environ., 294, 113632, https://doi.org/10.1016/j.rse.2023.113632, 2023. a
Takahashi, Y., Yoshida, A., Sato, M., Adachi, T., Kondo, S., Hsu, R.-R., Su, H.-T., Chen, A. B., Mende, S. B., Frey, H. U., and Lee, L.-C.: Absolute optical energy of sprites and its relationship to charge moment of parent lightning discharge based on measurement by ISUAL/AP, J. Geophys. Res.-Space, 115, https://doi.org/10.1029/2009JA014814, 2010. a
Tubiana, C., Penasa, L., Agostini, L., Aboudan, A., Aye, M., Matz, K.-D., Read, M., Bilotta, T., Hueso, R., Lucchetti, A., Kersten, E., Politi, R., Portyankina, G., Seignovert, B., Trauthan, F., Zinzi, A., Evill, R., Dietz, A., Belgacem, I., Cornet, T., Castro-Marin, J. M., Della Corte, V., Hviid, S., Roatsch, T., Schmitz, N., Patel, M. R., Lara, L. M., and Palumbo, P.: Planning of the JUICE/JANUS camera observations during the first ever Lunar-Earth Gravity Assist, EGUsphere [preprint], https://doi.org/10.5194/egusphere-2026-2008, 2026. a
Van Den Broeke, M. S., Beasley, W. H., and Richman, M. B.: The Role of Atmospheric Conditions in Determining Intensity of Crepuscular and Anticrepuscular Rays, Mon. Weather Rev., 138, 2883–2894, https://doi.org/10.1175/2010MWR3162.1, 2010. a
van Dokkum, P. G.: Cosmic-Ray Rejection by Laplacian Edge Detection, Publications of the Astronomical Society of the Pacific, 113, 1420–1427, https://doi.org/10.1086/323894, 2001. a, b
Vasavada, A. R. and Showman, A. P.: Jovian atmospheric dynamics: an update after Galileo and Cassini, Rep. Prog. Phys., 68, 1935–1996, https://doi.org/10.1088/0034-4885/68/8/R06, 2005. a
Vasavada, A. R., Ingersoll, A. P., Banfield, D., Bell, M., Gierasch, P. J., Belton, M. J. S., Orton, G. S., Klaasen, K. P., DeJong, E., Breneman, H. H., Jones, T. J., Kaufman, J. M., Magee, K. P., and Senske, D. A.: Galileo Imaging of Jupiter's Atmosphere: The Great Red Spot, Equatorial Region, and White Ovals, Icarus, 135, 265–275, https://doi.org/10.1006/icar.1998.5984, 1998. a
Vasavada, A. R., Bouchez, A. H., Ingersoll, A. P., Little, B., Anger, C. D., and Galileo SSI Team: Jupiter's visible aurora and Io footprint, J. Geophys. Res., 104, 27133–27142, https://doi.org/10.1029/1999JE001055, 1999. a
Wahlund, J. E., Bergman, J. E. S., Åhlén, L., and et al.: The Radio & Plasma Wave Investigation (RPWI) for the JUpiter ICy moons Explorer (JUICE), Space Sci. Rev., 221, https://doi.org/10.1007/s11214-024-01110-0, 2025. a
Wescott, E. M., Sentman, D., Osborne, D., Hampton, D., and Heavner, M.: Preliminary results from the Sprites94 Aircraft Campaign: 2. Blue jets, Geophys. Res. Lett., 22, 1209–1212, https://doi.org/10.1029/95GL00582, 1995. a
West, R. A., Strobel, D. F., and Tomasko, M. G.: Clouds, aerosols, and photochemistry in the Jovian atmosphere, Icarus, 65, 161–217, https://doi.org/10.1016/0019-1035(86)90135-1, 1986. a
West, R. A., Baines, K. H., Friedson, A. J., Banfield, D., Ragent, B., and Taylor, F. W.: Jovian clouds and haze, in: Jupiter: The Planet, Satellites and Magnetosphere, edited by: Bagenal, F., Dowling, T. E., and McKinnon, W. B., Cambridge University Press, ISBN 0-521-81808-7, 2004. a
Wong, M. H., Bjoraker, G. L., Goullaud, C., Stephens, A. W., Luszcz-Cook, S. H., Atreya, S. K., de Pater, I. d., and Brown, S. T.: Deep Clouds on Jupiter, Remote Sensing, 15, 702, https://doi.org/10.3390/rs15030702, 2023. a
Yuan, Y., Zheng, Q., Dai, D., Hu, X., Qiao, F., and Meng, J.: Mechanism of internal waves in the Luzon Strait, J. Geophys. Res.-Oceans, 111, C11S17, https://doi.org/10.1029/2005JC003198, 2006. a
Zhu, Y., Stock, M., Lapierre, J., and DiGangi, E.: Upgrades of the Earth Networks Total Lightning Network in 2021, Remote Sensing, 14, 2209, https://doi.org/10.3390/rs14092209, 2022. a
- Abstract
- Introduction
- JANUS instrument and Earth observations
- Nighttime images
- Crepuscular illumination near the terminator
- Daytime observations
- Multi-spectral observations of the Pacific Ocean: comparison with EnMAP and PRISMA
- Earth portrait
- Conclusions
- Appendix A: Summary of JANUS images
- Data availability
- Author contributions
- Competing interests
- Disclaimer
- Special issue statement
- Acknowledgements
- Financial support
- Review statement
- References
- Abstract
- Introduction
- JANUS instrument and Earth observations
- Nighttime images
- Crepuscular illumination near the terminator
- Daytime observations
- Multi-spectral observations of the Pacific Ocean: comparison with EnMAP and PRISMA
- Earth portrait
- Conclusions
- Appendix A: Summary of JANUS images
- Data availability
- Author contributions
- Competing interests
- Disclaimer
- Special issue statement
- Acknowledgements
- Financial support
- Review statement
- References