the Creative Commons Attribution 4.0 License.
the Creative Commons Attribution 4.0 License.
Impact of different solar extreme ultraviolet (EUV) proxies and Ap index on hmF2 trend analysis
Trinidad Duran
Bruno Santiago Zossi
Yamila Daniela Melendi
Blas Federico de Haro Barbas
Fernando Salvador Buezas
Ana Georgina Elias
Long-term trend estimation in the peak height of the F2 layer, hmF2, needs the previous filtering of much stronger natural variations such as those linked to the diurnal, seasonal, and solar activity cycles. If not filtered, they need to be included in the model used to estimate the trend. The same happens with the maximum ionospheric electron density that occurs in this layer, NmF2, which is usually analyzed through the F2 layer critical frequency, foF2. While diurnal and seasonal variations can be easily managed, filtering the effects of solar activity presents more challenges, as does the influence of geomagnetic activity. However, recent decades have shown that geomagnetic activity may not significantly impact trend assessments. On the other hand, the choice of solar activity proxies for filtering has been shown to influence trend values in foF2, potentially altering even the trend's sign. This study examines the impact of different solar activity proxies on hmF2 trend estimations using data updated to 2022, including the ascending phase of solar cycle 25, and explores the effect of including the Ap index as a filtering factor. The results obtained based on two mid-latitude stations are also comparatively analyzed to those obtained for foF2. The main findings indicate that the squared correlation coefficient, r2, between hmF2 and solar proxies, regardless of the model used or the inclusion of the Ap index, is consistently lower than in the corresponding foF2 cases. This lower r2 value in hmF2 suggests a greater amount of unexplained variance, indicating that there is significant room for improvement in these models. However, in terms of trend values, foF2 shows greater variability depending on the proxy used, whereas the inclusion or exclusion of the Ap index does not significantly affect these trends. This suggests that foF2 trends are more sensitive to the choice of solar activity proxy. In contrast, hmF2 trends, while generally negative, exhibit greater stability than foF2 trends.
- Article
(6072 KB) - Full-text XML
- BibTeX
- EndNote
-
Long-term trends in hmF2 change with the solar activity proxy used for filtering but are mostly negative.
-
SN yields the weakest negative hmF2 trends, which are still negative, while foF2 trends are mostly positive.
-
Yearly hmF2 values show a linear relationship with solar proxies but improve with the inclusion of a squared term and the Ap index.
Long-term trends in the Earth's ionosphere expected from the increase in greenhouse gas concentration along the last few decades has been a topic of growing interest since the late 1980s (Roble and Dickinson, 1989; Rishbeth, 1990), with many results already published (Laštovička et al., 2012, 2014; Laštovička, 2017, 2021a). It has mainly been studied through the analyses of the critical frequency of the F2 layer, foF2, that is a measure of the ionospheric peak electron density, NmF2 (= 1.24 × 10¹⁰ foF22, with foF2 in MHz and NmF2 in m−3). Even though the trends in the ionosphere linked to the greenhouse effect are expected to be more clear in the ionospheric peak height, hmF2 (Rishbeth, 1990; Rishbeth and Roble, 1992), publications analyzing foF2 trend detection are by far more numerous. One reason may be that hmF2, unlike foF2, is not directly derived from ionosonde records. It can be estimated using the Shimazaki formula (Shimazaki, 1955) based on the M(3000)F2 propagation factor, which is calculated by taking the ratio of the maximum usable frequency at 3000 km (MUF(3000)) to foF2 and which dates back to the same years as foF2. However, especially during daytime hours, there are systematic differences between hmF2 derived from M(3000)F2 and the true height value. A good option is systematic hmF2 deduced by real-height analysis of automatically scaled vertical-incidence digisonde ionograms, but these time series are available for only a few past decades.
Regarding the selection of a best solar extreme ultraviolet (EUV) proxy to estimate trends in the F2 region, it is a problem which dates back almost to the very beginning, when long-term trends in the upper atmosphere became a topical issue, but has regained critical importance during the last few years. We could speak of two epochs discussing this issue, which are before and after the occurrence of the 2008 solar minimum. Papers analyzing trends based on time series not reaching this period basically deal with the selection between two proxies: F10.7 and SN. After the 2008 minimum epoch, studies that analyzed time series that included cycle 23 with its minimum in ∼ 2008, detected that not only SN, but also F10.7 was not efficient enough for filtering solar activity. As a result, indices more directly related to UV and EUV radiation came into play, such as the core-to-wing ratio of the Mg II line and the solar Lyman-α irradiance (at 121.567 nm). It can be also said that 2021, with the works by Laštovička (2021b, c), is the year when a variety of solar EUV proxies are formally introduced as options to filter ionospheric parameters as a previous step in trend estimations.
Most papers used foF2 in order to determine the effect of the different proxies over the trend values and also to decide which of them was a best EUV indicator (de Haro Barbas et al., 2021; Zossi et al., 2023; Danilov and Konstantinova, 2023; Laštovička and Burešová, 2023; Laštovička, 2024). Laštovička (2021b) incorporated foE and Laštovička (2021c) global total electron content (TEC) as well.
Jarvis et al. (1998) were among the first to do a solar proxy selection for estimating hmF2 trends. They specifically compared F10.7 and SN, choosing F10.7 due to its slightly smaller variance in trend estimates during solar cycles 23 and 24, which marked a period of significant discrepancy compared to earlier cycles, ending in 1995. Jarvis et al. (2002), added E10.7 to the solar proxies' options for hmF2 trend estimations, but its performance was almost identical to F10.7.
Laštovička et al. (2006), to conduct foF2 trend analysis, compared SN to F10.7 and E10.7. They distinguished between adjusted and observed in the case of the last two proxies, with the observed F10.7 and E10.7 appearing to be the best correcting factors for filtering or modeling solar activity effects prior to trend estimation. Observed F10.7 also performed the best in the study of Ulich et al. (2007), analyzing foF2 trends as well, which is reasonable since the solar radiative energy reaching Earth is modulated by the variation in the Earth–Sun distance.
The idea was to provide a comprehensive overview of the evolution in the effort to select the best solar proxy for detecting long-term trends in ionospheric parameters, but the task turned out to be much larger than anticipated. This is not only due to the many years that have passed since the proxy selection issue was first identified as a conflict in the field of long-term trends, but also because the problem has become increasingly complex. On the one hand, there are numerous proxies, and on the other hand, two variations in solar activity have become more apparent over the years that were not as evident with shorter data series. One is the prominence of the Gleissberg cycle in the maximum solar activity, which became clear with six complete cycles of data showing a long-term periodic modulation (∼ 80–90 years, corresponding to the Gleissberg periodicity) and the decline in the last two minima (∼ 2008 and ∼ 2019) compared to previous minima. These two “trends” in solar activity are not identical in every proxy. Therefore, we will end with the review of this major issue in trend estimation here, suggesting it as a future task to be carefully revisited, and proceed directly to our analysis of this conflict with hmF2 data updated to the year 2022. The issue of including Ap or not seemed to have a weaker effect than the solar proxy selection but was also mostly analyzed in foF2 trend studies. So, we will focus in the two problems: the solar activity proxy selection and whether accounting for geomagnetic activity makes a difference or not in trend values, making a comparison with the foF2 case.
The next three sections outline the datasets used and the methodology. The results are provided in Sect. 5, which is followed by the discussion and concluding remarks in Sect. 6.
2.1 Ionospheric data
Hourly monthly medians of the ionospheric propagating factor at 3000 km of the F2 layer, identified as M(3000)F2, and foF2 from two mid-latitude ionospheric stations were analyzed for the period 1960–2022: Rome (41.5° N, 12.3° E) and Juliusruh (54.6° N, 13.4° E). Data bases were obtained from the World Data Centre (WDC) for Space Weather, Australia, accessible at https://downloads.sws.bom.gov.au/wdc/iondata/au/ (last access: 25 November 2024) and from the Damboldt and Suessmann data base (Damboldt and Suessmann, 2012), available from the same WDC (https://downloads.sws.bom.gov.au/wdc/iondata/medians/, last access: 25 November 2024). In the case of Rome, to extend the dataset until 2022, additional data were incorporated from the Digital Ionogram Data Base (DIDBase) at the Lowell Global Ionospheric Radio Observatory (GIRO)Data Center (LGDC), (Reinisch and Galkin, 2011). A 7-year overlap (2001–2007) between the two datasets was examined to confirm series homogeneity, resulting in a reasonable agreement of over 95 % between the series.
Autoscaled hmF2, together with M(3000)F2, for the period 2001–2022 from the LGDC were also used for Rome and Juliusruh to test the height formula chosen in this study. Data from the DIDBase at the LGDC have a frequency of 5 to 30 min. In order to obtain the monthly medians, we first selected data with an autoscaling confidence score (CS) greater than 70 % and then estimated the hourly medians for each month.
To calculate hmF2 from M(3000)F2, the Shimazaki formula was used (Shimazaki, 1955):
Annual mean foF2 and hmF2 values were assessed for 00:00 and 12:00 LT.
While the value of hmF2 depends on the formula used, and it is closer to the “real” value for those more precise than Eq. (1), such as those given by Bradley and Dudeney (1973), Dudeney (1974), and Bilitza et al. (1979), the trend values may not differ much. In this regard, some studies suggest this is the case (Bremer, 1998), while others indicate that trend values and even the sign may change depending on the formula used (Ulich, 2000; Jarvis et al., 2002). We conducted a test for the two stations here, analyzed as described in Sect. 3, leading us to conclude that the Shimazaki formula is reasonable and reliable for the analysis outlined in this research.
In the case of M(3000)F2 monthly median data for Rome, from January 1960 to December 2022, there are no missing values for the selected local times. For Juliusruh, there are a total of eight missing values that correspond to the monthly medians of May 1977, September–October–November 1978, October 1983, August 2009, July 2020, and January 2022 for both local times. We considered that the mean annual values are all representative, considering that the worst case is 1978, with only three months missing. In the case of foF2 for both stations, at 00:00 and 12:00 LT, there are no missing data in the monthly median records.
2.2 Solar EUV proxies and geomagnetic activity data
The five most commonly used solar EUV radiation proxies were employed together with the geomagnetic activity Ap index. The five selected proxies are
-
Magnesium II (Mg II) core-to-wing ratio (Snow et al., 2014) represents the ratio of the h and k lines of the solar Mg II emission at 280 nm to the background solar continuum near 280 nm. The annual mean time series was calculated as the average of daily values from the composite extended Mg II series obtained from the University of Bremen at https://www.iup.uni-bremen.de/UVSAT/data/ (last access: 25 November 2024).
-
Hydrogen Lyman-α flux (Fα) (Machol et al., 2019) in W m−2 units is the full-disk integrated solar irradiance over 121–122 nm dominated by the solar HI 121.6 nm emission, where HI refers to neutral hydrogen in its ground state. The annual mean time series was estimated as the average of daily values of the composite series sourced from the Laboratory for Atmospheric and Space Physics (LASP) Interactive Solar Irradiance Data Center, University of Colorado, at https://lasp.colorado.edu/data/timed_see/composite_lya/lyman_alpha_composite.nc (last access: 25 November 2024).
-
The annual mean values of the revised sunspot number (SN) were directly obtained from SILSO (Sunspot Index and Long-term Solar Observations of the Royal Observatory of Belgium, Brussels), which is accessible at http://www.sidc.be/silso/datafiles (last access: 25 November 2024).
-
F10.7 is the flux density of radio emissions from the Sun at 10.7 cm wavelength (2800 MHz) in sfu = 10−22 Ws m−2 (where sfu stands for solar flux units) measured at the Earth's surface. The annual time series was estimated as the average of the monthly mean series available from Space Weather Canada at https://spaceweather.gc.ca/forecast-prevision/solar-solaire/solarflux/sx-en.php (last access: 25 November 2024).
-
F30 is the flux density of radio emissions from the Sun at 30 cm wavelength (1000 MHz) in sfu = 10−22 Ws m−2, measured at the Earth's surface. The annual mean time series was estimated as the average of daily values provided by Nobeyama Radio Polarimeters (NoRP) at https://solar.nro.nao.ac.jp/norp/index.html (last access: 25 November 2024).
The geomagnetic activity index Ap annual mean series was estimated as the average of daily values supplied by the Kyoto World Data Center for Geomagnetism at https://wdc.kugi.kyoto-u.ac.jp/index.html (last access: 25 November 2024).
The Shimazaki formula to obtain hmF2 based only on M(3000)F2 is adequate at nighttime hours, when the ionization below the F2 region is weak. As this ionization begins to increase, this formula systematically overestimates hmF2. This can be seen in Fig. 1, where the average of the monthly median hmF2 values along 2001–2022 is plotted in terms of month. At 00:00 LT, a good agreement is noticed between the autoscaled and the Shimazaki heights, which declines in the case of 12:00 LT.
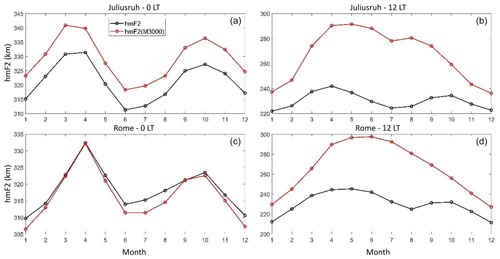
Figure 1hmF2 monthly median average along the period 2001–2022 in terms of month at Juliusruh (a, b) and Rome (c, d) at 00:00 LT (a, c) and 12:00 LT (b, d), considering autoscaled heights (black) and the values obtained using the Shimazaki formula (red).
However, the trend of the residuals, considering annual means, for example, after filtering the solar activity effect is in good agreement for night- and daytime as can be noticed from Fig. 2.
For this purpose, the simplest filtering was applied, that is, considering the residuals of hmF2 from a linear regression with Mg II as the EUV solar proxy. There is a general good agreement in trend values, except in the case of Rome at noon, when different signs are obtained between the autoscaled and Shimazaki hmF2 values. Despite this, we chose to carry out this study with the Shimazaki formula, given by Eq. (1), considering that the errors are systematic and will not impact the results of the comparative analysis we aim to present. We further reference the findings of Scotto (2013) to support the use of the formula for trend analysis. Their results were obtained for a simulation of nighttime hours with a superimposed trend of −14 km per century on the hmF2 parameter and indicate that regardless of the empirical formula used, the accuracy of hmF2 from ionosonde measurements would be adequate to detect this trend.
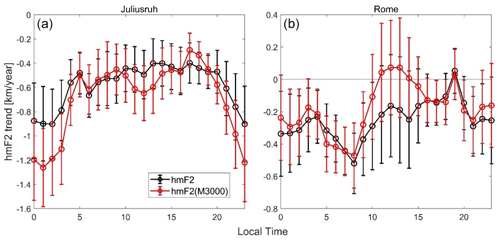
Figure 2hmF2 trends (km yr−1) in terms of local time considering annual means of monthly median autoscaled heights (black) and the values obtained using the Shimazaki formula (red) for Juliusruh (a) and Rome (b) after filtering solar activity using linear regression on Mg II. The error bars correspond to 1 standard deviation.
In order to compare the different solar EUV proxies' effects on the trend estimation process, we repeat the filtering and trend calculations using each of the five proxies (Mg II, Fα, F10.7, SN, and F30), which is generically called X here. The filtering, in turn, was performed considering four models in order to analyze the effect of Ap, which are
-
linear regression on X,
-
second-degree polynomial regression on X,
-
linear regression on X and Ap,
-
second-degree polynomial regression on X and linear on Ap,
Thus, the regression variables in each model are X for 1; X and X2 for 2; X and Ap for 3; and X, X2, and Ap for 4.
The trend is estimated considering a linear regression of the residuals from these models, ΔhmF2, and time:
In order to determine each solar proxy and Ap suitability for the filtering process and its effect on trend values, we considered the squared correlation coefficient, r2, of each of the four models for each of the five solar proxies together with the values of the linear trend obtained in each case. A visual comparative analysis is first made by plotting the results obtained for each variable (r2 and trend values). This is followed by a quantitative comparison through the estimation of percentage differences while considering F30 as the reference EUV solar proxy and model 1 as the reference model.
The adjusted r2 value was considered because, in multiple regression, the r2 value increases as more predictors are added due to the way it is calculated. In contrast, the adjusted r2 value will decrease if the additional variables do not significantly improve the explanation of the dependent variables (foF2 and hmF2 in this case).
Concerning r2, the percentage difference to compare the different solar proxies is estimated as
where Xi= Mg II, Fα, SN, or F10.7, using only model 1, while the percentage difference to compare the different models is estimated as
for model i from model 2 to model 4 using only F30 as the solar proxy.
The same applies to trend values, but relative percentage differences were assessed in this case, estimated as
and
This analysis is repeated for foF2 to compare the effects of solar proxies and the inclusion of Ap. Since the study is based on a similar analysis made by Laštovička (2021b, c), who considered the period 1976–2014, each calculation was also made for this period and for 1976–2022 that is Laštovička's period updated to 2022.
Figures 3 and 4 present r2 for each model at 00:00 and 12:00 LT, respectively, in terms of each solar proxy, considering hmF2 and foF2 measured at Juliusruh. Figures 5 and 6 show the equivalent results for hmF2 and foF2 measured at Rome. It is easily noticed that the longest period analyzed, 1960–2022, shows the greatest variations in r2 between each solar proxy, with an improved correlation in the case of SN followed by F10.7 for all the models at midnight and noon, which nevertheless does not mean that they should be considered the best proxies (Laštovička, 2024; Zossi et al., 2024). For the shorter periods, particularly excluding solar cycles 20 and 21, the difference in r2 values is smoothed, and Mg II emerges as the proxy with the highest correlation for most of the cases.
Looking at the same figures, when comparing the different models in the hmF2 case, the addition of variables to model 1 improves the correlation, in particular when Ap is added, which is something that in the foF2 case is almost not noticed. We can argue that this is because there is more potential for improvement in hmF2 compared to foF2 as the r2 value is, on average, lower for hmF2.
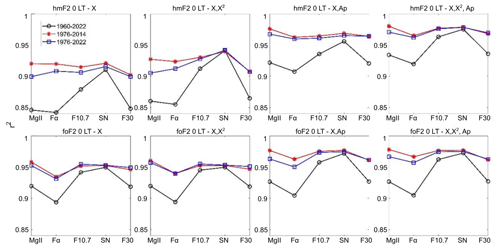
Figure 3Squared correlation coefficient, r2, of hmF2 (upper panels) and foF2 (lower panels) at 00:00 LT measured at Juliusruh within each model (indicated at the top of each panel) in terms of each solar proxy (Mg II, Fα, F10.7, SN, and F30). Time series periods are 1960–2022 (black), 1976–2014 (red), and 1976–2022 (blue).
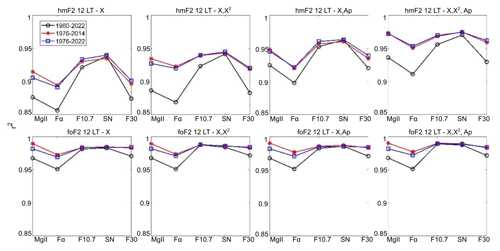
Figure 4Squared correlation coefficient, r2, of hmF2 (upper panels) and foF2 (lower panels) at 12:00 LT measured at Juliusruh within each model (indicated at the top of each panel) in terms of each solar proxy (Mg II, Fα, F10.7, SN, and F30). Time series periods are 1960–2022 (black), 1976–2014 (red), and 1976–2022 (blue).
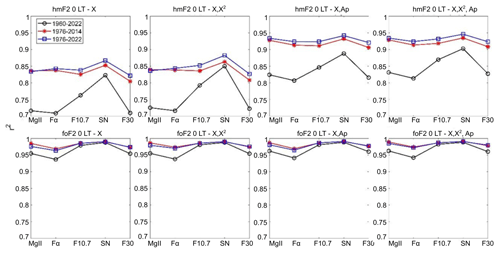
Figure 5Squared correlation coefficient, r2, of hmF2 (upper panels) and foF2 (lower panels) at 00:00 LT measured at Rome within each model (indicated at the top of each panel) in terms of each solar proxy (Mg II, Fα, F10.7, SN, and F30). Time series periods are 1960–2022 (black), 1976–2014 (red), and 1976–2022 (blue).
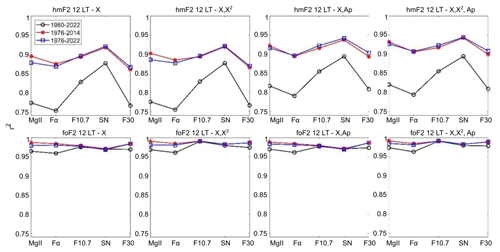
Figure 6Squared correlation coefficient, r2, of hmF2 (upper panels) and foF2 (lower panels) at 12:00 LT measured at Rome within each model (indicated at the top of each panel) in terms of each solar proxy (Mg II, Fα, F10.7, SN, and F30). Time series periods are 1960–2022 (black), 1976–2014 (red), and 1976–2022 (blue).
Figures 7 and 8 present trend values obtained after filtering through each of the four models at 00:00 and 12:00 LT, respectively, in terms of each solar proxy of hmF2 and foF2 measured at Juliusruh. Figures 9 and 10 show the equivalent results for hmF2 and foF2 measured at Rome. Similarly to the foF2 case, hmF2 trends are less negative when the solar proxy used is SN followed by F10.7. They are more negative when F30, Mg II, and Fα are used instead. In the hmF2 case also, the trends get less negative and closer to zero when Ap is included in the model, which is expected due to the increase obtained in r2. foF2 trends are almost identical with or without Ap included, which is in agreement with the results of other authors showing that Ap do not make a significant difference if included in the filtering process (Laštovička, 2021a). It is worth noting that in the hmF2 case, there are almost no positive trends except two exceptions: Juliusruh at 00:00 LT using SN as a proxy in model 3 for periods 1976–2014 and 1976–2022. However, in the foF2 case, positive trends are obtained for several cases, all of which use SN or F10.7 as the solar proxy.
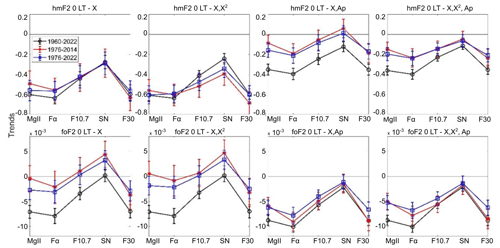
Figure 7Linear trend of hmF2 (upper panels; in km yr−1) and foF2 (lower panels; in MHz yr−1) at 00:00 LT measured at Juliusruh, considering residuals filtered with each model (indicated at the top of each panel) in terms of each solar proxy (Mg II, Fα, F10.7, SN, and F30). Time series periods are 1960–2022 (black), 1976–2014 (red), and 1976–2022 (blue).
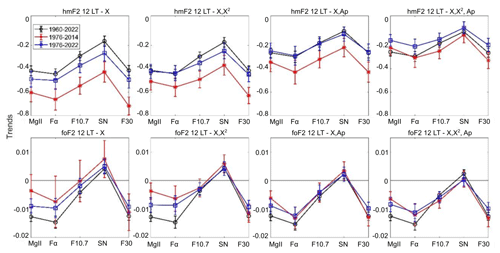
Figure 8Linear trend of hmF2 (upper panels; in km yr−1) and foF2 (lower panels; in MHz yr−1) at 12:00 LT measured at Juliusruh, considering residuals filtered with each model (indicated at the top of each panel) in terms of each solar proxy (Mg II, Fα, F10.7, SN, and F30). Time series periods are 1960–2022 (black), 1976–2014 (red), and 1976–2022 (blue).
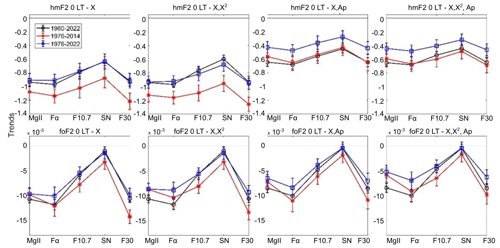
Figure 9Linear trend of hmF2 (upper panels; in km yr−1) and foF2 (lower panels; in MHz yr−1) at 00:00 LT measured at Rome, considering residuals filtered with each model (indicated at the top of each panel) in terms of each solar proxy (Mg II, Fα, F10.7, SN, and F30). Time series periods are 1960–2022 (black), 1976–2014 (red), and 1976–2022 (blue).
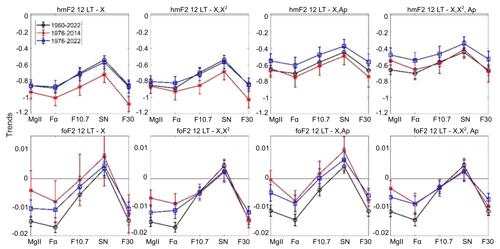
Figure 10Linear trend of hmF2 (upper panels; in km yr−1) and foF2 (lower panels; in MHz yr−1) at 12:00 LT measured at Rome, considering residuals filtered with each model (indicated at the top of each panel) in terms of each solar proxy (Mg II, Fα, F10.7, SN, and F30). Time series periods are 1960–2022 (black), 1976–2014 (red), and 1976–2022 (blue).
In order to have a more quantitative analysis of the differences in each solar proxy and of the Ap role in filtering, we estimated r2 and trend differences with respect to proxies and also to models as explained in Sect. 4. We do not show the case of SN in order to simplify the figures since the difference is highly notable and easily observed in Figs. 3 to 10.
Figures 11 to 14 show the percentage difference in r2 together with the relative percentage difference in trends when comparing F30 with each of the other proxies – Mg II, Fα, and F10.7 – for both hmF2 and foF2, for each station, and in local time.
In the case of the r2 percentage difference, a positive value means a higher correlation, while a negative value represents a lower one. In general, and leaving SN out of the discussion on this point, F10.7 is the proxy that mostly improves r2 considering the two stations, both local times, and three periods. There are also cases of improvement when considering Mg II. Again, we highlight that this result does not imply a better performance of F10.7 and/or Mg II (Laštovička, 2024; Zossi et al., 2024).
In the case of the trend relative percentage differences, considering that the reference trend is always negative, a positive value implies a less negative trend or even a positive one, while a negative value indicates a more negative one. For the period 1960–2022, trend values are similar using either F30 or Mg II in hmF2 and foF2 cases, while in the shortest period 1976–2014, F30 clearly gives the most negative trends in all the cases, with the strongest effect in foF2.
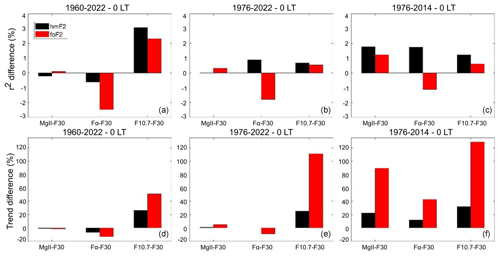
Figure 11r2 percentage difference (a, b, c) and trend relative percentage difference (d, e, f) using model 1 between Mg II, Fα, or F10.7 and F30 for hmF2 (black bars) and foF2 (red bars) measured at Juliusruh at 00:00 LT, considering the periods 1960–2022, 1976–2022, and 1976–2014, indicated at the top of each panel.
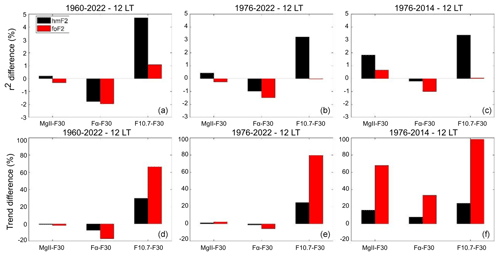
Figure 12r2 percentage difference (a, b, c) and trend relative percentage difference (d, e, f) using model 1 between Mg II, Fα, or F10.7 and F30 for hmF2 (black bars) and foF2 (red bars) measured at Juliusruh at 12:00 LT, considering the periods 1960–2022, 1976–2022, and 1976–2014, indicated at the top of each panel.
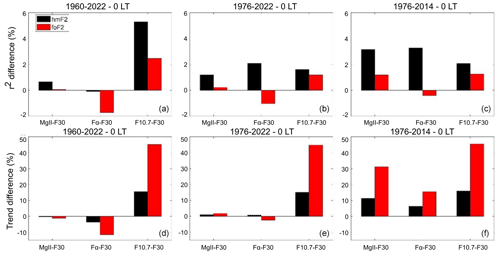
Figure 13r2 percentage difference (a, b, c) and trend relative percentage difference (d, e, f) using model 1 between Mg II, Fα, or F10.7 and F30 for hmF2 (black bars) and foF2 (red bars) measured at Rome at 00:00 LT, considering the periods 1960–2022, 1976–2022, and 1976–2014, indicated at the top of each panel.
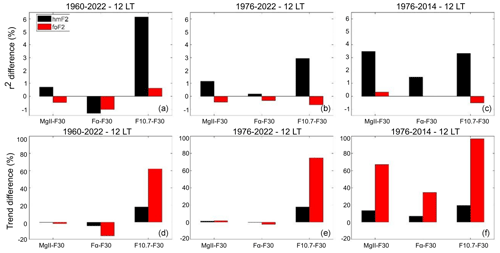
Figure 14r2 percentage difference (a, b, c) and trends relative percentage difference (d, e, f) using model 1 between Mg II, Fα, or F10.7 and F30 for hmF2 (black bars) and foF2 (red bars) measured at Rome at 12:00 LT, considering the periods 1960–2022, 1976–2022, and 1976–2014, indicated at the top of each panel.
Figures 15 to 18 show the percentage difference in r2 together with the relative percentage difference in trends when comparing model 1 with each of the other models, for both hmF2 and foF2 at each station and local time. r2 differences are consistently greater for hmF2 compared to foF2 in all cases, meaning that adding the squared solar proxy term and/or the Ap index always improves the model. Once more, this is statistically reasonable since hmF2 has a larger margin for improvement. When a model, such as that for foF2, already exhibits a high degree of correlation, incorporating additional variables is less likely to result in significant improvements. For example, at Juliusruh at 12:00 LT, neither the Ap index nor the squared proxy term significantly enhances the foF2 model. This outcome is expected because maximum solar activity levels typically do not surpass the saturation level, limiting improvements in correlation for both ionospheric parameters.
In the case of the trend values, again, the square term alone does not produce big differences, while the Ap weakens in the negative trends in all the cases except for one: foF2 at Juliusruh at 00:00 LT.
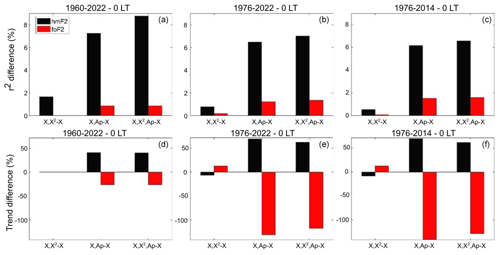
Figure 15r2 percentage difference (a, b, c) and trend relative percentage difference (d, e, f) using F30 as a solar proxy between models 2, 3, or 4 and model 1 for hmF2 (black bars) and foF2 (red bars) measured at Juliusruh at 00:00 LT, considering the periods 1960–2022, 1976–2022, and 1976–2014, indicated at the top of each panel.
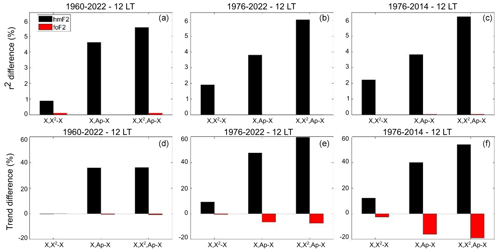
Figure 16r2 percentage difference (a, b, c) and trend relative percentage difference (d, e, f) using F30 as a solar proxy between models 2, 3, or 4 and model 1 for hmF2 (black bars) and foF2 (red bars) measured at Juliusruh at 12:00 LT, considering the periods 1960–2022, 1976–2022, and 1976–2014, indicated at the top of each panel.
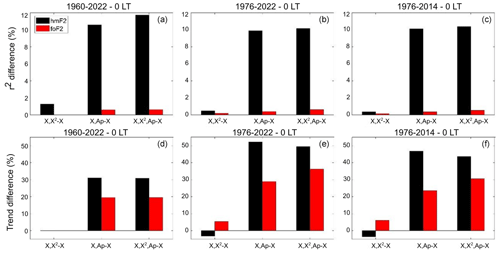
Figure 17r2 percentage difference (a, b, c) and trend relative percentage difference (d, e, f) using F30 as a solar proxy between models 2, 3, or 4 and model 1 for hmF2 (black bars) and foF2 (red bars) measured at Rome at 00:00 LT, considering the periods 1960–2022, 1976–2022, and 1976–2014, indicated at the top of each panel.
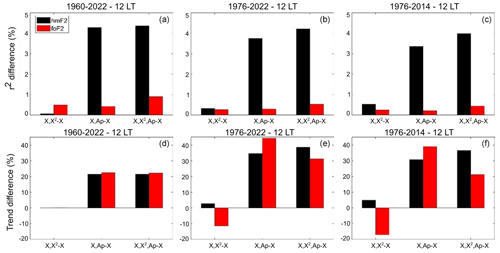
Figure 18r2 percentage difference (a, b, c) and trend relative percentage difference (d, e, f) using F30 as a solar proxy between models 2, 3, or 4 and model 1 for hmF2 (black bars) and foF2 (red bars) measured at Rome at 12:00 LT, considering the periods 1960–2022, 1976–2022, and 1976–2014, indicated at the top of each panel.
In order to analyze the effect of different solar EUV proxies on hmF2 trend estimation, following the works by Laštovička (2021b, c), we implemented a similar analysis with some additions to noon and midnight values. Noting that the correlation between hmF2 and solar EUV proxies was systematically lower than in foF2, the inclusion of Ap in the filtering process was incorporated to the analyses.
For both stations, both local times, and three periods analyzed, r2 values between hmF2 and the solar proxies considering different models which include or not Ap are consistently lower compared to the corresponding foF2 cases. Thus, the variation in r2 values between different proxies and between different models is stronger for hmF2 since there is more variance left out to be improved. In contrast, for foF2, the solar proxy linear term typically accounts for almost all the variation, leaving less than 5 % of the variance unexplained.
However, with respect to trend values, the difference is more noticeable in the foF2 case when comparing different proxies but not when evaluating the addition or non-addition of Ap. This suggests that foF2 trends seem more sensitive to the proxy used to filter solar activity effect. hmF2 trends are also in general all negative and seem more stable than in the foF2 case, probably related to the fact that the greenhouse effect is expected to be more clear in hmF2 than in foF2 (Rishbeth, 1990; Rishbeth and Roble, 1992).
An aspect which deserves further discussion is the comparison of our results between the three periods considered. Differences in r2 and in trends are more noticeable during the longest period, 1960–2022. This can be explained by looking at the long-term variation in each solar proxy that is linked to the Gleissberg cycle of ∼ 80–100-year quasi-periodicity. Figure 19 highlights this more clearly by displaying the normalized annual mean values of the five proxies here considered together with the envelope that joins the maximum and minimum values of each solar cycle in the period 1960–2022. The Gleissberg cycle is shown by the maximum values, having the most recent peak in cycle 22 (∼ 1990). The increasing phase of this long-term cycle is clearly observed before cycle 22 followed by the beginning of the decreasing phase. While the well-known ∼ 11-year cycle is quite similar for all solar proxies, the Gleissberg cycle is not, with SN being the index with the greatest differences. It is also clear from this figure that, while the period within the 1960–2022 interval is longer, more differences are included since more maximum periods enter into the analyzed time series, and that could explain the stronger differences we found for the period 1960–2022 in comparison to the shorter ones in most of the cases.
A similar effect is produced by differences in the minimum epochs but in the opposite sense. This is supposedly not part of the Gleissberg cycle, but it is clear that since the 1996 minimum epoch, the following minima present weaker indices' values in all the cases but with different decreasing levels. Therefore, if the series starts closer to 1996, the trend will be more pronounced than if the time series begins earlier. Consequently, more significant differences should be observed in shorter periods, especially if they include one or both of the recent minima around ∼ 2008 and ∼ 2019.
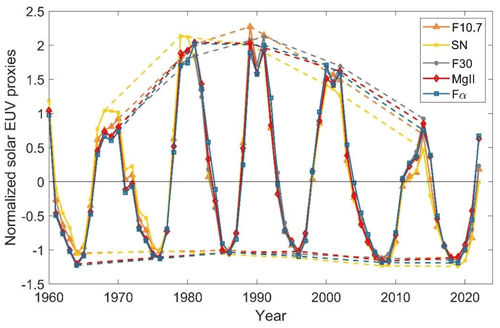
Figure 19Mg II (red diamond), Fα (blue square), F10.7 (orange triangle), SN (yellow cross), and F30 (gray dot) normalized annual means (during 1960–2022). Dashed lines join the maximum and minimum values of each solar cycle.
The trends observed over the longest period (1960–2022) show the smallest magnitudes. Notably, 1980 coincides with the peak of solar cycle 21. Using the Rz proxy, we observe that solar activity levels began declining after 1979–1980, which corresponds to the Gleissberg cycle. However, for proxies like F30 and F10.7, this decline in solar maxima became evident only after solar cycle 22, around 1990. This pattern supports the hypothesis that anthropogenic effects, such as increased greenhouse gases, may have become more prominent after 1980, coinciding with the reduction in solar maximum levels. Therefore, the observed trends likely result from a combination of both the rising anthropogenic influence and the decreasing solar activity, with varying impacts depending on the solar proxy considered.
Here, we bring back the conclusion from Bremer (1992), where they mention that an important demand is the correct filtering of the solar and geomagnetic influence on the data because it causes variations that are much larger than the trends of interest. We here emphasize this aspect of trend assessments, showing once again that the problem is not yet fully resolved and deserves to be further and more deeply investigated and expanded.
Ionospheric M(3000)F2 and foF2 data for Rome and Juliusruh were obtained from the World Data Centre (WDC) for Space Weather, Australia, accessible at https://downloads.sws.bom.gov.au/wdc/iondata/au/ (Australian Space Weather Forecasting Centre, 2024a) and from the Damboldt and Suessmann data base available from the same WDC (https://downloads.sws.bom.gov.au/wdc/iondata/medians/, Australian Space Weather Forecasting Centre, 2024b). In the case of Rome, to extend the dataset until 2022, additional data were incorporated from the Digital Ionogram Data Base (DIDBase) at Lowell GIRO Data Center (LGDC). Juliusruh data are also available from the Leibniz Institute of Atmospheric Physics at https://www.ionosonde.iap-kborn.de/mon_fof2.htm (IAP, 2024). hmF2 autoscaled values for both stations were obtained from LGDC. Mg II data are obtained from the University of Bremen at https://www.iup.uni-bremen.de/UVSAT/data/ (Viereck et al., 2004). Hydrogen Lyman-α flux is accessible from the LASP Interactive Solar Irradiance Data Center, University of Colorado, at https://lasp.colorado.edu/data/timed_see/composite_lya/lyman_alpha_composite.nc (Machol et al., 2019). SN annual mean values were directly obtained from SILSO (Sunspot Index and Long-term Solar Observations of the Royal Observatory of Belgium, Brussels) via http://www.sidc.be/silso/datafiles (WDC-SILSO, Royal Observatory of Belgium, 2024). F10.7 series are provided by Space Weather Canada at https://spaceweather.gc.ca/forecast-prevision/solar-solaire/solarflux/sx-en.php (Space Weather Canada, 2024). F30 is available from Nobeyama Radio Polarimeters (NoRP) at https://solar.nro.nao.ac.jp/norp/index.html (Nobeyama Radio Polarimeters, 2024). The Ap index was obtained from the Kyoto World Data Center for Geomagnetism at https://wdc.kugi.kyoto-u.ac.jp/index.html (Kyoto World Data Center for Geomagnetism, 2024).
TD: conceptualization, supervision, investigation, formal analysis, methodology, and writing; BSZ: investigation, methodology, validation, and review and editing; YM, BFdHB, and FSB: investigation, validation, and review and editing; AGE: original draft preparation, investigation, formal analysis, and review and editing.
At least one of the (co-)authors is a member of the editorial board of Annales Geophysicae. The peer-review process was guided by an independent editor, and the authors also have no other competing interests to declare.
Publisher’s note: Copernicus Publications remains neutral with regard to jurisdictional claims made in the text, published maps, institutional affiliations, or any other geographical representation in this paper. While Copernicus Publications makes every effort to include appropriate place names, the final responsibility lies with the authors.
This article is part of the special issue “Long-term trends in the stratosphere–mesosphere–thermosphere–ionosphere system”. It is a result of the 12th International Workshop on Long-Term Changes and Trends in the Atmosphere (TRENDS 2024), Ourense, Spain, 6–10 May 2024.
We acknowledge the GIRO data resources (http://spase.info/SMWG/Observatory/GIRO, last access: 25 November 2024); the World Data Centre (WDC) for Space Weather, Australia, accessible at https://downloads.sws.bom.gov.au/wdc/iondata/au (last access: 25 November 2024); and the Damboldt and Suessmann database, which is also available through the WDC. Additionally, we recognize the data provided by the Leibniz Institute of Atmospheric Physics, accessible at https://www.ionosonde.iap-kborn.de/mon_fof2.htm (last access: 25 November 2024).
This paper was edited by Jan Laštovička and reviewed by two anonymous referees.
Australian Space Weather Forecasting Centre: https://downloads.sws.bom.gov.au/wdc/iondata/au/ (last access: 25 November 2024), 2024a.
Australian Space Weather Forecasting Centre: https://downloads.sws.bom.gov.au/wdc/iondata/medians/ (last access: 25 November 2024), 2024b.
Bilitza, D., Sheikh, N. M., and Eyfrig, R.: A global model for the height of the F2-peak using M3000 values from CCIR, Telecommun. J., 46, 549–553, 1979.
Bradley, P. A. and J. R. Dudeney: A simple model of the vertical distribution of electron concentration in the ionosphere, J. Atmos. Terr. Phys., 35, 2131–2146, https://doi.org/10.1016/0021-9169(73)90132-3, 1973.
Bremer, J.: Ionospheric trends in mid-latitudes as a possible indicator of the atmospheric greenhouse effect, J. Atmos. Terr. Phys., 54, 1505–1511, https://doi.org/10.1016/0021-9169(92)90157-G, 1992.
Bremer, J.: Trends in the ionospheric E and F regions over Europe, Ann. Geophys., 16, 986–996, https://doi.org/10.1007/s00585-998-0986-9, 1998.
Damboldt, T. and Suessmann, P.: Consolidated Database of Worldwide Measured Monthly Medians of Ionospheric Characteristics foF2 and M(3000)F2, INAG Bulletin 73, https://www.ursi.org/files/CommissionWebsites/INAG/web-73/2012/damboldt_consolidated_database.pdf (last access: 25 November 2024), 2012.
Danilov, A. and Konstantinova, A.: Trends in foF2 to 2022 and various solar activity indices, Adv. Space Res., 71, 4594–4603, https://doi.org/10.1016/j.asr.2023.01.028, 2023.
de Haro Barbas, B. F., Elias, A. G., Venchiarutti, J. V., Fagre, M., Zossi, B. S., Tan Jun, G., and Medina, F. D.: MgII as a Solar Proxy to Filter F2-Region Ionospheric Parameters, Pure Appl. Geophys., 178, 4605–4618, https://doi.org/10.1007/s00024-021-02884-y, 2021.
Dudeney, J. R.: A simple empirical method for estimating the height and semithickness of the F2-layer at the Argentine Islands, Sci. Rep., 88, British Antarct. Surv., Cambridge, UK, 1974.
Jarvis, M. J., Jenkins, B., and Rodgers, G. A.: Southern hemisphere observations of a long-term decrease in F region altitude and thermospheric wind providing possible evidence for global thermospheric cooling, J. Geophys. Res., 103, 20775–20787, https://doi.org/10.1029/98JA01629, 1998.
Jarvis, M. J., Clilverd, M. A., and Ulich, T.: Methodological influences on F-region peak height trend analyses, Phys. Chem. Earth Pt. A/B/C, 27, 589–594, https://doi.org/10.1016/S1474-7065(02)00041-4, 2002.
Kyoto World Data Center for Geomagnetism: https://wdc.kugi.kyoto-u.ac.jp/index.html, last access: 25 November 2024.
Laštovička, J.: A review of recent progress in trends in the upper atmosphere, J. Atmos. Solar Terr. Phys., 163, 2–13, https://doi.org/10.1016/j.jastp.2017.03.009, 2017.
Laštovička, J.: Long-Term Trends in the Upper Atmosphere, in: Upper Atmosphere Dynamics and Energetics, edited by: Wang, W., Zhang, Y., and Paxton, L. J., American Geophysical Union, Washington DC, 325–344, https://doi.org/10.1002/9781119815631.ch17, 2021a.
Laštovička, J.: The best solar activity proxy for long-term ionospheric investigations, Adv. Space Res., 68, 2354–2360, https://doi.org/10.1016/j.asr.2021.06.032, 2021b.
Laštovička, J.: What is the optimum solar proxy for long-term ionospheric investigations? Adv. Space Res., 67, 2–8, https://doi.org/10.1016/j.asr.2020.07.025, 2021c.
Laštovička, J.: Dependence of long-term trends in foF2 at middle latitudes on different solar activity proxies, Adv. Space Res., 73, 685–689, https://doi.org/10.1016/j.asr.2023.09.047, 2024.
Laštovička, J. and Burešová, D.: Relationships between foF2 and various solar activity proxies, Space Weather, 21, e2022SW003359, https://doi.org/10.1029/2022SW003359, 2023.
Laštovička, J., Mikhailov, A. V., Ulich, T., Bremer, J., Elias, A. G., Ortis de Adler, N., Jara, V., Abarca del Rio, R., Foppiano, A. P., Ovalle, E., and Danilov, A. D.: Long-term trends in foF2: a comparison of various methods, J. Atmos. Sol. Terr. Phys., 68, 1854–1870, https://doi.org/10.1016/j.jastp.2006.02.009, 2006.
Laštovička, J., Solomon, S., and Qian, L.: Trends in the Neutral and Ionized Upper Atmosphere, Space Sci. Rev., 168, 113–145, https://doi.org/10.1007/s11214-011-9799-3, 2012.
Laštovička, J., Beig, G., and Marsh, D. R.: Response of the mesosphere-thermosphere-ionosphere system to global change-CAWSES-II contribution, Prog. Earth Planet Sc., 1, 21, https://doi.org/10.1186/s40645-014-0021-6, 2014.
Leibniz Institute of Atmospheric Physics at the University of Rostock (IAP): https://www.ionosonde.iap-kborn.de/mon_fof2.htm, last access: 25 November 2024.
Machol, J., Snow, M., Woodraska, D., Woods, T., Viereck, R., and Coddington, O.: An Improved Lyman-Alpha Composite, Earth Space Sci., 6, 2263–2272, https://doi.org/10.1029/2019EA000648, 2019 (data available at: https://lasp.colorado.edu/data/timed_see/composite_lya/lyman_alpha_composite.nc, last access: 25 November 2024).
Nobeyama Radio Polarimeters: https://solar.nro.nao.ac.jp/norp/index.html, last access: 25 November 2024.
Reinisch, B. W. and Galkin, I. A.: Global ionospheric radio observatory (GIRO), Earth Planet Sp., 63, 377–381, https://doi.org/10.5047/eps.2011.03.001, 2011.
Rishbeth, H.: A greenhouse effect in the ionosphere?, Planet Space Sci., 38, 945–948, https://doi.org/10.1016/0032-0633(90)90061-T, 1990.
Rishbeth, H. and Roble, R. G.: Cooling of the upper atmosphere by enhanced greenhouse gases – modelling of thermospheric and ionospheric effects, Planet Space Sci., 40, 1011–1026, https://doi.org/10.1016/0032-0633(92)90141-A, 1992.
Roble, R. G. and Dickinson, R. E.: How will changes in carbon dioxide and methane modify the mean structure of the mesosphere and thermosphere?, Geophys. Res. Lett., 16, 1441–1444, https://doi.org/10.1029/GL016i012p01441, 1989.
Scotto, C.: The accuracy of data from ionosondes for the estimation of hmF2 and the identification of global change in the ionosphere, Adv. Space Res., 52, 569–574, https://doi.org/10.1016/j.asr.2013.04.007, 2013.
Shimazaki, T.: World daily variability in the height of the maximum electron density of the ionospheric F2-layer, J. Radio Res. Lab., 2, 85–97, 1955.
Snow, M., Weber, M., Machol, J., Viereck, R., and Richard, E.: Comparison of Magnesium II core-to-wing ratio observations during solar minimum 23/24, J. Sp. Weather Sp. Clim., 4, A04, https://doi.org/10.1051/swsc/2014001, 2014.
Space Weather Canada: https://spaceweather.gc.ca/forecast-prevision/solar-solaire/solarflux/sx-en.php, last access: 25 November 2024.
Ulich, T.: Solar Variability and Long-Term Trends in the Ionosphere, PhD Thesis, Sodankylä Geophysical Observatory Publications, 87, SGO, Tähteläntie 112, FIN-99600 Sodankylä, Finland, May, ISBN 951-42-6023-6, 2000.
Ulich, T., Clilverd, M. A., Jarvis, M. J., and Rishbeth, H.: Unravelling Signs of Global Change in the Ionosphere, in: Space Weather, edited by: Lilensten, J., Astrophysics and Space Science Library, Vol. 344, Springer, Dordrecht, https://doi.org/10.1007/1-4020-5446-7_10, 2007.
Viereck, R. A., Floyd, L. E., Crane, P. C., Woods, T. N., Knapp, B. G., Rottman, G., Weber, M., Puga, L. C., and DeLand, M. T.: A composite MgII index spanning from 1978 to 2003, Sp Weather, 2, S10005, https://doi.org/10.1029/2004SW000084, 2004 (data available at: https://www.iup.uni-bremen.de/UVSAT/data/, last access: 25 November 2024).
WDC-SILSO, Royal Observatory of Belgium: http://www.sidc.be/silso/datafiles, last access: 25 November 2024.
Zossi, B. S., Medina, F. D., Tan Jun, G., Laštovička, J., Duran, T., Fagre, M., de Haro Barbas, B. F., and Elias, A. G.: Extending the analysis on the best solar activity proxy for long-term ionospheric investigations, Proc. R. Soc. A., 479, 20230225, https://doi.org/10.1098/rspa.2023.0225, 2023.
Zossi, B. S., Medina, F. D., Duran, T., and Elias, A. G.: Selecting the best solar EUV proxy for long-term timescale applications, Adv. Space Res., in press, https://doi.org/10.1016/j.asr.2024.07.023, 2024.
- Abstract
- Highlights
- Introduction
- Datasets
- Testing the hmF2 Shimazaki formula for use in this analysis
- Methodology to compare the different solar EUV proxies and Ap index roles on hmF2 trend analysis
- Results
- Discussion and conclusions
- Data availability
- Author contributions
- Competing interests
- Disclaimer
- Special issue statement
- Acknowledgements
- Review statement
- References


