the Creative Commons Attribution 4.0 License.
the Creative Commons Attribution 4.0 License.
Polar mesospheric summer echo (PMSE) multilayer properties during the solar maximum and solar minimum
Dorota Jozwicki
Puneet Sharma
Devin Huyghebaert
Ingrid Mann
Polar mesospheric summer echoes (PMSEs) are radar echoes that are measured in the upper atmosphere during the summer months and that can occur in several layers. In this study, we aimed to investigate the relationship between PMSE layers ranging from 80 to 90 km altitude and the solar cycle. We investigated 230 h of observations from the EISCAT very high frequency (VHF) radar located near Tromsø, Norway, from the years 2013, 2014 and 2015 during the solar maximum and the years 2019 and 2020 during the solar minimum and applied a previously developed classification model to identify PMSE layers. Our analysis focused on parameters such as the altitude, thickness and echo power in the PMSE layers, as well as the number of layers present. Our results indicate that the average altitude of PMSEs, the echo power in the PMSEs and the thickness of the layers are, on average, higher during the solar maximum than during the solar minimum. In the considered observations, the electron density at 92 km altitude and the echo power in the PMSEs are positively correlated with the thickness of the layers except for four multilayers at solar minimum. We infer that higher electron densities at ionospheric altitudes might be necessary to observe multilayered PMSEs. We observe that the thickness decreases as the number of multilayers increases. We compare our results with previous studies and find that similar results regarding layer altitudes were found in earlier studies using observations with other VHF radars. We also observed that the bottom layer in the different sets of multilayers almost always aligned with the noctilucent cloud (NLC) altitude reported by previous studies at 83.3 km altitude. Also, an interesting parallel is seen between the thickness of NLC multilayers and PMSE multilayers, where both NLCs and PMSEs have a similar distribution of layers greater than 1 km in thickness. Future studies that include observations over longer periods would make it possible to distinguish the influence of the solar cycle from possible other long-term trends.
- Article
(3838 KB) - Full-text XML
- BibTeX
- EndNote
During the summer months, radars can measure a phenomenon in the upper atmosphere called polar mesospheric summer echoes (PMSEs). PMSEs are strong radar echoes that typically form at heights between 80 and 90 km and in regions of extremely cold temperatures. They are observed at mid-latitudes and high latitudes, and their height and thickness varies over time (Rapp and Lübken, 2004). Figure 1 shows a typical example of a PMSE event where these variations can be seen. The PMSE formation is linked to the presence of turbulence, free electrons and charged aerosols. The charged aerosols contain water ice, which requires the presence of low temperatures, sufficient water vapor and nucleation centers to foster heterogeneous condensation (Latteck et al., 2021; Cho and Röttger, 1997; Rapp and Lübken, 2004). The mesopause, which marks the boundary between the mesosphere and the thermosphere, is characterized by the lowest temperatures in the atmosphere. Such low temperatures at PMSE altitudes are conducive to ice formation. Meteor smoke particles (MSPs), produced by meteor ablation and recondensation have been proposed to be potential condensation nuclei along with several other potential nuclei (Rapp and Thomas, 2006). In addition to nucleation centers, the presence of water vapor and the low temperatures at the mid- and high-latitude mesopause during the summer months create conditions favorable for ice particle formation (Avaste, 1993). Cold temperatures and water ice are known to be at the origin of another phenomenon called noctilucent cloud (NLC) (Schäfer et al., 2020) that are, due to light, scattered at the ice particles observed from the ground. More generally, and when observed from space, the clouds of ice particles are denoted as polar mesospheric clouds (Fritts et al., 2019).
The PMSEs are formed through a process that involves the electrical charging of the ice particles and is, for instance, discussed by Rapp and Lübken (2004) and Latteck et al. (2021). They are strong radar echoes, and they result from reflections at inhomogeneities in the electron density when their spatial scales are of sizes comparable to half of the radar wavelength. Constructive interferences of the reflections result in high backscattered power and narrowly peaked power spectra. Such strong echoes are typically from turbulence in the partially ionized upper atmosphere. The PMSEs are, in addition, influenced by the presence of charged ice particles. The ice particles are spatially structured by the turbulence, and as the ice particles collect ambient electrons when they are charged, they cause electron gradients to last longer and to form on smaller scales. The neutral atmospheric motion and dissipation of gravity waves at these altitudes are causes for the turbulence. The radar echoes in PMSEs are stronger compared to normal incoherent scattering.
The EISCAT very high frequency (VHF) radar used in our study is designed to measure the incoherent scatter, which comes from the small-scale fluctuations in electrons in the ionospheric plasma. As the ionospheric electrons are exposed to the electromagnetic wave transmitted by the radar, the Thomson scattering scatters a small fraction back. The backscattered power is proportional to the electron density and the electron oscillations, which in turn are influenced by ion interactions. As a result, the spectra measured from incoherent scatter allow one to derive from the observed signal the electron density and electron and ion temperatures (Beynon and Williams, 1978). In their study, Rapp and Lübken (2004) elucidate the difference to PMSEs, where PMSEs are typically stronger than incoherent scatter located at the same altitude and their spectra are more narrow. Observations with radars that also detect incoherent scatter offer the opportunity to measure the electron density in the vicinity of the PMSEs.

Figure 1Data from EISCAT VHF from 16 July 2015 from 00:00 to 12:00 showing an example of a PMSE event that contains three multilayers in the red frame.
Multilayered polar mesospheric summer echoes have been the focus of several investigations (Hoffmann et al., 2005; Li et al., 2016; Shucan et al., 2019). To simplify the exploration of PMSE multilayers, Jozwicki et al. (2021) conducted a study demonstrating the feasibility of distinguishing between images containing PMSEs and those that do not employing linear discriminant analysis (LDA). Subsequently, in Jozwicki et al. (2022), a model built on a random forest was employed to segment the PMSE signal from the incoherent scatter signal based on the power return in altitude. This model is utilized in the current paper for the pre-selection of data. An example of a PMSE occurrence with three distinct layers is depicted in Fig. 1 inside of the red frame. Given the significance of electron density in PMSE formation, it is reasonable to expect a potential influence of the solar cycle in it. Limited research has been conducted to examine the connection between multilayered PMSEs and the solar cycle.
We investigate PMSE observations with EISCAT VHF during the recent years. Our objective is to analyze the number of PMSE layers and their thickness, altitude and general behavior during the solar maximum and minimum and to determine possible correlations between these variables and the electron density at ionospheric heights above PMSEs. The study is organized as follows: in Sect. 2, we describe the methods and theories related to the pre-selection of the PMSE data, as well as the correlation coefficients employed to assess the significance of obtained results. In Sect. 3, we present and discuss the results. Finally, in Sect. 4, we summarize the conclusions drawn from this study.
In this section, we describe our methodology for data selection, including the tools utilized. Furthermore, we present the criteria used for identifying the different PMSE layers and the metrics employed for analyzing the collected data. In this study, we use recorded data from the EISCAT VHF radar located in Tromsø that operates at 224 MHz. The geographical coordinates of the EISCAT VHF radar are 69°35′ N and 19°14′ E; its geomagnetic latitude and longitude are, respectively, 66.73 and 102.18°.
2.1 Data selection
The Grand Unified Incoherent Scatter Design and Analysis Package (GUISDAP) is a software package used for processing and analyzing data from the EISCAT VHF incoherent scatter radar (Lehtinen and Huuskonen, 1996). The GUISDAP analysis fits the observed frequency spectrum received from each height with an incoherent scatter profile. The analysis returns the electron density based on the backscattered power, independently from the scattering process. The electron density parameter given by the analysis is proportional to the received echo power and therefore the strength of the PMSEs.
Table 1The dataset used for this study. The upper part of the table displays the dates and times selected for the solar maximum, and the lower part of the table is dedicated to the solar minimum. For each date, the corresponding sunspot number and the F10.7 cm flux is displayed. The F10.7 cm solar flux is given in W m−2 Hz−1. The date and time format are given, respectively, in DD/MM/YYYY format and in hours and minutes.
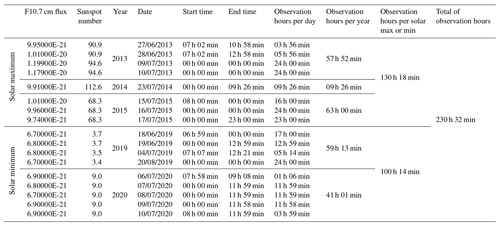
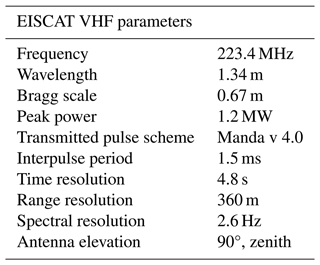
We downloaded over 230 h of recorded data via the Madrigal website. This corresponds to 17 930 data points, with the details provided in Table 1. The EISCAT VHF radar utilizes many different experimental modes to collect data. The utilized pulse coding for the PMSE measurements we analyzed is referred to as “Manda”. Some parameters of the EISCAT VHF radar using the Manda experiment are listed in Table 2. Detailed information regarding this experiment can be found on the EISCAT website (https://eiscat.se/scientist/document/experiments/, last access: 1 January 2023). For this study, we specifically analyzed data obtained using the Manda experiment because it is designed to detect low-altitude signals and layers in the mesosphere. We chose a time resolution of 60 s and a height resolution of 0.360 km.
We employed EISCAT VHF frequencies over UHF frequencies due to the latter exhibiting a lower recorded amount of PMSEs compared to VHF frequencies. As the Heating experiment is known to influence the backscattered power (also known as echo power) of the PMSEs (Belova et al., 2003), we carefully selected data from the days when the Heating experiment was not performed. This enabled us to compare electron densities at 92 km altitude alongside echo power at PMSE altitudes.
The data were carefully selected to encompass the solar maximum and solar minimum phases of the solar cycle. For the purpose of this study, we do not require an absolute value of PMSE strength; thus, we do not perform all the steps that would be necessary to obtain the absolute radar reflectivity as per the study by Hocking et al. (1986).
To investigate the behavior of the ionosphere in relation to PMSEs, we compared the echo power for PMSE altitudes between 80 and 90 km, with the electron density at 92 km ionospheric altitude. We used the electron density at 92 km altitude as a reference as it was the closest to the PMSE altitudes and the results were similar for altitudes of 92, 95 and 100 km.
2.2 Data processing
In this paper, we consider two variables: echo power and electron density. Both are measured in base-10 logarithmic units of the number of electrons per cubic meter. The number of electrons per cubic meter is proportional to the backscattered power for incoherent scatter, where the backscattered power is defined as the amount of power in the scattered signal received by the antenna. We define the backscattered power at 92 km altitude as electron density. The backscattered power at PMSE altitudes, between 80 and 90 km altitude, is defined as echo power.
We selected the PMSE data between 80 and 90 km altitude using a segmentation model from the study by Jozwicki et al. (2022). The segmentation model used a random forest on a set of handcrafted features to segment the PMSE data from the background. Random forest is a machine learning algorithm used for both classification and regression. In this algorithm, a number of decision trees are used during training phase to make predictions. On the output from the segmentation model, we applied a threshold to ensure that only PMSE data were retained for further analysis. This thresholding technique was also employed in the study by Shucan et al. (2019), where they used an echo power threshold of m−3, and in the study by Rauf et al. (2018b), where the authors used a threshold m−3. We were able to use a lower threshold of m−3 (which is equivalent to 10.5 in base-10 logarithmic units of the number of electrons per cubic meter) as the segmentation model from the study by Jozwicki et al. (2022) had successfully removed almost all non-PMSE data. This enabled us to retain a large amount of PMSE data per number of hours of observation in comparison to the findings of Shucan et al. (2019) and Rauf et al. (2018b).
Table 2Some parameters of the EISCAT VHF radar, the source of data for this paper. More information about the EISCAT documentation and radar system parameters can be found at https://eiscat.se/scientist/document/experiments/, last access: 1 January 2023.
2.3 Detection of PMSE multilayers
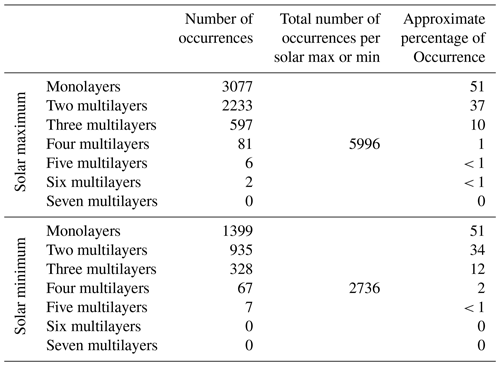
After processing the data at PMSE altitudes as described in Sect. 2.2, we aimed to detect the start and end of each PMSE layer in altitude. To achieve this, we utilized a method used in the study by Hoffmann et al. (2005) and Shucan et al. (2019). This method involves defining the start of a layer each time the threshold for echo power is exceeded and the end of the layer when the echo power falls below the given threshold. The time intervals and the corresponding altitude intervals associated with the start and end of each layer were recorded. During solar maximum conditions, we observed a maximum of six layers. In this study, we decided to ignore multilayers with more than four layers as their occurrence rates were low. For instance, we observed 13 occurrences of five multilayers in the whole dataset and two occurrences of six multilayers. In Table 3, we show the occurrences of monolayer and multilayer PMSE events, observed during solar minimum and solar maximum phases, with each occurrence corresponding to a 1 min interval.
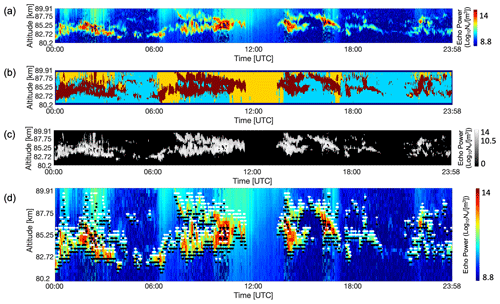
Figure 2Figure illustrating the process of the layer detection. (a) The original data for the 16 July 2015 between 00:00 and 23:58. (b) The output from the classification model used from Jozwicki et al. (2022). Dark red represents areas labeled as PMSEs, cyan represents areas of the data labeled as background noise and yellow represents areas labeled as ionospheric background. Panel (c) represents the data labeled as PMSEs in dark red from sub (b) onto which we applied the threshold described in Sect. 2.2 to make sure we only have PMSE data left. Finally, panel (d) represents the detected beginning and end of layers, respectively, represented with white and black points and overlayed on the original data.
2.4 Data analysis
In this study, we perform comparisons between the different mono- and multilayers of PMSEs using a number of parameters. The parameters included the starting and ending altitude intervals of the layer, the layer thickness (calculated as the difference between the start and end altitude interval), the mean altitude interval that corresponds to the middle of the layer, the echo power in the mean altitude interval inside the PMSEs, the altitude of the mean altitude interval, the layer's time interval, the UTC time associated with the time interval, the number of layers present in the time interval, and the electron density at 92 km altitude.
In order to investigate different PMSE properties, we use the Pearson correlation coefficient and the Spearman rank correlation coefficient to calculate the correlations between the different parameters (Wilks, 1995; Myers and Well, 2003). The Pearson correlation coefficient is used to measure how strong and in what direction two variables are related in a linear way (Wilks, 1995). For two random variables X and Y, the Pearson correlation coefficient is defined as follows (Wilks, 1995):
where σX and σY are the respective standard deviations of X and Y and cov is the covariance.
The Spearman rank correlation coefficient is a measure of the strength and direction of the relationship between two variables. It is similar to the Pearson correlation, but instead of measuring the linear relationship between two variables, it measures the monotonic relationship between them. The Spearman rank correlation coefficient is obtained by calculating the Pearson correlation between the ranked values of the variables (Myers and Well, 2003). To compute the Spearman correlation coefficient, for a sample size n, the raw scores Xi and Yi are converted into their rank values, rgX and rgY. After that, the Spearman correlation coefficient is computed as follows:
where and are the standard deviations of the rank variables, and cov(rgX, rgY) is the covariance of those rank variables.
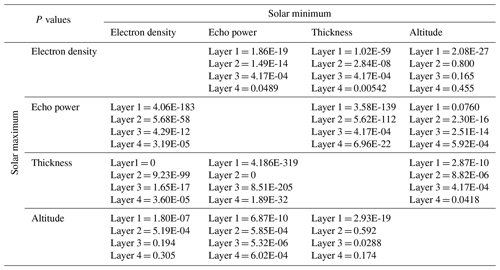
In this analysis, we calculated the statistical significance of our results using the P value (t test), which is listed in Tables B2, B3 and B4 in the Appendix. P values are used to determine whether the obtained results are different enough to be judged as statistically significant or not, using the means, variances and populations of the given variables. If the P value falls below the significance level (alpha), the given result is considered to be statistically significant. Testing the statistical significance of results comes with various confidence levels (90 %, 95 % and 99 %), which depend on the chosen significance level (with corresponding significance levels of 0.1, 0.05 and 0.01). It is commonly accepted that a P value below α=0.05 is indicative of statistical significance. However, in this study, we are analyzing a multi-parameter dataset, which is why we chose a lower threshold of α=0.0001 that is 2 orders of magnitude more selective.
In this section, we discuss our results, which are organized into multiple parts. Firstly, we discuss the distributions of a few variables, which are presented using histograms. Subsequently, we analyze the correlation coefficients that we have computed for the different variables.
Table 3The number of occurrences and approximate percentage of occurrence for each of the mono- and multilayers in our dataset. The data are separated according to solar maximum and solar minimum. For both solar maximum and solar minimum, the approximate percentage of occurrence for five multilayers or more is below 1,%. Therefore, the analysis in this study is limited to PMSEs with up to four multilayers.
3.1 Height distribution of PMSE layers
Our study focuses on observations from the summer mesopause during the solar maximum in years 2013 to 2015 and the solar minimum in years 2020 and 2021. The average peak altitude of PMSE height distribution, considering all PMSE detections, is higher during the solar maximum than during the solar minimum (see Fig. 3). The averaged mean altitude values of all the separate layers in the different sets of two multilayers, three multilayers and four multilayers are shown in the Appendix in Figs. A1 and A2.
When considering the mean altitude values of individual layers within the sets of two, three and four multilayers, a trend is seen in Figs. 4 and 5. In these figures, the color scheme has the red distribution representing the highest-altitude layer (the topmost layer) followed by the green distribution for the second-highest layer, the blue distribution for the third-highest layer and the magenta distribution for the fourth-highest layer. Additionally, when two layers' altitude distributions overlap, an intermediate color arises to represent this overlap. The P values for all possible combinations of these individual layers, as shown in Figs. 4 and 5, can be found in Table B1 in the Appendix. Upon decomposing the multilayer sets into individual layers, one can see that in both solar maximum and solar minimum conditions, the altitude of the top layer increases as the number of multilayers increases. This pattern holds true for the second- and third-highest layers as well.
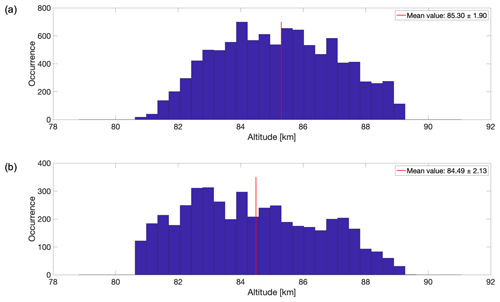
Figure 3Altitude distribution of the data for the (a) solar maximum and (b) solar minimum. Each subplot has its respective mean altitude represented with a red line on the graph and specified in the legend together with 1 standard deviation.
Our study confirms the findings of Hoffmann et al. (2005) regarding the altitude of the observed mono and multiple layers. Hoffmann et al. (2005) examined the occurrence and mean altitude of PMSE layers and performed microphysical model simulations. They proposed that the observed multiple-PMSE-layer structures are mainly caused by the layering of ice particles due to subsequent nucleation cycles. They reported that monolayers occurred at an average altitude of 84.8 km, and our results show that the mean altitude of monolayers was 85.21 km for the solar maximum and 84.46 km for the solar minimum. Our mean altitude of 84.83 km is consistent with the results of Hoffmann et al. (2005). Furthermore, they observed that in a set of two multilayers, the lower layer occurs at a mean altitude of 83.4 km and the upper layer occurs at a mean height of about 86.3 km, which is consistent with our findings. In fact, we found that in a set of two multilayers, the lower layer happens at a mean altitude of 83.74 km for the solar maximum and 82.90 km for the solar minimum, which results in an average of 83.32 km. Additionally, the upper layer occurs at an average altitude of 86.71 km for the solar maximum and 85.97 km for the solar minimum, which results in an average altitude of 86.34 km over the whole solar cycle. For this reason, we can note a similar observation to that in the study of Hoffmann et al. (2005) which claims that the altitude of the lower layer is in good agreement with the mean altitude of NLCs from lidar observations made by Fiedler et al. (2003) at Arctic Lidar Observatory for Middle Atmosphere Research (ALOMAR; at 69°16′42.0′′ N, 16°00′29.0′′ E, i.e., close to EISCAT), where the mean altitude of NLCs was found to be about 83.3 km. When examining the lowest layer in various multilayer sets in Figs. 4 and 5 (not limited to a set of just two multilayers, as discussed earlier), one can notice that the lowest layer almost always aligns with the NLC altitude as reported by Fiedler et al. (2003). Finally, Hoffmann et al. (2005) observed that monolayers occurred 50.1 %, double layers 36.6 % and multilayers with more than two layers 13.3 % of the time, during both solar maximum and minimum periods. Our study indicates that monolayers were observed at a rate of 51 % in both solar maximum and minimum, while double layers occurred at a rate of 37 % in solar maximum and 34 % in solar minimum. Furthermore, we found that the occurrence rate for multilayers with three and four layers combined was more than 11 % in the solar maximum and more than 14 % in the solar minimum.
The solar maximum phase is characterized by an increased number of sunspots and higher levels of ultraviolet radiation compared to the solar minimum phase. The F10.7 flux is often used as a proxy for the level of solar activity and, more specifically, the amount of ultraviolet radiation. The K index describes geomagnetic activity and potentially corresponds to particle precipitation. Shucan et al. (2019) found that PMSE mono-, double-, and triple-layer occurrence ratios are positively correlated with the K index. Also, Shucan et al. (2019) mention that the PMSE triple-layer occurrence ratio shows a negative correlation with F10.7. Zhao et al. (2020) reported a positive correlation between the temperature of the mesopause and the F10.7 flux. They found that the temperature of the mesopause is decreasing with time over an 18-year-long investigation (from 0 to −0.14 K yr−1), which could affect the formation of PMSEs. They also found that the height of the mesopause is decreasing with time at polar latitudes, which could potentially impact the height of PMSEs.
Lübken et al. (2021) show in their study that, over time, the ice particles are increasing in size. In Fig. 3, we can see that the altitude of the PMSE layers is, on average, lower for the solar minimum compared to the solar maximum. This could be due to the fact that the ice particle sizes increase with time over the years, and our selected dates for the solar maximum are anterior to the selected dates for the solar minimum. Considering these findings, the small difference in the altitude of the layers that we noted may be due to trends not related to solar cycle effects. Therefore, it appears that factors other than the sole influence from the solar cycle play a significant role in the altitude of PMSEs. Finally, further investigations and comparing the next solar maximum to the previous one might bring more clarity to the understanding of the influence from the solar cycle alone.
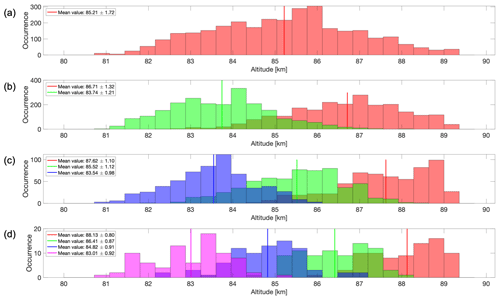
Figure 4Altitude distribution of the data during the solar maximum for (a) monolayers, (b) multilayers with two layers, (c) multilayers with three layers and (d) multilayers with four layers. In each figure, the color scheme of the distributions indicates altitude order: red for the highest layer, green for the second-highest, blue for the third-highest and magenta for the fourth-highest. Intermediate colors represent overlapping altitude distributions. The legend displays the mean value and 1 standard deviation for each distribution.
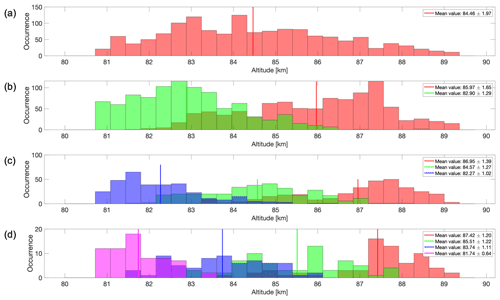
Figure 5Altitude distribution of the data during the solar minimum for (a) monolayers, (b) multilayers with two layers, (c) multilayers with three layers and (d) multilayers with four layers. In each figure, the color scheme of the distributions indicates altitude order: red for the highest layer, green for the second-highest, blue for the third-highest and magenta for the fourth-highest. Intermediate colors represent overlapping altitude distributions. The legend displays the mean value and 1 standard deviation for each distribution.
3.2 Distribution of the electron density
In the next step, we investigate how the distribution of the PMSE layers changes with ionization. We consider the electron densities observed above the PMSEs and ignore specific causes of ionization in this study. All the observed electron densities are summarized in Fig. 6; they range from 8.9 to 11.7 electrons per cubic meter in base-10 logarithmic unit during the solar maximum and their mean value is slightly higher during the solar maximum. Specifically, multilayer PMSEs with two layers exhibit the highest average corresponding electron density, reaching 10.47 electrons per cubic meter in base-10 logarithmic unit as one can see from Fig. 7. In contrast, the monolayers during the solar minimum have the lowest average corresponding electron density, with a value of 10.15 electrons per cubic meter in base-10 logarithmic unit, as displayed in Fig. 8. It is worth noting that, for both solar maximum and solar minimum periods, the monolayers corresponded to the lowest average electron density of their respective seasons. However, it is important to bear in mind that this trend is weak and that some P values corresponding to the different combinations of layers in Figs. 7 and 8 are greater than 0.05, as shown in Table B2. A plausible argument could be made that higher electron densities at ionospheric altitudes might be necessary to observe multilayered PMSEs.
During the solar maximum, we observe a wider range of electron densities compared to the solar minimum when PMSEs are present, particularly at higher electron densities. This variation in electron densities may explain why the mean electron density at an altitude of 92 km is higher during the solar maximum than the solar minimum during PMSE events. Additionally, our analysis reveals that the standard deviation of electron densities decreases with increasing number of layers, with monolayers exhibiting the largest standard deviations and four-layer systems exhibiting the smallest standard deviations for both solar maximum and minimum conditions.
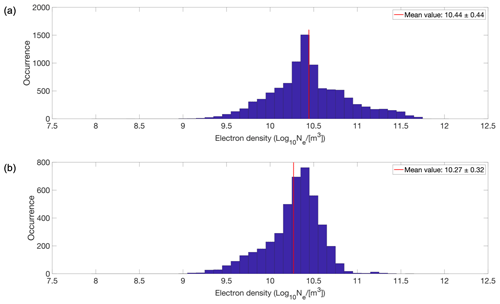
Figure 6Electron densities at 92 km altitude for all layers during the (a) solar maximum and (b) solar minimum. Each subplot was its respective mean electron density represented with a red line on the graph and specified in the legend together with 1 standard deviation.
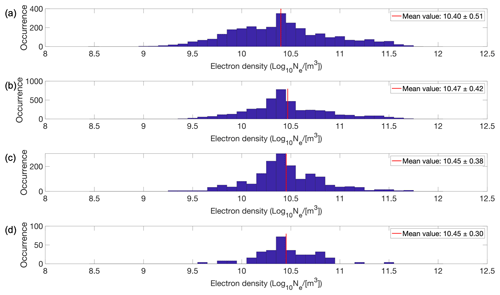
Figure 7Electron density at 92 km altitude during the solar maximum for (a) monolayers, (b) multilayers with two layers, (c) multilayers with three layers and (d) multilayers with four layers. Each subplot was its respective mean electron density represented with a red line on the graph and specified in the legend together with 1 standard deviation.
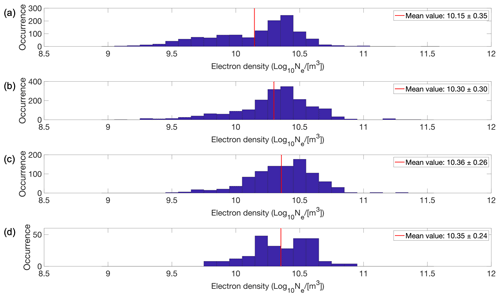
Figure 8Electron density at 92 km altitude during the solar minimum for (a) monolayers, (b) multilayers with two layers, (c) multilayers with three layers and (d) multilayers with four layers. Each subplot was its respective mean electron density represented with a red line on the graph and specified in the legend together with 1 standard deviation.
3.3 Distribution of the echo power
As discussed in Sect. 2.2, we classified the data using the classification model of Jozwicki et al. (2022) and applied a threshold to identify PMSEs. Specifically, we considered all echo power values above a threshold of 10.5 electrons per cubic meter in base-10 logarithmic unit as PMSEs. This explains the absence of values below 10.5 on the horizontal axis of Figs. 9, 10 and 11. Figures have been generated to visualize individual layers within the various sets of two, three and four multilayers seen in Figs. 10 and 11. This approach mirrors the technique employed in Figs. 4 and 5. However, since the separation of layers did not yield additional information, we have chosen to retain the averaged representations of all multilayers combined, as depicted in Figs. 10 and 11.
In Fig. 9, it is evident that the average echo power in PMSEs is higher during the solar maximum than the solar minimum. We noticed a greater distribution of higher values of echo power during the solar maximum as compared to the solar minimum, which leads to a higher mean value during the solar maximum. Further, in Fig. 10, we observe that the average echo power decreases as the number of multilayers increases for the solar maximum and the individual layers are considered. This indicates that a single monolayer has a higher echo power than the individual layers of two multilayers, which in turn have a higher echo power than the individual layers of three multilayers and so on. However, during the solar minimum, as shown in Fig. 11, this trend is less evident, and we do not see a clear decrease in echo power with the increasing number of layers.
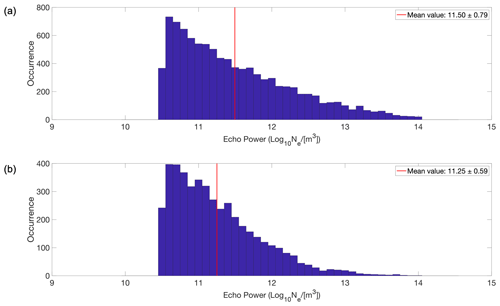
Figure 9Echo power in the PMSEs for all layers during the (a) solar maximum and (b) solar minimum. Each subplot has its respective mean echo power represented with a red line on the graph and specified in the legend together with 1 standard deviation.
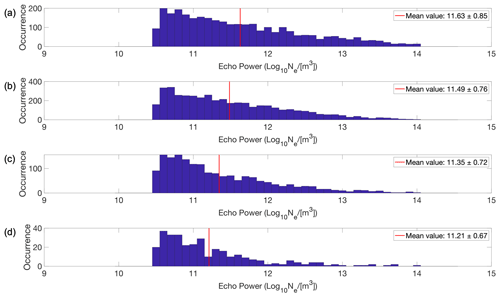
Figure 10Echo power in the PMSEs during the solar maximum for (a) monolayers, (b) multilayers with two layers, (c) multilayers with three layers and (d) multilayers with four layers. Each subplot has its respective mean echo power represented with a red line on the graph and specified in the legend together with 1 standard deviation.
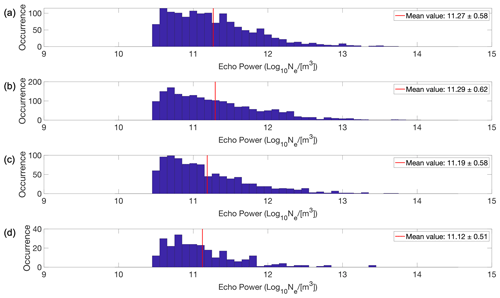
Figure 11Echo power in the PMSEs during the solar minimum for (a) monolayers, (b) multilayers with two layers, (c) multilayers with three layers and (d) multilayers with four layers. Each subplot has its respective mean echo power represented with a red line on the graph and specified in the legend together with 1 standard deviation.
3.4 Distribution of the thickness
In our study, we determined the thickness of the PMSE layers based on the number of neighboring data points or altitude channels exceeding the echo power threshold described in Sect. 2.2. Each data point or altitude channel corresponds to a distance of 360 m. As shown in Fig. 12, the average thickness of the layers is higher during the solar maximum, with an average of 1.59 km, compared to solar minimum, where the average thickness is 1.32 km. When we examine the mono- and multilayer cases in more detail, as shown in Figs. 13 and 14, we observe that the average thickness decreases as the number of layers increases. This means that a monolayer will be thicker than a layer belonging to a set of two multilayers, which in turn will be thicker than a layer in a three-multilayer case and so on. Figures have been generated to visualize individual layers within the various sets of two, three and four multilayers seen in Figs. 13 and 14. This approach mirrors the technique employed in Figs. 4 and 5. However, since the separation of layers did not yield additional information, we have chosen to retain the averaged representations of all multilayers combined, as depicted in Figs. 13 and 14. The highest average layer thickness is obtained during the solar maximum for monolayers, with an average of 2.15 km, while the lowest average of 0.87 km is obtained during the solar minimum for four multilayers.
A comparison can be drawn between the thickness of NLCs and PMSEs. Although the formation mechanisms of these two phenomena differ, there is a shared population of ice particles that contribute to both. Therefore, it is worthwhile to explore the potential similarities and differences between them. Lübken et al. (2009) found that NLCs have a higher brightness at lower altitudes, while Schäfer et al. (2020) analyzed 182 h of lidar data and found that NLCs occur more than half of the time (57.2 %) in thick layers of more than 1 km. In our study, we analyzed 7790 instances of PMSEs with three or more altitude channels. Knowing that one altitude channel corresponds to 360 m, three altitude channels or more indicate a PMSE thickness of at least 1.08 km. Our findings show that 54.64 % of PMSE occurrences happened in thick layers of 1.08 km or more. These results are consistent with those of Schäfer et al. (2020), where they reported that 57.2 % of NLC occurrences were observed in thick layers of 1 km or more. Additionally, Schäfer et al. (2020) classified the NLCs they observed into 10 subcategories and found that the most frequently occurring subcategory consists of thick layers composed of multiple multilayers, with an occurrence rate of 20.5 %. They report that each of the multilayers move in parallel with each other. This implies that there is a similar movement in the vertical displacement of the multilayers. If we consider all types of multilayers mentioned by Schäfer et al. (2020), this percentage increases to up to 27.6 %. In our study, multilayers happen half of the time, with an approximate occurrence rate of 49 %. Therefore, our results differ from the ones of Schäfer et al. (2020) when it comes to the occurrence rate of multilayers, which may be explained by some of the differences in the formation and measurement of the two phenomena.
Gravity waves are thought to play a role in the formation of PMSEs by generating neutral turbulence in the mesosphere. The complex dynamics and structuring because of shear instabilities and breaking of the gravity waves are derived, for example, from polar mesospheric cloud observations and can generate turbulence at PMSE altitudes (Fritts et al., 2019). This turbulence can lead to small-scale variations in the electron density, which can create the conditions necessary for PMSEs to form (Rapp and Lübken, 2004). Therefore, understanding the characteristics of gravity waves and their effects on the neutral atmosphere is essential for understanding the formation of PMSEs.
Li et al. (2016) developed a two-dimensional theoretical model to explore the creation process of multilayered PMSEs. The aim of the proposed model was to consider how gravity waves could cause movement of ice particles through collisions with the neutral atmosphere. Their model was able to simulate the presence of gravity waves by assigning both vertical and horizontal wavelengths. The ice particles are considered to be spherical, and their size does not vary during the simulations. This means that processes such as growth, sedimentation or sublimation are not taken into account in their model. In their first experiment, Li et al. (2016) fixed the particle size at 10 nm and varied the vertical wavelength of gravity waves to 3, 4 and 5 km. Only one wavelength was considered at a time, when varying the vertical wavelength. They observed a decrease in the number of layers as the vertical wavelength increased. Also, the thickness of the layers increased as the number of layers decreased. Our results on thickness distribution shown in Figs. 12, 13 and 14 show similar trends. We found that the average thickness of monolayers was higher than that of multilayers and that the thickness decreased with an increasing number of multilayers. One possible hypothesis that can be drawn is that the thickness of the layers could be related to the vertical wavelength of gravity waves, with higher wavelengths producing thicker layers.
In another experiment in the Li et al. (2016) study, they investigated the effect of varying ice particle size while fixing the vertical wavelength of gravity waves at 4km. They used particle sizes of 10, 20 and 30 nm and found that the altitude of the layers decreased more rapidly and their formation became more challenging with increasing particle size. Also, once the turbulence stopped, the larger ice particles took longer to go back to a neutral homogeneous state. It is worth noting that their model does not consider the growth, sedimentation and sublimation processes, so these findings should be considered preliminary hypotheses. Li et al. (2016) also reported the observation of preferred altitudes for each multilayer formation, which depended on the size of the ice particles. Potential mechanisms for ice formation at upper mesospheric altitudes that could be affected by the solar cycle are unknown to the authors, but this is something to investigate in a future study.
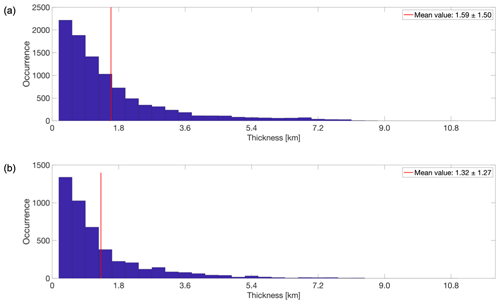
Figure 12Thickness distribution of the layers for all layers combined during the (a) solar maximum and (b) solar minimum. Each subplot was its respective mean thickness represented with a red line on the graph and specified in the legend together with 1 standard deviation.
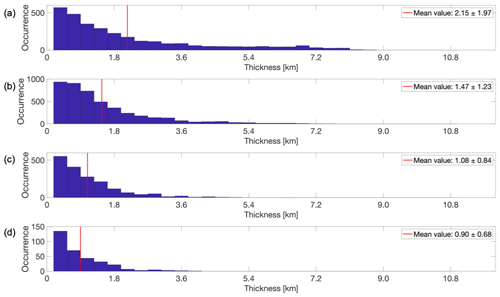
Figure 13Thickness distribution during the solar maximum for (a) monolayers, (b) multilayers with two layers, (c) multilayers with three layers and (d) multilayers with four layers. Each subplot was its respective mean thickness represented with a red line on the graph and specified in the legend together with 1 standard deviation.
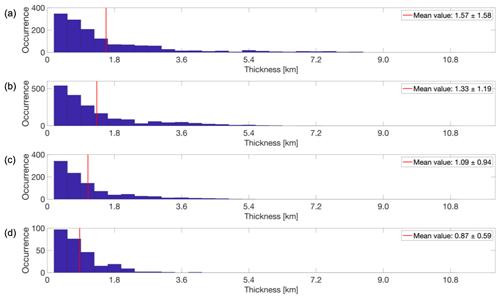
Figure 14Thickness distribution during the solar minimum for (a) monolayers, (b) multilayers with two layers, (c) multilayers with three layers and (d) multilayers with four layers. Each subplot was its respective mean thickness represented with a red line on the graph and specified in the legend together with 1 standard deviation.
Neutral air turbulence, which is a key factor in PMSE formation, can be generated by wind shears. Singer et al. (2012) found that westward winds increase below an altitude of about 85 km, while eastward winds increase above 85 km, particularly during summer. They also found that at an altitude of about 75 km, the long-term trend of zonal winds corresponds to increased activity of gravity waves with periods of 3 to 6 h at altitudes between 80 and 88 km. Severe solar proton events cause eastward winds to increase above an altitude of about 85 km. This behavior of winds and their effects at PMSE altitudes may be another key to a better understanding of the formation of multilayered PMSEs.
3.5 Correlations
In this section, we will analyze the correlation between several parameters – namely, electron density, echo power, thickness and altitude. Table 4 shows both correlation coefficients for all layers together for the solar maximum on the lower portion of the table and for the solar minimum on the upper portion of the table. Table 5a shows the results of the Pearson correlation coefficient only, for mono- and multilayers separately, and for the solar maximum and minimum. Table 5b shows the results of the Spearman rank correlation coefficient only, for mono- and multilayers separately, and for the solar maximum and minimum. For simplicity, in all the abovementioned tables, the notation rp is chosen to represent Pearson correlation coefficients, and the notation rs is chosen to represent Spearman rank correlation coefficients. In Table 5a and b, the notations rp1, rp2, rp3 and rp4 denote the Pearson correlation coefficients for monolayers, double layers, triple layers and quadruple layers, respectively. In a similar manner, the Spearman rank correlation coefficient notations are rs1, rs2, rs3 and rs4.
Table 4Pearson and Spearman rank correlation coefficients for all layers together for the solar maximum and solar minimum.
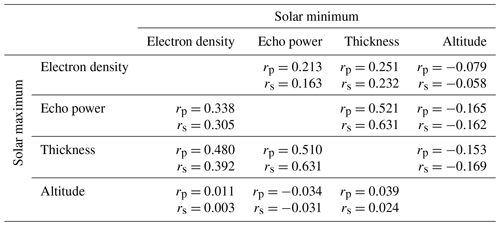
Table 5(a) Pearson correlation coefficients for mono- and multilayers separately for the solar maximum and solar minimum. (b) Spearman rank correlation coefficients for mono- and multilayers separately for the solar maximum and solar minimum.
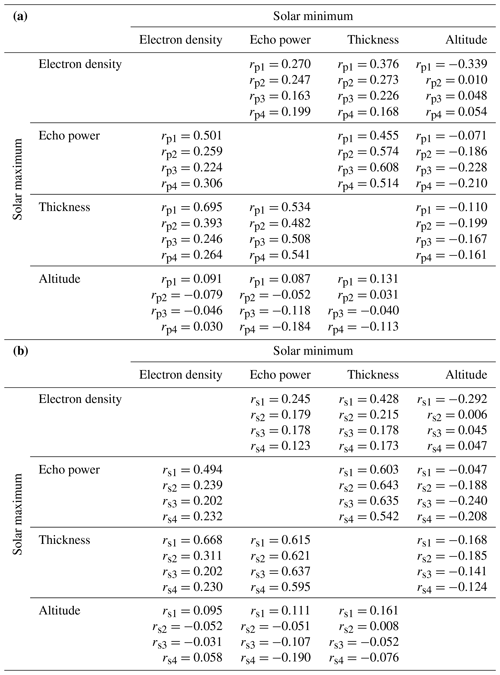
In Table 4, it is observed that the electron density at 92 km altitude and the echo power are positively correlated with the thickness of all the layers for both the solar maximum and solar minimum. This is also the case for Table 5a and b. During the solar maximum, the positive correlation between electron density and thickness is greater than during the solar minimum, but this is not observed between echo power and thickness. In Table 4, the Pearson correlation coefficient of 0.480 for the solar maximum suggests a moderate positive linear relationship between electron density and thickness, while the Spearman rank correlation coefficient of 0.392 indicates a moderate positive monotonic relationship between the variables for the same case. Since the two values are similar, it suggests that during the solar maximum, there is a consistent association between electron density and thickness. In Table 5a and b, we observe that the Pearson correlation coefficient and Spearman rank correlation coefficient between electron density and thickness decrease as the number of multilayers increases. Specifically, in both cases the highest correlation is observed for the solar maximum and monolayers, with a Pearson coefficient of 0.695 and a Spearman rank coefficient of 0.668. This could possibly indicate that at higher ionization levels at this altitude, the PMSE monolayers are thicker. Conversely, the lowest correlations were obtained for the solar minimum and the largest number of multilayers, which is 4, with a Pearson coefficient of 0.168 and a Spearman rank coefficient of 0.173.
From Tables 4, 5a, and b we notice a weak negative correlation between the echo power in the PMSEs and altitude for all layers during both solar maximum and solar minimum. The strongest negative correlation is found for 3 multilayers, with a Pearson coefficient of −0.228 and a Spearman rank coefficient of −0.240. Notably, altitude appears to be uncorrelated with the other variables, implying that additional factors may be influencing the formation of PMSEs at specific altitudes. For example, this could be attributed to mesopause conditions, gravity wave wavelength and ice particle size.
From Tables 4, 5a, and b electron density at 92 km altitude and the echo power in the PMSEs for all the layers and for both solar maximum and solar minimum. For Table 5a and b, we note that the highest Pearson correlation coefficient and Spearman rank correlation coefficient are obtained for monolayers. Specifically for the solar maximum, the Pearson coefficient is 0.501 and the Spearman rank coefficient is 0.494, while for the solar minimum, the Pearson coefficient is 0.270 and the Spearman rank coefficient is 0.245. These results can possibly suggest that at higher ionization levels at 92 km altitude, the PMSEs have a higher intensity, indicated by a higher echo power, particularly in the case of monolayers during the solar maximum. On the other hand, the lowest correlations were found for multilayers containing three layers, with a Pearson coefficient of 0.224 and a Spearman rank coefficient of 0.202 for the solar maximum and a Pearson coefficient of 0.306 and a Spearman rank coefficient of 0.232 for the solar minimum.
Narayanan et al. (2022) investigated the effects of particle precipitation on PMSE formation using electron densities from 90 to 95 km. They found a clear response in the power of the PMSEs during particle precipitation events: in all their cases, an increase in PMSE power was observed in association with particle precipitations. However, Narayanan et al. (2022) say that the particle precipitation does not seem to be related to the very existence of PMSEs and that there seems to be no linear relationship between both, which is consistent with the results of our study. Specifically, we observe weak Pearson correlation coefficients during the solar minimum, as reported in Table 5a, which is consistent with the findings of Narayanan et al. (2022), who analyzed EISCAT VHF observations from 2019, a period corresponding to the solar minimum. However, our results indicate slightly higher Pearson correlation coefficients during the solar maximum, particularly for monolayers. It would be worthwhile to conduct a similar investigation as Narayanan et al. (2022) during the solar maximum phase of a solar cycle. These findings should be interpreted with care, considering that our study differs from that of Narayanan et al. (2022) in several ways. Specifically, our data selection process did not require the simultaneous presence of PMSEs and particle precipitation.
From Table 4, one can notice that for the combination of echo power and electron density during the solar maximum, the obtained Pearson correlation coefficient is 0.338 and the Spearman rank correlation coefficient is 0.305. In their study, Rauf et al. (2018a) used EISCAT VHF data to investigate the correlation between PMSE strength and particle precipitation over a dataset consisting of 111 h, or 5 d of observation. However, in their case, they derived the Pearson and Spearman correlation coefficients between their PMSE proxy, which is equivalent to our use of the term “echo power” and the electron density at 90 km altitude instead of 92 km we used. Nevertheless, it is interesting to note that they also found a positive correlation between echo power and electron density of 0.15 for the Pearson correlation coefficient, and 0.24 for the Spearman correlation coefficient. It is important to note that during their analysis, Rauf et al. (2018a) only selected data from 8 to 12 July 2013, when PMSEs and particle precipitation were occurring simultaneously. In our study, we included data from the year 2013 in the solar maximum period. Hence, we compare the correlation coefficients from Rauf et al. (2018a) with our own coefficients for the solar maximum. While both studies discovered a positive correlation, our findings had higher correlation coefficients than the Rauf et al. (2018a) study. One factor which could explain this difference might be the fact that in Rauf et al. (2018a) data, PMSEs and particle precipitation were always occurring simultaneously, while in our analysis, data were selected solely based on the presence of PMSEs without any filtering based on the occurrence of particle precipitation. It should be noted that while a PMSE was present in all of our cases, there may have been instances where particle precipitation was present and instances where it was not. Another factor might be that we used a lower threshold for PMSE detection than Rauf et al. (2018a) due to the fact that we used a classification model on the data beforehand. We used the threshold m−3, while Rauf et al. (2018a) used m−3.
The altitude, the echo power and the thickness of layers in PMSEs have, on average, higher values during the solar maximum than during the solar minimum. During the PMSE occurrence, as expected, the electron density at 92 km is, on average, higher during the solar maximum than solar minimum. Taking into account the findings presented by Lübken et al. (2021) that show an increase in ice particle size over time in conjunction with these results, it is difficult to isolate the exact mechanisms by which the PMSE properties are affected. Nonetheless, breaking down the multilayer sets into individual layers reveals a consistent trend: in both solar maximum and solar minimum cases, the altitude of the top layer tends to rise with an increasing number of multilayers. This tendency extends to the second- and third-highest layers as well. Our findings support the conclusions drawn by Hoffmann et al. (2005) regarding the altitude and occurrence rate of both mono and multiple layers. Additionally, when examining the lowest layer in various multilayer sets, the lowest layer almost always aligns with the NLC altitude as reported by Fiedler et al. (2003) of 83.3 km. The recent work by Vellalassery et al. (2024) addresses the variation in NLCs throughout the solar cycle. They used the Leibniz Institute Middle Atmosphere (LIMA) model and the Mesospheric Ice Microphysics and Transport (MIMAS) model over the years 1849 to 2019, corresponding to 15 solar cycles. Their findings indicate that NLC altitudes increase during periods of solar maximum and decrease during the solar minimum. Additionally, they observed a long-term decline in NLC altitude, attributed to the overall shrinking of the atmosphere. Our findings align with those results, as we observed a lower altitude of the PMSEs during the solar minimum period (years 2019 and 2020) compared to the solar maximum phase (years 2013 to 2015).
We have observed that the thickness of the layers decreases as the number of multilayers increases, indicating that a single monolayer will be thicker than the separate layers of a set of two multilayers, which in turn will be thicker than the separate layers of three multilayers and so on. This is mostly the case for layers 1 to 3 and for both the solar maximum and solar minimum. Furthermore, the echo power was found to decrease with increasing multilayers but only in the case of the solar maximum and mostly for layers 1 to 3. This suggests that there may be a relationship between the number of layers, echo power and thickness. Our study is consistent with the findings of Li et al. (2016) where they found that the thickness of multilayers decreases with increasing number of multilayers.
Based on our investigation, we have found that the electron density at 92 km altitude and the echo power are positively correlated with the thickness for all the layers and for both the solar maximum and solar minimum except for four multilayers at the solar minimum. We also found similar results as Rauf et al. (2018a), discovering a positive correlation between electron density and echo power, especially for monolayers and during the solar maximum. This can possibly suggest that under those conditions and at higher ionization levels at 92 km altitude, the PMSEs are stronger, which is indicated by a higher echo power. The electron density was highly correlated with the thickness of the layers except for the solar minimum and four multilayers. The correlation is the strongest, especially for the solar maximum and monolayers, which indicates that at higher ionization levels at 92 km altitude, the PMSE monolayers are commonly thicker. Comparing our results with Li et al. (2016) led us to the hypothesis that the thickness of the layers could be related to the vertical wavelength of gravity waves, with larger wavelengths producing thicker layers. Further investigations could explore this hypothesis, potentially providing a means of inferring the wavelength of gravity waves through PMSE observations at these altitudes.
For both solar maximum and solar minimum periods, the monolayers attained the lowest average electron density of their respective seasons though the trend was relatively weak. An argument could be made that higher electron densities at ionospheric altitudes might be necessary to generate multilayered PMSEs, though this requires more investigation.
A parallel can be drawn with the findings of Schäfer et al. (2020) regarding multilayered NLCs, where both of our studies found a similar occurrence rate for thick-layer formation above 1 km thickness. In light of the similarities in multilayer formation between PMSEs and NLCs, future studies may be able to utilize findings from NLC research to gain insights into PMSE dynamics.
In conclusion, the mechanism of the formation PMSEs might be presently well understood; however, the exact conditions leading to multilayered PMSE formation remain unclear, and further investigation is required. Hoffmann et al. (2005) proposed that PMSE layering can be explained by the stratification of ice particles resulting from successive nucleation cycles near the mesopause followed by growth and sedimentation. Other authors hypothesized a potential connection between PMSE multilayers and gravity waves (Li et al., 2016; Hoffmann et al., 2005). Our hypothesis on the formation of multilayered PMSEs is that gravity waves transport particles into regions of low temperature at varying altitudes. In these conditions, ice particles can form and grow. This process may impact the size of ice particles, which in turn could affect their spatial distribution via sedimentation, and potentially influence the formation of multilayers. Therefore, for example, future research could include further investigation of the connections between multilayered PMSE formation, winds and gravity waves. One possible way to do this is to measure gravity waves using the EISCAT radar (Günzkofer et al., 2023). Utilizing the dissipative anelastic gravity wave dispersion relation, Günzkofer et al. (2023) derive vertical wind profiles within the lower thermosphere. This is a promising avenue for further measuring of gravity waves during PMSE occurrences. Understanding the complex interplay of the factors involving the formation of PMSEs is crucial to gain insights into the thermodynamic and fluid dynamic processes occurring at altitudes between 80 and 90 km. While differences between the results from observations during the solar maximum and during the solar minimum considering all the layers together are statistically significant, the cause for the differences needs to be confirmed by future studies.
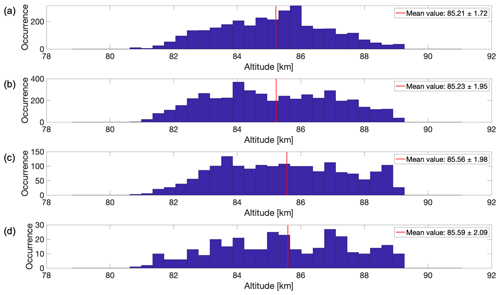
Figure A1Altitude distribution of the data during the solar maximum for (a) monolayers, (b) multilayers with two layers, (c) multilayers with three layers and (d) multilayers with four layers. Each subplot was its respective averaged mean altitude of all the multilayers represented with a red line on the graph and specified in the legend together with 1 standard deviation.
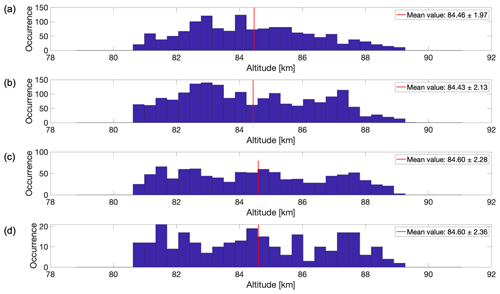
Figure A2Altitude distribution of the data during the solar minimum for (a) monolayers, (b) multilayers with two layers, (c) multilayers with three layers and (d) multilayers with four layers. Each subplot was its respective averaged mean altitude of all the multilayers represented with a red line on the graph and specified in the legend together with 1 standard deviation.
Table B2P values for all combinations of layers and parameters shown in Figs. 3, A1, A2, 6, 7, 8, 9, 10, 11, 12, 13 and 14.
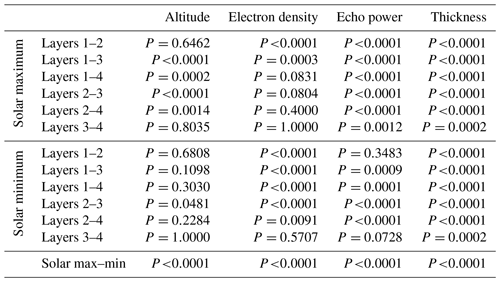
Table B3P values for the correlation coefficients for all layers together during the solar maximum and solar minimum shown in Table 4.

Table B4P values for the correlation coefficients for the mono- and multilayers separately, during the solar maximum and solar minimum shown in Table 5b).
EISCAT VHF data are available under https://madrigal.eiscat.se/madrigal/ (EISCAT, 2023).
DJ, PS, DH and IM: conceptualization; DJ: data curation, investigation, software, and writing (original draft); IM: funding acquisition; IM: project administration; PS, DH and IM: supervision; PS, DH and IM: validation; DJ, PS, DH and IM: writing (review and editing). All authors have read and agreed to the published version of the paper.
At least one of the (co-)authors is a member of the editorial board of Annales Geophysicae. The peer-review process was guided by an independent editor, and the authors also have no other competing interests to declare.
Publisher’s note: Copernicus Publications remains neutral with regard to jurisdictional claims made in the text, published maps, institutional affiliations, or any other geographical representation in this paper. While Copernicus Publications makes every effort to include appropriate place names, the final responsibility lies with the authors.
This article is part of the special issue “Special issue on the joint 20th International EISCAT Symposium and 15th International Workshop on Layered Phenomena in the Mesopause Region”. It is a result of the Joint 20th International EISCAT Symposium 2022 and 15th International Workshop on Layered Phenomena in the Mesopause Region, Eskilstuna, Sweden, 15–19 August 2022.
This work was carried out within a project funded by the Research Council of Norway. The Norwegian participation in EISCAT and EISCAT3D is funded by the Research Council of Norway. The EISCAT Scientific Association is supported by research organizations in Norway (NFR), Sweden (VR), Finland (SA), Japan (NIPR and STEL), China (CRIPR) and the United Kingdom (NERC). The authors would like to thank the anonymous reviewers for their valuable feedback and constructive comments, which have helped improve the quality of this paper.
This research has been supported by the Norges Forskningsråd (NFR; grant no. 275503) and the UiT (The Arctic University of Norway) contribution to the EISCAT_3D project funded by the Research Council of Norway through research infrastructure (grant no. 245683).
This paper was edited by Alexa Halford and reviewed by two anonymous referees.
Avaste, O.: Noctilucent clouds, J. Atmos. Terr. Phys., 55, 133–143, https://doi.org/10.1016/0021-9169(93)90118-I, 1993. a
Belova, E., Chilson, P. B., Kirkwood, S., and Rietveld, M. T.: The response time of PMSE to ionospheric heating, J. Geophys. Res.-Atmos., 108, 8446, https://doi.org/10.1029/2002JD002385, 2003. a
Beynon, W. and Williams, P.: Incoherent scatter of radio waves from the ionosphere, Rep. Prog. Phys., 41, 909–956, https://doi.org/10.1088/0034-4885/41/6/003, 1978. a
Cho, J. Y. N. and Röttger, J.: An updated review of polar mesosphere summer echoes: Observation, theory, and their relationship to noctilucent clouds and subvisible aerosols, J. Geophys. Res.-Atmos., 102, 2001–2020, https://doi.org/10.1029/96JD02030, 1997. a
EISCAT: EISCAT VHF data, Madrigal Database, EISCAT [data set], https://madrigal.eiscat.se/madrigal/, last access: 15 January 2023. a
Fiedler, J., Baumgarten, G., and von Cossart, G.: Noctilucent clouds above ALOMAR between 1997 and 2001: Occurrence and properties, J. Geophys. Res.-Atmos., 108, 8453, https://doi.org/10.1029/2002JD002419, 2003. a, b, c
Fritts, D. C., Miller, A. D., Kjellstrand, C. B., Geach, C., Williams, B. P., Kaifler, B., Kaifler, N., Jones, G., Rapp, M., Limon, M., Reimuller, J., Wang, L., Hanany, S., Gisinger, S., Zhao, Y., Stober, G., and Randall, C. E.: PMC Turbo: Studying Gravity Wave and Instability Dynamics in the Summer Mesosphere Using Polar Mesospheric Cloud Imaging and Profiling From a Stratospheric Balloon, J. Geophys. Res.-Atmos., 124, 6423–6443, https://doi.org/10.1029/2019JD030298, 2019. a, b
Günzkofer, F., Pokhotelov, D., Stober, G., Mann, I., Vadas, S. L., Becker, E., Tjulin, A., Kozlovsky, A., Tsutsumi, M., Gulbrandsen, N., Nozawa, S., Lester, M., Belova, E., Kero, J., Mitchell, N. J., and Borries, C.: Inferring neutral winds in the ionospheric transition region from atmospheric-gravity-wave traveling-ionospheric-disturbance (AGW-TID) observations with the EISCAT VHF radar and the Nordic Meteor Radar Cluster, Ann. Geophys., 41, 409–428, https://doi.org/10.5194/angeo-41-409-2023, 2023. a, b
Hocking, W., Rüster, R., and Czechowsky, P.: Absolute reflectivities and aspect sensitivities of VHF radio wave scatterers measured with the SOUSY radar, J. Atmos. Terr. Phys., 48, 131–144, https://doi.org/10.1016/0021-9169(86)90077-2, 1986. a
Hoffmann, P., Rapp, M., Serafimovich, A., and Latteck, R.: On the occurrence and formation of multiple layers of polar mesosphere summer echoes, Geophys. Res. Lett., 32, L05812, https://doi.org/10.1029/2004GL021409, 2005. a, b, c, d, e, f, g, h, i, j
Jozwicki, D., Sharma, P., and Mann, I.: Investigation of Polar Mesospheric Summer Echoes Using Linear Discriminant Analysis, Remote Sens., 13, 522, https://doi.org/10.3390/rs13030522, 2021. a
Jozwicki, D., Sharma, P., Mann, I., and Hoppe, U.-P.: Segmentation of PMSE Data Using Random Forests, Remote Sens., 14, 2976, https://doi.org/10.3390/rs14132976, 2022. a, b, c, d, e
Latteck, R., Renkwitz, T., and Chau, J. L.: Two decades of long-term observations of polar mesospheric echoes at 69° N, J. Atmos. Sol.-Terr. Phys., 216, 105576, https://doi.org/10.1016/j.jastp.2021.105576, 2021. a, b
Lehtinen, M. S. and Huuskonen, A.: General incoherent scatter analysis and GUISDAP, J. Atmos. Terr. Phys., 58, 435–452, https://doi.org/10.1016/0021-9169(95)00047-X, 1996. a
Li, H., Wu, J., and Zhou, Z.: The formation of multiple layers of ice particles in the polar summer mesopause region, Ann. Geophys., 34, 117–122, https://doi.org/10.5194/angeo-34-117-2016, 2016. a, b, c, d, e, f, g, h
Lübken, F.-J., Berger, U., and Baumgarten, G.: Stratospheric and solar cycle effects on long-term variability of mesospheric ice clouds, J. Geophys. Res.-Atmos., 114, D00I06, https://doi.org/10.1029/2009JD012377, 2009. a
Lübken, F.-J., Baumgarten, G., and Berger, U.: Long term trends of mesopheric ice layers: A model study, J. Atmos. Sol.-Terr. Phys., 214, 105378, https://doi.org/10.1016/j.jastp.2020.105378, 2021. a, b
Myers, J. and Well, A.: Research Design and Statistical Analysis, 2nd Edn., Hillsdale, NJ, Lawrence Erlbaum Associates, Psychology Press, https://doi.org/10.4324/9781410607034, 2003. a, b
Narayanan, V. L., Häggström, I., and Mann, I.: Effects of particle precipitation on the polar mesospheric summer echoes observed by EISCAT VHF 224 MHz radar, Adv. Space Res., 69, 3350–3361, https://doi.org/10.1016/j.asr.2022.02.015, 2022. a, b, c, d, e
Rapp, M. and Lübken, F.-J.: Polar mesosphere summer echoes (PMSE): Review of observations and current understanding, Atmos. Chem. Phys., 4, 2601–2633, https://doi.org/10.5194/acp-4-2601-2004, 2004. a, b, c, d, e
Rapp, M. and Thomas, G. E.: Modeling the microphysics of mesospheric ice particles: Assessment of current capabilities and basic sensitivities, J. Atmos. Sol.-Terr. Phys., 68, 715–744, https://doi.org/10.1016/j.jastp.2005.10.015, 2006. a
Rauf, A., Li, H., Ullah, S., Lin, M., Wang, B., and Wang, M.: Statistical study about the influence of particle precipitation on mesosphere summer echoes in polar latitudes during July 2013, Earth Planet. Space, 70, 108, https://doi.org/10.1186/s40623-018-0885-6, 2018a. a, b, c, d, e, f, g, h
Rauf, A., Li, H., Ullah, S., Lin, M., Wang, B., and Wang, M.: Investigation of PMSE dependence on high energy particle precipitation during their simultaneous occurrence, Advances in Space Research, 63, https://doi.org/10.1016/j.asr.2018.09.007, 2018b. a, b
Schäfer, B., Baumgarten, G., and Fiedler, J.: Small-scale structures in noctilucent clouds observed by lidar, J. Atmos. Sol.-Terr. Phys., 208, 105384, https://doi.org/10.1016/j.jastp.2020.105384, 2020. a, b, c, d, e, f, g
Shucan, G., Li, H., Xu, T., Zhu, M., Wang, M., Lin, M., Ullah, S., and Rauf, A.: Characteristics of the layered polar mesosphere summer echoes occurrence ratio observed by EISCAT VHF 224 MHz radar, Ann. Geophys., 37, 417–427, https://doi.org/10.5194/angeo-37-417-2019, 2019. a, b, c, d, e, f
Singer, W., Hoffmann, P., Grandhi, K. K., Mitchell, N., and Wendt, V.: Atmospheric Coupling by Gravity Waves: Climatology of Gravity Wave Activity, Mesospheric Turbulence and Their Relations to Solar Activity, Springer, 409–427, ISBN 978-94-007-4347-2, https://doi.org/10.1007/978-94-007-4348-9_22, 2012. a
Vellalassery, A., Baumgarten, G., Grygalashvyly, M., and Lübken, F.-J.: Long-Term Evolution in Noctilucent Clouds’ Response to the Solar Cycle: A Model-Based Study, Atmosphere, 15, 88, https://doi.org/10.3390/atmos15010088, 2024. a
Wilks, D.: Statistical Methods in the Atmospheric Sciences, 4th Edn., Academic Press, 100, 50–60, https://doi.org/10.1016/C2017-0-03921-6, 1995. a, b, c
Zhao, X. R., Sheng, Z., Shi, H. Q., Weng, L. B., and Liao, Q. X.: Long-Term Trends and Solar Responses of the Mesopause Temperatures Observed by SABER During the 2002–2019 Period, J. Geophys. Res.-Atmos., 125, e2020JD032418, https://doi.org/10.1029/2020JD032418, 2020. a


