the Creative Commons Attribution 4.0 License.
the Creative Commons Attribution 4.0 License.
 | 18 Apr 2023
Identifying gravity waves launched by the Hunga Tonga–Hunga Ha′apai volcanic eruption in mesosphere/lower-thermosphere winds derived from CONDOR and the Nordic Meteor Radar Cluster
Alexander Kozlovsky
Zishun Qiao
Witali Krochin
Guochun Shi
Johan Kero
Masaki Tsutsumi
Njål Gulbrandsen
Satonori Nozawa
Mark Lester
Kathrin Baumgarten
Evgenia Belova
Nicholas Mitchell
The Hunga Tonga–Hunga Ha′apai volcano eruption was a unique event that caused many atmospheric phenomena around the globe. In this study, we investigate the atmospheric gravity waves in the mesosphere/lower-thermosphere (MLT) launched by the volcanic explosion in the Pacific, leveraging multistatic meteor radar observations from the Chilean Observation Network De Meteor Radars (CONDOR) and the Nordic Meteor Radar Cluster in Fennoscandia. MLT winds are computed using a recently developed 3DVAR+DIV algorithm. We found eastward- and westward-traveling gravity waves in the CONDOR zonal and meridional wind measurements, which arrived 12 and 48 h after the eruption, and we found one in the Nordic Meteor Radar Cluster that arrived 27.5 h after the volcanic detonation. We obtained observed phase speeds for the eastward great circle path at both locations of about 250 m s−1, and they were 170–150 m s−1 for the opposite propagation direction. The intrinsic phase speed was estimated to be 200–212 m s−1. Furthermore, we identified a potential lamb wave signature in the MLT winds using 5 min resolved 3DVAR+DIV retrievals.
- Article
(6091 KB) - Full-text XML
- BibTeX
- EndNote


On 15 January 2022 at 04:15 UTC the Hunga Tonga–Hunga Ha′apai volcano erupted in the Pacific. Already one week after the explosion, it was assessed as a one-in-a-thousand-year event (Klein, 2022), although later studies suggest that it was comparable to the Krakatau eruption in 1883 (Matoza et al., 2022). Signatures of the volcanic event are found in various observations from the surface to space (Wright et al., 2022). Because of the unique nature of the Hunga Tonga–Hunga Ha′apai volcano (due to its underwater eruption), it released an enormous amount of water vapor into the stratosphere that was transported with the vertical plume up to 50–55 km above the Earth's surface (Carr et al., 2022).
Furthermore, the Hunga Tonga–Hunga Ha′apai volcano launched various atmospheric and seismoacoustic waves traveling around the Earth (Matoza et al., 2022). The volcanic activity was registered over several weeks by infrasound stations of the International Monitoring System (IMS) before the main eruption in January occurred. These sensors revealed a complex eruption sequence, reaching a peak magnitude M of 5.7 to 5.8 on 15 January 04:15:45 UTC, and a final major volcanic explosion occurred at 08:31 UTC on the same day (Matoza et al., 2022). Superpressure balloons from the French space agency (CNES) flying over the Pacific also recorded the infrasound signal at the stratosphere. So far, most of the attention was drawn by the lamb wave excited during the strongest explosion (Wright et al., 2022; Matoza et al., 2022). In particular, ionospheric disturbances due to the lamb wave seen in total electron content (TEC) maps were reported in several studies (Themens et al., 2022; Heki, 2022; Yamada et al., 2022; Otsuka, 2022; Zhang et al., 2022). Based on the TEC data, the phase speed of the lamb wave was estimated to be around 310 m s−1 (Wright et al., 2022; Heki, 2022; Yamada et al., 2022; Zhang et al., 2022). However, at the F-region altitudes, phase velocities in excess of 900 m s−1 were documented using Global Navigation Satellite System (GNSS) TEC data gathered above New Zealand (Themens et al., 2022).
Besides TEC and infrasound measurements, the volcanic eruption was also visible in other atmospheric sensors such as the brightness temperatures measured from satellites e.g., AIRS, CrIS, and IASI, as well as in airglow images over Hawaii (Wright et al., 2022). These observations also showed that the lamb wave was followed by gravity waves traveling at slower phase speeds around the globe. In this study, we analyze high-resolution wind observations obtained from the multistatic meteor radar network CONDOR (Chilean Observation Network De Meteor Radars) and the Nordic Meteor Radar Cluster at the mesosphere/lower-thermosphere (Stober et al., 2021a). We found gravity wave amplitudes of up to 45–50 m s−1 in the zonal wind component above CONDOR and gravity wave amplitudes of 30 m s−1 for the zonal and meridional components above the Nordic Meteor Radar Cluster.
Multistatic meteor radar observations provide a powerful experimental tool to investigate transient events like the Hunga Tonga–Hunga Ha′apai volcanic eruption in the mesosphere/lower-thermosphere (MLT) winds. Such networks have already proven to provide valuable information about the spatial variability of winds to investigate gravity wave properties from airglow (Sarkhel et al., 2022). Due to the much higher number of meteor detections within each meteor radar network and due to angular diversity over large domain areas, these networks permit us to resolve the spatial and temporal variability related to the fast-traveling gravity waves that were caused by the sequence of major volcanic explosions. MLT winds were derived for CONDOR and the Nordic Meteor Radar Cluster (abbreviated “Nordic” in figure labels) using a 3DVAR+DIV retrieval (Stober et al., 2022) with a temporal resolution of 10 min, using a 20 min window with a Gaussian weighting (Gudadze et al., 2019). The vertical resolution was 2 km with a 2.5 km oversampling centered at each reference altitude between 80–100 km. The increased vertical averaging kernel seemed to be appropriate when considering the long vertical wavelength of the gravity wave packet (λz>110 km) (Wright et al., 2022). The spatial domain remained unchanged from the Cartesian grid of 30×30 km that was already used in other studies for both domains (Stober et al., 2021a, 2022).
Furthermore, we performed benchmark analyses with temporal resolutions of 5 and 3 min using CONDOR observations. The 3 min temporal resolution analysis was configured with a grid cell size of 40×40 km. However, the averaging kernels suggested an effectively larger spatial averaging (Shannon, 1948; Stober et al., 2021a); thus, these data did not provide statistically significant results about the lamb wave or the volcanic gravity wave packet. A comparison of the zonal and meridional instantaneous wind and the domain-averaged winds for both high-resolution retrievals can be found in Appendix A1. Sustaining a spatial resolution of 30×30 km, the best achievable temporal resolution for CONDOR was 5 min. A similar analysis for the Nordic Meteor Radar Cluster resulted in wider averaging kernels and, thus, damping of all small-scale structures, which essentially would also inhibit the detection of the lamb wave.
The data analysis for the Nordic Meteor Radar Cluster involves all four meteor radars, located on the mainland in Norway at Tromsø (TRO) and Alta (ALT) as well as in Sweden at Kiruna (KIR) and in Finland at Sodankylä (SOD). The volcanic eruption happened during a time of the year where the sporadic meteor influx rate is close to its seasonal minimum, which posed a challenge for the retrieval to handle such extremely sparse measurements. CONDOR (ALO) was in normal operation with both remote receiver systems at the Southern Cross Observatory (SCO) and at Las Campanas Observatory (LCO) providing high-quality data. During this time of year, there is no additional need to treat the forward-scatter bias that was identified in Stober et al. (2022). A summary of all technical details of the experiments and the locations of the main transmitters can be found in Table 1.
Table 1Technical parameters of the Nordic Meteor Radar Cluster (TRO, ALT, KIR, SOD) and CONDOR (ALO). Note that PRF represents pulse repetition frequency.
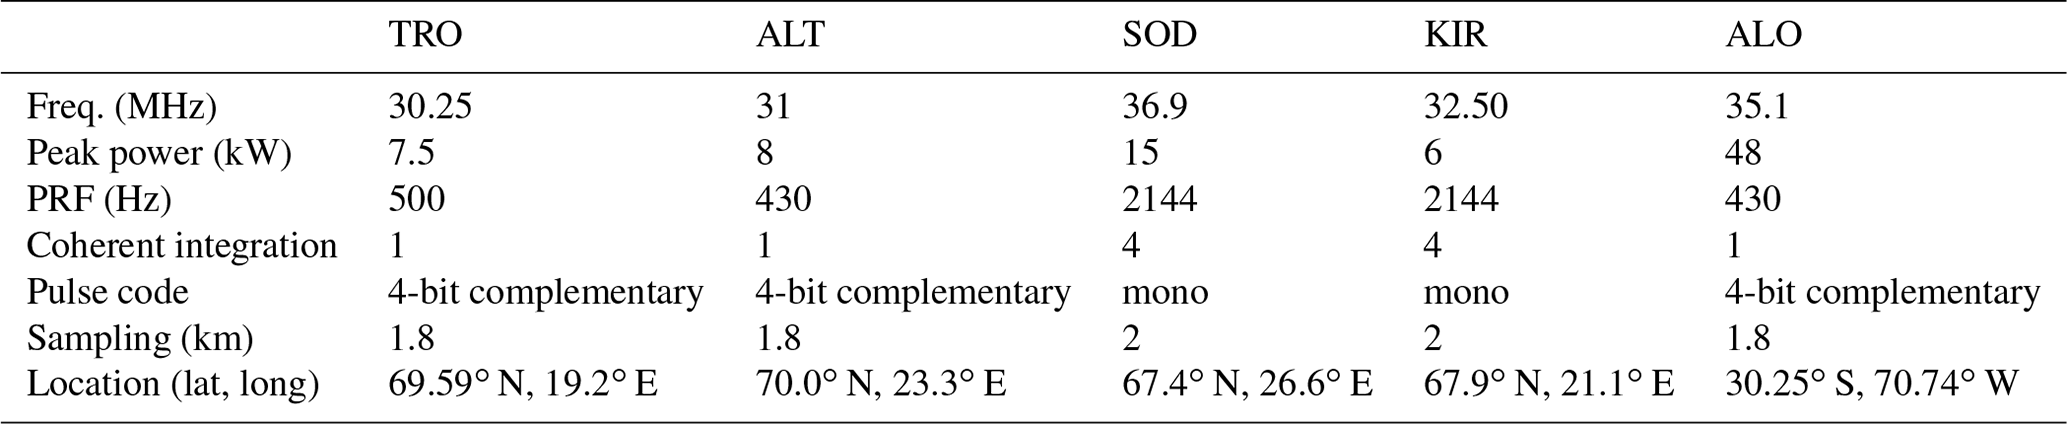
Figure 1 shows a Robinson projection of the globe centered on the Pacific. The Hunga Tonga–Hunga Ha′apai volcano is found at geographic coordinates 20.54∘ S, 175.38∘ W. The solid red line denotes a great circle from the volcano to the center of the CONDOR multistatic network. The dashed red line illustrates the long path of the same great circle but in reversed direction. The solid blue line represents the shortest great circle distance to the Nordic Meteor Radar Cluster, whereas the yellow line labels the long path passing over Antarctica.
The distance between the volcano and CONDOR along the great circle is about 10 485 km at the Earth surface. The Nordic Meteor Radar Cluster is over 14 963 km away from the explosion site in the Pacific. Furthermore, it is obvious that the wavefront struck the Chilean coast from an almost zonal direction and; thus, the strongest response of the MLT winds would be expected in the zonal direction above CONDOR. The gravity wavefronts arrived from the northeast and southwest directions at the Nordic Meteor Radar Cluster.
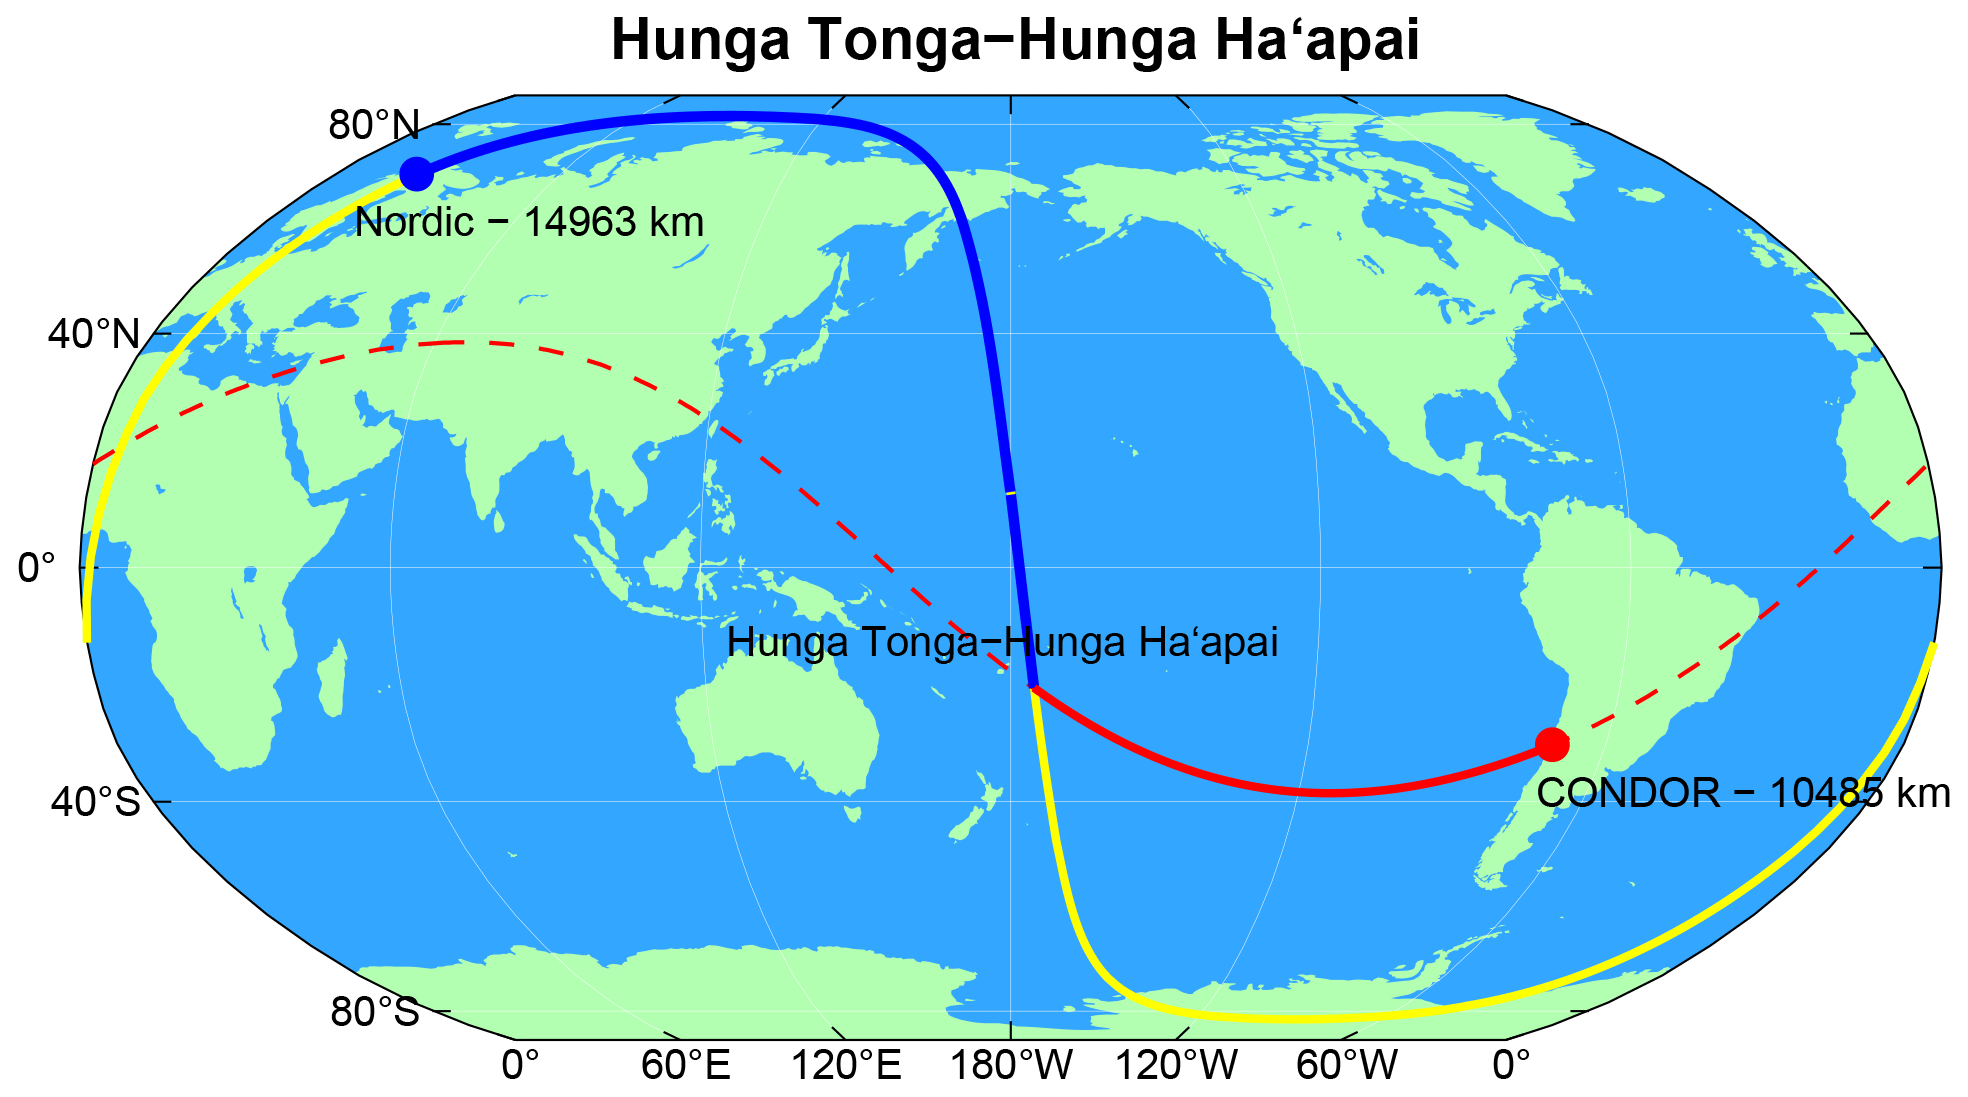
Figure 1Robinson projection of the globe centered on the Pacific. The solid red line shows the shortest great circle distance between the volcanic eruption and the center of CONDOR. The dashed red line reflects the opposite path along the same great circle. The blue line shows the shortest great circle path from the volcano to the Nordic Meteor Radar Cluster. The yellow line denotes the long path.
Figure 2 shows altitude–time plots of the zonal and meridional winds for both multistatic networks. These winds were taken from a single grid cell or pixel out of the entire domain centered at geographic coordinates 29.91∘ S, 71.52∘ W for CONDOR and 69.0∘ N, 22.0∘ E for the Nordic Meteor Radar Cluster. Both locations were selected to ensure a good measurement response (mr > 0.6) for most observations and both wind components (Stober et al., 2022). Hence, these winds represent the instantaneous small-scale wind variability for a single grid cell. The first vertical black line indicates the time of the eruption. The other vertical lines embrace the times when we identified the gravity wave signature associated with the volcanic explosion in each network for the eastward and westward great circle propagation.
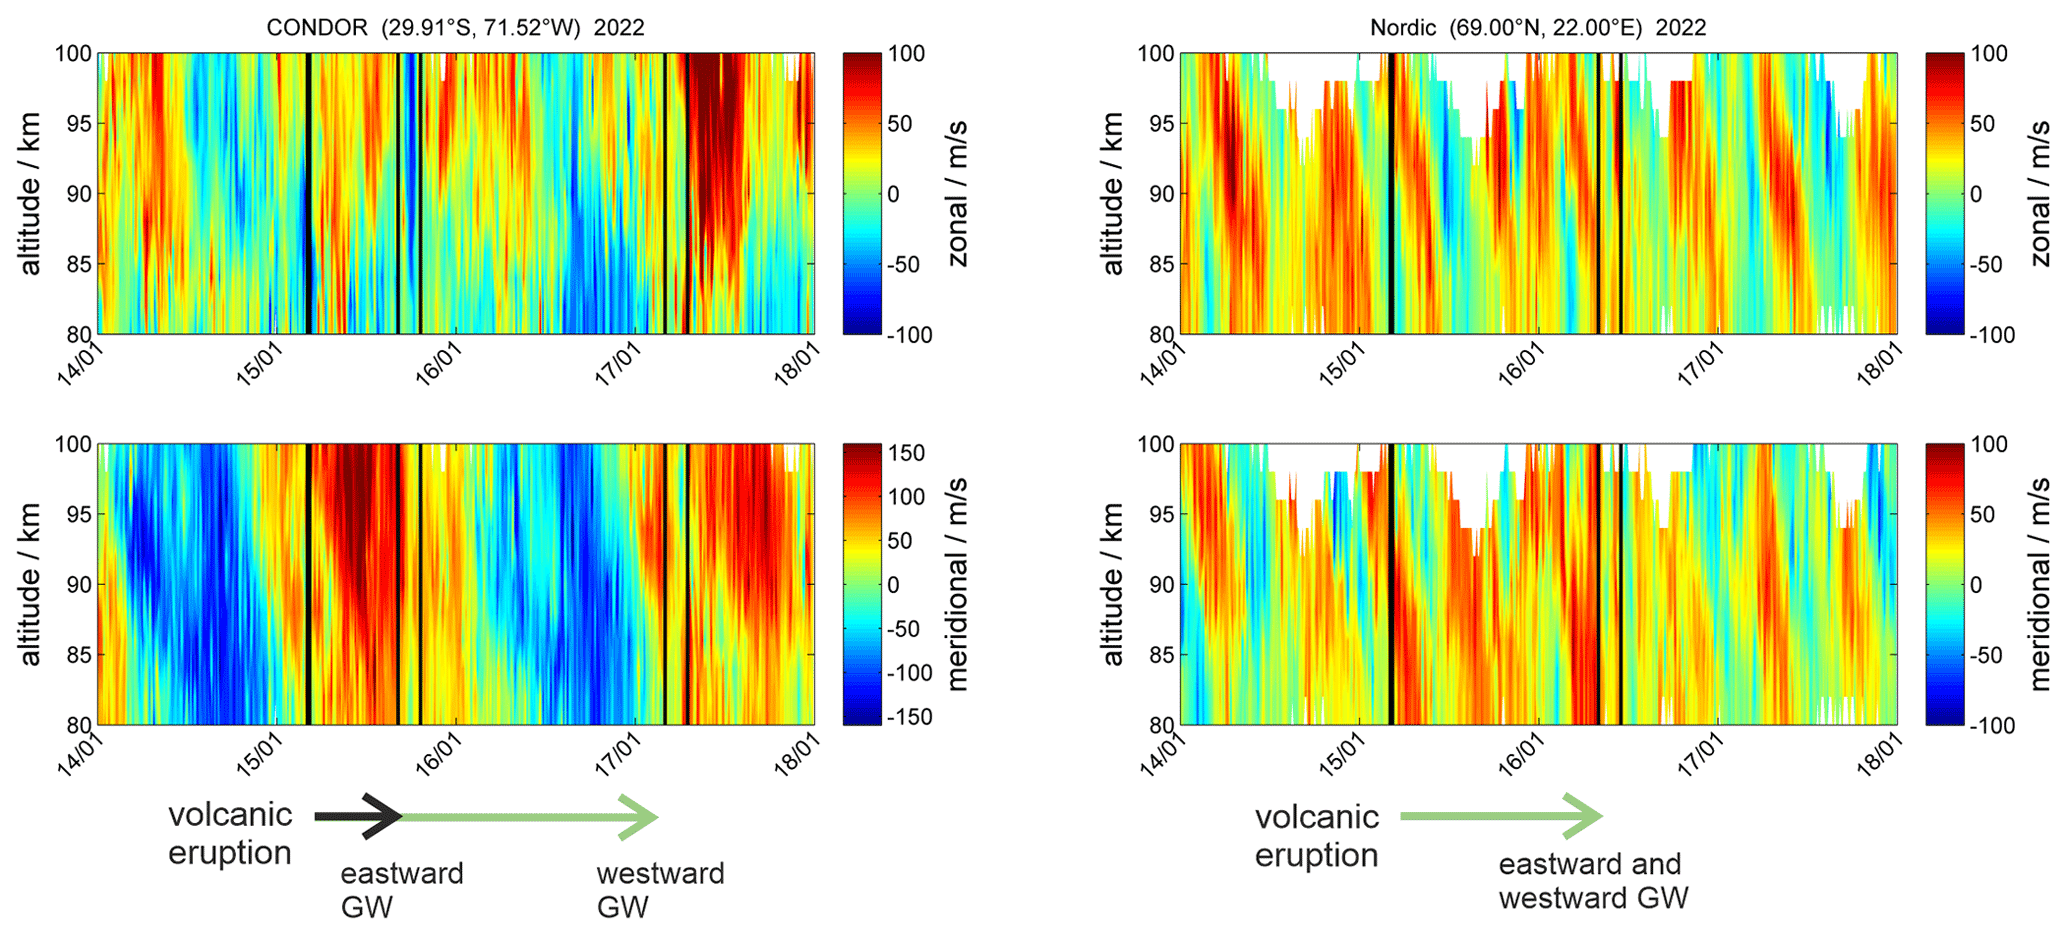
Figure 2Zonal and meridional winds obtained by the 3DVAR+DIV algorithm above CONDOR and the Nordic Meteor Radar Cluster with a temporal resolution of 10 min. The first solid vertical black line indicates the time of the main eruption on 15 January 2022 at 04:15 UTC. The dark grey lines embrace the signature of the volcanic gravity wave (GW) signature in each domain. Horizontal arrows emphasize the time of the volcanic eruption and the arrival times of the eastward- and westward-propagating gravity waves for both meteor radar networks.
CONDOR instantaneous winds are dominated by all types of large- and small-scale atmospheric variability. Above CONDOR, the meridional wind exhibits values of more than 160 m s−1. The horizontal wind speed exceeds 180 m s−1 during this period, which is the highest atmospheric wind velocity that was observed so far at the MLT, and it even exceeds the wind speeds observed during a mesospheric bore event in central Europe (Smith et al., 2017). The meridional wind component reveals a strong quasi-2-day wave (Q2DW). The Q2DW occurrence is typical for this time of year as well as the presence of diurnal tidal activity (Stober et al., 2021b). Another important aspect is that above CONDOR the morphologies of the zonal and meridional winds exhibit a significant difference concerning the Q2DW amplitude in each wind component. Winds above the Nordic Meteor Radar Cluster reflect the typical midwinter situation. There is a weak prevailing eastward zonal flow, and both wind components are characterized by a semidiurnal tide and some gravity wave activities (Wilhelm et al., 2019).
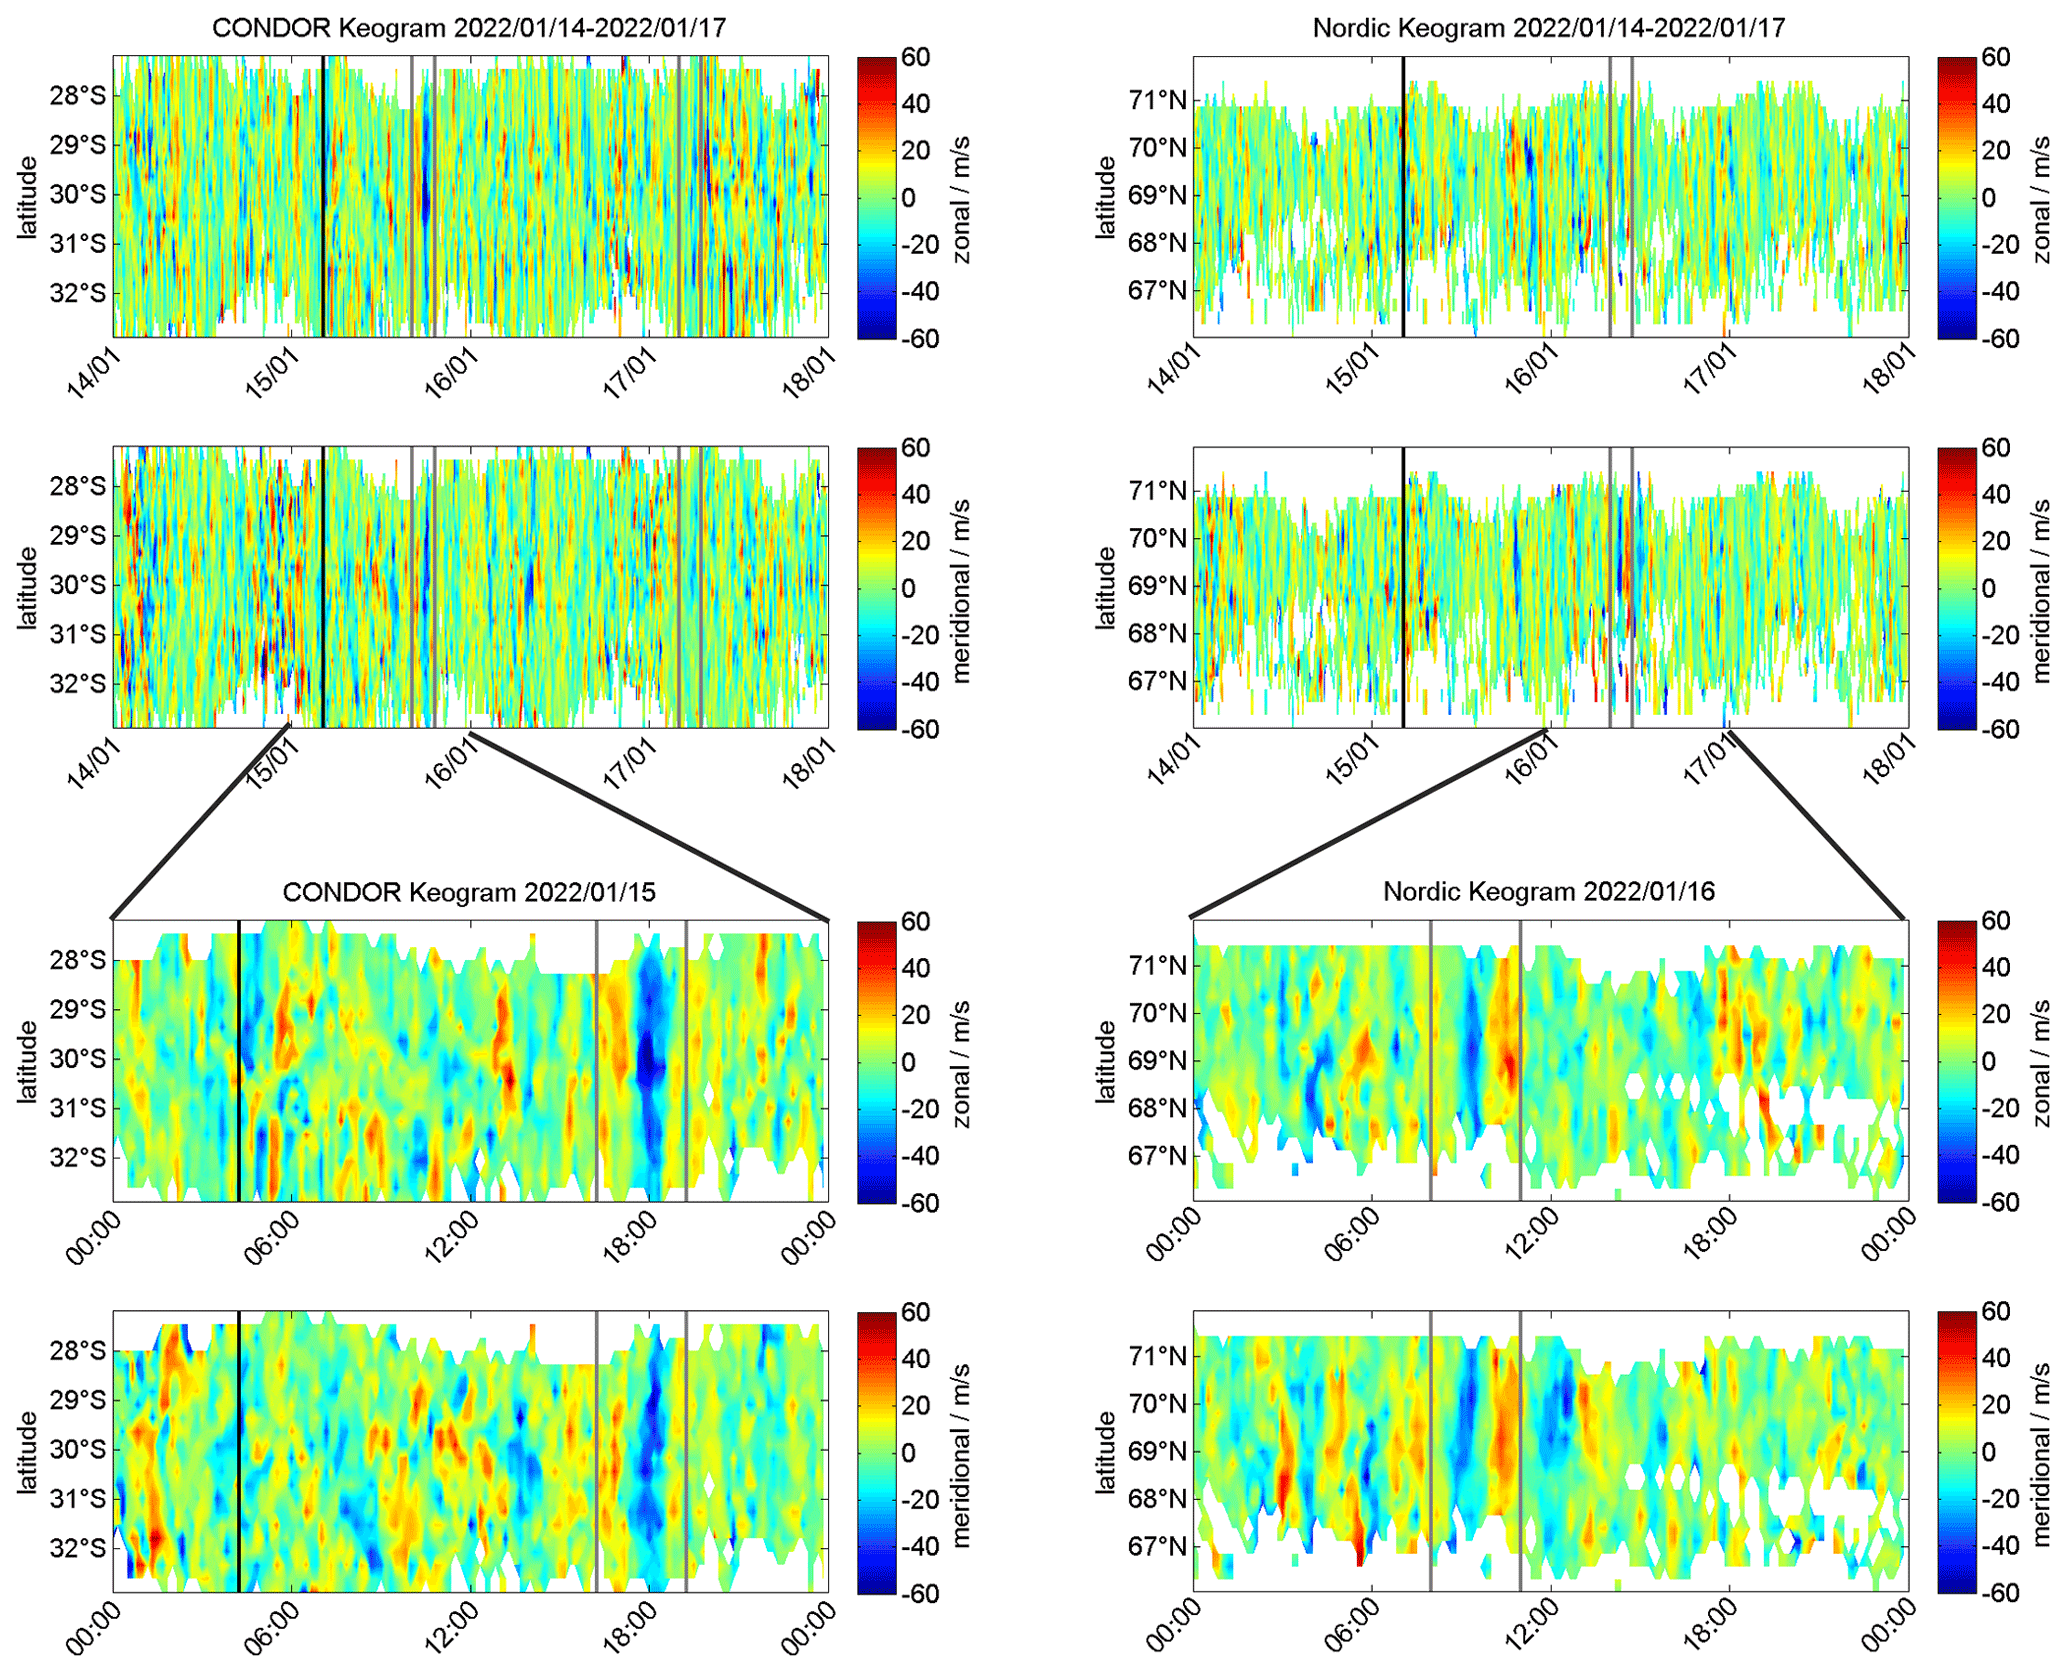
Figure 3Latitudinal keograms of the vertical average zonal and meridional winds for both domains (upper panels). The lower panels represent shorter-time sections of the first event above CONDOR and the one event at the Nordic Meteor Radar Cluster. Vertical lines are explained in the caption of Fig. 2.
Given the great variability of the instantaneous winds at both sites, we tried to minimize the impact of all other atmospheric oscillations with periods larger than 4 h and vertical wavelengths (λh) shorter than 20 km. Therefore, we subtracted a background wind by using a 4 h running mean and integrated the residuals over all available vertical levels. The temporal filter essentially removes the planetary wave and tidal background, and the vertical integration suppresses gravity waves with shorter vertical wavelengths. We performed this filtering for each grid cell separately to avoid contamination by excessively large spatial averaging since the volcano-generated gravity waves have very high phase velocity (Wright et al., 2022). Assuming a 250 m s−1 phase velocity results in a horizontal propagation of the gravity wavefront of 150 km within our temporal resolution of 10 min or about 5 grid cells in our 3DVAR+DIV domain (Stober et al., 2022).
Keograms of the residual wind fluctuations for both wind components above CONDOR and the Nordic Meteor Radar Cluster are shown in Fig. 3. Again, the vertical black lines denote the time of the eruption, and the other vertical grey lines embrace the corresponding gravity wave responses in each observation domain. The two lower panels show temporally zoomed keograms around the time when the gravity wave packet passed over CONDOR or the Nordic Meteor Radar Cluster. CONDOR reflects a strong zonal and meridional anomaly that extends over all latitudes of the domain, which is consistent with an almost zonally propagating phase front. Furthermore, the zonal wind component exhibits a higher amplitude compared to the meridional component. In the Northern Hemisphere, mesospheric winds indicate a wavefront that arrived first from the southwest direction in the Nordic Meteor Radar Cluster measurements. The meridional wind component clearly shows a tilt, indicating that one volcanic gravity wave packet entered the observational domain from the southwest direction. However, at the same time, we found indications of a gravity wave packet arriving from the northeast when selecting another longitude as a reference (data not shown). In addition, the wind anomaly that is associated with the volcanic eruption reached the same amplitude in both wind components, which is consistent with the great circle propagation of the gravity wave phase front.
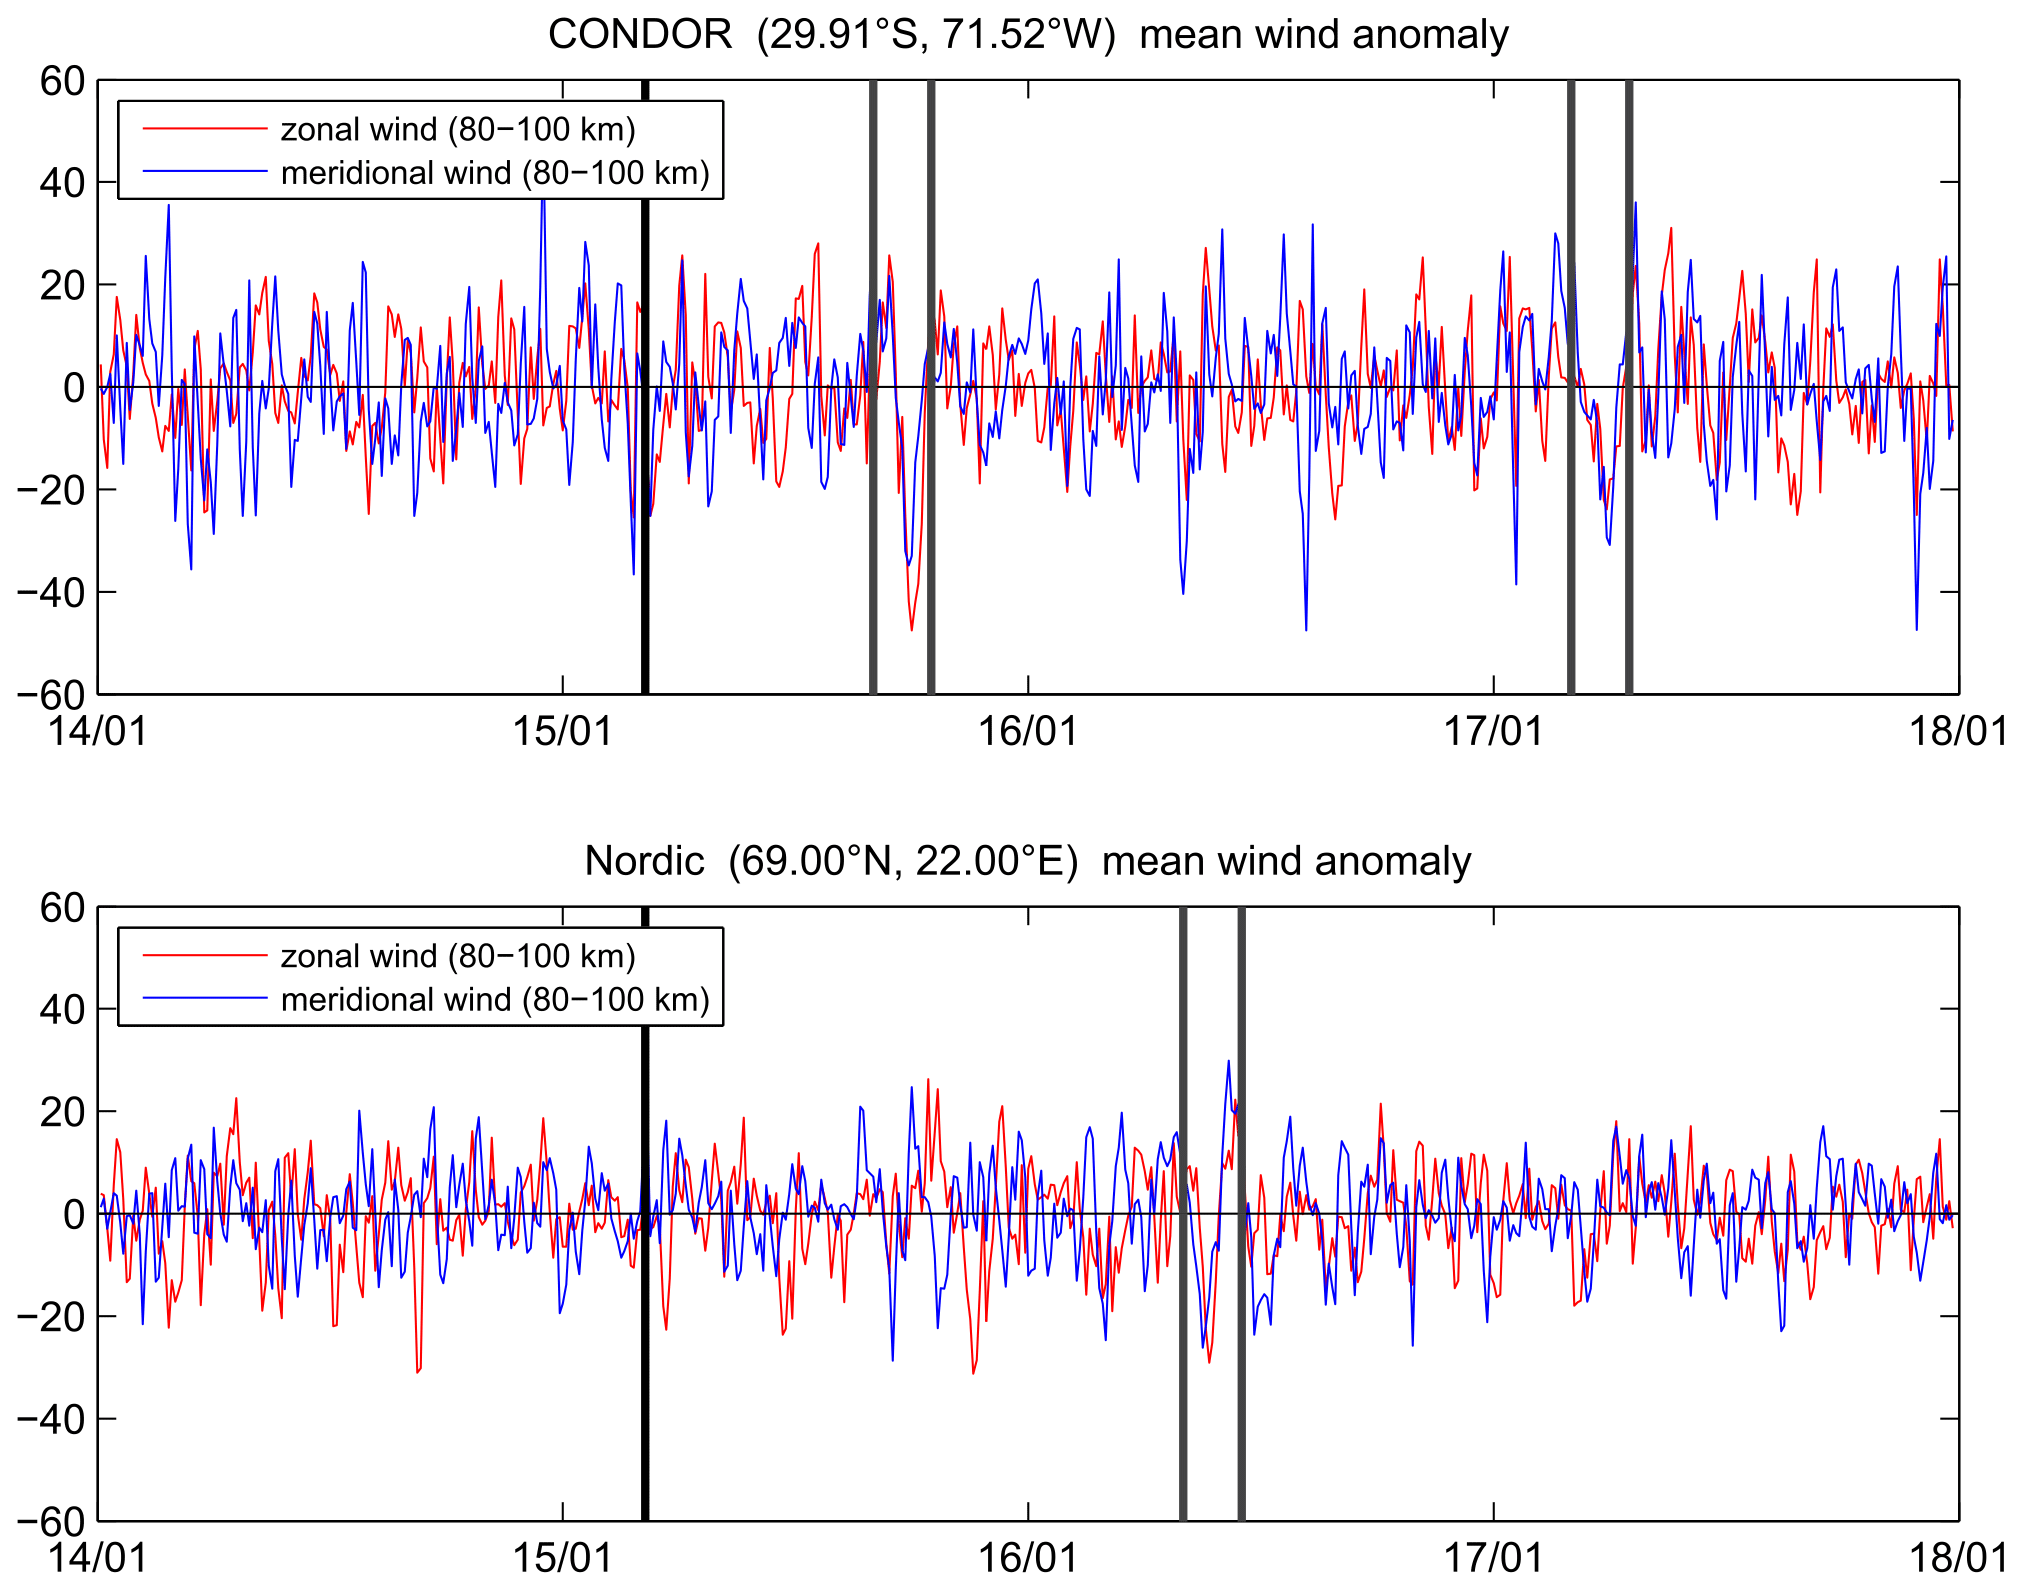
Figure 4Zonal and meridional wind anomalies for two 30×30 km grid cells centered at the geographic coordinates of CONDOR (29.91∘ S, 71.52∘ W) and the Nordic Meteor Radar Network (69.0∘ N, 22.0∘ E), respectively, both averaged between 80–100 km altitude after removing a 4 h running mean. The vertical lines are explained in the caption of Fig. 2.
Finally, we analyzed the time series of zonal and meridional wind anomalies for a single grid cell. Figure 4 shows the zonal and meridional wind components for CONDOR and the Nordic Meteor Radar Cluster. These winds were vertically integrated using all available measurements between 80–100 km in the given grid cell. The time of the eruption is indicated by a thick vertical black line, and the volcanic gravity wave signature is embraced by the vertical dark grey lines. These plots show amplitudes of 50 m s−1 for the zonal component and about 35 m s−1 for the meridional wind in the CONDOR observations. The Nordic Meteor Radar Cluster data show almost equal magnitudes for both wind components of 30 m s−1.
We also used these data to determine the time of arrival of the first indication of the gravity wave above each observational domain. The first gravity wave packet at CONDOR, traveling along the short great circle path in an eastward direction, arrived 12 h after the eruption of the volcano. The wavefront propagating in the opposite direction along the great circle (westward) reached the CONDOR location 48 h after the major volcanic explosion. We estimated a mean propagation velocity of the gravity wavefront of about 252±15 m s−1 for the eastward great circle path and an average velocity of about 175±15 m s−1 for the westward path, which indicates that the wave packet was slower in the westward direction, traveling a distance of approximately 29 590 km.
Winds obtained from the Nordic Meteor Radar Cluster exhibit the first signs of the volcano-triggered gravity wave at approximately 27.75 h after the eruption. This corresponds to an observed propagation speed of the gravity wavefront of about 150±15 m s−1 along the blue line (westward great circle route) in Fig. 1 and an observed gravity wave velocity of 250±15 m s−1 for the yellow (eastward) great circle path.
Furthermore, we estimated the intrinsic gravity wave phase speed when assuming that the wave encounters a mean effective head or tail wind along the great circle path, depending on its propagation direction. The resulting intrinsic phase speed for CONDOR is about ci=212 m s−1 (mean eastward wind of 37 m s−1), and for the Nordic Meteor Radar Cluster, we obtain an intrinsic phase velocity of ci=200 m s−1 (mean eastward wind of 50 m s−1). In addition, we determined the observed wave periods from the CONDOR observations. Using a similar argument as for the intrinsic phase speed, we also estimated the horizontal wavelength to be λh=1600–2000 km, leveraging the differences in the observed periods between both wave packets arriving above CONDOR. The first wave packet that arrived above CONDOR showed an observed period of 2 h to 2 h 20 min, and the wave packet traveling around the Earth along the opposite direction exhibited a period of 2 h 40 min to 3 h when it, again, was visible in the CONDOR winds. Based on these periods and intrinsic phase speed, we derived a coarse estimate of the horizontal wavelength of λh=1600–2000 km, which is much larger than both of our multistatic meteor radar networks. Longitudinal keograms through our domains only allow for estimating a lower limit of the horizontal wavelength of λh>1000 km.
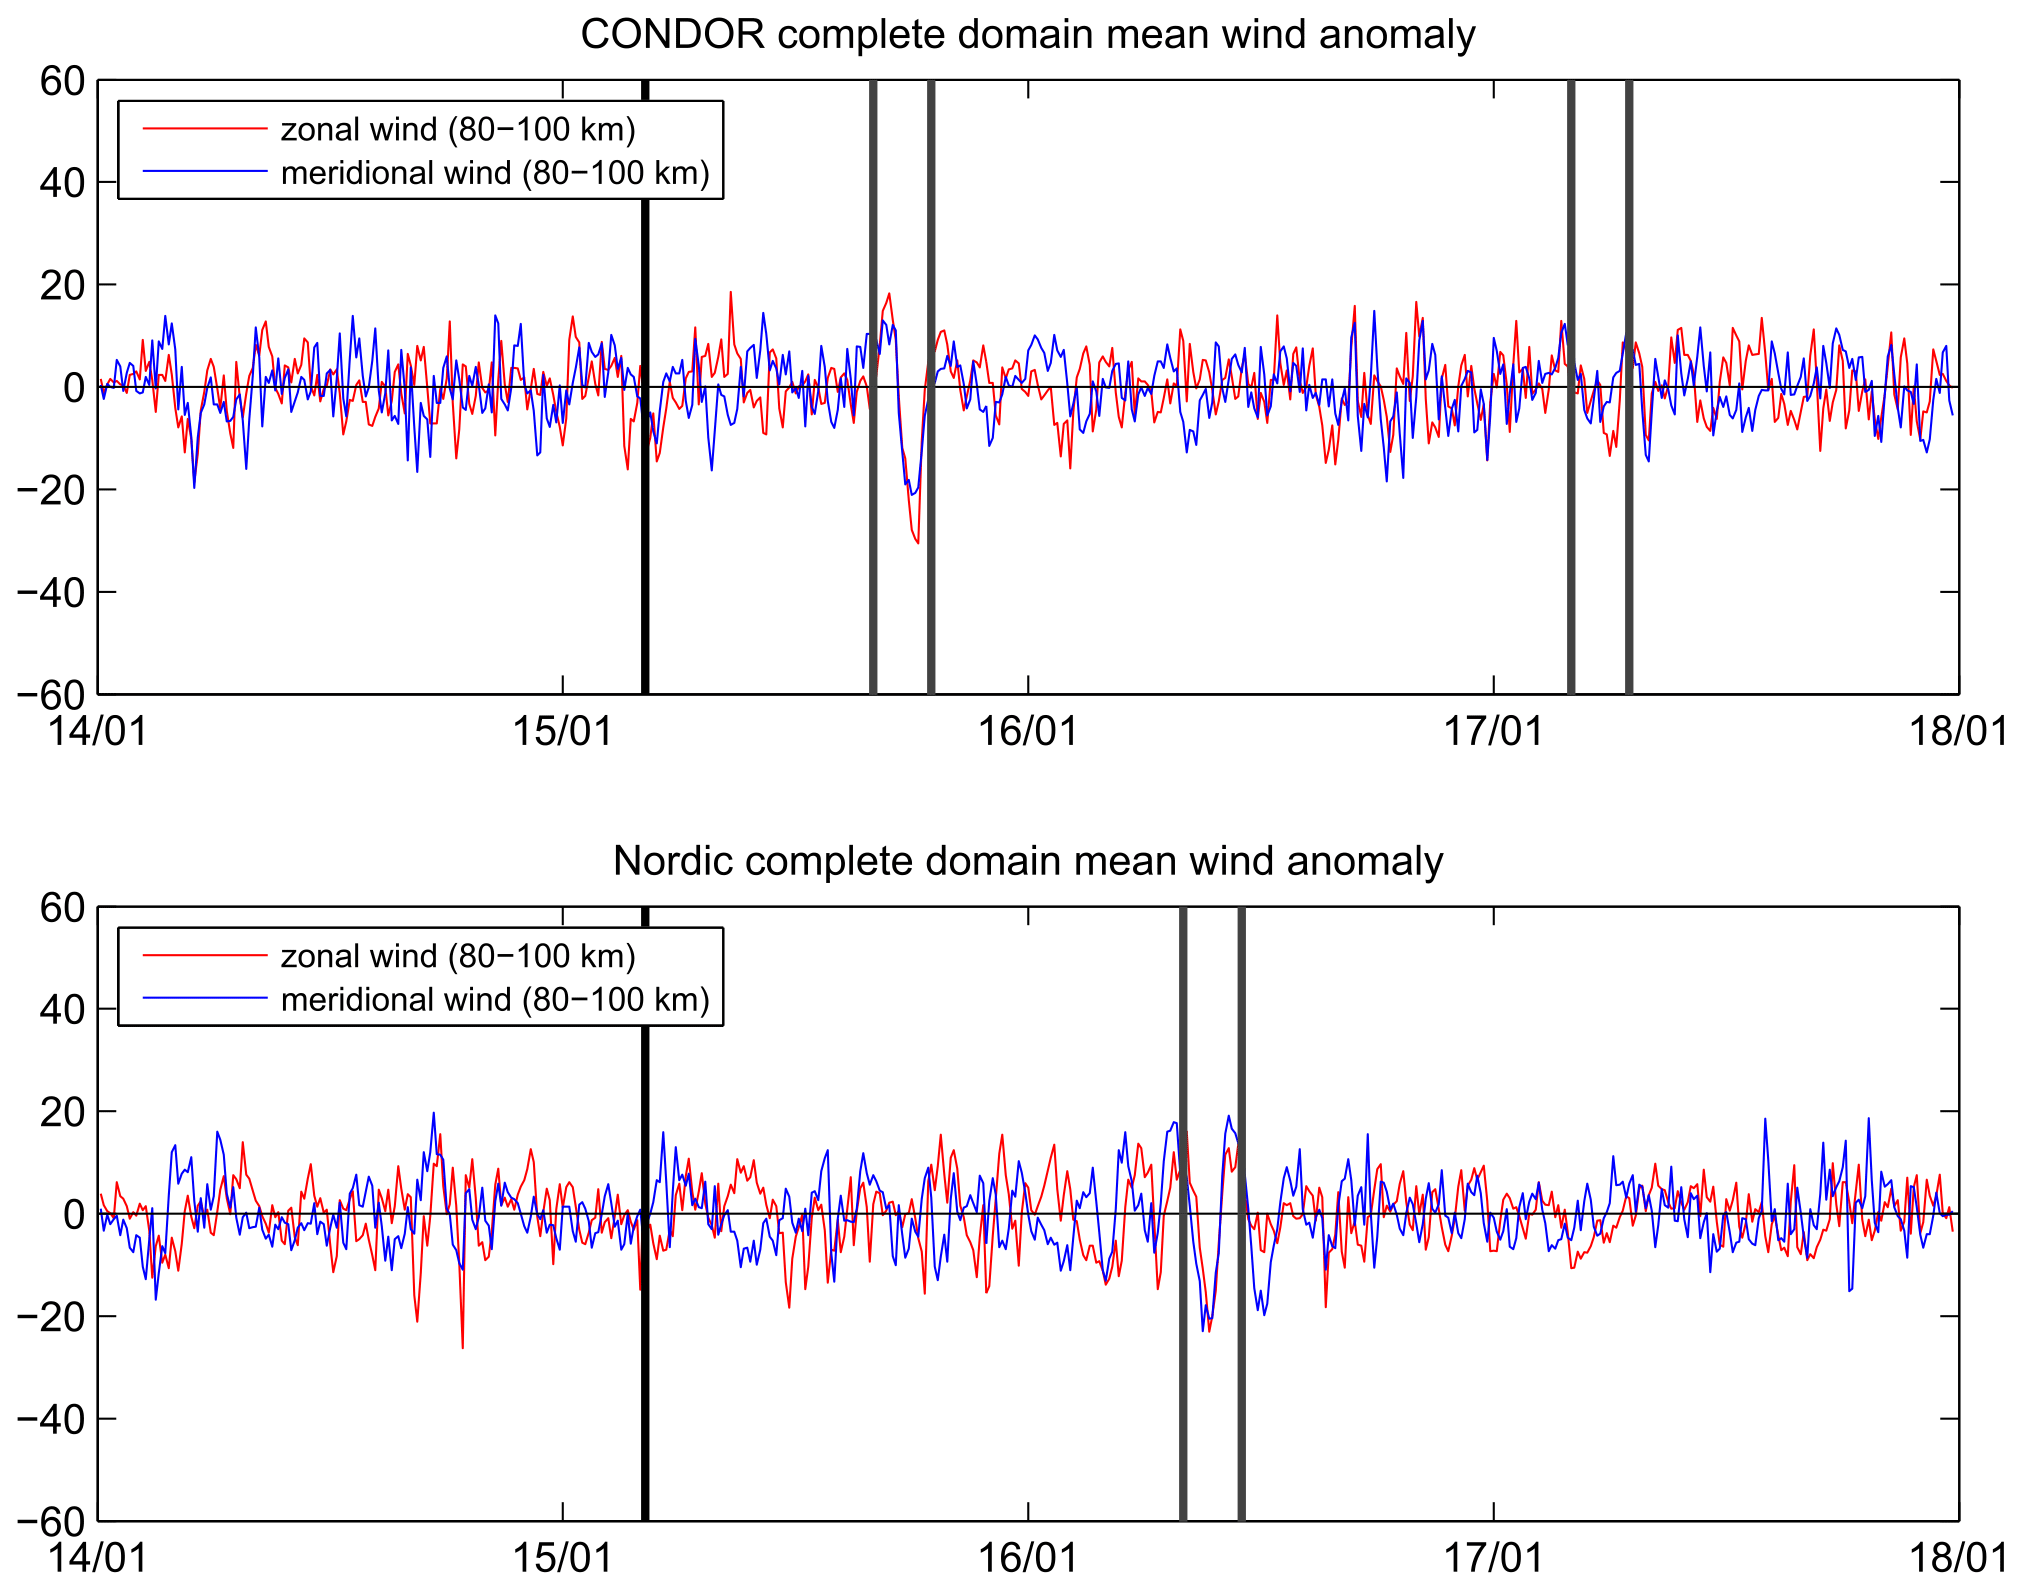
Further averaging over the whole domain substantially reduces the remaining pixel noise due to small-scale gravity waves that are still visible in Fig. 4. Figure 5 presents the domain-integrated (averaged) zonal and meridional winds. As expected, the variability of both wind components is much reduced for all waves with shorter horizontal and vertical scales. However, it is still possible to identify the volcano-caused gravity wave with a 25 % reduced maximum amplitude. CONDOR shows a very similar morphology for the first wavefront that propagates eastward but a less clear signature for the other propagation direction, which was more pronounced in the single-pixel data. On the other hand, the Nordic Meteor Radar Cluster winds even exhibit a much more clear gravity wave signature associated with the volcanic eruption. It appears that for the domain-integrated anomalies, the event lasts longer than in the single grid cell time series. Considering that the Nordic Meteor Radar Cluster has a much wider longitudinal coverage compared to CONDOR, this implies that indeed the eastward and westward gravity waves arrived almost at the same time above the Fennoscandian observational domain.
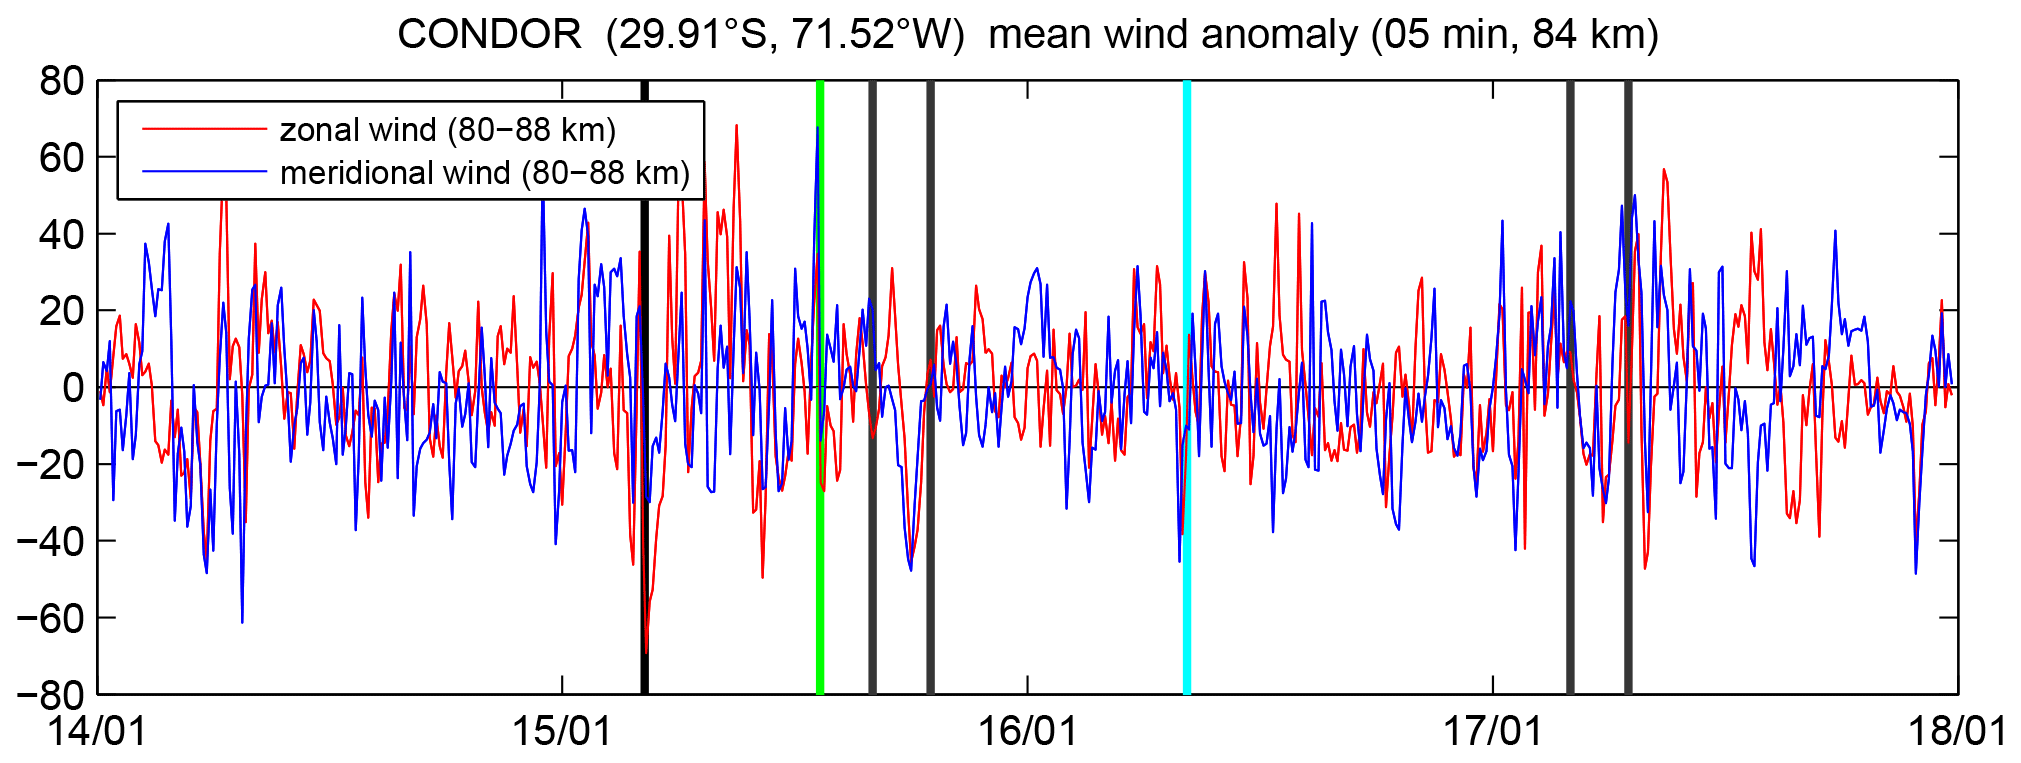
Finally, we investigated the high-temporal-resolution 3DVAR+DIV retrieval to identify a potential signature of a potential lamb wave in the CONDOR winds. We computed the lamb wave arrival times by assuming a horizontal propagation velocity of 310 m s−1 (Matoza et al., 2022; Wright et al., 2022). Figure 6 illustrates the vertically integrated time series of the zonal and meridional winds. The green and cyan vertical lines visualize the theoretical arrival times of the lamb wave along the great circle within the CONDOR observation volume in eastward and westward directions, respectively. Both times coincide with rather sharp and short peaks in the zonal and meridional wind components. However, considering the speed of the sound barrier in the mesosphere, it is expected that a lamb wave excited at the Earth's surface or troposphere can penetrate a bit into an evanescent region due to its long vertical wavelength but rapidly decays with increasing altitude. Therefore, we repeated the analysis for the altitude region between 80–88 and 90–100 km separately. Indeed, we found only a coherent lamb wave signature in the zonal and meridional wind for the lower altitudes and a more random and irregular behavior above.
On the other side, the time series also exhibits many other similar peaks even before the eruption, which makes it hard to unambiguously identify these signatures as the lamb wave that was caused by the volcanic eruption. Interestingly all of these narrow peaks disappear in the domain-averaged time series, which suggests that these are caused by small-scale very localized structures with a long vertical wavelength (λz≫20 km).
Many previous publications focused on the lamb wave and estimated its propagation velocity to be on the order of 310 m s−1 (Wright et al., 2022; Otsuka, 2022; Yamada et al., 2022; Matoza et al., 2022) at the troposphere and thermosphere. However, the multistatic meteor radar MLT winds did not indicate a detectable signature or response corresponding to such a fast-propagating lamb wave. Thus, we identified only the volcano-triggered gravity wave packet in the winds above CONDOR and the Nordic Meteor Radar Cluster. The speed of sound at the mesosphere, cs, is approximately cs=296.8 m s−1 for T=220 K (mesospheric mid- to high-latitude winter conditions) or cs=236.8 m s−1 for T=140 K (mesospheric mid- to high-latitude summer conditions). These values present a natural barrier for the intrinsic propagation velocity of gravity waves and lamb waves (Wright et al., 2022). A more detailed theoretical discussion of the vertical change in the speed of sound due to a change in the atmospheric temperature and its impact on the vertical propagation of atmospheric waves is given in Heale et al. (2022). Thus, the mesosphere presents an evanescent region for both waves. In this study, we derived a first estimate of the intrinsic phase speed of ci=200–212 m s−1 for the volcanic gravity wave, assuming mean (eastward) winds along the propagation path and considering the different arrival times between the westward- and eastward-traveling gravity wavefronts. This intrinsic phase speed is still very high but well below the sound barrier.
An unambiguous identification of the lamb wave seems to be unfeasible from the current data that are available at CONDOR and the Nordic Meteor Radar Cluster. Cold mesospheric temperatures reduce the speed of sound so that the tropospheric and stratospheric lamb wave would become supersonic at the mesosphere/lower-thermosphere. However, due to the very long vertical wavelength, which is by definition for a lamb wave λz→∞ or m=0, it might be possible for the wave to enter into the mesosphere to a certain extent before the wave amplitude finally is damped and decays. Leveraging the benchmark high-temporal-resolution 3DVAR+DIV retrieval for CONDOR, we were able to link two sharp and short-lived peaks to the predicted arrival times of the lamb wave by assuming great circle propagation in the eastward and westward directions. The velocity was assumed to be identical to the infrasound signal and stratospheric observations (Matoza et al., 2022; Wright et al., 2022). Based on our observations, we can almost rule out that the primary lamb wave that was caused by the volcanic eruption reached the upper atmosphere. Thus, the thermospheric/ionospheric observations are likely the result of multistep vertical coupling processes as described in Becker and Vadas (2018), Vadas and Becker (2018), and Vadas et al. (2018). However, the wind measurements indicated several other signals exhibiting a similar morphology, and the lifetimes of other peaks in the winds could not be linked to the lamb wave excited by the Hunga Tonga–Hunga Ha′apai eruption. On the other hand, this is perhaps not surprising given that de-orbiting objects such as space debris as well as large meteoroids sometimes cause similar shock waves during their re-entry. However, this hypothesis remains speculative and cannot be verified with the currently available observations.
Due to the different propagation velocities of the eastward- and westward-traveling volcanic gravity waves along the great circle path around the Earth, both wavefronts arrived at the same time in the observation volume of the Nordic Meteor Radar Cluster, which explains why only one signature of these waves are found in the wind observations. This interpretation is also supported by Fig. 5. The domain-integrated signal, which covers all longitudes, reveals a clear double structure of the gravity wave signature corresponding to different arrival times at different longitudes. Furthermore, the good agreement of the derived intrinsic phase speed between CONDOR and the Nordic Meteor Radar Cluster provides additional confidence that the eastward- and westward-propagating wavefronts arrived at the same time above Fennoscandia.
Other intrinsic wave parameters such as the horizontal or vertical wavelength were derived using additional assumptions about the mean winds along the propagation path. This can only be verified by global simulations with high-resolution models. We derived a coarse estimate of the horizontal wavelength λh=1600–2000 km, which is much larger than both meteor radar network observation volumes. We also investigated longitudinal keograms of both domains to determine a lower limit for horizontal wavelengths of λh>1000 km. The vertical wavelength is more challenging due to the altitude coverage of MLT winds being limited to between 80–100 km. Considering that the observed gravity wave phase speeds in the stratosphere reported by Wright et al. (2022) are in agreement with the meteor radar wind observations, it is reasonable to assume that the vertical wavelength has to be large, i.e., λz>110 km.
The Hunga Tonga–Hunga Ha′apai volcanic eruption triggered various atmospheric waves. In this study, we identified volcano-triggered gravity waves in MLT winds using observations from CONDOR and the Nordic Meteor Radar Cluster. The data were analyzed with a 3DVAR+DIV retrieval which allowed for an unprecedented temporal resolution of 10 min while sustaining a spatial resolution of 30×30 km to assess the MLT wind response caused by the volcanic explosion. We demonstrated the capability of such multistatic networks to observe volcanic gravity wave signatures after propagating a large distance of a few thousand kilometers around the Earth.
CONDOR winds exhibited a gravity wave signature for the westward and eastward great circle paths with amplitudes of about 50 and 30 m s−1, respectively. By chance, the eastward- and westward-propagating gravity wave packets arrived at the same time within the Nordic Meteor Radar Cluster observation volume and showed amplitudes of 25–30 m s−1. A potential signature of the lamb wave was found in the vertical integrated zonal and meridional wind time series using a temporal resolution of 5 min for the 3DVAR+DIV retrieval. The predicted theoretical arrival time of the lamb wave coincides with two peaks in the zonal and meridional wind components, which could be interpreted as the volcanic lamb wave that penetrated into an essentially evanescent region due to the cold temperature at the MLT. However, we also found several similar peaks in the observations that could not be linked to the volcanic eruption and this signature may be serendipitous.
Latitudinal keograms of both domains clearly indicate the spatial extension of the gravity wavefront through both observational domains in the zonal and meridional winds. Furthermore, we derived mean wind anomalies for a single grid cell as well as for the entire domain volumes, leveraging all vertical wind measurements between 80–100 km, to precisely determine the observed phase speeds and gravity wave periods. Based on these values, we estimated an intrinsic phase speed of the wave of ci=200–212 m s−1 and a horizontal wavelength of the gravity wave packet of λh=1600–2000 km.
Besides the volcanic gravity wave signature, we also found a strong quasi-2-day wave in the CONDOR meridional wind component. During this period, we observed horizontal wind speeds of about 180 m s−1 and a meridional wind amplitude of about 160 m s−1 at 95–100 km altitude. These mesospheric neutral wind velocities belong to the highest values so far reported in the literature. These extremely high horizontal wind speeds are the result of a superposition of a strong Q2DW, semidiurnal and diurnal tidal modes, and gravity waves above the Andes. The lamb wave of the volcanic eruption contributed to these extreme values but does not provide the sole explanation.
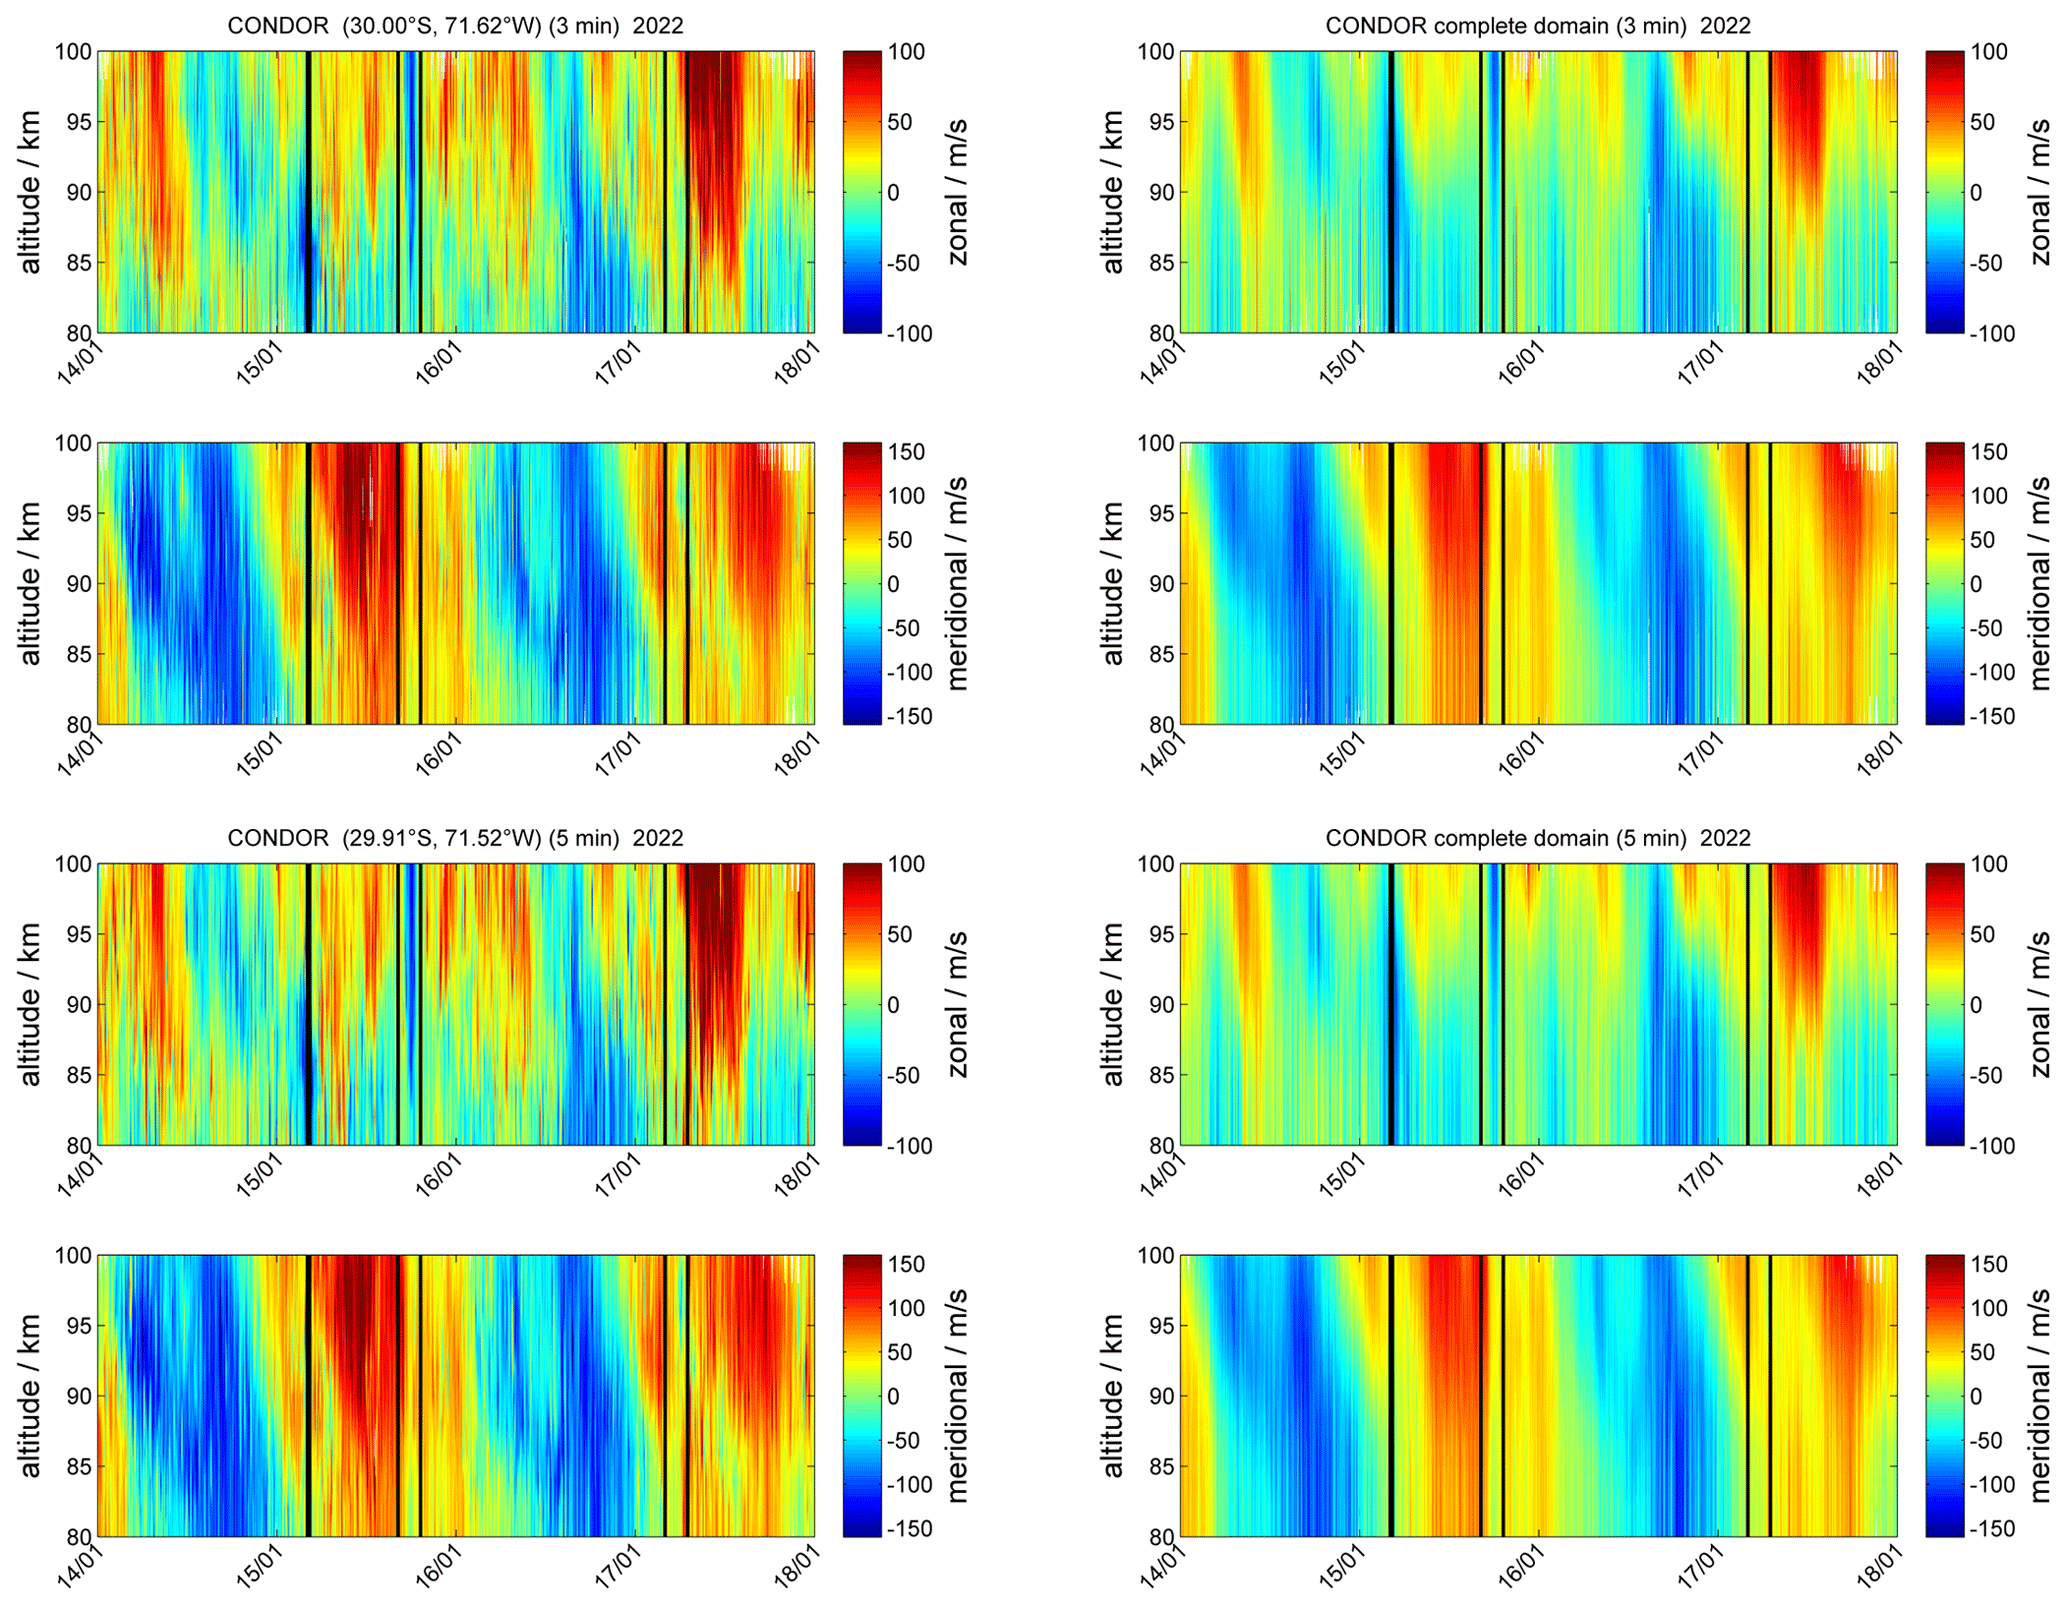
Figure A1Zonal and meridional winds from the 3DVAR+DIV retrieval with temporal resolutions of 3 and 5 min. The left panels show the zonal and meridional winds for a single grid cell centered at geographic coordinates 30∘ S, 71.62∘ W and 29.91∘ S, 71.52∘ W, respectively. The four right panels present the zonal and meridional winds integrated/averaged over the entire CONDOR domain.
The data are available upon request. Please contact Alexander Kozlovsky (alexander.kozlovsky@oulu.fi) for the Nordic Meteor Radar Cluster and Alan Liu (liuz2@erau.edu) for CONDOR to obtain the 3DVAR+DIV retrievals.
GS, AL, and AK supported the data analysis. AK, AL, and ZQ supported the implementation of the algorithms and data handling of the Nordic Meteor Radar Cluster and CONDOR. JK, EB, SN, MT, NM, NG, and ML maintained the observations of the Nordic meteor radars and provided the data. KB validated the data for gravity wave analysis. WK and GS analyzed auxiliary data. All authors helped with the editing of the paper.
Gunter Stober declares to have a shared patent on multistatic meteor radar technology with Juha Vierinen and Jorge L. Chau (WO-2019170797-A1). At least one of the (co-)authors is a member of the editorial board of Annales Geophysicae. The peer-review process was guided by an independent editor.
Any opinions, findings, and conclusions or recommendations expressed in this material are those of the author(s) and do not necessarily reflect the views of the National Science Foundation.
Publisher's note: Copernicus Publications remains neutral with regard to jurisdictional claims in published maps and institutional affiliations.
This article is part of the special issue “Special issue on the joint 20th International EISCAT Symposium and 15th International Workshop on Layered Phenomena in the Mesopause Region”. It is a result of the Joint 20th International EISCAT Symposium 2022 and 15th International Workshop on Layered Phenomena in the Mesopause Region, Eskilstuna, Sweden, 15–19 August 2022.
Gunter Stober, Witali Krochin and Guochun Shi are members of the Oeschger Center for Climate Change Research (OCCR). The work by Alan Liu is supported by (while serving at) the National Science Foundation (NSF), USA. The Esrange meteor radar operation, maintenance and data collection were provided by the Esrange Space Center of the Swedish Space Corporation. The 3DVAR+DIV retrievals were developed as part of the ARISE design study (http://arise-project.eu/, last access: 22 November 2022) funded by the European Union's Seventh Framework Programme for Research and Technological Development. Njål Gulbrandsen acknowledges the support of the Leibniz Institute of Atmospheric Physics (IAP), Kühlungsborn, Germany, for their contributions to the upgrade of the TRO meteor radar. Calculations were performed on UBELIX (http://www.id.unibe.ch/hpc, last access: 16 November 2022), the high-performance computing (HPC) cluster at the University of Bern.
Witali Krochin and Guochun Shi are supported by the Schweizerischer Nationalfonds zur Förderung der Wissenschaftlichen Forschung (grant no. 200021-200517/1). Zishun Qiao and the operation of the CONDOR meteor radar system are supported by the NSF grant 1828589. This research has been supported by the STFCCE14 (grant no. ST/W00089X/1 to Mark Lester). This study is partly supported by Grants-in-Aid for Scientific Research (no. 17H02968) of the Japan Society for the Promotion of Science (JSPS).
This paper was edited by Daniel Whiter and reviewed by two anonymous referees.
Becker, E. and Vadas, S. L.: Secondary Gravity Waves in the Winter Mesosphere: Results From a High-Resolution Global Circulation Model, J. Geophys. Res.-Atmos., 123, 2605–2627, https://doi.org/10.1002/2017JD027460, 2018. a
Carr, J. L., Horváth, A., Wu, D. L., and Friberg, M. D.: Stereo Plume Height and Motion Retrievals for the Record-Setting Hunga Tonga-Hunga Ha'apai Eruption of 15 January 2022, Geophys. Res. Lett., 49, e2022GL098131, https://doi.org/10.1029/2022GL098131, 2022. a
Gudadze, N., Stober, G., and Chau, J. L.: Can VHF radars at polar latitudes measure mean vertical winds in the presence of PMSE?, Atmos. Chem. Phys., 19, 4485–4497, https://doi.org/10.5194/acp-19-4485-2019, 2019. a
Heale, C. J., Inchin, P. A., and Snively, J. B.: Primary Versus Secondary Gravity Wave Responses at F-Region Heights Generated by a Convective Source, J. Geophys. Res.: Space Physics, 127, e2021JA029947, https://doi.org/10.1029/2021JA029947, 2022. a
Heki, K.: Ionospheric signatures of repeated passages of atmospheric waves by the 2022 Jan. 15 Hunga Tonga-Hunga Ha’apai eruption detected by QZSS-TEC observations in Japan, Earth Planet. Space, 74, 112, https://doi.org/10.1186/s40623-022-01674-7, 2022. a, b
Klein, A.: Tongan volcano erupts, New Scientist, 253, 7, https://doi.org/10.1016/S0262-4079(22)00074-4, 2022. a
Matoza, R. S., Fee, D., Assink, J. D., Iezzi, A. M., Green, D. N., Kim, K., Toney, L., Lecocq, T., Krishnamoorthy, S., Lalande, J.-M., Nishida, K., Gee, K. L., Haney, M. M., Ortiz, H. D., Brissaud, Q., Martire, L., Rolland, L., Vergados, P., Nippress, A., Park, J., Shani-Kadmiel, S., Witsil, A., Arrowsmith, S., Caudron, C., Watada, S., Perttu, A. B., Taisne, B., Mialle, P., Pichon, A. L., Vergoz, J., Hupe, P., Blom, P. S., Waxler, R., Angelis, S. D., Snively, J. B., Ringler, A. T., Anthony, R. E., Jolly, A. D., Kilgour, G., Averbuch, G., Ripepe, M., Ichihara, M., Arciniega-Ceballos, A., Astafyeva, E., Ceranna, L., Cevuard, S., Che, I.-Y., Negri, R. D., Ebeling, C. W., Evers, L. G., Franco-Marin, L. E., Gabrielson, T. B., Hafner, K., Harrison, R. G., Komjathy, A., Lacanna, G., Lyons, J., Macpherson, K. A., Marchetti, E., McKee, K. F., Mellors, R. J., Mendo-Pérez, G., Mikesell, T. D., Munaibari, E., Oyola-Merced, M., Park, I., Pilger, C., Ramos, C., Ruiz, M. C., Sabatini, R., Schwaiger, H. F., Tailpied, D., Talmadge, C., Vidot, J., Webster, J., and Wilson, D. C.: Atmospheric waves and global seismoacoustic observations of the January 2022 Hunga eruption, Tonga, Science, 377, 95–100, https://doi.org/10.1126/science.abo7063, 2022. a, b, c, d, e, f, g
Otsuka, S.: Visualizing Lamb Waves From a Volcanic Eruption Using Meteorological Satellite Himawari-8, Geophys. Res. Lett., 49, e2022GL098324, https://doi.org/10.1029/2022GL098324, 2022. a, b
Sarkhel, S., Stober, G., Chau, J. L., Smith, S. M., Jacobi, C., Mondal, S., Mlynczak, M. G., and Russell III, J. M.: A case study of a ducted gravity wave event over northern Germany using simultaneous airglow imaging and wind-field observations, Ann. Geophys., 40, 179–190, https://doi.org/10.5194/angeo-40-179-2022, 2022. a
Shannon, C. E.: A Mathematical Theory of Communication, Bell Syst. Tech. J., 27, 379–423, https://doi.org/10.1002/j.1538-7305.1948.tb01338.x, 1948. a
Smith, S. M., Stober, G., Jacobi, C., Chau, J. L., Gerding, M., Mlynczak, M. G., Russell, J. M., Baumgardner, J. L., Mendillo, M., Lazzarin, M., and Umbriaco, G.: Characterization of a Double Mesospheric Bore Over Europe, J. Geophys. Res.-Space Phys., 122, 9738–9750, https://doi.org/10.1002/2017JA024225, 2017. a
Stober, G., Kozlovsky, A., Liu, A., Qiao, Z., Tsutsumi, M., Hall, C., Nozawa, S., Lester, M., Belova, E., Kero, J., Espy, P. J., Hibbins, R. E., and Mitchell, N.: Atmospheric tomography using the Nordic Meteor Radar Cluster and Chilean Observation Network De Meteor Radars: network details and 3D-Var retrieval, Atmos. Meas. Tech., 14, 6509–6532, https://doi.org/10.5194/amt-14-6509-2021, 2021. a. a, b, c
Stober, G., Kuchar, A., Pokhotelov, D., Liu, H., Liu, H.-L., Schmidt, H., Jacobi, C., Baumgarten, K., Brown, P., Janches, D., Murphy, D., Kozlovsky, A., Lester, M., Belova, E., Kero, J., and Mitchell, N.: Interhemispheric differences of mesosphere–lower thermosphere winds and tides investigated from three whole-atmosphere models and meteor radar observations, Atmos. Chem. Phys., 21, 13855–13902, https://doi.org/10.5194/acp-21-13855-2021, 2021b. a
Stober, G., Liu, A., Kozlovsky, A., Qiao, Z., Kuchar, A., Jacobi, C., Meek, C., Janches, D., Liu, G., Tsutsumi, M., Gulbrandsen, N., Nozawa, S., Lester, M., Belova, E., Kero, J., and Mitchell, N.: Meteor radar vertical wind observation biases and mathematical debiasing strategies including the 3DVAR+DIV algorithm, Atmos. Meas. Tech., 15, 5769–5792, https://doi.org/10.5194/amt-15-5769-2022, 2022. a, b, c, d, e
Themens, D. R., Watson, C., Žagar, N., Vasylkevych, S., Elvidge, S., McCaffrey, A., Prikryl, P., Reid, B., Wood, A., and Jayachandran, P. T.: Global Propagation of Ionospheric Disturbances Associated With the 2022 Tonga Volcanic Eruption, Geophys. Res. Lett., 49, e2022GL098158, https://doi.org/10.1029/2022GL098158, 2022. a, b
Vadas, S. L. and Becker, E.: Numerical Modeling of the Excitation, Propagation, and Dissipation of Primary and Secondary Gravity Waves during Wintertime at McMurdo Station in the Antarctic, J. Geophys. Res.-Atmos., 123, 9326–9369, https://doi.org/10.1029/2017JD027974, 2018. a
Vadas, S. L., Zhao, J., Chu, X., and Becker, E.: The Excitation of Secondary Gravity Waves From Local Body Forces: Theory and Observation, J. Geophys. Res.-Atmos., 123, 9296–9325, https://doi.org/10.1029/2017JD027970, 2018. a
Wilhelm, S., Stober, G., and Brown, P.: Climatologies and long-term changes in mesospheric wind and wave measurements based on radar observations at high and mid latitudes, Ann. Geophys., 37, 851–875, https://doi.org/10.5194/angeo-37-851-2019, 2019. a
Wright, C. J., Hindley, N. P., Alexander, M. J., Barlow, M., Hoffmann, L., Mitchell, C. N., Prata, F., Bouillon, M.and Carstens, J., Clerbaux, C., Osprey, S. M., Powell, N., Randall, C. E., and Yue, J.: Surface-to-space atmospheric waves from Hunga Tonga-Hunga Ha’apai eruption, Nature, 609, 741–746, https://doi.org/10.1038/s41586-022-05012-5, 2022. a, b, c, d, e, f, g, h, i, j, k
Yamada, M., Ho, T.-C., Mori, J., Nishikawa, Y., and Yamamoto, M.-Y.: Tsunami Triggered by the Lamb Wave From the 2022 Tonga Volcanic Eruption and Transition in the Offshore Japan Region, Geophys. Res. Lett., 49, e2022GL098752, https://doi.org/10.1029/2022GL098752, 2022. a, b, c
Zhang, S.-R., Vierinen, J., Aa, E., Goncharenko, L. P., Erickson, P. J., Rideout, W., Coster, A. J., and Spicher, A.: 2022 Tonga volcanic eruption induced global propagation of ionospheric disturbances via Lamb waves, Front. Astron. Space Sci., 9, 871275, https://doi.org/10.3389/fspas.2022.871275, 2022. a, b