the Creative Commons Attribution 4.0 License.
the Creative Commons Attribution 4.0 License.
 | 28 Sep 2022
Mid-latitude neutral wind responses to sub-auroral polarization streams
Daniel D. Billett
Kathryn A. McWilliams
Robert B. Kerr
Jonathan J. Makela
Alex T. Chartier
J. Michael Ruohoniemi
Sudha Kapali
Mike A. Migliozzi
Juanita Riccobono
We investigate the response of the mid-latitude thermospheric neutral winds to a sub-auroral polarization stream (SAPS) event. Using red line (F region) airglow data from two Fabry–Pérot interferometers (FPIs), and F-region ionospheric flow velocities from four Super Dual Auroral Radar Network (SuperDARN) radars, the drivers behind changes seen in the neutral winds are explored within the context of the larger SAPS structure. Different, although strong, neutral wind responses to the SAPS are seen at the two FPI sites, even though they are relatively close geographically. We attribute the wind differences to the varying balance of pressure gradient, ion drag, and Coriolis forces, which ultimately depend on proximity to the SAPS. At the FPI site equatorward of the SAPS, pressure gradient and Coriolis forces drive the winds equatorward and then westward. At the FPI site co-located with the SAPS, the ion drag is strong and results in the winds surging westward before turning eastward when becoming influenced by dawnside sunward plasma convection drifts.
- Article
(3527 KB) - Full-text XML
-
Supplement
(1616 KB) - BibTeX
- EndNote


Thermospheric neutral winds are highly susceptible to ionospheric dynamics on Earth. This is particularly true in the high-latitude regions, where strong plasma drifts driven by coupling to the magnetosphere and the solar wind are often present. The study of ion-neutral coupling is very important in the field of space weather, as it directly relates to how energy from the solar wind is deposited into the upper atmosphere. It has also been a challenge, however, as measurements of the neutral wind can be difficult to obtain on large scales. Analysis of neutral winds in the context of geomagnetic activity has thus often relied on measurements within limited regions, statistics, and modelling (Meriwether, 2006; Billett and McWilliams, 2021).
At geomagnetic mid-latitudes (∼ 30–60∘), disturbance winds (i.e. deviations from quiet time diurnal and seasonal variations) are commonly observed during times of high geomagnetic activity. These events occur when typically high-latitude (> 60∘) ionospheric dynamics impinge on lower latitudes, such as when the polar cap expands or during substorms (Cowley and Lockwood, 1992; Walach and Grocott, 2019). The winds at these locations are primarily disturbed by a combination of the following three forces: the pressure gradient force from thermospheric expansion due to Joule heating, the ion drag force due to collisions with fast-moving plasma, and the rotational Coriolis force, which acts in response to winds generated by the previous forces. A common feature of mid-latitude storm time winds, in response to higher latitude activity, for example, is a pressure-gradient-driven equatorward surge followed by a westward Coriolis-driven turning (e.g. Makela et al., 2014). By contrast, neutrals in the direct vicinity of ionospheric drifts are driven strongly by ion drag, which acts in the direction of the drifts (Deng and Ridley, 2006). The Coriolis force can additionally act on ion-drag-driven winds, turning them poleward if they are initially flowing westward (Zhang et al., 2015). The balance of forces driving disturbance winds is thus quite complicated and highly dependent on factors such as geographic location and proximity to the ionospheric disturbance. Altitude within the thermosphere/ionosphere system is also a factor, as the ion-neutral collision frequency is a function of the neutral and electron densities (Billett et al., 2020b).
Sub-auroral polarization steams (SAPS; Foster and Burke, 2002) are an ionospheric phenomenon unique to mid-latitudes. They are characterized by channels of strong westward plasma drifts slightly equatorward of the nightside auroral oval and are a few degrees of latitude wide. SAPS are notably separate from the high-latitude plasma convection but still strongly correlated with the occurrence and strength of geomagnetic storms (Huang and Foster, 2007). They are driven by poleward-directed electric fields thought to be produced in the low-conductivity trough region in response to charge separation in the magnetospheric ring current (Southwood and Wolf, 1978). Sub-auroral ion drifts (SAIDs), latitudinally narrow (∼ 1∘), and very fast (several km s−1) plasma flow channels are also sometimes seen embedded within SAPS (Anderson et al., 2001).
In this study, we present observations of F-region neutral winds from two mid-latitude Fabry–Pérot interferometers (FPIs) located in the continental USA, in conjunction with a SAPS event observed by high-frequency (HF) radars in the Super Dual Auroral Radar Network (SuperDARN). The event presented is very unique in that the SAPS were observed independently across the fields-of-view (FOV) of four mid-latitude SuperDARN radars and that both the FPIs observed strong, but quite different, neutral wind responses. We examine the potential drivers behind the behaviour of the FPI winds while taking into account the larger-scale context of the ionospheric plasma provided by the SuperDARN radars.
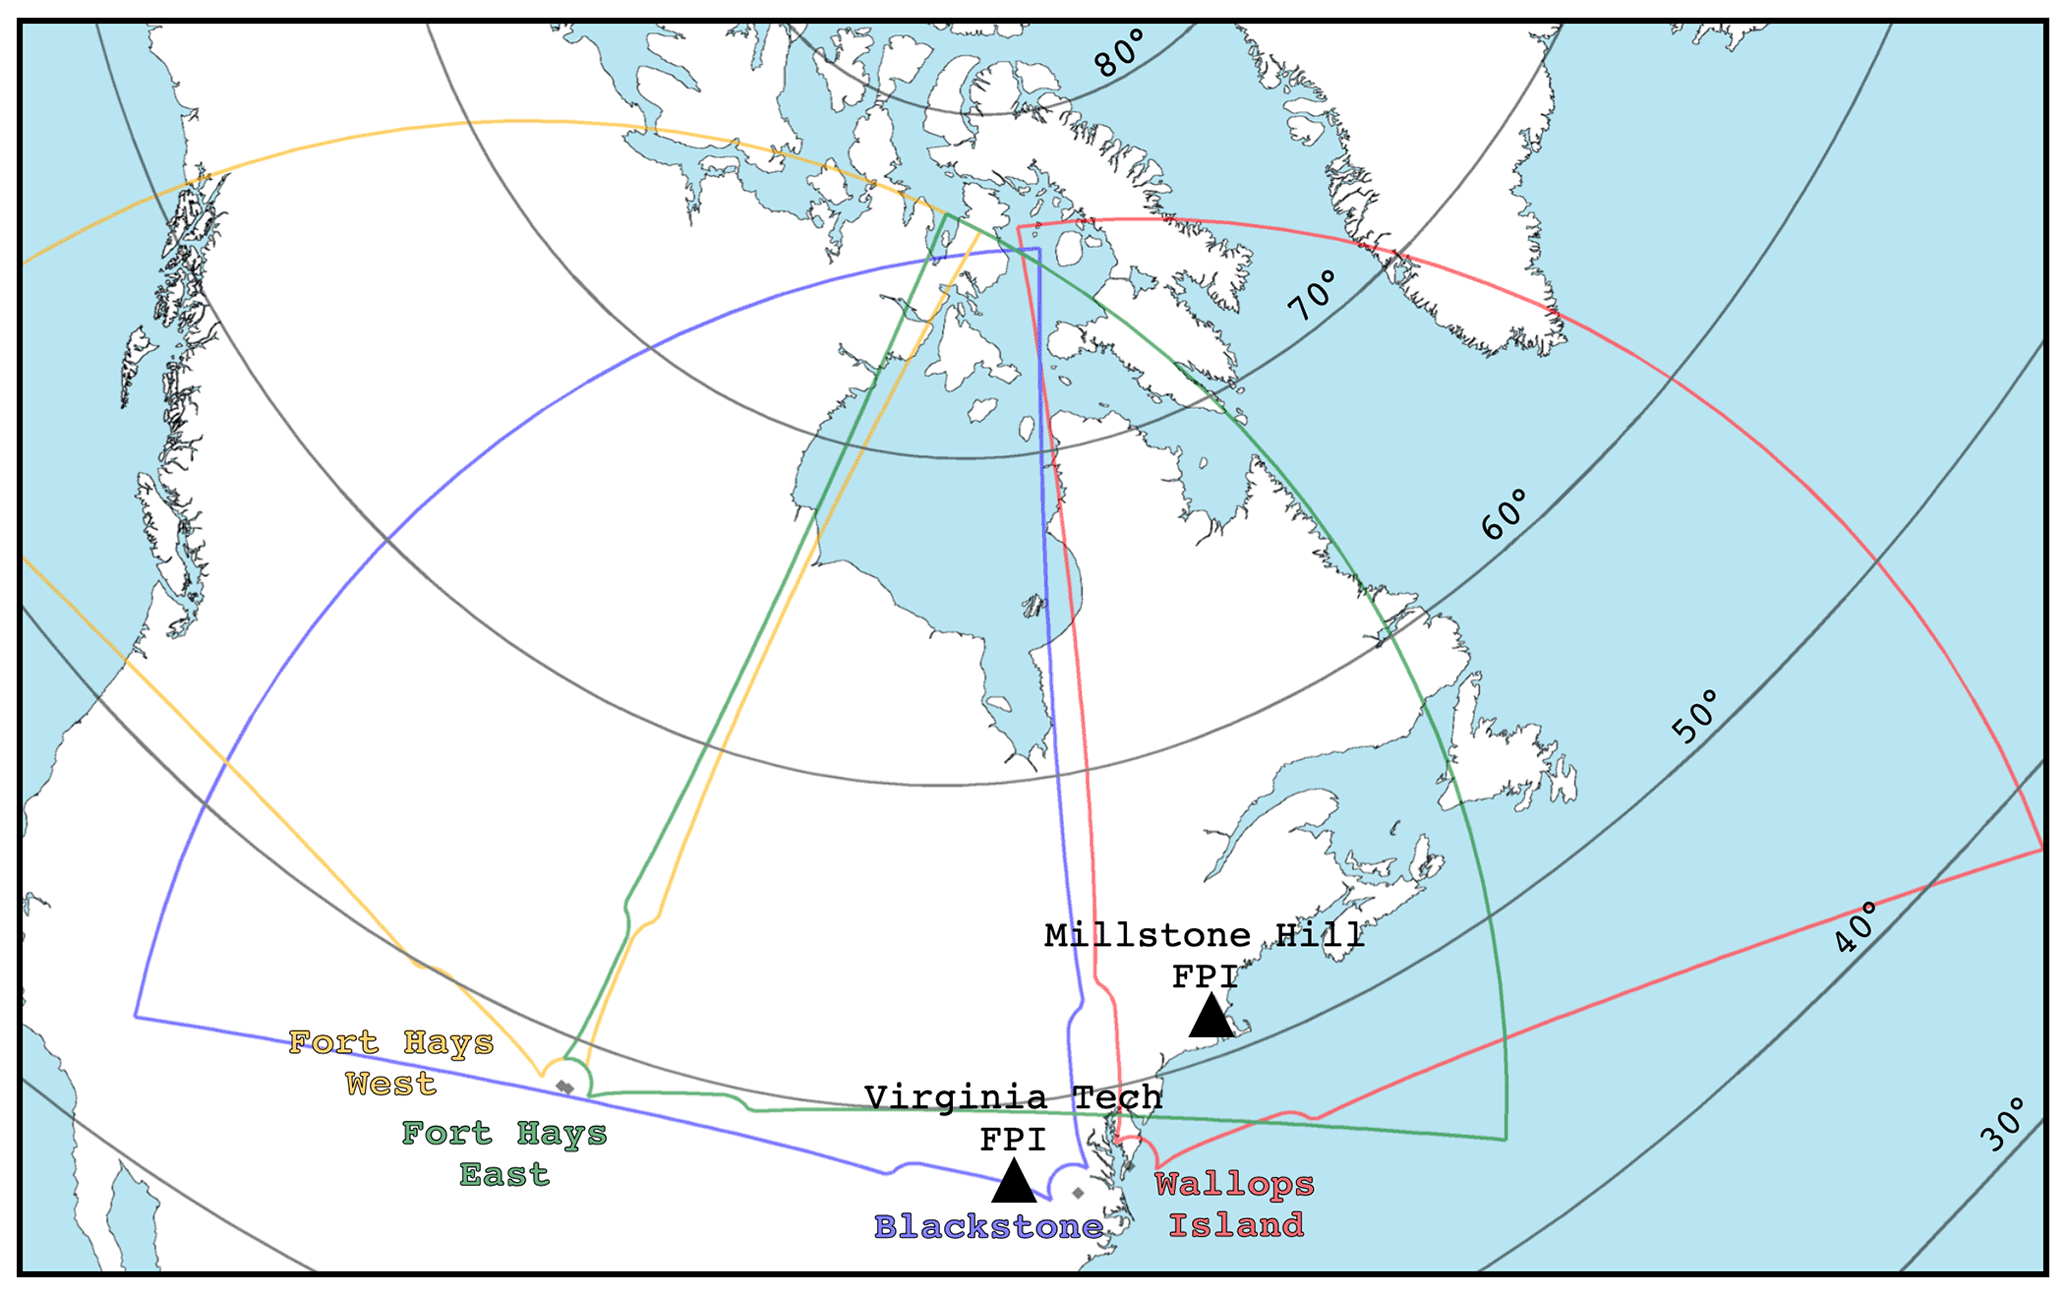
Figure 1The fields of view of the Fort Hays West, Fort Hays East, Blackstone, and Wallops Island SuperDARN radars, up to range gate 75 (with each gate being 45 km wide). Also shown are the locations of two FPIs (black triangles), with one at Millstone Hill Geospace Facility and the other at Virginia Tech (November 2013). Black lines indicate parallels of constant altitude-adjustment-corrected geomagnetic (AACGM) latitude.
Plasma velocity data in this study are primarily obtained from four mid-latitude radars that are part of the SuperDARN network (Greenwald et al., 1995; Chisham et al., 2007; Nishitani et al., 2019). SuperDARN radars measure the line-of-sight (LOS) Doppler velocity of ionospheric magnetic field-aligned irregularities from a backscattered HF signal. The FOV of the four SuperDARN radars used for LOS plasma velocities in this study, located at Fort Hays West, Fort Hays East, Blackstone, and Wallops Island in the continental USA, are shown in Fig. 1. The FOV of the radars encompass a large swath of the geomagnetic mid-latitudes across North America (below 60∘ altitude-adjusted-corrected geomagnetic latitude, AACGM; Shepherd, 2014), a region which is almost always sub-auroral, depending on geomagnetic activity level. Due to the geometry of HF propagation through the ionosphere and the requirement that the signal be perpendicular to the geomagnetic field lines for Bragg reflection to occur, measurements beyond slant rages of ∼ 800 km are typically considered to be located at F-region altitudes (Thomas and Shepherd, 2018). Although, far-ranging echoes may still potentially be from E-region scatter, depending on factors that can affect ionospheric conductivity gradients, such as seasonal or diurnal trends (Chisham and Pinnock, 2002). The spatiotemporal resolution of the radars depends on the scan mode employed, but typically (which is the case in this study), a 1 min scan time with 45 km range gates is used. The mid-latitude SuperDARN radars are excellent at making observations of SAPS due to their wide FOV and fast sampling rates and have been used in several previous studies for plasma velocity information (e.g. Oksavik et al., 2006; Kataoka et al., 2007; Clausen et al., 2012; Kunduri et al., 2018)
In addition to SuperDARN radar LOS velocity measurements, we also utilize the map potential technique whereby velocities from all available radars in the Northern Hemisphere are combined to generate a fitted pattern of the high-latitude electric potential, otherwise known as a convection pattern (Ruohoniemi and Baker, 1998). In short, a global electric potential (Φ) best fit to the SuperDARN radar LOS velocities is derived, where the parameters are associated with each other through the relations and . E, B and v are the electric field, magnetic field, and convection velocity, respectively. Best-fit plasma velocities can then be obtained at an arbitrary location within the bounds of the convection pattern, which are used later in the paper to obtain the average velocity over a specific spatial area coinciding with the SAPS region. The fitted SuperDARN electric potential (where the equipotentials are equivalent to plasma velocity streamlines) is a hemispheric spherical harmonic fit resulting in velocities at a certain location being inherently coupled to data gathered elsewhere in the hemisphere. Because the data coverage for the four aforementioned radars is good for the event described in this study, the SAPS region of interest is well constrained by the fit and thus will capture changes in the SAPS velocity. A caveat of using the SuperDARN fitted plasma velocities is that plasma drifts associated with SAPS will be fitted together with drifts associated with the large-scale ionospheric convection pattern. This will potentially result in an underestimation of the fitted SAPS velocity because SAPS at mid-latitudes and the large-scale convection at higher latitudes are driven by inherently different processes, causing them to be decoupled. We minimize this source of error by later averaging the fitted velocities in the sub-auroral region only, but we cannot fully eliminate it.
Also shown in Fig. 1 are the locations of the FPIs used in this study (black triangles), situated at the Millstone Hill Geospace Facility (MH; Kerr et al., 2017; Kerr, 2022) and Virginia Tech university campus (VTI; Makela et al., 2011, 2012; Harding et al., 2014). Both FPIs observe the red line 630 nm O(1D) nightglow/auroral emission, which is used to estimate the neutral wind LOS Doppler velocity in four cardinal directions (north, south, east and west, geographically) at a zenith of ∼ 45∘. Clear and dark skies are required for good data, which were both the case during the event presented in this study. To obtain horizontal winds from the LOS Doppler velocities, it is assumed that both the vertical wind is negligible and that it remains constant across the FPI FOV, thus allowing for the wind to be resolved in the horizontal plane. Finally, the horizontal wind components are transformed from a geographic coordinate system to an AACGM coordinate system using the 2D rotation matrix transformation, as follows:
where v and v′ are the original and transformed wind vectors, respectively. R is the rotation matrix given by the left set of square brackets, where θ is the angle subtended by the great circle lines connecting the location of the FPI to the geographic and AACGM poles. The rotation into a magnetic reference frame requires pairing a meridional (vmeridional; north or south) measurement with a zonal (vzonal; east or west) one. This is because the FPI measures the wind sequentially in the four cardinal directions, and a complete vector is required to carry out the transformation. For clarity, all mentions of latitude/longitude and zonal/meridional velocities going forward refer to those in an AACGM reference frame. The integration time in each cardinal direction for the MH data is 3 min, and the average fit uncertainty for the 136 LOS measurements used in this study is 0.9 m s−1. Meridional and zonal wind uncertainties sum the north/south and east/west LOS errors, respectively, producing an average velocity uncertainty of 1.8 m s−1 at MH. At VTI the integration time is dynamic (up to 300 s), achieving an average LOS uncertainty of 8.6 m s−1 for the 204 LOS measurements used here. The corresponding average uncertainty for the meridional and zonal velocities at VTI is 17.1 m s−1.
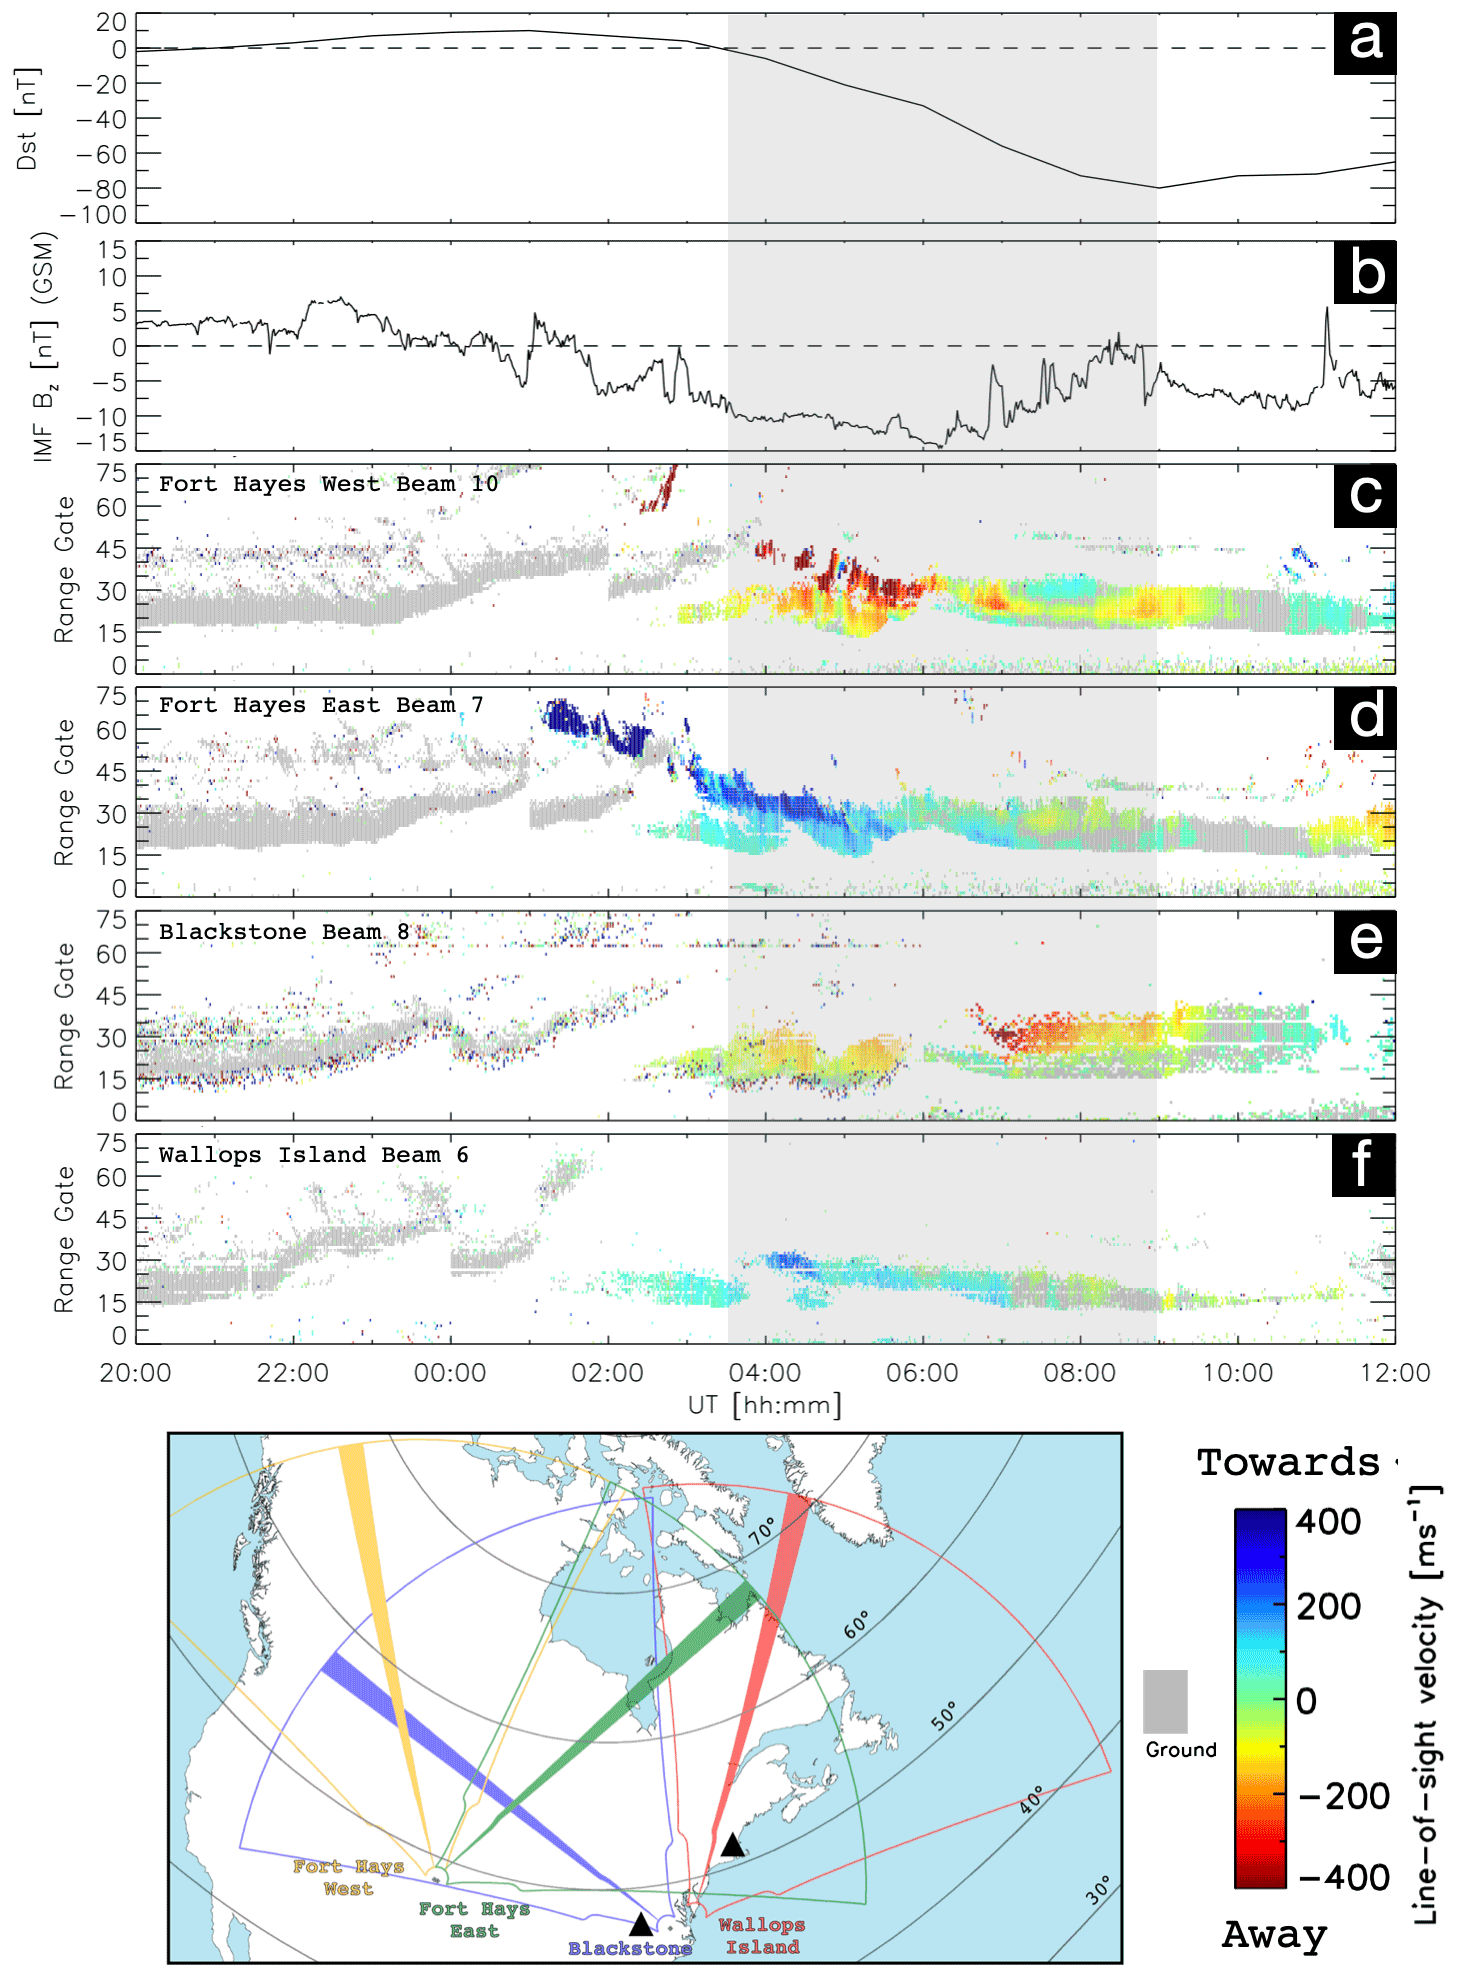
Figure 2SAPS event overview, starting at 20:00 UT on 8 November and ending at 12:00 UT on 9 November 2013. (a) Disturbance storm time (Dst) index. (b) Interplanetary magnetic field (IMF) Bz in geocentric solar magnetospheric coordinates (GSM). (c–f) Range–time plots of the LOS plasma velocity from beams 0, 7, 8, and 6 of the Fort Hays West, Fort Hays East, Blackstone, and Wallops Island SuperDARN radars, respectively. Blue indicates plasma moving towards the radar site, while red means moving away. Grey indicates data that have been flagged as ground scatter. The diagram at the bottom shows the orientations of the chosen beams for panels (c–f). The grey shaded region is the geomagnetic storm main phase, as dictated by the Dst index.
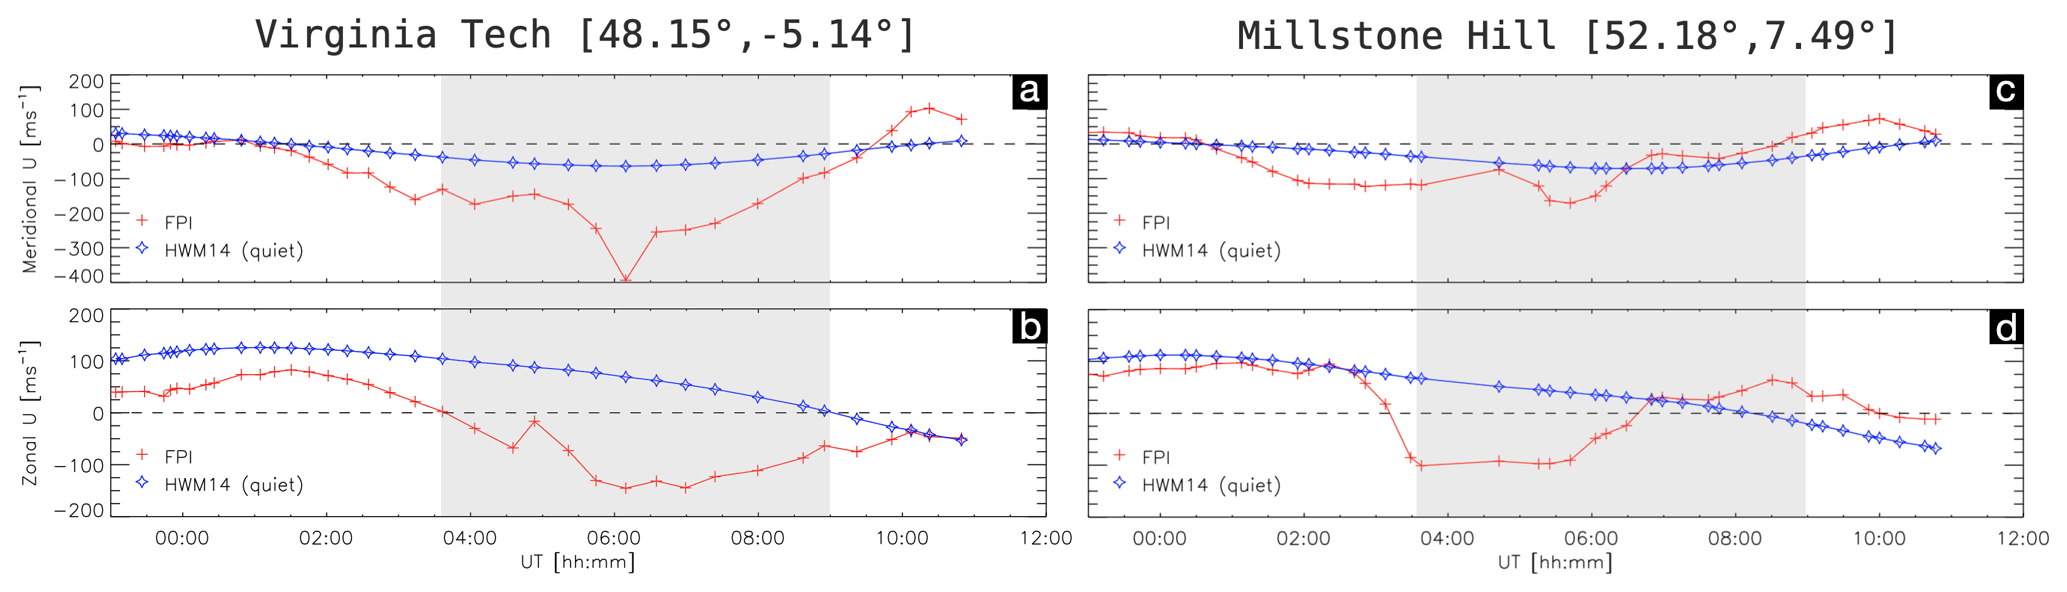
Figure 3Time series of neutral wind zonal (a, c) and meridional (b, d) velocities at the locations of VTI (a, b) and MH (c, d) FPIs starting at 20:00 UT on 8 November and ending at 12:00 UT on 9 November 2013. Red lines are velocities from the FPIs with error bar uncertainties, while blue lines with diamonds are the quiet time curve from the HWM14. The grey shaded region is the geomagnetic storm main phase, also shown in Fig. 2. Positive values are poleward and eastward for the meridional and zonal data, respectively.
3.1 Case study: 9 November 2013
An overview of a SAPS event is shown in Fig. 2. The disturbance storm time (Dst) index for the event is shown in Fig. 2a, which indicates that the main phase of the geomagnetic storm began at ∼ 03:30 UT on 9 November 2013 and ended at ∼ 09:00 UT on the same day (grey shaded region). The peak Dst minimum was −80 nT, which would classify the event as a moderate storm (Loewe and Prölss, 1997). The interplanetary magnetic field (IMF) Bz component (geocentric solar magnetospheric, GSM, coordinates) is shown in Fig. 2b, which stays almost entirely negative from ∼ 02:00 UT onwards on 9 November.
Also shown in Fig. 2c–f are range–time–velocity plots along specific beams of four mid-latitude SuperDARN radars, namely Fort Hays West, Fort Hays East, Blackstone, and Wallops Island. There is a diagram at the bottom of Fig. 2 showing the relevant beam geometries in AACGM coordinates. The zonal-looking (east–west) beams with the most ionospheric backscatter were chosen. Fort Hays West beam 10 and Blackstone beam 8 point westward, while Fort Hays East beam 7 and Wallops Island beam 6 point eastward. There were radar operating mode changes to using a different frequency at 00:00 UT on 9 November for Wallops Island and Blackstone, which caused a change in the propagation path of the radar beam and an apparent shift in ground scatter location at those times. Similar mode changes occurred at Fort Hays East (01:00 UT) and at Fort Hays West (02:00 UT). The changes act to modify the HF beam propagation through the ionosphere, causing it to refract and hit the ground/ionosphere at different range gates.
At the beginning of the geomagnetic storm main phase (03:30–06:00 UT), North America was located in the pre-midnight dusk sector and all radars observed westward ionospheric flow enhancements between range gates 15 and 45. Based on the radar beam geometry, these ranges vary between 50 and 60∘ geomagnetic latitude. The westward flows are most prominent in the Fort Hays West and Fort Hays East observations (Fig. 2c and d), where they reach approximately 300 m s−1. Before the storm, at around 02:00 UT, strong flows at far ranges/higher latitudes (range gates > 60 and 65–70∘ geomagnetic latitude) were observed by the Fort Hays West and Fort Hays East radars. The high-latitude flows appear detached from those seen at a lower latitude later on, which could indicate the distinction between high-latitude convection and SAPS. Additional low-latitude westward plasma flows can be seen from 07:00 UT till roughly the end of the storm main phase, which are strongest in the Blackstone data (Fig. 2e). From ∼ 11:00 UT, eastward flows are seen by both Fort Hays East and Fort Hays West, which could be observation of the dawnside ionospheric convection return flow.
Meridional and zonal neutral wind velocity data from the VTI and MH FPIs are shown as red lines in Fig. 3, which are averaged from the north/south and east/west FPI look directions, respectively. The blue lines with diamonds are the quiet time neutral wind velocities obtained from the Horizontal Wind Model 2014 (HWM14; Drob et al., 2015) at the location of the FPIs, using an Ap index of 0 as geomagnetic activity input. We classify the difference between the FPI data and the HWM14 quiet time curve as the disturbance neutral wind, i.e. the deviation from normal (non-geomagnetically enhanced) diurnal variations.
The VTI (Fig. 3a and b) meridional velocity closely follows the quiet time curve before 02:00 UT, while the zonal velocity is offset by around 50 m s−1 westward (but follows a similar trend). Before the storm at MH (Fig. 3c and d), the zonal winds closely follow the quiet time curve, while the meridional winds become disturbed by around 100 m s−1 equatorward at 02:00 UT. Both FPIs observed significant disturbance winds slightly before and during the storm main phase; the peak disturbance meridional and zonal velocities were 330 m s−1 equatorward and 215 m s−1 westward at VTI, while they were 100 m s−1 equatorward and 165 m s−1 westward at MH. After the storm main phase, winds observed at both FPIs returned approximately to quiet time velocities; however, the data recordings ended at 11:00 UT when the skies were no longer dark enough for the FPI to work.
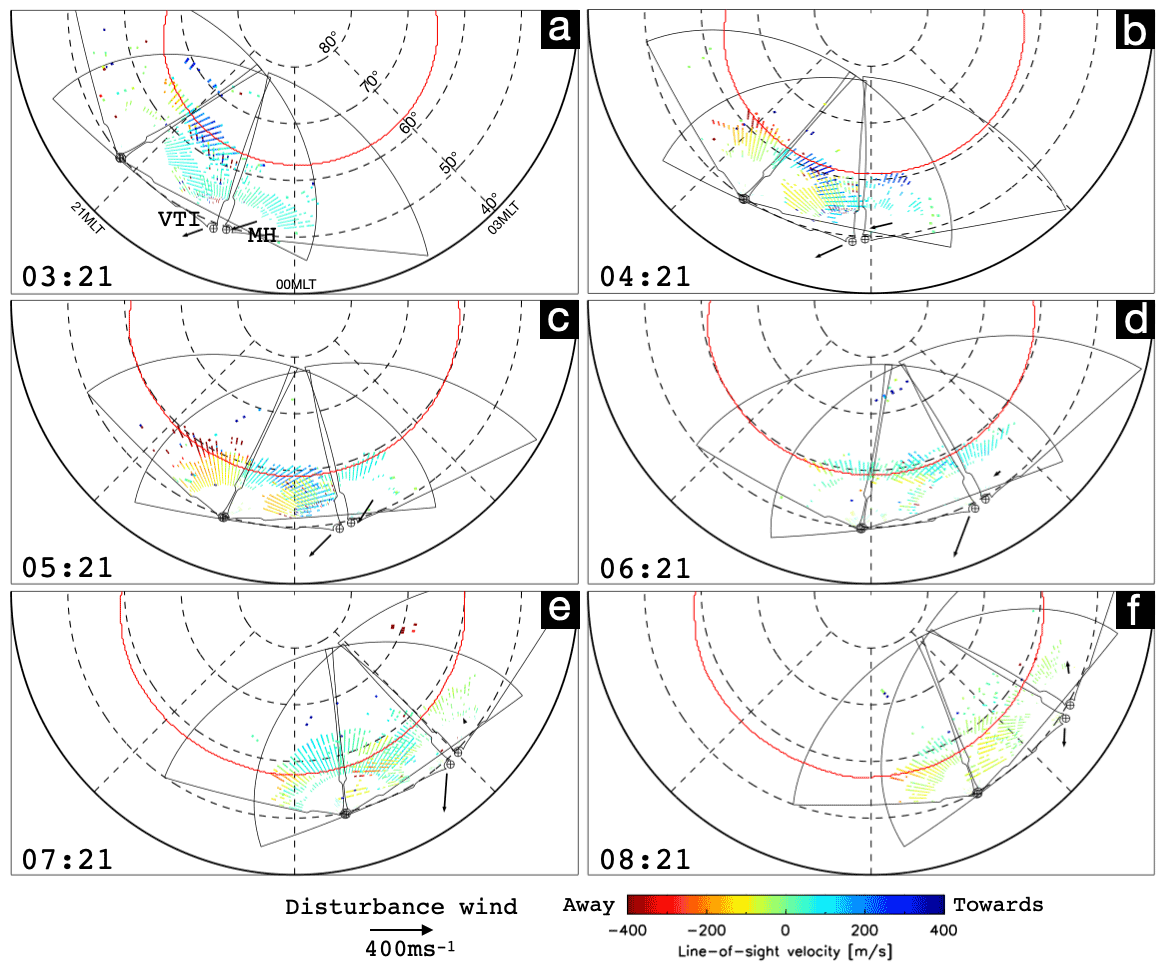
Figure 4Nightside polar plots of plasma velocity data from four SuperDARN radars and disturbance neutral wind velocity vectors from the VTI and MH FPIs (black arrows) for times on 9 November 2013. The red circle is the approximate location of the auroral oval lower-latitude boundary, derived from Special Sensor Ultraviolet Spectrographic Imager (SSUSI) data aboard whichever Defense Meteorological Satellite Program (DMSP) instrument (F-16, F-17, or F-18) last crossed the pole. There are six times shown 1 h apart each, the coordinate system is AACGM latitude magnetic local time, and the concentric dashed lines separate 10∘ of latitude. Data in each SuperDARN radar beam have been made thinner to help show which radar it was measured by and, thus, the LOS direction. The VTI FPI is the arrow with a base at a slightly lower latitude compared to the MH FPI.
The large wind excursions equatorward and westward, as seen by the VTI FPI, are commonly seen disturbance wind features (e.g. Yagi and Dyson, 1985; Fejer et al., 2002; Makela et al., 2014; Sivla and McCreadie, 2014; Joshi et al., 2015). Energy is deposited into the ionosphere–thermosphere system via either high-latitude convection or SAPS, which then drives the thermospheric heating and an equatorward pressure gradient force (Rishbeth et al., 1987). A westward wind then develops due to a westward directed Coriolis force on the equatorward winds. At the MH FPI, there is a much smaller equatorward wind disturbance but a much more sudden westward wind enhancement. This could mean that MH measured winds are directly in the path of the westward plasma flows seen in Fig. 2, thus experiencing the ion drag force westward in a manner similar to the strong ion-neutral coupling seen at higher latitudes (e.g. Förster et al., 2008; Billett et al., 2020a). Westward mid-latitude winds directly driven by SAPS ion drag have also been seen by Zhang et al. (2015), which could additionally explain the decrease in equatorward wind velocity at MH during the storm main phase (as the Coriolis force would act poleward).
To assess the neutral winds in context with the enhanced plasma velocities, Fig. 4 shows a series of nightside-only polar plots from just before the storm main phase till the end of the storm main phase, with the SuperDARN and FPI disturbance data overlain. The plots are in a AACGM latitude-magnetic local time coordinate system and show the radar/FPI locations moving from the pre-midnight to post-midnight Magnetic Local Time (MLT) sector. The equatorward boundary of the auroral oval is also drawn as a red circle, which was derived from the previous polar pass of the Special Sensor Ultraviolet Spectrographic Imager (SSUSI; Paxton et al., 2002; Ding et al., 2017) instrument aboard the Defense Meteorological Satellite Program (DMSP) instruments of F-16, F-17, and F-18. The SSUSI equatorward auroral oval boundary gives an indication of which SuperDARN detected flows are sub-auroral and thus potentially SAPS. Throughout the times shown in Fig. 4, the equatorward auroral oval boundary consistently expands to lower latitudes. This is an indication of polar cap expansion and follows from the consistently southward IMF Bz during those times (Fig. 2b). The auroral oval typically expands during geomagnetic storms (Craven and Frank, 1987) and is offset from the high-latitude convection by a few degrees of latitude (Imber et al., 2013).
Based on the SSUSI equatorward auroral oval boundaries, there is a clear indication that a large portion of the SuperDARN-measured plasma flows are sub-auroral and westward orientated. These flows are most intense in Fig. 4b and c (04:21 and 05:21 UT), where all the radars measure sub-auroral westward plasma flows of the order of 200–400 m s−1. Based on statistics of SuperDARN data from the Hokkaido East radar, Nagano et al. (2015) notes that the lower velocity limit of SAPS, which distinguishes them from mid-latitude F-region ionospheric echoes, is between 150 and 200 m s−1. We therefore classify the measured sub-auroral flows during this event as relatively low-magnitude SAPS. There does not appear to be high-velocity SAID embedded within the SAPS. Near the end of the storm main phase (Fig. 4f; 08:21 UT), the equatorward auroral oval boundary is at 57∘ latitude (at 0:00 MLT), and the SAPS have mostly subsided to 100 m s−1 or less. The SAPS velocity decrease is expected as the radar FOV move into to the post-midnight dawn sector, as fast SAPS are usually longitudinally constrained to pre-midnight local times (Clausen et al., 2012; Landry and Anderson, 2018; Zhang et al., 2021). We note that, although plasma flows were not observed by the SuperDARN radars directly over MH, this does not necessarily mean no flows exist there. This is due to backscatter only being possible where the radar signals hit ionospheric irregularities perpendicularly. Due to a lack of coverage, we also cannot entirely rule out the potential for plasma flows above VTI.
The disturbance neutral wind vectors (measured winds from the FPIs with the quiet time curve from the HWM14 subtracted) are also shown in Fig. 4. Between 03:21 and 05:21 UT, when the SAPS flows are most intense, both FPIs observe wind disturbances southwestward. At 06:21 UT, the VTI FPI (lower-latitude arrow) observes a large equatorward disturbance, while the MH disturbance winds (higher-latitude arrow) decrease to near-quiet-time levels. Assuming the wind disturbances at VTI and MH are due to the aforementioned pressure gradient forces and ion drag, respectively, the differences between them could possibly be due to their location with respect to the SAPS. As the VTI measurement is at a consistently lower latitude than the SAPS, the large equatorward enhancement at 06:21 UT could be due to the delay in the pressure gradient force wave front propagation from higher latitudes generated by heating from earlier SAPS. The disturbance winds measured at MH, conversely, do not appear to be strongly delayed in their response to the SAPS subsiding. As the MH winds are at a latitude closer to that of the SAPS, they may be more directly susceptible to ion drag forcing from the plasma. Indeed, previous studies have shown that ion drag is likely the dominant force acting on the neutrals within the SAPS region compared to the pressure gradient or Coriolis forces (Ferdousi et al., 2019; Zou et al., 2022). There is still a delay between plasma acceleration/deceleration becoming apparent in the neutral winds, but it would be a function of the ion-neutral collision frequency and usually varies significantly (Billett et al., 2019; Aa et al., 2021).
In addition to single-vector wind measurements from the MH and VTI FPIs, horizontal wind fields from the North American Thermosphere–Ionosphere Observing Network (NATION; Makela et al., 2012) of FPIs were available for the night of event. The full process by which the horizontal wind field is derived is described by Harding et al. (2015); however, in short, a regularization-based technique is employed to fit the measured neutral winds from NATION FPIs to the smoothest possible structure. During storm times, however, and indeed as shown by the VTI and MH measurements in Fig. 3, the neutral winds become inherently structured due to sharp ion drag and pressure gradients. Similarly to the VTI and MH data, an assumption is also made that the vertical wind is negligible and constant across the fitting region, which is probably inaccurate and contributes to the uncertainty of the wind field. When compounded with an average uncertainty of ∼ 20 m s−1 for each NATION FPI during this event, the uncertainty in the derived wind field becomes significant (potentially around 100 m s−1 in some regions). However, the field is still useful for obtaining a general idea of the mesoscale neutral wind direction across North America, appreciating that the uncertainty during this event is probably too high to resolve wind structures between the FPI locations. We therefore include a video of the NATION-derived wind (Video S1 in the Supplement) between 23:30 UT on 8 November and 11:00 UT on the 9 November 2013. The coordinate system in Video S1 is geographic, and black dots indicate FOV observation directions from five NATION FPIs, projected to an altitude of 250 km (corresponding to the red line emission). For context, the geographic coordinates (lat/long) of MH and VTI are 43.5∘ N, 71.3∘ W and 38.2∘ N, 80.6∘ W, respectively. MH is out of bounds of the axis shown. The SSUSI auroral boundary shown in Fig. 4 reaches a lower geographic latitude limit of around 48∘; thus, we consider the entire wind field shown in Video S1 as sub-auroral.
The entire NATION wind field in Video S1 shows strong equatorward winds from around 03:00 to 07:30 UT, which is in agreement with the equatorward disturbance wind enhancements seen by VTI (Figs. 3 and 4) soon after the occurrence of SAPS. Between 06:30 and 09:30 UT, there is also a notable westward component of the lower-latitude (below 40∘) winds, which is consistent with the VTI measured westward winds (geomagnetically) within a similar region. As mentioned previously, this westward turning of the lower-latitude winds may be due to a westward-acting Coriolis force on the previously equatorward flows, which were pressure gradient driven from the higher-latitude SAPS. From 09:30 UT the NATION winds become poleward, which also occurs in the geomagnetic north direction for the VTI and MH winds in Fig. 3. In summary, the general wind direction in the smoothed NATION wind field is consistent with VTI and MH measured winds during the SAPS event shown.
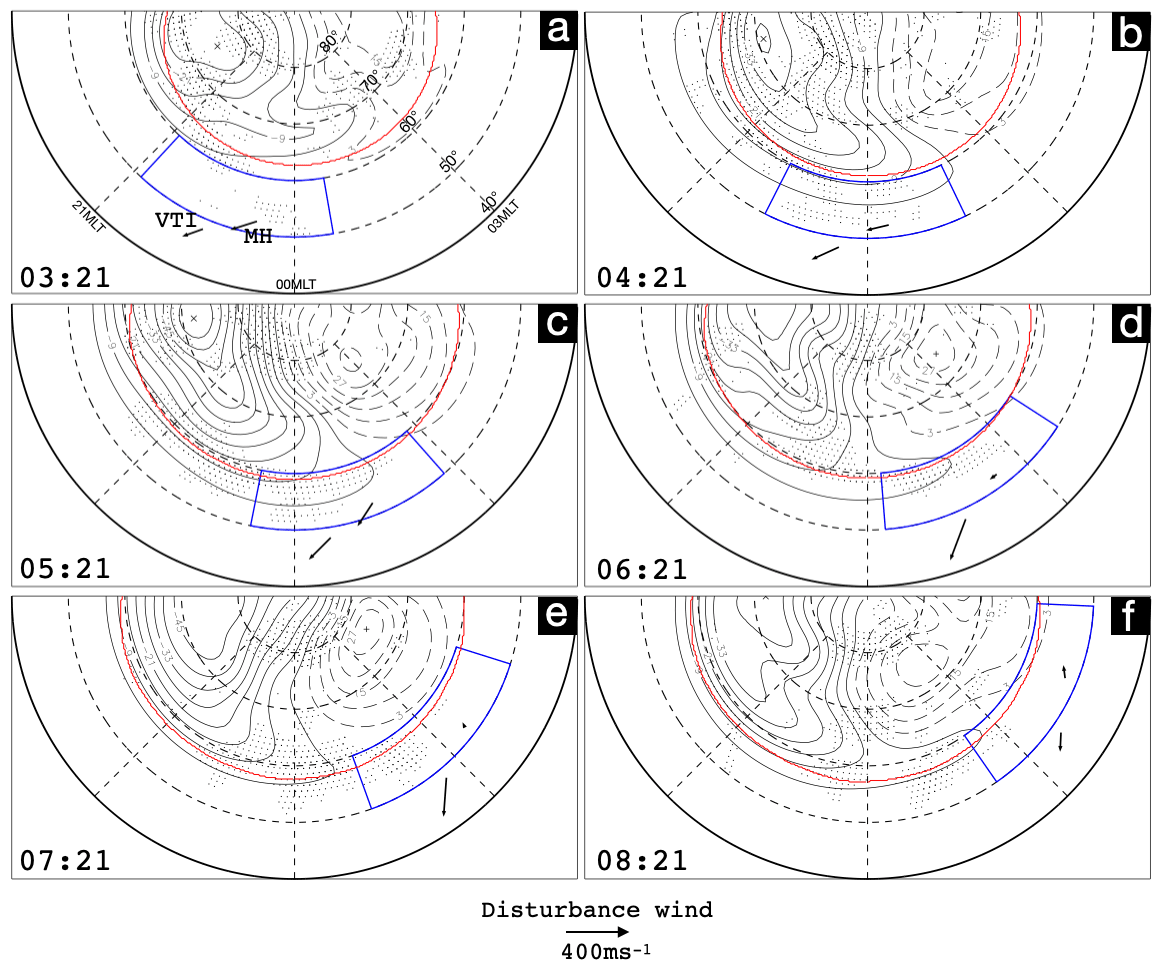
Figure 5Polar plots in the same format as Fig. 4, except with the SuperDARN global fitted electric potential contours (in kV) instead of the radar LOS data. Black dots are the locations of SuperDARN radar LOS data which contributed to the fit. The blue box is the region over which the fitted plasma velocity was averaged for the purpose of cross-correlation, the results of which are shown in Fig. 6.
3.2 Cross-correlation of neutral wind and SAPS flow
We empirically examine the VTI and MH neutral wind response to the 9 November 2013 SAPS event by carrying out a cross-correlation analysis. Cross-correlation in this context involves lagging the disturbance wind time series against that for the plasma drift and seeing which pair of lagged time series has the highest correlation. The lag with the highest correlation could be considered the delay of the disturbance wind to plasma drift variations, depending on the shape of the correlation curve, and gives a potential insight into the processes driving the winds. To do this, however, a plasma velocity time series within the SAPS region is required, which can then be compared to the VTI and MH wind measurements.
To obtain the plasma time series, we average the zonal and meridional components of the fitted SuperDARN plasma convection velocity within a region bound by 50 to 60∘ AACGM latitude and −25.14 to 27.49∘ AACGM longitude (± 20∘ longitude each side of the FPI locations). As mentioned in Sect. 2, obtaining an average SAPS velocity from the SuperDARN fitted data product likely results in a source of error, due to the fit coupling to high-latitude convection which is separate from SAPS. For the purposes of cross-correlation, however, averaging in this way would still extract the SAPS velocity trend. For example, the fitted westward velocity will still enhance and subside in response to the underlying data at that location from the four mid-latitude SuperDARN radars. In short, this means that changes in the convection pattern velocity at the location of the SAPS should still be representative of SAPS variations, assuming the radar data coverage is good. The SuperDARN-derived electric potential fit and the averaging region (blue box) just described are shown in Fig. 5 for the same times shown in Fig. 4. Black dots indicate where radar data have contributed to the fit.

Figure 6(a–c) Time series used in the cross-correlation for the (a) Average fitted convection magnitude within the blue box region in Fig. 5, (b) VTI disturbance winds, and (c) MH disturbance winds. (d, e) Cross-correlation results from the meridional, zonal, and magnitude disturbance winds from (d) VTI and (e) MH. Winds are lagged backwards up to 180 min in 5 min steps against the plasma velocities shown in panel (a). Vertical dashed lines in panel (d) indicate the lags with the highest r values for the meridional and zonal components.
At 03:21 UT (Fig. 5a), there exists a two-cell convection pattern of which the equatorward edge is within a few degrees latitude of the auroral oval boundary. Soon after, however, and shown in the panels from 04:21–06:21 UT, the contours expand significantly further equatorward of the oval. Plasma convection during this time is still a two-cell convection, with anti-sunward flow over the pole and return flows on the dawn and dusk sides, but the dusk cell is elongated onto the dawnside near 0:00 MLT. The elongation of the dusk cell is a typical signature of SAPS flow in the global SuperDARN convection patterns, as westward flow directly post-midnight usually fits best to the dusk cell instead of the dawn in an apparent enhancement of the Harang discontinuity (Bristow et al., 2001; Zou et al., 2009, 2012). In the 07:21 and 08:21 UT panels, the auroral oval boundary is expanded to a similar latitude as the convection pattern boundary, and the averaging region is far on the dawnside.
Looking at the disturbance winds from VTI and MH in context with the convection pattern in Fig. 5, we see that MH winds (higher-latitude arrow) are consistently closer to the convection contours than those measured by VTI. This can help explain why the MH winds are more impacted in the zonal direction compared to meridional direction (Fig. 3c and d) and also their eastward turning to align with the dawnside convection return flow (07:21 and 08:21 UT panels). Due to pressure gradients from solar heating, in addition to Coriolis forces tending to oppose the eastward ion drag direction, winds on the dawnside are typically anti-sunward orientated (Förster et al., 2008). Eastward/sunward winds measured by the MH FPI thus imply a particularly strong ion drag force.
A cross-correlation analysis is carried out by shifting (lagging) the neutral wind disturbance time series backwards, in 5 min intervals, up to 180 min. At each step, the Pearson correlation (r) coefficient is calculated against the magnitude of the average plasma velocity time series (from the fitted SuperDARN convection velocities), which is fixed in time. The correlation window used for the neutral wind is between 02:00 and 10:00 UT on 9 November 2013, and the wind components from VTI and MH are cross-correlated separately. Lagging wind data backwards in this way assumes that the plasma velocity magnitude is driving the wind disturbances, and not vice versa. Winds themselves may drive ion drift (i.e. via the disturbance dynamo or neutral wind flywheel effects; Blanc and Richmond, 1980; Deng et al., 1991), but this would be unrelated to the SAPS drift seen before the winds themselves became enhanced. The plasma and disturbance wind time series used in for the cross-correlation are shown in Fig. 6a–c, while the cross-correlation results are shown in Fig. 6d and e. Before approximately 03:00 UT, the plasma-averaging region (blue box in Fig. 5) was lower in latitude than the extent of the convection pattern, and therefore, the plasma velocity in Fig. 6a was set to zero. For Fig. 6d and e, r=1 indicates the perfect correlation, and is the perfect anti-correlation.
The cross-correlation curves for the VTI disturbance winds (Fig. 6d) all have well-defined peaks at high correlation values (indicated by the dashed vertical lines). The lags with the highest r are also fairly close, i.e. 105 min for the zonal component and 125 min for the meridional and magnitude components. This implies that enhancement of the disturbance winds at VTI (Fig. 6b) lags that of the SAPS drift by roughly 2 h, which is in agreement with the large meridional enhancements seen in Fig. 4d and e, even though the bulk of the SAPS occurred between panels Fig. 4a–c (i.e. the enhanced plasma before the VTI meridional winds peaked in Fig. 6a). As mentioned earlier, we attribute this lag to the time taken for the pressure gradient force wavefront, driven by SAPS heating, to propagate equatorward to the region observed by the VTI FPI. Once the pressure gradient force begins to act on the neutrals, there is then additional time for the velocity of the wind to fully change. The ∼ 2 h full response time of the VTI-measured winds thus includes the propagation of the pressure force to a lower latitude and the momentum change of the winds. A similar lagged equatorward propagation of disturbance wind enhancements can be seen in Fig. 3 of Makela et al. (2014) (for the vertical wind component), which also appears to be of the order of a couple of hours across ∼ 6∘ of latitude.
At MH (Fig. 6e), the correlation of the zonal disturbance wind is highest when there is no lag and steadily decreases up to a lag of 180 min. By contrast, the MH meridional correlation curve shows no well-defined peaks or troughs throughout all lags. In reality, a lag of zero does not physically make sense, assuming all other forces except ion drag are removed from the winds, because the neutrals will always need time for their momentum to significantly change upon collision with the plasma. A peak correlation at zero lag for the MH zonal disturbance winds could thus mean that there is uncertainty in the time series for the disturbance winds, plasma, or both. For example, we subtracted the quiet time HWM14 winds from the FPI data to isolate the effect of ion drag, which is non-ideal because HWM14 only captures the quiet time climatology. There is also no time history in the SuperDARN convection fitting, causing a degree of spikiness between sequential convection patterns, as previous conditions are not considered. Ultimately, these uncertainties illustrate the limitations of the cross-correlation technique itself, as the correlation window is considered as a whole. Regardless, it can be seen in Fig. 6a and c that the MH zonal disturbance winds do indeed respond quickly to the onset of SAPS around 03:00 UT. We interpret this as the zonal disturbance wind being closely coupled with the SAPS drift, while the meridional wind is mostly not consistently affected. This agrees with the winds at MH being strongly affected by ion drag forcing because of a closer proximity to the SAPS and high-latitude convection compared to VTI (e.g. Fig. 5b–f). In a force term analysis by Ferdousi et al. (2019), it was found that ion drag was indeed dominant in the SAPS region versus the Coriolis and pressure gradient forces. In global simulations by Wang et al. (2012), a similarly strong ion drag effect was seen.
We have presented neutral wind measurements from two mid-latitude FPIs, which showed significant disturbances in response to a sub-auroral polarization stream (SAPS) event observed by mid-latitude SuperDARN radars. The two FPIs, located at Virginia Tech (VTI) and Millstone Hill (MH), observe a significantly different response, which could be explained by their proximity to the SAPS itself.
-
Large equatorward and westward disturbance winds were observed at the VTI FPI, which was consistently located equatorward of the SAPS region. We propose that the observations were driven by the pressure gradient force and subsequent Coriolis force, due to SAPS heating at higher latitudes.
-
The VTI disturbance wind was delayed from the SAPS by roughly 2 h, indicative of the time taken for the pressure gradient force wave front to propagate equatorward from the SAPS region to the FPI location.
-
Strong westward winds were observed at the MH FPI almost immediately in response to the SAPS. As the MH FPI was located much closer to the SAPS region than VTI, we propose that the MH observed winds were driven strongly by ion drag from the westward SAPS drift.
Our results illustrate the degree of neutral wind variability at mid-latitudes in response to the impingement of high-latitude ionospheric flows. Although the VTI and MH FPIs are fairly close geographically, the disturbance winds measured by each vary significantly during a single geomagnetic event. It is thus important, when analysing disturbance neutral wind data, to be attentive to mesoscale ionospheric events such as SAPS which can have wide-reaching effects on the thermosphere. We also highlight the diagnostic potential of direct thermospheric wind measurements in conjunction with SuperDARN-observed ionospheric flows. The mid-latitude expansion of the SuperDARN within the last decade, in particular, has greatly enhanced options for the multi-instrument studies of mesoscale ion-neutral coupling mechanisms equatorward of the auroral zones.
Fitted SuperDARN data can be downloaded from Globus, instructions for which are provided at https://superdarn.ca/data-products (last access: 23 September 2022). Raw SuperDARN data with DOIs can be accessed from https://www.frdr-dfdr.ca/repo/collection/superdarn (Super Dual Auroral Radar Network, 2022). Fabry–Pérot interferometer data from both the Millstone Hill and Virginia Tech sites were obtained from the Madrigal Millstone Hill data repository at http://millstonehill.haystack.mit.edu/index.html (Millstone Hill, 2022). The NATION wind fields were obtained from https://airglow.ece.illinois.edu/Data/Calendar (Airglow, 2022). Disturbance storm time (Dst) index data were accessed from https://wdc.kugi.kyoto-u.ac.jp/dstdir/ (WDC for Geomag., Kyoto, 2022). IMF data were accessed from the OMNI dataset at https://omniweb.gsfc.nasa.gov/ow_min.html (NASA, 2022a). DMSP SSUSI auroral boundary data were accessed from https://spdf.gsfc.nasa.gov/pub/data/dmsp/ (NASA, 2022b). The HWM14 Fortran software was obtained from the supporting information of Drob et al. (2015). SuperDARN data in this study were processed using the Radar Software Toolkit (RST), version 4.6 (https://doi.org/10.5281/zenodo.5156752; SuperDARN Data Analysis Working Group et al., 2021).
The supplement related to this article is available online at: https://doi.org/10.5194/angeo-40-571-2022-supplement.
This paper was written by DDB, who also carried out the event analysis. KAM, ATC, and JMR aided in result interpretation for the SuperDARN data. RBK and JJM aided in interpretation of the FPI data. SK, MAM, and JR carried out (ongoing) software and engineering maintenance for the MH FPI.
The contact author has declared that none of the authors has any competing interests.
Publisher's note: Copernicus Publications remains neutral with regard to jurisdictional claims in published maps and institutional affiliations.
We thank Greg Earle, of the Virginia Polytechnic Institute and State University, for hosting the VTI Fabry–Pérot Interferometer used in this study. The authors acknowledge the use of data from SuperDARN, an international project made possible by the national funding agencies of Australia, Canada, China, France, Italy, Japan, South Africa, Norway, the United Kingdom, and the United States of America.
This research has been supported by the European Space Agency (ESA) Living Planet Fellowship programme and by the National Sciences and Engineering Research Council of Canada (NSERC). Daniel D. Billett has been supported by ESA under the HLPF-SSA project and by NSERC CREATE (grant no. 479771-20). Kathryn A. McWilliams has been supported by NSERC Discovery (grant no. RGPIN 05472-2017).
This paper was edited by Steve Milan and reviewed by two anonymous referees.
Aa, E., Zhang, S.-R., Erickson, P. J., Coster, A. J., Goncharenko, L. P., Varney, R. H., and Eastes, R.: Salient Midlatitude Ionosphere-Thermosphere Disturbances Associated With SAPS During a Minor but Geo-Effective Storm at Deep Solar Minimum, J. Geophys. Res.-Space, 126, e2021JA029509, https://doi.org/10.1029/2021JA029509, 2021. a
Anderson, P. C., Carpenter, D. L., Tsuruda, K., Mukai, T., and Rich, F. J.: Multisatellite observations of rapid subauroral ion drifts (SAID), J. Geophys. Res.-Space, 106, 29585–29599, 2001. a
Airglow: Calendar, https://airglow.ece.illinois.edu/Data/Calendar, last access: 23 September 2022. a
Billett, D. D. and McWilliams, K. A.: The SuperDARN's role in ion-neutral coupling research, Polar Sci., 28, 100624, https://doi.org/10.1016/j.polar.2020.100624, 2021. a
Billett, D. D., Wild, J. A., Grocott, A., Aruliah, A. L., Ronksley, A. M., Walach, M.-T., and Lester, M.: Spatially resolved neutral wind response times during high geomagnetic activity above Svalbard, J. Geophys. Res.-Space, 124, 6950–6960, 2019. a
Billett, D. D., Hosokawa, K., Grocott, A., Wild, J. A., Aruliah, A. L., Ogawa, Y., Taguchi, S., and Lester, M.: Multi-Instrument Observations of Ion-Neutral Coupling in the Dayside Cusp, Geophys. Res. Lett., 47, e2019GL085590, https://doi.org/10.1029/2019GL085590, 2020a. a
Billett, D. D., McWilliams, K. A., and Conde, M. G.: Colocated observations of the E and F region thermosphere during a substorm, J. Geophys. Res.-Space, 125, e2020JA028165, https://doi.org/10.1029/2020JA028165, 2020b. a
Blanc, M. and Richmond, A. D.: The ionospheric disturbance dynamo, J. Geophys. Res.-Space, 85, 1669–1686, 1980. a
Bristow, W. A., Otto, A., and Lummerzheim, D.: Substorm convection patterns observed by the super dual auroral radar network, J. Geophys. Res.-Space, 106, 24593–24609, 2001. a
Chisham, G. and Pinnock, M.: Assessing the contamination of SuperDARN global convection maps by non-F-region backscatter, Ann. Geophys., 20, 13–28, https://doi.org/10.5194/angeo-20-13-2002, 2002. a
Chisham, G., Lester, M., Milan, S. E., Freeman, M. P., Bristow, W. A., Grocott, A., McWilliams, K. A., Ruohoniemi, J. M., Yeoman, T. K., Dyson, P. L., Greenwald, R. A., Kikuchi, T., Pinnock, M., Rash, J. P. S., Sato, N., Sofko, G. J., Villain, J.-P., and Walker, A. D. M.: A decade of the Super Dual Auroral Radar Network (SuperDARN): Scientific achievements, new techniques and future directions, Surv. Geophys., 28, 33–109, 2007. a
Clausen, L. B. N., Baker, J. B. H., Ruohoniemi, J. M., Greenwald, R. A., Thomas, E. G., Shepherd, S. G., Talaat, E. R., Bristow, W. A., Zheng, Y., Coster, A. J., and Sazykin, S.: Large-scale observations of a subauroral polarization stream by midlatitude SuperDARN radars: Instantaneous longitudinal velocity variations, J. Geophys. Res.-Space, 117, A05306, https://doi.org/10.1029/2011JA017232, 2012. a, b
Cowley, S. W. H. and Lockwood, M.: Excitation and decay of solar wind-driven flows in the magnetosphere-ionosphere system, Annales Geophysicae, 10, 103–115, 1992. a
Craven, J. D. and Frank, L. A.: Latitudinal motions of the aurora during substorms, J. Geophys. Res.-Space, 92, 4565–4573, 1987. a
Deng, W., Killeen, T. L., Burns, A. G., and Roble, R. G.: The flywheel effect: Ionospheric currents after a geomagnetic storm, Geophys. Res. Lett., 18, 1845–1848, 1991. a
Deng, Y. and Ridley, A. J.: Dependence of neutral winds on convection E-field, solar EUV, and auroral particle precipitation at high latitudes, J. Geophys. Res.-Space, 111, A09306, https://doi.org/10.1029/2005JA011368, 2006. a
Ding, G.-X., He, F., Zhang, X.-X., and Chen, B.: A new auroral boundary determination algorithm based on observations from TIMED/GUVI and DMSP/SSUSI, J. Geophys. Res.-Space, 122, 2162–2173, 2017. a
Drob, D. P., Emmert, J. T., Meriwether, J. W., Makela, J. J., Doornbos, E., Conde, M., Hernandez, G., Noto, J., Zawdie, K. A., McDonald, S. E., Huba, J. F., and Klenzing, J. H.: An update to the Horizontal Wind Model (HWM): The quiet time thermosphere, Earth and Space Science, 2, 301–319, 2015. a, b
Fejer, B. G., Emmert, J. T., and Sipler, D. P.: Climatology and storm time dependence of nighttime thermospheric neutral winds over Millstone Hill, J. Geophys. Res.-Space, 107, SIA 3-1–SIA 3-9, https://doi.org/10.1029/2001JA000300, 2002. a
Ferdousi, B., Nishimura, Y., Maruyama, N., and Lyons, L. R.: Subauroral neutral wind driving and its feedback to SAPS during the 17 March 2013 geomagnetic storm, J. Geophys. Res.-Space, 124, 2323–2337, 2019. a, b
Förster, M., Rentz, S., Köhler, W., Liu, H., and Haaland, S. E.: IMF dependence of high-latitude thermospheric wind pattern derived from CHAMP cross-track measurements, Annales Geophysicae, 26, 1581–1595, 2008. a, b
Foster, J. C. and Burke, W. J.: SAPS: A new categorization for sub-auroral electric fields, Eos T. Am. Geophys. Un., 83, 393–394, 2002. a
Greenwald, R. A., Baker, K. B., Dudeney, J. R., Pinnock, M., Jones, T. B., Thomas, E. C., Villain, J.-P., Cerisier, J.-C., Senior, C., Hanuise, C., Hunsucker, R. D., Sofko, G., Koehler, J., Nielsen, E., Pellinen, R., Walker, A. D. M., Sato, N., and Yamagishi, H.: Darn/superdarn, Space Sci. Rev., 71, 761–796, 1995. a
Harding, B. J., Gehrels, T. W., and Makela, J. J.: Nonlinear regression method for estimating neutral wind and temperature from Fabry–Perot interferometer data, Appl. Optics, 53, 666–673, 2014. a
Harding, B. J., Makela, J. J., and Meriwether, J. W.: Estimation of mesoscale thermospheric wind structure using a network of interferometers, J. Geophys. Res.-Space, 120, 3928–3940, 2015. a
Huang, C.-S. and Foster, J. C.: Correlation of the subauroral polarization streams (SAPS) with the Dst index during severe magnetic storms, J. Geophys. Res.-Space, 112, A11302, https://doi.org/10.1029/2007JA012584, 2007. a
Imber, S. M., Milan, S. E., and Lester, M.: The Heppner–Maynard Boundary measured by SuperDARN as a proxy for the latitude of the auroral oval, J. Geophys. Res.-Space, 118, 685–697, 2013. a
Joshi, P. P., H. Baker, J. B., Ruohoniemi, J. M., Makela, J. J., Fisher, D. J., Harding, B. J., Frissell, N. A., and Thomas, E. G.: Observations of storm time midlatitude ion-neutral coupling using SuperDARN radars and NATION Fabry–Perot interferometers, J. Geophys. Res.-Space, 120, 8989–9003, 2015. a
Kataoka, R., Nishitani, N., Ebihara, Y., Hosokawa, K., Ogawa, T., Kikuchi, T., and Miyoshi, Y.: Dynamic variations of a convection flow reversal in the subauroral postmidnight sector as seen by the SuperDARN Hokkaido HF radar, Geophys. Res. Lett., 34, L21105, https://doi.org/10.1029/2007GL031552, 2007. a
Kerr, R., Kapali, S., Riccobono, J., Migliozzi, M. A., Noto, J., Brum, C. G. M., and Garcia, R.: Climatology of Neutral vertical winds in the midlatitude thermosphere, in: AGU Fall Meeting Abstracts, 11 December 2017, New Orleans, vol. 2017, SA44A–06, 2017. a
Kerr, R. B.: The “Red Line” Fabry–Perot Interferometer (FPI), http://neutralwinds.com/redlinedescribe.html, last access: 23 September 2022. a
Kunduri, B. S. R., Baker, J. B. H., Ruohoniemi, J. M., Nishitani, N., Oksavik, K., Erickson, P. J., Coster, A. J., Shepherd, S. G., Bristow, W. A., and Miller, E. S.: A new empirical model of the subauroral polarization stream, J. Geophys. Res.-Space, 123, 7342–7357, 2018. a
Landry, R. G. and Anderson, P. C.: An auroral boundary-oriented model of subauroral polarization streams (SAPS), J. Geophys. Res.-Space, 123, 3154–3169, 2018. a
Loewe, C. A. and Prölss, G. W.: Classification and mean behavior of magnetic storms, J. Geophys. Res.-Space, 102, 14209–14213, 1997. a
Makela, J. J., Meriwether, J. W., Huang, Y., and Sherwood, P. J.: Simulation and analysis of a multi-order imaging Fabry–Perot interferometer for the study of thermospheric winds and temperatures, Appl. Optics, 50, 4403–4416, 2011. a
Makela, J. J., Meriwether, J. W., Ridley, A. J., Ciocca, M., and Castellez, M. W.: Large-scale measurements of thermospheric dynamics with a multisite Fabry–Perot interferometer network: Overview of plans and results from midlatitude measurements, International Journal of Geophysics, 2012, 872140, https://doi.org/10.1155/2012/872140, 2012. a, b
Makela, J. J., Harding, B. J., Meriwether, J. W., Mesquita, R., Sanders, S., Ridley, A. J., Castellez, M. W., Ciocca, M., Earle, G. D., Frissell, N. A., Hampton, D. L., Gerrard, A. J., Noto, J., and Martinis, C. R.: Storm time response of the midlatitude thermosphere: Observations from a network of Fabry–Perot interferometers, J. Geophys. Res.-Space, 119, 6758–6773, 2014. a, b, c
Meriwether, J. W.: Studies of thermospheric dynamics with a Fabry–Perot interferometer network: A review, J. Atmos. Sol.-Terr. Phy., 68, 1576–1589, 2006. a
Millstone Hill: Madrigal Database, http://millstonehill.haystack.mit.edu/index.html, last access: 23 September 2022. a
NASA: High resolution (1-min, 5-min) OMNI: Solar wind magnetic field and plasma data at Earth's Bow Shock Nose (BSN), also geomagnetic activity indices and 5-min energetic proton fluxes, https://omniweb.gsfc.nasa.gov/ow_min.html, last access: 23 September 2022. a
NASA: DMSP SSUSI auroral boundary data, https://spdf.gsfc.nasa.gov/pub/data/dmsp/, last access: 23 September 2022b. a
Nagano, H., Nishitani, N., and Hori, T.: Occurrence characteristics and lowest speed limit of subauroral polarization stream (SAPS) observed by the SuperDARN Hokkaido East radar, Earth Planets Space, 67, 1–7, 2015. a
Nishitani, N., Ruohoniemi, J. M., Lester, M., Baker, J. B. H., Koustov, A. V., Shepherd, S. G., Chisham, G., Hori, T., Thomas, E. G., Makarevich, R. A., Marchaudon, A., Ponomarenko, P., Wild, J. A., Milan, S. E., Bristow, W. A., Devlin, J., Miller, E., Greenwald, R. A., Ogawa, T., and Kikuchi, T.: Review of the accomplishments of mid-latitude Super Dual Auroral Radar Network (SuperDARN) HF radars, Progress in Earth and Planetary Science, 6, 1–57, 2019. a
Oksavik, K., Greenwald, R. A., Ruohoniemi, J. M., Hairston, M. R., Paxton, L. J., Baker, J. B. H., Gjerloev, J. W., and Barnes, R. J.: First observations of the temporal/spatial variation of the sub-auroral polarization stream from the SuperDARN Wallops HF radar, Geophys. Res. Lett., 33, L12104, https://doi.org/10.1029/2006GL026256, 2006. a
Paxton, L. J., Morrison, D., Zhang, Y., Kil, H., Wolven, B., Ogorzalek, B. S., Humm, D. C., and Meng, C.-I.: Validation of remote sensing products produced by the Special Sensor Ultraviolet Scanning Imager (SSUSI): A far UV-imaging spectrograph on DMSP F-16, in: Optical spectroscopic techniques, remote sensing, and instrumentation for atmospheric and space research IV, Vol. 4485, International Society for Optics and Photonics, 338–348, 2002. a
Rishbeth, H., Fuller-Rowell, T. J., and Rodger, A. S.: F-layer storms and thermospheric composition, Phys. Scripta, 36, 327, https://doi.org/10.1088/0031-8949/36/2/024, 1987. a
Ruohoniemi, J. M. and Baker, K. B.: Large-scale imaging of high-latitude convection with Super Dual Auroral Radar Network HF radar observations, J. Geophys. Res.-Space, 103, 20797–20811, 1998. a
Shepherd, S. G.: Altitude-adjusted corrected geomagnetic coordinates: Definition and functional approximations, J. Geophys. Res.-Space, 119, 7501–7521, 2014. a
Sivla, W. T. and McCreadie, H.: Mid-latitude thermospheric zonal winds during the equinoxes, Adv. Space Res., 54, 499–508, 2014. a
Southwood, D. J. and Wolf, R. A.: An assessment of the role of precipitation in magnetospheric convection, J. Geophys. Res.-Space, 83, 5227–5232, 1978. a
SuperDARN Data Analysis Working Group, Schmidt, M. T., Bland, E. C., Thomas, E. G., Burrell, A. G., Coco, I., Ponomarenko, P. V., Reimer, A. S., Sterne, K. T., and Walach, M.-T.: SuperDARN/rst: RST 4.6 (v4.6), Zenodo [software], https://doi.org/10.5281/zenodo.5156752, 2021. a
Super Dual Auroral Radar Network: SuperDARN, https://www.frdr-dfdr.ca/repo/collection/superdarn, Digital Research Alliance of Canada, last access: 23 September 2022. a
Thomas, E. G. and Shepherd, S. G.: Statistical patterns of ionospheric convection derived from mid-latitude, high-latitude, and polar SuperDARN HF radar observations, J. Geophys. Res.-Space, 123, 3196–3216, 2018. a
Walach, M.-T. and Grocott, A.: SuperDARN observations during geomagnetic storms, geomagnetically active times, and enhanced solar wind driving, J. Geophys. Res.-Space, 124, 5828–5847, 2019. a
Wang, W., Talaat, E. R., Burns, A. G., Emery, B., Hsieh, S.-Y., Lei, J., and Xu, J.: Thermosphere and ionosphere response to subauroral polarization streams (SAPS): Model simulations, J. Geophys. Res.-Space, 117, A07301, https://doi.org/10.1029/2012JA017656, 2012. a
WDC for Geomag., Kyoto: Geomagnetic Equatorial Dst index Home Page, https://wdc.kugi.kyoto-u.ac.jp/dstdir/, last access: 23 September 2022. a
Yagi, T. and Dyson, P. L.: The response of the mid-latitude thermospheric wind to magnetic activity, Planet. Space Sci., 33, 461–467, 1985. a
Zhang, Q., Liu, Y. C.-M., Zhang, Q.-H., Xing, Z.-Y., and Ma, Y.-Z.: Longitudinal Evolution of the Velocity of Subauroral Polarization Streams (SAPS) in Different Phases of Magnetic Storms: SuperDARN Observations, J. Geophys. Res.-Space, 126, e2021JA029340, https://doi.org/10.1029/2021JA029340, 2021. a
Zhang, S.-R., Erickson, P. J., Foster, J. C., Holt, J. M., Coster, A. J., Makela, J. J., Noto, J., Meriwether, J. W., Harding, B. J., Riccobono, J., and Kerr, R. B.: Thermospheric poleward wind surge at midlatitudes during great storm intervals, Geophys. Res. Lett., 42, 5132–5140, 2015. a, b
Zou, S., Lyons, L. R., Wang, C.-P., Boudouridis, A., Ruohoniemi, J. M., Anderson, P. C., Dyson, P. L., and Devlin, J. C.: On the coupling between the Harang reversal evolution and substorm dynamics: A synthesis of SuperDARN, DMSP, and IMAGE observations, J. Geophys. Res.-Space, 114, A01205, https://doi.org/10.1029/2008JA013449, 2009. a
Zou, S., Lyons, L. R., and Nishimura, Y.: Mutual Evolution of Aurora and Ionospheric Electrodynamic Features Near the Harang Reversal During Substorms, American Geophysical Union (AGU), https://doi.org/10.1029/2011GM001163, 159–170, 2012. a
Zou, Y., Lyons, L., Shi, X., Liu, J., Wu, Q., Conde, M., Shepherd, S. G., Mende, S., Zhang, Y., and Coster, A.: Effects of Subauroral Polarization Streams on the Upper Thermospheric Winds during Non-Storm Time, J. Geophys. Res.-Space, 127, e2021JA029988, https://doi.org/10.1029/2021JA029988, 2022. a