the Creative Commons Attribution 4.0 License.
the Creative Commons Attribution 4.0 License.
 | 03 May 2022
Responses of intermediate layers to geomagnetic activity during the 2009 deep solar minimum over the Brazilian low-latitude sector
Ângela M. Santos
Christiano G. M. Brum
Inez S. Batista
José H. A. Sobral
Mangalathayil A. Abdu
Jonas R. Souza
This work presents the daytime behavior of the intermediate layer (ILs) parameters (the virtual height – h'IL, and the top frequency – ftIL) over the low-latitude region of Cachoeria Paulista (CP, 22.42∘ S; 45∘ W, I: −34.59∘) during the 2009 deep solar minimum. Under such a unique condition, this research reveals the ILs' quiet state seasonal behavior as well as its responses to moderate changes in the geomagnetic activity. The main results show that even small variations of geomagnetic activity (quantified by the planetary Kp index) are able to modify the dynamics of the ILs parameters. For the first time, it was observed that during the summer, the h'IL decreases rapidly with the increase of geomagnetic activity, mainly in the early morning hours, while in the following hours, a smoothed rise of the IL was found in all seasons analyzed. Regarding the IL frequency, it was observed that after 12:00 LT, there is a tendency to decrease with the increase of magnetic disturbances, this characteristic being more intense after 16:00 LT for summer and winter. For the equinox, such variation was detected, however with half of the amplitude of the other seasons. In addition, the domain of the annual periodicity of the ftIL stands out, while the h'IL presents a semiannual component under the condition of geomagnetic quiet.
- Article
(6064 KB) - Full-text XML
- BibTeX
- EndNote


The deep solar minimum of the solar cycle 23–24 provides an unprecedented opportunity to understand the variability of Earth's ambient ionosphere since 1947. During this period, an unusually inactive state of the Sun with only relatively small sunspot-carrying active regions was observed. The solar fluxes (UV, EUV, and X-rays) responsible for the heating of the upper atmosphere and production of the ionosphere and the well-known 10.7 cm solar radio flux (F10.7 cm) presented very low values when compared to the previous solar cycle of the modern era (see, for example, Tapping, 2013; Tapping and Morgan, 2017; Balan et al., 2012; Kutiev et al., 2013). During this period, a reduction of ionospheric temperatures and densities was detected over several latitudes (Coley et al., 2010; Heelis et al., 2009; Yue et al., 2010; Klenzing et al., 2011; Aponte et al., 2013). The thermospheric total mass density from the prolonged minimum in solar activity between cycles 23 and 24 compared with that of the previous solar minima, presented a reduction of about 10 %–30 % compared with the climatologically expected levels (Emmert et al., 2010). Likewise, Heelis et al. (2009) and Aponte et al. (2013) reported an unprecedented contraction of the topside ionosphere to altitudes that had never been reported before.
Great efforts have been made to better understand the behavior of the different ionospheric layers over the equatorial and low-latitude sectors during this period. Under such conditions, it is expected that the effects caused by geomagnetic activities are highlighted, since the variability of radiation coming from the Sun in this case can be neglected. Liu et al. (2012), for example, discussed the impacts of the high-speed stream in the equatorial ionization anomaly (EIA) development. They showed that the inhibition in the EIA formation was probably due to a westward disturbance dynamo electric field. Santos et al. (2016a) investigated the behavior of the equatorial F region zonal and vertical plasma drifts over Jicamarca during the weak geomagnetic storm of June 2008. Based on a realistic low-latitude ionospheric model (SUPIM – Sheffield University Plasmasphere-Ionosphere Model), they showed that the perfect anticorrelation between the vertical and the zonal drifts close to the evening prereversal enhancement of the zonal electric field was driven mainly by a vertical Hall electric field induced by the primary zonal electric field in the presence of an enhanced nighttime E region ionization (see Abdu et al., 1998). Sreeja et al. (2011), in turn, showed that the daytime E-region westward drift over Trivandrum (8.5∘ N, 77∘ E; dip latitude ∼0.5∘ N) presented a reduction that was simultaneous with the disappearance of the equatorial sporadic E layer (Esq) echoes in the ionograms. In this case, it was suggested that an additional overshielding electric field (westward during the day and eastward during the night), superposed on the ionosphere during the storm main phase, contributed to the observed reduction in the drift.
While the effects of the geomagnetic storms on the E, F, and sporadic-E (Es) layers have been widely investigated, little information can be found about such effects on those layers located in the ionospheric valley, especially during the deep solar cycle minimum of 2008–2009. These layers, which are known as “intermediate layers” (or just “ILs”) are defined as a region of enhanced electron density located in the ionospheric valley that extends from the peak altitude of the daytime E-region to the bottom side of the F-region. Fujitaka and Tohmatsu (1973) reported that the solar semidiurnal atmospheric tide can be the dominant cause of the intermediate layers at night and that the vertical drift of the ionizations by the Sq electric field seems to modify the altitude variation of the ILs during this time. Szuszczewicz et al. (1995) found that the ILs are observed throughout the day and in all latitudes that covered the Northern and Southern Hemispheres. Besides that, they also reported the formation of ILs at high altitudes (>170 km) and a monotonic descent to lower altitudes at rates as high as 8.5 km h−1. Rodger et al. (1981) noted that the ILs over South Georgia (54∘ S, 37∘ W) are characterized by a prior downward movement of the F-layer, followed by the formation of the intermediate layer and its subsequent drift downwards to about 140 km. They also mentioned that initially this downward movement of the ILs can be at the same rate as the F layer but decreases as the ILs attains lower altitudes. Mridula and Pant (2021) studied the behavior of ILs over the equatorial location of Thiruvananthapuram and noted that the occurrence of ILs over this sector is higher in the summer and winter solstice and lower in equinoxes. They also showed that the occurrence of this layer is higher in the solar minimum than in the solar maximum period. The possible influence of the gravity waves in determining these characteristics is also discussed by the authors.
Recently, dos Santos et al. (2019) and Santos et al. (2020, 2021) studied the essential characteristics of the ILs over the Brazilian sector during epochs of minimum and maximum solar activity. It was observed that these layers are predominantly diurnal and present a typical downward movement that can last from minutes to hours. Depending on the height at which the ILs are formed, they can descend and merge with the normal ongoing sporadic – E (Es) layers. The occurrence of ILs over Brazil is high and seems to be dependent on the magnetic inclination angle and independent (or weakly dependent) on the solar activity. Nocturnal ILs also were observed over Brazil, but they are very unusual. Regarding the shape in which the ILs are seen in the ionograms, it was verified that they presented a curved format similar to the “h” type Es layer; however, ILs with a straight format and spreading base appearance were also observed.
The studies conducted so far on the ILs over Brazil give us some indications that the dynamics of these layers can be influenced by the atmospheric tides, gravity waves, and electric fields (Nygrén et al., 1990; Wilkinson et al., 1992). The day-to-day variability in the average ILs' descent velocity also suggests the influence of a periodic perturbation with a periodicity of some days. The velocity values found are compatible with those of the semidiurnal and quarter-diurnal tides. However, the larger descending rate (>10 km h−1) observed over the equatorial region may reveal the additional influence of the gravity waves in IL's dynamics. Additionally, Santos et al. (2021) reported interesting events in which the ILs presented an upward movement at the same time in which the F layer rises due to the evening prereversal enhancement of the zonal electric field. Such a characteristic was observed in most of the cases during a period of high solar activity, between October and April; however, a single case was also observed in 2009. Another interesting characteristic observed is that the ILs could suffer in some way from the influence of the prompt penetration electric fields. Dos Santos et al. (2019), for example, showed a case in which a daytime IL over the equatorial region of São Luis (2∘ S; 44∘ W) on 9 October 2009 presented a strong upward movement that carried the IL to the base of the F2 layer in ∼ 1.5 h. This anomalous rise was probably caused by the joint action of the atmospheric gravity wave propagation and the dawn to dusk PPEF. Santos et al. (2021) also reported the ascending ILs, but during sunset times. As was mentioned by the authors, it is possible that the ILs in these cases were caused by the action of the PRE and in some events by the additional contribution from the prompt penetration electric fields. In all the studied events, the ILs were located at altitudes higher than or equal to 175 km, except the event of 10 November 2003, when an Es layer located at about 120 km of altitude presented an abrupt rise reaching 290 km of altitude in a time interval of ∼ 1.25 h. This rapid rise of the Es and IL layers was probably caused by an eastward electric field of ∼ 0.6 mV m−1 arising from the PRE and the PPEF (for more details, see Santos et al., 2021).
The focus of this paper is to investigate the geomagnetic activity effects on the intermediate layers over the Brazilian low-latitude sector during the deep solar minimum of 2009, regardless of the reasons why such storms were generated. As was mentioned previously, this epoch is especially suited to developing studies like the one proposed here due to the very low values and little variation of the solar decimetric flux (10.7 cm). In this case, the effects caused in the ILs by the variability of radiation coming from the Sun can be neglected and only those caused by geomagnetic variations are considered. The data and methodology used to investigate the possible influence of the geomagnetic storms in the intermediate layers is given in Sect. 2. The results are presented in Sect. 3, and finally, in Sect. 4, the discussion and conclusions.
In this paper, the ionospheric sounding data collected by the Digisonde operated over the low-latitude site, Cachoeira Paulista (CP, 22.42∘ S; 45∘ W, I: −34.59∘), during the deep solar minimum of 2009 are used to verify the possible dependence of the ILs on geomagnetic activity. The ionospheric survey made by Digisonde is based on the reflection of the electromagnetic signal transmitted vertically to the ionosphere with a peak power of the order of 10 kW (for the case of Digisonde DGS256, that is the model used to collect data for 2009 over CP) at frequencies ranging from 0.5 to 30 MHz. The vertical radio sounding makes use of the fact that radio waves are reflected in the ionosphere at the height where the local cutoff frequency equals the frequency of the radio wave. The ionospheric information is recorded in the form of ionograms that display the virtual height of the returned echoes versus their frequency, generally registered at 10 and or 15 min intervals. The Digisonde data used in this work were preprocessed through ARTIST software (Automatic Real Time Ionogram Scaler with True Height) and also manually postprocessed using the SAO-explorer software following the same criteria described by dos Santos et al. (2019). For more details about Digisonde, see, for example, Reinisch (1986) and Reinisch et al. (2009). The ILs' virtual height (h'IL) and top frequency (ftIL) are analyzed as a function of the Kp index. All the ILs observed were included in the analysis, regardless of whether they present a descending or an ascending movement.
Before going into details on the topic that this work proposes, we will first give an overview of the behavior of ILs on the sector of CP. Figure 1 shows the variability of the parameter of frequency and height of the ILs (panels a and b), their distribution with the local time (panel c), as well as their rate of occurrence for different seasons of the year. The red, blue, and gray colors are used to represent the summer (December solstice), winter (June solstice), and equinoxes, respectively. It can be observed that in general the ILs attain higher frequencies (>6 MHz) after 11:00 LT (panel a) (except in some cases) and present a high variability in height during the entire period analyzed (panel b). The downward movement of the ILs is an important characteristic that also can be observed in panel (b). As indicated in panel (c), the occurrence of the ILs during the day is not continuous, which means that the ILs can appear and disappear many times during the day or simply not occur. Additionally, panel (c) also shows that in some periods (especially in winter, with some exceptions), there is a tendency that the ILs be formed a little later (after 08:00–09:00 LT). Regarding panel (d), it can be seen that the occurrence of the ILs in the low-latitude sector of CP increases significantly in the first hours of the day, attaining its maximum at ∼ 14:00 LT in summer, ∼ 12:00 LT in winter, and ∼ 10:30 LT in the equinoxes. In general, the probability of occurrence decays drastically as the nighttime period approaches (note that the seasons were equally divided, i.e., 121 d around the solstices and 61 d around the equinoxes).
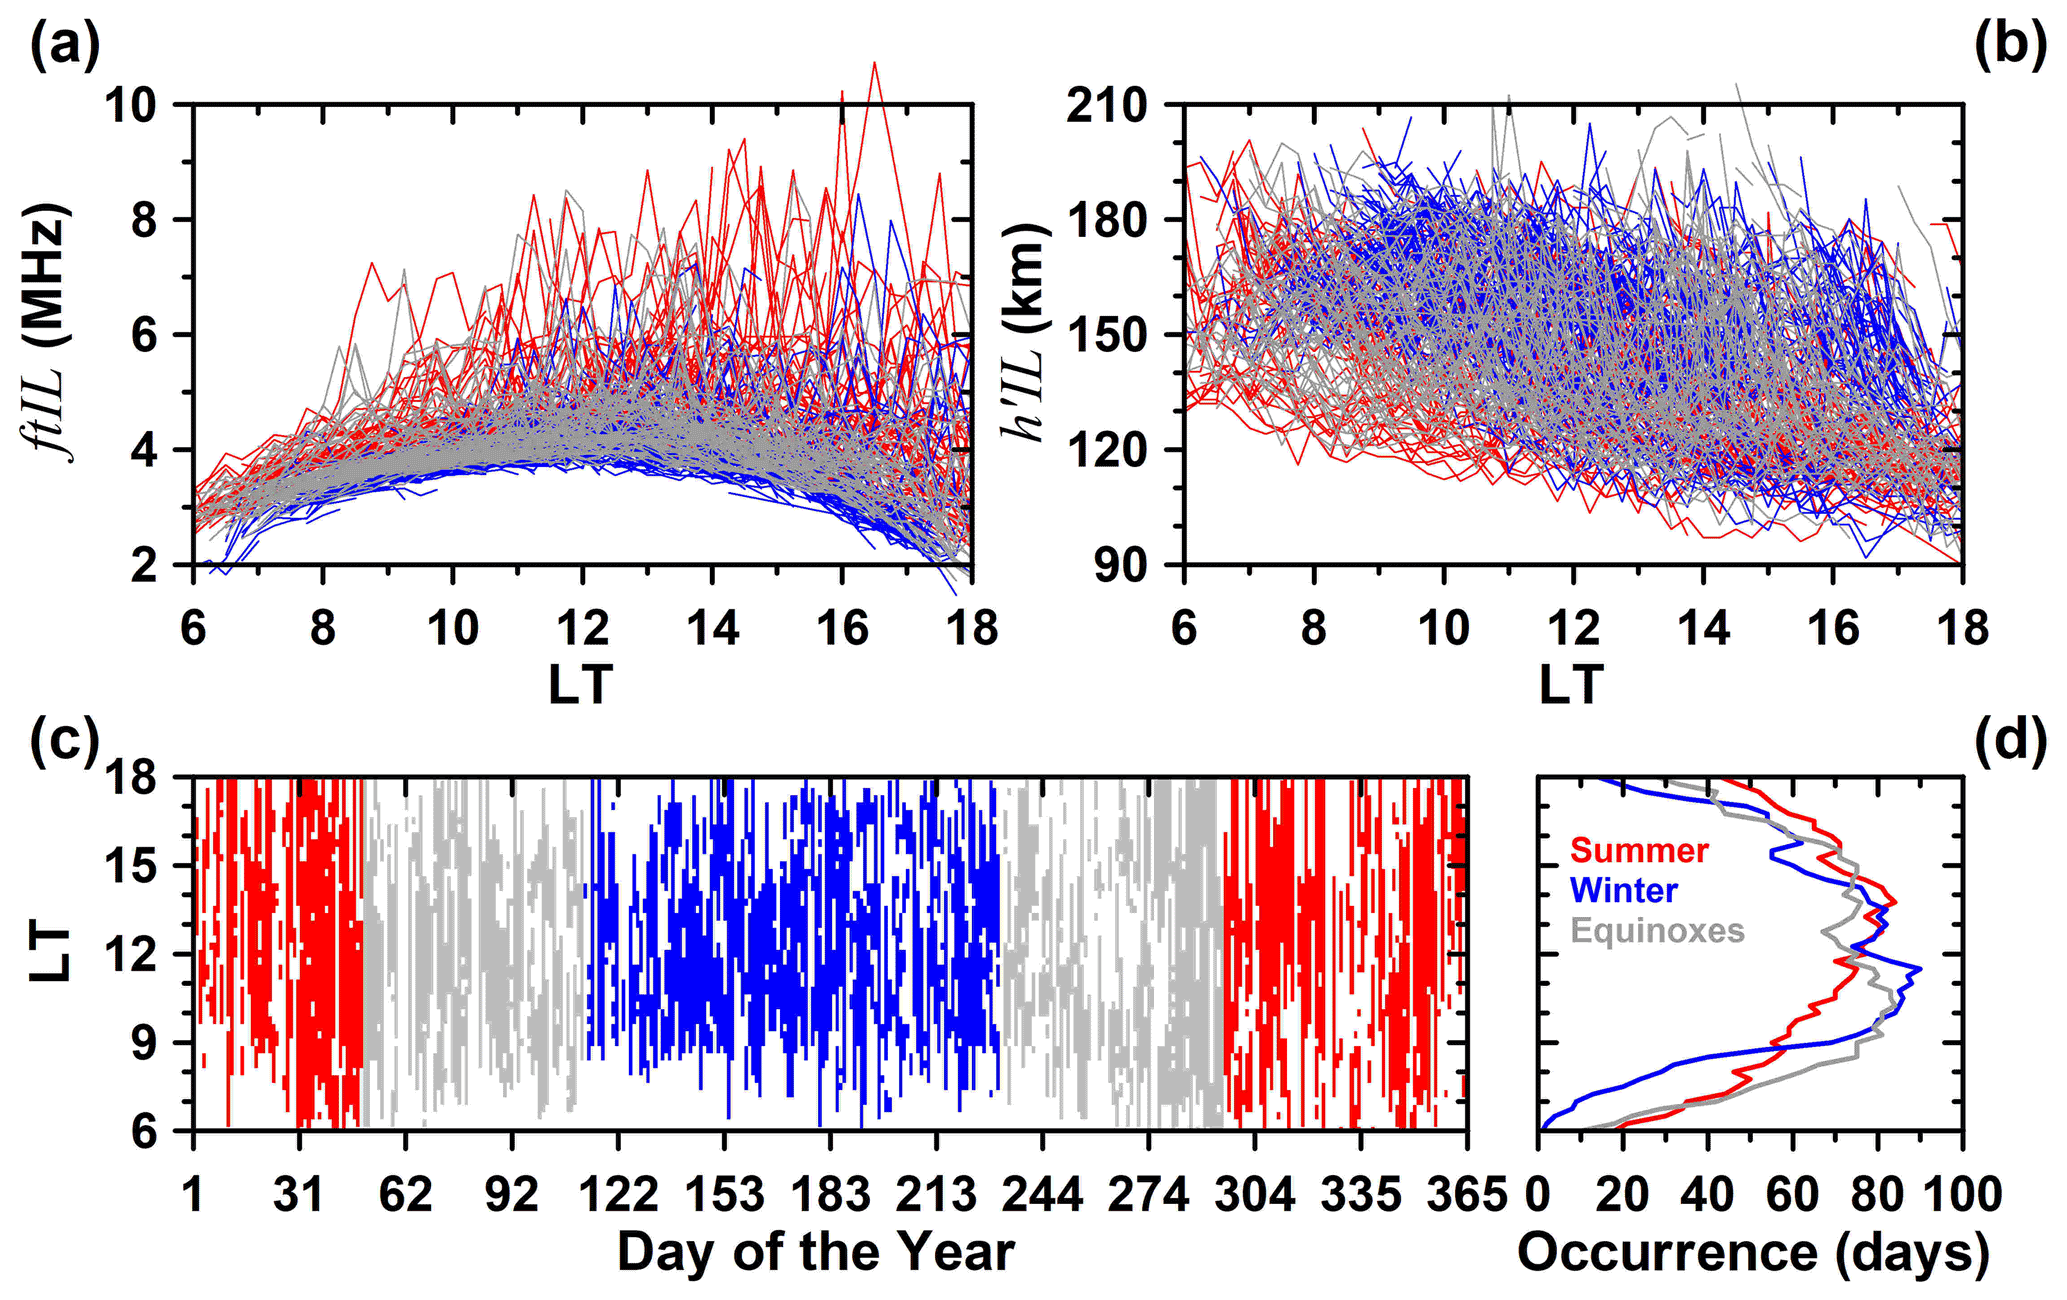
Figure 1Behavior of the frequency (ftIL) and height (h'IL) parameters of the intermediate layers over Cachoeira Paulista during 2009 (a and b, respectively) as functions of local time; distribution of the ILs occurrence with the local time as a function of day of the year for 2009 (c), and the seasonal occurrence probability of the ILs. In each panel, red, blue, and gray are used to represent summer, winter, and equinoxes, respectively (d).
Figure 2 summarizes the geophysical condition of the data distribution according to the solar and geomagnetic activities based on the F10.7P index and Kpav index, respectively. The F10.7P (gray line in the top left panel) is a combination of the daily decimetric solar flux index (F10.7) and one more term (F10.7A), which corresponds to the average of the 81 previous days, thus F10.7P = (F10.7A + F10.7) (given in solar flux units (SFU); 1 SFU = 10−22 W m−2 Hz−1). F10.7P was chosen because several authors have shown that the ionospheric parameters are better described by this index (Brum et al., 2011, 2012; Goncharenko et al., 2013 and references therein). In fact, Brum et al. (2011) and Brum et al. (2012) have shown that the best description of the UV-EUV (based on UV-EUV irradiance data from Pioneer Venus Orbiter (10–150 nm) and by the Solar EUV Monitor on board the Solar Heliospheric Observatory (26–34 and 0.1–50 nm bands)) is given by F10.7P when compared with F10.7. In addition, their works have shown that the UV-EUV emissions tend to increase with F10.7P until a certain threshold (around 175 SFU). However, for low solar activity, the UV-EUV variations with the F10.7P can be well represented by a linear function, and this feature is very important for the methodology employed in this work, as seen below. For more details about F10.7 index, see Tapping (2013) and Tapping and Morgan (2017). The Kpav (grey line in left bottom panel) is the average of the 3 h data current Kp value (Kp(ref)) and the previous 3 and 6 h, that is, Kpav= (Kp(ref)+ Kp Kp, which gives the standard behavior of the geomagnetic activity and avoids sharp gradients in the temporal edges of this index (every 3 h). Then, in the case of Kpav, different values can be defined per day, since the ILs can occur in different intervals of the day.
The occurrence number in hours of the Kpav level during 2009 is presented in the right bottom panel of Fig. 2 (red bars). It is observed that all of the data were acquired during very low to normal geomagnetic activity (Kp or 3.3) according to the Wrenn et al. (1987) classification. Such a distribution is very similar to that found by Terra et al. (2020) when the authors analyzed the MSTID events for the period starting in the middle of 2018 to the end of 2019 (also low solar activity). Note that the occurrence of various levels of magnetic activity is well distributed throughout the year (left bottom panel of Fig. 2), and this behavior is the optimum condition for the kind of analysis of this work, as will be seen in this report. Tsurutani et al. (2011) have studied part of the period in analysis and showed that the causes of the low geomagnetic activity during the end of cycle #23 can be related to the solar midlatitude small coronal holes, low IMF Bz variances, low solar wind speeds, and low solar magnetic fields. Regarding the solar activity, the period that encompasses our dataset is the end of solar cycle #23 and the beginning of solar cycle #24. A growth of activity and fluctuations of F10.7P along the year is observed, varying from 66.5 to 78.1 SFU (average of 70.1 SFU, top right panel), and an uneven distribution of F10.7P (left upper panel) may be noted. Schrijver et al. (2011) showed that in agreement with the yearly averaged sunspot number, only 5 of 28 cycles since 1700 had a minimum lower than in early 2009. From mid-2008 until September 2009, the fraction of spot-free days fluctuated around 82 %, which was unprecedented in the age of modern instrumentation. Using Johann Heinrich Müller's sunspot observations from 1709 (Fig. 5 of Hayakawa et al., 2021a) and the sunspot catalog published by the Kislovodsk Mountain Astronomical Station of the Central Astronomical Observatory at Pulkovo for the recent solar cycles (1996–2019), Carrasco et al. (2021) showed that one of the most active years in the Maunder Minimum (1709), was still less active than most years in the Dalton Minimum and also less active than those of the most recent solar minima. Additionally, they mentioned that only the solar activity levels in 2008, 2009, and 2019 were similar to or lower than (as in the case of 2008) the most probable active day fraction value for 1709 (for more details, see Fig. 2 of Carrasco et al., 2021). This reinforces how special the period chosen here is to analyze the possible dependence of ILs on geomagnetic activity. For more details about the Maunder Minimum, see Usoskin et al. (2015, 2021), Carrasco et al. (2021), and Hayakawa et al. (2021a, b).

Figure 2Variability of the solar and geomagnetic activity quantified by the F10.7P (a, b) and the Kpav indices (c, d). (a) and (c) show the geophysical conditions as a function of the day of the year, while (b) and (d) show their corresponding number of occurrences (in hours) under different geophysical conditions. The dots of (a) represent the 41 d' averages and the standard deviation of F10.7P, while the dots of (c) represent the same range of days of (a) and (b) and its respective standard deviation but for Kpav≤2.3 (geomagnetic condition used to construct the quiet time condition of h'IL and ftIL) (Note: (a) and (c) show the geophysical conditions as a function of the day of the year (gray line)). The red continuous lines are the reconstruction of these variabilities using fast Fourier transform (FFT). The given occurrence in the right column of panels is the number of hours for a given interval of Kpav (0.125) and F10.7P (0.5 SFU).
From the h'IL and ftIL data, an empirical climatological model was developed that accounted for the dependencies of these parameters on time and season, under low solar and geomagnetic activities. Determining the variability of ILs parameters in function of time and season make the isolation of any changes related to geomagnetic activity possible. The first step in our methodology was to extract the seasonal quiet time behavior of the h'IL and ftIL parameters. To this end, the weighted arithmetic mean defined as x(trefd) represented as (Eq. 1) was employed
where x denotes h'IL or ftIL values under the geomagnetic activity condition below Kpav≤2.3 for the time reference tref and the selected day of the year (d= DOY). The average value of height and frequency of the ILs was calculated considering 20 d adjacent to the dref and 30 min around the tref.
From the quiet time variability of the h'IL and ftIL obtained by weighted arithmetic mean process described above, a simple model was built using finite Fourier series reconstruction following the procedure by Souza et al. (2010) and Brum et al. (2011), given by
where xV(t,d) is the reconstructed variable as a function of time in LT (t), and DOY (d) (xV stands for h'IL or ftIL), f1 is the fundamental frequency of the parameter to be reconstructed (), A0(t) is the annual average of such a parameter for a given (t), and finally, Am(t) and Bm(t) are the mth Fourier coefficients also as a function of time. The terms A0(t), Am(t) and Bm(t) were incorporated into the model using polynomial fittings in function of time (LT), as shown in Fig. 3, for the harmonics m=1 (1 year), m=2 (∼ 6 months), m=3 (∼ 4 months), and m=4 (∼ 3 months). The upper left (h'IL) and right (ftIL) panels show the time dependence of A0(t) open circles for Fourier coefficients. Similarly, the values of Am(t) and Bm(t) are presented in the lower panels by the blue and red circles, respectively. In all the panels of this figure, the best polynomial fitting is represented by the continuous lines following the same color scale described above.
Based on the model output described above, Fig. 4 shows the behavior of the h'IL and ftIL during the year from 06:00 to 18:00 LT (top and bottom panel, respectively). The right panels show the dispersion diagram between the model and its respective weighted arithmetic mean (under Kpav≤2.3) obtained by Eq. (1), wherein it is possible to see the good correlation between the observation and the modeled data. The left panels show the dominance of the semiannual and annual variation of the ILs' virtual height and top frequency, respectively. It is interesting to observe that the upper intermediate layers (>160 km) are formed as winter approaches in the Southern Hemisphere between ∼ 06:00 and 11:00 LT, with a maximum in April–May (DOY 92-153) before the local noon. A second maximum is observed from the beginning of November to the middle of January (DOY 304-15), however, in a more restricted range of time (prior ∼ 09:00 LT). After 12:00 LT, the ILs are generally located at altitudes at or below 150 km. In addition, it is observed that the evolution of the ILs to altitudes below 120 km was more evident between the months of April and May (DOY 92-153) at the end of the day. The bottom left panel shows an annual variation of the top frequencies, with a maximum at about 12:00–13:00 LT from November to February (DOY 304-62). It can be observed that the upper ILs present lower frequencies when compared to the layers located near 150 km. As the ILs descend, they can reach the E region and merge with the existing sporadic-Es layer increasing, in this way, the top frequency of the layer due to the presence of the metallic ions.
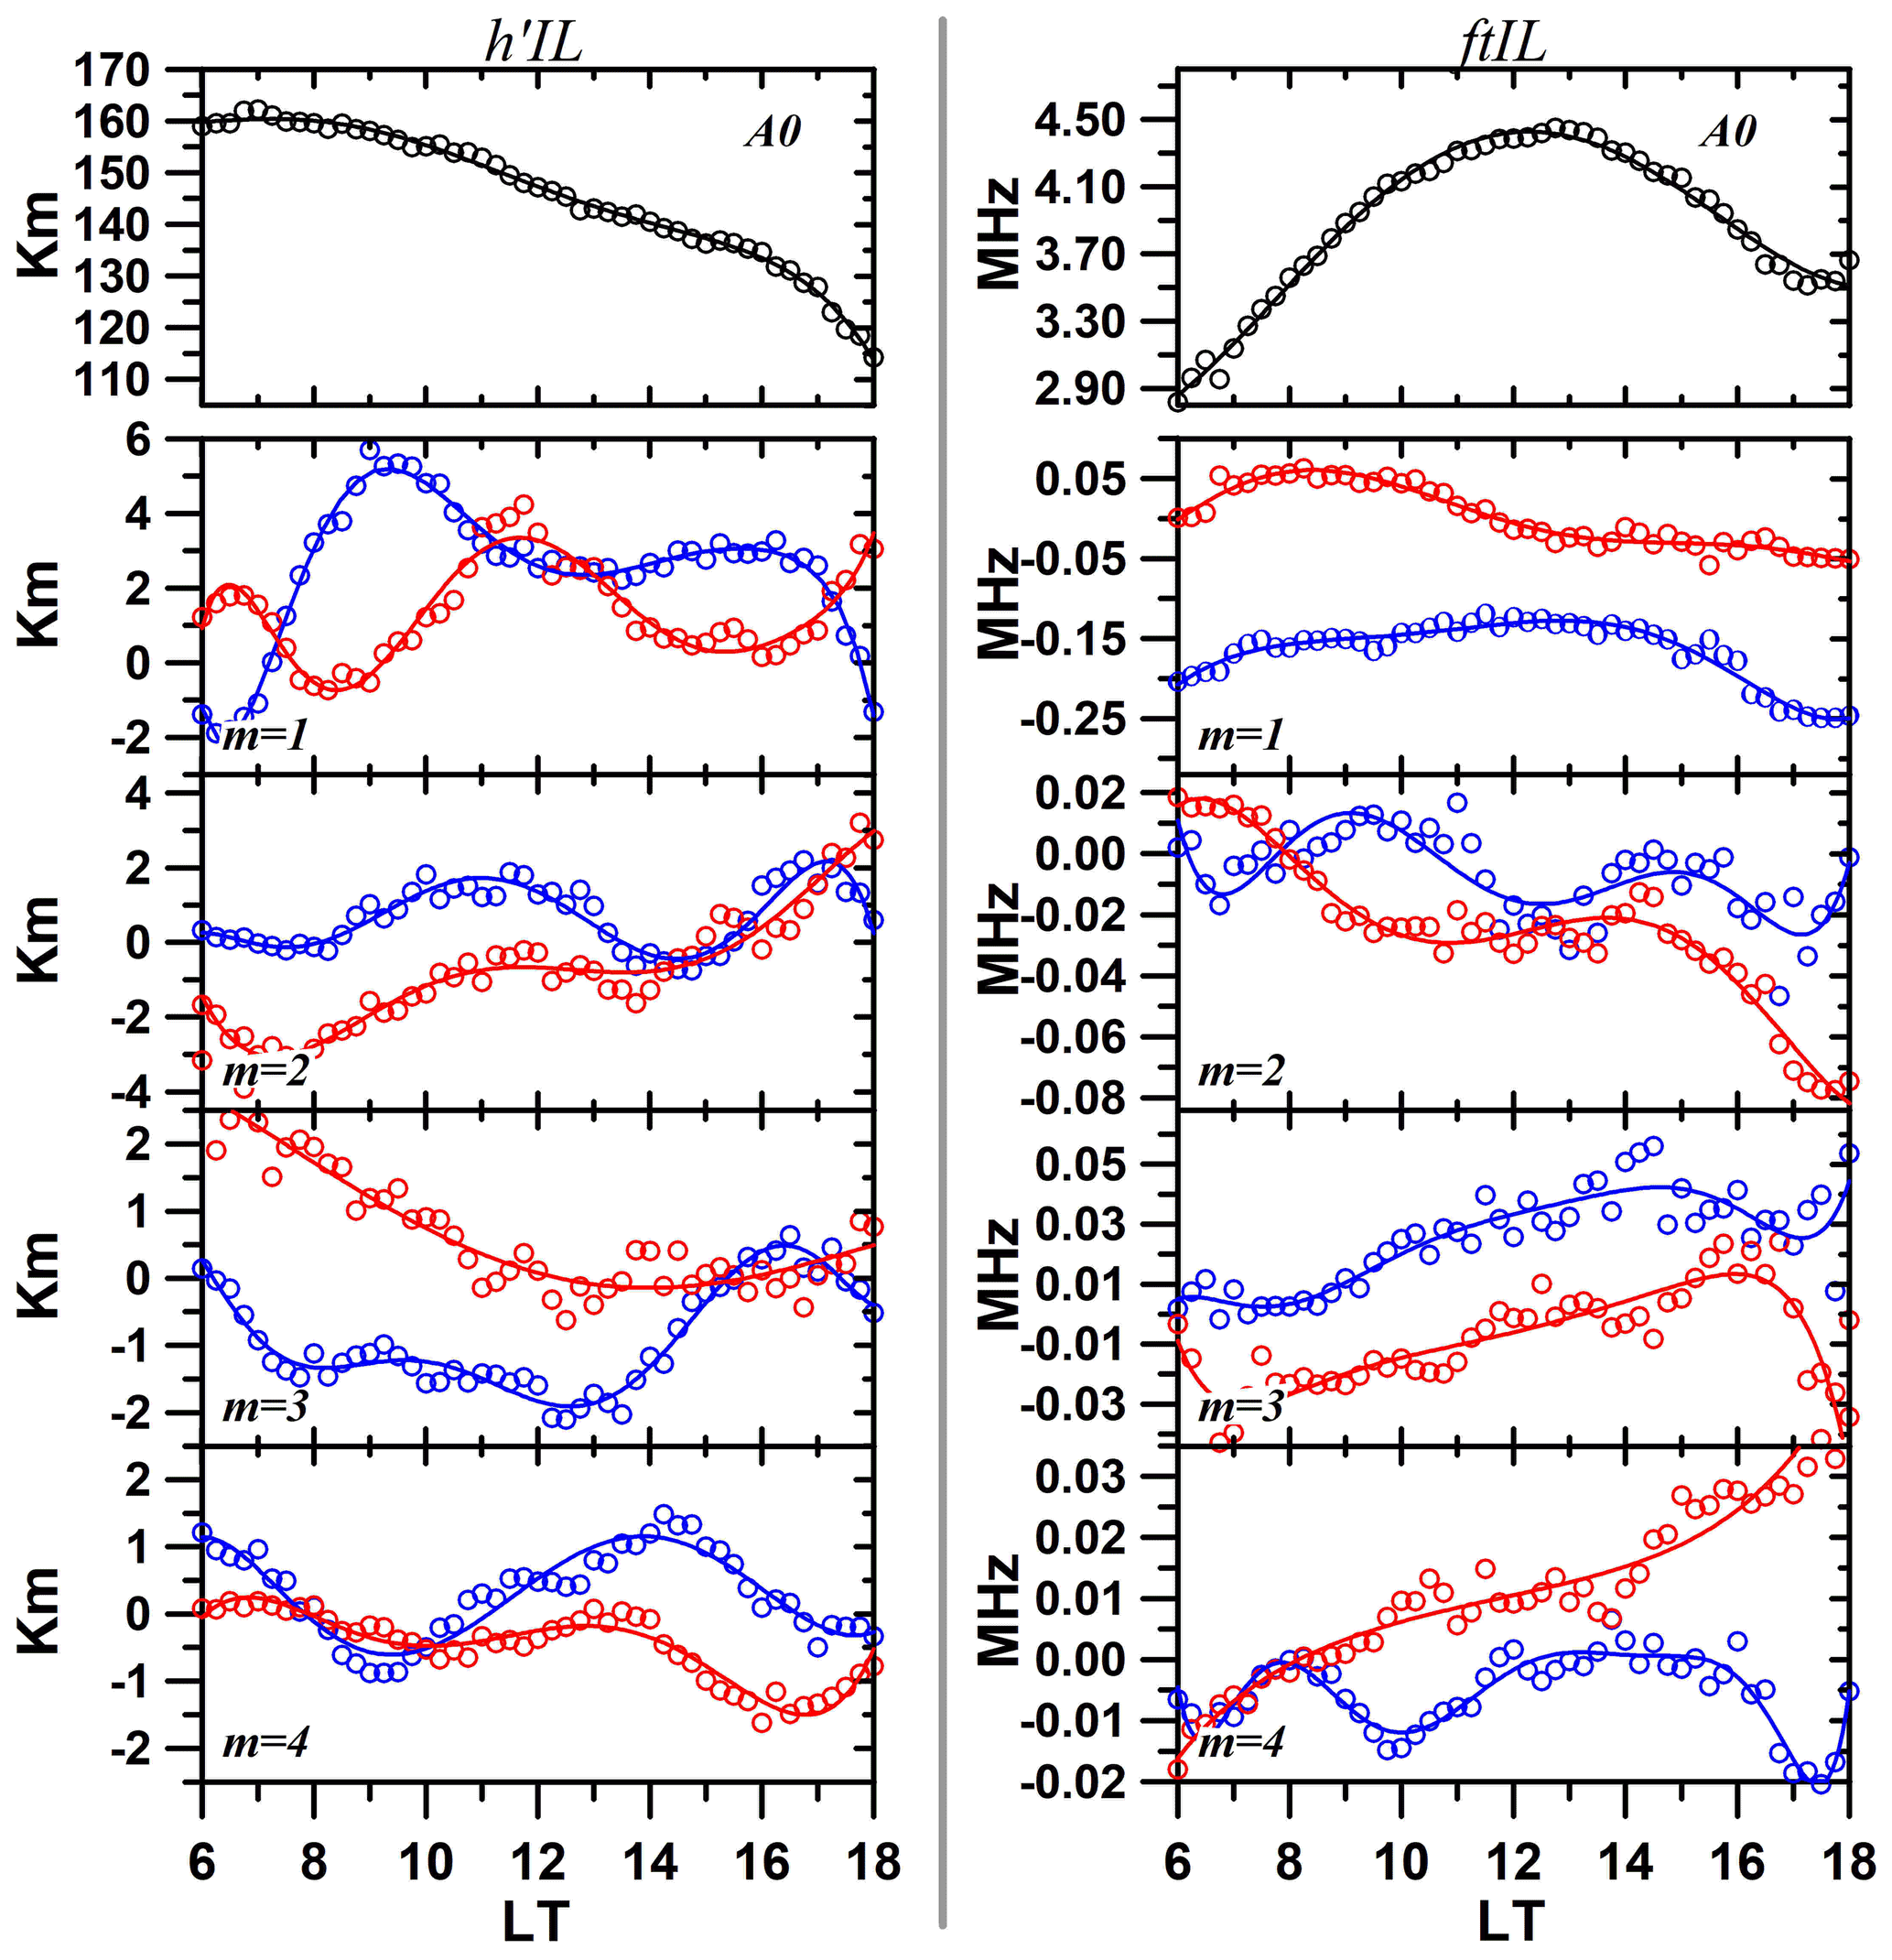
Figure 3Dependence of the h'IL ftIL's FFT coefficients as a function of LT (left or right, respectively). The circles are the values obtained by the FFT decomposition, while the continuous lines are the best polynomial approximation. The colors blue and red are used to represent the coefficients values of Am(t) and Bm(t), respectively.

Figure 4Contour plot of the annual variation of the modeled virtual height (h'IL, a) and top frequency (ftIL, c) of the intermediate layers over Cachoeira Paulista. The dispersion diagrams on the right-hand side show the correlation between the weighted arithmetic mean and model results. In (b) and (d), the correlation coefficient (R) and root mean square error (RSME) values are also provided.
Figure 5 exemplifies how the dependence of the different parameters of the intermediate layers in respect to geomagnetic activity was investigated in this work using ΔKpav. The ΔKpav is the mean of the respective Kpav (gray line in the left bottom panel of Fig. 2, Kpav= (Kp(ref)+ Kp Kp) minus the average of any value below Kpav≤2.3 in a range of ± 20 d (this is the geomagnetic condition that the model was developed for, the red line shown in the left bottom panel of Fig. 2). Note that the usage of the residuals minimizes the background quiet time behavior variation along the time (LT and season), enhancing in this way the detection of the real contribution or not of the geomagnetic activity on the ILs parameters. The upper panel of Fig. 5 shows the whole dataset sorted from the lowest to the highest ΔKpav values and divided into eight sections with the same percentage of samples for each range of ΔKpav (12.5 %, represented by the black vertical lines) for the summer (December solstice) at 17:30 LT ± 30 min. Specifically, for this example, the selected range represents 178 data points, i.e., each 12.5 % displays the behavior of ∼ 22 individual data samples. This panel also displays the respective F10.7P values (red line) and its respective average and standard deviation (blue open circles) for the same sorted 12.5 % occurrence range of ΔKpav. Note that the F10.7P mean variation for each range does not vary much, which leads us to emphasize that the following variations of ILs are due to geomagnetic activity. The bottom panels show the h'IL and ftIL responses to the geomagnetic activity by the residual average obtained by the difference of the data and the model output presented in Fig. 4 in function of ΔKpav. The open circles represent the average values of the height and frequency residuals (Δ h'IL and Δ ftIL, respectively) for the eight different levels of ΔKpav and their respective standard deviations (vertical and horizontal lines). The linear fitting is indicated by the blue lines. The slope (SLP) of the dependence of h'IL and ftIL with respect to the geomagnetic activity variation (km ΔKp−1 and MHz ΔKp−1) and the correlation factor (R) are also shown. In this example, it can be clearly observed that as the geomagnetic activity increases, the height of the intermediate layers also increases. The opposite occurs with the frequency when an increase of ΔKpav causes a decrease in this parameter.
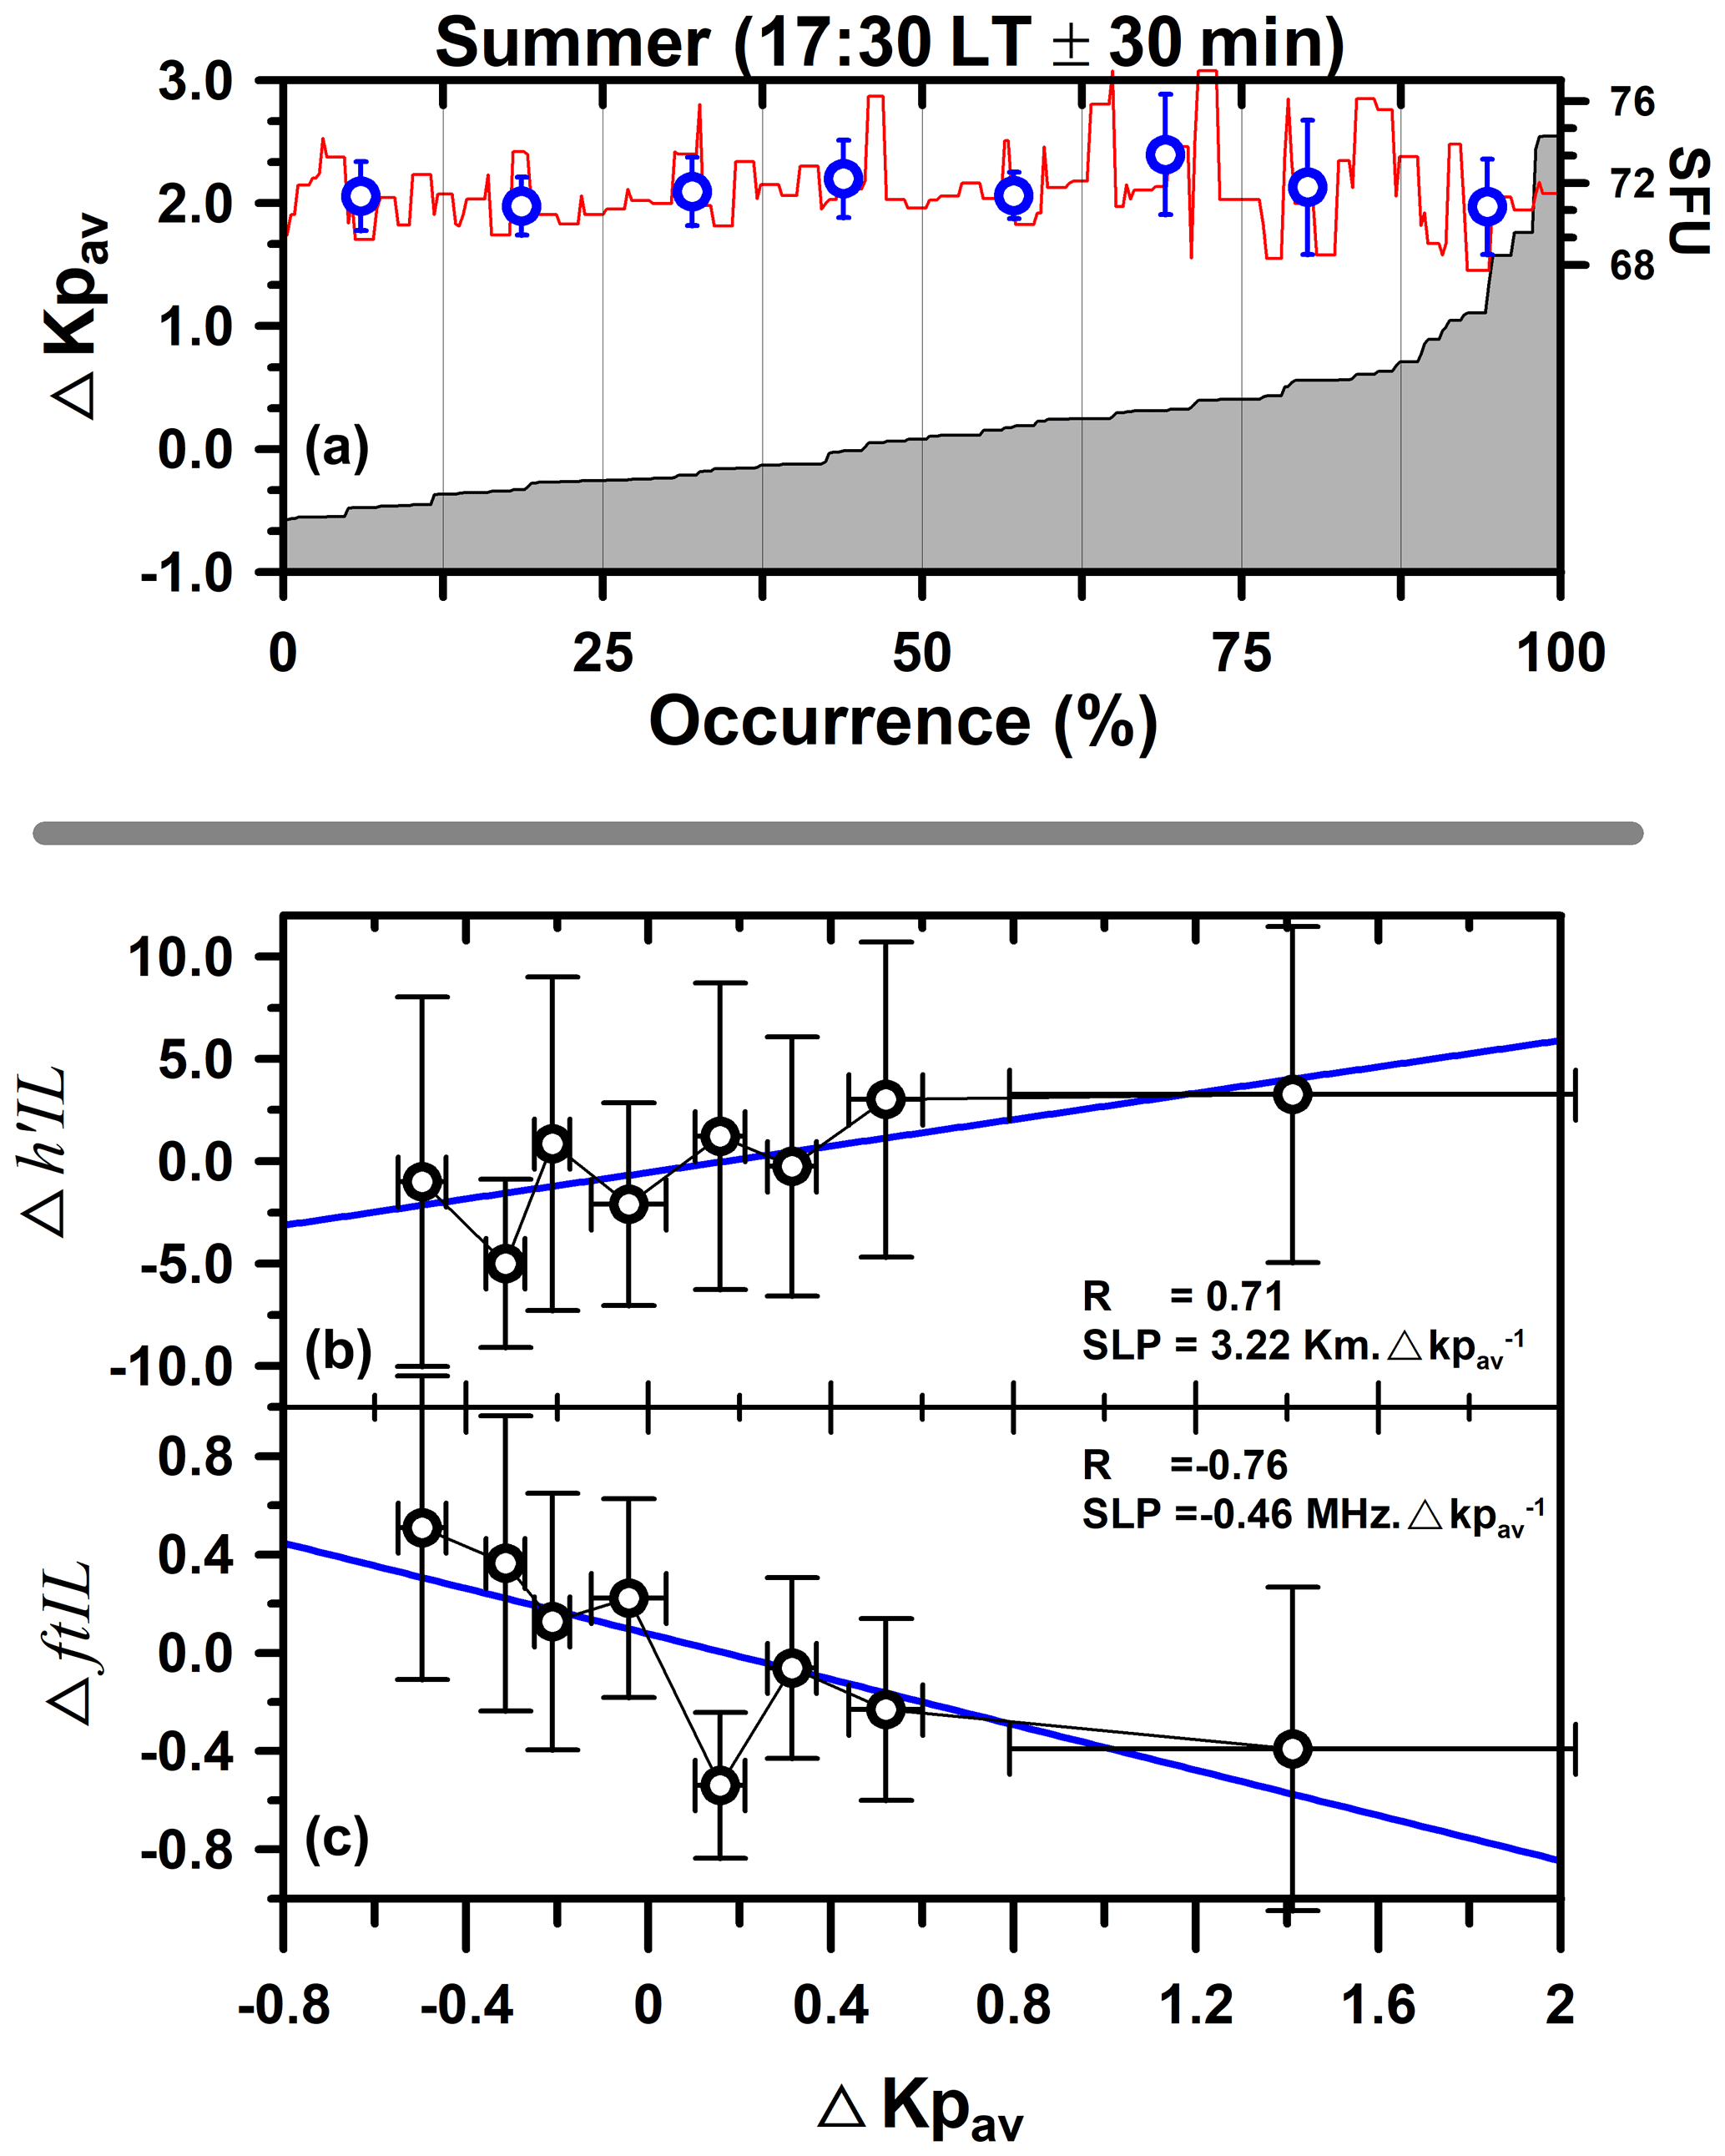
Figure 5Responses of the intermediate layer to the geomagnetic activity for summer at 17:30 LT ± 30 min. (a) shows the ΔKpav data organized from the lowest to the highest values and divided into eight sections with the same percentage of samples. In addition, the values of F10.7P with respect to ΔKpav and the average of the F10.7P (blue open circles) for each section are also presented. (b) and (c) show the linear regression fitting over the height and frequency residual variability relative to the average ΔKpav values.
The same methodology explained in the case of Fig. 5 was applied to all the data between 06:00 and 18:00 LT for each season. Figure 6 shows the dependence of ILs on the geomagnetic activity in terms of height (the first two columns from left to right) and frequency (two columns on the left) for the different seasons of the year (the data were grouped in seasons as shown in panel c of Fig. 1). The correlation coefficient (R) of both parameters is also shown at the right column of each block of panels. The variations of the geomagnetic activity presented in this figure were 2.13 ± 0.28 (summer), 2.18 ± 0.24 (equinoxes), and 1.72 ± 0.21 (winter) in Kp index. It is observed that the higher variability in the height of ILs with geomagnetic activity occurs during the summer period. In this case, the IL was located lower than the expected position with the increase of the geomagnetic activity in the beginning of the day. In the following hours, this condition decreases until a moment in which the opposite behavior occurs, that is, a small rise of the IL begins to be observed with the increase of the ΔKpav. Although some fluctuation in the R-value can be observed (mainly during the equinox and winter), there is a tendency for the height of the ILs' to increase with the ΔKpav variation in all seasons after ∼ 12:00 LT, as can be seen by the positive values of km ΔKp. Regarding the behavior of the frequency, it is noticed that in the summer, the ftIL parameter presented a tendency to increase with the geomagnetic activity in the beginning of the day (∼ 0.1 MHz ΔKp); however, from ∼ 12:00 LT on there is a significant decrease in the ftIL with ΔKpav (mainly after 16:00 LT), as can be confirmed by the negative values of the coefficient correlation (R). During the equinox, the general tendency is that the ftIL decreases during the day, and during winter, and little or no response of the top frequency to ΔKpav variability can be observed prior 16:00 LT, and there is a sharp decrease after the period referred to similar to what is observed during the summer.

Figure 6Geomagnetic activity effects on h'IL and ftIL parameters for different seasons. The first two panels (from left to right) show the linear regression of the h'IL as a function of the ΔKpav index over the different times of the day and the correlation coefficient R. The two right panels indicate the same but for the ftIL parameter.
It is well known that geomagnetic activity can drastically modify the low-latitude ionospheric dynamics. During the last solar minimum, a unique opportunity was available to investigate such dynamics, since the effects of the solar activity, which dominates the temporal variability of ionospheric properties, could practically be disregarded due to very low solar radiation variation. Using Digisonde data from a Brazilian low-latitude station, Cachoeira Paulista, we studied the impacts of the geomagnetic activity in the height and top frequency of the intermediate layers during the deep solar minimum of 2009.
The results summarized in Fig. 6 revealed, for the first time, that the most expressive response of the ILs over the low-latitude region of Brazil to geomagnetic activity occurred during the early morning hours (∼ 06:00–08:00 LT) of the summer when the ILs presented a significant variation of altitude with the increase of the ΔKpav (as indicated by the negative values of the km.ΔKp in h'IL panels). One of the hypotheses to explain such variation in the h'IL parameter is that this behavior can be related to dusk-to-dawn directed PPEF (see, for example, Tsurutani et al., 2008). Such electric fields have westward polarity during the daytime and, therefore, it may be one of the factors responsible for the occurrence of lower h'IL at this time. As pointed out by Santos et al. (2021), depending on the height at which the ILs are located, the electric field disturbance can affect the vertical displacement of the intermediate layers considerably.
Another interesting point that needs to be considered is that the movement of the ILs can also be influenced by the regular undisturbed day-to-day variations in the zonal electric field of the ionosphere that is directed to east during the daytime and west during the nighttime hours. Therefore, it is possible that in the first 2–3 h of our analysis period, the lowering of the h'IL with the increase of ΔKpav (negative values of the rate km ΔKp) could be a result of a competition between the eastward zonal electric field created by the E-region dynamo and the disturbance westward electric field arising from the overshielding process. In the following hours, an opposite situation was observed, that is, a small rise of the ILs occurred in all seasonal periods analyzed, as denoted by the positive values of the rate
km ΔKp in the first set of panels on the left in Fig. 6. As mentioned by dos Santos et al. (2019), the rise of an IL during daytime can also be a result of the joint action of the of the eastward PPEF (undershielding) and gravity wave propagation. In the case studied by dos Santos et al. (2019), the rise of the IL was also accompanied by a decrease in their top frequency. Wakai (1967) reported that the height of the intermediate layer over Boulder (40∘ N; 105∘ W) can also be influenced by the magnetic disturbances; however, their observation was made during the nighttime.
At the same time in which a decrease in the ILs height was observed, an increase in the ftIL parameter occurred during the summer between 08:00 and 12:00 LT attaining a maximum of 0.2 MHz ΔKp at 09:00 LT. It is interesting to observe that before 12:00 LT, for example, the rate variation of the ftIL was positive, indicating that when they are located in lower altitudes, the ILs' top frequency increased in relation to its quiet time values. This increase in the frequency is expected since as the layer descends, it can suffer an additional increase of ionization arising from the metallic ions that contribute to the ion density in the ongoing sporadic-E (Es) layers. As the ILs presented a rise after 13:00 LT, the tendency was that the ftIL decrease with the increase of ΔKpav. Note that the after 16:00 LT, this decrease is more accentuated during the summer and winter. Analyzing the incoherent scatter data from the mid-latitude region of Arecibo, Raizada et al. (2017) showed that the integrated electron content (E-region total electron content – ErTEC) between 80 and 150 km altitude regions presented a maximum variability throughout the night due to geomagnetic activity for both low and high solar activity during equinox periods. Besides that, the authors also verified that the integrated electron content during geomagnetically disturbed or normal conditions and high solar flux periods displays positive changes during summer and equinox, while it is negative in winter. Wakai (1967) reported a study about the maximum electron concentration of the nighttime E layer, the valley above it, and the appearance of the intermediate layer from analysis of the low-frequency ionogram obtained at Boulder on three nights of quiet, moderate, and severe geomagnetic activity. They observed an increase of the ionization in the nighttime valley at times of increased magnetic activity and the appearance of an intermediate layer in ∼ 150–160 km during periods of moderated activity. Eventually, the IL can be impacted by the energetic particle precipitation (EPP) (see, for example, Santos et al., 2016a, b), mainly during the occurrence of intense geomagnetic storms. Furthermore, as the present study refers to a period in which the geomagnetic storms were considerably weaker. That said, we believe that if ILs were impacted in any way by the EPP, it would not be relevant to our investigation at this moment. In addition, theoretical simulation of ion-pair production by EPP over Cachoeira Paulista have shown that the peak production of electrons is comfortably below the IL's minimum height used in this work (Brum et al., 2006; Brum, 2021).
The effects of the magnetic storms on the intermediate layer were studied also by Rodger et al. (1981) using ionosonde data from South Georgia (54∘ S; 34∘ W). They showed that the rate of the downward movement and the final height of the nocturnal intermediate layer are independent of the season or magnetic activity. Additionally, they observed that the probability of formation of an IL when the minimum virtual height of the F2 layer is above 220 km is very low, but it can increase during magnetically disturbed periods. As was shown by Santos et al. (2020a), the occurrence of ILs over Cachoeira Paulista (22.42∘ S; 45∘ W) was very high both in 2009 (a low solar activity year and the same period of this report) and 2003 (a high solar activity year). These results show that, in general, the ILs occurrence resulted to be independent of the magnetic disturbances, since the two periods of geomagnetic activity referred to are totally different from each other. However, their development and dynamics over the Brazilian sector can be affected by disturbed electric fields, as shown by the results presented here and previous other publications (dos Santos et al., 2019; Santos et al., 2021).
Although the impacts of the geomagnetic activity on different layers of the ionosphere have been studied extensively, there is a lack of information about what happens in the ionospheric valley region during such conditions, mainly over the low and equatorial latitudes. Using the low-power VHF radar data over the equatorial site of Jicamarca, Chau and Kudeki (2006) showed that the 150 km echoes were not affected by the electric field reversal caused by a magnetic disturbance (Kp = 5). As mentioned by them, a statistical study on the ILs occurrence based on the magnetic activity index Kp did not identify any correlation between magnetic activity and the 150 km echoes. On the other hand, our results show that a small variation in ΔKpav index (∼ 2.0) can affect the ILs, especially in the morning period of the summer and late afternoon of all season over the low-latitude sector over Brazil. Although the techniques used by us are different from those used by Chau and Kudeki (2006), the contrasting result reveals that the ionospheric valley is a complex region, and additional studies need to be performed to understand the physical mechanism governing the generation of the intermediate layers during the occurrence of magnetic disturbances. It is important to emphasize that for the first time, it was shown that a small variation in ΔKpav index (by ∼ 2.0) was able to impact the dynamics of the intermediate layer over the low-latitude region during the period of deep solar minimum. The main results of this work are summarized as follows:
-
A small variation in the geomagnetic activity during low solar activity can affect both the parameter of height and frequency of the ILs over the low latitude Brazilian sector, and such responses are dependent on local time and season.
-
During the summer, the height of the ILs tends to be lower with the increase of magnetic activity in the first hours of the day. This characteristic was probably caused by a dusk to dawn electric field.
-
During the daytime, the smoothed rise of the h'IL can be related to the regular day-to-day undisturbed zonal electric field of the ionosphere.
-
With respect to the top frequency dependence with geomagnetic activity, before 12:00 LT, positive or null variation in all seasons was observed. After midday, there is a tendency that the ftILs decrease with the magnetic disturbances, this characteristic being more intense after 16:00 LT for the summer and winter.
-
The domain of a semiannual and an annual component variation was observed in parameters of height and top frequency of the ILs, respectively, for very quiet time, geomagnetic conditions.
The Digisonde data can be downloaded in Zenodo (identified as CAJ2M 2009 in https://doi.org/10.5281/zenodo.3967542, Santos et al., 2020b).
AMS and CGMB processed the data, performed the analysis and wrote the paper. ISB, MAA, JHAS, JRS contributed in the interpretation of the data.
The contact author has declared that neither they nor their co-authors have any competing interests.
Publisher's note: Copernicus Publications remains neutral with regard to jurisdictional claims in published maps and institutional affiliations.
This article is part of the special issue “From the Sun to the Earth's magnetosphere–ionosphere–thermosphere”. It is a result of the VIII Brazilian Symposium on Space Geophysics and Aeronomy & VIII Symposium on Physics and Astronomy, Brazil, March 2021.
The Kp index was obtained from the World Data Center for Geomagnetism, Kyoto (http://wdc.kugi.kyoto-u.ac.jp/index.html, last access: 8 November 2019) and Solar Radio Flux (F10.7 cm) from the National Oceanic and Atmospheric Administration (NOOA). The Arecibo Observatory is operated by the University of Central Florida under a cooperative agreement with the National Science Foundation (AST-1744119) and in alliance with Yang Enterprises and Ana G. Méndez-Universidad Metropolitana.
Ângela M. Santos is grateful for the financial support from FAPESP (process number: 2015/25357-4) and CNPq (grant no. 165743/2020-4). Inez S. Batista is grateful for CNPq grant numbers 306844/2019-2 and 405555/2018-0. One of us (José H. A. Sobral) had Grant number 303383/2019-4 from the Conselho Nacional de Desenvolvimento Cientifico e Tecnológico (CNPq). Jonas R. Souza would like to thank the CNPq (grant no. 307181/2018-9) for the research productivity sponsorship and the INCT GNSS-NavAer supported by CNPq (grant no. 465648/2014-2), FAPESP (grant no. 2017/50115-0) and CAPES (grant no. 88887.137186/2017-00).
This paper was edited by Luis Vieira and reviewed by two anonymous referees.
Abdu, M. A., Jayachandran, P. T., MacDougall, J., Cecile, J. F., and Sobral, J. H. A.: Equatorial F zonal plasma irregularity drifts under magnetospheric disturbances, Geophys. Res. Lett., 25, 4137–4140, https://doi.org/10.1029/1998GL900117, 1998.
Aponte, N., Brum, C. G. M., Sulzer, M. P., and Gonzalez, S. A.: Measurements of the O+ to H+ transition height and ion temperatures in the lower topside ionosphere over Arecibo for equinox conditions during the 2008–2009 extreme solar minimum, J. Geophys. Res.-Space, 118, 4465–4470, https://doi.org/10.1002/jgra.50416, 2013.
Balan, N., Chen, C. Y., Liu, J. Y., and Bailey, G. J.: Behaviour of the low latitude ionosphere-thermosphere system at long deep solar minimum, Ind. J. Radio Space Phys., 41, 89–97, 2012.
Brum, C. G. M.: The impacts of particle precipitation spectrum on the 30 MHz cosmic noise absorption over the under the South Atlantic Anomaly Region, 2021 34th General Assembly and Scientific Symposium of the International Union of Radio Science (URSI GASS), Rome, Italy, 28 August–4 September 2021, 1–4, https://doi.org/10.23919/URSIGASS51995.2021.9560414, 2021.
Brum, C. G. M., Abdu, M. A., Batista, I. S., Carrasco, A. J., and Santos, P. M. T.: Numerical Simulation of Nighttime Electron Precipitation in the Lower Ionosphere over a Sub-Auroral Region, Adv. Space Res., 37, 1051–1057, https://doi.org/10.1016/j.asr.2006.02.003, 2006.
Brum, C. G. M., Rodrigues, F. S., dos Santos, P. T., Matta, A. C., Aponte, N., Gonzalez, S. A., and Robles, E.: A modeling study of foF2 and hmF2 parameters measured by the Arecibo incoherent scatter radar and comparison with IRI model predictions for solar cycles 21, 22, and 23, J. Geophys. Res., 116, A03324, https://doi.org/10.1029/2010JA015727, 2011.
Brum, C. G. M., Tepley, C. A., Fentzke, J. T., Robles, E., dos Santos, P. T., and Gonzalez, S. A.: Long-term changes in the thermospheric neutral winds over Arecibo: Climatology based on over three decades of Fabry-Perot observations, J. Geophys. Res., 117, A00H14, https://doi.org/10.1029/2011JA016458, 2012.
Carrasco, V. M. S., Hayakawa, H., Kuroyanagi, C., Gallego, M. C., and Vaquero, J. M.: Strong evidence of low levels of solar activity during the Maunder Minimum, Mon. Not. R. Astron. Soc., 504, 5199–5204, https://doi.org/10.1093/mnras/stab1155, 2021.
Chau, J. L. and Kudeki, E.: Statistics of 150-km echoes over Jicamarca based on low-power VHF observations, Ann. Geophys., 24, 1305–1310, https://doi.org/10.5194/angeo-24-1305-2006, 2006.
Coley, W. R., Heelis, R. A., Hairston, M. R., Earle, G. D., Perdue, M. D., Power, R. A., Holt, L. L. H. B. J., and Lippincott, C. R.: Ion temperature and density relationships measured by CINDI from the C/NOFS spacecraft during solar minimum, J. Geophys. Res., 115, A02313, https://doi.org/10.1029/2009JA014665, 2010.
dos Santos, Â. M., Batista, I. S., Abdu, M. A., Sobral, J. H. A., Souza, J. R., and Brum, C. G. M.: Climatology of intermediate descending layers (or 150 km echoes) over the equatorial and low-latitude regions of Brazil during the deep solar minimum of 2009, Ann. Geophys., 37, 1005–1024, https://doi.org/10.5194/angeo-37-1005-2019, 2019.
Emmert, J. T., Lean, J. L., and Picone, J. M.: Record-low thermospheric density during the 2008 solar minimum, Geophys. Res. Lett., 37, L12102, https://doi.org/10.1029/2010GL043671, 2010.
Fujitaka, K. and Tohmatsu, T.: A tidal theory of the ionosphere intermediate layer, J. Atmos. Sol.-Terr. Phys., 35, 425–438, https://doi.org/10.1016/0021-9169(73)90034-2, 1973.
Goncharenko, L. P., Hsu, V. W., Brum, C. G. M., Zhang, S.-R., and Fentzke, J. T.: Wave signatures in the midlatitude ionosphere during a sudden stratospheric warming of January 2010, J. Geophys. Res.-Space, 118, 472–487, https://doi.org/10.1029/2012JA018251, 2013.
Hayakawa, H., Uneme, S., Besser, B. P., Iju, T., and Imada, S.: Sunspot Observations at the Eimmart Observatory and in Its Neighborhood during the Late Maunder Minimum (1681–1718), Astrophys. J., 909, 166, https://doi.org/10.3847/1538-4357/abd949, 2021a.
Hayakawa, H., Lockwood, M., Owens, M., Sôma, M., Besser, B., and van Driel-Gesztelyi, L.: Graphical evidence for the solar coronal structure during the Maunder minimum: comparative study of the total eclipse drawings in 1706 and 1715, J. Space Weather Space Clim., 11, 1, https://doi.org/10.1051/swsc/2020035, 2021b.
Heelis, R. A., Coley, W. R., Burrell, A. G., Hairston, M. R., Earle, G. D., Perdue, M. D., Power, R. A., Holt, L. L. H. B. J., and Lippincott, C. R.: Behaviour of the O+ H+ transition height during the extreme solar minimum of 2008, Geophys. Res. Lett., 36, L00C03, https://doi.org/10.1029/2009GL038652, 2009.
Klenzing, J., Simoes, F. A., Ivanov, S., Heelis, R. A., Bilitza, D., Pfaff, R. F., and Rowland, D.: Topside equatorial ionospheric density and composition during and after extreme solar minimum, J. Geophys. Res., 116, A12330, https://doi.org/10.1029/2011JA017213, 2011.
Kutiev, I., Tsagouri, I., Perrone, L., Pancheva, D., Mukhtarov, P., Mikhailov, A., Lastovicka, J., Jakowski, N., Buresova, D., Blanch, E., Andonov, B., Altadill, D., Magdaleno, S., Parisi, M., and Miquel Torta, J.: Solar activity impact on the Earth's upper atmosphere, J. Space Weather Space Clim., 3, A06, https://doi.org/10.1051/swsc/2013028, 2013.
Liu, J., Liu, L., Zhao, B., Wei, Y., Hu, L., and Xiong, B.: High-speed stream impacts on the equatorial ionization anomaly region during the deep solar minimum year 2008, J. Geophys. Res., 117, A10304, https://doi.org/10.1029/2012JA018015, 2012.
Mridula, N.: Tarun Kumar Pant, Occurrence features of Intermediate Descending Layers [IL] over the equatorial location of Thiruvananthapuram, Adv. Space Res., 69, 2102–2110, https://doi.org/10.1016/j.asr.2021.12.003, 2022.
Nygrén, T., Lanchester, B. S., Huukskonen, A., Jalonen, L., Turunen, T., Rishbeth, H., and Van Eyken, A. P.: Interference of tidal and gravity waves in the ionosphere and an associated sporadic-E layer, J. Atmos. Terr. Phys., 1526, 609–613, 615–623, https://doi.org/10.1016/0021-9169(90)90056-S, 1990.
Raizada, S., Brum, C. G. M., D. Mathews, J. D., Gonzalez, C., and Franco, E.: Characteristics of nighttime E-region over Arecibo: Dependence on solar flux and geomagnetic variations, Adv. Space Res., 61, 1850–1857, https://doi.org/10.1016/j.asr.2017.07.006, 2017.
Reinisch, B. W.: New techniques in ground-based ionospheric sounding and studies, Radio Sci., 21, 331–341, 1986.
Reinisch, B. W., Galkin, I. A., Khmyrov, G. M., Kozlov, A. V., Bibl, K., Lisysyan, I. A., and Luo, Y.: New Digisonde for research and monitoring applications, Radio Sci., 44, 1–15, 2009.
Rodger, A. S., Fitzgerald, P. H., and Broom, S. M.: The nocturnal intermediate layer over South Georgia, J. Atmos. Terr. Phys., 43, 1043–1050, 1981.
Santos, A. M., Abdu, M. A., Souza, J. R., Sobral, J. H. A., and Batista, I. S.: Disturbance zonal and vertical plasma drifts in the Peruvian sector during solar minimum phases, J. Geophys. Res.-Space, 121, 2503–2521, https://doi.org/10.1002/2015JA022146, 2016a.
Santos, A. M., Abdu, M. A., Souza, J. R., Sobral, J. H. A., Batista, I. S., and Denardini, C. M.: Storm time equatorial plasma bubble zonal drift reversal due to disturbance Hall electric field over the Brazilian region, J. Geophys. Res.-Space, 121, 5594–5612, https://doi.org/10.1002/2015JA022179, 2016b.
Santos, A. M., Batista, I. S., Sobral, J. H. A., Brum, C. G. M., Abdu, M. A., and Souza, J. R.: Some differences in the dynamics of the intermediate descending layers observed during periods of maximum and minimum solar flux, J. Geophys. Res.-Space, 125, e2019JA027682, https://doi.org/10.1029/2019JA027682, 2020a.
Santos, A. M., Brum, C. G. M., Batista, I. S., Sobral, J. H. A., Abdu, A. M, and Souza, J. R.: São Luís e Cachoeira Paulista DATA [dataset], https://doi.org/10.5281/zenodo.3967542, 2020b,
Santos, A. M., Batista, I. S., Brum, C. G. M., Sobral, J. H. A., Abdu, M. A., and Souza, J. R.: F region electric field effects on the intermediate layer dynamics during the evening prereversal enhancement at equatorial region over Brazil, J. Geophys. Res.-Space, 126, e2020JA028429, https://doi.org/10.1029/2020JA028429, 2021.
Scherliess, L., and Fejer, B. G.: Storm time dependence of equatorial disturbance dynamo zonal electric fields, J. Geophys. Res., 102, 24037–24046, https://doi.org/10.1029/97JA02165, 1997.
Schrijver, C. J., Livingston, W. C., Woods, T. N., and Mewaldt, R. A.: The minimal solar activity in 2008–2009 and its implications for longterm climate modeling, Geophys. Res. Lett., 38, L06701, https://doi.org/10.1029/2011GL046658, 2011.
Souza, J. R., Brum, C. G. M., Abdu, M. A., Batista, I. S., Asevedo, W. D., Bailey, G. J., and Bittencourt, J. A.: Parameterized Regional Ionospheric Model and a comparison of its results with experimental data and IRI representations, Adv. Space Res., 46, 1032–1038, https://doi.org/10.1016/j.asr.2009.11.025, 2010.
Sreeja, V., Pant, T. K., Jose, L., and Ravindran, S.: Westward electric field penetration to the dayside equatorial ionosphere during the main phase of the geomagnetic storm on 22 July 2009, J. Geophys. Res., 116, A03303, https://doi.org/10.1029/2010JA016013, 2011.
Szuszczewicz, E. P., Roble, R. G.,Wilkinson, P. J., and Hanbaba, R.: Coupling mechanisms in the lower ionospheric-thermospheric system and manifestations in the formation and dynamics of intermediate descending layers, J. Atmos. Sol.-Terr. Phys., 57, 1483–1496, https://doi.org/10.1016/0021-9169(94)00145-E, 1995.
Tapping, K. and Morgan, C.: Changing Relationships Between Sunspot Number, Total Sunspot Area and F10.7 in Cycles 23 and 24, Sol. Phys., 292, 73, https://doi.org/10.1007/s11207-017-1111-6, 2013.
Tapping, K. F.: The 10.7 cm solar radio flux (F10.7), Space Weather, 11, 394–406, https://doi.org/10.1002/swe.20064, 2013.
Terra, P., Vargas, F., Brum, C. G. M., and Miller, E. S.: Geomagnetic and solar dependency of MSTIDs occurrence rate: A climatology based on airglow observations from the Arecibo Observatory ROF, J. Geophys. Res.-Space, 125, e2019JA027770, https://doi.org/10.1029/2019JA027770, 2020.
Tsurutani, B. T., Verkhoglyadova, O. P., Mannucci, A. J., Saito, A., Araki, T., Yumoto, K., Tsuda, T., Abdu, M. A., Sobral, J. H. A., Gonzalez, W. D., McCreadie, H., Lakhina, G. S., and Vasyliūnas, V. M.: Prompt penetration electric fields (PPEFs) and their ionospheric effects during the great magnetic storm of 30–31 October 2003, J. Geophys. Res., 113, A05311, https://doi.org/10.1029/2007JA012879, 2008.
Tsurutani, B. T., Echer, E., and Gonzalez, W. D.: The solar and interplanetary causes of the recent minimum in geomagnetic activity (MGA23): a combination of midlatitude small coronal holes, low IMF BZ variances, low solar wind speeds and low solar magnetic fields, Ann. Geophys., 29, 839–849, https://doi.org/10.5194/angeo-29-839-2011, 2011.
Usoskin, I. G., Arlt, R., Asvestari, E., Hawkins, E., Käpylä, M., Kovaltsov, G. A., and Vaquero, J. M.: The Maunder minimum (1645–1715) was indeed a grand minimum: A reassessment of multiple datasets, Astron. Astrophys., 581, A95, https://doi.org/10.1051/0004-6361/201526652, 2015.
Usoskin, I. G., Solanki, S. K., Krivova, N. A., Hofer, B., Kovaltsov, G. A., Wacker, L., Brehm, N., and Kromer, B.: Solar cyclic activity over the last millennium reconstructed from annual 14C data, Astron. Astrophys., 649, A141, https://doi.org/10.1093/mnras/stab1155, 2021.
Wakai, N.: Quiet and disturbed structure and variations of the nighttime E-region, J. Geophys. Res., 72, 4507–4517, 1967.
Wilkinson, P. J., Szuszczewicz, E. P., and Roble, R. G.: Measurements and modeling of intermediate, descending, and sporadic layers in the lower ionosphere: Results and implications for global-scale ionospheric-thermospheric studies, Geophys. Res. Lett., 19, 95–98, https://doi.org/10.1029/91GL02774, 1992.
Wrenn, G., Rodger, A. S., and Rishbeth, H.: Geomagnetic storms in the Antarctic F-region. I. Diurnal and seasonal patterns for main phase effects, J. Atmos. Sol.-Terr. Phys., 49, 901–913, https://doi.org/10.1016/0021-9169(87)90004-3, 1987.
Yue, X., Schreiner, W. S., Lei, J., Rocken, C., Kuo, Y., and Wan, W.: Climatology of ionospheric upper transition height derived from COSMIC satellites during the solar minimum of 2008, J. Atmos. Terr. Phys., 72, 1270–1274, https://doi.org/10.1016/j.jastp.2010.08.018, 2010.