the Creative Commons Attribution 4.0 License.
the Creative Commons Attribution 4.0 License.
 | 08 Oct 2021
Simulated seasonal impact on middle atmospheric ozone from high-energy electron precipitation related to pulsating aurorae
Antti Kero
Noora Partamies
Monika E. Szeląg
Shin-Ichiro Oyama
Yoshizumi Miyoshi
Esa Turunen
Recent simulation studies have provided evidence that a pulsating aurora (PsA) associated with high-energy electron precipitation is having a clear local impact on ozone chemistry in the polar middle mesosphere. However, it is not clear if the PsA is frequent enough to cause longer-term effects of measurable magnitude. There is also an open question of the relative contribution of PsA-related energetic electron precipitation (PsA EEP) to the total atmospheric forcing by solar energetic particle precipitation (EPP). Here we investigate the PsA-EEP impact on stratospheric and mesospheric odd hydrogen, odd nitrogen, and ozone concentrations. We make use of the Whole Atmosphere Community Climate Model and recent understanding on PsA frequency, latitudinal and magnetic local time extent, and energy-flux spectra. Analysing an 18-month time period covering all seasons, we particularly look at PsA-EEP impacts at two polar observation stations located at opposite hemispheres: Tromsø in the Northern Hemisphere (NH) and Halley Research Station in the Southern Hemisphere (SH). We find that PsA EEP can have a measurable impact on ozone concentration above 30 km altitude, with ozone depletion by up to 8 % seen in winter periods due to PsA-EEP-driven NOx enhancement. We also find that direct mesospheric NOx production by high-energy electrons (E> 100 keV) accounts for about half of the PsA-EEP-driven upper stratospheric ozone depletion. A larger PsA-EEP impact is seen in the SH where the background dynamical variability is weaker than in the NH. Clearly indicated from our results, consideration of polar vortex dynamics is required to understand PsA-EEP impacts seen at ground observation stations, especially in the NH. We conclude that PsA-EEP has the potential to make an important contribution to the total EPP forcing; thus, it should be considered in atmospheric and climate simulations.
- Article
(12532 KB) - Full-text XML
- BibTeX
- EndNote


Atmospheric chemistry impacts of energetic particle precipitation (EPP) have effectively been studied since 1960s when satellite-based particle flux measurements became available (for a review, see Sinnhuber et al., 2012). Later evidence on potential climate connection through middle atmospheric ozone depletion has extended studies to include dynamical coupling processes between the atmospheric layers (Rozanov et al., 2005; Seppälä et al., 2009; Baumgaertner et al., 2011; Maliniemi et al., 2013). The EPP contribution is now recognized as an important part of solar forcing in climate simulations (Matthes et al., 2017), particularly when assessing regional climate variability in the polar regions over decadal timescales.
While the chemical processes leading to middle atmospheric production of ozone depleting catalysts such as odd hydrogen (HOx, defined as the sum of H, OH, and HO2 molecules) and odd nitrogen (NOx, defined as the sum of N, NO, NO2 molecules) are well known (e.g. Verronen and Lehmann, 2013), the flux and spectra of EPP that drive these processes remain partly uncertain. The solar forcing data set prepared for the Coupled Model Intercomparison Project Phase 6 (CMIP6) includes atmospheric ionization rates due to precipitation of solar protons, radiation belt electrons (E=30–1000 keV), and galactic cosmic rays (Matthes et al., 2017). The electron ionization data set does not explicitly include the contribution of auroral electrons (E< 30 keV), and it also suffers from shortcomings of the utilized satellite-based observations which lead to larger uncertainties at electron energies higher than 300 keV and low fluxes (Rodger et al., 2010a; van de Kamp et al., 2016, 2018; Nesse Tyssøy et al., 2019). In order to understand the extent of these observational uncertainties, there have also been theoretical studies providing estimates of local chemical forcing from different types of electron precipitation separately, including substorm and microburst precipitation (Turunen et al., 2009; Verronen et al., 2013; Seppälä et al., 2015, 2018).
Polar EPP-NOx amounts drive the upper stratospheric ozone impact and depend on its production in the mesosphere to lower thermosphere and on transport to lower altitudes (e.g. Sinnhuber et al., 2011). Observations have shown that exceptionally strong wintertime descent can lead to a 40 %–60 % ozone depletion in the polar upper stratosphere (Randall et al., 1998, 2005). On the other hand, the relatively large year-to-year variability in atmospheric dynamics makes the overall EPP-NOx impact less clear especially in the NH (Päivärinta et al., 2013; Funke et al., 2014). There is also a large variability in year-to-year EPP and its NOx production, as well as a variability driven by the solar cycle (Andersson et al., 2018). Thus, it is a requirement to capture both the EPP and dynamics variability in simulations. The challenges emerge especially during disturbed dynamical conditions (Randall et al., 2015; Funke et al., 2017) and in the representation of electron precipitation forcing (Nesse Tyssøy et al., 2019). Finally, a detailed description of the lower ionospheric chemistry enhances the NOx production and the magnitude of the EPP impacts (Andersson et al., 2016; Kalakoski et al., 2020), but it is not included in most models today.
Pulsating aurora (PsA) is a type of diffuse aurora which appears in patches of emission or other irregular shapes (Lessard, 2013; Nishimura et al., 2020). While a large number of the emission structures in a PsA undergo quasi-periodic intensity modulations, there are also patches which appear quasi-stable (Grono and Donovan, 2018). A pulsating aurora is most commonly observed after the magnetic midnight, with a likelihood of about 50 % (Jones et al., 2011; Bland et al., 2019). It is also commonly related to substorm recovery phases but typically observed to continue beyond the recovery of the magnetic deflection. PsA is found in the equatorward part of the auroral oval, ranging from about 60∘ to about 70∘ magnetic latitude (Grono and Donovan, 2020; Bland et al., 2021), which magnetically maps to the radiation belt region in the inner magnetosphere. PsA can persist for several hours, up to 15 h (Jones et al., 2013b), with a median duration of about 2–4 h (Bland et al., 2019). It may also occupy both hemispheres at the same time (e.g. Partamies et al., 2017), as the source region is near-equatorial. These observations reveal PsA as being a very common auroral structure. It does not require particularly strong magnetic activity as a driver, and interestingly, PsA decays slower than the geomagnetic activity recovers (Partamies et al., 2017). This means that the particle precipitation proxies based on the geomagnetic indices may not capture the long-lived precipitation past the lifetime of the magnetic disturbances.
The particle precipitation during PsA has been reported to cover a large energy range from a few kiloelectronvolts (keV) up to several hundred kiloelectronvolts, with the full range modulating in tandem (e.g. Miyoshi et al., 2010, 2015a; Grandin et al., 2017). The lower-energy end causes the auroral emission, whereas the higher-energy end of the observed precipitation penetrates through the mesosphere down to about 60–70 km heights. While this is the bulk behaviour, there is a softer population of PsA precipitation, which does not reach the mesosphere. The dependence of the precipitation energy and the temporal evolution of the PsA patch size (Partamies et al., 2019) as well as the precipitation energy and the morphology of PsA structures (Tesema et al., 2020b) have also been investigated. In the former study, it was concluded that the PsA events with increasing patch sizes do not change the auroral peak emission height and would thus not be dominated by energies higher than the usual aurora. The latter study examined PsA events of different morphological subcategories (amorphous PsA and patchy PsA) and concluded that higher energies are typically observed in association with the quasi-stable patchy PsA as compared to the more transient and largely unstable amorphous PsA.
PsA energetic electron precipitation (EEP) is related to other types of electron precipitation and cannot be fully separated in satellite-based electron flux observations. According to the current understanding, the primary cause of PsA is electron precipitation from the plasma sheet and the inner magnetosphere (outer radiation belt) (Nishimura et al., 2020). PsA EEP is often observed during substorm activity but also extends beyond substorm disturbance and includes higher-energy electrons than typical substorm precipitation. A relation between PsA and microburst precipitation is expected theoretically (Miyoshi et al., 2020) but has not been observed and is not understood in detail (Miyoshi et al., 2015b).
PsA EEP has recently received increasing research attention because of its different characteristics compared to other types of aurorae. Specifically, PsA EEP extends to higher electron energies than any other morphological type of auroral precipitation and thus leads to direct ozone depletion in the mesosphere through HOx and also to mesospheric production of NOx (Turunen et al., 2016; Miyoshi et al., 2021). Further, PsA EEP has a higher occurrence rate, longer duration (Bland et al., 2019), and greater latitudinal extent than other auroral precipitation (Bland et al., 2021). All these PsA-EEP features contribute towards stronger atmospheric impacts and justify our focus on PsA EEP here.
First simulated results of PsA-EEP-related ozone depletion were reported by Turunen et al. (2016). They used a PsA-EEP forcing based on a precipitation spectrum observed by Miyoshi et al. (2015a) as an input in the Sodankylä Ion and Neutral Chemistry (SIC) model simulations. As a result of 30 min precipitation, up to 14 % of ozone at around 75 km was lost locally during the event due to production of odd hydrogen. Based on ground observations, however, a half an hour duration underestimates the true duration of PsA (Jones et al., 2011; Bland et al., 2019). A more recent study by Tesema et al. (2020) constructed a median particle precipitation spectrum over the energy range of 30 eV–1000 keV from about 250 low-altitude spacecraft overpasses during PsA events. These statistical median and extreme spectra were constructed by averaging all electron measurements over the region which was optically defined to be occupied by PsA. Thus, these overpass-average spectra do not take the “patchiness” of the pulsating aurora into account. Using a median duration (120 min) of the observed 840 PsA events in the model, the local ozone depletion in the mesosphere at 75–80 km reached about 80 % for a few hours during the PsA peak. The SIC model was further run for the low-flux scenario, which describes the lower envelope curve of the whole precipitation spectrum bundle. While no observable HOx or ozone changes were seen in the mesosphere during this experiment, the high-flux scenario (upper envelope curve) constructed from the collected spectra resulted in strong depletion (> 90 %) of mesospheric ozone within a vertically thin layer around 79 km. Thus, these previously reported modelling efforts suggest that the immediate local effect of the PsA EEP on the atmosphere is significant. The questions that remain are whether PsA is common enough to cause an appreciable longer-term effect over a wider range of latitudes and local times and whether these could be detected by satellite-based observations. Furthermore, an outstanding issue in simulations is the shortcomings in EPP-related enhancement of wintertime odd nitrogen (e.g. Randall et al., 2015; Pettit et al., 2019). In this context, understanding the PsA-EEP-driven odd nitrogen production could be particularly useful, because PsA events are most common in wintertime (Bland et al., 2019). Finally, the PsA-EEP high-energy end can directly increase the mesospheric NOx production which should enhance the indirect ozone impact in the upper stratosphere (Sinnhuber et al., 2016; Andersson et al., 2018).
In this paper, we study the chemical impacts of PsA EEP at polar latitudes. We use the Whole Atmosphere Community Climate Model with its lower ionospheric chemistry extension (WACCM-D), together with a plausible estimate for PsA-EEP forcing based on observations reported in the literature, to simulate the PsA-EEP impact. We analyse the atmospheric response for over an 18-month period, including all seasons of the year. Considering both the Northern Hemisphere and Southern Hemisphere, we select the locations of Tromsø (69.60∘ N, 19.20∘ E; 66.64∘ CGMlat) and Halley (75.58∘ S, 26.66∘ W; 65.78∘ CGMlat) observation stations from our global simulations in order to understand the expected impact that could be measured by ground-based instrumentation such as radiometers (Daae et al., 2014; Newnham et al., 2018) and the next-generation EISCAT_3D ionospheric radar system (McCrea et al., 2015). Finally, we discuss our results in the context of overall EPP impact and the current challenges in representing EPP forcing in simulations. We will show that PsA EEP has a potential to cause appreciable longer-term atmospheric impacts such that part of the NOx shortage found in previous simulation work could be covered by considering PsA EEP. The novelty of our work compared to previous PsA-EEP studies is that we consider long-term atmospheric impacts using a global chemistry–climate model; thus, the impact of atmospheric dynamics on the NOx/ozone response is included.
Here we use the Whole Atmosphere Community Climate Model (WACCM) version 4, described in detail by Marsh et al. (2007) and Marsh et al. (2013). Running simulations in a specified dynamics mode, the model temperature, horizontal winds, and surface pressure below 50 km were nudged to NASA GEOS5.1 reanalysis data (Rienecker et al., 2008). At the levels above 50 km up to the model upper boundary at hPa, the model dynamics are free-running, although there is a degree of control coming from specified dynamics below. We make use of the variant WACCM-D which includes a representation of the lower ionospheric chemistry of both positive and negative cluster ions and was particularly designed for EPP studies (Verronen et al., 2016). WACCM-D captures a full range of observed EPP impacts in the middle atmosphere (Andersson et al., 2016; Kalakoski et al., 2020), in contrast to the standard WACCM which includes only a parameterization of HOx and NOx production. For example, according to Andersson et al. (2016) the detailed D-region ion chemistry resulted in 30 %–130 % more NOx at 70–85 km during the January 2005 solar proton event. Other recent studies using WACCM-D include work on seasonal changes in ion composition and comparison of the latitudinal extent of solar proton events against ionospheric observations (Orsolini et al., 2018; Heino et al., 2019).
To create a typical PsA-EEP forcing for our simulations, we utilize energy-flux spectra and ionization rates published by Turunen et al. (2016). These are based on ionospheric observations of the EISCAT radar and the Kilpisjärvi Atmospheric Imaging Receiver Array (KAIRA) riometric observations during a PsA event on the 17 November 2012. In their Fig. 2, Turunen et al. (2016) presented several different ionization rate profiles which differ especially at altitudes below 80 km due to larger electron flux differences and uncertainties present at high electron energies > 100 keV. We make use of the “MCMC median” electron spectrum and the corresponding ionization rate profile. The electron spectrum for that was inverted by Turunen et al. (2016) from the ionospheric data using the Metropolis–Hastings Markov Chain Monte Carlo (MCMC) method (Haario et al., 2006). The MCMC inversion provided electron fluxes at the energy range of 10–1000 keV, which leads to atmospheric ionization mainly at altitudes 60–125 km. Note that although the selected spectrum is based on a single event, it is well justified, because it is in good agreement with the statistical median PsA-EEP spectrum of Tesema et al. (2020).
In our WACCM-D simulations, the PsA-EEP ionization rates are applied every other night, at magnetic local time (MLT) hours between midnight and 06:00 MLT, homogeneously between 60 and 72∘ of geomagnetic latitude. This approach neglects any fine structures in PsA EEP but still provides our global WACCM-D simulations with realistic and useful forcing scenarios. The applied latitudinal and temporal extent follows the reported about 50 % occurrence frequency of PsA in the morning sector local times (Bland et al., 2019), although that study did not comment on the PsA occurrence times sequence. The radar detection study by Bland et al. (2019) further suggested a typical PsA duration of 2–4 h. However, also extremely long-lasting events, such as 15 h by Jones et al. (2013a), have been reported. We therefore settled on a 6 h duration for this study, which is on the lengthy side of observed events while still being realistic. The latitude extent used for the PsA forcing corresponds to the Fennoscandian Lapland latitudes at the equatorward part of the average auroral oval location, where previous statistical studies have observed a high occurrence rate of pulsating aurora (Partamies et al., 2017; Tesema et al., 2020). In summary, with these simplifying assumptions we aim at simulating and analysing the full potential of PsA-related atmospheric impacts. Note that the same PsA-EEP forcing characteristics are applied throughout the year, which allows for direct comparisons between seasonal atmospheric responses. Because we apply a 50 % occurrence frequency, which is valid in wintertime but an overestimation in the summer (Bland et al., 2019), the summertime PsA-EEP frequency in our simulations is too high by a factor of about 2.5. For the assessment of PsA impact, however, this is not crucial: the results will show that the long-term atmospheric response is clearly driven by the wintertime forcing (see Sect. 3).
To demonstrate the impact of the PsA-EEP forcing in WACCM-D simulations, Fig. 1 shows two snapshots of global electron concentration on 18 January at ∼ 78 km altitude. Overall features include higher values on the dayside ionosphere from photoionization as well as higher values in the auroral regions due to particle precipitation. Very high electron concentrations are shown with red colour and occur at the time and place of PsA-EEP forcing. During every other day, these high-ionization PsA-EEP patterns remain at the same magnetic local times and rotate once around the magnetic poles, following the magnetic latitudes of the forcing. The locations of Tromsø and Halley stations are marked on the map, both being within the latitude bands that are directly affected by the PsA-EEP forcing.

Figure 1An example of simulated electron concentrations on 18 January 2010, at ∼ 78 km altitude. The locations of the Tromsø and Halley stations are marked with the black crosses in the NH (a) and the SH (b), respectively.
We simulate the time period between January 2010 and June 2011 (18 months). Three simulations were made, with different PsA-EEP forcing scenarios: (1) no-PsA, i.e. zero ionization for a reference; (2) full-PsA, i.e. the MCMC median ionization from Turunen et al. (2016), (3) thermo-PsA, like full-PsA but the ionization below 85 km ( hPa) is set to zero. Comparisons between the full-PsA and no-PsA simulations gives us an estimate of PsA atmospheric impacts, while the thermo-PsA simulation can be used to separate the impacts from thermospheric and mesospheric forcing. Note that a forcing scenario similar to the thermo-PsA simulation could be created by setting the electron flux to zero at energies larger than about 40 keV, with the difference that thermospheric ionization from the > 40 keV electron would also be removed. By setting the ionization below 85 km to zero, we assure that the thermospheric forcing in the full-PsA and thermo-PsA simulations is the same, which allows us better assess the importance of direct mesospheric forcing. The simulations begin in January, i.e. in the middle of NH winter. Thus much of our discussion on the NH results is focused on the second winter which is forced by PsA EEP throughout.
All simulations included background EPP forcing, i.e. solar protons (e.g. Jackman et al., 2008), auroral electrons (Marsh et al., 2007), and galactic cosmic rays (GCRs) (Jackman et al., 2016), which is important for a realistic assessment of the relative PsA-EEP impact. PsA EEP adds to the forcing especially at mesospheric altitudes where GCRs and protons, taken as given in the CMIP6 data set (Matthes et al., 2017), provide a continuous but low ionization background throughout the simulation period globally and at geomagnetic latitudes larger than 60∘. The auroral electron forcing is driven by the geomagnetic Kp index, has a 2 keV characteristic energy with a Maxwellian distribution, and is restricted to altitudes > 90 km (E<30 keV); i.e. there is no direct mesospheric ionization from the Kp aurora. All three background EPP forcing types are defined as daily zonal averages. Therefore, PsA EEP provides dominant ionization in the mesosphere with a strong diurnal variability from the MLT dependency. Note that the simulation period is in the ascending phase of the solar cycle right after a record minimum in solar activity; thus, the background EPP forcing was relatively low. For example, maximum daily Ap in the 18-month period was 54.6, as opposed to the maximum Ap of 203.9 for the full cycle of 2001–2011. Further, no large solar proton events occurred during the simulation period (ftp://ftp.swpc.noaa.gov/pub/indices/SPE.txt, last access: April 2021, NOAA). This means that the PsA-EEP contribution to the total EPP forcing will be relatively larger than it would be during solar maximum conditions. Our selection of a solar minimum period for the simulations is in line with our approach of assessing the full potential of the PsA-related impact.
The simulations were analysed for impacts on electron density, HOx, NOx, and O3 concentration in the height range of 10–120 km. We especially look at two ground station locations: Tromsø (69.60∘ N, 19.20∘ E; 66.64∘ CGMlat) and Halley (75.58∘ S, 26.66∘ W; 65.78∘ CGMlat). These provide a view on local effects over the opposite hemispheres and in different dynamical conditions at two stations that have hosted and will host a wealth of instrumentation for ionospheric and atmospheric research. Both selected locations are within the latitude band of PsA-EEP forcing and auroral forcing in general, and thus the results from our 3-D chemistry–dynamics simulations for these locations can be compared to those of Turunen et al. (2016) and Tesema et al. (2020) calculated with a 1-D chemistry model.

Figure 2Simulation results for a selected location in the Northern Hemisphere, namely the Tromsø radar site (69.6∘ N, 19.2∘ E). Left column: (a) electron concentration Ne, (b) NOx, (c) HOx, and (d) O3 from the full-PsA simulation. Centre column: absolute differences in (e) Ne, (f) NOx, (g) HOx, and (h) O3 between the full-PsA and no-PsA simulation. Right column: panels (i) to (l) are the same as the centre column but showing differences between the thermo-PsA and no-PsA simulation.
Figure 2 presents the simulation results for the entire 18-month time period at the location of Tromsø in the NH auroral region. The temporal resolution of the electron, NOx, HOx, and ozone data is 1 h; thus, the diurnal variations are included. In panels (a)–(d), the absolute concentrations from the full-PsA simulation display the overall seasonal variability as well as the vertical distributions at 10–110 km. The electron concentration increases towards higher altitudes due to the increasing ionization from the solar short-wave radiation and EPP. NOx displays two characteristic maxima: one in the stratosphere (at ∼30 km) and another in the lower thermosphere (at ∼110 km), and more (less) NOx in the mesosphere (stratosphere) during wintertime. Denitrification due to reactions with chlorine leads to very low concentrations in the lower stratosphere around 20 km during winter periods. The HOx concentration is higher during summer due to its production being driven by solar ultraviolet and Lyman-α radiation and maximizes around the stratopause (at ∼50 km). In wintertime, the largest concentrations are seen in the mesosphere. Ozone has two maxima in the summer: the stratospheric ozone layer peaking at 20–30 km and the secondary maximum at mesopause at around 90 km. In wintertime, the mesospheric ozone concentration is higher than in the summer due to less loss from diminished solar radiation and photodissociation. The tertiary maximum development in the middle mesosphere around 70 km at the vicinity of the polar winter terminator contributes to higher wintertime concentrations as well.
Highlighting the PsA-EEP impact, differences between the full-PsA and no-PsA simulations are shown in panels (e)–(h) of Fig. 2. The electron concentration clearly enhances at 60–90 km during summer/daytime due to the added PsA-EEP ionization. The daytime mesospheric increase reaches 103–104 cm−3 with larger increase towards higher altitudes. In general, in the wintertime and at night there is much less impact than in the summer. However, because of the absence of solar radiation, a larger portion of the negative charge below 90 km is held by ions not electrons (e.g. Verronen et al., 2016; Orsolini et al., 2018). Above 90 km, the wintertime differences exhibit a variation between increases and decreases which are relatively small and are related to the internal variability of the model coming from its free-running dynamics at the upper altitudes. Also, the ionization from auroral electrons, which is the same in all simulations, becomes dominant over PsA EEP at altitudes above ∼ 90 km (not shown). The NOx concentrations show a similar, relatively small, variability around 100 km but only during the winter periods when there is more dynamical variability. Focusing on the main NOx features, increases are seen at 80–90 km throughout the year. Early in the winter season, the NOx increase due to PsA EEP is observed in the mesosphere, from where it further descends into the stratosphere reaching down to about 20 km by the end of the winter season. The increase related to the descent disappears and then appears several times during the winter. A layer of PsA-EEP NOx persists at about 25 km altitude until the end of the simulation period (midsummer). The HOx response shows some diurnal variability, i.e. cyclic increases and decreases. Overall, however, there is an increase of HOx at 70–80 km altitudes from the direct PsA-EEP impact. Around 60 km, the NOx increase leads to chemical loss of wintertime HOx concentrations (see e.g. Verronen and Lehmann, 2015). The major feature in the ozone response is the descending stratospheric depletion during the winter and spring seasons which closely follows the descent of enhanced NOx and is caused by the NOx-driven ozone loss reactions. Note that the relative ozone response is larger in the mesosphere than in the stratosphere because of lower background concentrations (not shown).
Panels (i)–(l) of Fig. 2 are similar to panels (e)–(h) but show the differences between the thermo-PsA and the no-PsA simulations. In the following, we compare these responses to those in panels (e)–(h) and discuss the impact from the direct mesospheric PsA-EEP forcing. The removal of PsA-EEP ionization below 85 km in the thermo-PsA simulation removes nearly all of the electron density response from those altitudes, especially the 103–104 cm−3 daytime increase above 60 km seen in the full-PsA simulation is gone. Above 85 km the responses are very similar. Thus the ionospheric response is largely restricted to the altitudes which experience direct PsA-EEP forcing. However, HOx, NOx, and ozone show a clear response also at altitudes below 85 km also in the thermo-PsA simulation. For all three species, the main features of the PsA-EEP impact remain. Particularly, the NOx descent and the corresponding stratospheric ozone depletion are still clear, even without direct PsA-EEP forcing in the mesosphere. The notable difference is in the magnitude of the response which is smaller than with the mesospheric PsA-EEP forcing. Also, the maximum response is reached later in the winter/spring because of the lack of early winter impact from direct mesospheric NOx production.
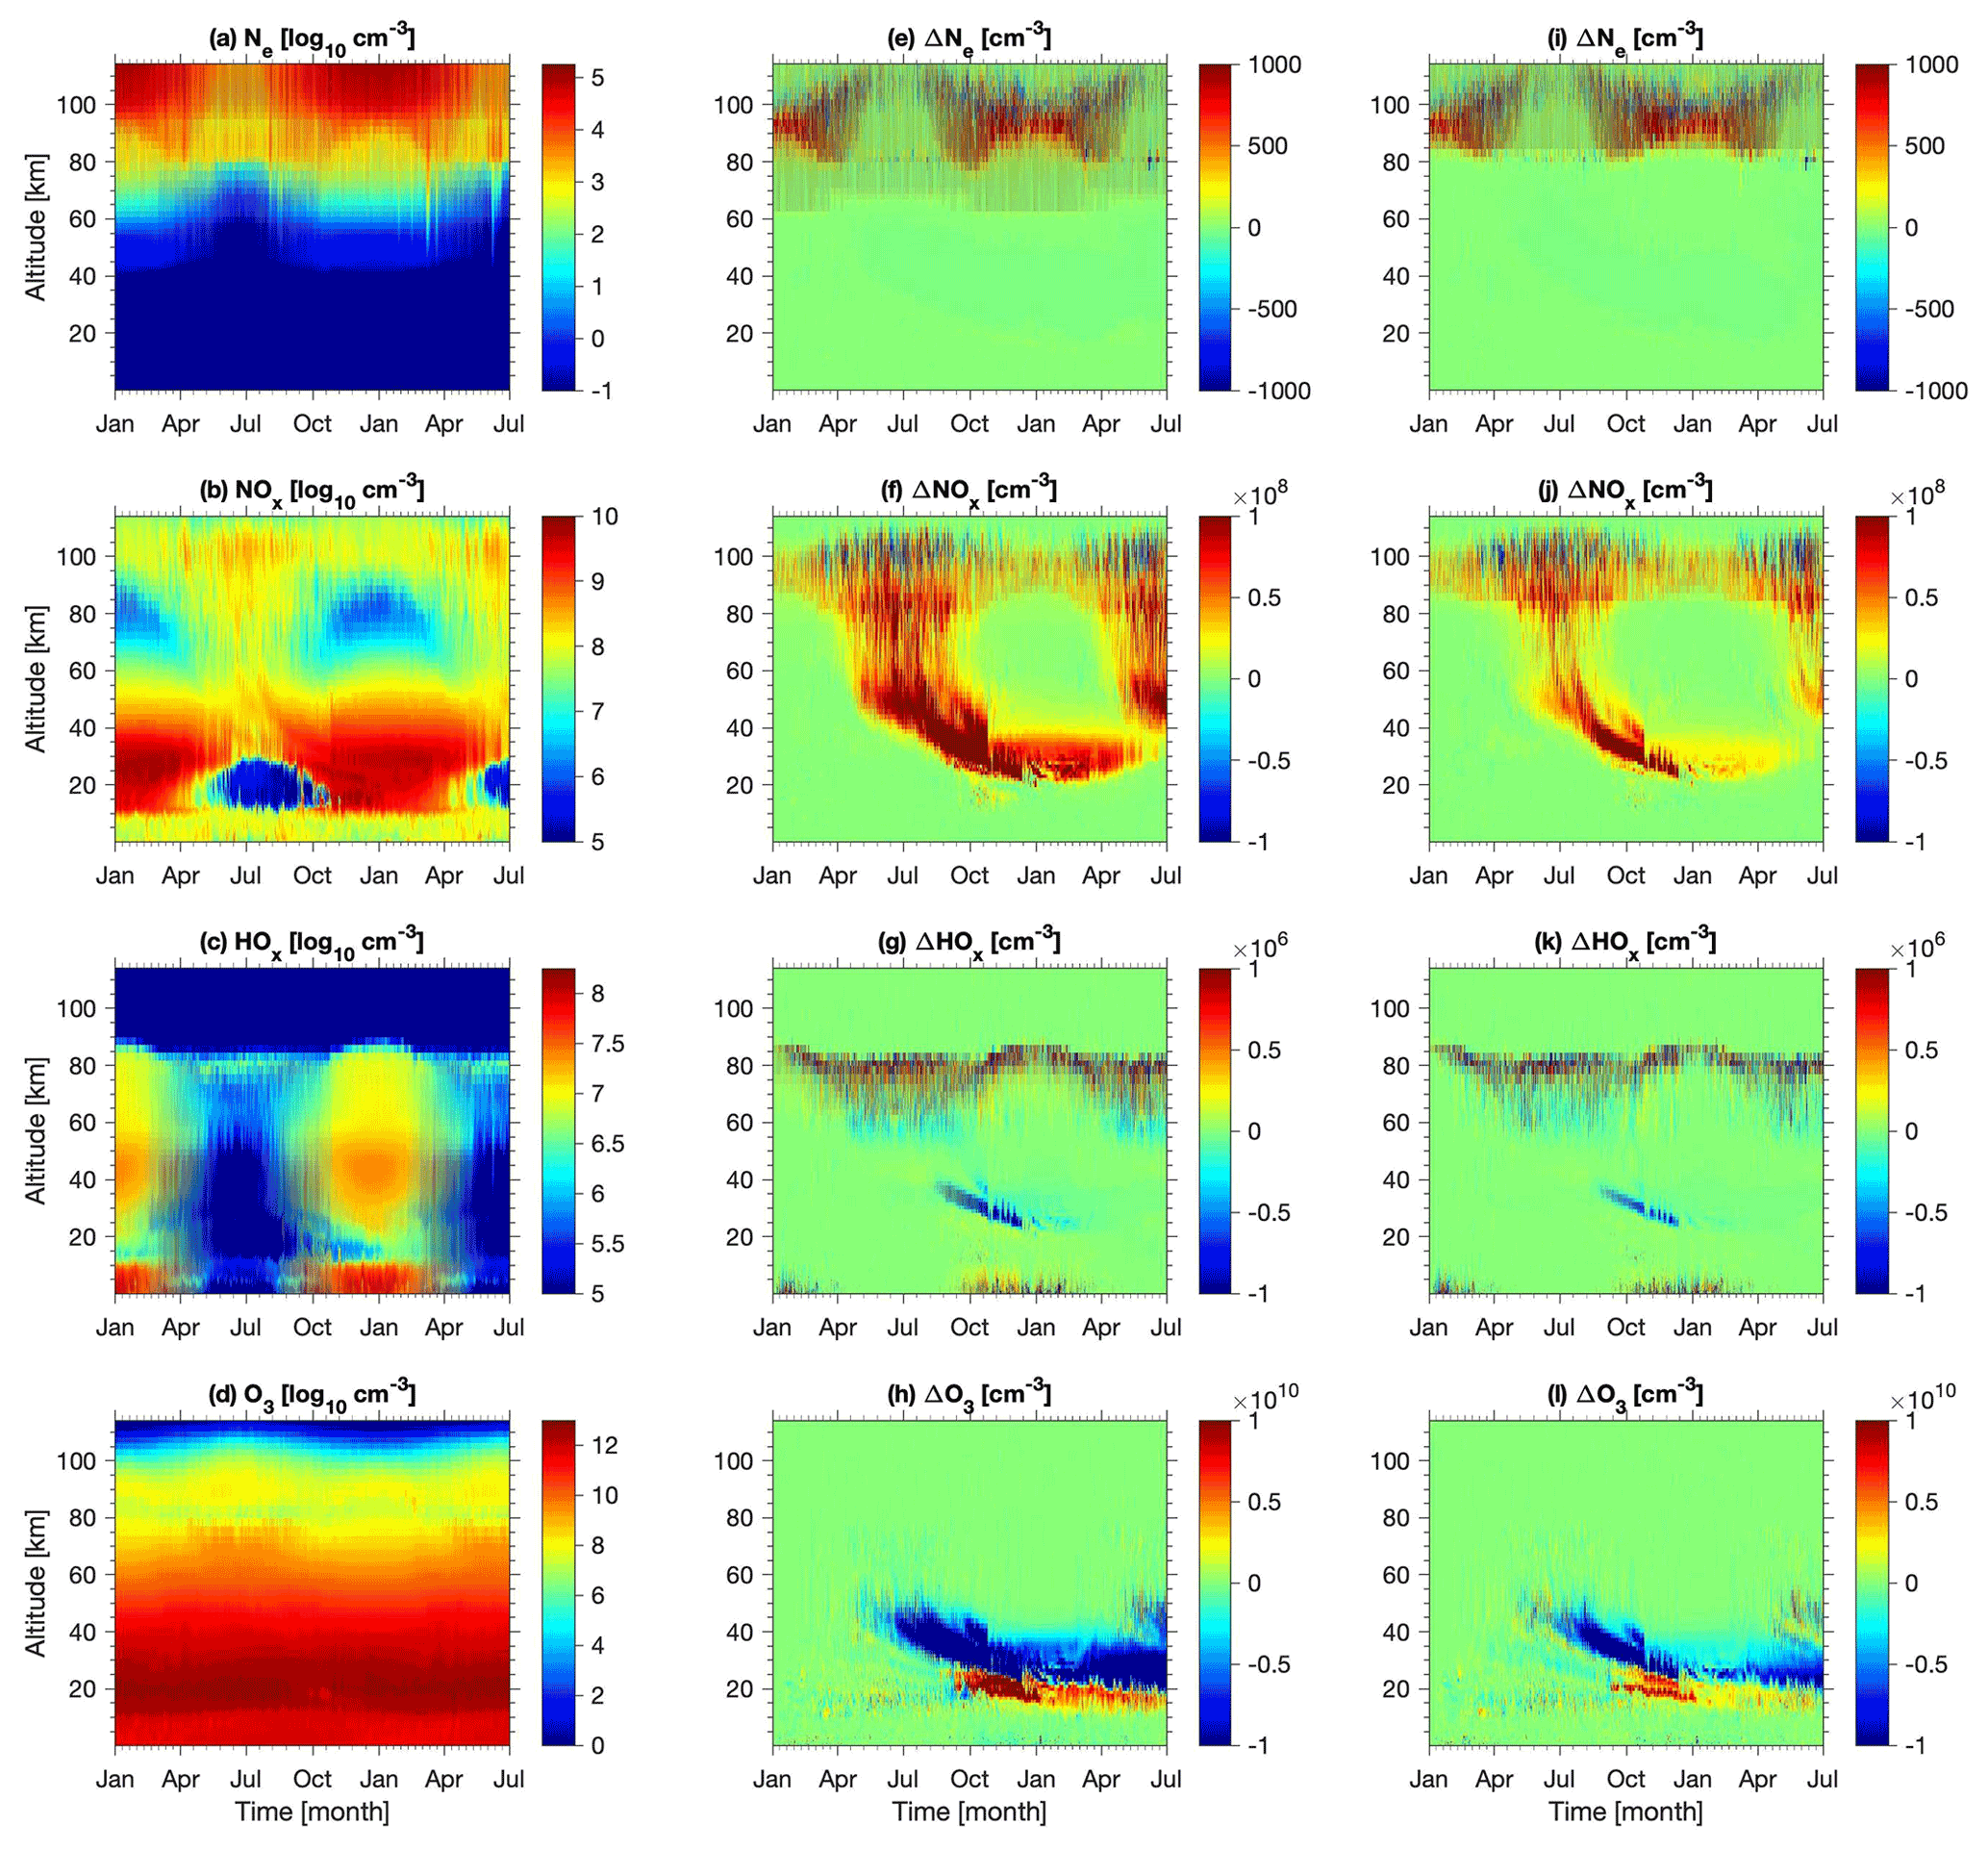
Figure 3Model results for a selected location in the Southern Hemisphere: Halley Research Station in Antarctica (75.6∘ S, 26.6∘ W). For a description of panels, see the caption of Fig. 2.
Figure 3 displays a similar set of simulation results as in Fig. 2 but for the Halley station location in the SH. Based on previous studies (e.g. Andersson et al., 2018), the same EEP forcing is expected to produce a larger wintertime effect on the SH middle atmospheric chemistry, because atmospheric wave-driven dynamical variability is much weaker in the SH than in the NH, which allows for stronger signatures of the chemical response. Indeed, the NOx response is clearly stronger and displays much less disruptions during the descent than that seen in the NH. Similar differences between the NH and the SH are seen in the ozone response as well. Additional differences compared to the NH response are the descending depletion of HOx at 20–40 km and the ozone increase at 15–30 km, both seen from mid-winter to spring. The former is caused by conversion of HOx to NOy species, such as HNO3, in reactions with enhanced NOx. The latter is due to enhanced denitrification which converts ozone-depleting catalysts, active chlorine, and bromine to reservoir species. As in the NH, the removal of the PsA-EEP direct mesospheric impact leads to a decrease in the magnitude of the atmospheric response below 85 km and about a 1-month delay in the maximum stratospheric ozone response.
Figures 4, 5, and 6 show the height-integrated PsA-EEP impact on HOx, NOx, and ozone columns at altitudes > 30 and > 60 km. Overall, the hourly responses display a large variability in the mesosphere, such that the impact there is somewhat masked. For NOx and O3, the inclusion of upper stratosphere makes the impact much clearer. To clarify the PsA-EEP impact in cases with large variability, we have calculated 30 d running averages from the hourly data and show them also in Figs. 4, 5, and 6.

Figure 4Height-integrated HOx response to PsA EEP at the Tromsø and Halley stations. (black line) The difference between the full-PsA and no-PsA simulations in 1 h resolution. (white line) The 30 d running mean of the black line (cyan line). The 30 d running mean of the difference between thermo-PsA and no-PsA simulations.
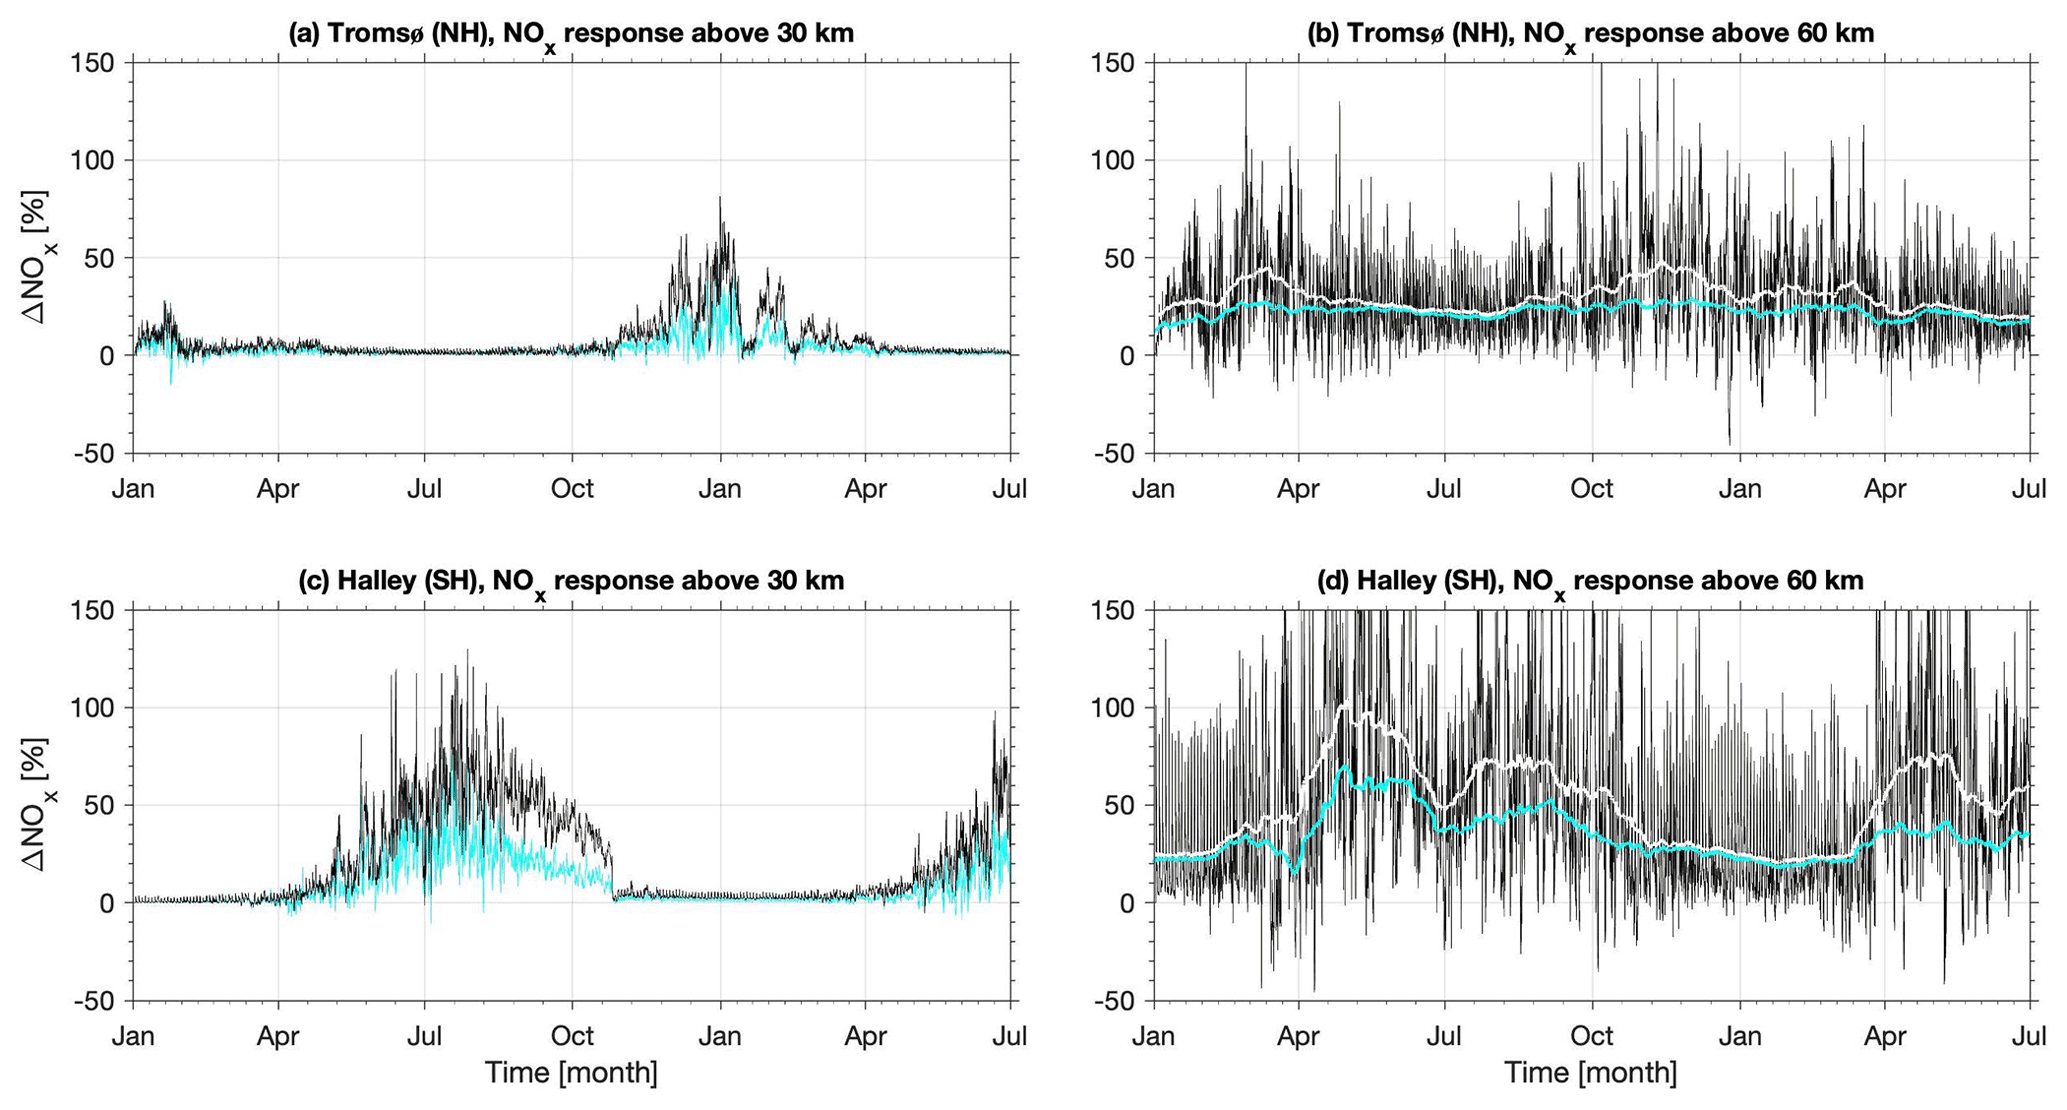
Figure 5Height-integrated NOx response to PsA EEP at the Tromsø and Halley stations. (black line, all panels) The difference between the full-PsA and no-PsA simulations in 1 h resolution. (cyan line, panels a and c) The difference between the thermo-PsA and no-PsA simulations in 1 h resolution. (white line, panels b and d) The 30 d running mean of the black line. (cyan line, panels b and d) The 30 d running mean of the difference between thermo-PsA and no-PsA simulations.
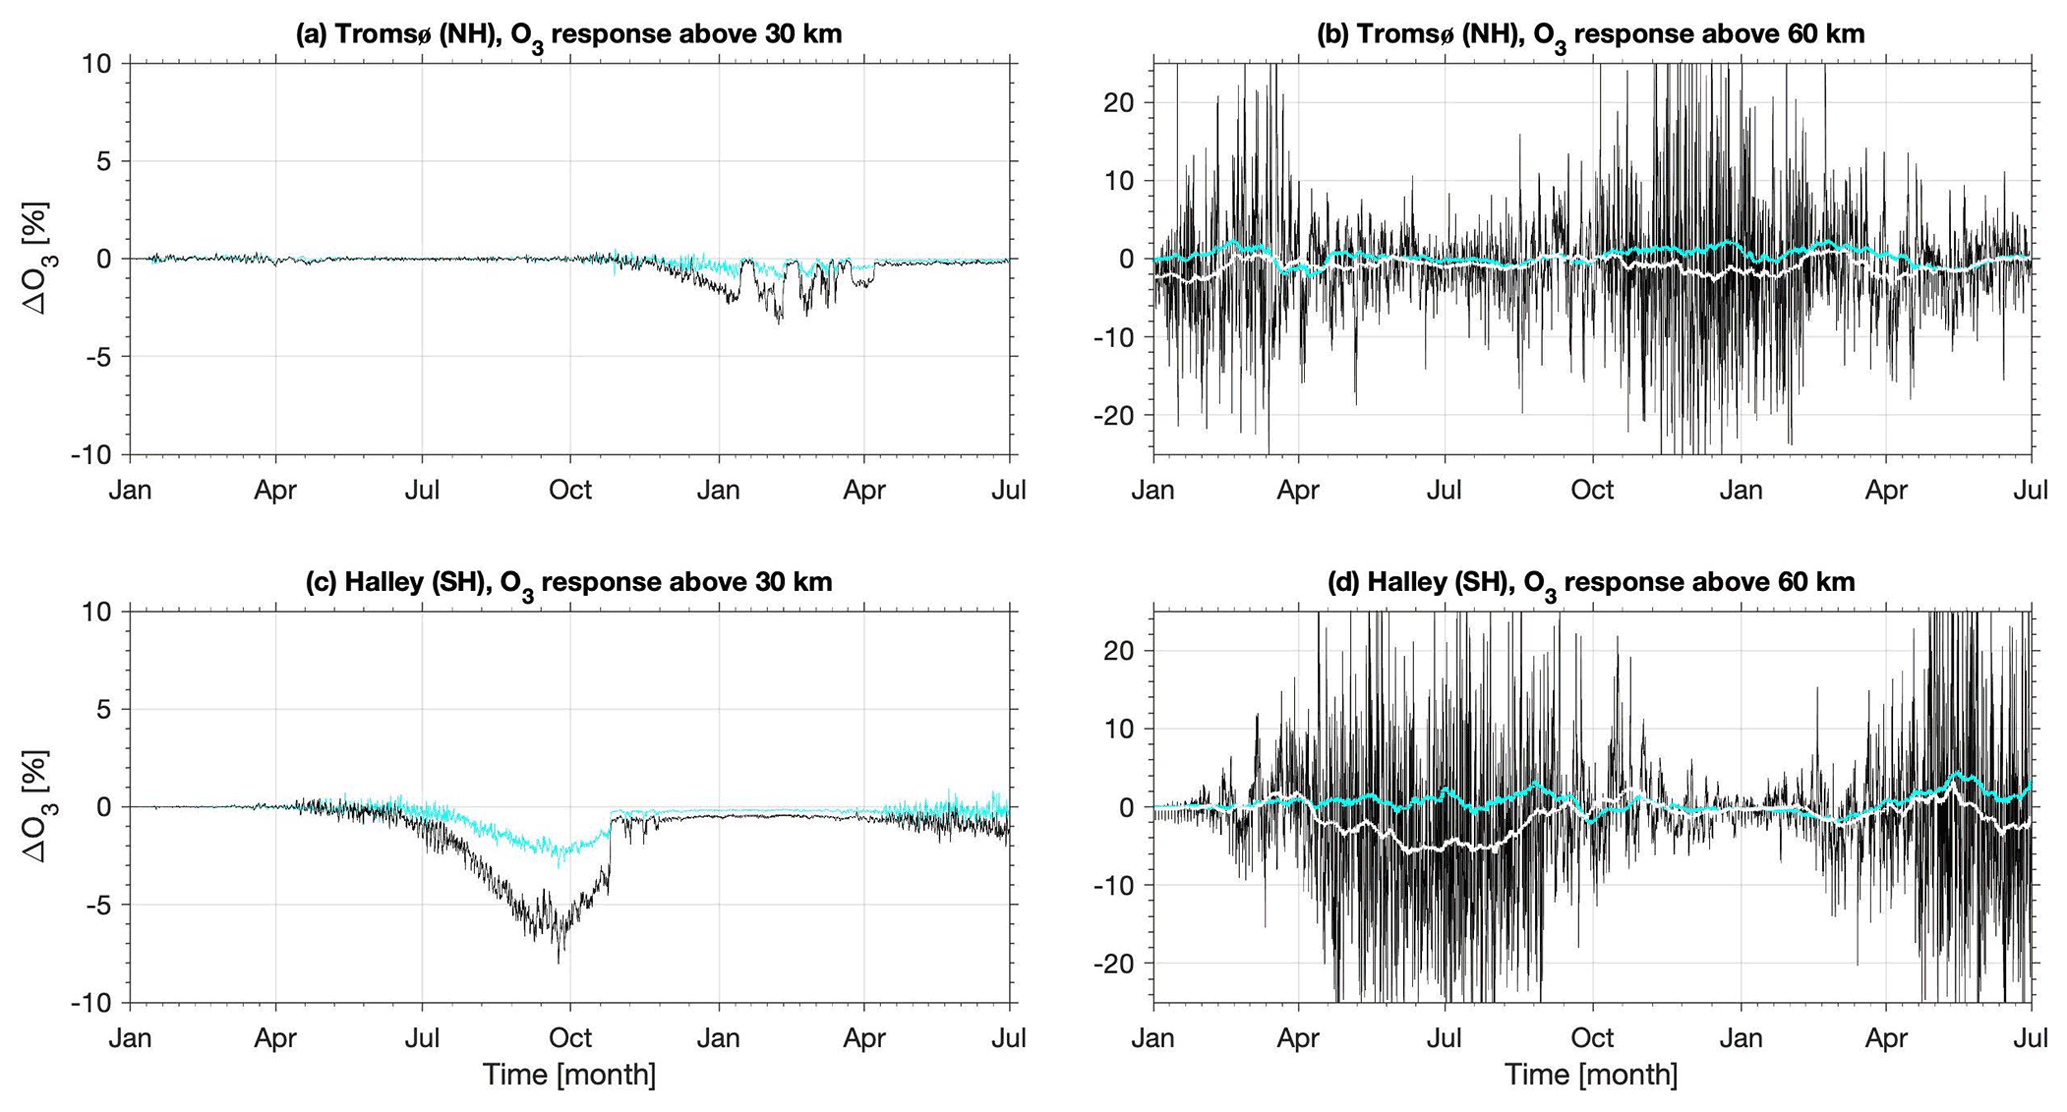
Figure 6Height-integrated O3 response to PsA EEP at the Tromsø and Halley stations. See the caption of Fig. 5 for explanations.
Without the direct mesospheric forcing, the PsA-EEP impact on HOx does not reach 10 % and is clearly negligible compared to the overall variability (Fig. 4). When the mesospheric forcing is included, there is a clear increase in HOx during the winter periods, with the 30 d impact peaking at about 30 % in the SH mesosphere. The inclusion of the upper stratosphere reduces the maximum 30 d impact to about 25 % in the SH and to about 15 % in the NH. Note that in the hourly data the impact can temporarily reach beyond 100 % in both hemispheres and altitude ranges.
The PsA-EEP forcing leads to a mesospheric 30 d mean NOx increase of about 20 % during the summer periods (Fig. 5). In the winter periods the increase is larger, reaching about 100 % in the SH and about 50 % in the NH. Note that in the NH the response is clearly larger in the second winter than in the first one, mainly because the simulation and the PsA-EEP forcing begin in January and only cover the latter half of the first winter. The exclusion of the direct mesospheric PsA-EEP forcing reduces the impact especially in the winter periods, by up to a factor of 2 to 3. The inclusion of the upper stratosphere reduces the variability in the hourly data, so that the impact becomes clear: in wintertime NOx increases while during summer periods the PsA-EEP impact is negligible. The wintertime peak increase is 50 %–75 % in the SH, reaching beyond 100 % temporarily. In the NH, the peak increase during the second winter is around 50 % while showing a larger dynamical variability over the winter period. Again, the exclusion of the direct mesospheric PsA-EEP forcing leads to a smaller maximum impact, i.e. around 40 % in the SH and 30 % in the NH.
The mesospheric (> 60 km) 30 d mean ozone response is small in the NH; a decrease of a few percent is seen in the winter periods (Fig. 6). In the SH, the ozone decrease reaches up to about 6 % in mid-winter. The exclusion of mesospheric PsA-EEP forcing reduces the ozone decrease to less than 1 % for all seasons, while there is an increase of a few percent in the winter periods. The lack of a clear ozone decrease without the mesospheric PsA-EEP forcing is in line with the negligible HOx response, because HOx is the main ozone loss catalyst in the mesosphere. As seen in the hourly data, the mesospheric ozone response shows a large overall variability ( 10 %), even in the SH with the direct mesospheric PsA-EEP forcing included.
When including the upper stratosphere (> 30 km), the ozone response becomes clear in the hourly data (Fig. 6). In the full-PsA forcing scenario, a NH column ozone depletion of up to 3 % is seen around the middle of the second winter (black curve). This response is related to the PsA-NOx descent. No real ozone response is seen during the first winter, because simulation begins in January, i.e. in the middle of that winter, leaving less time for PsA-NOx production and descent. If the mesospheric PsA-EEP forcing is excluded (cyan curve), the wintertime peak ozone depletion reduces to around 1 %; i.e. the impact is reduced by more than a factor of 2. In the SH the impact is qualitatively similar to the NH, but the ozone decrease is more consistent over time and also stronger, i.e. 4 %–8 % at the end of September. When the mesospheric PsA-EEP forcing is excluded, the PsA-EEP impact reduces to 2 %–3 %. Following a full winter, a 0.5 % decrease persists over the summer period. Compared to the NH response with the full-PsA forcing, the SH ozone depletion reaches a similar magnitude with the thermo-PsA simulation only because less variability in the polar vortex dynamics in the SH leads to less interruptions in the NOx descent. The interruptions in the NH are clear, also from the NOx and O3 data shown in Fig. 2. In the full-PsA simulation, the SH ozone depletion is more than double the NH depletion, and both last over the winter season. In both hemispheres, it is clear that the mesospheric NOx production plays a key role in depleting the ozone, and it is important for both the magnitude and the timing of the impact.
In the above analysis we are focusing on the local PsA-EEP impact at the selected stations of Tromsø and Halley. To put our results into a wider context, we next consider the overall polar upper stratospheric impact of PsA EEP. We do this for the NH only, because there the dynamical variability of the polar vortex is stronger and more drastic. A particularly interesting period in our simulations is January, 2011, when the NOx and O3 responses disappear and reappear during the month (see Figs. 2, 5, and 6).
Figure 7 presents the relative NOx and O3 responses at ∼ 40 km altitude, i.e. in the upper stratosphere. At the beginning of January, Tromsø is located within the polar vortex. There, the PsA-EEP impact is clearly seen as increased NOx and decreased O3 concentrations. There is considerable variability of the relative impact within the vortex with a range of responses up to about +180 % and down to about −6 %, respectively. In the middle of January, the polar vortex has moved away from Tromsø. Although the PsA-EEP impact inside the vortex is quite similar compared to the situation in the beginning of the month, this time none of it can be seen at the Tromsø location. The situation changes back at the end of January when the polar vortex is over Tromsø again. Thus the variability in the NOx and O3 responses seen in Figs. 2, 5, and 6 is due to the evolution of the NH polar vortex over the winter period. Clearly, a global model like WACCM is a powerful tool when interpreting results from a single polar station like Tromsø, as demonstrated here. Although not shown, the SH vortex is much more stationary with respect to the Halley location, and the PsA-EEP impacts there do not display similar large variability.
The particle forcing used in this study was recently validated by a statistical analysis of in situ particle spectra from low-altitude spacecraft measurements (Tesema et al., 2020). It was concluded that the spectrum does indeed represent the observed median spectrum for PsA particle precipitation very well. The simulation results presented in this study thus provide insight into the effects of the median PsA-EEP forcing. Tesema et al. (2020) also showed that while the low-flux PsA forcing causes no atmospheric changes, the high-flux PsA forcing could deplete mesospheric ozone by more than 70 %. It is therefore desirable to investigate both the atmospheric sensitivity threshold towards the low-flux scenario as well as the NOx production and descent during the high-flux forcing. As reported by Partamies et al. (2017), the solar wind driving during pulsating aurora does not need to be extreme although the wind speed is typically elevated. This can be particularly important for simulation runs during the solar minimum and the declining phase of the solar activity, because these time periods are known to associate with a frequent high-speed streams in the solar wind (Asikainen and Ruopsa, 2016). The question is whether PsA forcing during consecutive nights would lead to a stronger cumulative effect in the atmosphere than what we have seen in this study. Some variations in the PsA MLT extent are expected due to changes in the solar wind driving. The latitude extent of PsA, which maps to the ionosphere from the outer radiation belt source region, is likely to undergo little variability from event to event (Sandhu et al., 2019). However, the outer radiation belt electron flux at high L shells has been observed to increase during the solar declining phase and the minimum phase (Miyoshi et al., 2004), which will affect the latitude extent of a longer-term PsA-EEP forcing. Thus, a more thorough analysis of the spatial and MLT extent should be done in order to estimate how realistic is the latitude and MLT extent of the PsA-EEP forcing used in this study. Furthermore, our results suggest that the overlap between the polar vortex and the particle precipitation region is a key factor in determining the chemical impact. It is therefore important not to study the impact area in isolation but with respect to the vortex location and area.
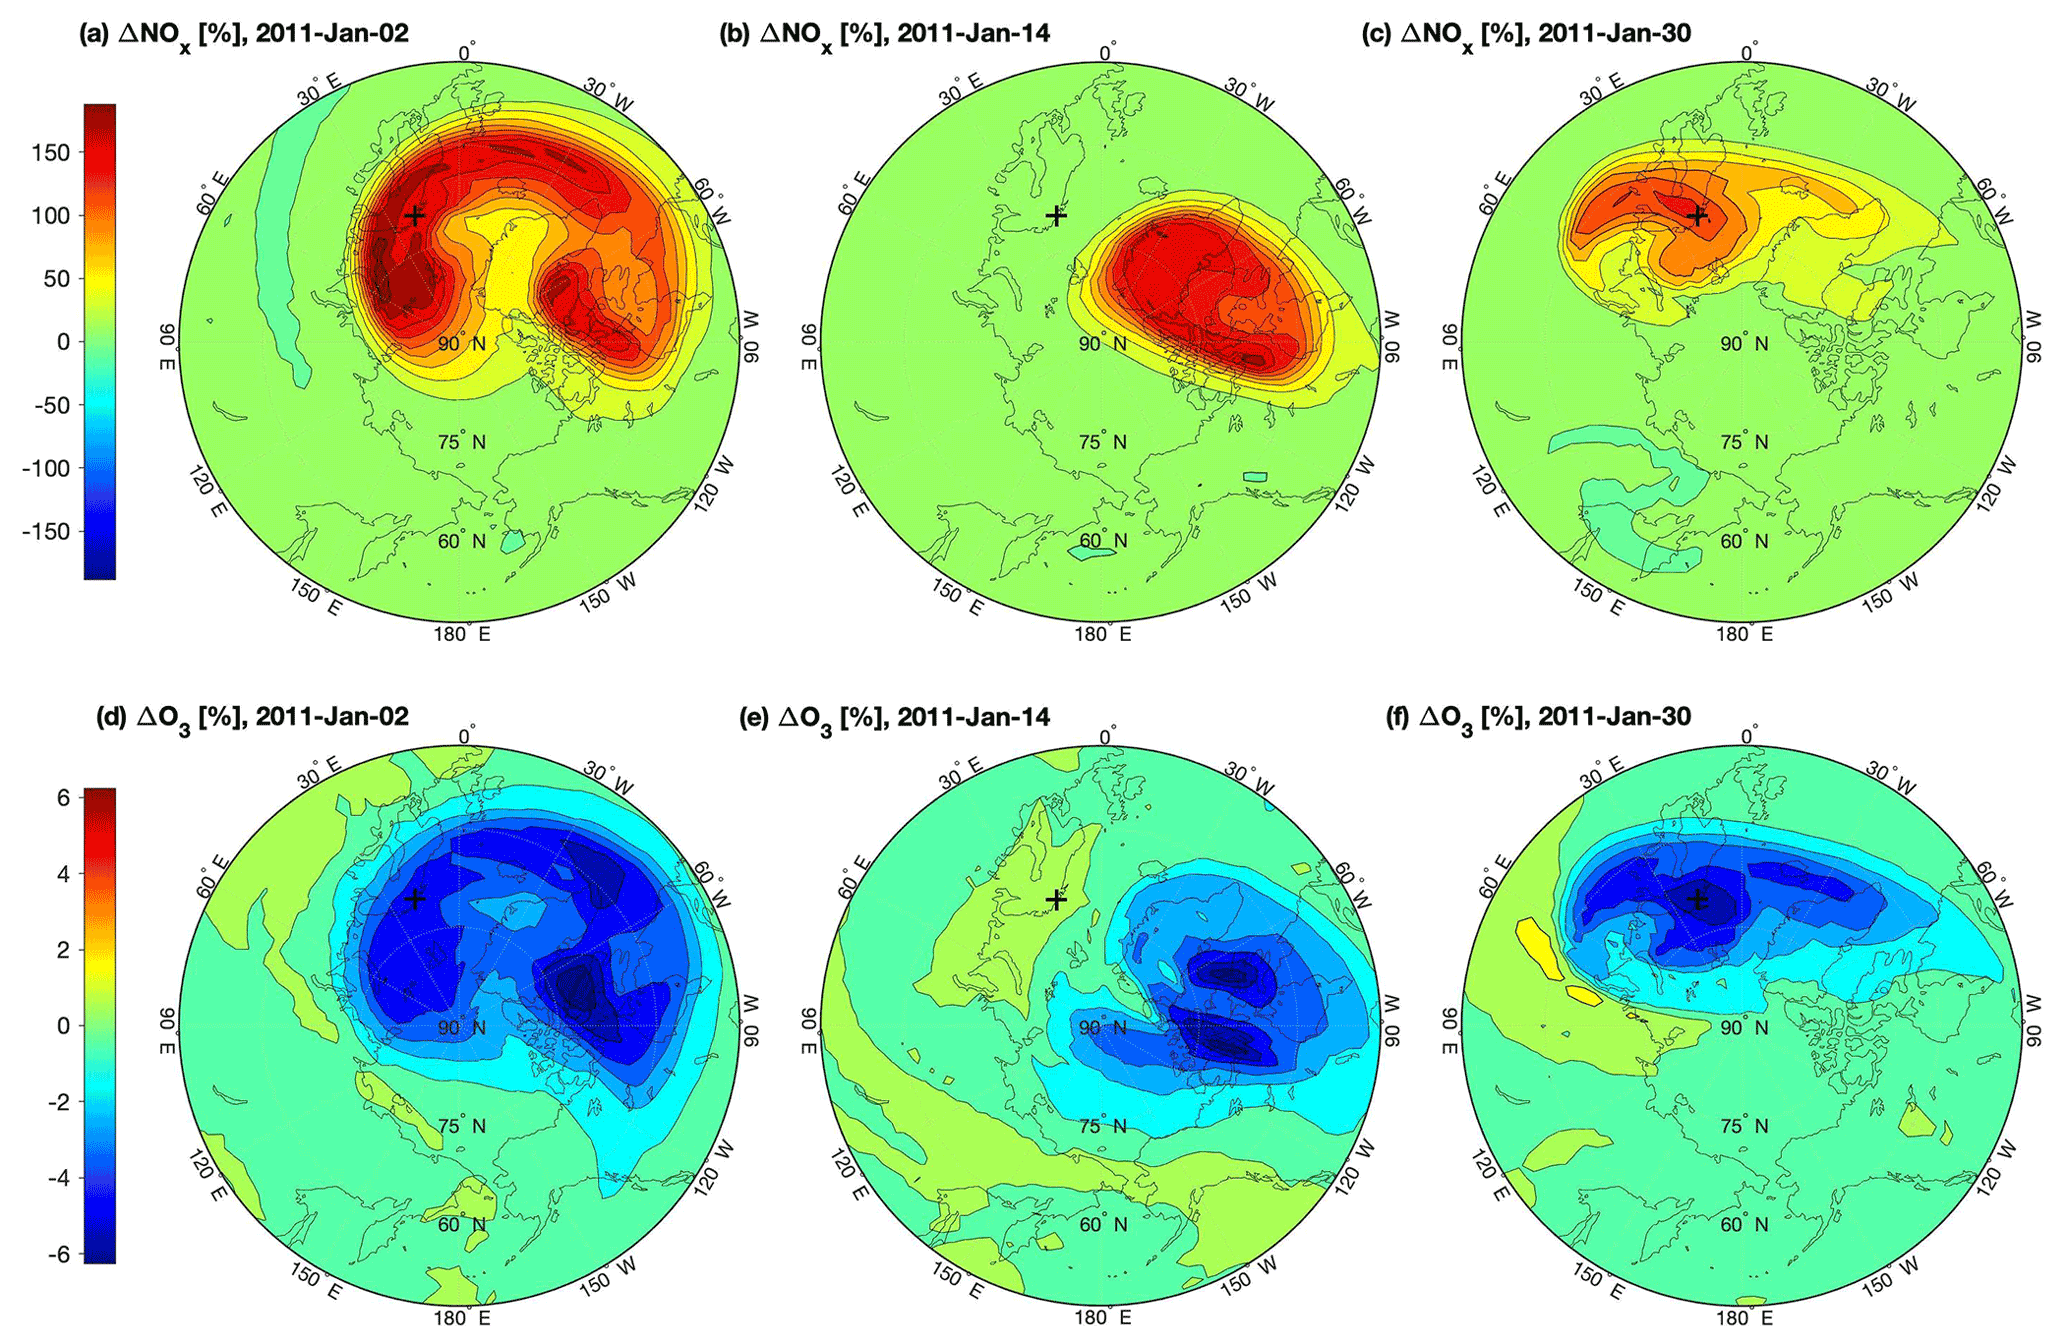
Figure 7(a, b, c) Relative NOx differences between the full-PsA and no-PsA simulations at ∼ 40 km altitude, at 12:00 UT on (a) 2 January 2011, (b) 14 January 2011, and (c) 30 January 2011. The black cross indicates the Tromsø station location. Latitudes from 45 to 90∘ N are displayed. (d, e, f) Same as the top row but for O3.
Based on our analysis, PsA EEP is common and strong enough to have an impact on polar ozone through the production of NOx in the mesosphere to lower thermosphere and its wintertime descent inside the polar vortex. The magnitude of the mesospheric column response from the HOx increase, i.e. up to about 5 % decrease above 60 km in the SH (Fig. 6d, 30 d mean), is clearly smaller than the PsA-EEP impact estimated in previous studies (Turunen et al., 2016; Tesema et al., 2020), and it is smaller than what has been estimated for substorm precipitation (Seppälä et al., 2015). However, these previous studies considered the direct short-term ozone response in the middle mesosphere locally and did not consider the background variability from atmospheric dynamics in their simulations. Our results now indicate that satellite-based detection of PsA-EEP ozone impact would be challenging in the mesosphere due to overall short-term variability of the response. Even in simulations, the variability of internal model dynamics could largely mask ozone responses smaller than ∼ 5 % (e.g. Verronen et al., 2020). In the column above 30 km, including the upper stratosphere, the ozone decrease reaches up to 8 % and 3 % with and without the direct mesospheric PsA-EEP impact, respectively. This highlights the importance of the mesospheric NOx production to the stratospheric ozone response, and it is in agreement with previous studies (Arsenovic et al., 2016; Andersson et al., 2018). For example, Andersson et al. (2018) noted a similar ozone response to mesospheric NOx production when applying the CMIP6 medium-energy electron (MEE) forcing. It is also interesting to note that the magnitude of our PsA-EEP ozone response is close to the 7 % ozone decrease from MEE reported by Andersson et al. (2018), although our model setup and analysis is different from theirs. Particularly, Andersson et al. (2018) made their simulations with fully free-running dynamics, made their comparisons between years of high and low EPP, and did not use a D-region ion chemistry extension. All of these differences should contribute to smaller atmospheric responses than in our analysis. Since the CMIP6 MEE forcing is from a proxy model based on observations, it should cover all types of electron precipitation at energies 30–1000 keV including PsA EEP. Thus, the similarity in the magnitude of ozone response could indicate an overestimation of PsA-EEP impact or an underestimation of overall electron impact in the CMIP6 MEE set as has been suggested, for example, by Nesse Tyssøy et al. (2019). On the other hand, a larger EPP impact is generally seen in satellite observations; for example, Fytterer et al. (2015) and Damiani et al. (2016) have reported ozone depletion between 5 % and 15 % in the upper stratosphere. Therefore, in the context of the current underestimation of EPP-NOx in simulations (Hendrickx et al., 2018; Smith-Johnsen et al., 2018; Pettit et al., 2019), PsA EEP could provide part of the missing NOx and improve simulations of ozone response.
The simulated 5 % SH ozone depletion from PsA EEP alone is a substantial contribution to the total EPP impact, because it is comparable to that seen in satellite observations (up to 15 % in the SH upper stratosphere; Damiani et al., 2016) and in simulations (e.g. 7 % in the SH upper stratosphere; Andersson et al., 2018). Capturing the magnitude of the stratospheric ozone response is important for realistic simulations of the proposed ground-level climate connection, because middle atmospheric ozone controls the dynamical response through absorption of solar ultraviolet radiation. The ozone response to EPP is typically seen in the polar cap areas (as shown e.g. in Fig. 7), but it also affects the temperature balance between the middle and polar latitudes and subsequently the zonal winds, and it connects to the ground-level climate variability (Baumgaertner et al., 2011). Currently, the ground-level regional temperature variability from observations (± 5 K; Seppälä et al., 2009) exceeds the simulated variability (± 1 K; Rozanov et al., 2012), and improvements in the EPP forcing could help to reduce the difference.
Although we present a simplified sensitivity study here, the results indicate that PsA EEP has the potential to contribute considerably to the total EPP forcing and a stronger response in middle atmospheric NOx and ozone. Currently, the CMIP6 MEE forcing data cover part of our estimated PsA-EEP energy and latitude range (van de Kamp et al., 2016). However, there are problems related to the satellite-based data used to create CMIP6 MEE, including proton contamination and noise floor issues. Also, the spatiotemporal variability of CMIP6 MEE is driven by the geomagnetic Ap index. It is not clear how good a proxy Ap is for different types of EPP, because PsA, substorm precipitation, and microburst electrons all have their own energy, latitude, and temporal characteristics and are driven by different solar wind and magnetospheric processes (Asikainen and Ruopsa, 2016). Understanding quantitatively the relative contributions of different types of EPP to the total forcing remains a challenge.
Finally, we note that our study presents the atmospheric response to a simplified, repeating pattern of PsA-EEP forcing and highlights some seasonal differences between the NH and the SH. In each hemisphere, however, seasonal responses are expected to vary from year to year, driven by variations in PsA-EEP forcing and modulated by differences in polar atmospheric dynamics which define the background conditions locally (e.g. Newnham et al., 2018). Over longer periods, assessment of the PsA-EEP impact on the atmosphere and further on climate requires understanding of the PsA-EEP variability over solar cycle timescales and consideration of the year-to-year variability of dynamical conditions. This is a target for future studies in which chemistry–climate models like WACCM-D are a strong asset.
In this paper, we have studied the seasonal ozone impacts of PsA EEP, particularly at two polar observatory locations. We have shown that PsA EEP has the potential to cause appreciable longer-term atmospheric impacts, and part of the NOx shortage found in previous simulation work could be covered by considering PsA EEP. This is the first study focusing on the longer-term atmospheric impacts from PsA EEP, including the contribution of atmospheric dynamics on the NOx/ozone response. Based on our simulations which utilize the latest knowledge on PsA-EEP energy-flux spectrum and spatiotemporal extent, as well as the WACCM model with its lower ionospheric chemistry extension, we conclude the following:
-
PsA EEP has the potential to cause a measurable ozone depletion in the column above 30 km. The main impact, up to 8 % decrease in the upper stratosphere in winter periods, is caused by descent of PsA-NOx from altitudes above. The mesospheric production of NOx from the high-energy part of PsA EEP causes more than half of the ozone response.
-
In the mesosphere, there is a PsA-EEP 30 d mean impact reaching to 5 % of O3 loss from the HOx enhancement. However, on hourly timescales the ozone response is less clear and displays a large variability.
-
A larger PsA-EEP impact is seen in the SH where the variability of atmospheric dynamics is smaller than in the NH. Overall, the interpretation of ground-based observations requires consideration of polar vortex dynamics.
We conclude that PsA EEP has the potential to contribute to the total EPP forcing and lead to a stronger response of middle atmospheric NOx and ozone. More work is needed to understand qualitatively the relative contributions from different types of EPP to the atmospheric response over solar cycle timescales.
WACCM source code is distributed freely through a public subversion code repository of the Coupled Earth System Model (CESM) (http://www.cesm.ucar.edu/models/cesm1.0/, University Corporation of Atmospheric Research (UCAR), last access: April 2021). WACCM-D has been officially released with the CESM version 2.0 in June 2018 (http://www.cesm.ucar.edu/models/cesm2/, UCAR, last access: April 2021). The simulation data used in the analysis are open-access data and freely available through the B2SHARE service (https://doi.org/10.23728/FMI-B2SHARE.D3BFECA00C1744328DA71CC7A8DCAD76, Verronen, 2021, last access: May 2021).
All authors contributed to the original research plan. PTV, AK, and NP defined the PsA-EEP forcing. PTV and MES made the simulations. PTV and AK analysed the data and made the figures. PTV, AK, and NP led the writing of the paper. All authors contributed to the final paper.
The contact author has declared that neither they nor their co-authors have any competing interests.
Publisher’s note: Copernicus Publications remains neutral with regard to jurisdictional claims in published maps and institutional affiliations.
The work of Antti Kero is funded by the Tenure Track Project in Radio Science at Sodankylä Geophysical Observatory, University of Oulu.
This research has been supported by the Academy of Finland (grant no. 335555) and the Norges Forskningsråd (grant nos. 223252 and 287427).
This paper was edited by Dalia Buresova and reviewed by two anonymous referees.
Andersson, M. E., Verronen, P. T., Marsh, D. R., Päivärinta, S.-M., and Plane, J. M. C.: WACCM-D – Improved modeling of nitric acid and active chlorine during energetic particle precipitation, J. Geophys. Res.-Atmos., 121, 10328–10341, https://doi.org/10.1002/2015JD024173, 2016. a, b, c
Andersson, M. E., Verronen, P. T., Marsh, D. R., Seppälä, A., Päivärinta, S.-M., Rodger, C. J., Clilverd, M. A., Kalakoski, N., and van de Kamp, M.: Polar Ozone Response to Energetic Particle Precipitation Over Decadal Time Scales: The Role of Medium-Energy Electrons, J. Geophys. Res.-Atmos., 123, 607–622, https://doi.org/10.1002/2017JD027605, 2018. a, b, c, d, e, f, g, h
Arsenovic, P., Rozanov, E., Stenke, A., Funke, B., Wissing, J. M., Mursula, K., Tummon, F., and Peter, T.: The influence of Middle Range Energy Electrons on atmospheric chemistry and regional climate, J. Atmos. Sol.-Terr. Phys., 149, 180–190, https://doi.org/10.1016/j.jastp.2016.04.008, 2016. a
Asikainen, T. and Ruopsa, M.: Solar wind drivers of energetic electron precipitation, J. Geophys. Res.-Space, 121, 2209–2225, https://doi.org/10.1002/2015JA022215, 2016. a, b
Baumgaertner, A. J. G., Seppälä, A., Jöckel, P., and Clilverd, M. A.: Geomagnetic activity related NOx enhancements and polar surface air temperature variability in a chemistry climate model: modulation of the NAM index, Atmos. Chem. Phys., 11, 4521–4531, https://doi.org/10.5194/acp-11-4521-2011, 2011. a, b
Bland, E., Tesema, F., and Partamies, N.: D-region impact area of energetic particle precipitation during pulsating aurora, Ann. Geophys., 39, 135–149, https://doi.org/10.5194/angeo-39-135-2021, 2021. a, b
Bland, E. C., Partamies, N., Heino, E., Yukimatu, A. S., and Miyaoka, H.: Energetic Electron Precipitation Occurrence Rates Determined Using the Syowa East SuperDARN Radar, J. Geophys. Res.-Space, 124, 6253–6265, https://doi.org/10.1029/2018JA026437, 2019. a, b, c, d, e, f, g, h
Daae, M., Straub, C., Espy, P., and Newnham, D.: Atmospheric ozone above Troll station, Antarctica observed by a ground based microwave radiometer, Earth Syst. Sci. Data, 6, 105–115, https://doi.org/10.5194/essd-6-105-2014, 2014. a
Damiani, A., Funke, B., Santee, M. L., Cordero, R. R., and Watanabe, S.: Energetic particle precipitation: A major driver of the ozone budget in the Antarctic upper stratosphere, Geophys. Res. Lett., 43, 3554–3562, https://doi.org/10.1002/2016GL068279, 2016. a, b
Funke, B., López-Puertas, M., Stiller, G. P., and von Clarmann, T.: Mesospheric and stratospheric NOy produced by energetic particle precipitation during 2002–2012, J. Geophys. Res., 119, 4429–4446, https://doi.org/10.1002/2013JD021404, 2014. a
Funke, B., Ball, W., Bender, S., Gardini, A., Harvey, V. L., Lambert, A., López-Puertas, M., Marsh, D. R., Meraner, K., Nieder, H., Päivärinta, S.-M., Pérot, K., Randall, C. E., Reddmann, T., Rozanov, E., Schmidt, H., Seppälä, A., Sinnhuber, M., Sukhodolov, T., Stiller, G. P., Tsvetkova, N. D., Verronen, P. T., Versick, S., von Clarmann, T., Walker, K. A., and Yushkov, V.: HEPPA-II model-measurement intercomparison project: EPP indirect effects during the dynamically perturbed NH winter 2008–2009, Atmos. Chem. Phys., 17, 3573–3604, https://doi.org/10.5194/acp-17-3573-2017, 2017. a
Fytterer, T., Mlynczak, M. G., Nieder, H., Pérot, K., Sinnhuber, M., Stiller, G., and Urban, J.: Energetic particle induced intra-seasonal variability of ozone inside the Antarctic polar vortex observed in satellite data, Atmos. Chem. Phys., 15, 3327–3338, https://doi.org/10.5194/acp-15-3327-2015, 2015. a
Grandin, M., Kero, A., Partamies, N., McKay, D., Whiter, D., Kozlovsky, A., and Miyoshi, Y.: Observation of pulsating aurora signatures in cosmic noise absorption data, Geophys. Res. Lett., 44, 5292–5300, https://doi.org/10.1002/2017GL073901, 2017. a
Grono, E. and Donovan, E.: Differentiating diffuse auroras based on phenomenology, Ann. Geophys., 36, 891–898, https://doi.org/10.5194/angeo-36-891-2018, 2018. a
Grono, E. and Donovan, E.: Surveying pulsating auroras, Ann. Geophys., 38, 1–8, https://doi.org/10.5194/angeo-38-1-2020, 2020. a
Haario, H., Laine, M., Mira, A., and Saksman, E.: DRAM: Efficient adaptive MCMC, Stat. Comput., 16, 339–354, https://doi.org/10.1007/s11222-006-9438-0, 2006. a
Heino, E., Verronen, P. T., Kero, A., Kalakoski, N., and Partamies, N.: Cosmic noise absorption during solar proton events in WACCM-D and riometer observations, J. Geophys. Res.-Space, 124, 1361–1376, https://doi.org/10.1029/2018JA026192, 2019. a
Hendrickx, K., Megner, L., Marsh, D. R., and Smith-JohnsenSm, C.: Production and transport mechanisms of NO in the polar upper mesosphere and lower thermosphere in observations and models, Atmos. Chem. Phys., 18, 9075–9089, https://doi.org/10.5194/acp-18-9075-2018, 2018. a
Jackman, C. H., Marsh, D. R., Vitt, F. M., Garcia, R. R., Fleming, E. L., Labow, G. J., Randall, C. E., López-Puertas, M., Funke, B., von Clarmann, T., and Stiller, G. P.: Short- and medium-term atmospheric constituent effects of very large solar proton events, Atmos. Chem. Phys., 8, 765–785, https://doi.org/10.5194/acp-8-765-2008, 2008. a
Jackman, C. H., Marsh, D. R., Kinnison, D. E., Mertens, C. J., and Fleming, E. L.: Atmospheric changes caused by galactic cosmic rays over the period 1960–2010, Atmos. Chem. Phys., 16, 5853–5866, https://doi.org/10.5194/acp-16-5853-2016, 2016. a
Jones, S. L., Lessard, M. R., Rychert, K., Spanswick, E., and Donovan, E.: Large-scale aspects and temporal evolution of pulsating aurora, J. Geophys. Res.-Space, 116, A03214, https://doi.org/10.1029/2010JA015840, 2011. a, b
Jones, S. L., Lessard, M. R., Rychert, K., Spanswick, E., Donovan, E., and Jaynes, A. N.: Persistent, widespread pulsating aurora: A case study, J. Geophys. Res.-Space, 118, 2998–3006, https://doi.org/10.1002/jgra.50301, 2013a. a
Jones, S. L., Lessard, M. R., Rychert, K., Spanswick, E., Donovan, E., and Jaynes, A. N.: Persistent, widespread pulsating aurora: A case study, J. Geophys. Res.-Space, 118, 2998–3006, https://doi.org/10.1002/jgra.50301, 2013b. a
Kalakoski, N., Verronen, P. T., Seppälä, A., Szeląg, M. E., Kero, A., and Marsh, D. R.: Statistical response of middle atmosphere composition to solar proton events in WACCM-D simulations: importance of lower ionospheric chemistry, Atmos. Chem. Phys., 20, 8923–8938, https://doi.org/10.5194/acp-20-8923-2020, 2020. a, b
Lessard, M. R.: A Review of Pulsating Aurora, American Geophysical Union (AGU), 55–68, https://doi.org/10.1029/2011GM001187, 2013. a
Maliniemi, V., Asikainen, T., Mursula, K., and Seppälä, A.: QBO-dependent relation between electron precipitation and wintertime surface temperature, J. Geophys. Res.-Atmos., 118, 6302–6310, https://doi.org/10.1002/jgrd.50518, 2013. a
Marsh, D. R., Garcia, R. R., Kinnison, D. E., Boville, B. A., Sassi, F., Solomon, S. C., and Matthes, K.: Modeling the whole atmosphere response to solar cycle changes in radiative and geomagnetic forcing, J. Geophys. Res.-Atmos., 112, D23306, https://doi.org/10.1029/2006JD008306, 2007. a, b
Marsh, D. R., Mills, M., Kinnison, D., Lamarque, J.-F., Calvo, N., and Polvani, L.: Climate change from 1850 to 2005 simulated in CESM1(WACCM), J. Clim., 26, 7372–7391, https://doi.org/10.1175/JCLI-D-12-00558.1, 2013. a
Matthes, K., Funke, B., Andersson, M. E., Barnard, L., Beer, J., Charbonneau, P., Clilverd, M. A., Dudok de Wit, T., Haberreiter, M., Hendry, A., Jackman, C. H., Kretschmar, M., Kruschke, T., Kunze, M., Langematz, U., Marsh, D. R., Maycock, A., Misios, S., Rodger, C. J., Scaife, A. A., Seppälä, A., Shangguan, M., Sinnhuber, M., Tourpali, K., Usoskin, I., van de Kamp, M., Verronen, P. T., and Versick, S.: Solar Forcing for CMIP6, Geosci. Model Dev., 10, 2247–2302, https://doi.org/10.5194/gmd-10-2247-2017, 2017. a, b, c
McCrea, I., Aikio, A., Alfonsi, L., Belova, E., Buchert, S., Clilverd, M., Engler, N., Gustavsson, B., Heinselman, C., Kero, J., Kosch, M., Lamy, H, Leyser, T, Ogawa, Y., Oksavik, K., Pellinen-Wannberg, A., Pitout, F., Rapp, M., Stanislawska, I., and Vierinen, J.: The science case for the EISCAT_3D radar, Prog. Earth Planet. Sc., 21, https://doi.org/10.1186/s40645-015-0051-8, 2015. a
Miyoshi, Y., Katoh, Y., Nishiyama, T., Sakanoi, T., Asamura, K., and Hirahara, M.: Time of flight analysis of pulsating aurora electrons, considering wave-particle interactions with propagating whistler mode waves, J. Geophys. Res.-Space, 115, A10312, https://doi.org/10.1029/2009JA015127, 2010. a
Miyoshi, Y., Oyama, S., Saito, S., Kurita, S., Fujiwara, H., Kataoka, R., Ebihara, Y., Kletzing, C., Reeves, G., Santolik, O., Clilverd, M., Rodger, C. J., Turunen, E., and Tsuchiya, F.: Energetic electron precipitation associated with pulsating aurora: EISCAT and Van Allen Probe observations, J. Geophys. Res.-Space, 120, 2754–2766, https://doi.org/10.1002/2014JA020690, 2015a. a, b
Miyoshi, Y., Saito, S., Seki, K., Nishiyama, T., Kataoka, R., Asamura, K., Katoh, Y., Ebihara, Y., Sakanoi, T., Hirahara, M., Oyama, S., Kurita, S., and Santolik, O.: Relation between fine structure of energy spectra for pulsating aurora electrons and frequency spectra of whistler mode chorus waves, J. Geophys. Res.-Space, 120, 7728–7736, https://doi.org/10.1002/2015JA021562, 2015b. a
Miyoshi, Y., Saito, S., Kurita, S., Asamura, K., Hosokawa, K., Sakanoi, T., Mitani, T., Ogawa, Y., Oyama, S., Tsuchiya, F., Jones, S. L., Jaynes, A. N., and Blake, J. B.: Relativistic Electron Microbursts as High-Energy Tail of Pulsating Aurora Electrons, Geophys. Res. Lett., 47, e90360, https://doi.org/10.1029/2020GL090360, 2020. a
Miyoshi, Y., Hosokawa, K., Kurita, S., Oyama, S.-I., Ogawa, Y., Saito, S., Shinohara, I., Kero, A., Turunen, E., Verronen, P. T., Kasahara, S., Yokota, S., Mitani, T., Takashima, T., Higashio, N., Kasahara, Y., Matsuda, S., Tsuchiya, F., Kumamoto, A., Matsuoka, A., Hori, T., Keika, K., Shoji, M., Teramoto, M., Imajo, S., Jun, C., and Nakamura, S.: Penetration of MeV electrons into the mesosphere accompanying pulsating aurorae, Sci. Rep., 11, 13724, https://doi.org/10.1038/s41598-021-92611-3, 2021. a
Miyoshi, Y. S., Jordanova, V. K., Morioka, A., and Evans, D. S.: Solar cycle variations of the electron radiation belts: Observations and radial diffusion simulation, Space Weather, 2, S10S02, https://doi.org/10.1029/2004SW000070, 2004. a
Nesse Tyssøy, H., Haderlein, A., Sandanger, M. I., and Stadsnes, J.: Intercomparison of the POES/MEPED loss cone electron fluxes with the CMIP6 parametrization, J. Geophys. Res.-Space, 124, 628–642, https://doi.org/10.1029/2018JA025745, 2019. a, b, c
Newnham, D. A., Clilverd, M. A., Rodger, C. J., Hendrickx, K., Megner, L., Kavanagh, A. J., Seppälä, A., Verronen, P. T., Andersson, M. E., Marsh, D. R., Kovacs, T., Feng, W., and Plane, J. M. C.: Observations and modelling of increased nitric oxide in the Antarctic polar middle atmosphere associated with geomagnetic storm driven energetic electron precipitation, J. Geophys. Res.-Space, 123, 6009–6025, https://doi.org/10.1029/2018JA025507, 2018. a, b
Nishimura, Y., Lessard, M. R., Katoh, Y., Miyoshi, Y., Grono, E., Partamies, N., Sivadas, N., Hosokawa, K., Fukizawa, M., Samara, M., Michell, R. G., Kataoka, R., Sakanoi, T., Whiter, D. K., Oyama, S.-i., Ogawa, Y., and Kurita, S.: Diffuse and Pulsating Aurora, Space Sci. Rev., 216, 4, 2020. a, b
Orsolini, Y. J., Smith-Johnsen, C., Marsh, D. R., Stordal, F., Rodger, C. J., Verronen, P. T., and Clilverd, M. A.: Mesospheric nitric acid enhancements during energetic electron precipitation events simulated by WACCM-D, J. Geophys. Res.-Atmos., 123, 6984–6998, https://doi.org/10.1029/2017JD028211, 2018. a, b
Päivärinta, S.-M., Seppälä, A., Andersson, M. E., Verronen, P. T., Thölix, L., and Kyrölä, E.: Observed effects of solar proton events and sudden stratospheric warmings on odd nitrogen and ozone in the polar middle atmosphere, J. Geophys. Res.-Atmos., 118, 6837–6848, https://doi.org/10.1002/jgrd.50486, 2013. a
Partamies, N., Whiter, D., Kadokura, A., Kauristie, K., Nesse Tyssøy, H., Massetti, S., Stauning, P., and Raita, T.: Occurrence and average behavior of pulsating aurora, J. Geophys. Res.-Space, 122, 5606–5618, https://doi.org/10.1002/2017JA024039, 2017. a, b, c, d
Partamies, N., Bolmgren, K., Heino, E., Ivchenko, N., Borovsky, J. E., and Sundberg, H.: Patch Size Evolution During Pulsating Aurora, J. Geophys. Res.-Space, 124, 4725–4738, https://doi.org/10.1029/2018JA026423, 2019. a
Pettit, J., Randall, C. E., Peck, E. D., Marsh, D. R., van de Kamp, M., and Fang, X. C.: Atmospheric effects of >30-keV energetic electron precipitation in the southern hemisphere winter during 2003, J. Geophys. Res.-Space, 124, 5747–5763, https://doi.org/10.1029/2019JA026868, 2019. a, b
Randall, C. E., Rusch, D. W., Bevilacqua, R. M., Hoppel, K. W., and Lumpe, J. D.: Polar Ozone and Aerosol Measurement (POAM) II stratospheric NO2, 1993–1996, J. Geophys. Res.-Atmos., 103, 28361–28371, https://doi.org/10.1029/98JD02092, 1998. a
Randall, C. E., Harvey, V. L., Manney, G. L., Orsolini, Y., Codrescu, M., Sioris, C., Brohede, S., Haley, C. S., Gordley, L. L., Zawodny, J. M., and Russell, J. M.: Stratospheric effects of energetic particle precipitation in 2003–2004, Geophys. Res. Lett., 32, L05802, https://doi.org/10.1029/2004GL022003, 2005. a
Randall, C. E., Harvey, V. L., Holt, L. A., Marsh, D. R., Kinnison, D., Funke, B., and Bernath, P. F.: Simulation of energetic particle precipitation effects during the 2003–2004 Arctic winter, J. Geophys. Res.-Space, 120, 5035–5048, https://doi.org/10.1002/2015JA021196, 2015. a, b
Rienecker, M. M., Suarez, M. J., Todling, R., Bacmeister, J., Takacs, L., Liu, H.-C., Gu, W., Sienkiewicz, M., Koster, R. D., Gelaro, R., Stajner, I., and Nielsen, J. E.:: The GEOS-5 Data Assimilation System: A Documentation of GEOS-5.0, Tech. Rep., 104606 V27, NASA, https://doi.org/10.1186/s40645-015-0051-8, 2008. a
Rodger, C. J., Clilverd, M. A., Green, J. C., and Lam, M. M.: Use of POES SEM-2 observations to examine radiation belt dynamics and energetic electron precipitation into the atmosphere, J. Geophys. Res.-Space, 115, A04202, https://doi.org/10.1029/2008JA014023, 2010a. a
Rozanov, E., Callis, L., Schlesinger, M., Yang, F., Andronova, N., and Zubov, V.: Atmospheric response to NOy source due to energetic electron precipitation, Geophys. Res. Lett., 32, L14811, https://doi.org/10.1029/2005GL023041, 2005. a
Rozanov, E., Calisto, M., Egorova, T., Peter, T., and Schmutz, W.: The influence of precipitating energetic particles on atmospheric chemistry and climate, Surv. Geophys., 33, 483–501, https://doi.org/10.1007/s10712-012-9192-0, 2012. a
Sandhu, J. K., Rae, I. J., Freeman, M. P., Gkioulidou, M., Forsyth, C., Reeves, G. D., Murphy, K. R., and Walach, M.-T.: Substorm-Ring Current Coupling: A Comparison of Isolated and Compound Substorms, J. Geophys. Res.-Space, 124, 6776–6791, https://doi.org/10.1029/2019JA026766, 2019. a
Seppälä, A., Randall, C. E., Clilverd, M. A., Rozanov, E., and Rodger, C. J.: Geomagnetic activity and polar surface air temperature variability, J. Geophys. Res., 114, A10312, https://doi.org/10.1029/2008JA014029, 2009. a, b
Seppälä, A., Clilverd, M. A., Beharrell, M. J., Rodger, C. J., Verronen, P. T., Andersson, M. E., and Newnham, D. A.: Substorm-induced energetic electron precipitation: Impact on atmospheric chemistry, Geophys. Res. Lett., 42, 8172–8176, https://doi.org/10.1002/2015GL065523, 2015. a, b
Seppälä, A., Douma, E., Rodger, C. J., Verronen, P. T., Clilverd, M. A., and Bortnik, J.: Relativistic Electron Microburst Events: Modeling the Atmospheric Impact, Geophys. Res. Lett., 45, 1141–1147, https://doi.org/10.1002/2017GL075949, 2018. a
Sinnhuber, M., Kazeminejad, S., and Wissing, J. M.: Interannual variation of NOx from the lower thermosphere to the upper stratosphere in the years 1991–2005, J. Geophys. Res., 116, A02312, https://doi.org/10.1029/2010JA015825, 2011. a
Sinnhuber, M., Nieder, H., and Wieters, N.: Energetic particle precipitation and the chemistry of the mesosphere/lower thermosphere, Surv. Geophys., 33, 1281–1334, https://doi.org/10.1007/s10712-012-9201-3, 2012. a
Sinnhuber, M., Friederich, F., Bender, S., and Burrows, J. P.: The response of mesospheric NO to geomagnetic forcing in 2002–2012 as seen by SCIAMACHY, J. Geophys. Res.-Space, 121, 3603–3620, https://doi.org/10.1002/2015JA022284, 2016. a
Smith-Johnsen, C., Marsh, D., Orsolini, Y., Nesse Tyssøy, H., Hendrickx, K., Sandanger, M., Glesnes Ødegaard, L.-K., and Stordal, F.: Nitric oxide response to the April 2010 electron precipitation event: Using WACCM and WACCM-D with and without medium-energy electrons, J. Geophys. Res.-Space, 123, 5232–5245, https://doi.org/10.1029/2018JA025418, 2018. a
Tesema, F., Partamies, N., Tyssøy, H. N., Kero, A., and Smith-Johnsen, C.: Observations of electron precipitation during pulsating aurora and its chemical impact, J. Geophys. Res.-Space, 125, e2019JA027713, https://doi.org/10.1029/2019JA027713, 2020. a, b, c, d, e, f, g
Tesema, F., Partamies, N., Nesse Tyssøy, H., and McKay, D.: Observations of precipitation energies during different types of pulsating aurora, Ann. Geophys., 38, 1191–1202, https://doi.org/10.5194/angeo-38-1191-2020, 2020b. a
Turunen, E., Verronen, P. T., Seppälä, A., Rodger, C. J., Clilverd, M. A., Tamminen, J., Enell, C.-F., and Ulich, T.: Impact of different precipitation energies on NOx generation during geomagnetic storms, J. Atmos. Sol.-Terr. Phys., 71, 1176–1189, https://doi.org/10.1016/j.jastp.2008.07.005, 2009. a
Turunen, E., Kero, A., Verronen, P. T., Miyoshi, Y., Oyama, S., and Saito, S.: Mesospheric ozone destruction by high-energy electron precipitation associated with pulsating aurora, J. Geophys. Res.-Atmos., 121, 11852–11861, https://doi.org/10.1002/2016JD025015, 2016. a, b, c, d, e, f, g, h
van de Kamp, M., Seppälä, A., Clilverd, M. A., Rodger, C. J., Verronen, P. T., and Whittaker, I. C.: A model providing long-term datasets of energetic electron precipitation during geomagnetic storms, J. Geophys. Res.-Atmos., 121, 12520–12540, https://doi.org/10.1002/2015JD024212, 2016. a, b
van de Kamp, M., Rodger, C. J., Seppälä, A., Clilverd, M. A., and Verronen, P. T.: An updated model providing long-term datasets of energetic electron precipitation, including zonal dependence, J. Geophys. Res.-Atmos., 123, 9891–9915, https://doi.org/10.1029/2017JD028253, 2018. a
Verronen, P. T.: Simulated atmospheric data from Verronen et al. (2021), “Simulated seasonal impact on middle atmospheric ozone from high-energy electron precipitation related to pulsating aurorae” submitted to Annales Geophysicae, FMI B2SHARE [D3BFECA00C1744328DA71CC7A8DCAD76], available at: https://fmi.b2share.csc.fi/records/d3bfeca00c1744328da71cc7a8dcad76, 2021. a
Verronen, P. T. and Lehmann, R.: Analysis and parameterisation of ionic reactions affecting middle atmospheric HOx and NOy during solar proton events, Ann. Geophys., 31, 909–956, https://doi.org/10.5194/angeo-31-909-2013, 2013. a
Verronen, P. T. and Lehmann, R.: Enhancement of odd nitrogen modifies mesospheric ozone chemistry during polar winter, Geophys. Res. Lett., 42, 10445–10452, https://doi.org/10.1002/2015GL066703, 2015. a
Verronen, P. T., Andersson, M. E., Rodger, C. J., Clilverd, M. A., Wang, S., and Turunen, E.: Comparison of modeled and observed effects of radiation belt electron precipitation on mesospheric hydroxyl and ozone, J. Geophys. Res., 118, 11419–11428, https://doi.org/10.1002/jgrd.50845, 2013. a
Verronen, P. T., Andersson, M. E., Marsh, D. R., Kovács, T., and Plane, J. M. C.: WACCM-D – Whole Atmosphere Community Climate Model with D-region ion chemistry, J. Adv. Model. Earth Syst., 8, 954–975, https://doi.org/10.1002/2015MS000592, 2016. a, b
Verronen, P. T., Marsh, D. R., Szeląg, M. E., and Kalakoski, N.: Magnetic local time dependency of radiation belt electron precipitation: impact on ozone in the polar middle atmosphere, Ann. Geophys., 38, 833–844, https://doi.org/10.5194/angeo-38-833-2020, 2020. a