the Creative Commons Attribution 4.0 License.
the Creative Commons Attribution 4.0 License.
 | 24 Sep 2021
Observations of sunlit N2+ aurora at high altitudes during the RENU2 flight
Pål Gunnar Ellingsen
Dag Lorentzen
David Kenward
James H. Hecht
J. Scott Evans
Fred Sigernes
Marc Lessard
We present measurements of sunlit aurora during the launch of the Rocket Experiment for Neutral Upwelling 2 (RENU2) on the 13 December 2015, 07:34 UTC. The in situ auroral conditions coincide with those of sunlit aurora and were characterised by the 391.4 and 427.8 nm emissions. A correlation between several auroral wavelengths, as measured by a meridian-scanning photometer, was used to detect sunlit aurora and indirectly neutral upwelling. These results, based on ground data, agree well with the RENU2 measurements recorded during its pass through the sunlit polar cusp. Using in situ data from RENU2 and the solar photon flux, it was estimated that the sunlit aurora was a major part (≈40 %) of the observed 427.8 nm emission.
- Article
(6592 KB) - Full-text XML
-
Supplement
(2250 KB) - BibTeX
- EndNote


Upwelling of neutrals and ions is known to occur in the cusp region of the auroral oval (Lühr et al., 2004; Lorentzen et al., 2007; Carlson et al., 2012; Sadler et al., 2012). The upwelling is known to significantly increase the density of the upper ionosphere and can be observed by proxy as an increase in satellite drag over the cusp (Lühr et al., 2004). The underlying mechanisms behind the increased density above 400 km are not fully understood, and several explanations have been proposed. Carlson et al. (2012) used a first-principles physics model to show an increase in cusp and polar cap densities due to plasma flow shear through soft electron precipitation. According to a theoretical study by Deng et al. (2013), the precipitation of soft electrons together with a Poynting flux contributed to an increase in neutral density at 400 km. The electrons contributed to an increase in the Pedersen conductivity in the F-region. Electrons with around 100 eV of energy dominated this process. Cohen et al. (2015) used a model to study the relation between electron temperature and density and ion upwelling. They found that auroral precipitation, electron temperature and density increases all result in an increased upwelling. Due to the localised nature of the upwelling and lack of good techniques for remote measurement of neutrals in the ionosphere, sounding rockets have been used to gather in situ observations.
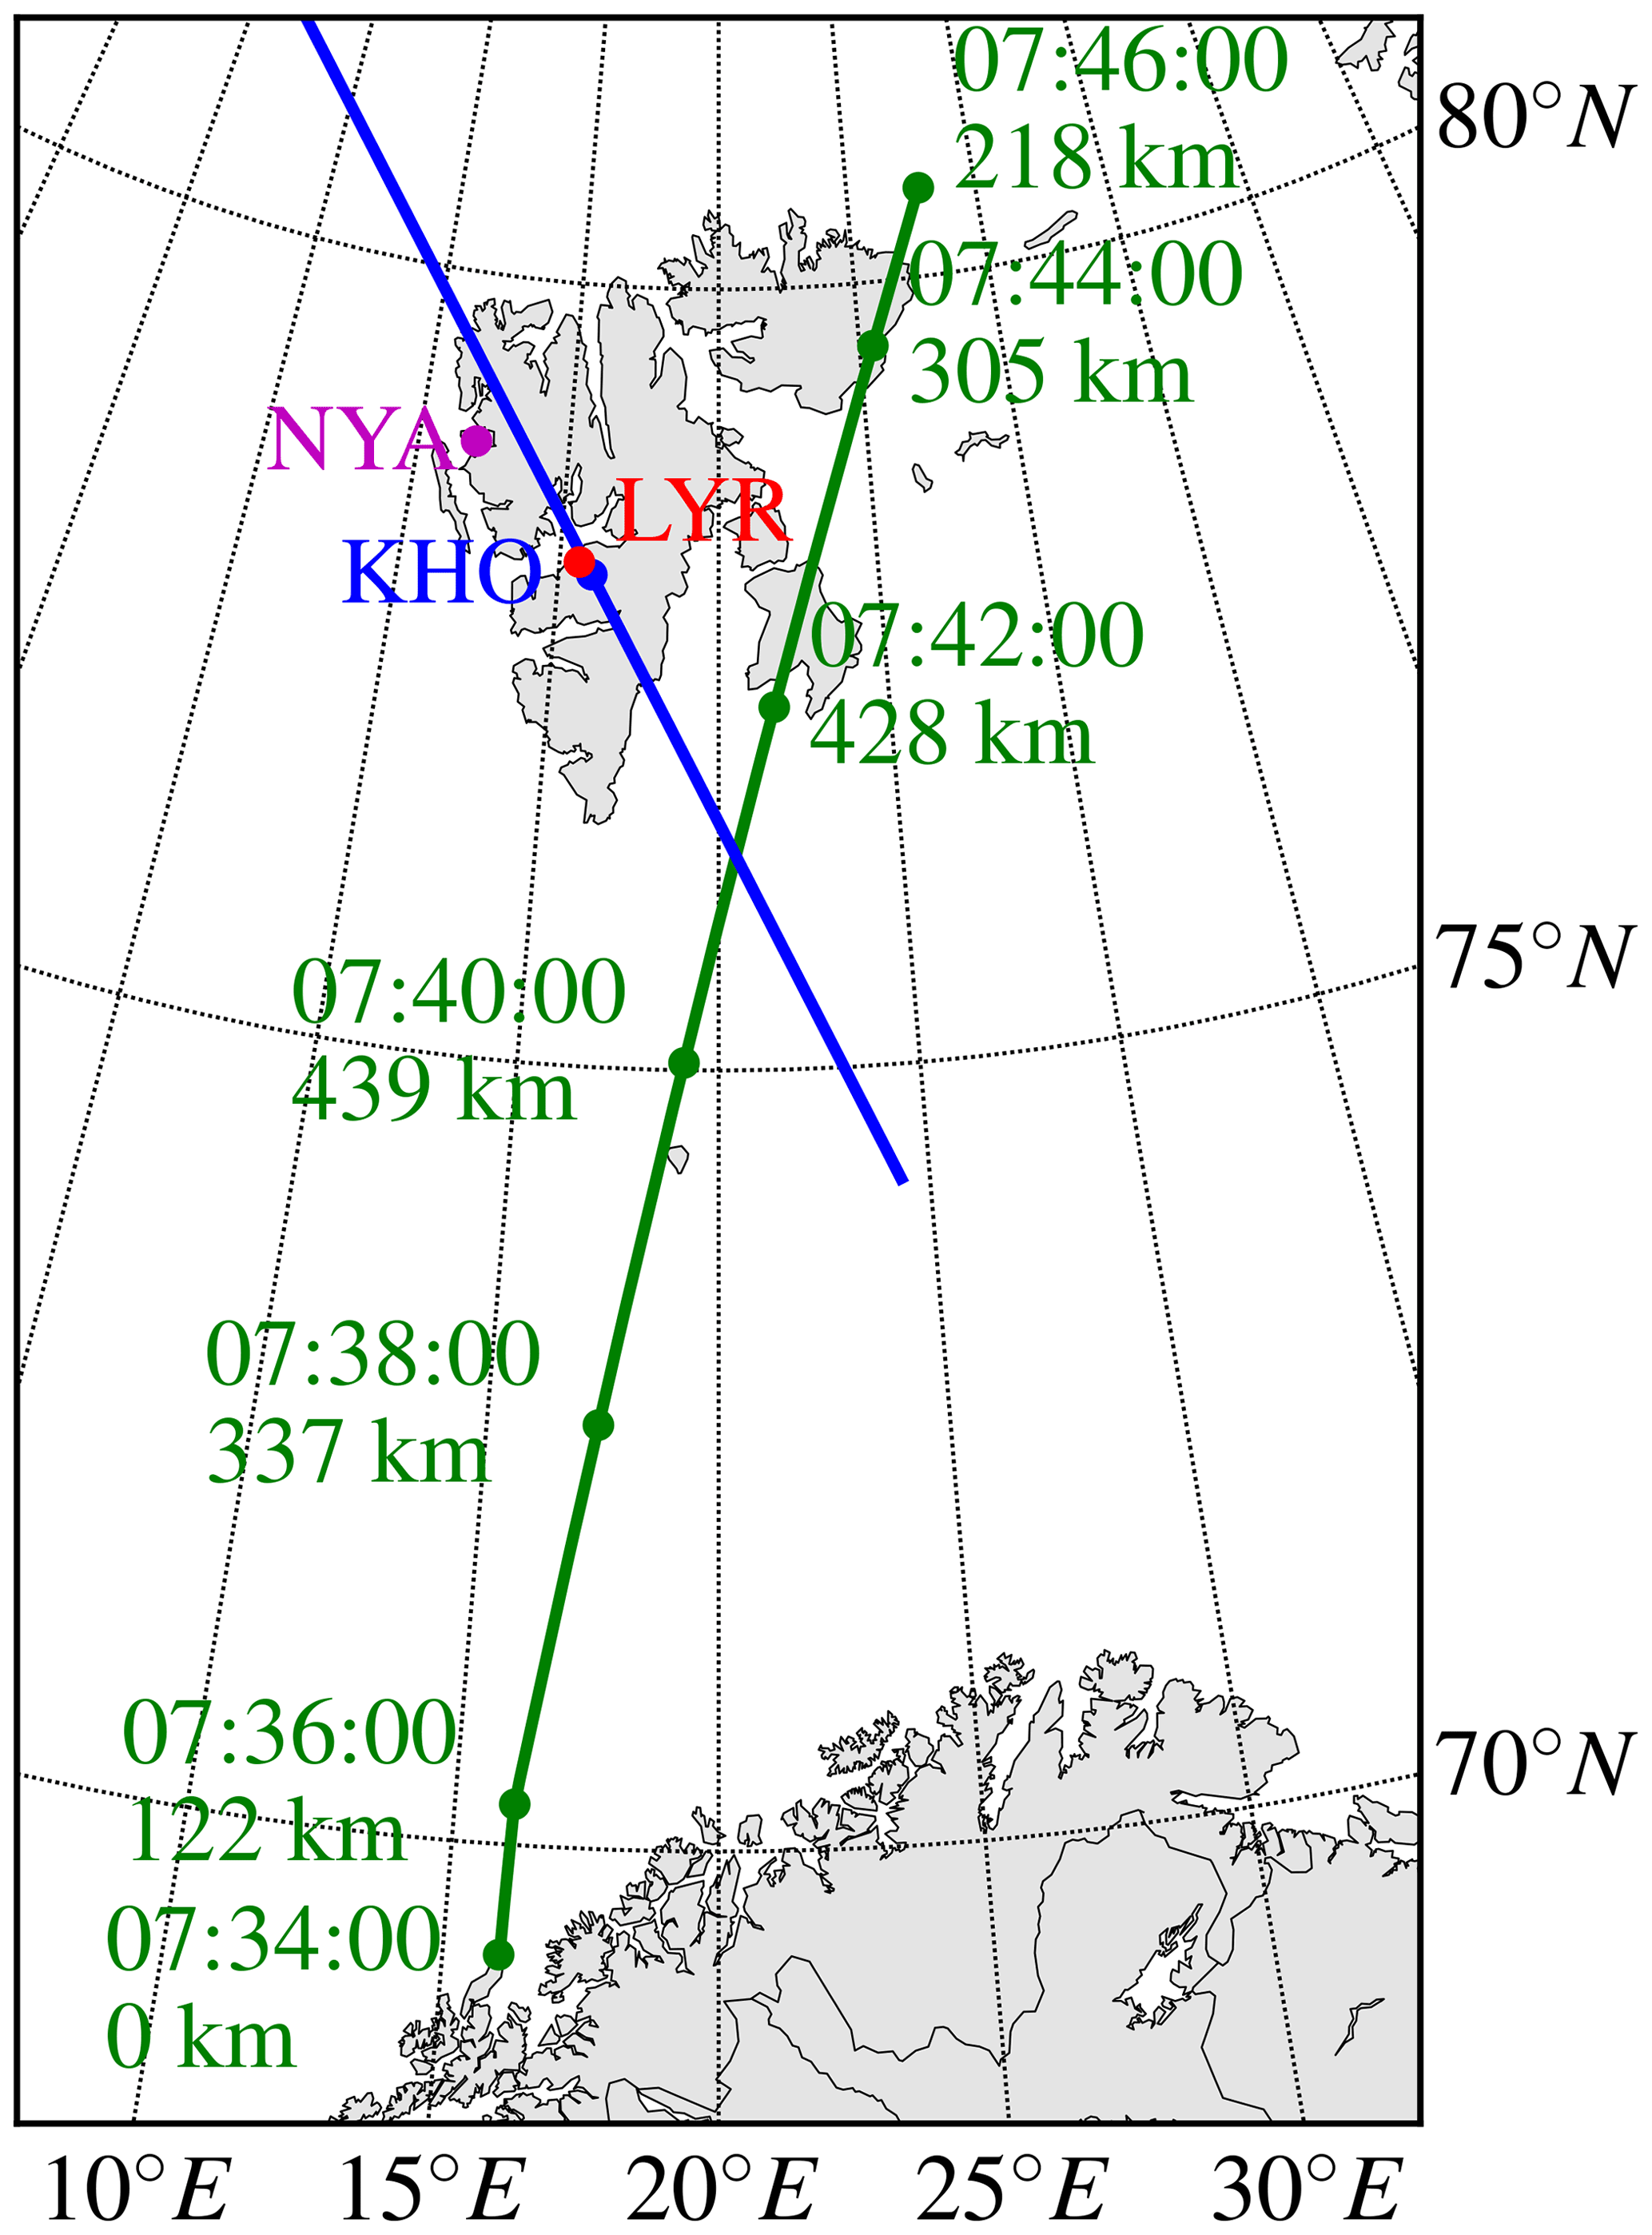
Figure 1 Figure showing the ground track for the RENU2 rocket (green) and the meridian-scanning photometer (MSP) scan line (blue) when scanning above 20∘ elevation angle. The locations of Longyearbyen (LYR), Ny-Ålesund (NYA) and the Kjell Henrisken Observatory (KHO) are shown.
Rocket Experiment for Neutral Upwelling 2 (RENU2) was launched from Andøya Space Centre (ASC) on the 13 December 2015, 07:34 UTC (≈10:34 MLT, magnetic local time). It flew through a Sun-illuminated cusp over eastern Svalbard. The launch track is shown Fig. 1. The payload carried a large variety of instruments for measuring the in situ magnetic and electric fields, ion and electron density and energy, optical emissions, and more. Details about the sounding rocket and its instrumentation can be found in the overview article for RENU2 (Lessard et al., 2020).
During the RENU2 campaign, ground-based support was available from Svalbard, both from Longyearbyen (LYR) and Ny-Ålesund (NYA); see Fig. 1. Support from SuperDARN (Super Dual Auroral Radar Network) for high-frequency (HF) radars was also given (Greenwald et al., 1995; Chisham et al., 2007). In addition to collecting data for post-launch analysis, data were used as input for the launch decision. In this paper we will concentrate on optical ground-based data from the LYR site and the Kjell Henriksen Observatory (KHO; geographical coordinates: 78.148∘ N, 16.043∘ E; magnetic coordinates (2015): 75.55∘ N, 109.66∘ E) in combination with rocket data, and the focus will be on studying the link between sunlit aurora and neutral upwelling, as well as how different processes contribute to the emissions.
2.1 Nitrogen ionisation and emission
Cusp aurora is optically characterised by an irradiance ratio and a typical electron precipitation energy of ≈0.5 keV. The Kjell Henriksen Observatory is placed directly beneath the statistical dayside auroral oval, with a negative solar zenith angle for more than 2 months of the year. However, parts of the ionosphere will always be sunlit in the daytime. The cusp auroral red emission line – 630.0 nm [OI] – has an average emission altitude of ≈250 km (Johnsen et al., 2012) due to collisional quenching at lower altitudes. In addition to the atomic oxygen emission, emissions in the first negative band of the ions have previously been observed in the sunlit part of the ionosphere at Svalbard (Deehr et al., 1980). During the RENU2 launch, the onboard photometer observed the 391.4 nm 1N (0,0) emission, while the ground-based meridian-scanning photometer at KHO observed the 427.8 nm 1N (0,1) emission.
The ionised nitrogen in the auroral 1N band is normally produced by direct ionisation via electron impact
where e′ is a thermal electron.
However ionised nitrogen can also be produced from molecular nitrogen by solar extreme ultraviolet (EUV) radiation via (Hunten, 2003; Jokiaho, 2009)
where hν is the EUV photon energy.
Under sunlit conditions in the ionosphere, the ion in its ground state (X), can experience resonant absorption of solar photons, ending up in an excited state ( A or B) and thus contributing to emissions from the Meinel or 1N band, respectively. The more common way of exciting is through precipitating electrons. In sunlit aurora it is expected that both will occur, while in non-sunlit conditions, only precipitating electrons will excite the .
2.2 EUV illumination of the ionosphere
At the time of the rocket launch, the area north of the launch site (ASC) was experiencing polar night, with the Sun continuously below the horizon, as seen from the ground. Higher altitudes had some sunlight, though the amount of EUV radiation depends on what part of the atmosphere the solar radiation had propagated through (Cohen et al., 2015). The penetration depth of EUV is wavelength dependent, and the majority of the EUV spectrum is attenuated by at least below 150 km (Brasseur, 1986). Therefore, we will define a sunlit ionosphere as an ionosphere where the incident EUV has not propagated lower than 150 km before reaching the point of interest.
In this article the definition of sunlit aurora will be the same as the one by Hunten (Hunten, 2003). In this summary he specifies that sunlit aurora occurs when fluoresces in the blue and violet as a result of being excited from the ground state by higher-energy sunlight.
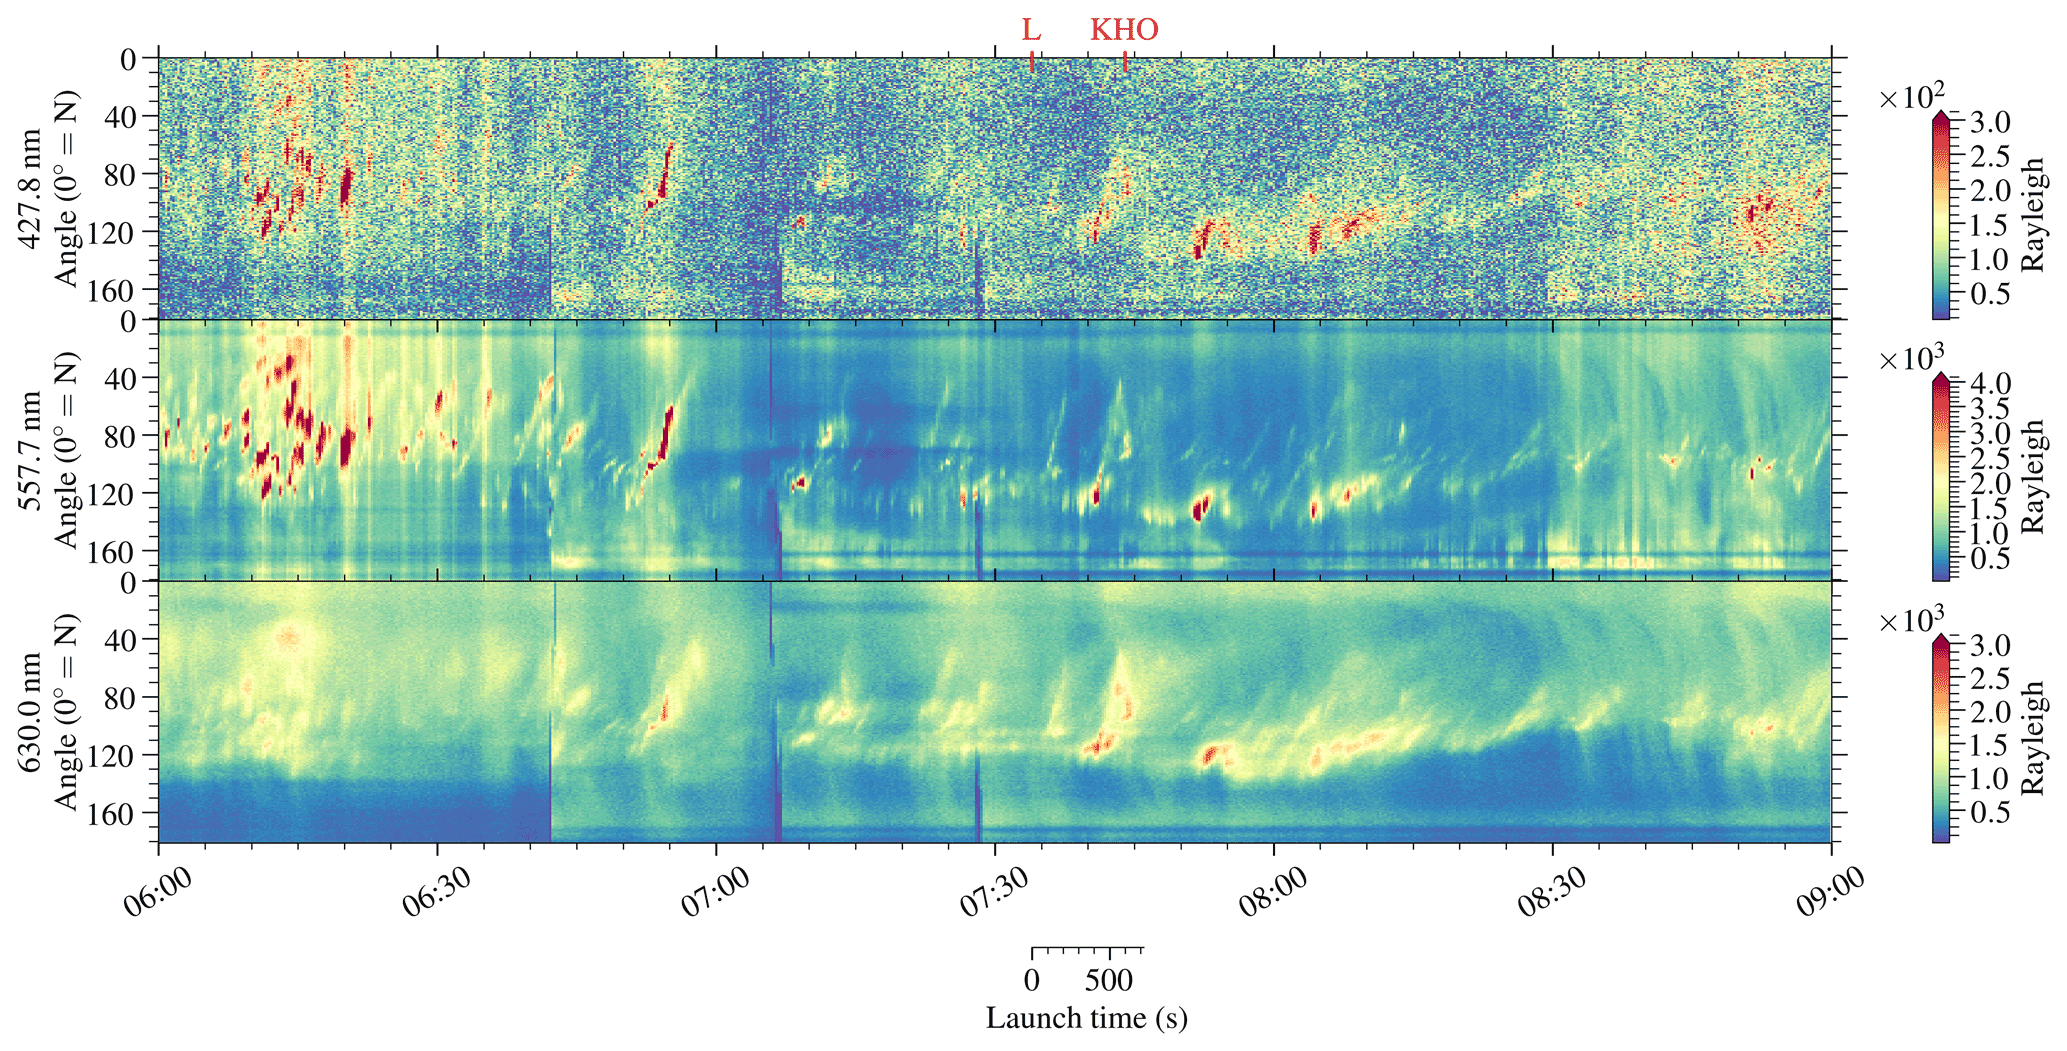
Figure 2The MSP data from 06:00 to 09:00 UTC. This shows the three recorded wavelengths over the north to south scan along the magnetic meridian. The vertical dark blue stripes are from when the slit covering the MSP was cleaned of snow. L and KHO mark the launch and passing east of KHO.
2.3 Poleward-moving auroral forms and cusp processes
It is known from literature that poleward-moving auroral forms (PMAFs) are associated with cusp aurora processes such as neutral and ion upflows (Moen et al., 2004), polar cap patches (Lorentzen et al., 2010) and flow channels (Sandholt and Farrugia, 2007; Herlingshaw et al., 2019). PMAFs are ionospheric signatures of pulsed magnetopause reconnection (Fasel, 1995; Sandholt and Farrugia, 2007). The upflows present under PMAFs can allow for the generation of sunlit aurora due to the increased availability of nitrogen at higher altitudes. If the ionosphere is illuminated by solar EUV (Sect. 2.1), nitrogen can be ionised, making it available for resonant scattering of sunlight. This gives rise to one of the more commonly studied sunlit aurora bands, the first negative band of , and then especially its emission at 427.8 nm (Chakrabarti, 1998; Hunten, 2003).
The ground-based optical observations were done under partly overcast conditions, with some light snow in the air. These observations were done with several types of optical instruments, but in this work we will concentrate on the meridian-scanning photometer (MSP) and a 180∘ fisheye all-sky camera. From the RENU2 payload, measurements from the electron plasma sensor (EPLAS) and the three photometers will be utilised. Measurements of incident EUV were acquired from the Extreme Ultraviolet Variability Experiment (EVE) on the Solar Dynamics Observatory satellite. Using the OMNI solar wind data service, it was seen that the interplanetary magnetic field component, Bz, turned southward at about 06:00 UTC and stayed negative until about 13:00 UTC, with a weakly negative value of −1.5 nT throughout the time period.
3.1 Meridian-scanning photometer
The meridian-scanning photometer (MSP) scans the magnetic meridian (see Fig. 1), at three different wavelengths: 630.0, 557.7 and 427.8 nm. The two first wavelengths are OI lines, while the last is the previously mentioned line. Narrow interference filters, with a bandpass of ≈0.4 nm, are mounted in individual tilting filter holders. By tilting the filter away from the measured emission line, the background can be measured and subsequently subtracted. Each revolution of the scanning mirror takes 4 s. One background-subtracted scan consequently takes 8 s. Two of these background-subtracted scans are averaged to give a complete acquisition time of 16 s.
Figure 2 shows 3 h of MSP data centred around the time of launch (07:34 UTC). Prior to the launch, a number of poleward-moving auroral forms (PMAFs) are observed. The first ones are seen around 06:30 UTC. PMAFs are indicative of pulsed magnetopause reconnection (i.e flux transfer events) (Sandholt and Farrugia, 2007; Russell and Elphic, 1978). The payload flew east of KHO and through the extended PMAF located on the keogram between 07:40 UTC (360 s) and 07:45 UTC (540 s) and 120 to 60∘ scan angle.
3.2 All-sky camera
The all-sky camera in use during the rocket campaign was a Sony a7s equipped with a 180∘ fisheye lens (Sigma 8 mm f3.5 EX DG Circular Fisheye). It is a full format CMOS camera and was taking images every 30 s with a 5 s exposure. During the launch, there was light snow settling on the dome of the camera (cleaned periodically). The images collected were sufficient to see that during the launch there was a clear arc of dayside aurora overhead, extending from magnetic east to magnetic west. A video (Sony_launch.mp4) of these images can be found in the Supplement.
3.3 RENU2 photometers
RENU2 was equipped with a three-channel photometer measuring the red 630.0 nm OI emission, the green 557.7 nm OI emission and the 391.4 nm 1N (0,0) emission. Details of the instrumentation can be found in Lessard et al. (2020). In this work, the focus will be on the nitrogen channel. Observations and analysis from the other two channels are available in the paper by Hecht et al. (2019).
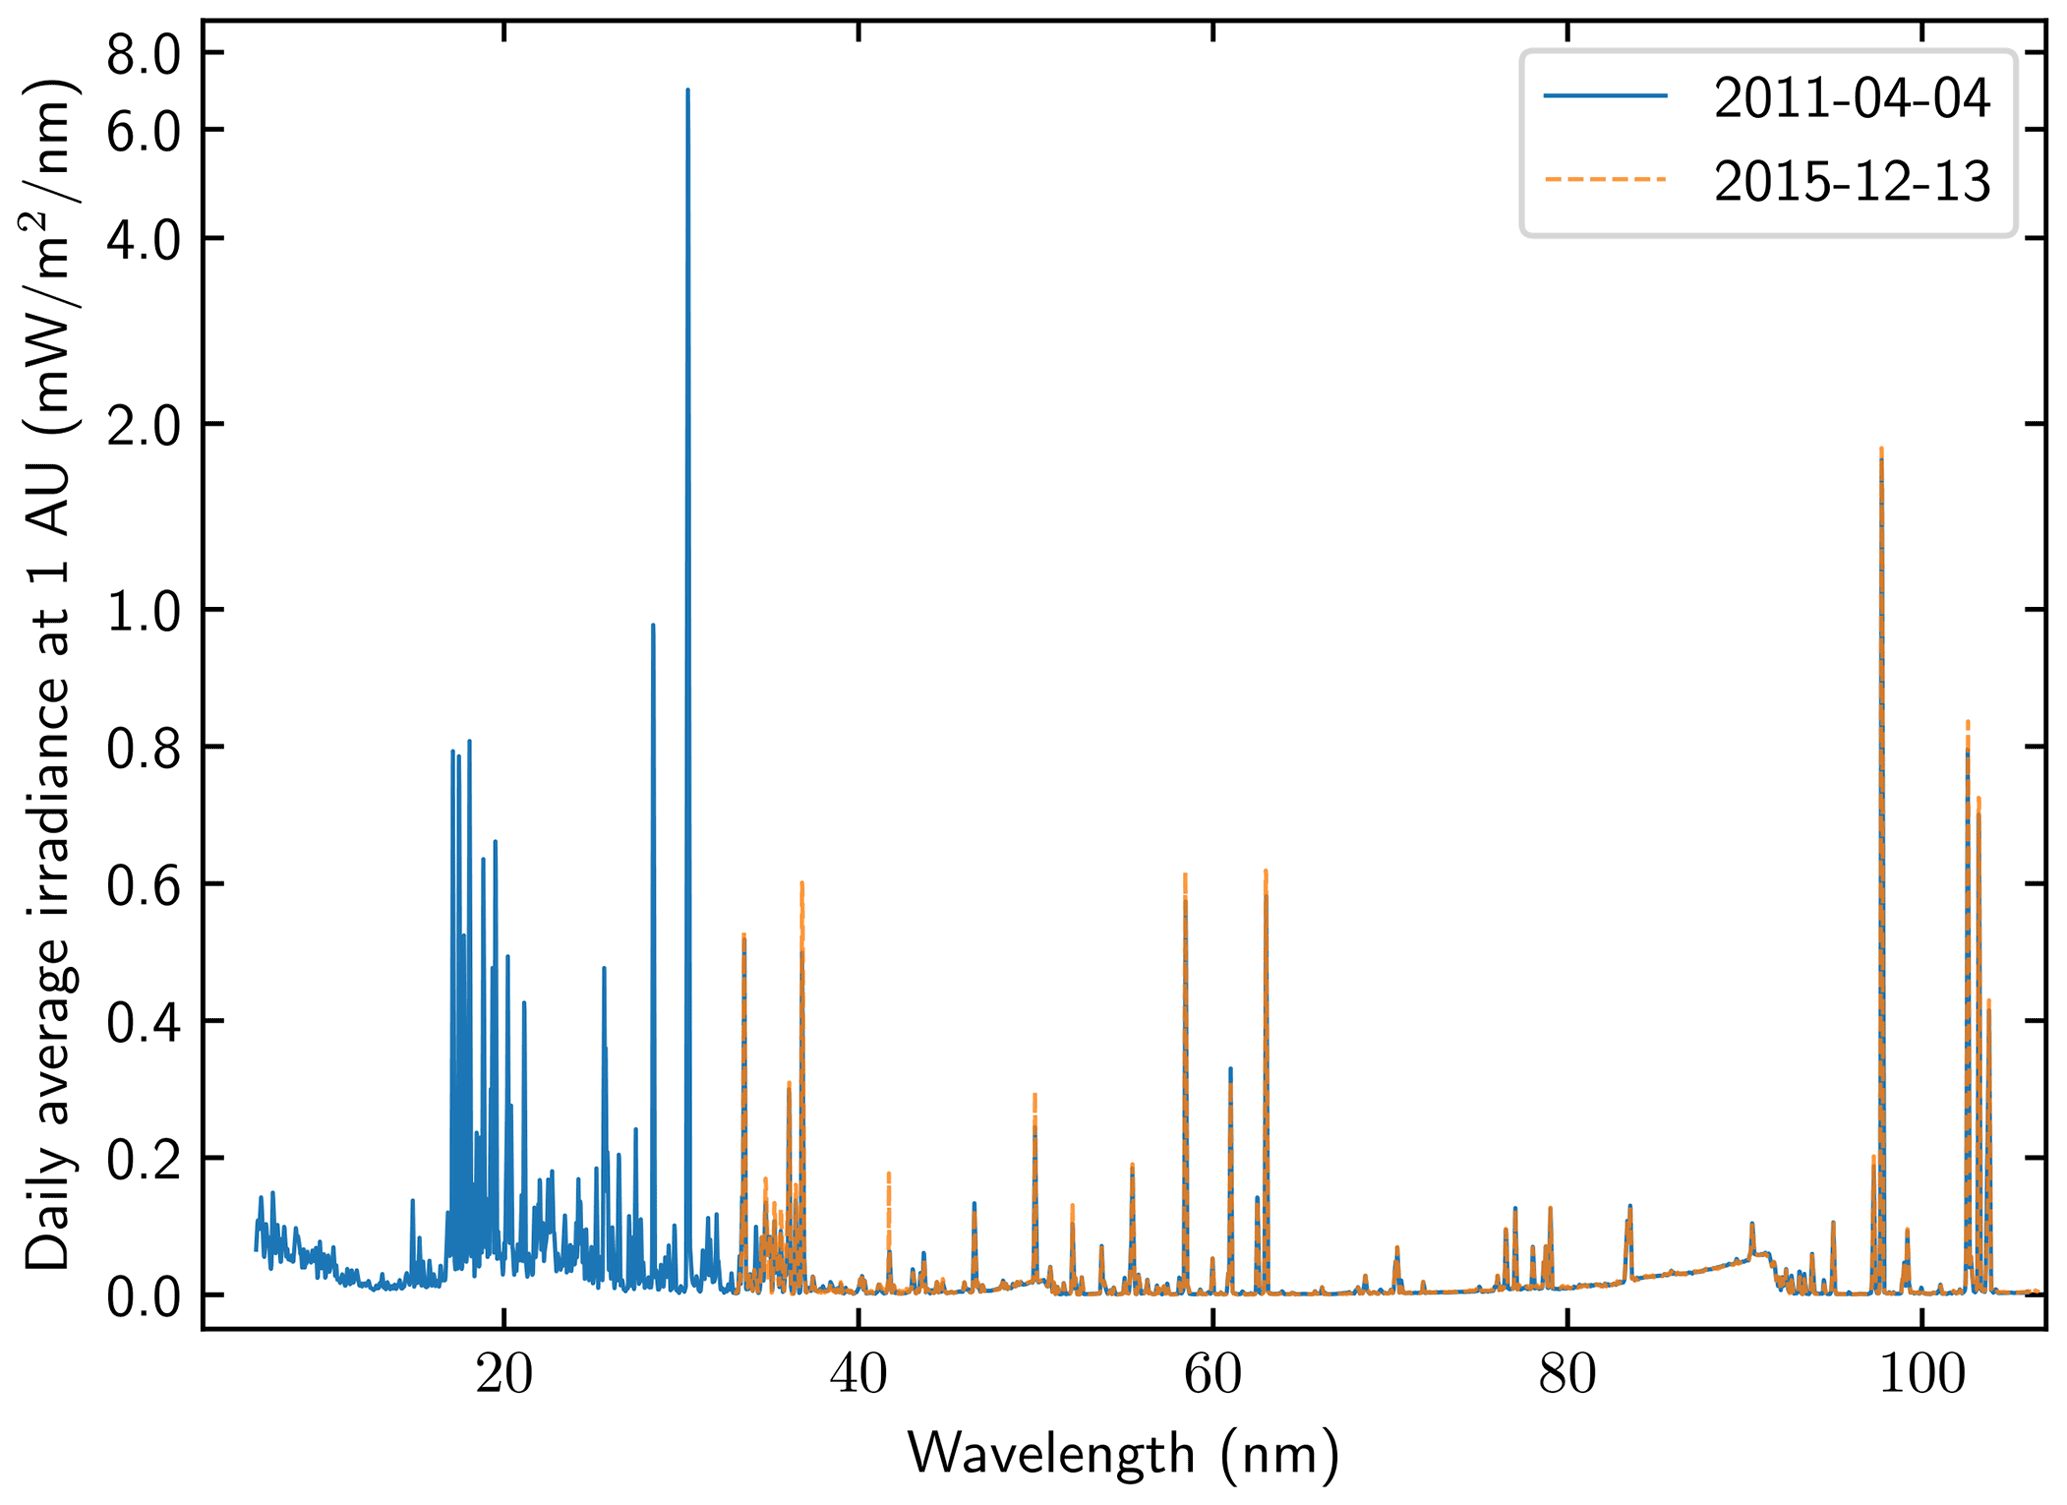
Figure 3 Measurements of daily average irradiance at 1 AU from the EVE instrument from the day of the launch 13 December 2015 (orange) and the closest match to the launch day from when the MEGS-A detector worked (blue). Notice that the irradiance scale is linear below 1 and logarithmic above.
3.4 RENU2 electron plasma sensor and EVE Solar Dynamics Observatory
In this work, we utilise two instruments: the electron plasma sensor (EPLAS) detector on board the RENU2 rocket and the Extreme Ultraviolet Variability Experiment (EVE) on board the Solar Dynamics Observatory (SDO) satellite (Pesnell et al., 2012). EVE contains two spectrographs: MEGS-A (6–33 nm) and MEGS-B (33–105 nm). Unfortunately MEGS-A broke on the 26 May 2014, leaving only MEGS-B working. In Fig. 3 the average irradiance on the day of the rocket (dashed orange), in addition to the closest day when the MEGS-A was running (blue line), can be seen. The closest match was calculated by correlating the valid parts of the spectra together. In the figure the spectral lines which are part of the solar EUV spectrum can be seen on top of a dimmer, continuous spectrum.
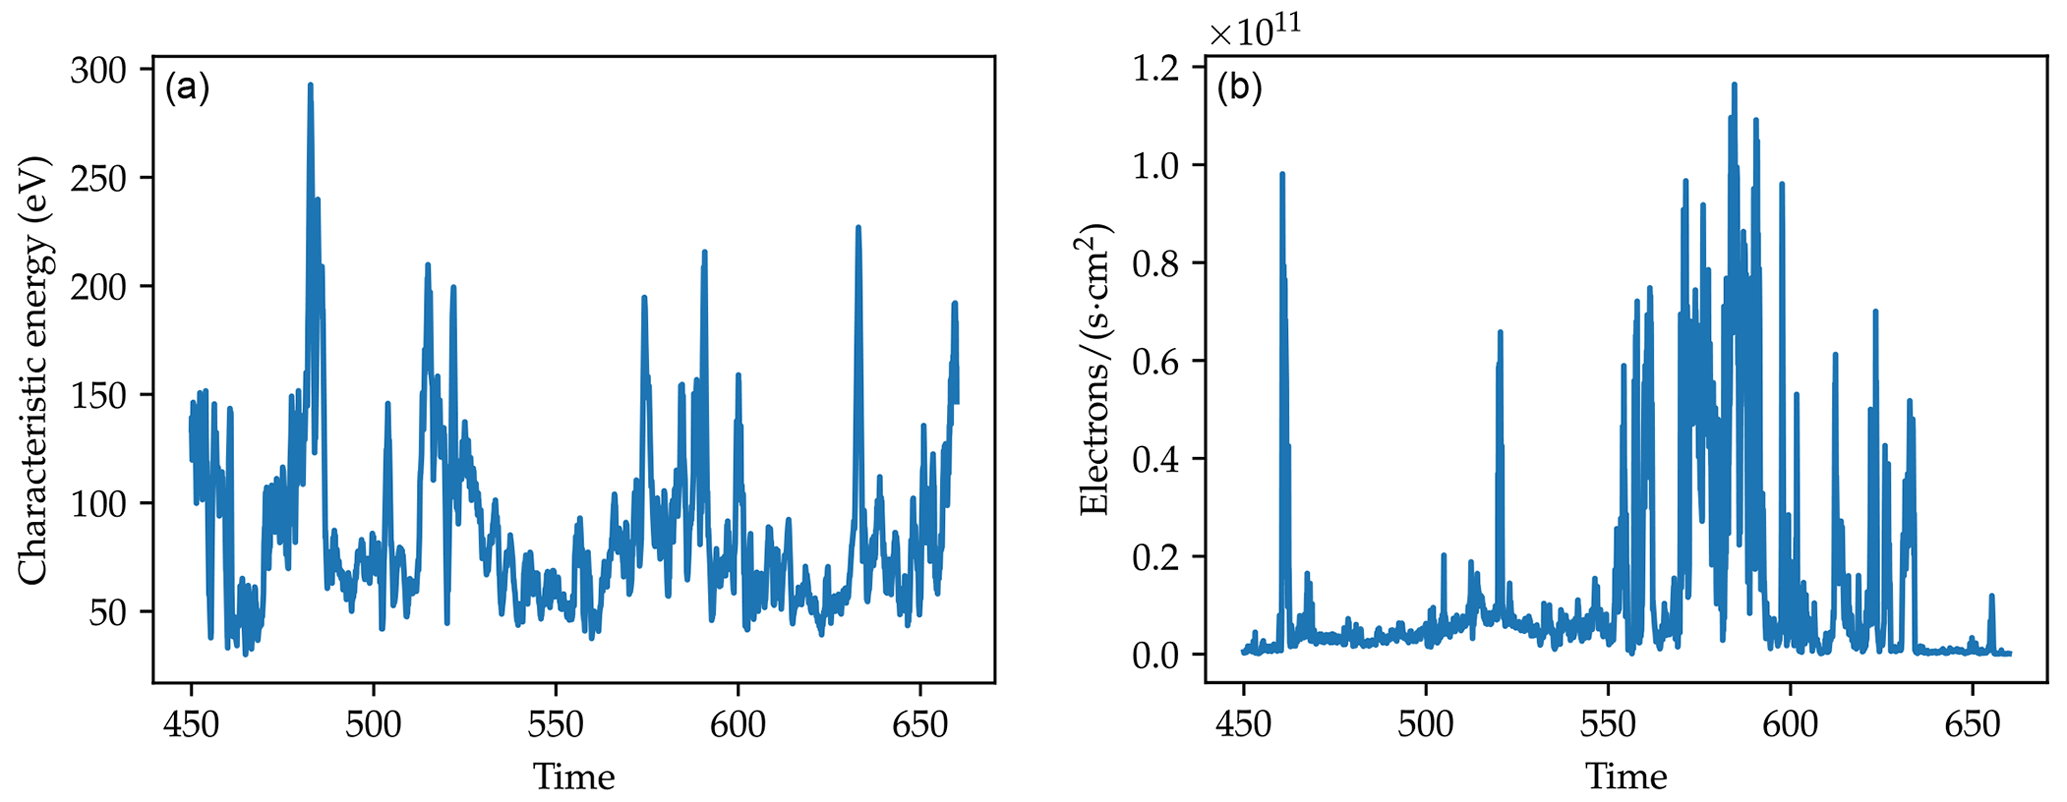
The electron plasma (EPLAS) instrument is a top-hat electrostatic analyser which measures electron energy from 5 eV to 14.6 keV around a 360∘ field of view with 10∘ pitch angle resolution and 42 ms time resolution. The energy steps are logarithmic, and each step has 1 ms dwell time. Further details can be found in Kenward (2020). Figure 4 shows the measurements taken when the rocket passed through the cusp. In the left plot the characteristic energies of the electrons can be seen. The values are above 50 eV for the whole duration, with some short bursts reaching energies above 200 eV. In the right plot the electron flux is shown. It shows a significant increase in flux at 550 s (07:44:10 UTC), which subsides again at 630 s (07:45:30 UTC). The increase is not constant within this time period but comes in both shorter and longer bursts.
4.1 Auroral measurements in sunlit aurora
We will now investigate if the ground-based 427.8 nm emissions observed during the sounding rocket launch can be classified as sunlit aurora and if the ionisation is driven by solar EUV or precipitating electrons. In order to find the contribution of the different processes, we first start by looking at the ionisation rates. Calculating these rates requires knowledge of the amount of EUV flux at a given height and the particle flux of precipitating electrons. RENU2 reached the Svalbard latitudes at around 07:41 UTC (420 s) on the 13 December 2015. At that time the solar depression angle was 15∘, and the ionosphere was sunlit above ≈223 km altitude (as per definition in Sect. 2.2). The sounding rocket was, at that time, close to its apogee altitude of ≈450 km and thus well within the sunlit part of the ionosphere.
4.1.1 EUV photon flux
The EUV flux incident on atmosphere can be obtained from the Extreme Ultraviolet Variability Experiment (EVE) (Woods et al., 2012; Hock et al., 2012; Didkovsky et al., 2012) on the Solar Dynamic Observatory (SDO) satellite (Pesnell et al., 2012). Using the EVE Level 3 daily average irradiance data (downloaded in 2017), it is possible to calculate the total irradiance in the wavelength range 33–79.6 nm at 1 AU. On the 13 December 2015, (see Fig. 3) it is found to be 0.83 mW m−2. After 2014, only the MEGS-B instrument on the SDO EVE platform – which detects wavelengths above 33 nm – was working. Prior to its failure in 2014, the MEGS-A measured between 6–33 nm. As there are some strong spectral lines below 33 nm, a calculation of the irradiance needs to include the region down to 6.0 nm. In order to extrapolate the incoming EUV irradiance to the original measurement region, the complete merged EVE Level 3 data from the EVE instrument over the total spectrum from 6.0 to 79.8 nm were averaged over the complete time series for the instrument (2010–2017). Thus, by comparing the regions below and above 33 nm with the total average, it was found that the total irradiance for the full wavelength range of 6.0–79.8 nm is approximately equal to 4 times the irradiance above 33 nm, with a standard deviation of 1. To check this factor, the spectrum closest to the one on the 13 December 2015 was found by correlating the valid parts (33–79.6 nm) of the spectrum with the daily averages from before the MEGS-A broke. The highest correlation was found with 4 April 2011, shown in Fig. 3, with a correlation coefficient of 0.9937. This spectrum had a factor of 4.03. Taking both approaches into account, a factor of 4 for the time of the RENU2 launch will be used, yielding a total EUV irradiance of 3.3 mW m−2 at a distance of 1 AU.
By using the calculated EUV irradiance, the photon flux can be found using:
where I is the irradiance, Eγ the photon energy, λ the wavelength, h the Planck constant and c the speed of light. To get an estimate, we can set λ=50 nm based on the invariability of the photoionisation cross section from approximately 30 to 70 nm (Itikawa et al., 1986) and use the calculated irradiance I=3.3 mW m−2 to get .
4.1.2 Electron flux
The particle flux of precipitating electrons can be obtained using the electron plasma sensor (EPLAS) on the RENU2 payload. For more details see Lessard et al. (2020) and Kenward (2020). EPLAS measured electron energy, flux and pitch angles for electrons with energies between 10 eV and 15 keV. From the measurements shown in Fig. 4, the average electron flux was found to be in the time period between 07:41:30 UTC (450 s) and 07:44:50 UTC (650 s) when the rocket was in the cusp. The characteristic energies for these electrons were from 50 eV to over 100 eV (with peaks of up to 300 eV).
4.1.3 Ionisation rates
The last parameters needed to calculate the ionisation rates are the cross sections for ionisation of N2. From literature it is found that the photoionisation cross section for N2 is cm2 (Itikawa et al., 1986). The electron impact ionisation cross sections on N2 in the range around 100 eV is cm2 (Bug et al., 2013; Tabata et al., 2006). Using these together with the photon and electron fluxes found in the previous subsections, the photoionisation rate is found to be
while the electron ionisation rate is found to be
These numbers indicate that the EUV can contribute up to 40 % of the total production of at the time of measurement, assuming steady-state conditions where there is enough N2 available for ionisation. The two rates being comparable (within the limits of the estimate given above) means that in solar EUV conditions one should be careful in classifying EUV as the only production mechanism for , as an increase in the precipitating electrons can drive the production of as well. Some of the produced is already in an excited state, as the cross section for photoionisation into the state is cm2 for photons with wavelengths in the 50 nm region (Itikawa et al., 1986). The corresponding cross section for electrons at 100 eV is cm2 (Itikawa et al., 1986). These estimated rates are only a small part of the complicated photochemistry of (Abdou et al., 1984).
When observing from the ground, one observes the ions via the 427.8 nm emission, excited by electrons. One would then also be measuring light from, for instance, resonant scattering of sunlight. Remick et al. (2001) estimated the enhancement from resonant scattering at ≈50 % compared to non-sunlit conditions, but these estimates could include water absorption, Rayleigh scattering and other uncertainties. Similarly Jokiaho et al. (2009) used remote sensing data in combination with a steady-state model and found that a more comprehensive model is needed for a complete understanding. This together with the difference in the scanning direction of the MSP and the rocket path of the RENU2 rocket (see Fig. 1) means that no direct comparison between the estimate and the observed 427.8 nm will be done.
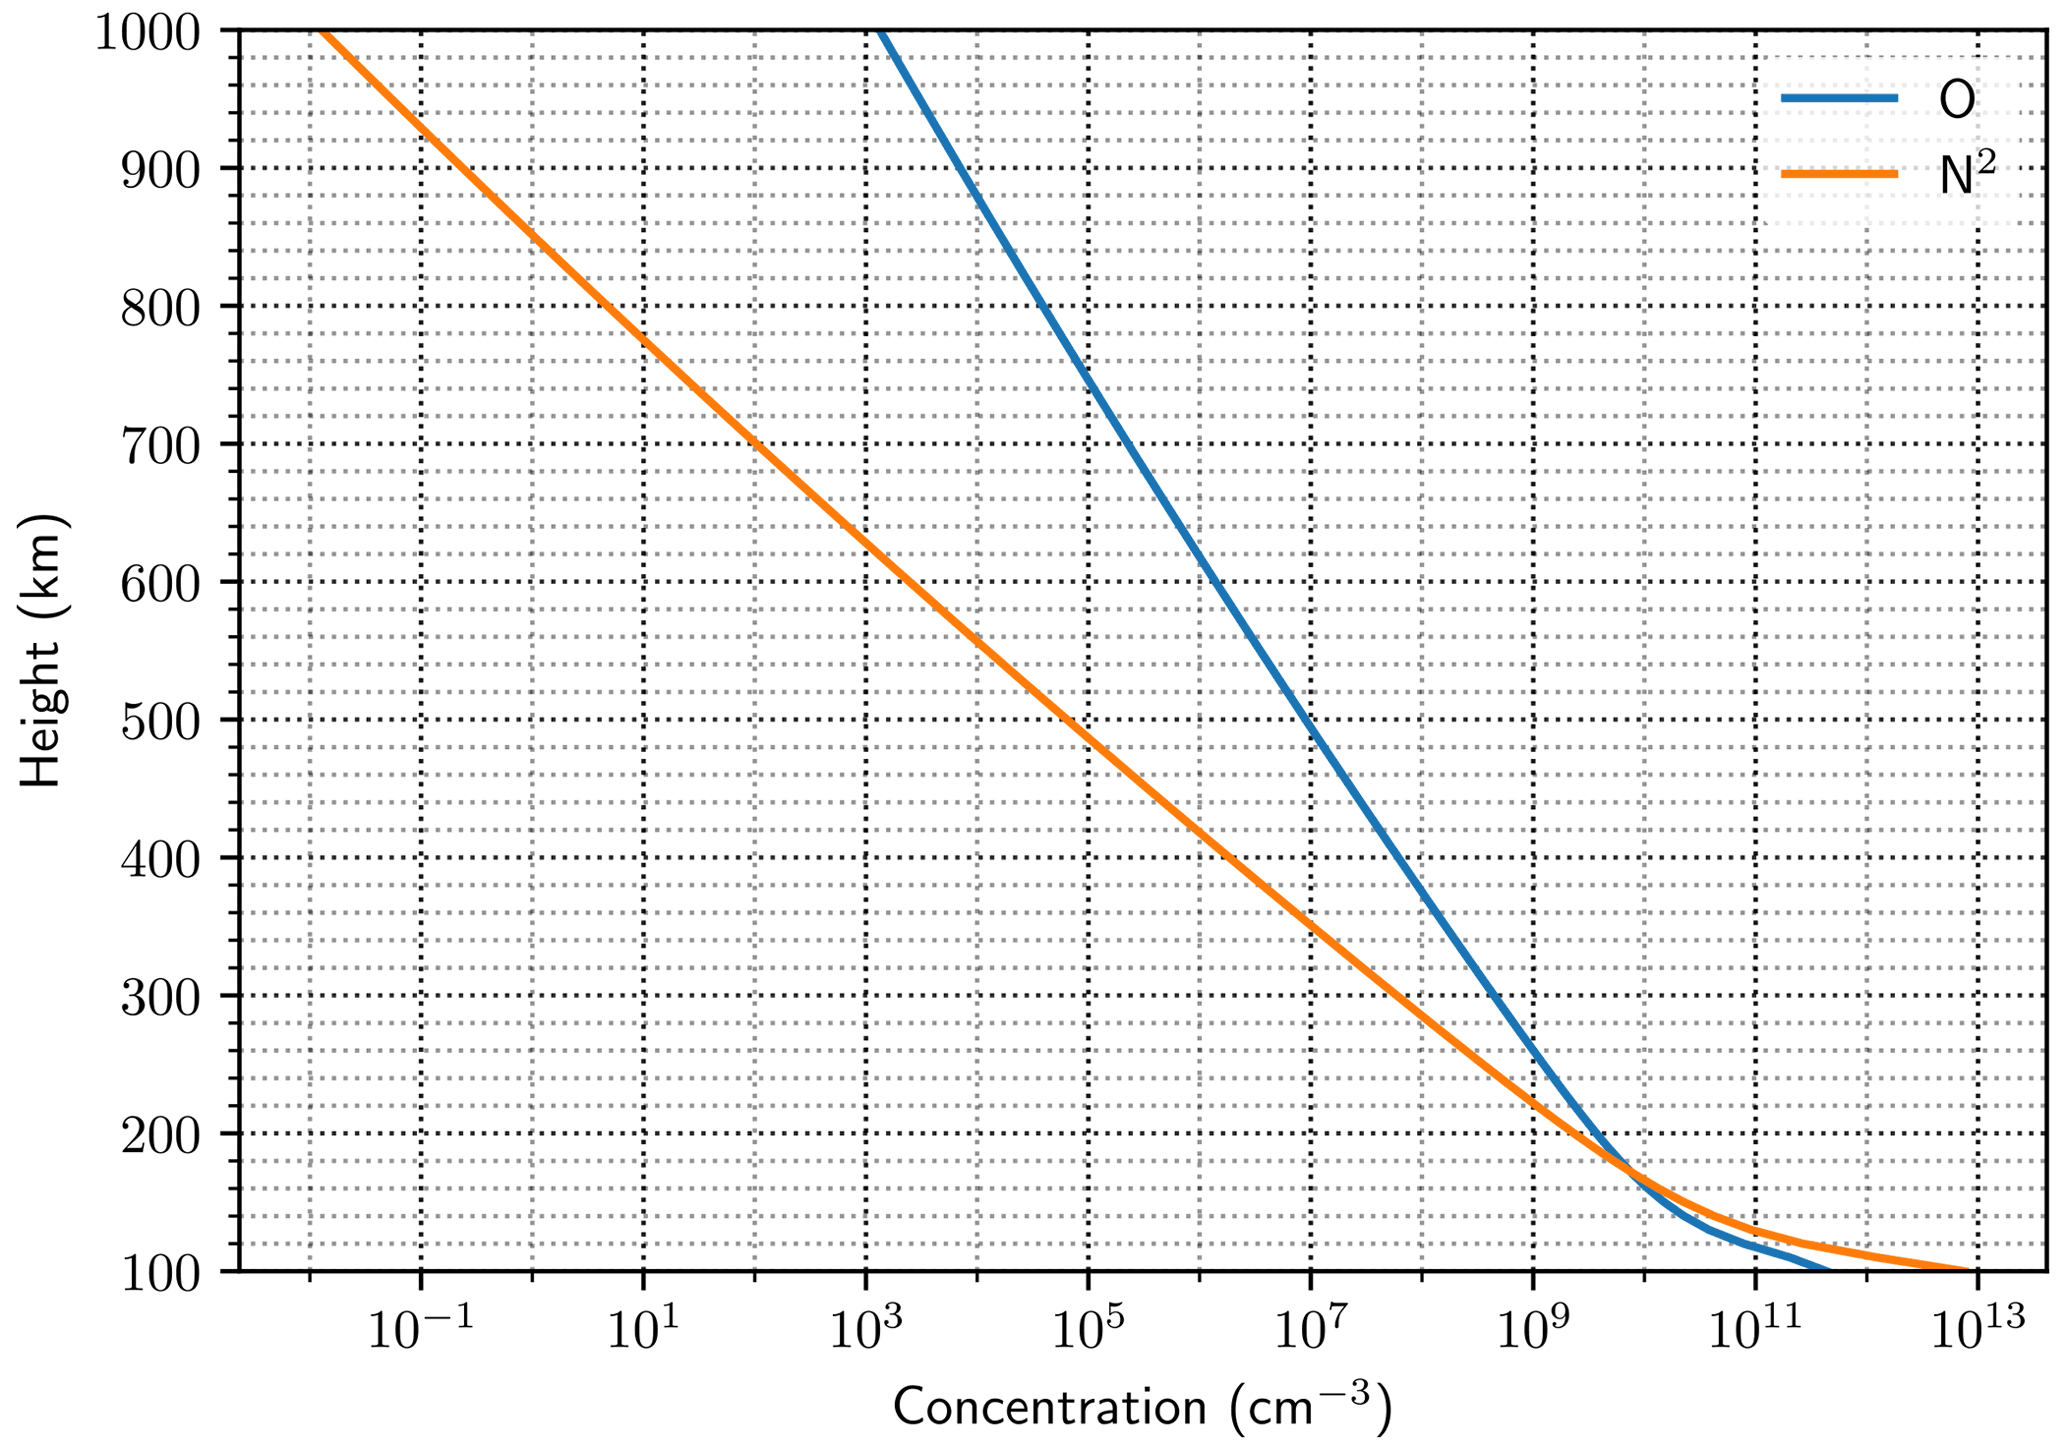
Figure 5 An NRLMSISE model of the nitrogen and atomic oxygen contents above KHO in Longyearbyen for the time of the launch (UTC 7.5). From the CCMC ModelWeb, https://ccmc.gsfc.nasa.gov/modelweb/models/nrlmsise00.php (last access: 31 October 2017), M. Picone, A. E. Hedin and D. Drob, Naval Research Laboratory (Picone et al., 2002).
4.1.4 Availability of N2
In the previous section we estimated the ionisation rates of N2 through two different processes. These rates require there to be enough N2 available at the point of ionisation. Determining the amount of available N2 at a given altitude is challenging, especially in the cusp. A baseline can be found using the NRLMSISE-00 atmospheric model for the location and time of interest. If we input the location above KHO and time of the launch, the model returns the profiles shown in Fig. 5. These model results show that the concentration of molecular nitrogen above 400 km is at least 2 orders of magnitudes smaller than that of atomic oxygen. As mentioned the model is not correct in the cusp, as there is an increase in the density of neutrals at these higher altitudes, due to heating and ion upflow (Carlson et al., 2012; Sadler et al., 2012; Lessard et al., 2020). Such an increase provides a significant amount of available neutral nitrogen for ionisation. Under these conditions the model predictions can be viewed as a lower bound for the conditions.
4.1.5 Auroral observations from the RENU2 photometers
Hecht et al. (2019) report observations from the red-line and green-line photometers on board the RENU2 rocket. These data are accompanied by a model which includes dayglow and auroral precipitation, the latter based on the onboard electron spectrometer data. Also on board RENU2 was a third photometer that measured emission from the (0,0) band of the 1NG system at 391.4 nm (blue emission) that arises from direct electron precipitation and resonance scattering from sunlit ions that are produced by the precipitation (Romick et al., 1999). In the absence of precipitation, dayglow emission is observed from resonance scattering from ambient ions produced by solar photons or photoelectrons, but this is a minor portion of the observed emission. The field of view of the photometers was 3.2∘, and the instrument was pointed in the zenith, although the rocket spun and some glint was observed as described in Hecht et al. (2019). The photometer bandpass was narrow enough, at about 3 nm full-width at half maximum, to isolate the (0,0) band.
To model the data, two long-established models were used to predict the emissions that could be observed during the flight. AURIC (Strickland et al., 1999) modelled the dayglow emissions, and B3C (Strickland et al., 1993) modelled the auroral emissions. The input to the B3C model, as noted in Hecht et al. (2019), included an onboard electron spectrometer that identified auroral precipitation events. The resonant scattering of sunlight off background ions was predicted by the models to dominate the emission for most of the flight prior to about 450 s. After that time until about 630 s the modelling predicts that the observed 391.4 nm emission would be enhanced due to the effects of auroral precipitation. This enhancement is almost entirely due to the resonance scattering of sunlight off that is produced during the auroral precipitation. It should be noted that the model predicts that the resonant scattering component vastly exceeds the direct auroral emission component.
Figure 6 shows the RENU2 observations of the 391.4 nm emissions. Also plotted are the model results, for this emission, in the same format as in Hecht et al. (2019). The data do reflect, as predicted by the model, some enhancement in signal as the rocket passed through the region of auroral precipitation. But, as noted in Hecht et al. (2019), the short-lived nature of some of the intense precipitation could affect some of the observations of the auroral emissions. For example, the OI (630 nm) emission intensity was observed to be well below the model predictions. But emissions with short lifetimes (well below a second) are not affected, and in fact some clear auroral signals are seen in the 391.4 nm observations. For example, between about 550 and 600 s (07:43:10–07:44:00 UTC) there are clear increases that correspond to the model predictions of increases in the 391.4 nm emission due to resonance scattering of ions.
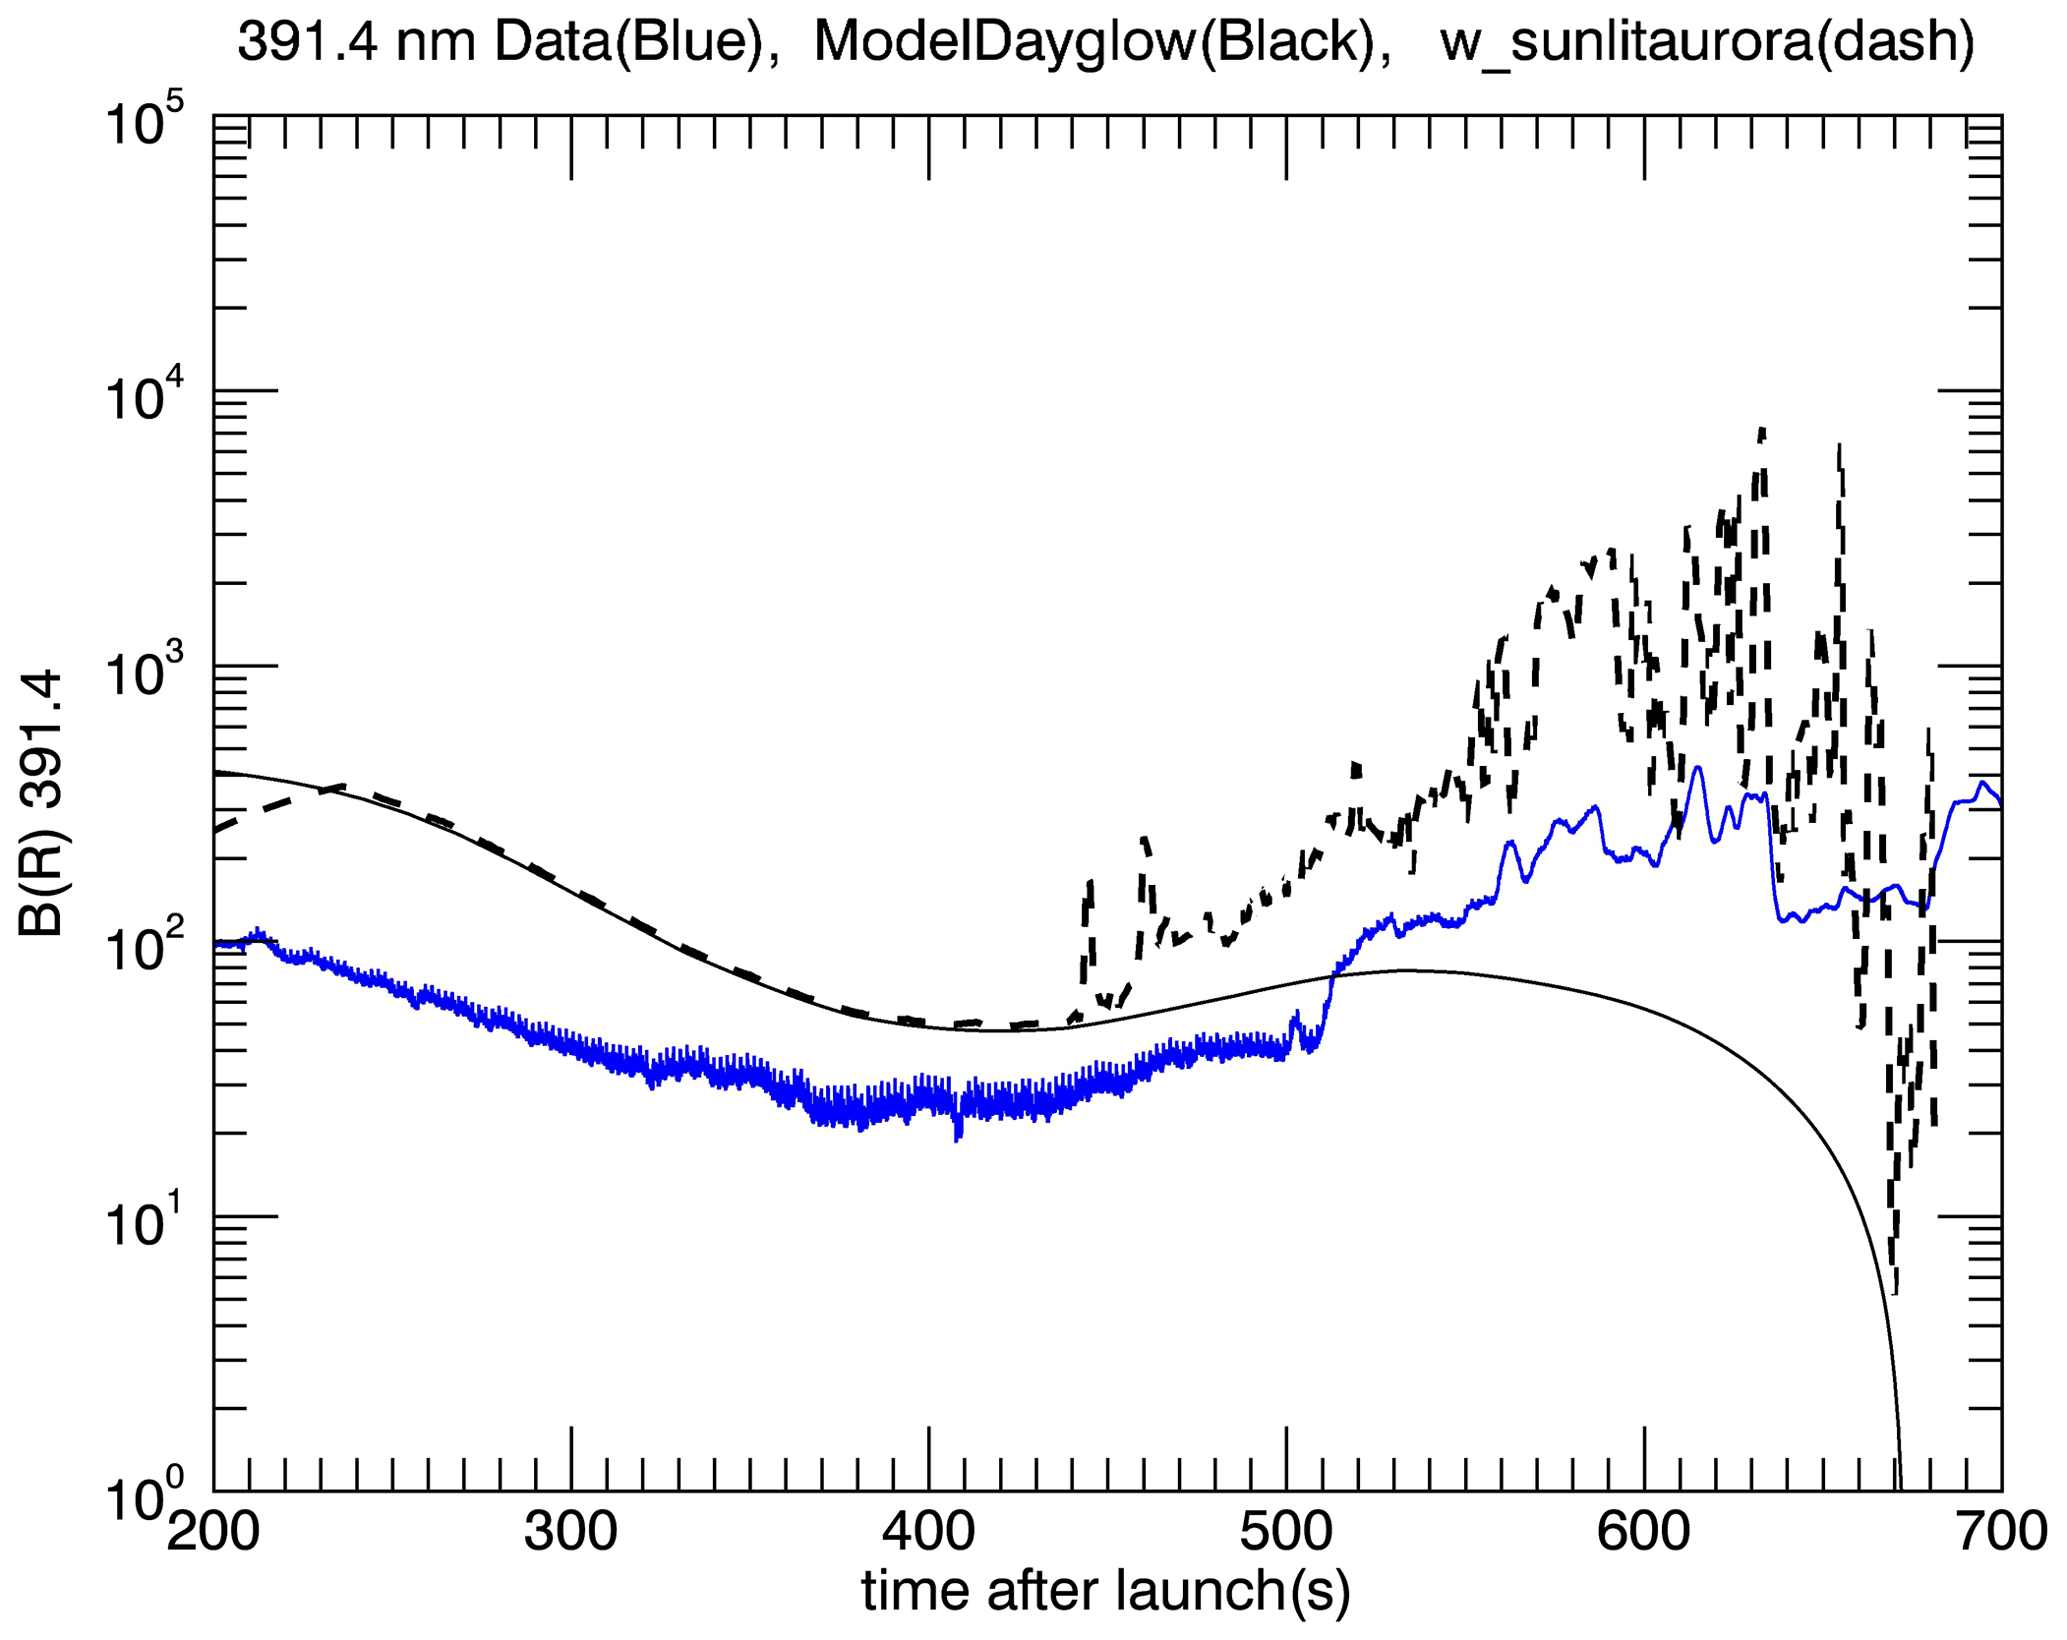
Figure 6 A plot of the brightness in rayleigh of the emission from the (0,0) band of the 1NG system at 391.4 nm from the RENU2 blue photometer (blue line) vs. time after launch. Also shown are the Strickland model predictions (see text) for the 1NG system at 391.4 nm dayglow (solid line) and for the 1NG system at 391.4 nm dayglow plus the 1NG system at 391.4 nm emission due to the auroral precipitation (dashed line). A time after launch of 200 s corresponds to 07:37:30 UTC while 700 s corresponds to 07:45:40 UTC.
However, the most noticeable aspect of the data is the sudden increase in signal just after 500 s (07:42:20 UTC) that continues, as a plateau, until a decrease just around 630 to 640 s (07:44:30–40 UTC). This is not reflected in the model nor as shown in Hecht et al. (2019) in the green-line and red-line data. Since the model does include sunlit , this plateau is almost surely due to an excess of these ions above the rocket that begins after about 500 s when the rocket is descending below 400 km. This excess should be an indicator of some ion upflow, above the rocket, associated with the auroral precipitation region, such as has been discussed in other studies (Romick et al., 1999; Yau et al., 1993). The decrease at 630–640 s is probably due to a boundary associated with the end of the precipitation.
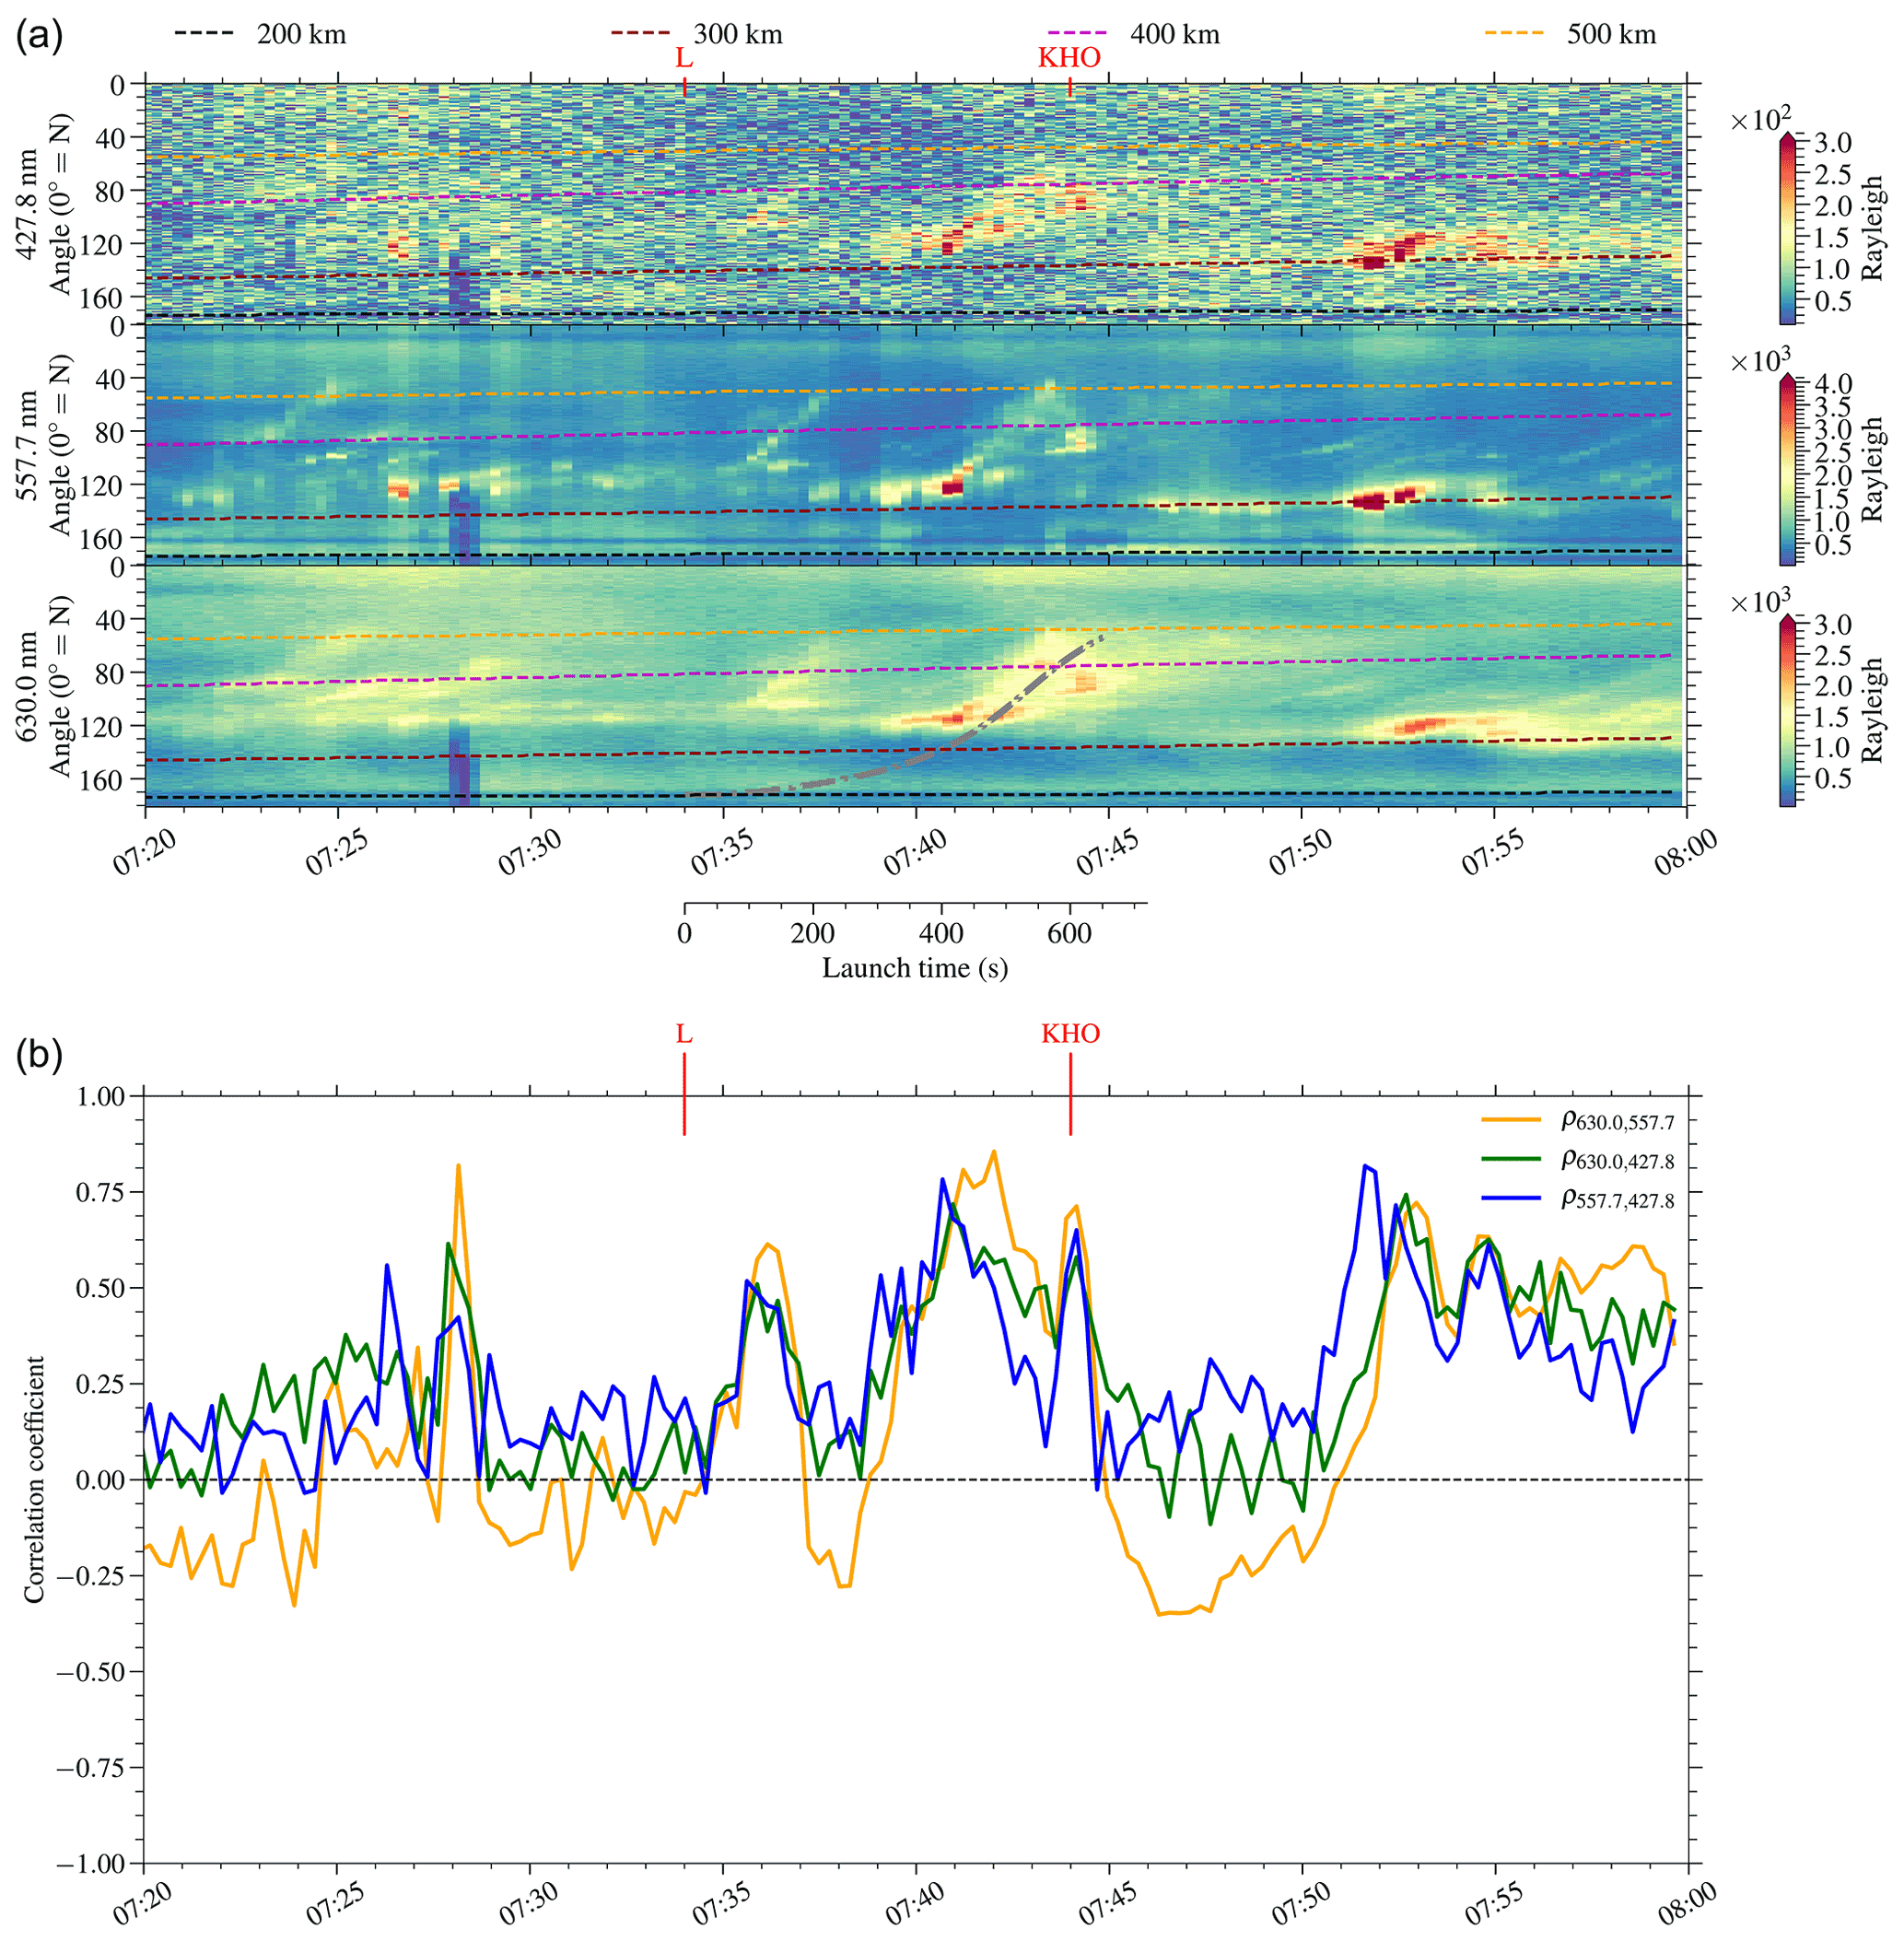
Figure 7 Panel (a) shows the MSP data just before and after the 07:34 UTC launch. The vertical blue stripe is due to clearing of snow from the slit. L and KHO mark the launch and passing east of KHO, respectively. Dashed lines represent the sunlit part of the atmosphere, with everything south of the line being sunlit at and above that altitude. Sunlit means that the light from the Sun has not passed below 150 km in order to get to the point of interaction. In the 630.0 nm subpanel the dashed and dotted grey line represents the rocket track mapped to the MSP field of view at a height of 240 km. Panel (b) shows the correlation coefficients for the time around the launch at 07:34 UTC based on the data in the top panel.
4.2 Correlation analysis
In order to investigate if the 427.8 nm emission corresponds to sunlit aurora, it is necessary to look at the emission altitude. For oxygen emissions, the altitudes are related to the energy of the precipitating electrons, resulting in expected altitudes of 100–120 km for 557.7 nm and 220–300 km for 630.0 nm (Omholt, 1971). The 427.8 nm emission is dependent on the availability of ionised nitrogen. From the model results in Fig. 5, one can infer that the nitrogen emissions would originate at lower altitudes. These would correspond to the altitude of the 557.7 nm emission or lower. This contrasts to sunlit aurora, where the expected emission altitude depends on which part is sunlit above 150 km. This corresponds to the altitude of the 630.0 nm emission. As all of these emissions originate from particle precipitation, one can correlate the emissions from these three lines, in an attempt to determine if the 427.8 nm emission is more correlated with the 557.7 or the 630.0 nm emissions.
The correlation will be performed using the MSP data, by calculating the Pearson's correlation coefficient (Edwards and Penney, 1982) between the different wavelengths recorded in one scan. The coefficient is given by
where cov is the covariance, σ the standard deviation and C(λ,t) the meridian scan for a given wavelength, λ, and time, t. The value of the correlation coefficient is limited between −1 and 1 inclusive, where 1 indicates that the C(λ1,t) and C(λ2,t) are identically shaped and proportional to each other, and −1 indicates that they are 180∘ out of phase. A value of 0 indicates that their relationship is completely random or 90∘ out of phase. The resulting correlation is independent of amplitude (normalised), ensured by the standard deviation divisors in the equation. It is also symmetric, meaning that .
Figure 7 shows the calculated correlation coefficients. In order to understand the coefficients, we first have to take into consideration the dynamics and geometry of the MSP measurements. The different measured auroral emissions have substantially different emission lifetimes, with the shortest being the prompt emission of the 427.8 nm, which has a lifetime of s (Itikawa et al., 1986). The other two are significantly slower at ≈0.7 s for the 557.7 nm emission and 110 s for the 630.0 nm emission. It is worth noting that ionospheric density changes and quenching could shorten these lifetimes somewhat. Since the scan time for the MSP is 16 s, both the emissions at 427.8 and 557.7 nm will persist in only one scan. In the case of the 630.0 nm emission, it will be visible over several scans, blending together recent emissions with previous emission, as seen in Fig. 7. In relation to the correlation, this means that in most cases the correlation between the 630.0 nm emission and the other two will be largest at the start of the auroral activity.
With respect to the calculation, there are some geometrical considerations to take into account. As the MSP scans from magnetic north to magnetic south, a given angle off magnetic zenith will intersect different field lines depending on the altitude one is looking at. This means that if an emission occurs on a given field line, the 630.0 nm emission from that field line will end up in a different angular bin compared to the 557.7 nm emission, due to the difference in emission altitude. This effect is smallest close to zenith and becomes larger as one moves away from zenith. Due to this change in angle, one would expect a reduction in the correlation coefficient between these two emission, as the shape of the angular scan for the two emissions is different.
Taking all of these considerations into account, it is now possible to start analysing the correlation coefficients in Fig. 7. Firstly, it can be noted that the correlation between the red (630.0 nm) and the green (557.7 nm) emissions corresponds to periods of strong auroral activity, showing correlation values larger than 0. At certain points in time, the red–green correlation closely follows the green–blue (427.8 nm) and the red–blue, i.e. at 07:27, 07:36 UTC (120 s) and 07:44 UTC (600 s). One type of event that can generate this similarity is a period of high-energy precipitation around magnetic zenith, which causes emissions from the three lines within the same scan. These events are well known.
Looking at the correlation at 07:38 UTC (240 s) and 07:50 UTC (960 s), we have a situation where the red–blue correlation is smaller than the green–blue. Taking into account the previously discussed mechanisms, the blue emissions occur at similar altitudes to the green emissions. By following the correlation coefficients, it is possible to see that after two to three minutes the difference in the correlation coefficient switches, with red–blue correlating more than green–blue. From the MSP data in Fig. 7, we can see that if the emissions are from altitudes in the range 300–400 km, we can expect them to be sunlit. The sunlit altitude is displayed in the figure, calculated according to the method described in Sect. 2.2. This observation of the time delay is consistent with the “cooking time” responsible for the observed ion upflow in the ionosphere (Lund et al., 2012). The ion upflow drags with it neutral molecules from lower altitudes, and it would subsequently increase both the availability of N2 and for the generation of sunlit aurora. An increase in available nitrogen was further confirmed by the observation of in situ 427.8 nm emission on board the RENU2 rocket. Together with the rate calculations in the previous section, we argue that a significant part of the observed 427.8 nm emissions can be attributed to sunlit aurora, which is further backed up by the observations made from the photometer on board RENU2.
We have presented an optical study of the sunlit aurora present in the time around the RENU2 launch, 13 December 2015. Calculations of the possible EUV height show that the upper parts of the ionosphere above the Kjell Henriksen Observatory were sunlit at the time. An analysis using the correlation coefficient between three different wavelengths (427.8, 557.7 and 630.0 nm) measured along the magnetic meridian at a given point in time was used to demonstrate the detection of sunlit aurora from ground-based instrumentation. By utilising this correlation, we show that the 427.8 nm emission occurs at the same heights as the 630.0 nm emissions. Using data from the RENU2 rocket and the estimated solar photon flux, it was found that sunlit aurora was a major part of the observed 391.4 and 427.8 nm emissions. The EUV photon flux and the electron flux were estimated to be and respectively. Using these fluxes, the ionisation rate of by photons was found to be and by electrons . We have also shown that the correlation method presented here can be used to understand the altitude of the 427.8 nm emission as well as some of the processes occurring.
We acknowledge the Space Physics Data Facility (SPDF) and SPDF contact Natalia Papitashvili (natalia.e.papitashvili@nasa.gov) for the use of OMNI data which was downloaded from https://lasp.colorado.edu/eve/data_access/index.html (The Laboratory for Atmospheric and Space Physics, 2017). Data from the RENU2 sounding rocket mission are publicly available at NASA's Space Physics Data Facility (SPDF, https://spdf.gsfc.nasa.gov, Lessard et al., 2021). The data from the photometer plot can be found at http://mirl.sr.unh.edu/projects_renu2/FlightData/Hecht/ (Hecht, 2021).
The supplement related to this article is available online at: https://doi.org/10.5194/angeo-39-849-2021-supplement.
The article was primarily written by PGE with input from the other co-authors. ML was additionally the RENU2 principal investigator.
The authors declare that they have no conflict of interest.
Publisher's note: Copernicus Publications remains neutral with regard to jurisdictional claims in published maps and institutional affiliations.
This article is part of “Special Issue on the joint 19th International EISCAT Symposium and 46th Annual European Meeting on Atmospheric Studies by Optical Methods”. It is a result of the 19th International EISCAT Symposium 2019 and 46th Annual European Meeting on Atmospheric Studies by Optical Methods, Oulu, Finland, 19–23 August 2019.
This research has been supported by the Research Council of Norway/CoE (grant nos. 223252/F50 and 195385) and the National Aeronautics and Space Administration (grant nos. NNX13AJ94G and NNX13AJ93G).
This paper was edited by Daniel Whiter and reviewed by two anonymous referees.
Abdou, W. A., Torr, D. G., Richards, P. G., Torr, M. R., and Breig, E. L.: Results of a comprehensive study of the photochemistry of in the ionosphere, J. Geophys. Res., 89, 9069, https://doi.org/10.1029/JA089iA10p09069, 1984. a
Brasseur, G.: Aeronomy of the middle atmosphere: chemistry and physics of the Stratosphere and Mesosphere, Atmospheric sciences library, Reidel, Dordrecht, 2nd rev. edn., 1986. a
Bug, M. U., Gargioni, E., Nettelbeck, H., Baek, W. Y., Hilgers, G., Rosenfeld, A. B., and Rabus, H.: Ionization cross section data of nitrogen, methane, and propane for light ions and electrons and their suitability for use in track structure simulations, Phys. Rev. E, 88, 043308, https://doi.org/10.1103/PhysRevE.88.043308, 2013. a
Carlson, H. C., Spain, T., Aruliah, A., Skjaeveland, A., and Moen, J.: First-principles physics of cusp/polar cap thermospheric disturbances, Geophys. Res. Lett., 39, 1–5, https://doi.org/10.1029/2012GL053034, 2012. a, b, c
Chakrabarti, S.: Ground based spectroscopic studies of sunlit airglow and aurora, J. Atmos. Sol.-Terr. Phys., 60, 1403–1423, https://doi.org/10.1016/S1364-6826(98)00060-1, 1998. a
Chisham, G., Lester, M., Milan, S. E., Freeman, M. P., Bristow, W. A., Grocott, A., McWilliams, K. A., Ruohoniemi, J. M., Yeoman, T. K., Dyson, P. L., Greenwald, R. A., Kikuchi, T., Pinnock, M., Rash, J. P. S., Sato, N., Sofko, G. J., Villain, J. P., and Walker, A. D. M.: A decade of the Super Dual Auroral Radar Network (SuperDARN): Scientific achievements, new techniques and future directions, Surv. Geophys., 28, 33–109, https://doi.org/10.1007/s10712-007-9017-8, 2007. a
Cohen, I. J., Lessard, M. R., Varney, R. H., Oksavik, K., Zettergren, M., and Lynch, K. A.: Ion upflow dependence on ionospheric density and solar photoionization, J. Geophys. Res., 120, 10039–10052, https://doi.org/10.1002/2015JA021523, 2015. a, b
Deehr, C., Sivjee, G., Egeland, A., Henriksen, K., Sandholt, P., Smith, R., Sweeney, P., Duncan, C., and Gilmer, J.: Ground-based observations of F region aurora associated with the magnetospheric cusp, J. Geophys. Res., 85, 2185, https://doi.org/10.1029/JA085iA05p02185, 1980. a
Deng, Y., Fuller-Rowell, T. J., Ridley, A. J., Knipp, D., and Lopez, R. E.: Theoretical study: Influence of different energy sources on the cusp neutral density enhancement, J. Geophys. Res., 118, 2340–2349, https://doi.org/10.1002/jgra.50197, 2013. a
Didkovsky, L., Judge, D., Wieman, S., Woods, T., and Jones, A.: EUV SpectroPhotometer (ESP) in Extreme Ultraviolet Variability Experiment (EVE): Algorithms and Calibrations, Solar Physics, 275, 179–205, https://doi.org/10.1007/s11207-009-9485-8, 2012. a
Edwards, C. H. and Penney, D. E.: Elementary Linear Algebra, Prentice-Hall, New Jersey, 1982. a
Fasel, G. J.: Dayside poleward moving auroral forms: A statistical study, J. Geophys. Res., 100, 11891, https://doi.org/10.1029/95ja00854, 1995. a
Greenwald, R. A., Baker, K. B., Dudeney, J. R., Pinnock, M., Jones, T. B., Thomas, E. C., Villain, J. P., Cerisier, J. C., Senior, C., Hanuise, C., Hunsucker, R. D., Sofko, G., Koehler, J., Nielsen, E., Pellinen, R., Walker, A. D., Sato, N., and Yamagishi, H.: DARN/SuperDARN – A global view of the dynamics of high-latitude convection, Space Sci. Rev., 71, 761–796, https://doi.org/10.1007/BF00751350, 1995. a
Hecht, J. H.: RENU2 photometer and model data, [data set], available at: http://mirl.sr.unh.edu/projects_renu2/FlightData/Hecht/, last access: 31 August 2021. a
Hecht, J. H., Clemmons, J. H., Lessard, M. R., Kenward, D. L., Sadler, F. B., Fritz, B. A., Evans, J. S., and Lynch, K. A.: A New Technique for Estimating The Lifetime of Bursts of Electron Precipitation From Sounding Rocket Measurements, Geophys. Res. Lett., 47, e2019GL082894, https://doi.org/10.1029/2019gl082894, 2019. a, b, c, d, e, f, g
Herlingshaw, K., Baddeley, L. J., Oksavik, K., Lorentzen, D. A., and Bland, E. C.: A Study of Automatically Detected Flow Channels in the Polar Cap Ionosphere, J. Geophys. Res., 124, 9430–9447, https://doi.org/10.1029/2019JA026916, 2019. a
Hock, R. A., Chamberlin, P. C., Woods, T. N., Crotser, D., Eparvier, F. G., Woodraska, D. L., and Woods, E. C.: Extreme Ultraviolet Variability Experiment (EVE) Multiple EUV Grating Spectrographs (MEGS): Radiometric Calibrations and Results, Sol. Phys., 275, 145–178, https://doi.org/10.1007/s11207-010-9520-9, 2012. a
Hunten, D. M.: Sunlit aurora and the ion: A personal perspective, Planet. Space Sci., 51, 887–890, https://doi.org/10.1016/S0032-0633(03)00079-5, 2003. a, b, c
Itikawa, Y., Hayashi, M., Ichimura, A., Onda, K., Sakimoto, K., Takayanagi, K., Nakamura, M., Nishimura, H., and Takayanagi, T.: Cross Sections for Collisions of Electrons and Photons with Nitrogen Molecules, J. Phys. Chem. Ref. Data, 15, 985–1010, https://doi.org/10.1063/1.555762, 1986. a, b, c, d, e
Johnsen, M. G., Lorentzen, D. A., Holmes, J. M., and Løvhaug, U. P.: A model based method for obtaining the open/closed field line boundary from the cusp auroral 6300 Å[OI] red line, J. Geophys. Res., 117, A03319, https://doi.org/10.1029/2011JA016980, 2012. a
Jokiaho, O., Lanchester, B. S., and Ivchenko, N.: Resonance scattering by auroral : steady state theory and observations from Svalbard, Ann. Geophys., 27, 3465–3478, https://doi.org/10.5194/angeo-27-3465-2009, 2009. a
Jokiaho, O.-P.: Spectral modelling of molecular nitrogen in aurora, Doctoral thesis, University of Southampton, available at: http://eprints.soton.ac.uk/161195/ (last access: 31 August 2021), 2009. a
Kenward, D. R.: The Impact of Fine Scale Drivers on Upwelling Processes, PhD thesis, University of New Hampshire, Ann Arbor, United States, available at: https://www.proquest.com/dissertations-theses/impact-fine-scale-drivers-on-upwelling-processes/docview/2423440975/se-2?accountid=17260 (last access: 20 September 2021), 130 pp., 2020. a, b, c
The Laboratory for Atmospheric and Space Physics: Solar Dynamics Observatory (SDO) Extreme Ultraviolet Variability Experiment (EVE) level 2 data, version 6, the Laboratory for Atmospheric and Space Physics [data set], Boulder, Colorado, available at: https://lasp.colorado.edu/eve/data_access/index.html, (last access: 31 August 2021), 2017. a
Lessard, M. R., Fritz, B., Sadler, B., Cohen, I., Kenward, D., Godbole, N., Clemmons, J. H., Hecht, J. H., Lynch, K. A., Harrington, M., Roberts, T. M., Hysell, D., Crowely, G., Sigernes, F., Syrjäsuo, M., Ellingsen, P., Partamies, N., Moen, J., Clausen, L., Oksavik, K., Yeoman, T.: Overview of the Rocket Experiment for Neutral Upwelling Sounding Rocket 2 (RENU2), Geophys. Res. Lett., 47, e2018GL081885, https://doi.org/10.1029/2018GL081885, 2020. a, b, c, d
Lessard, M. R., Fritz, B., Sadler, B., Cohen, I., Kenward, D., Godbole, N., Clemmons, J. H., Hecht, J. H., Lynch, K. A., Harrington, M., Roberts, T. M., Hysell, D., Crowley, G., Sigernes, F., Syrjäsuo, M., Ellingsen, P., Partamies, N., Moen, J., Clausen, L., Oksavik, K., and Yeoman, T.: RENU2 sounding rocket data, NASA [data set], available at: https://spdf.gsfc.nasa.gov, last access: 31 August 2021. a
Lorentzen, D. A., Kintner, P. M., Moen, J., Sigernes, F., Oksavik, K., Ogawa, Y., and Holmes, J.: Pulsating dayside aurora in relation to ion upflow events during a northward interplanetary magnetic field (IMF) dominated by a strongly negative IMF By, J. Geophys. Res., 112, 1–12, https://doi.org/10.1029/2006JA011757, 2007. a
Lorentzen, D. A., Moen, J., Oksavik, K., Sigernes, F., Saito, Y., and Johnsen, M. G.: In situ measurement of a newly created polar cap patch, J. Geophys. Res., 115, 1–11, https://doi.org/10.1029/2010JA015710, 2010. a
Lühr, H., Rother, M., Köhler, W., Ritter, P., and Grunwaldt, L.: Thermospheric up-welling in the cusp region: Evidence from CHAMP observations, Geophys. Res. Lett., 31, 6805, https://doi.org/10.1029/2003GL019314, 2004. a, b
Lund, E. J., Lessard, M. R., Sigernes, F., Lorentzen, D. A., Oksavik, K., Kintner, P. M., Lynch, K. A., Huang, D. H., Zhang, B. C., Yang, H. G., and Ogawa, Y.: Electron temperature in the cusp as measured with the SCIFER-2 sounding rocket, J. Geophys. Res., 117, A06326, https://doi.org/10.1029/2011JA017404, 2012. a
Moen, J., Oksavik, K., and Carlson, H. C.: On the relationship between ion upflow events and cusp auroral transients, Geophys. Res. Lett., 31, 1–5, https://doi.org/10.1029/2004GL020129, 2004. a
Omholt, A.: The Optical Aurora, Springer, Berlin Heidelberg, https://doi.org/10.1007/978-3-642-46269-6, 1971. a
Pesnell, W. D., Thompson, B. J., and Chamberlin, P. C.: The Solar Dynamics Observatory (SDO), Sol. Phys., 275, 3–15, https://doi.org/10.1007/s11207-011-9841-3, 2012. a, b
Picone, J. M., Hedin, A. E., Drob, D. P., and Aikin, A. C.: NRLMSISE-00 empirical model of the atmosphere: Statistical comparisons and scientific issues, J. Geophys. Res., 107, 1–16, https://doi.org/10.1029/2002JA009430, 2002. a
Remick, K., Smith, R., and Lummerzheim, D.: The significance of resonant scatter in the measurement of first negative 0–1 emissions during auroral activity, J. Atmos. Sol.-Terr. Phys., 63, 295–308, https://doi.org/10.1016/S1364-6826(00)00233-9, 2001. a
Romick, G. J., Yee, J. H., Morgan, M. F., Morrison, D., Paxton, L. J., and Meng, C. I.: Polar cap optical observations of topside (>900 km) molecular nitrogen ions, Geophys. Res. Lett., 26, 1003–1006, https://doi.org/10.1029/1999GL900091, 1999. a, b
Russell, C. T. and Elphic, R. C.: Initial ISEE magnetometer results: magnetopause observations, Space Sci. Rev., 22, 681–715, https://doi.org/10.1007/BF00212619, 1978. a
Sadler, F. B., Lessard, M., Lund, E., Otto, A., and Lühr, H.: Auroral precipitation/ion upwelling as a driver of neutral density enhancement in the cusp, J. Atmos. Sol.-Terr. Phys., 87–88, 82–90, https://doi.org/10.1016/j.jastp.2012.03.003, 2012. a, b
Sandholt, P. E. and Farrugia, C. J.: Poleward moving auroral forms (PMAFs) revisited: responses of aurorae, plasma convection and Birkeland currents in the pre- and postnoon sectors under positive and negative IMF By conditions, Ann. Geophys., 25, 1629–1652, https://doi.org/10.5194/angeo-25-1629-2007, 2007. a, b, c
Strickland, D., Bishop, J., Evans, J., Majeed, T., Shen, P., Cox, R., Link, R., and Huffman, R.: Atmospheric Ultraviolet Radiance Integrated Code (AURIC): theory, software architecture, inputs, and selected results, J. Quant. Spectrosc. Ra., 62, 689–742, https://doi.org/10.1016/S0022-4073(98)00098-3, 1999. a
Strickland, D. J., Daniell, R. E., Jasperse, J. R., and Basu, B.: Transport-Theoretic Model for the Electron-Proton-Hydrogen Atom Aurora, 2. Model Results, J. Geophys. Res., 98, 21533–21548, https://doi.org/10.1029/93JA01645, 1993. a
Tabata, T., Shirai, T., Sataka, M., and Kubo, H.: Analytic cross sections for electron impact collisions with nitrogen molecules, Atom. Data Nucl. Data, 92, 375–406, https://doi.org/10.1016/j.adt.2006.02.002, 2006. a
Woods, T. N., Eparvier, F. G., Hock, R., Jones, A. R., Woodraska, D., Judge, D., Didkovsky, L., Lean, J., Mariska, J., Warren, H., McMullin, D., Chamberlin, P., Berthiaume, G., Bailey, S., Fuller-Rowell, T., Sojka, J., Tobiska, W. K., and Viereck, R.: Extreme Ultraviolet Variability Experiment (EVE) on the Solar Dynamics Observatory (SDO): Overview of Science Objectives, Instrument Design, Data Products, and Model Developments, Sol. Phys., 275, 115–143, https://doi.org/10.1007/s11207-009-9487-6, 2012. a
Yau, A. W., Whalen, B. A., Goodenough, C., Sagawa, E., and Mukai, T.: EXOS D (Akebono) observations of molecular NO+ and upflowing ions in the high-altitude auroral ionosphere, J. Geophys. Res., 98, 11205, https://doi.org/10.1029/92ja02019, 1993. a