the Creative Commons Attribution 4.0 License.
the Creative Commons Attribution 4.0 License.
 | 22 Jan 2021
Electron precipitation characteristics during isolated, compound, and multi-night substorm events
Noora Partamies
Fasil Tesema
Emma Bland
Erkka Heino
Hilde Nesse Tyssøy
Erlend Kallelid
A set of 24 isolated, 46 compound, and 36 multi-night substorm events from the years 2008–2013 have been analysed in this study. Isolated substorm events are defined as single expansion–recovery phase pairs, compound substorms consist of multiple phase pairs, and multi-night substorm events refer to recurring substorm activity on consecutive nights. Approximately 200 nights of substorm activity observed over Fennoscandian Lapland have been analysed for their magnetic disturbance magnitude and the level of cosmic radio noise absorption. Substorm events were automatically detected from the local electrojet index data and visually categorized.
We show that isolated substorms have limited lifetimes and spatial extents as compared to the other substorm types. The average intensity (both in absorption and ground-magnetic deflection) of compound and multi-night substorm events is similar. For multi-night substorm events, the first night is rarely associated with the strongest absorption. Instead, the high-energy electron population needed to cause the strongest absorption builds up over 1–2 additional nights of substorm activity. The non-linear relationship between the absorption and the magnetic deflection at high- and low-activity conditions is also discussed. We further collect in situ particle spectra for expansion and recovery phases to construct median precipitation fluxes at energies from 30 eV up to about 800 keV. In the expansion phases the bulk of the spectra show a local maximum flux in the range of a few keV to 10 keV, while in the recovery phases higher fluxes are seen in the range of tens of keV to hundreds of keV. These findings are discussed in the light of earlier observations of substorm precipitation and their atmospheric effects.
- Article
(2585 KB) - Full-text XML
- BibTeX
- EndNote


Substorms are key energy transfer and reconfiguration elements in the magnetosphere–ionosphere system. They use the energy delivered by the solar wind to power a variety of processes in the magnetosphere, which deposit some of the energy into the ionosphere. At the substorm onset, a particle injection from the plasma sheet provides a source population to the ring current and outer radiation belt region with energies up to tens of keV (e.g. Ripoll et al., 2020). Some of the injected particles end up directly in the ionospheres. This energetic particle precipitation is observed as an intense burst at the substorm onset. These spike events (e.g. Spanswick et al., 2007) are observed as a sharp rise and slow decay of cosmic radio noise absorption (CNA), which moves together with the expanding particle precipitation region in the ionosphere. In the inner magnetosphere, the injected electrons may undergo further acceleration by wave–particle interaction up to energies of hundreds of keV and even MeV. These relativistic particles can be lost in the atmosphere through pitch angle scattering, resulting in a more spread-out high-energy drizzle during the recovery phase after the initial substorm onset. In the ionosphere, this is related to diffuse and pulsating aurorae, which are primarily observed in the magnetic morning sector (e.g. Nishimura et al., 2020).
Substorms occur both in isolation and in recurrence. These two types were introduced by Borovsky and Yakymenko (2017), who used the terms “randomly occurring” and “periodically occurring”. From a large statistics of substorms detected both in ground-magnetic data and in particle injection data at geostationary orbit, they concluded that the randomly occurring substorms have a recurrence time (waiting time) of 6–15 h, while the periodic ones occur every 2–4 h. Both substorm types were found to be associated with enhanced solar wind driving, but no evidence of the recurrence rate driver of the periodic substorms was identified in the solar wind. Many earlier substorm studies have landed on a similar categorization of substorms (e.g. Newell and Gjerloev, 2011; Rodger et al., 2016; Liou et al., 2013; Sandhu et al., 2019), all with substorms grouped into isolated and recurrent, periodic, non-isolated, or compound, each of which with a slightly different meaning but always something more active and morphologically more complex than an isolated substorm. The isolated substorms have systematically been defined to include a few hours of quiet time prior to the onset and largely mean the same from one study to another. For instance, Liou et al. (2013) concluded that the isolated substorms are intrinsically no different from the non-isolated ones, just related to weaker solar wind driving and lower precipitation power. This logic is true for all of the more complex categories mentioned above.
Substorms can be identified using data from space or from the ground. Automatic substorm detection algorithms often use the auroral electrojet index, which is a continuous and easily available data set. Whether the index implemented in the detection is the original global auroral electrojet index (AL) (Juusola et al., 2011), the SuperMAG SML index (Newell and Gjerloev, 2011), or a local electrojet index (e.g. Partamies et al., 2013) is determined by the purpose of the study. Earlier attempts have incorporated fixed threshold values for substorm detection criteria, while an important improvement to that is percentile thresholding on the rate of change (Forsyth et al., 2015). Different detection algorithms share some common basic concepts: substorm onsets are identified as abrupt decreases in the ground-magnetic north–south (or horizontal) component, expansion phases start from the onset and last until the minimum of the magnetic deflection, and recovery phases last until the magnetic disturbance has decayed. The actual threshold values for the rate of change of the magnetic field at the onset, the threshold value for the measured magnetic field minimum, the definition of the end of the recovery, as well as the definition of the growth phase vary between the different algorithms. The search routines still produce similar statistical results on substorm occurrence and duration, as concluded by Forsyth et al. (2015), although the individual onset and phase timings can differ. As also pointed out by Borovsky and Yakymenko (2017), different substorm descriptors hardly give exactly the same set of events. In their study, about 60 % of substorms identified by particle injections coincided with substorms detected by ground-magnetic signatures. Thus, it is very important to clearly define and choose descriptors that are best suited for the purpose.
Energetic particle precipitation can be monitored from the ground by measuring the CNA in the atmosphere. CNA has been shown to closely follow the variations in the geomagnetic activity, as demonstrated by a linear correlation between the logarithm of CNA and the Kp index (Kavanagh et al., 2004, and references therein). The CNA distribution was found to have a local time dependence: the strongest CNA values were seen in the pre-midnight and midnight sectors due to substorm activity, while another high-absorption sector was shown to be the morning due to the eastward drift of substorm-injected electrons. All CNA and geomagnetic data were included in their study without selecting any specific events, such as substorms, which are associated with strong absorption. The correlations reported by Kavanagh et al. (2004) had coefficients around 0.4, which were speculated to increase if time periods with higher activity were examined separately. A quadratic relationship was suggested and tested to better describe the relationship between CNA and Kp with a higher correlation of about 0.5. However, in some time sectors (for instance at 15:00–18:00 MLT – magnetic local time), the dependence between the two parameters was approximately linear. The non-linear contributions were generally assigned to the high-activity or very low CNA. An AE index was suggested to be better correlated with CNA as it would capture the rapid substorm-related changes in the magnetic activity more accurately than the 3 h-averaged Kp.
An overview of the particle precipitation during the substorm cycle has been presented by Wing et al. (2013). They divided the precipitation into three different categories: monoenergetic, diffuse, and wave electron aurora. Monoenergetic precipitation refers to field-aligned acceleration, diffuse precipitation relates to pitch angle scattering of plasma sheet electrons in resonance with very low-frequency whistler mode chorus waves, and wave electron aurora is associated with electron interaction with dispersive Alfvén waves. All the different precipitation types strongly increase at the substorm onset: monoenergetic by 70 %, diffuse by 300 %, and wave electron aurora by 170 %. The substorm onset was detected simultaneously at all precipitation types, but the diffuse precipitation took 1–2 h longer to decay than the other types of electron precipitation. The mechanism generating the diffuse precipitation is the one that most strongly contributes to the high-energy electron precipitation and, thus, to the evolution of CNA. Although this statistical study was based on a decade of particle data from a spectrometer onboard the DMSP spacecraft, where most of the energy channels count electrons with energies below 10 keV, the tripling of the precipitation power indicates a significant enhancement in the high-energy electron precipitation as well. Furthermore, it is important to note that the diffuse precipitation is a particularly large-scale feature: after the onset, it statistically occupies 10–12 h of magnetic local time at the magnetic latitudes of about 65–70∘. Furthermore, the lifetime of the diffuse precipitation exceeded the epoch time used in their analysis (about 2 h after the onset).
A detailed study of substorm electron precipitation spectra by Beharrell et al. (2015) presented a model for injections of energetic electrons at the energies of 20–300 keV (so-called medium-energy electrons). They used the substorm list by Newell and Gjerloev (2011) as their onset times as well as typical substorm parameters found in the literature. These included the substorm onset location close to the magnetic midnight, the flux of the injected particles, the energy spectrum of the injection, the temporal evolution of electron flux, and the mean lifetime of injected electrons (for details and references, see the model description in their paper). The number of energetic electrons injected during substorms was used to estimate electron density profiles for the ionospheric region affected by the substorm injection, which was further used to calculate the absorption due to the particle precipitation. The model absorption was then matched to the measured CNA to obtain the best possible flux magnitudes of the particle injections for a 5 d period of 61 substorm onsets during a mild geomagnetic storm (Dst index between −40 and −10 nT). The energetic electron precipitation (EEP) forcing described by this sequence of modelled substorms was further used to estimate the corresponding atmospheric impact (Seppälä et al., 2015). The one-dimensional Sondakylä Ion and Neutral Chemistry model (e.g. Turunen et al., 2009) was run to investigate the production of odd hydrogen () and odd nitrogen () due to the strong ionization at the bottom part of the ionosphere and the following catalytic depletion of mesospheric ozone. The peak loss of mesospheric ozone was found to be 10 %–50 % depending on the season. Due to the lower background ionization level, the winter solstice substorm forcing penetrated deeper in the atmosphere, causing stronger and longer-lasting ozone loss. The maximum depletion was observed during days 3 and 4 in the substorm sequence, when the recurrence rate also maximized. The range of modelled ozone depletion was estimated to be comparable to the ozone loss of a small to medium solar proton event (in the range of about 500–6000 pfu, von Clarmann et al., 2013).
The substorm recurrence rate of about 15 onsets a day (Beharrell et al., 2015) is much higher than any longer-term average rate of a few per day (e.g. Borovsky and Yakymenko, 2017). At the same time, the substorm detection routines have slightly different definitions and threshold values, and the previous studies have indicated both temporal delays and non-linear magnitude dependence between the magnetic disturbances and the energetic particle precipitation signatures, as outlined above. Our aim with this study is to investigate whether all substorms can be equally influential in the neutral atmosphere or whether the intensity, duration, or internal structure of the substorms can be used to differentiate events which have a significant atmospheric impact from those which only have a negligible impact. In this paper, we use the cosmic noise absorption enhancement as a measure of the medium-energy electron precipitation, which has the potential to produce odd hydrogen and odd nitrogen, thus leading to depletion of mesospheric ozone. We investigate isolated, compound, and multi-night substorm events with different magnetic disturbance magnitudes, examine any cumulative effects the multi-night events may have on CNA, and compare in situ particle precipitation spectra to previously observed reference values of energetic electron forcing.
2.1 Magnetic activity indices and substorm phase detection
The lower-envelope curve of the AL is sensitive to enhancements in the westward electrojet, which makes the AL index a good tool for identifying substorm signatures. An AL index-based substorm phase-detection method was introduced by Juusola et al. (2011). The method detects start and end times of substorm phases using the following criteria.
-
The growth phase begins from the IMF BZ southward turning and ends at the substorm onset.
-
The substorm onset is an abrupt decrease in the AL index with the rate of change of at least 4 nT min−1.
-
The expansion phase begins at the substorm onset and ends at the AL index minimum, which must be less than −50 nT.
-
The recovery phase begins at the AL index minimum and lasts until the AL index has reached values above −50 nT or until a new onset.
The threshold value of −50 nT comes from a long-term median of negative AL index values. OMNIWeb solar wind data, which have been propagated to the magnetopause, are used to determine the IMF BZ polarity.
Juusola et al. (2011) validated these substorm detection criteria against a list of substorm onsets published by Frey et al. (2004) and concluded that the agreement was good. Instead of the AL, Partamies et al. (2015) used a regional electrojet index (an IL version they called ILASC) constructed from baselined data collected at five Lapland magnetometer stations of the IMAGE network (Tanskanen, 2009): Kevo (KEV; 69.76∘ N, 27.01∘ E), Kilpisjärvi (KIL; 69.02∘ N, 20.87∘ E), Muonio (MUO; 68.02∘ N, 23.53∘ E), Abisko (ABK; 68.36∘ N, 18.82∘ E), and Sodankylä (SOD; 67.42∘ N, 26.39∘ E). The selected stations were co-located with the MIRACLE auroral all-sky cameras (Sangalli et al., 2011), allowing the auroral morphology to be analysed over the same area. They also concluded that the long-term median value of −50 nT was valid for this regional index as well. Furthermore, it is important to note that an earlier study by Kauristie et al. (1996) shows that a local electrojet index, IL (including the entire IMAGE magnetometer network), corresponds well to the global AL index in the magnetic midnight sector (20:00–02:00 UT in Lapland). A more recent study by Tanskanen (2009) suggested that the reliable time range could be extended to 16:00–03:00 UT. Since the magnetic midnight sector is the most favourable time range for substorm activity and the Lapland latitudes are most of the time under the substorm activity (e.g. Frey et al., 2004), results from nighttime substorm studies over Fennoscandian Lapland should be globally applicable. In this study, we use the Lapland substorm phases detected by Partamies et al. (2015) as a starting point. For simplicity, we use the term “IL index” to describe the Lapland IL index (ILASC) throughout the paper. A further visual selection and sub-categorization of events will be described in Sect. 2.4.
2.2 From cosmic noise absorption to a regional absorption index
Measurements of CNA from a chain of riometers owned and operated by the Sodankylä Geophysical Observatory (SGO) have been used here to describe the substorm EEP impact in the D-region ionosphere. Increased ionization in the D region leads to enhanced absorption of the cosmic noise, and at D-region heights this is mainly due to precipitation of electrons with energies above 10 keV (e.g. Turunen et al., 2009). The SGO riometers are wide-beam instruments which listen to the cosmic noise at approximately 30 MHz. CNA is calculated as the reduction of cosmic noise with respect to the quiet background, the so-called quiet day curve (QDC). For the SGO riometer data, the QDC is calculated automatically by fitting a sinusoidal curve to the data of the 10 previous days. Our automatically baselined (or QDC-subtracted) data set extends from 2008 until 2013 with a 1 min temporal resolution. For more instrument details, see for instance Heino and Partamies (2020). For this study, we selected the Lapland riometer stations at Abisko and Sodankylä, where the riometers are essentially co-located with the magnetometers, as well as Ivalo (IVA; 68.56∘ N, 27.29∘ E), which is close to the magnetometer station at KEV. We further calculate an “absorption index” by aligning the baselined CNA data from the three stations and taking the upper-envelope curve, similar to the construction of the global AU or the local IU index. Together with the regional electrojet index (IL), this absorption index allows us to capture the magnetic disturbances and the particle precipitation enhancements occurring within approximately the same geographic area over the same time period. Note that the terms “absorption” and “CNA” in this paper refer to this regional CNA index.
2.3 Space-borne particle precipitation measurements
To characterize the particle precipitation energy spectra during the substorm events, we searched for overpasses of the low-altitude spacecraft, DMSP and Polar Orbiting Environmental Satellites (POES). Together the spacecraft from the two satellite programmes cover electron energies from 30 eV up to almost 800 keV. The upward-looking spectrometers (SSJ versions 4 and 5) onboard DMSP measure fluxes of downward-going electrons at 19 energy channels from 30 eV up to 30 keV (Redmon et al., 2017).
POES observes particles with two different instruments, the Total Electron Detector (TED) and the Medium Energy Proton and Electron Detector (MEPED). The TED measures differential electron fluxes in four energy bands (0.15–0.22, 0.69–1, 2.12–3.08, and 6.50–9.46 keV) with telescopes pointing up and at 30∘ to the vertical (Evans and Greer, 2000). We used data from the upward-pointing telescope only, which may lead to an underestimation of the precipitation electron fluxes.
Similarly, the MEPED instrument comprises two telescopes, one pointing upwards and another one normal to the first. The measurements consist of fluxes of four integral channels (above 43, 114, 292, and 756 keV, Ødegaard et al., 2017). For these data, we used a combination of the measurements from both telescopes to construct the bounce loss cone fluxes as described by Nesse Tyssøy et al. (2016). Their pre-processed data set further includes corrections for proton contamination in the electron channels and identification of the relativistic electrons on the proton detector.
To make the MEPED integral fluxes comparable to the TED and SSJ differential fluxes, we converted the observed integral fluxes into differential fluxes. The resulting three flux values are set to the centre energy between the integral channel cutoff energies of 78.5, 203, and 524 keV. The data and the approach are similar to that described by Tesema et al. (2020), except for the extrapolation of the MEPED spectra into lower and higher energies, which we consider unnecessary for the purpose of the current study. All particle data analysed in this study are in the format of overpass-averaged spectra, also used by Tesema et al. (2020).
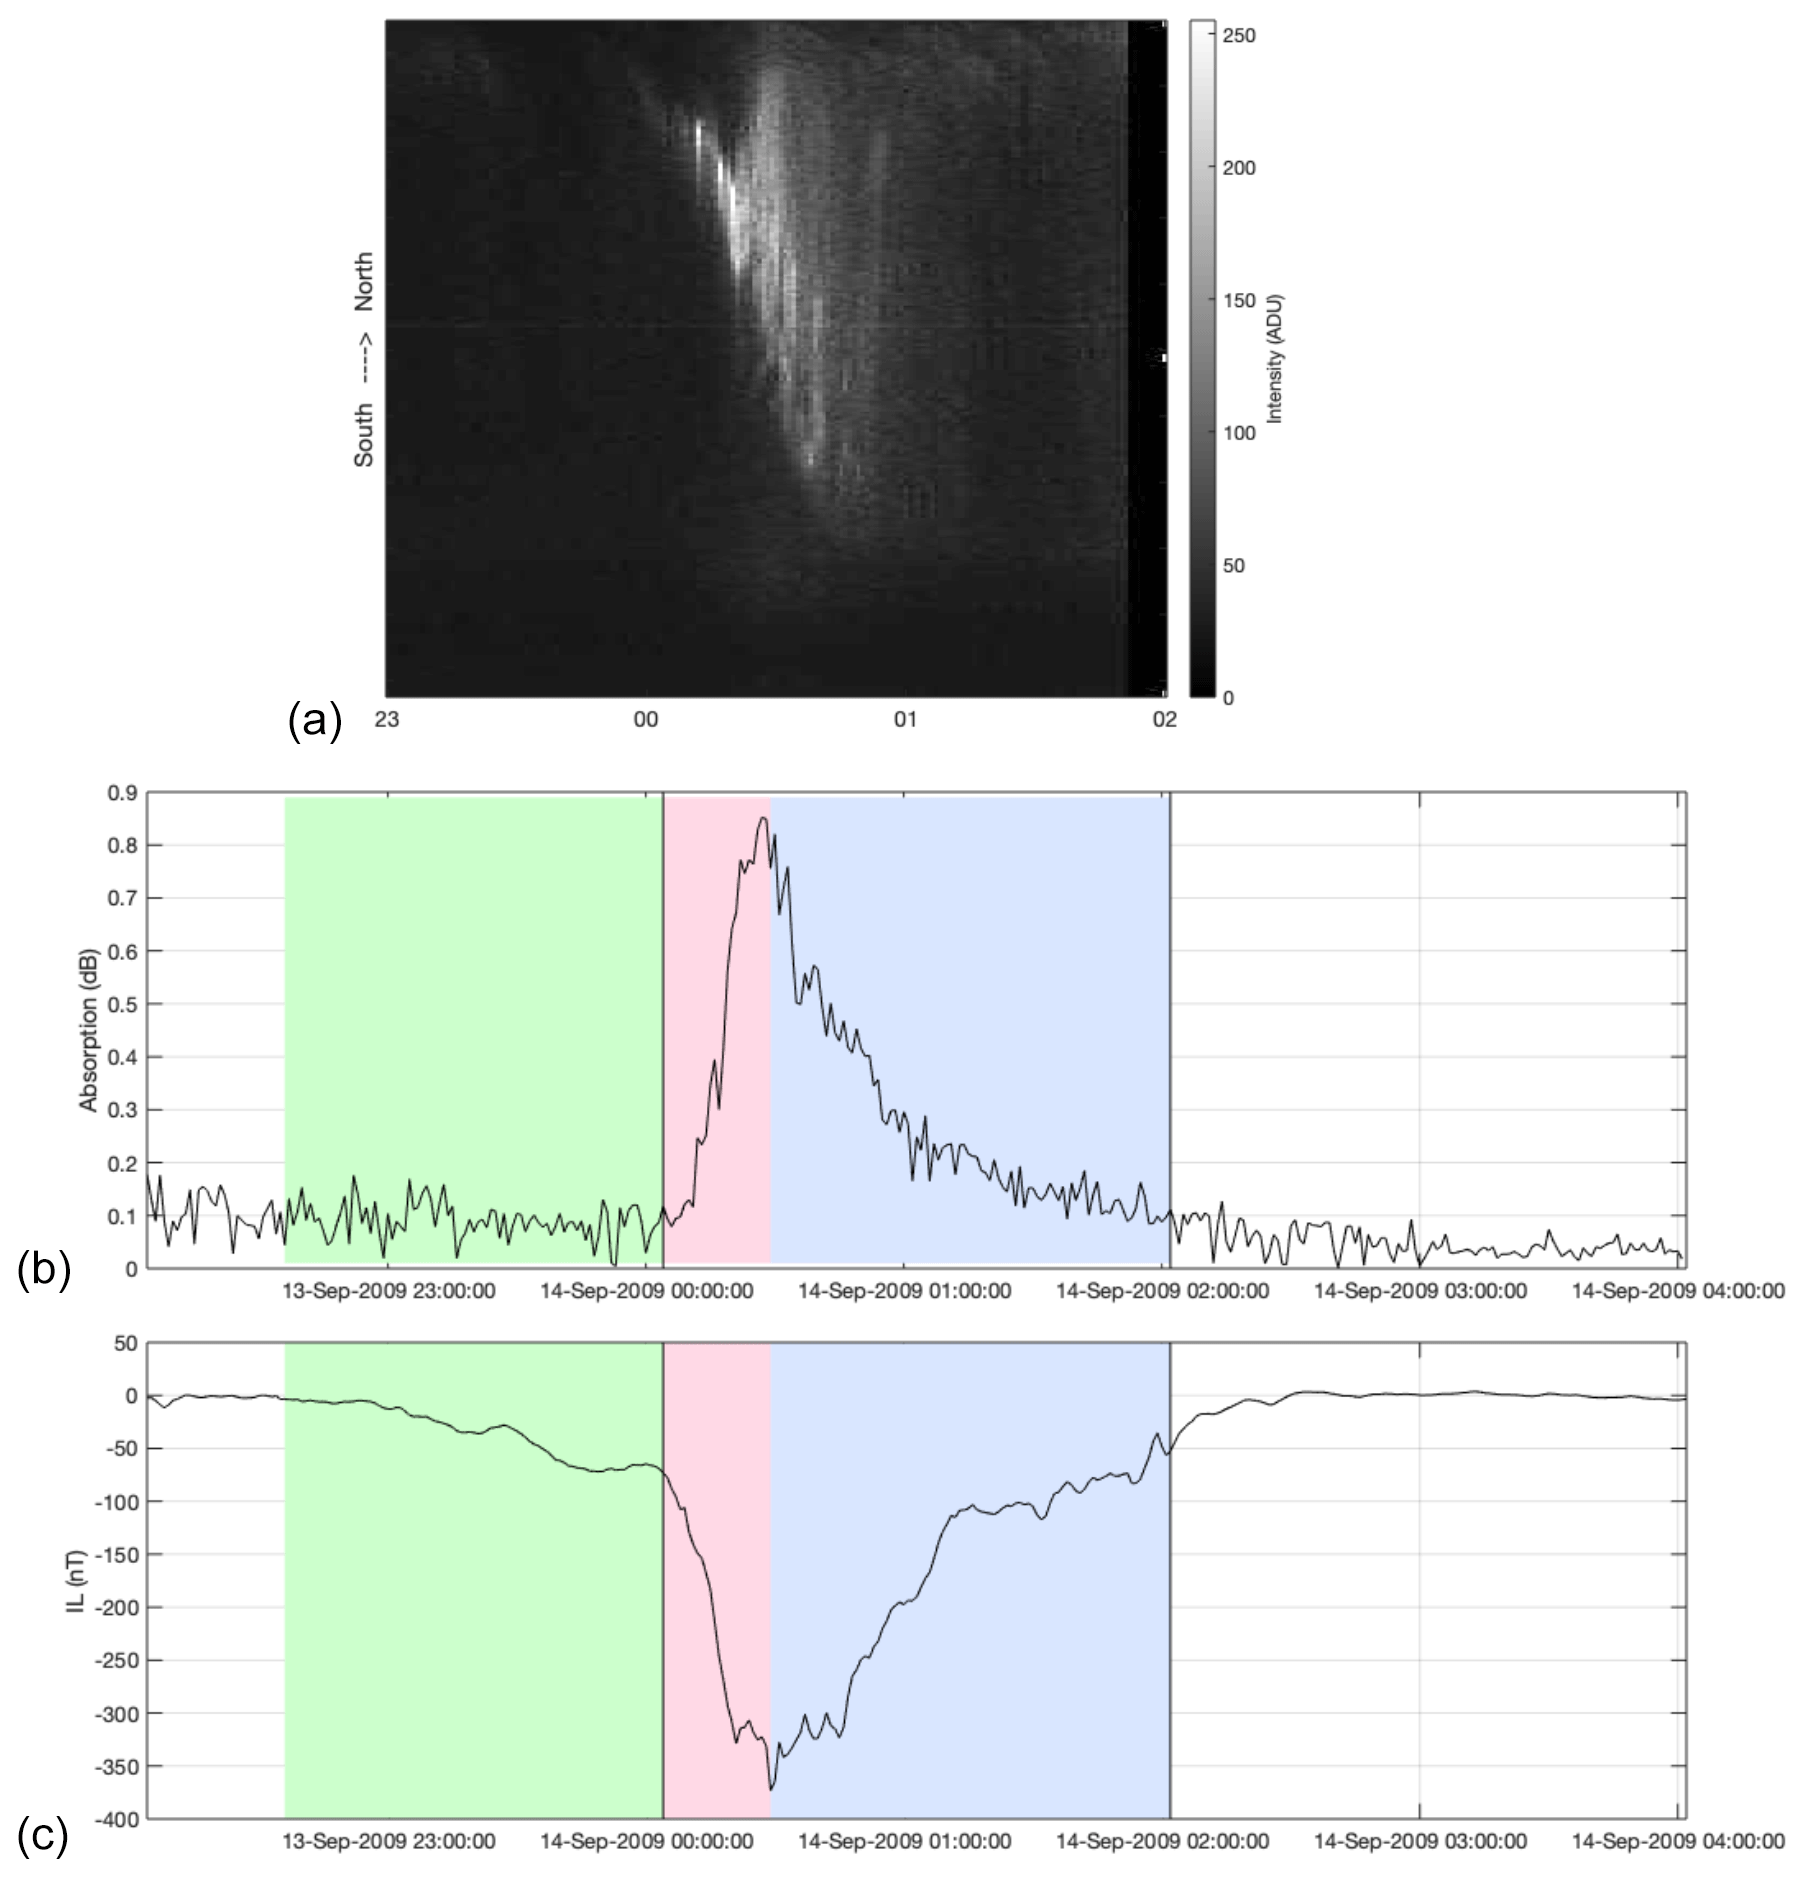
Figure 1An example of an isolated substorm event with a single expansion (red) and recovery (blue). The vertical lines mark the time period which is used in the analysis, i.e. from the expansion onset until the end of the recovery phase. The green shaded area marks the growth phase as determined by the search algorithm. Displayed is the temporal evolution of CNA (b) and the IL index (c). Panel (a) shows the auroral evolution at 557.7 nm as a keogram (north–south slice as a function of time) from the SOD camera station aligned to match the timing of data in b and c.
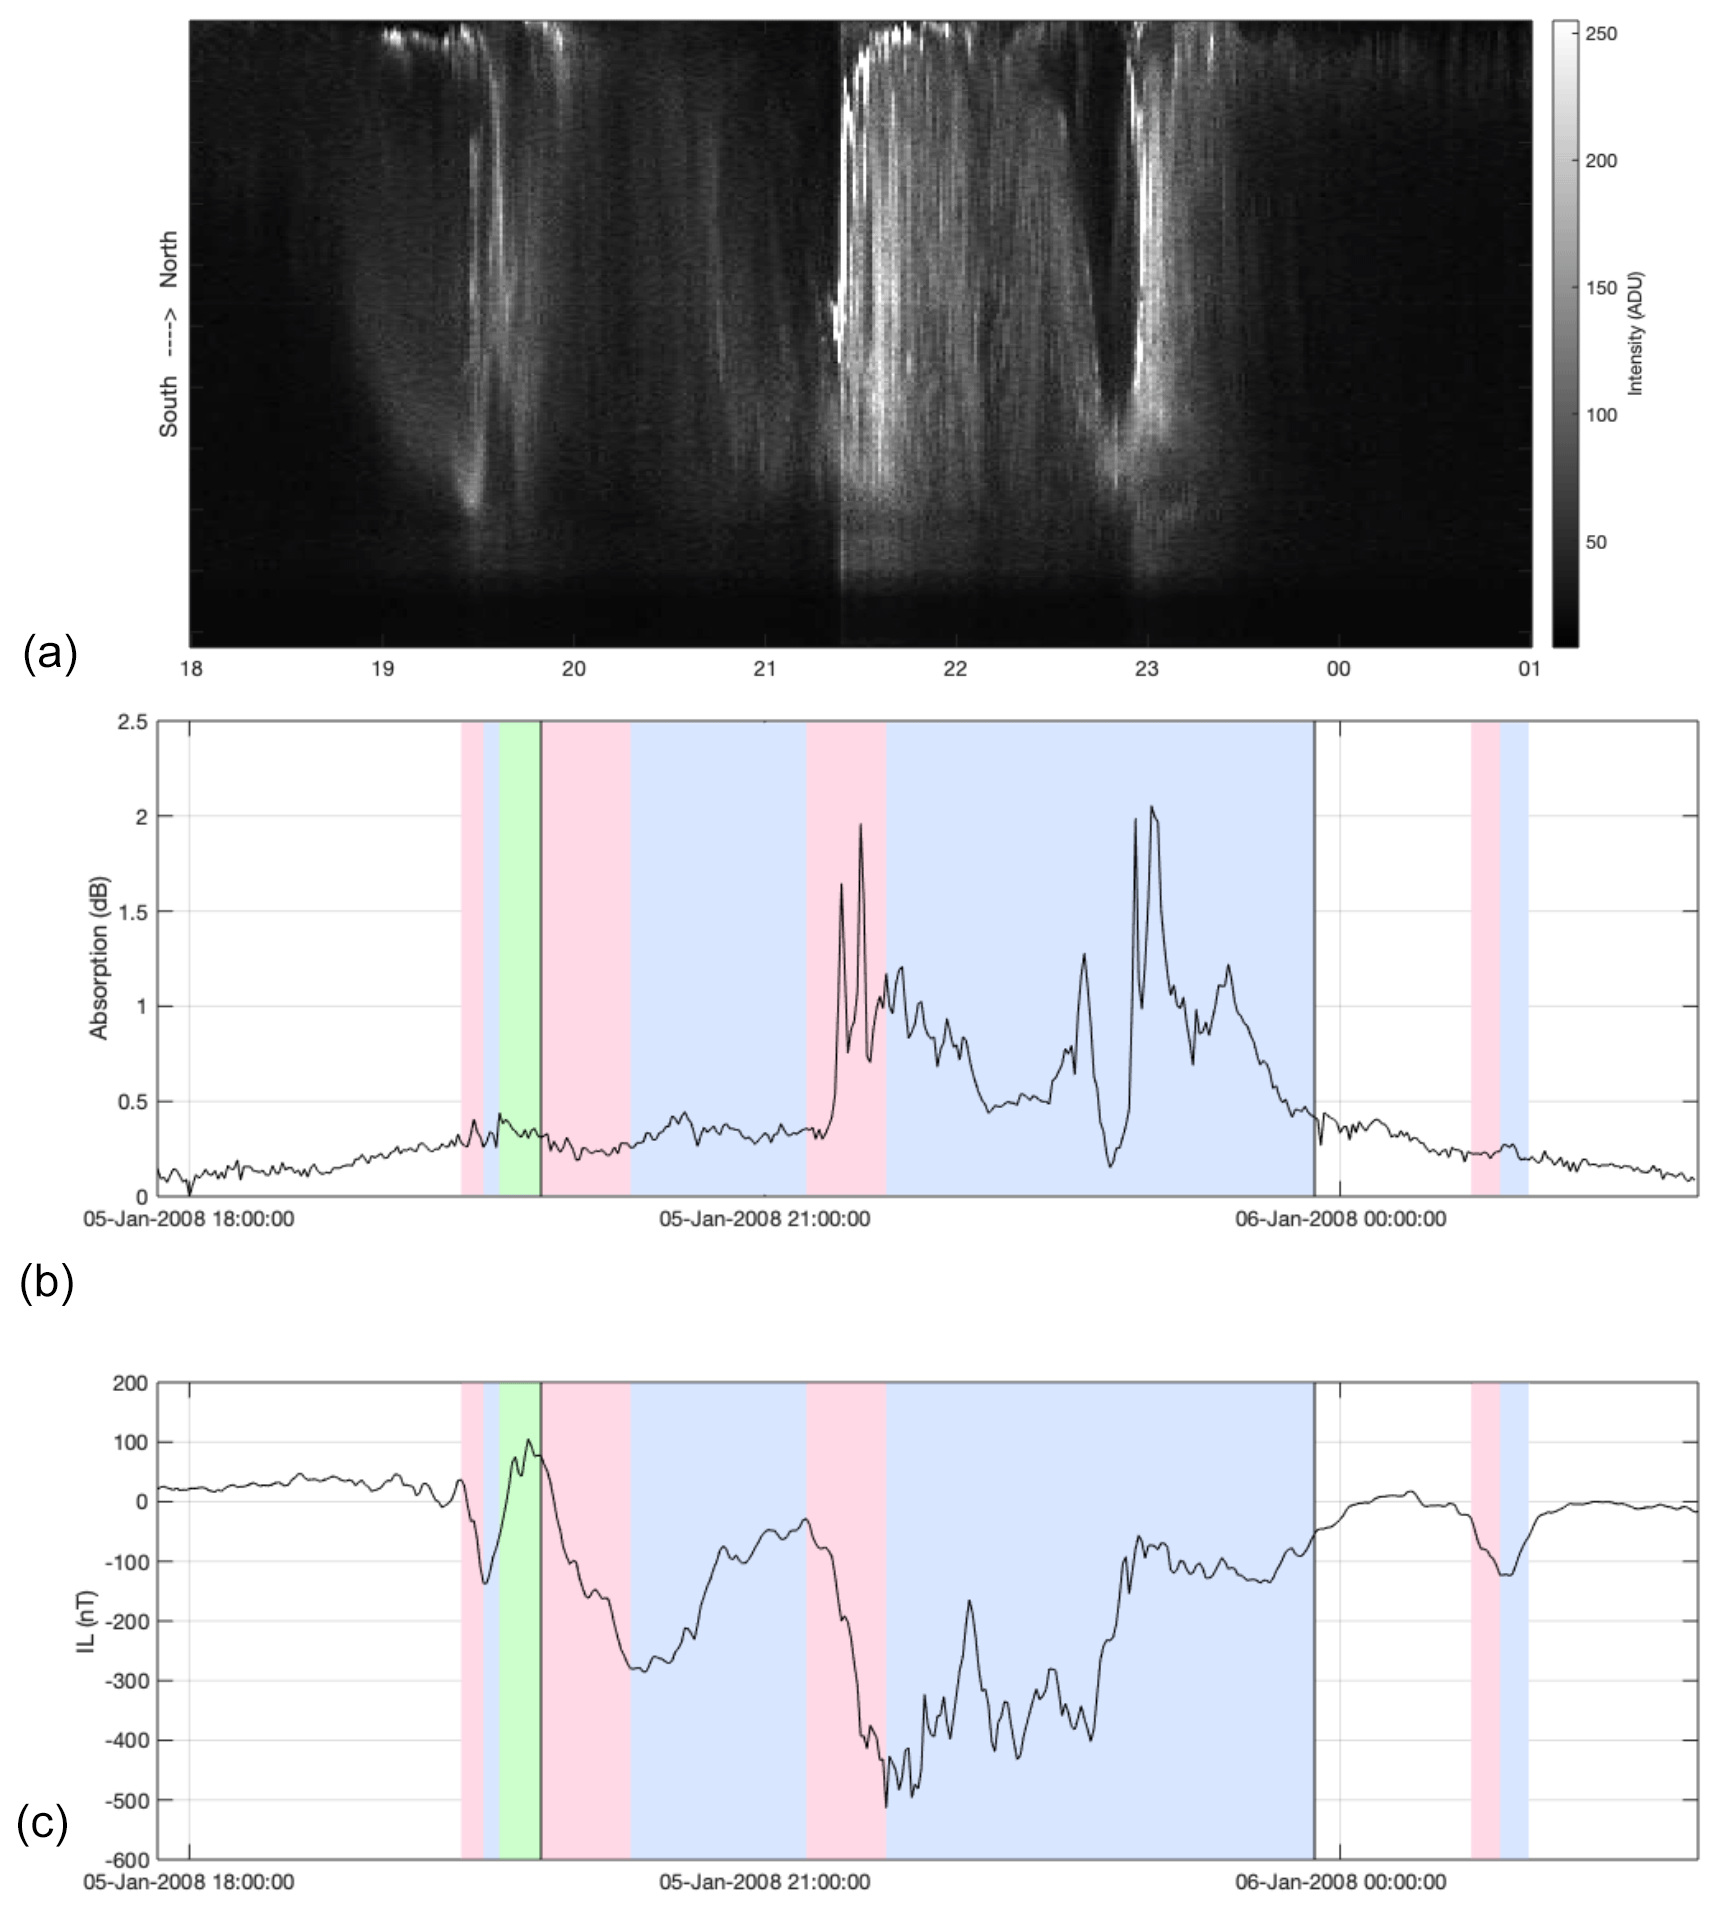
Figure 2An example of a compound substorm event with several consecutive expansion (red) and recovery (blue) phases. The vertical lines mark the time period which is used in the analysis, i.e. from the expansion onset until the end of the recovery phase. The green shaded area marks the growth phase as determined by the search algorithm. Displayed is the temporal evolution of CNA (b) and IL (c). Panel (a) shows the evolution of the green auroral emission as a keogram (north–south slice as a function of time) from the SOD camera station aligned to match the timing of data in b and c.
2.4 Event selection and substorm categories
The event categorization was performed visually using nightly overview plots similar to Figs. 1 and 2. Panel b of each figure shows the temporal evolution of the CNA index, and panel c shows the IL index. The green, red, and blue shadings mark the time periods of automatically detected growth, expansion, and recovery phases respectively. As the automatic substorm phase-detection routine is also sensitive to small events (thresholded by the IL index long-term median value of −50 nT), a visual inspection was done to exclude events with an IL minimum above −300 nT. These mild events are generally not accompanied by an appreciable CNA enhancement. We required two days of quiet time (no automatically detected substorms) prior to all of the event groups described below. This is done to make sure that the activity starts from a solidly quiet background, which allows us to determine whether there is a cumulative ionospheric response to the energetic particle precipitation.
Isolated substorms are defined as events with a single expansion–recovery phase pair. An example of an isolated substorm is plotted in Fig. 1: the CNA (middle) and IL (bottom) index evolution with colour shadings for substorm phases. The keogram from the SOD camera station in panel a shows that the auroral green emission (557.7 nm) evolves in tandem with the magnetic disturbances and the absorption enhancements. The expansion phase contains the brightest emission, while diffuse emission is seen in the recovery phase.
Compound substorms are defined as consecutive expansion–recovery phase pairs that are not interrupted by quiet time or a growth phase. A similar definition was employed by Sandhu et al. (2019). In the case of compound substorms, the substorm onset is the beginning of the first expansion phase. Later expansion phases are called intensifications. Although the threshold for the IL index minimum is −300 nT, we allow an intensification in the middle of the substorm activity to be as small as −100 nT as long as the lifetime of the expansion exceeds 20 min. All these threshold values are, of course, somewhat arbitrary, but they are based on our visual comparisons of the magnetic and absorption signatures from hundreds of events. An example of a compound substorm is shown in Fig. 2. This event contains two expansion–recovery phase pairs as well as a non-detected intensification (IL dip of about 200 nT at 22:04 UT). Prior to the visually approved onset (first black vertical line), a minor substorm event took place. This event was excluded from further analysis due to its low intensity ( nT) and a short growth phase between this minor event and the major onset at 19:50 UT. Another minor event that occurred the following morning, well after the main activity, was also ignored. Figure 2a again shows the auroral evolution from the SOD camera station as a keogram. The largest expansion (the second red shading in between the black vertical lines) corresponds to both enhancement in the CNA and bright aurora, while the first auroral brightening happened during the excluded event prior to the main event onset at 19:50 UT. The third auroral brightening occurred at around 23:00 UT, coinciding with the second major CNA enhancement but deep into the magnetic recovery without any appreciable IL index intensification. As can be seen in Figs. 1 and 2, there is a temporal delay between the onset determined in the magnetic data and the auroral breakup. This is particularly clear in the second expansion onset in Fig. 2 starting at 21:00 UT. This time delay was studied by Partamies et al. (2015), who concluded that it is typically of the order of a minute. It is, however, unclear what the delay between the magnetic onset and the energetic particle precipitation onset is on average.
Multi-night substorm events are defined as substorm activity that occurs on consecutive nights. The individual nights during these events consist of either substorms with a single phase pair or substorms with multiple intensifications. They can look like isolated or compound substorms (as described above) during any of the individual nights, but after a magnetically calm daytime (which is excluded from the analysis), the activity resumes for 1 or more additional nights. Each night has its own substorm onset and may include one or more intensifications. In total, the 36 multi-night events include 134 individual nights of substorm activity, most of which were linked to a series of 3–4 nights of activity, but a handful of events was found to continue over 6–7 consecutive nights.
Table 1A selection of descriptive parameters to characterize the different substorm categories.
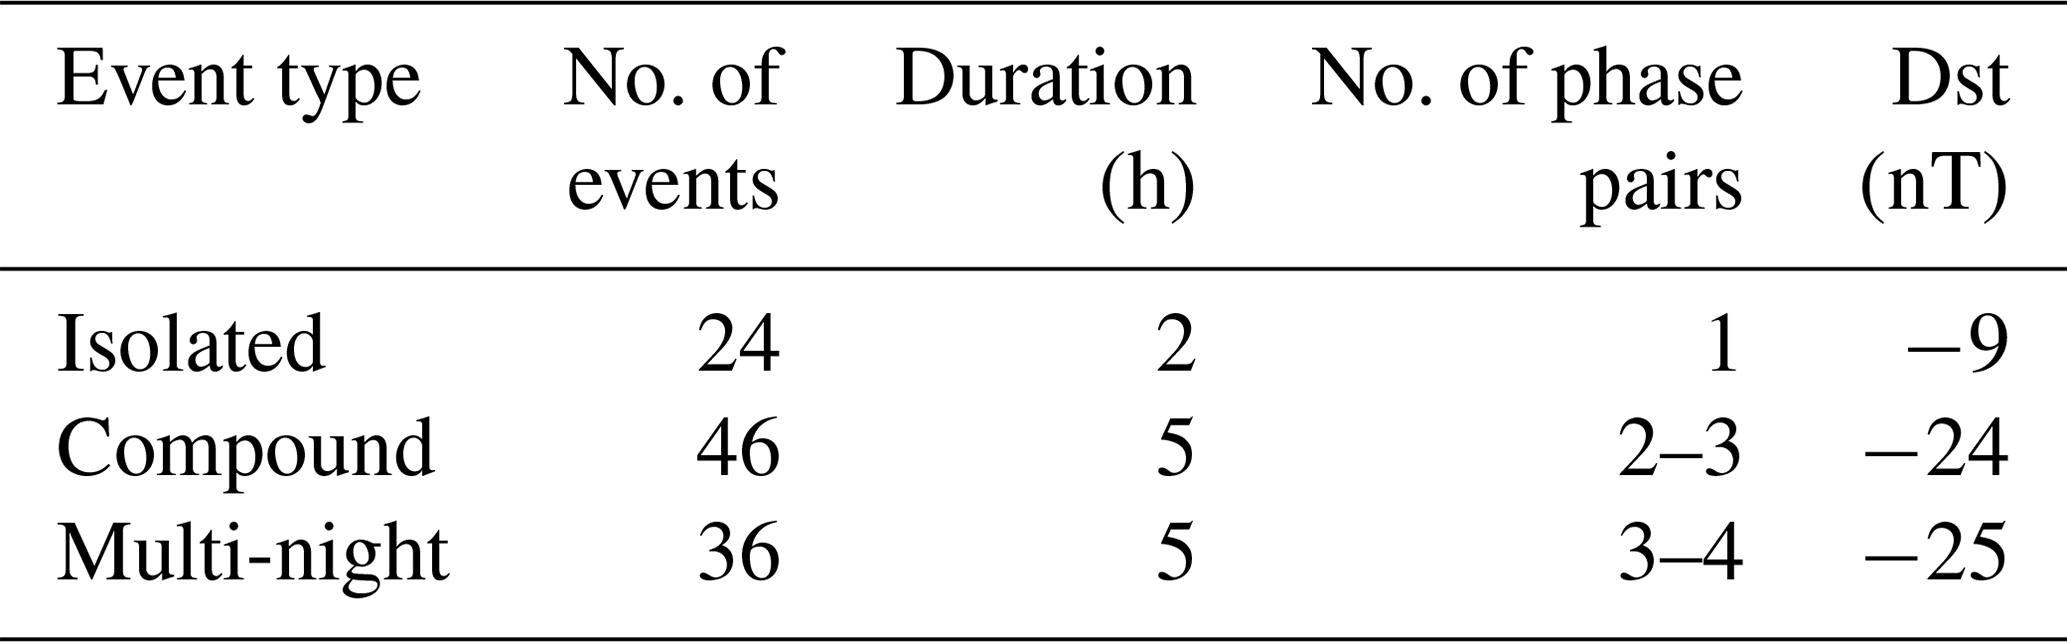
A summary of the identified and categorized events is given in Table 1. Each event duration excludes the growth phase prior to the substorm onset. Each event has been assigned an intensity value, which is the minimum IL index value rounded to the closest 100 nT. The median value of the substorm intensity in all three groups is around −500 nT (not included in the table). However, the range is very limited for isolated (from −300 to −800 nT) and compound events (from −300 to −900 nT), while it becomes much larger for the multi-night events (from −300 to −1800 nT). It is important to note that in the group of isolated substorms, there is only one event reaching the extreme IL value of about −800 nT. Based on our set of events, a substorm negative bay with an IL minimum below about −600 nT is highly uncommon for isolated substorms starting from quiet conditions. The durations and Dst indices given in Table 1 are median values for each substorm type. The range of Dst index values is larger in the group of multi-night events than it is in the other two sub-categories, but as the median values suggest, the typical events are related to very similar ring current enhancements in the groups of compound and multi-night substorm events. The number of phase pairs is the number of automatically detected expansion–recovery phase pairs during the event, where phases shorter than 20 min have been ignored (as described above). In the group of multi-night events, the table shows the number of phase pairs per night. The number of phase pairs varies between two and nine from one event to another in the groups of compound and multi-night substorms. The highest numbers of phase pairs are found during multi-night substorm events.
3.1 The relationship between CNA and magnetic disturbances
Since the correlation between magnetic disturbances and absorption has been studied before, we want to determine the extent to which our data set follows the previously established relationship. Figure 3 is a scatter plot showing the minimum IL index and the absorption for each event. The events are colour-coded as red, blue, and black for isolated, compound, and multi-night events respectively. Values for multi-night events describe individual nights. Although the Pearson correlation coefficient for the full data set here is −0.6 (with p<0.01), a number of obvious outliers can be seen in the figure. The correlation in the isolated substorm category is insignificant, while significant correlations (p<0.01) are found in the categories of compound and multi-night events with correlation coefficients of −0.5 and −0.7 respectively.
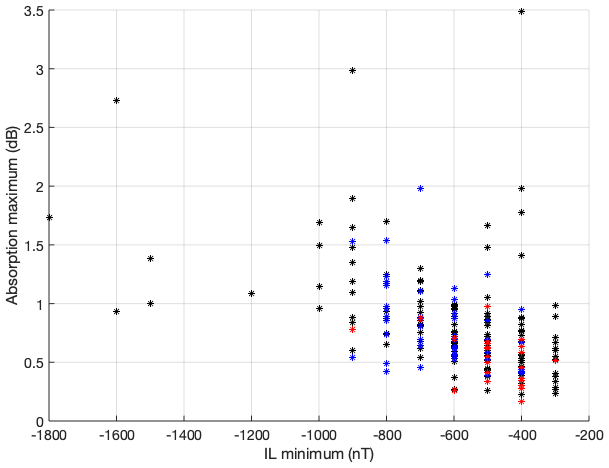
Figure 3A scatter showing the correlation between the CNA and IL index values for the substorm events. The events are separated into the groups of isolated (red), compound (blue), and multi-night (black) events.
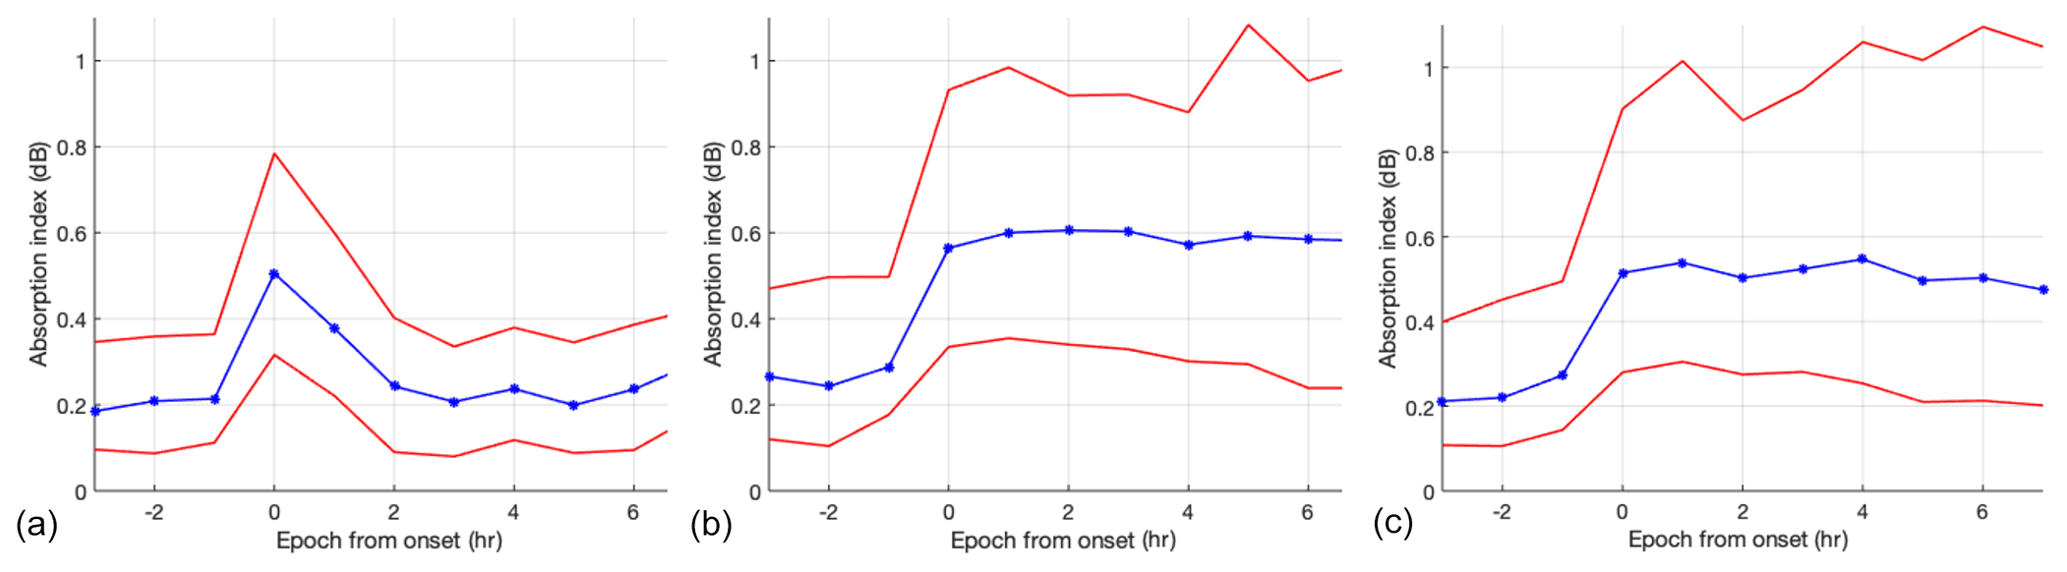
Figure 4A superposed epoch view of the isolated (a), compound (b), and multi-night (c) substorm events from −3 to +7 h from the onset of the first expansion phase. For multi-night events, the onset is the start of the first expansion phase of each night. The median curves are blue and the 25 % and 75 % percentile curves are red.
The temporal evolution of CNA during the substorm events from 3 h before to 7 h after the onset is illustrated by the superposed epoch plots of CNA in Fig. 4. The typical evolution of the isolated substorms shows a mild maximum (∼0.5 dB) in the median curve (blue) at the substorm onset time, which then decays during the following 2 h. Note that the hourly resolution of the superposed epoch analysis places the maximum CNA values at the onset hour, although in higher-resolution data they tend to occur around the minimum IL time, as seen in Fig. 1. The two other groups of more complex substorms show a slightly higher CNA enhancement in the median curve (up to ∼0.6 dB) at the onset time, which does not recover within the 7 h time frame shown here, not even in the 25 % percentile curve (bottom red curve). Interestingly, the top percentile for both of these event groups maximizes an hour after the onset as well as 4–6 h after the onset, which is most likely a signature of multiple substorm intensifications. Note that there is no appreciable CNA difference between the compound and multi-night events. This is probably due to the multi-night events being a mixture of nights with short single phase-pair substorms and those with multiple phase pairs and long durations.
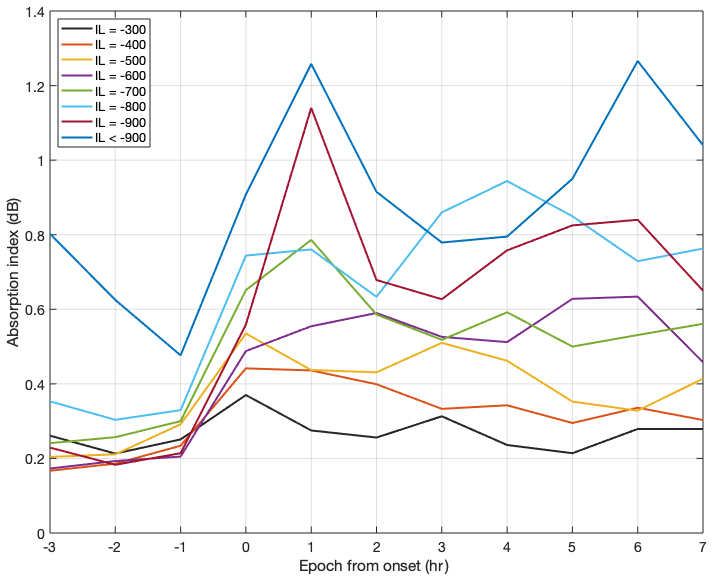
Figure 5Median CNA curves for different ranges of IL index values without any substorm-type categorization. The intensity categorization results in 10–40 events per group. The data are binned into 1 h resolution.
Figure 5 shows the evolution of the median CNA for eight different IL index intensities from nT to nT. In general, CNA increases with increasing substorm intensity. For the weakest electrojet intensities ( nT), the maximum CNA occurs at the zero epoch. In contrast, for events with nT the peak CNA is delayed by 1 h (top two curves). For these stronger events the temporal evolution of the CNA is also highly variable, and they are less obviously ordered by the IL intensity.
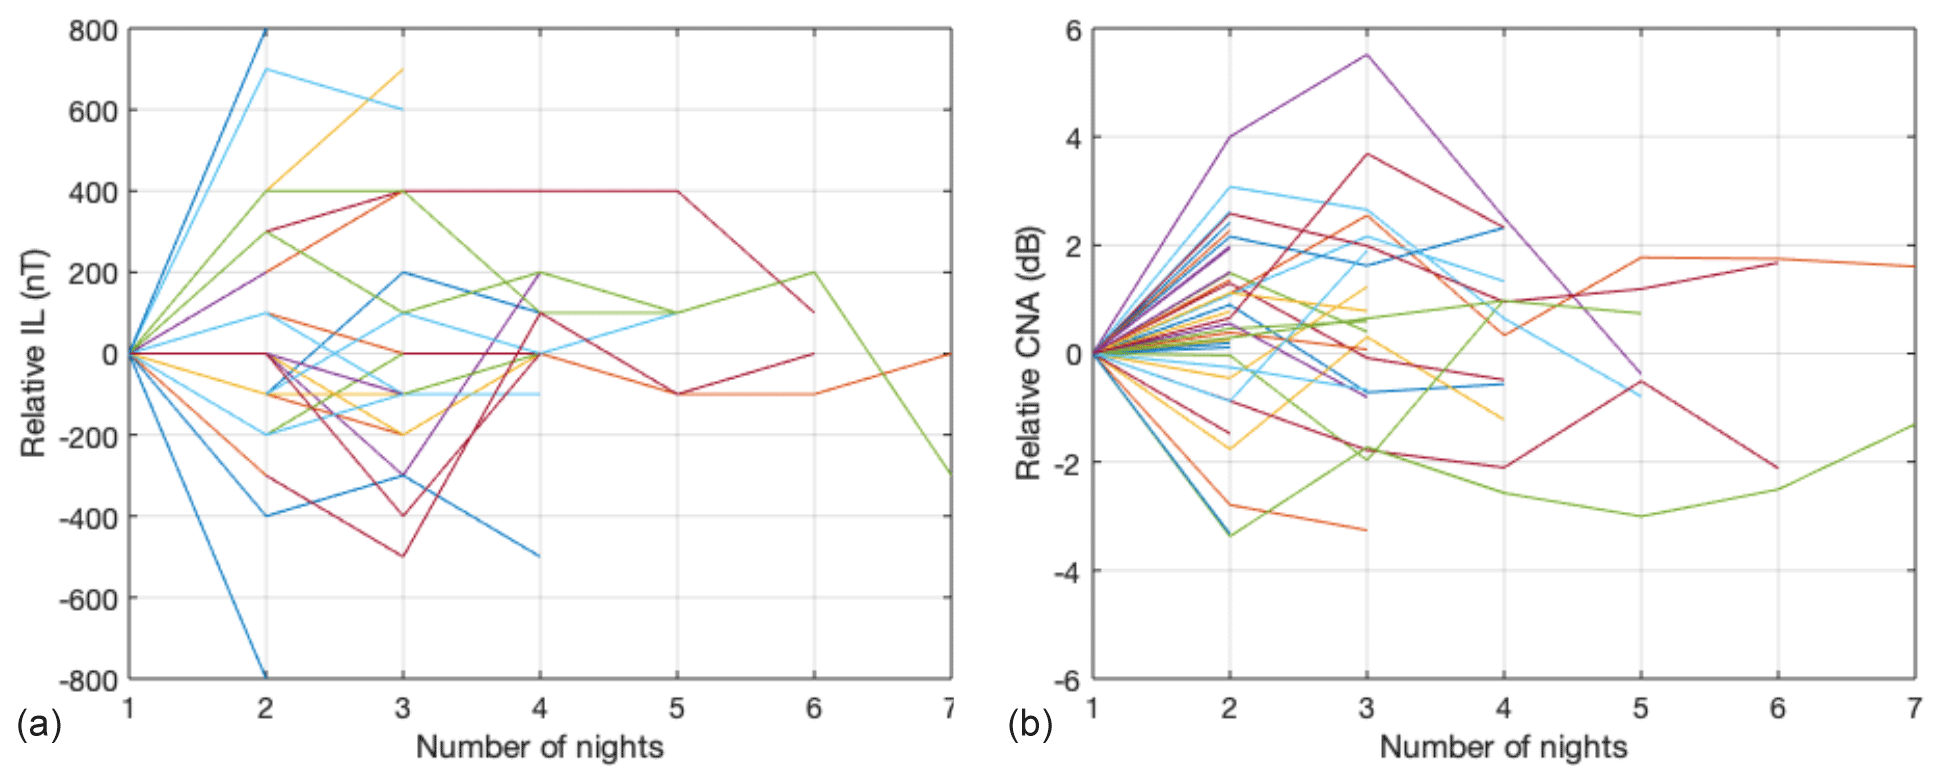
Figure 6An event-by-event evolution of the IL index (a) and the CNA index (b) during multi-night events. Each event is represented by one curve, whether the event lasts for 2 or 7 nights in a row. The minimum IL value and the maximum CNA value reached during the first night have been subtracted. As the IL minima have been rounded to the nearest full 100 nT, some of the event evolution lines appear on top of each other, making the plot look less busy than the CNA plot, although the number of events is equal in both panels.
We further investigate the CNA evolution during the multi-night substorm events, in particular, how the CNA responds to the IL change during the different nights in a series substorm activity. These results (not shown) suggest that CNA often grows strongest during the second, third, or fourth nights and is less dependent on the IL intensity of that night, which may account for some of the temporal CNA variability in Fig. 5. The most intense absorption is rarely observed during the first night of activity. To illustrate the mismatch between the IL index and CNA index behaviour during the multi-night activity, Fig. 6 shows the evolution of the IL (left) and CNA (right) intensity for the multi-night events. The intensities for IL and CNA are plotted with respect to the intensity values measured during the first night; thus, each event curve starts from 0. In total, there were 23 cases where the activity continued for 3 or more consecutive nights, 14 cases with 4 or more consecutive nights, and 7 cases with 5 or more consecutive nights. While the IL index evolution (panel a) shows a well-balanced distribution of positive and negative values during the second to fourth night (i.e. increase and decrease with respect to the first night) with average values within ±40 nT, the CNA evolution (panel b) is biased towards positive values during the second to third night with average values of 0.6–0.7 dB. In about 70 % of the cases, CNA increases from night 1 to night 2, with a median enhancement of 0.7 dB.
3.2 Particle precipitation spectra
During the 204 detected and categorized substorm periods, we found 30 DMSP overpasses and 124 POES overpasses in total. Most of the overpasses (123) took place during the substorm recovery phases, which is expected because those are the longest-lasting substorm phases, while 31 overpasses coincided with expansion phases. The distribution of the overpasses between the different substorm types is very uneven, with only 3 overpasses found during the isolated, 34 during compound, and 117 during multi-night events, which reflects the large differences in the lifetimes of the event types. To account for this uneven distribution of overpasses, we group all expansion-phase data into one bundle of spectra and all recovery-phase data into another, as shown in Fig. 7. Each spectrum in the figure is an average over an individual overpass, where an overpass is defined as a conjugate with the common field of view of Lapland auroral cameras, as described by Tesema et al. (2020). Note that DMSP and POES overpasses are mainly from different events or at least well-separated in time. We thus expect to see discontinuities between the spectra from one spacecraft to another throughout the displayed energy range.
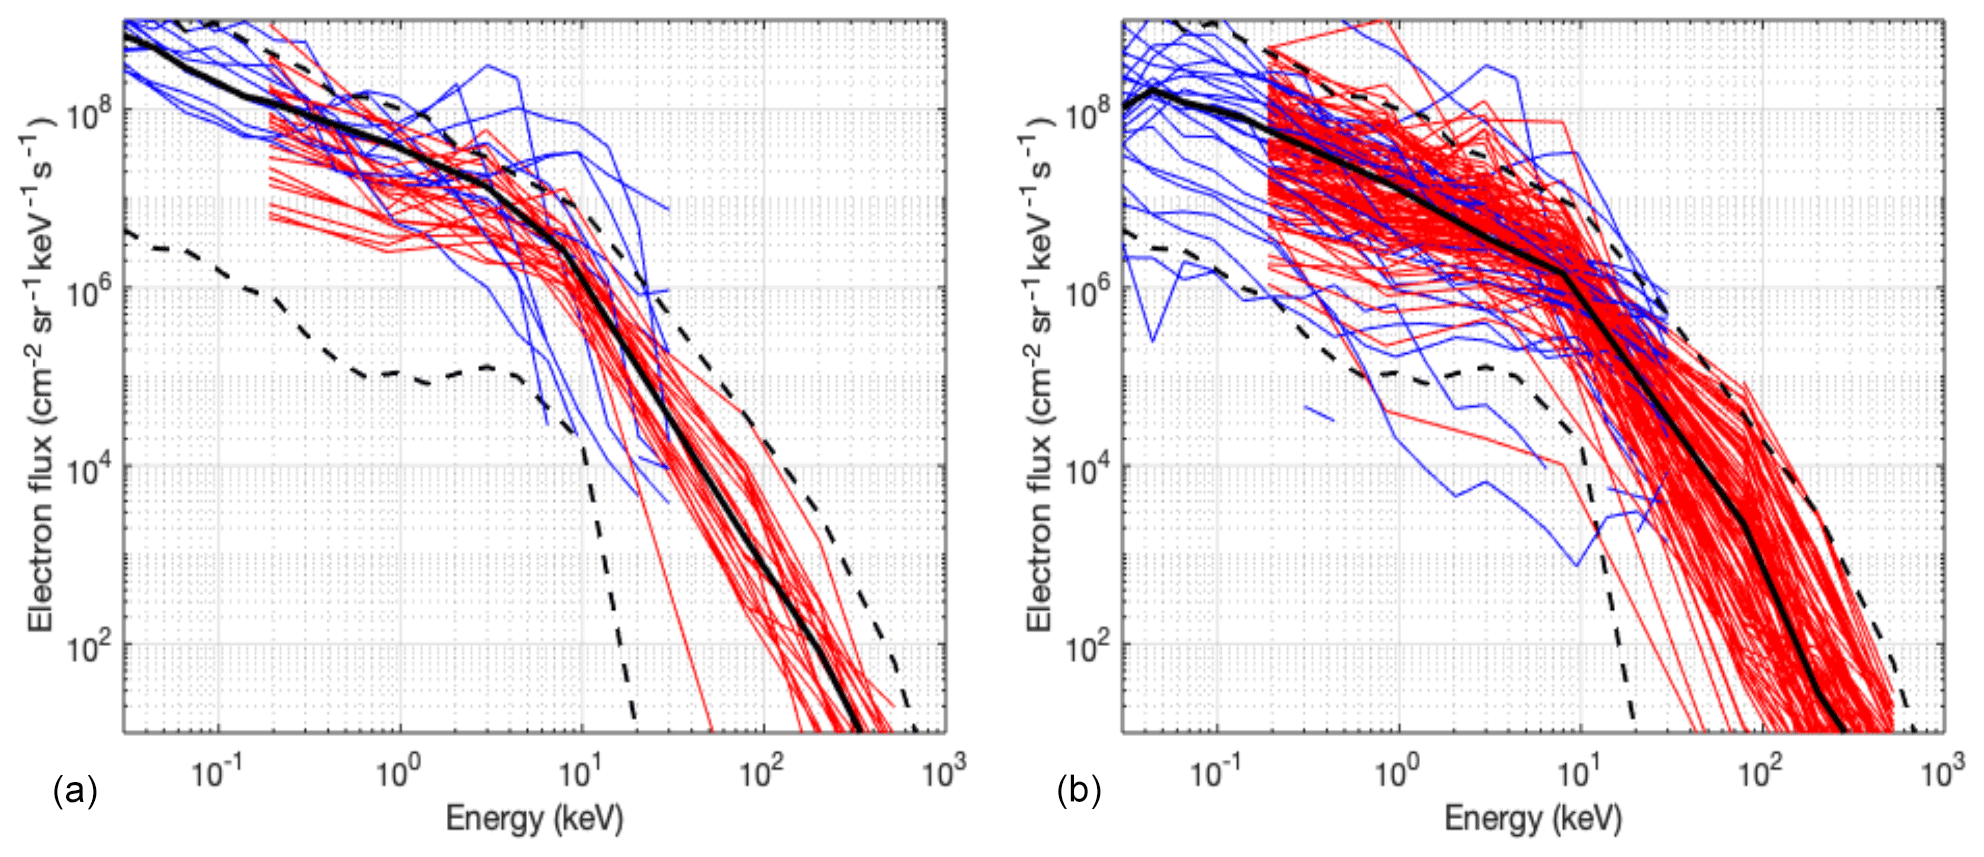
Figure 7Precipitation spectra for expansion phases (a) and recovery phases (b) from overpasses of DMSP (blue) and POES (red) spacecraft. The dashed curves are the upper and lower boundary spectra for pulsating aurora from Tesema et al. (2020), and the solid black curves are the median fluxes of our substorm events.
During the expansion phases (panel a), a majority of the DMSP overpasses (blue) shows enhanced electron fluxes at energies of a few keV. These fluxes are higher than the upper- and lower-envelope curves of the pulsating aurora spectra (black dashed curves) as determined in the statistical study of Tesema et al. (2020). Pulsating aurora (PsA) is a type of diffuse aurora which occurs mainly in the late recovery phases of substorms (Partamies et al., 2017). Expansion-phase fluxes are found at and around the PsA upper boundary up to about 10 keV, while fluxes at higher energies depart from the PsA upper boundary, and the median flux curve (solid black line) resides well inside the PsA band. During the recovery-phase overpasses (panel b), the flux values are much more variable at all energies. The fluxes up to 10 keV are mostly confined between the PsA boundaries, while the fluxes at and around 100 keV cluster in the upper part of the PsA band, close to the PsA upper-envelope curve. Compared to the expansion-phase fluxes, the recovery-phase fluxes at energies below 10 keV are lower by half an order of magnitude, as indicated by the median flux curves (solid black). On the other hand, the fluxes at higher energies are slightly enhanced during the recovery phases as compared to the expansion phases.
Similarly, we compare the precipitation spectra for events with one or two phase pairs to those with five or more phase pairs (spectra not shown). The fluxes at and around 100 keV are about an order of magnitude higher for events with five or more expansion phases than for those with only one to two phase pairs. Furthermore, during the first night of the multi-night events, the median flux at and around 100 keV is lower than during the second night by about half an order of magnitude. These findings are in good agreement with the CNA results described in the previous section.
Isolated, compound, and multi-night substorm events have been analysed with respect to the magnitude of their magnetic disturbance (IL index minimum) and the related cosmic noise absorption (CNA maximum). About 100 substorm events over the course of 6 years were automatically detected and visually classified. The substorm detection algorithm used in this study has provided well-grounded results in earlier large statistical analyses (Juusola et al., 2011; Partamies et al., 2013). Since the IL index threshold value in this method allows the detection of very mild events which do not produce an appreciable CNA enhancement, we have visually pruned the events to exclude all cases with magnetic deflections smaller than 300 nT. We have also required two days with no detected substorms prior to any of the events included in this study. This makes it less likely that there would be a significant high-energy particle storage in the radiation belt region, which could be tapped by a solar wind pressure pulse or another solar wind transient, as the nominal loss time for radiation belt particles with energies of the order of 100 keV is from hours to about a day (Summers et al., 2008). Thus, after two days of no substorm injections the particle storage build-up starts from the quiet magnetospheric conditions. This criterion is different from earlier substorm studies, which mostly require a quiet time of about 3 h prior to isolated substorms. As pointed out by Sandhu et al. (2019), a stronger solar wind driving was often maintained for several days prior to the compound substorm onsets.
It is important to note that most of the studied substorm events are not storm-time substorms, as indicated by the mild median Dst values of about −20 nT. For the multi-night events, which would be the candidates for the strongest magnetic activity, the median solar wind speed was around 530 km s−1. The top 25 % of the events were driven by the wind speed at and above 600 km s−1. Kavanagh et al. (2012) defined a high-speed stream as a period of sustained solar wind speed above 500 km s−1 and concluded that these conditions typically cause a period of multi-day substorm activity and longer-lasting enhancements in CNA. The sequence of 61 substorms (Beharrell et al., 2015), which was shown to lead to a significant mesospheric ozone depletion (Seppälä et al., 2015), took place within a Dst variation between −40 and −10 nT. The activity was driven by a high-speed stream (HSS) with the solar wind speed over 600 km s−1 for about 2.5 d (the driver conditions were not analysed in the paper). This period of high solar wind speed also coincided with the period of the highest substorm rate and the largest ozone depletion. About half of the individual nights during our multi-night events fall into this category of weak magnetic storms driven by the fast solar wind. The bias towards mild geomagnetic activity in our study is likely to be caused by the quiet-time requirement prior to all types of events.
As illustrated by the example events in Figs. 1 and 2, the isolated substorm events are often not only short-lived compared to the other two types, but also limited in their spatial coverage. The localization of the isolated event can be seen in the ASC keogram (panels a), where the auroral emission is limited to about half of the all-sky view (Fig. 1), while during the compound substorm event the auroral emission moves from the northern to southern horizon over the course of the activity. For consistency, we visually investigated the ASC data for all substorm events. About 40 % of the individual nights of substorm activity took place in summertime outside the auroral imaging season. Cloudiness prohibited auroral observations for approximately half of the remaining events. Thus, for about 30 % of the events, ASC data could be examined. This set of events included 10 isolated, 10 compound, and 42 individual nights during multi-night substorm events. Similarly to the sample substorm presented in Fig. 1, the auroral emissions during the rest of the isolated substorms were also found not to occupy the full ASC field of view at any of the Lapland stations. This suggests that in order to reliably use the spacecraft particle precipitation data to construct an average precipitation spectrum for isolated substorm events, the spatial extent should be assessed carefully to exclude overpass time outside the substorm particle precipitation region. The optical emission during the compound substorms was often found to be discontinuous, even though the magnetic disturbances were not interrupted with quiet time or substorm growth phases. The multi-night events were most often associated with a large spatial extent of auroral emission, which filled an individual ASC field of view. In fact, auroral emission in many of these events extended from Lapland to the southern part of the Svalbard archipelago, being observed in the ground-based auroral images there. The inner magnetospheric observations by Sandhu et al. (2019) showed that the energy content in the ring current was azimuthally more localized during isolated than compound substorms, leading to smaller-scale substorms. However, they concluded that the latitude (L-shell) extent of the enhancements varied less, suggesting that the same would apply to the high-energy part of the substorm precipitation. Gjerloev et al. (2007) reported on a full-width half-maximum extent of 3 h in MLT and 4.7∘ in latitude of 116 substorms studied using global auroral images, which is similar in latitude extent but narrower in MLT range than the extent of diffuse aurora (Wing et al., 2013). Thus, it is not clear whether the spatial extents of either the optical auroral emissions or the magnetic disturbances during substorms are a good proxy for the impact area of high-energy particle precipitation. A more direct estimate of the atmospheric impact area could be obtained by determining the spatial extent of the CNA, since this parameter is sensitive specifically to the particle precipitation energies associated with an atmospheric impact. Bland et al. (2020) recently used the Super Dual Auroral Radar Network (SuperDARN, Lester, 2013) to estimate the spatial coverage of the particle precipitation impact area during pulsating aurora by studying the attenuation of 10–12 MHz radio noise in the D-region ionosphere. They found that the atmospheric impact area extended over at least 4∘ of magnetic latitude for 75 % of the PsA events studied, and 36 % of the events extended over at least 12∘ of magnetic latitude. This method could be used to constrain the spacecraft energy spectra measurements to the atmospheric impact area during the substorm expansion and recovery phases, in addition to, or even instead of, the optical auroral data, and hence construct a more realistic description of the substorm precipitation spectrum.
The CNA values during the substorms studied here peaked between 0.5 and 1.0 dB (Fig. 4), which is between the long-term average CNA including the quiet times (CNA mainly below 0.5 dB, Kavanagh et al., 2004) and the absorption values related to geomagnetic storms driven by coronal mass ejection (CME) sub-structures, sheaths, and ejecta (CNA values typically around 1 dB, Kilpua et al., 2020). An earlier study on HSS-driven substorms reported CNA levels of 1–2 dB (Grandin et al., 2017). Thus, CNA values tend to increase with increasing magnetic activity on average. In agreement with the previous studies, we show a linear relationship between the magnetic disturbances and the CNA values (Fig. 3). We also find a similar level of correlation between the two parameters, although we only examine substorm events without including the quiet-time values. Some obvious departures from the linearity, as also pointed out by Kavanagh et al. (2004), were related to the high-/low-activity values. The saturation of the absorption when the IL deflection grows beyond −800 nT leads to poor correlation. Another poorly correlated substorm group is the isolated, less intense, and short-lived events, which do not typically cause strong CNA. Hence, the short lifetime and weak D-region ionization imply that these events will have a minor impact on the atmospheric chemistry. Compound and multi-night substorms will, however, be significant contributors to the direct production and HOX and NOX radicals in the atmosphere, as was already shown by Seppälä et al. (2015). Although some of the nights during multi-night substorm events can have mild IL indices, the corresponding absorption values may still be significant. The atmospheric and climate models currently use Kp and Ap index-based proxies to describe the ionization rates due to energetic electron precipitation (Matthes et al., 2017). As the temporal resolution of these global indices is 3 h, a short-lived (less than 3 h) isolated substorm may only result in a minor magnetic variation with respect to its maximum magnetic deflection in electrojet index data (used in this study), which is available at 1 min resolution. Thus, the current energetic electron precipitation proxies are likely to only describe well the longer-lasting compound and multi-night-type substorm events. Our findings emphasize the atmospheric influence of the compound and multi-night substorm events, which may explain why the global geomagnetic activity indices serve us so well as energetic particle precipitation proxies, despite their poor temporal and spatial resolution.
In total, 70 events included CNA enhancements during the growth phases prior to the onset. These signatures are similar to the growth-phase CNA observations reported by e.g. McKay et al. (2018) and Sergeev et al. (2012). The large majority of events with growth-phase CNA signatures (66 events) were compound or multi-night events. In the case of multi-night substorm events, only three events included a growth-phase CNA enhancement during the first night. Every isolated substorm with a CNA enhancement prior to onset was more intense than the average of −500 nT. This suggests that the growth-phase absorption typically requires magnetospheric preconditioning in the form of prior substorm activity. These CNA values are not counted towards the CNA averages presented here, as we have excluded the growth phases from our analysis. However, the previous studies show that growth-phase CNA enhancements are not always present, their durations are limited to the minutes and tens of minutes prior to onset, and they are confined to a limited latitude region equatorward of the growth-phase arc. They are, therefore, unlikely to sum up to a large global atmospheric impact, in contrast to the expansion and recovery phases.
Our results suggest that the strong CNA and energetic electron precipitation need some “cooking time” to build up the favourable conditions in the inner magnetosphere. This is supported by the finding that the first onset/phase pair (or the first night in multi-night events) is rarely the strongest one. In contrast to the multi-day events discussed by Kavanagh et al. (2012), our multi-night substorm sequences typically do not cause the strongest CNA during the first night of activity, but rather during the second to fourth night. The mildness of the first night in our study probably relates to the 2 d quiet-time requirement prior to the substorm events. The in situ particle data from POES MEPED show a similar delay in the magnetosphere–ionosphere coupled response independently, in that the flux of high-energy (≳100 keV) particle precipitation is lower during the first night of multi-night events than during the later nights of multi-night events. Thus, the cooking time may be required to accelerate electrons in the inner magnetosphere through wave–particle interactions. This conclusion agrees well with earlier observations of the radiation belt dynamics, where a 1–3 d delay was found between the substorm activity and the maximum radiation belt response (Forsyth et al., 2016). As was further discussed by Kilpua et al. (2020), the direct substorm injection into the ionosphere results in less intense precipitation than that driven by wave–particle interaction, which is in effect when the injected electrons drift into the morning sector after the injection. Grandin et al. (2017) also concluded that strong CNA is more likely to occur during a substorm event with a longer duration.
Due to the much longer lifetime of recovery phases, as compared to the expansion phases, we found many more spacecraft overpasses during recovery phases than we did during the expansion phases. However, some basic conclusions can still be drawn from the available particle precipitation spectra. In Fig. 7 we compare the particle precipitation spectra obtained in this study to the flux range constructed for PsA by Tesema et al. (2020). Pulsating aurora, which occurs mainly towards the end of substorm recovery phases and beyond (Partamies et al., 2017), has been associated with high-energy precipitation. This includes significant electron fluxes at energies up to 200 keV (Miyoshi et al., 2015), which cause strong ionization down to the lower D region (∼70 km) and can consequently cause depletion of mesospheric ozone. In our results, the recovery-phase fluxes are essentially PsA fluxes, although they are concentrated in the higher part of the PsA flux band. It was concluded by Tesema et al. (2020) that the low-flux scenario of the PsA spectrum (bottom dashed curve in Fig. 7) did not produce a chemical effect in the neutral D-region atmosphere. It thus remains to be determined how to separate PsA events that cause an atmospheric response from those for which the precipitation is too soft and whether the low-flux boundary of the recovery-phase precipitation would correspond to the threshold for the atmospheric effects to happen. Furthermore, it is important to note that most of the recovery-phase overpasses analysed here take place early in the recovery phases. We therefore speculate that the contribution of PsA to the recovery-phase spectra shown in this study is small. Out of the 25 events covered by both optical and spacecraft data, 5 events showed optical signatures of PsA during the spacecraft overpass. If this is a representative fraction for the whole data set, it should not bias the median spectrum of all recovery-phase overpasses. Another possible bias to the results presented here could be caused by the local time distribution of the spacecraft overpasses, since a precipitation energy increase has been observed in the morning MLT hours (Hosokawa and Ogawa, 2015). According to the results of Tesema et al. (2020), however, this hardening of precipitation only takes place after about 06:30 MLT and is largely due to a decay of softer precipitation. At that late MLT, less than one-fifth of the recovery phases analysed in this study have not come to an end yet. We thus conclude that the MLT distribution of the observations in the current study would not cause a major bias, but the substorm precipitation evolution as a function of MLT should be investigated in the future. Overall the expansion-phase spectra can be better described by the PsA upper-envelope spectrum than its median up to energies of about 10 keV, while the recovery-phase spectra tend to grow higher fluxes at energies above about 10 keV. A larger spacecraft data set needs to be collected in the future to confirm these conclusions.
About 200 nights of substorm activity have been classified into categories of isolated, compound, and multi-night substorm events while requiring a 2 d period of quiet time prior to each event. By comparing intensities of ground-magnetic deflections (local electrojet index) and cosmic radio noise absorption (CNA) measured in the same region, we conclude that the isolated substorm events rarely produce strong ionization in the D-region ionosphere (strong CNA). In addition, we have illustrated that the isolated substorm events have short durations and limited spatial extent as compared to compound and multi-night substorm events.
For multi-night substorm events preceded by magnetically quiet conditions, the CNA intensity typically grows during the first 1–3 nights of the sequence before reaching the maximum D-region impact. Similar conclusions can be drawn from the space-borne measurements of precipitating particles, where the fluxes at high energies (∼100 keV) increase significantly from the first night to the second night of substorm activity. The number of substorm intensifications (particle injections) also increases the high-energy electrons in the precipitating particle population.
As demonstrated by earlier studies, periods of continuous activity with recurring substorms can lead to significant ionization in the lower ionosphere, which in turn causes significant mesospheric ozone depletion. These model results of the mesospheric ozone depletion were associated with a multi-day sequence of tens of substorms, which is far from the average long-term substorm rate of a few per day. We used the CNA observations to estimate the atmospheric effect of the different substorm types and are inclined to conclude that the isolated events may not be important from a long-term perspective. This would explain why the geomagnetic Ap and Kp indices have been good energetic particle precipitation proxies in climate models despite their poor temporal resolution and spatial coverage. A more systematic precipitation spectrum study is required to include/exclude events with certain intensities and lifetimes, but in order to get there, the spatial extent of high-energy precipitation during different substorm types needs to be studied in more detail.
Global geomagnetic activity index data were obtained through the Kyoto World Data Center (http://wdc.kugi.kyoto-u.ac.jp, last access: 12 January 2021), and solar wind data have been downloaded from the OMNIWeb database (https://omniweb.gsfc.nasa.gov, last access: 12 January 2021). DMSP data have been downloaded from the CEDAR madrigal database at http://cedar.openmadrigal.org (last access: 12 January 2021). MIRACLE ASC quicklook data are available at https://space.fmi.fi/MIRACLE/ASC/ (last access: 12 January 2021), and full-resolution image data can be requested from FMI (kirsti.kauristie@fmi.fi).
The event selection and classification were done by EK for his MSc thesis (https://ntnuopen.ntnu.no/ntnu-xmlui/handle/11250/2656642, last access: 12 January 2021). FT provided the pre-processed POES and DMSP data and helped with the analysis. All the authors contributed to the discussion of the results and the writing of the paper.
The authors declare no conflict of interest.
This article is part of the “Special Issue on the joint 19th International EISCAT Symposium and 46th Annual European Meeting on Atmospheric Studies by Optical Methods”. It is a result of the 19th International EISCAT Symposium 2019 and 46th Annual European Meeting on Atmospheric Studies by Optical Methods, Oulu, Finland, 19–23 August 2019.
The work by Noora Partamies, Fasil Tesema and Hilde Nesse Tyssøy is supported by the Norwegian Research Council (NRC) under CoE contract 223252, Erkka Heino and Emma Bland by the NRC under contract number 287427. Noora Partamies, Fasil Tesema and Hilde Nesse Tyssøy further thank the Young CAS (Centre for Advanced Studies) fellow programme. We thank the institutes who maintain the IMAGE Magnetometer Array: Tromsø Geophysical Observatory of UiT, the Arctic University of Norway (Norway), the Finnish Meteorological Institute (Finland), the Institute of Geophysics, Polish Academy of Sciences (Poland), GFZ German Research Centre for Geosciences (Germany), the Geological Survey of Sweden (Sweden), the Swedish Institute of Space Physics (Sweden), Sodankylä Geophysical Observatory of the University of Oulu (Finland), and the Polar Geophysical Institute (Russia). Sodankylä Geophysical Observatory is thanked for the riometer data. We thank Kirsti Kauristie, Sanna Mäkinen, Jyrki Mattanen, Anneli Ketola, and Carl-Fredrik Enell for maintaining the MIRACLE camera network and data flow. We thank NOAA's SWPC and NCEI (formerly NGDC) for the availability of NOAA POES data.
This research has been supported by The Research Council of Norway (grant nos. 287427 and 223252).
This paper was edited by Andrew J. Kavanagh and reviewed by two anonymous referees.
Beharrell, M. J., Honary, F., Rodger, C. J., and Clilverd, M. A.: Substorm-induced energetic electron precipitation: Morphology and prediction, J. Geophys. Res., 120, 2993–3008, https://doi.org/10.1002/2014JA020632, 2015. a, b, c
Bland, E., Tesema, F., and Partamies, N.: D-region impact area of energetic particle precipitation during pulsating aurora, Ann. Geophys. Discuss. [preprint], https://doi.org/10.5194/angeo-2020-58, in review, 2020. a
Borovsky, J. E. and Yakymenko, K.: Substorm occurrence rates, substorm recurrence times and solar wind structure, J. Geophys. Res., 122, 2973–2998, https://doi.org/10.1002/2016JA023625, 2017. a, b, c
Evans, D. S. and Greer, M. S.: Polar Orbiting Environmental Satellite SpaceEnvironment Monitor -2 Instrument Descriptions and Archive Data Documentation, Oar Sed-93, NOAA, available at: ftp://satdat.ngdc.noaa.gov/sem/poes/docs/sem2_docs/2006/SEM2v2.0.pdf (last access: 12 January 2021), 2000. a
Forsyth, C., Rae, I. J., Coxon, J. C., Freeman, M. P., Jackman, C. M., Gjerloev, J., and Fazakerley, A. N.: A new technique for determining Substorm Onsets and Phases from Indices of the Electrojet (SOPHIE), J. Geophys. Res., 120, 10592–10606, https://doi.org/10.1002/2015JA021343, 2015. a, b
Forsyth, C., Rae, I. J., Murphy, K. R., Freeman, M. P., Huang, C.-L., Spence, H. E., Boyd, A. J., Coxon, J. C., Jackman, C. M., Kalmoni, N. M. E., and Watt, C. E. J.: What effect do substorms have on the content of the radiation belts?, J. Geophys. Res., 121, 6292–6306, https://doi.org/10.1002/2016JA022620, 2016. a
Frey, H. U., Mende, S. B., Angelopoulos, V., and Donovan, E. F.: Substorm onset observations by IMAGE-FUV, J. Geophys. Res., 109, A10304, https://doi.org/10.1029/2004JA010607, 2004. a, b
Gjerloev, J. W., Hoffman, R. A., Sigwarth, J. B., and Frank, L. A.: Statistical description of the bulge-type auroral substorm in the far ultraviolet, J. Geophys. Res., 112, A07213, https://doi.org/10.1029/2006JA012189, 2007. a
Grandin, M., Aikio, A. T., Kozlovsky, A., Ulich, T., and Raita, T.: Cosmic radio noise absorption in the high-latitude ionosphere during solar wind high-speed streams, J. Geophys. Res., 122, 5203–5223, https://doi.org/10.1002/2017JA023923, 2017. a, b
Heino, E. and Partamies, N.: Observational Validation of Cutoff Models as Boundaries of Solar Proton Event Impact Area, J. Geophys. Res., 125, e2020JA027935, https://doi.org/10.1029/2020JA027935, 2020. a
Hosokawa, K. and Ogawa, Y.: Ionospheric variation during pulsating aurora, J. Geophys. Res.-Space, 120, 5943–5957, https://doi.org/10.1002/2015JA021401, 2015. a
Juusola, L., Østgaard, N., Tanskanen, E., Partamies, N., and Snekvik, K.: Earthward plasma sheet flows during substorm phases, J. Geophys. Res., 116, A10228, https://doi.org/10.1029/2011JA016852, 2011. a, b, c, d
Kauristie, K., Pulkkinen, T. I., Pellinen, R. J., and Opgenoorth, H. J.: What can we tell about global auroral-electrojet activity from a single meridional magnetometer chain?, Ann. Geophys., 14, 1177–1185, https://doi.org/10.1007/s00585-996-1177-1, 1996. a
Kasahara, S., Miyoshi, Y., Yokota, S., Mitani, T., Kasahara, Y., Matsuda, S., Kumamoto, A., Matsuoka, A., Kazama, Y., Frey, H. U., Angelopoulos, V., Kurita, S., Keika, K., Seki, K., and Shinohara, I.: Pulsating aurora from electron scattering by chorus waves, Nature, 554, 337–340, https://doi.org/10.1038/nature25505, 2018.
Kavanagh, A. J., Kosch, M. J., Honary, F., Senior, A., Marple, S. R., Woodfield, E. E., and McCrea, I. W.: The statistical dependence of auroral absorption on geomagnetic and solar wind parameters, Ann. Geophys., 22, 877-887, https://doi.org/10.5194/angeo-22-877-2004, 2004. a, b, c, d
Kavanagh, A. J., Honary, F., Donovan, E. F., Ulich, T., and Denton, M. H.: Key features of >30 keV electron precipitation during high speed solar wind streams: A superposed epoch analysis, J. Geophys. Res., 117, A00L09, https://doi.org/10.1029/2011JA017320, 2012. a, b
Kilpua, E., Juusola, L., Grandin, M., Kero, A., Dubyagin, S., Partamies, N., Osmane, A., George, H., Kalliokoski, M., Raita, T., Asikainen, T., and Palmroth, M.: Cosmic noise absorption signature of particle precipitation during interplanetary coronal mass ejection sheaths and ejecta, Ann. Geophys., 38, 557–574, https://doi.org/10.5194/angeo-38-557-2020, 2020. a, b
Lester, M.: The Super Dual Auroral Radar Network (SuperDARN): An overview of its development and science, Adv. Polar Sci., 24, 1–11, 2013. a
Liou, K., Newell, P., Zhang, Y. L., and Paxton, L.: Statistical comparison of isolated and non-isolated auroral substorms, J. Geophys. Res., 118, 2466–2477, https://doi.org/10.1002/jgra.50218, 2013. a, b
Matthes, K., Funke, B., Andersson, M. E., Barnard, L., Beer, J., Charbonneau, P., Clilverd, M. A., Dudok de Wit, T., Haberreiter, M., Hendry, A., Jackman, C. H., Kretzschmar, M., Kruschke, T., Kunze, M., Langematz, U., Marsh, D. R., Maycock, A. C., Misios, S., Rodger, C. J., Scaife, A. A., Seppälä, A., Shangguan, M., Sinnhuber, M., Tourpali, K., Usoskin, I., van de Kamp, M., Verronen, P. T., and Versick, S.: Solar forcing for CMIP6 (v3.2), Geosci. Model Dev., 10, 2247–2302, https://doi.org/10.5194/gmd-10-2247-2017, 2017. a
McKay, D., Partamies, N., and Vierinen, J.: Pulsating aurora and cosmic noise absorption associated with growth-phase arcs, Ann. Geophys., 36, 59–69, https://doi.org/10.5194/angeo-36-59-2018, 2018. a
Miyoshi, Y., Oyama, S., Saito, S., Kurita, S., Fujiwara, H., Kataoka, R., Ebihara, Y., Kletzing, C., Reeves, G., Santolik, O., Clilverd, M., Rodger, C. J., Turunen, E., and Tsuchiya, F.: Energetic electron precipitation associated with pulsating aurora: EISCAT and Van Allen Probe observations. J. Geophys. Res., 120, 2754–2766, https://doi.org/10.1002/2014JA020690, 2015. a
Nesse Tyssøy, H., Sandanger, M. I., Ødegaard, L.-K. G., Stadsnes, J., Aasnes, A., and Zawedde, A. E.: Energetic electron precipitation into the middle atmosphere – Constructing the loss cone fluxes from MEPED POES, J. Geophys. Res., 121, 5693–5707, https://doi.org/10.1002/2016JA022752, 2016. a
Newell, P. T., and Gjerloev, J. W.: Substorm and magnetosphere characteristic scales inferred from the SuperMAG auroral electrojet indices, J. Geophys. Res., 116, A12232, https://doi.org/10.1029/2011JA016936, 2011. a, b, c
Nishimura, Y., Lessard, M. R., Katoh, Y., Miyoshi, Y., Grono, E., Partamies, N., Sivadas, N., Hosokawa, K., Fukizawa, M., Samara, M., Michell, R. G., Kataoka, R., Sakanoi, T., Whiter, D. K., Oyama, S.-I., Ogawa, Y., and Kurita, S.: Diffuse and Pulsating Aurora, Space Sci. Rev., 216, 4, https://doi.org/10.1007/s11214-019-0629-3, 2020. a
Ødegaard, L.-K. G., Nesse Tyssøy, H., Søraas, F., Stadsnes, J., and Sandanger, M. I.: Energetic electron precipitation in weak to moderate corotating interaction region-driven storms, J. Geophys. Res., 122, 2900–2921, https://doi.org/10.1002/2016JA023096, 2017. a
Partamies, N., Juusola, L., Tanskanen, E., and Kauristie, K.: Statistical properties of substorms during different storm and solar cycle phases, Ann. Geophys., 31, 349–358, https://doi.org/10.5194/angeo-31-349-2013, 2013. a, b
Partamies, N., Whiter, D., Syrjäsuo, M., and Kauristie, K.: Solar cycle and diurnal evolution of auroral structures, J. Geophys. Res., 119, 8448–8461, https://doi.org/10.1002/2013JA019631, 2014.
Partamies N., Juusola, L., Whiter, D., and Kauristie, K.: Substorm evolution of auroral structures, J. Geophys. Res., 120, 5958–5972, https://doi.org/10.1002/2015JA021217, 2015. a, b, c
Partamies, N., Whiter, D., Kadokura, A., Kauristie, K., Nesse Tyssøy, H., Massetti, S., Stauning, P., and Raita, T.: Occurrence and average behavior of pulsating aurora, J. Geophys. Res., 122, 5606–5618, https://doi.org/10.1002/2017JA024039, 2017. a, b
Redmon, R. J., Denig, W. F., Kilcommons, L. M., and Knipp, D. J.: New DMSP database of precipitating auroral electrons and ions, J. Geophys. Res., 122, 9056–9067, https://doi.org/10.1002/2016JA023339, 2017. a
Ripoll, J.-F., Claudepierre, S. G., Ukhorskiy, A. Y., Colpitts, C., Li, X., Fennell, J., and Crabtree, C.: Particle Dynamics in the Earth's Radiation Belts: Review of Current Research and Open Questions, J. Geophys. Res., 125, e2019JA026735, https://doi.org/10.1029/2019JA026735, 2020. a
Rodger, C. J., Cresswell-Moorcock, K., and Clilverd, M. A.: Nature's Grand Experiment: Linkage between magnetospheric convection and the radiation belts, J. Geophys. Res., 121, 171–189, https://doi.org/10.1002/2015JA021537, 2016. a
Sandhu, J., Rae, I., Freeman, M., Gkioulidou, M., C., F., Reeves, G., Murphy, K., and Walach, M. T.: Substorms – ring current coupling: A comparison of isolated and compound substorms. J. Geophys. Res., 124, 6776–6791, https://doi.org/10.1029/2019JA026766, 2019. a, b, c, d
Sangalli, L., Partamies, N., Syrjäsuo, M., Enell, C.-F., Kauristie, K., and Mäkinen, S.: Performance study of the new EMCCD-based all-sky cameras for auroral imaging, Int. J. Remote Sens., 32, 2987–3003, https://doi.org/10.1080/01431161.2010.541505, 2011. a
Seppälä, A., Clilverd, M. A., Beharrell, M. J., Rodger, C. J., Verronen, P. T., Andersson, M. E. and Newnham, D. A.: Substorm-induced energetic electron precipitation: Impact on atmospheric chemistry, Geophys. Res. Lett., 42, 8172–8176, https://doi.org/10.1002/2015GL065523, 2015. a, b, c
Sergeev, V., Nishimura, Y., Kubyshkina, M., Angelopoulos, V., Nakamura, R., and Singer, H.: Magnetospheric location of the equatorward prebreakup arc, J. Geophys. Res., 117, A01212, https://doi.org/10.1029/2011JA017154, 2012. a
Spanswick, E., Donovan, E., Friedel, R., and Korth, A.: Ground based identification of dispersionless electron injections, Geophys. Res. Lett., 34, L03101, https://doi.org/10.1029/2006GL028329, 2007. a
Summers, D., Ni, B., Meredith, N. P., Horne, R. B., Thorne, R. M., Moldwin, M. B., and Anderson, R. R.: Electron scattering by whistler-mode ELF hiss in plasmaspheric plumes, J. Geophys. Res., 113, A04219, https://doi.org/10.1029/2007JA012678, 2008. a
Tanskanen, E. I.: A comprehensive high-throughput analysis of substorms observed by IMAGE magnetometer network: Years 1993–2003 examined, J. Geophys. Res., 114, A05204, https://doi.org/10.1029/2008JA013682, 2009. a, b
Tesema, F., Partamies, N., Nesse Tyssøy, H., Kero, A., and Smith-Johnsen, C.: Observations of electron precipitation during pulsating aurora and its chemical impact, J. Geophys. Res., 125, e2019JA027713, https://doi.org/10.1029/2019JA027713, 2020. a, b, c, d, e, f, g, h
Turunen, E., Verronen, P. T., Seppälä, A., Rodger, C. J., Clilverd, M. A., Tamminen, J., Enell, C.-F., and Ulich, T.: Impact of different energies of precipitating particles on NOX generation in the middle and upper atmosphere during geomagnetic storms, J. Atmos. Sol.-Terr. Phy., 71, 1176–1189, https://doi.org/10.1016/j.jastp.2008.07.005, 2009. a, b
von Clarmann, T., Funke, B., López-Puertas, M., Kellmann, S., Linden, A., Stiller, G. P., Jackman, C. H., and Harvey, V. L.: The solar proton events in 2012 as observed by MIPAS, Geophys. Res. Lett., 40, 2339–2343, https://doi.org/10.1002/grl.50119, 2013. a
Wing, S., Gkioulidou, M., Johnson, J., Newell, P. T., and Wang, C.: Auroral particle precipitation characterized by the substorm cycle, J. Geophys. Res., 118, 1022–1039, https://doi.org/10.1002/jgra.50160, 2013. a, b