the Creative Commons Attribution 4.0 License.
the Creative Commons Attribution 4.0 License.
 | 07 May 2021
Atmospheric drag effects on modelled low Earth orbit (LEO) satellites during the July 2000 Bastille Day event in contrast to an interval of geomagnetically quiet conditions
William Denig
Sandip K. Chakrabarti
Muyiwa P. Ajakaiye
Johnson Fatokun
Adeniyi W. Akanni
Jean-Pierre Raulin
Emilia Correia
John E. Enoh
Paul I. Anekwe
In this work, we simulated the atmospheric drag effect on two model SmallSats (small satellites) in low Earth orbit (LEO) with different ballistic coefficients during 1-month intervals of solar–geomagnetic quiet and perturbed conditions. The goal of this effort was to quantify how solar–geomagnetic activity influences atmospheric drag and perturbs satellite orbits, with particular emphasis on the Bastille Day event. Atmospheric drag compromises satellite operations due to increased ephemeris errors, attitude positional uncertainties and premature satellite re-entry. During a 1-month interval of generally quiescent solar–geomagnetic activity (July 2006), the decay in altitude (h) was a modest 0.53 km (0.66 km) for the satellite with the smaller (larger) ballistic coefficient of m2 kg−1 ( m2 kg−1). The associated orbital decay rates (ODRs) during this quiet interval ranged from 13 to 23 m per day (from 16 to 29 m per day). For the disturbed interval of July 2000 the significantly increased altitude loss and range of ODRs were 2.77 km (3.09 km) and 65 to 120 m per day (78 to 142 m per day), respectively. Within the two periods, more detailed analyses over 12 d intervals of extremely quiet and disturbed conditions revealed respective orbital decays of 0.16 km (0.20 km) and 1.14 km (1.27 km) for the satellite with the smaller (larger) ballistic coefficient. In essence, the model results show that there was a 6- to 7-fold increase in the deleterious impacts of satellite drag between the quiet and disturbed periods. We also estimated the enhanced atmospheric drag effect on the satellites' parameters caused by the July 2000 Bastille Day event (in contrast to the interval of geomagnetically quiet conditions). The additional percentage increase, due to the Bastille Day event, to the monthly mean values of h and ODR are 34.69 % and 50.13 % for Sat-A and 36.45 % and 68.95 % for Sat-B. These simulations confirmed (i) the dependence of atmospheric drag force on a satellite's ballistic coefficient, and (ii) that increased solar–geomagnetic activity substantially raises the degrading effect of satellite drag. In addition, the results indicate that the impact of short-duration geomagnetic transients (such as the Bastille Day storm) can have a further deleterious effect on normal satellite operations. Thus, this work increases the visibility and contributes to the scientific knowledge surrounding the Bastille Day event and also motivates the introduction of new indices used to describe and estimate the atmospheric drag effect when comparing regimes of varying solar–geomagnetic activity. We suggest that a model of satellite drag, when combined with a high-fidelity atmospheric specification as was done here, can lead to improved satellite ephemeris estimates.
- Article
(3229 KB) - Full-text XML
- BibTeX
- EndNote


Atmospheric drag describes the force exerted on an object moving through the atmospheric medium. The orientation of the drag force is in the reverse direction of relative motion, with the resulting effect of impeding the motion of the object. Spacecraft moving through the atmosphere experience the atmospheric drag force, which expends energy at the expense of the orbital motion (Wertz and Larson, 1999; Chobotov, 2002; Nwankwo, 2016). Atmospheric drag is the largest force affecting the motion of satellites in low Earth orbit (LEO), especially at altitudes below 800 km (Nwankwo et al., 2015), and, to a lesser extent, the off-centre gravitational pull due to Earth's equatorial bulge, known as the Earth's oblateness (Chobotov, 2002; Nwankwo and Chakrabarti, 2015). Space weather enhances atmospheric drag on satellites in LEO, and the resultant impact can be profound (Nwankwo, 2016). Extreme space weather can cause satellite orbits to unexpectedly degrade, making it more difficult to manoeuvre spacecraft and to identify and track satellites and other space debris (Nwankwo et al., 2015 and references therein). Another detrimental impact of enhanced satellite drag is the unplanned loss of otherwise healthy spacecraft due to premature atmospheric re-entry. Under this scenario, a satellite would gradually decay from orbit (losing altitude) and would re-enter the Earth's lower atmosphere, unless appropriate orbit-raising manoeuvres were implemented. Examples of spacecraft that prematurely re-entered the atmosphere include Skylab (launched 14 May 1973; re-entered 11 July 1979) and the Russian Radar Ocean Reconnaissance Satellites (RORSATs), namely Kosmos-954 (launched 18 September 1977; re-entered 24 January 1978) and Kosmos-1402 (launched 30 August 1982; re-entered 7 February 1983) (Nwankwo, 2016).
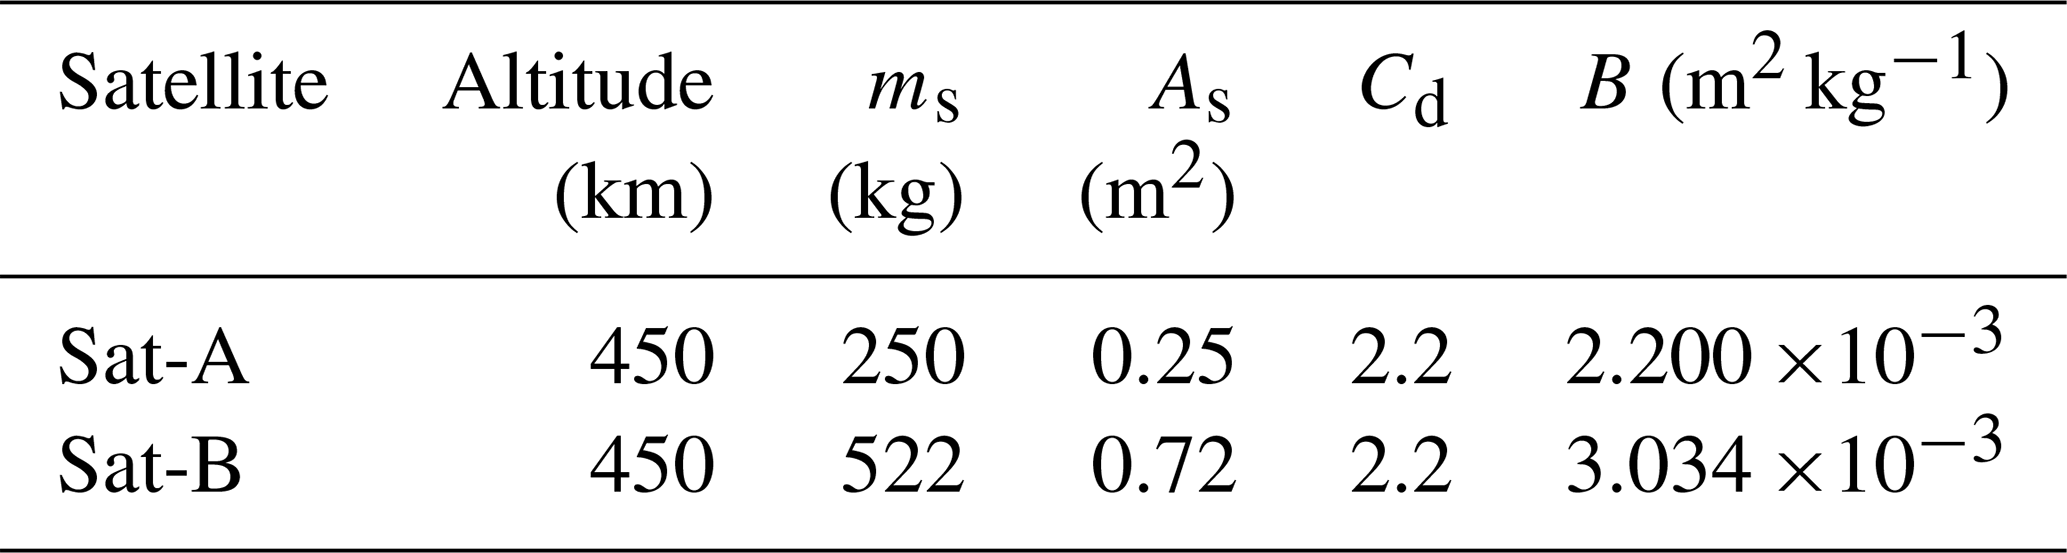
The orbital lifetime of a LEO satellite is subjected to the integrated atmospheric drag force experienced by the satellite over time. The drag or negative acceleration, fd, (in units of m s−2) experienced by the satellite is given as , where ρ (in units of kg m−3) is the altitude-dependent atmospheric density, and vs (in units of m s−1) is the satellite velocity (King-Hele, 1987). A simplified version of a satellite's ballistic coefficient, B (in units of m2 kg−1), is given as , where Cd is the unitless atmospheric drag coefficient, As (in units of m2) is the satellite's projected area in the direction of motion, and ms (in units of kilograms) is the satellite mass (Bowman, 2002; Bhatnagar et al., 2005). For altitudes representative of most LEO satellites, being between 140 to 400–600 km, a constant drag coefficient, Cd, of 2.2 is appropriate (Cooke, 1965). A drag force, F (in units of kg m s−2), acting in opposition to the satellite's motion, is given as . In this work, we model changes in the orbital decay rate (ODR; in units of metres per day) and the monthly mean orbital decay (in units of kilometres) experienced by two satellites having different ballistic coefficients, B, under different solar–geomagnetic conditions (Nwankwo et al., 2020a).
Solar activity describes changes in the overall energy and mass output from the Sun, consisting of both long-term trends within the 11-year solar cycle (longer term changes are beyond the scope of this effort) and transient events of increased solar output. Electromagnetic radiation (light) is continuously emitted from the Sun across a broad spectral range, from energetic gamma rays to radio waves (Eddy, 2009). Also emitted from the Sun are the streams of electrons and protons which comprise the background solar wind and impulsive fluxes of energetic charged particles contained in solar energetic particle (SEP) events (Parker, 1958; Ryan et al., 2000). Charged particle gases from the Sun are classified as high-beta plasmas within which the remnants of solar magnetic fields are transported towards Earth and can interact with the geomagnetic field. The transported field is referred to as the interplanetary magnetic field (IMF), and the orientation of this field relative to Earth has a controlling effect on the degree of coupling of the solar wind and/or the transient streams with the magnetosphere; that is, the Earth's outer magnetic shielding layer that acts to protect the terrestrial biosphere from interplanetary energetic charged particles (Schatten, 1971; Yermolaev et al., 2018). However, as the solar streams, with their embedded magnetic fields, impact the magnetosphere, they can enhance geomagnetic activity, which, in turn, can have a significant effect on the coupled magnetosphere–ionosphere–thermosphere (MIT) system. For example, within interplanetary space, a solar high-speed stream (HSS) can overtake a preceding low-speed stream (LSS), thus forming a dense corotating interaction region (CIR; Gosling and Pizzo, 1999) that can profoundly increase the level of geomagnetic activity. The Sun also periodically releases large-scale clouds of plasma in the form of coronal mass ejections (CMEs), which, when propagated into interplanetary space, are termed interplanetary CMEs (ICMEs; Gosling et al., 1990). When directed towards Earth, CIRs and ICMEs can initiate geomagnetic storms, resulting in large-scale perturbations of the MIT system lasting up to several days (Borovsky and Denton, 2006). Flares represent another class of transient solar phenomena which can affect the MIT system. A solar flare is a large-scale (on solar dimensions) reconfiguration of the photospheric magnetic field, resulting in the impulsive release of vast amounts of energy and a redistribution of solar mass (Philips, 1991). Electromagnetic radiation and extremely energetic (relativistic) particles released during a solar flare event can result in an abrupt increase in the ionospheric density near the subsolar point and within the high-latitude polar caps (Sauer and Wilkinson, 2008). A sudden ionospheric disturbance (SID) is the result of the increased solar ultraviolet (UV) and X-ray radiative flux released in solar flares (Mitra, 1974), whereas a polar cap absorption (PCA) event is the result of energetic particles entering the atmosphere along open magnetic field lines which connect to interplanetary space (Rose and Ziauddin, 1962).
The systematic monitoring of sunspots over the last 2 centuries has shown that solar activity exhibits an approximate 11-year temporal cycle during which the observed sunspot number (SSN; Clette et al., 2014) varies from a local solar minimum near zero; that is, where no spots are observed, to a solar maximum of up to several hundred spots being visible on the solar disc. Near solar maximum, the total radiant energy from the Sun reaches a corresponding peak along with a propensity for short-lived solar transients of increased radiation and particle emissions. These solar transients are the main drivers of space weather (Song et al., 2001; Knipp, 2011). Figure 1 illustrates this cyclic variation in the monthly averaged SSN, along with the related solar–geophysical indices for the solar radio flux (F10.7) and the geomagnetic Ap. The F10.7 index (Tapping, 2013) is a local noontime measurement of the solar radio flux at a wavelength of 10.7 cm, corresponding to a radio wave frequency of 1400 MHz. The F10.7 index is often used as a proxy for upper atmospheric heating from solar extreme ultraviolet (EUV) radiation. The F10.7 index is given in solar flux units (sfu's; 1 sfu is equal to 10−22 W m−2 Hz−1) and typically ranges from <50 sfu at solar minimum to >300 sfu at solar maximum. The daily Ap index (Rostoker, 1972) is derived from the 3 h Kp index, from which an additional Joule heating effect associated with geomagnetic activity can be estimated. The Ap index is provided in units of nanoTesla (nT) and typically ranges from ∼5 nT (solar minimum) to ∼40 nT (solar maximum). Near the time of solar maximum, the increased frequency of solar transients, i.e. flares and CMEs, can lead to increased geomagnetic activity. As energy inputs to the MIT system, the increased solar radiation and enhanced geomagnetic activity heat the thermosphere and cause the atmosphere to diffuse outward from lower altitude regions of higher neutral gas pressures (densities) to the more tenuous upper atmosphere. The consequential increase in atmospheric drag associated with a more dense atmosphere affects the motion of a LEO satellite and expends energy at the expense of the orbit. The monthly smoothed values for F10.7 and Ap, as plotted in Fig. 1, tend to obscure the effects of solar events and geomagnetic transients. The impacts of increased solar–geomagnetic activity on the atmosphere and, in turn, the atmospheric drag are discussed in Nwankwo et al. (2015) and references therein.
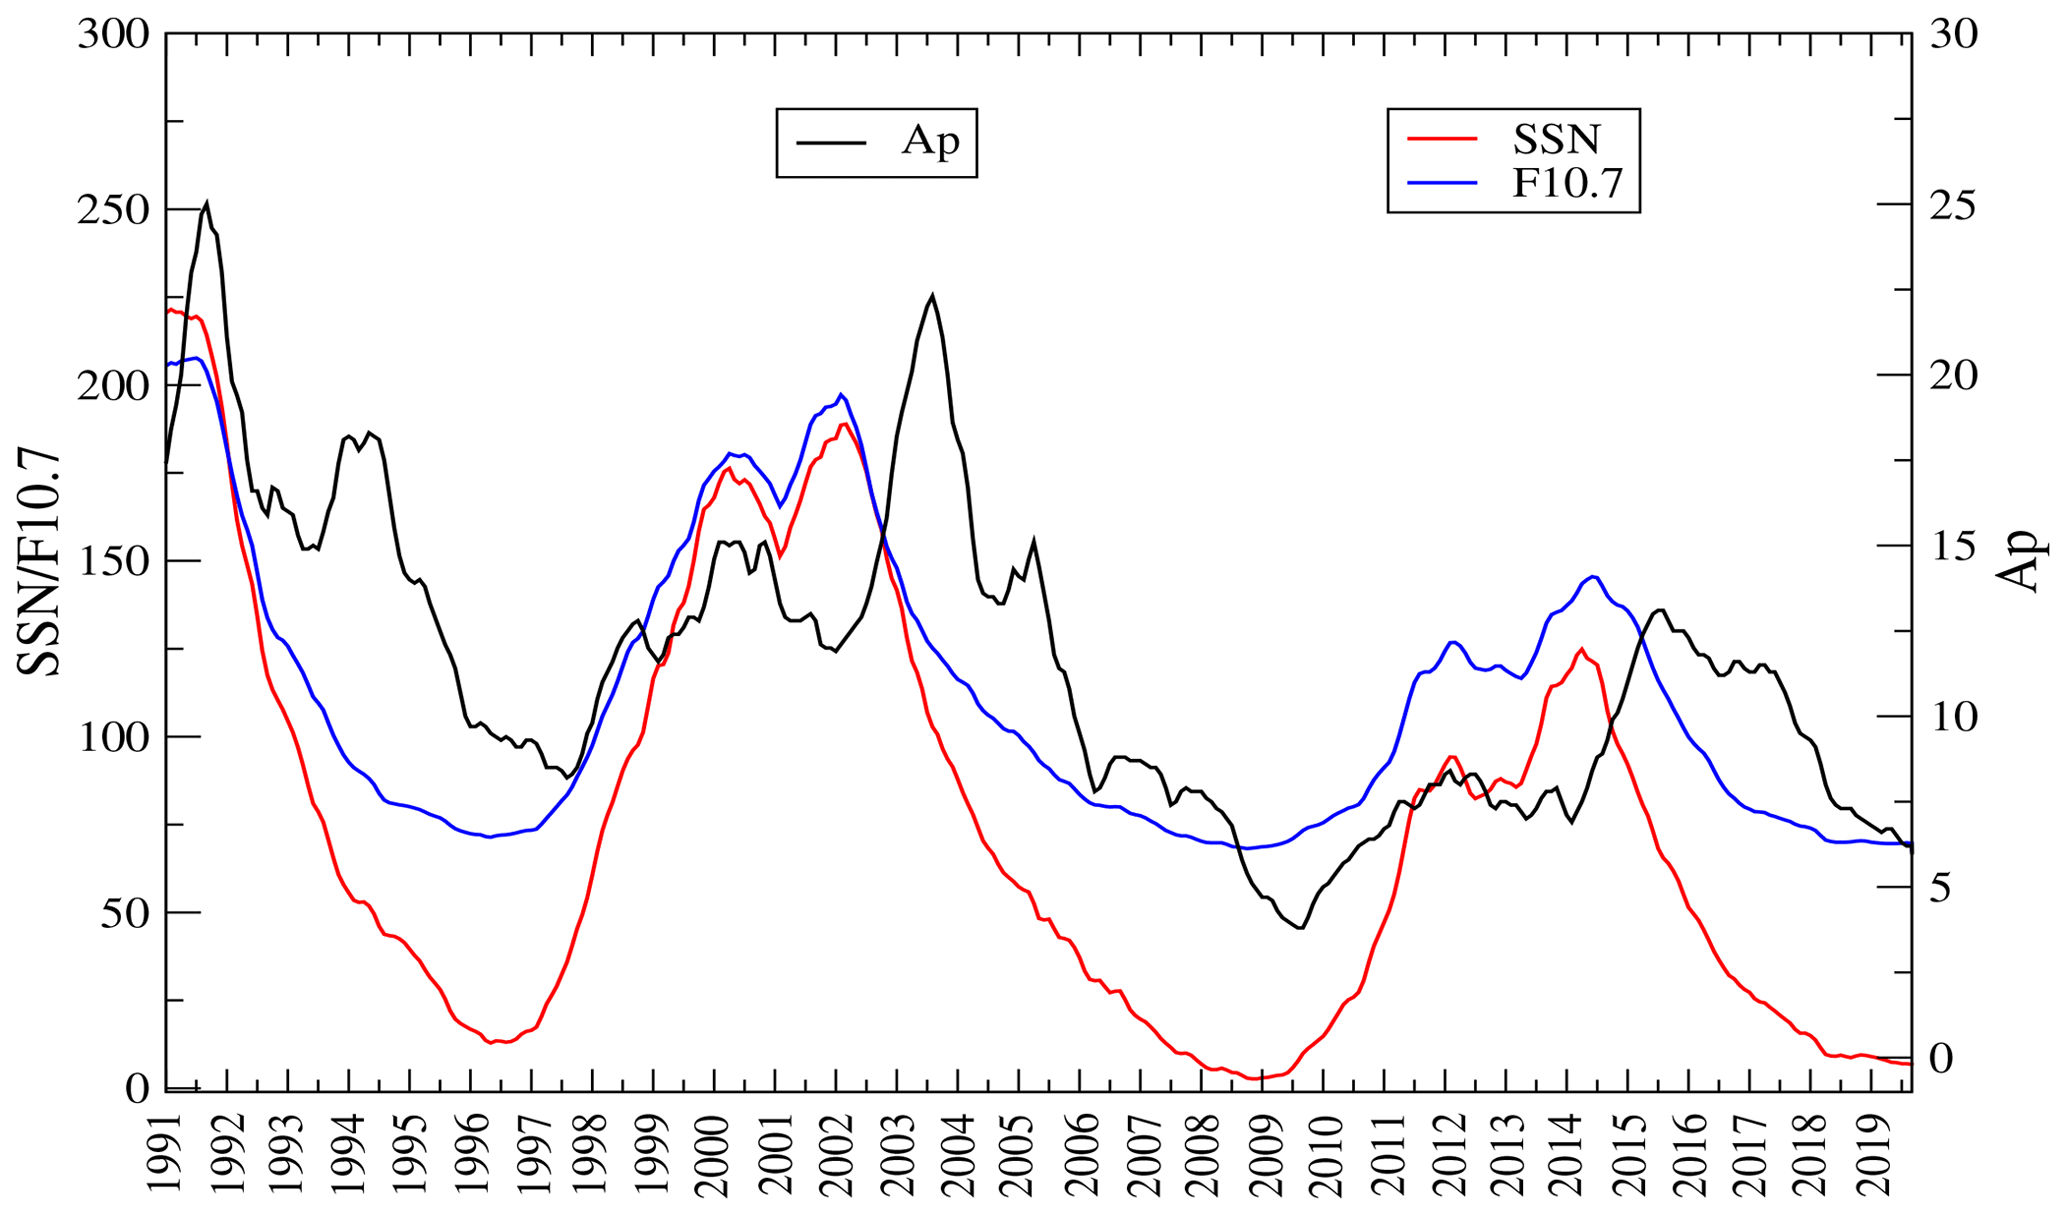
Figure 1Monthly smoothed values of archived sunspot number (SSN), radio solar flux (F10.7) and geomagnetic Ap from January 1991–March 2020 (updated predicted data in Nwankwo and Chakrabarti, 2013 with actual data).
2.1 Relevance of the study and its application
Rapid variations in the local thermospheric density increase the risk of satellite collisions due to larger error margins in spacecraft positioning and motion. In 2009, a Russian satellite in orbit (Kosmos 2251) collided with a United States communications satellite (Iridium 33) at an altitude of about 800 km (Jakhu, 2009; Kelso, 2009). Kosmos 2251 was a defunct satellite in orbit, whereas Iridium 33 was an operational satellite providing telecommunication services, when the accident occurred. In addition to the total destruction of the satellites, this hyper-velocity collision resulted in a large increase in the amount of small, but still potentially lethal, space debris. Assessing atmospheric-drag-associated risk is imperative, due to the increasing number of both active and expired space missions combined with a less than fully specified debris field (Ian McCrea, personal communication, 2018). For example, the planned launch of new capabilities, such as SpaceX's Starlink mega-constellation, makes this subject increasingly germane to satellite operators and stakeholders. Space agencies acknowledge the potential threat posed by solar–geomagnetic activity in modulating satellite trajectories and are making strides towards addressing the issue. For example, the European Space Agency (ESA) is currently assessing space-weather-related risks within the framework of its Space Situational Awareness (SSA) programme (Bobrinsky and Del Monte, 2010). An important mitigation approach (among others) for safeguarding satellite operations is the development and implementation of models that can mimic (and assess) the impact of space weather on LEO satellites (Nwankwo et al., 2020b). Accordingly, this work is of practical importance as the resulting model and simulation support efforts to increase SSA and improve collision risk mitigation.
It has been recommended that mitigation efforts be more robust for the solar maximum phase because the rate of impact is higher during this regime (e.g. Nwankwo et al., 2020b). Sudden severe solar energetic transients (SSETs) that can produce huge impact are highly probable during solar maximum. One example of such an SSET is the great geomagnetic storm of 13–14 March 1989. The event caused an increase in atmospheric drag for satellites and orbital debris in LEO, leading to temporal loss of about 2500 space objects being monitored by tracking systems (Boteler, 2019, and references therein). Another SSET is the Bastille Day event of 14–16 July 2000 during which anomalies (or disruptions) on several satellites were reported (Watari et al., 2001). The Bastille Day great geomagnetic storm (and associated phenomena) generated great interest among the scientific community due to its space weather consequences (e.g. Watari et al., 2001; Raeder et al., 2001; Webber et al., 2002). Efforts directed towards assessing, monitoring, modelling and/or prediction of the impacts associated with SSET are key to mitigating the potential threat posed by such events in future occurrence. In the light of these, the present work will increase the visibility and better contribute to the scientific body of knowledge surrounding the Bastille Day event (particularly on the impact of atmospheric drag). The current paper also contains extensive details of and/or reviews on solar (and geomagnetic) activity and its implications for atmospheric drag (modulating satellites trajectories) against a properly referenced background of existing work and, therefore, doubles as a review paper.
2.2 Data, method and scope of the study
In this work, we present model of LEO satellite trajectories during intervals of disturbed and quiet solar–geomagnetic conditions, applied to two satellites with different ballistic coefficients, as detailed in Table 1. Sat-A and Sat-B represent typical SmallSats of mass, ms, and projected area, As. It is important to note that the As for operational satellites might be known but not so easy to calculate. For high-precision studies, the satellite's attitude determination is employed for its calculation (e.g. Ben-Yaacov et al., 2015). The selected real-world intervals were chosen based of a review of the environmental parameters that describe solar–geomagnetic activity, including the solar wind speed (Vsw) and proton density (PD), the disturbance storm time (Dst) index (Mayaud, 1980), the IMF By and Bz components and the auroral electrojet (AE) index (Davis and Sugiura, 1966). The interplanetary parameters (Vsw, PD and IMF By and Bz) and the geomagnetic responses in Dst and AE are reflective of the processes by which energy is transferred from the solar wind to the MIT system (Nwankwo, 2016, and references therein). Model runs of the atmospheric density profile were made for the quiet environmental interval of July 2006 and for the disturbed conditions of July 2000. Within the disturbed interval, we also estimate the enhanced atmospheric drag effect on the satellites' parameters caused by the Bastille Day event during 14–16 July 2000. In particular, we simulate the mean altitude decay (h) and the orbit decay rates (ODRs) of the satellites during the regimes.
2.3 Quiet environmental conditions near solar minimum (1–31 July 2006)
Solar cycle 23 was on its descending phase in 2006, heading towards a solar minimum, which occurred in December 2008. Solar minimum is usually accompanied by a reduction in both solar radiant emissions and the frequency of solar transient events. The monthly averages of F10.7 and Ap for July 2006 were 78.4 sfu and 6.5 nT, respectively. Figure 2 is a plot of the 1 h averaged variations in Vsw, PD, Dst, IMF By and Bz and AE for July 2006. The most notable feature, or lack thereof, was the essentially flat Dst index throughout the month that is indicative of no significant geomagnetic storms. However, there were a number of interesting features related to the state of the solar–terrestrial environment. In particular, we note the character of the background solar wind speed, Vsw, and density, PD, on 4 July, which is indicative of a pressure build-up on the nose of the magnetopause. These data are suggestive of a CIR that was not particularly well coupled to the magnetosphere, due to a non-favourable IMF Bz (Pokhotelov et al., 2009). Supporting evidence of a CIR was the simultaneous detection of an increased flux of energetic protons (data not included here) observed just inside the magnetopause by the Geostationary Operational Environmental Satellite (GOES; Posner et al., 1999). Similar CIR-like features in Fig. 2 were the interplanetary parameters for 28 and 31 July, although their strengths were apparently less intense than the feature observed earlier in the month. We suspect that the sources for these CIRs were high-stream flows originating from within solar coronal holes (CHs). A review of solar imagery (data not included here) available from the Extreme ultraviolet Imaging Telescope (EIT) on the Solar and Heliospheric Observatory (SOHO) satellite revealed that there was a distinctly visible CH that crossed the solar disc in early July. This CH may well have been the source of a high-stream flow that resulted in the detected CIR on 4 July. During the middle of the month, no CHs were apparent except for a stationary, non-geoeffective, polar CH in the northern solar hemisphere. However, later in the month, several CHs could be seen on the solar disc, which might have been the sources for the solar wind features detected on 28 and 31 July. The final characteristic of interest in Fig. 2 was the periodic geomagnetic activity observed in the AE substorm index, which was suggestive of high-intensity, long-duration, continuous AE activity (HILDCAA). To this end, Guarnieri et al. (2006) noted that HILDCAA events can often be associated with CIRs, particularly on the downside of the solar cycle, as was the case here. The atmospheric drag effects modelled for this solar minimum interval of relative quiet will be compared and contrasted to the disturbed period of July 2000.
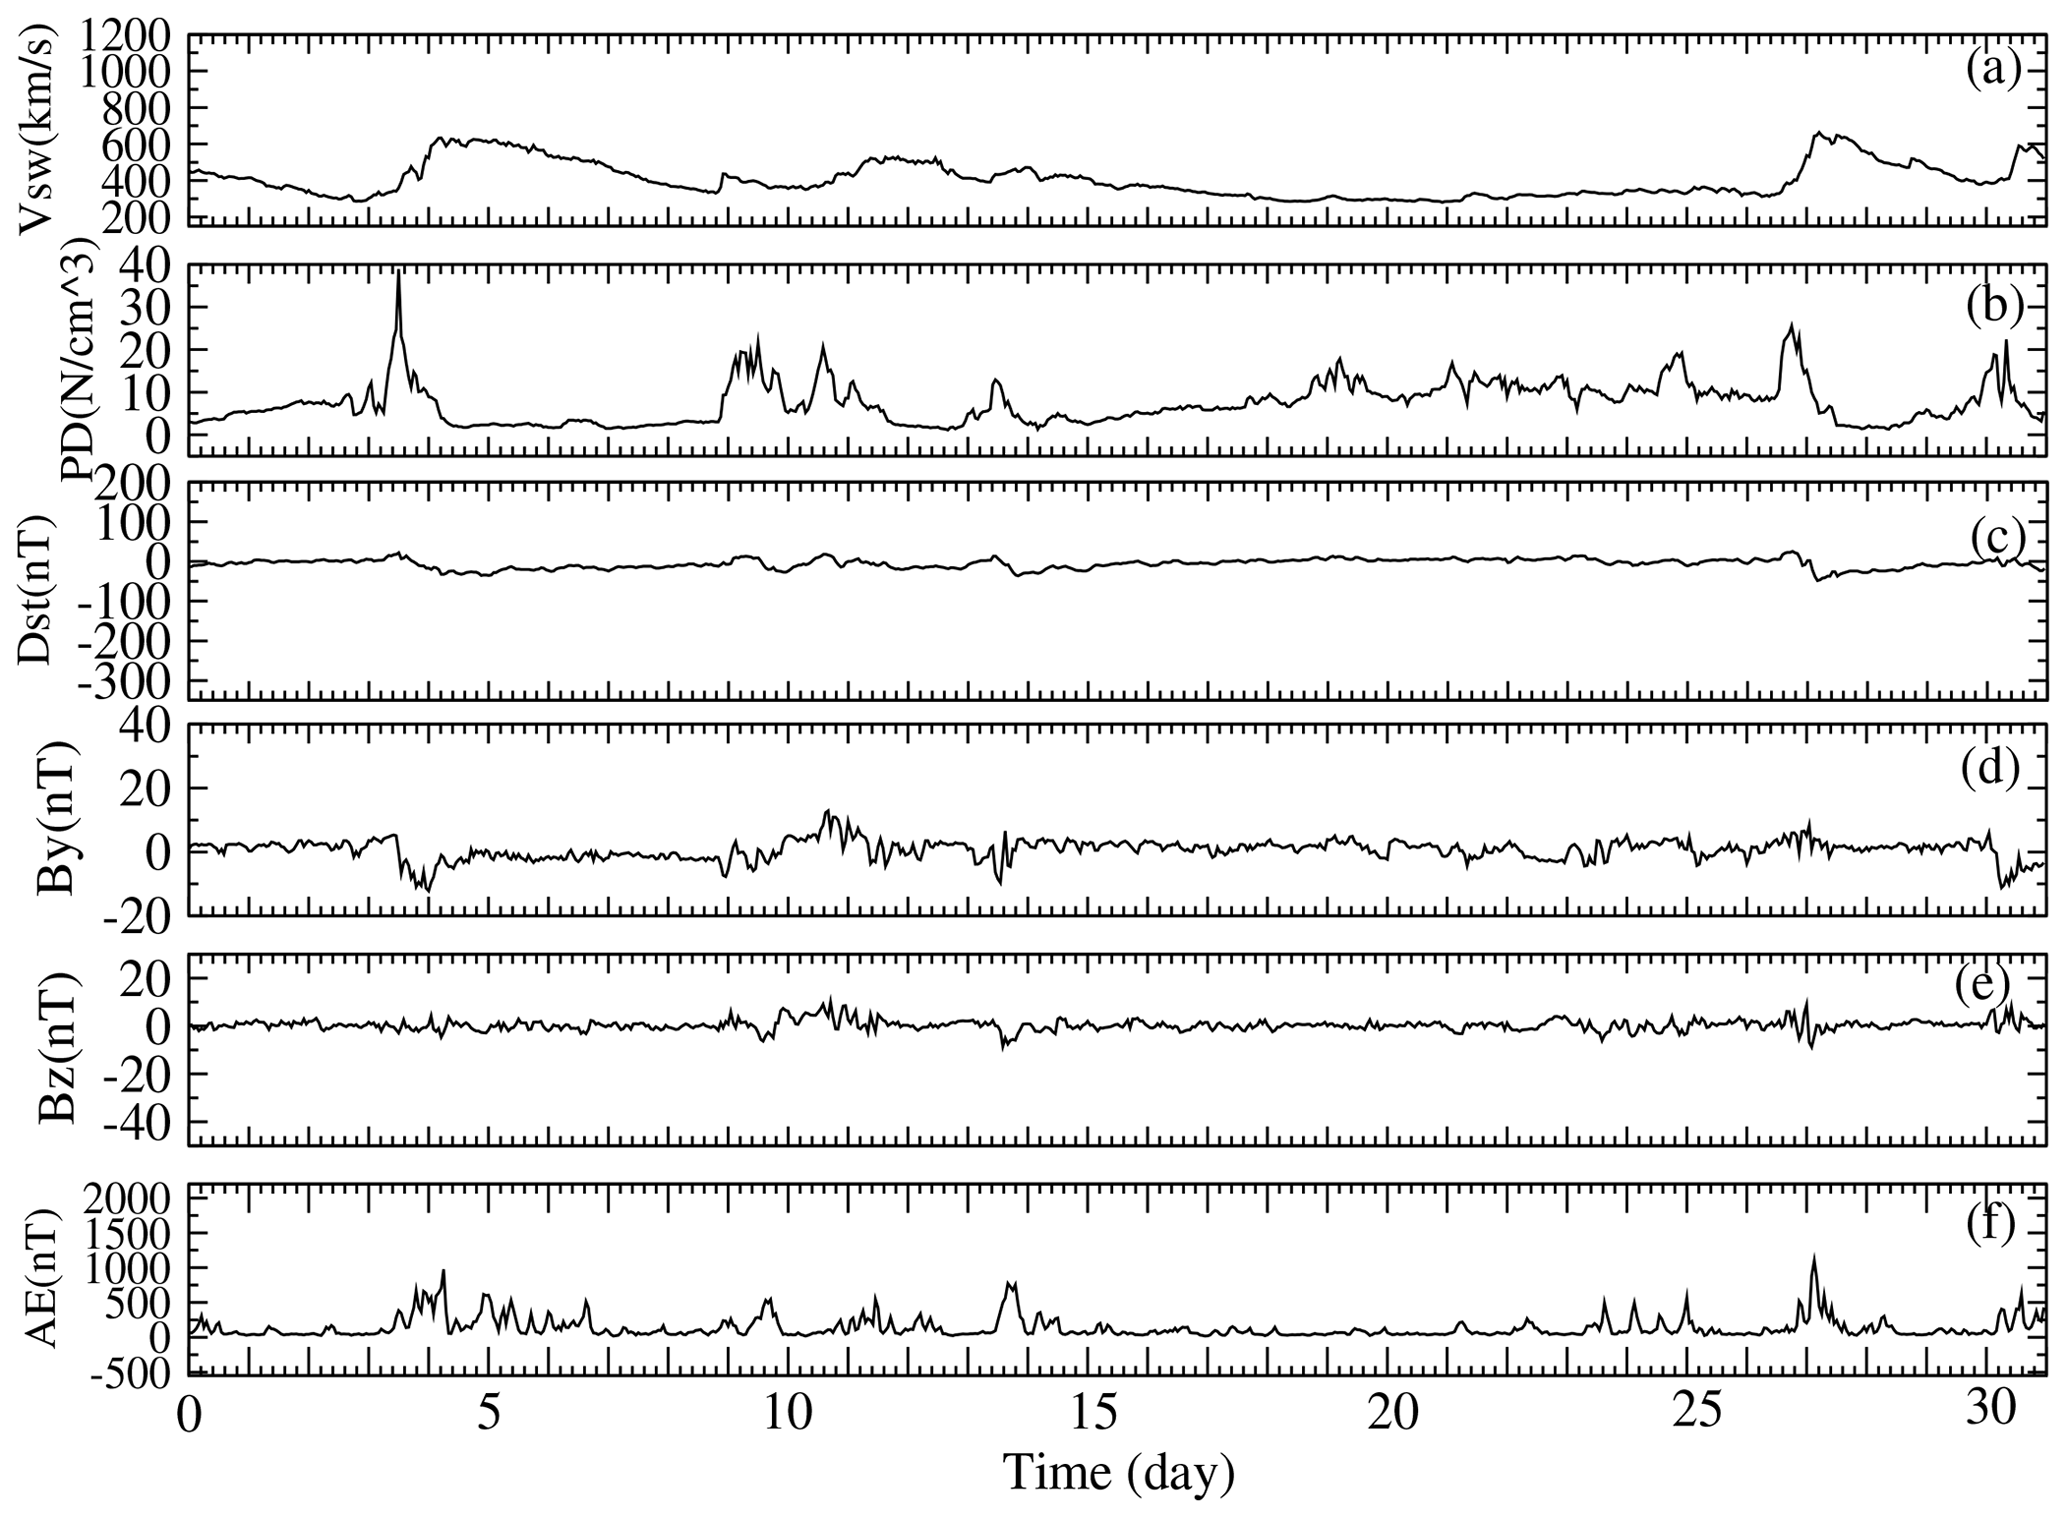
Figure 2The 1 h averaged variations in Vsw, PD, Dst, IMF By and Bz and AE for the geomagnetically quiet solar minimum interval 1–31 July 2006. Source: OMNIWeb at the NASA Goddard Space Flight Center Space Physics Data Facility.
Disturbed environmental conditions near solar maximum (1–31 July 2000)
Year 2000 witnessed the expected rise in overall solar activity as the Sun was progressing towards the maximum of cycle 23, which peaked in November 2001. Figure 3 is a plot of the hourly averaged interplanetary and geomagnetic parameters for July 2000. The related monthly averages of the F10.7 and Ap indices were 212.2 sfu and 21.4 nT, respectively. Germane to this interval were the solar wind drivers and, more importantly, their significant fluctuations and increases in the PD on days 1–4, 9–15 and 25–29 July. These fluctuations had significant consequences for the MIT system. Of note was the occurrence on 14–15 July of an intense geomagnetic storm (Gonzalez et al., 1994) with a Dst of −301 nT. The apparent source of this so-called Bastille Day event, which nominally spanned the 3 d interval 14–16 July, was a geoeffective CME that was first observed erupting from the Sun at 10:54 UT (universal time) on 14 July, in association with an X5.7 flare within active region #19077 at solar location N22W07 (Denig et al., 2018). On 15 July, a large sudden storm commencement (SSC) of 112 nT at 14:37 UT marked the arrival of the CME at the magnetopause and the start of the geomagnetic storm main phase (Closs, 1967). Given a total transit time of just under 28 h, the estimated CME speed from the Sun to the Earth was a fast ∼ 1500 km per second, which is consistent with an initially observed speed of 1673 km per second (Denig et al., 2018) and assessments of the probability of a significant geomagnetic response (Srivastava and Venkatakrishnan, 2002). The 40 nT magnitude and initial negative polarity of the IMF Bz suggests that significant energy was transferred to the MIT system from the solar wind. The related increase in AE, corresponding to a substorm occurring within the geomagnetic storm (McPherron et al., 1973; Kepko et al., 2015), indicates enhanced ionospheric currents within the auroral zone due to the strong coupling between the IMF and the MIT (Pudovkin et al., 1995). Clearly, the upper atmosphere was significantly disturbed throughout July 2000 and, in particular, during to the Bastille Day event. The expected consequences of the enhanced solar–geomagnetic activity for July 2000 was increased atmospheric drag and a consequential decrease in the satellite orbital altitude.
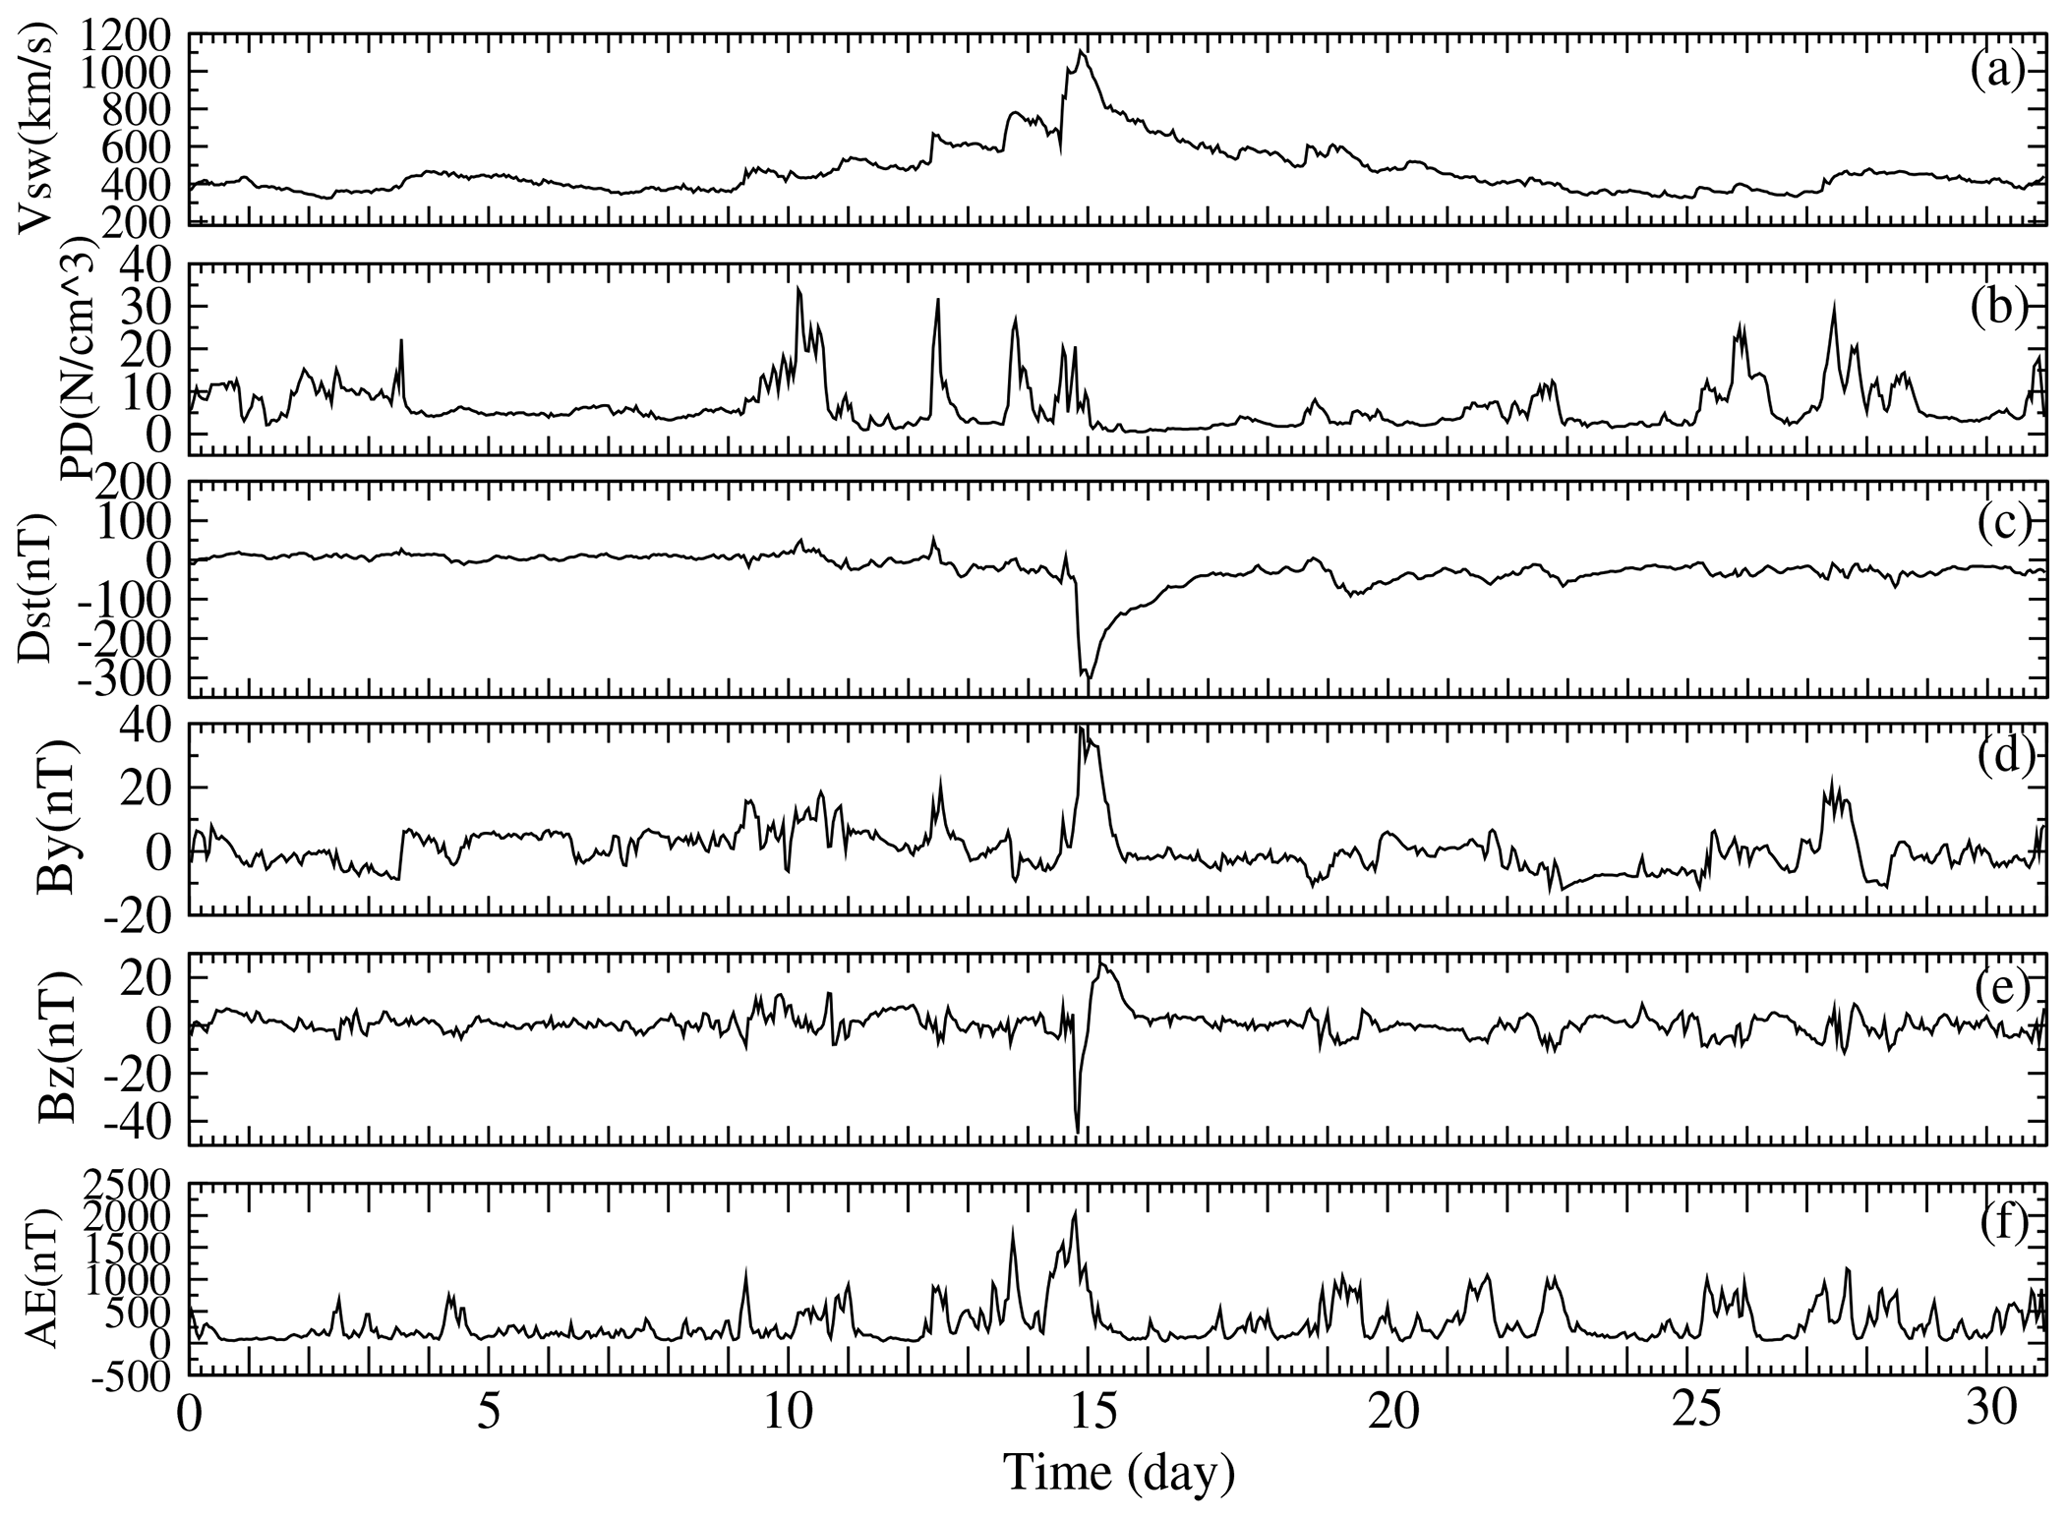
Figure 3The 1 h averaged variations in Vsw, PD, Dst, IMF By and Bz and AE for the geomagnetically quiet solar minimum interval 1–31 July 2000. Source: OMNIWeb at the NASA Goddard Space Flight Center Space Physics Data Facility.
The motion and perturbations associated with satellite trajectories in orbit are generally represented in the following form:
where r is the position vector of the satellite, μ (= GME) is Earth's gravitational parameters, and ap is the acceleration caused by perturbing forces in the adverse space or near-Earth environment.
ap is usually a result of two main types of forces – gravitational forces (e.g. Earth, solar and lunar attraction and Earth's oblateness (J2) and its triaxiality) and non-gravitational forces (e.g. atmospheric drag, solar radiation pressure, outgassing and tidal effects). Although the potency of any of these forces depends on the satellite's orbit, their effects on space probes are outlined in detail in Nwankwo and Chakrabarti (2015). Our model takes into account the effect of Earth's gravity, since the derivation of the satellites' velocity is based on the concept of the centripetal force. Solar and lunar gravitational forces (which constitute third-body perturbations) are important at higher altitudes, especially at and around the apogee height (for elliptic orbits; Sidi, 1997; Nwankwo and Chakrabarti, 2015). This work concentrates on atmospheric drag effect (non-gravitational force) because of its strong impact around the orbit of interest (i.e. LEO). Although, with lesser effect, the off-centre gravitational pull arising from the Earth's equatorial bulge also contributes to satellite perturbations in low Earth orbit. The main effects of Earth oblateness (also recognized as the J2 zonal harmonic) are secular motions of the node (Ω) and perigee (ω) of an orbit, which introduces a force component toward the Equator (Chobotov, 2002; Nwankwo and Chakrabarti, 2015). However, analysis of the effects of J2 of Earth oblateness on satellites is beyond the scope of this work.
Here, we adopt a previously formulated set of coupled differential equations which were solved to obtain the instantaneous position, velocity and acceleration of a typical LEO satellite under the influence of atmospheric drag (e.g. Nwankwo and Chakrabarti, 2014, 2015; Nwankwo et al., 2015; Nwankwo, 2018). We used a spherical coordinate system (r,θ and ϕ) with the origin at the centre of the Earth and assumed that the polar angle, θ, is constant. In satellite parlance, a constant polar angle is equivalent, in principle, to a constant satellite inclination angle. Orbital decay was determined as a consequence of changes in the radial distance, r, and the azimuthal angle, ϕ, through the following set of coupled equations:
where vr and vϕ are, respectively, the radial and tangential velocity components. and are, respectively, the azimuthal angular velocity and azimuthal angular acceleration. The parameters Cd, As and ms were defined in Sect. 1 – recall that the expression is the ballistic coefficient.
In the current analysis, the radial velocity, vr, is used to calculate the daily ODR, whereas the radial distance, r(R+h), is used to model changes in satellite altitude. The numerical integration of the equations were done using the fourth order Runge–Kutta method. From the values of h obtained from the solution of this computations, we plot Fig. 4 to demonstrate the orbital degradation of a hypothetical satellite in a nominally circular orbit which, in this case, degrades over time from an altitude of 480 km until re-entry. The computation (represented in Fig. 4) was first done under the condition of moderate solar activity (while keeping F10.7 and Ap at constant values), followed by the calculation of the daily ODR and h based on the daily solar–geophysical parameters.

Atmospheric density model
The effects of atmospheric drag on LEO satellites and, hence, the rates at which satellite orbits decay largely depend on the atmospheric density which, in turn, is largely influenced by solar and geomagnetic activity (Fujiwara et al., 2009). Accurate knowledge of atmospheric drag requires a high-fidelity model of the in situ neutral gas density or, more generally, the atmospheric density profile. Supporting information regarding the level of atmospheric heating and, in turn, atmospheric expansion can be gleaned from knowledge of the atmospheric temperature profile. The upper atmosphere, or thermosphere, exhibits large solar cycle variations in temperature, density, composition and winds (Walterscheid, 1989). A number of high-quality models are available that provide suitable approximations of atmospheric profiles of density, ρ, and temperature, T (Picone et al., 2002; Bruinsma et al., 2003; Bowman et al., 2008). For this work, we have selected the Naval Research Laboratory Mass Spectrometry and Incoherent Scatter Extended 2000 (NRLMSISE-00) empirical atmospheric model. NRLMSISE-00 consists of parametric and analytic approximations to physical theory for the vertical structure of the atmosphere as a function of time, location and solar and geomagnetic activity. The main solar–geomagnetic parameters used for NRLMSISE-00 model are the daily values of F10.7 and Ap (Nwankwo and Chakrabarti, 2018, and references therein).
The results of our simulation, arising as solutions to the above set of coupled differential equations, are presented in this section. The environmentally quiet interval of July 2006 is presented as the baseline for atmospheric drag, whereas the disturbed interval of July 2000 illustrates the deleterious impact that solar–geomagnetic activity can have on satellite orbits. Within each of these intervals, a 12 d period of environmentally quiet and exceptionally disturbed activity, respectively, is used to highlight the impact of extreme conditions.
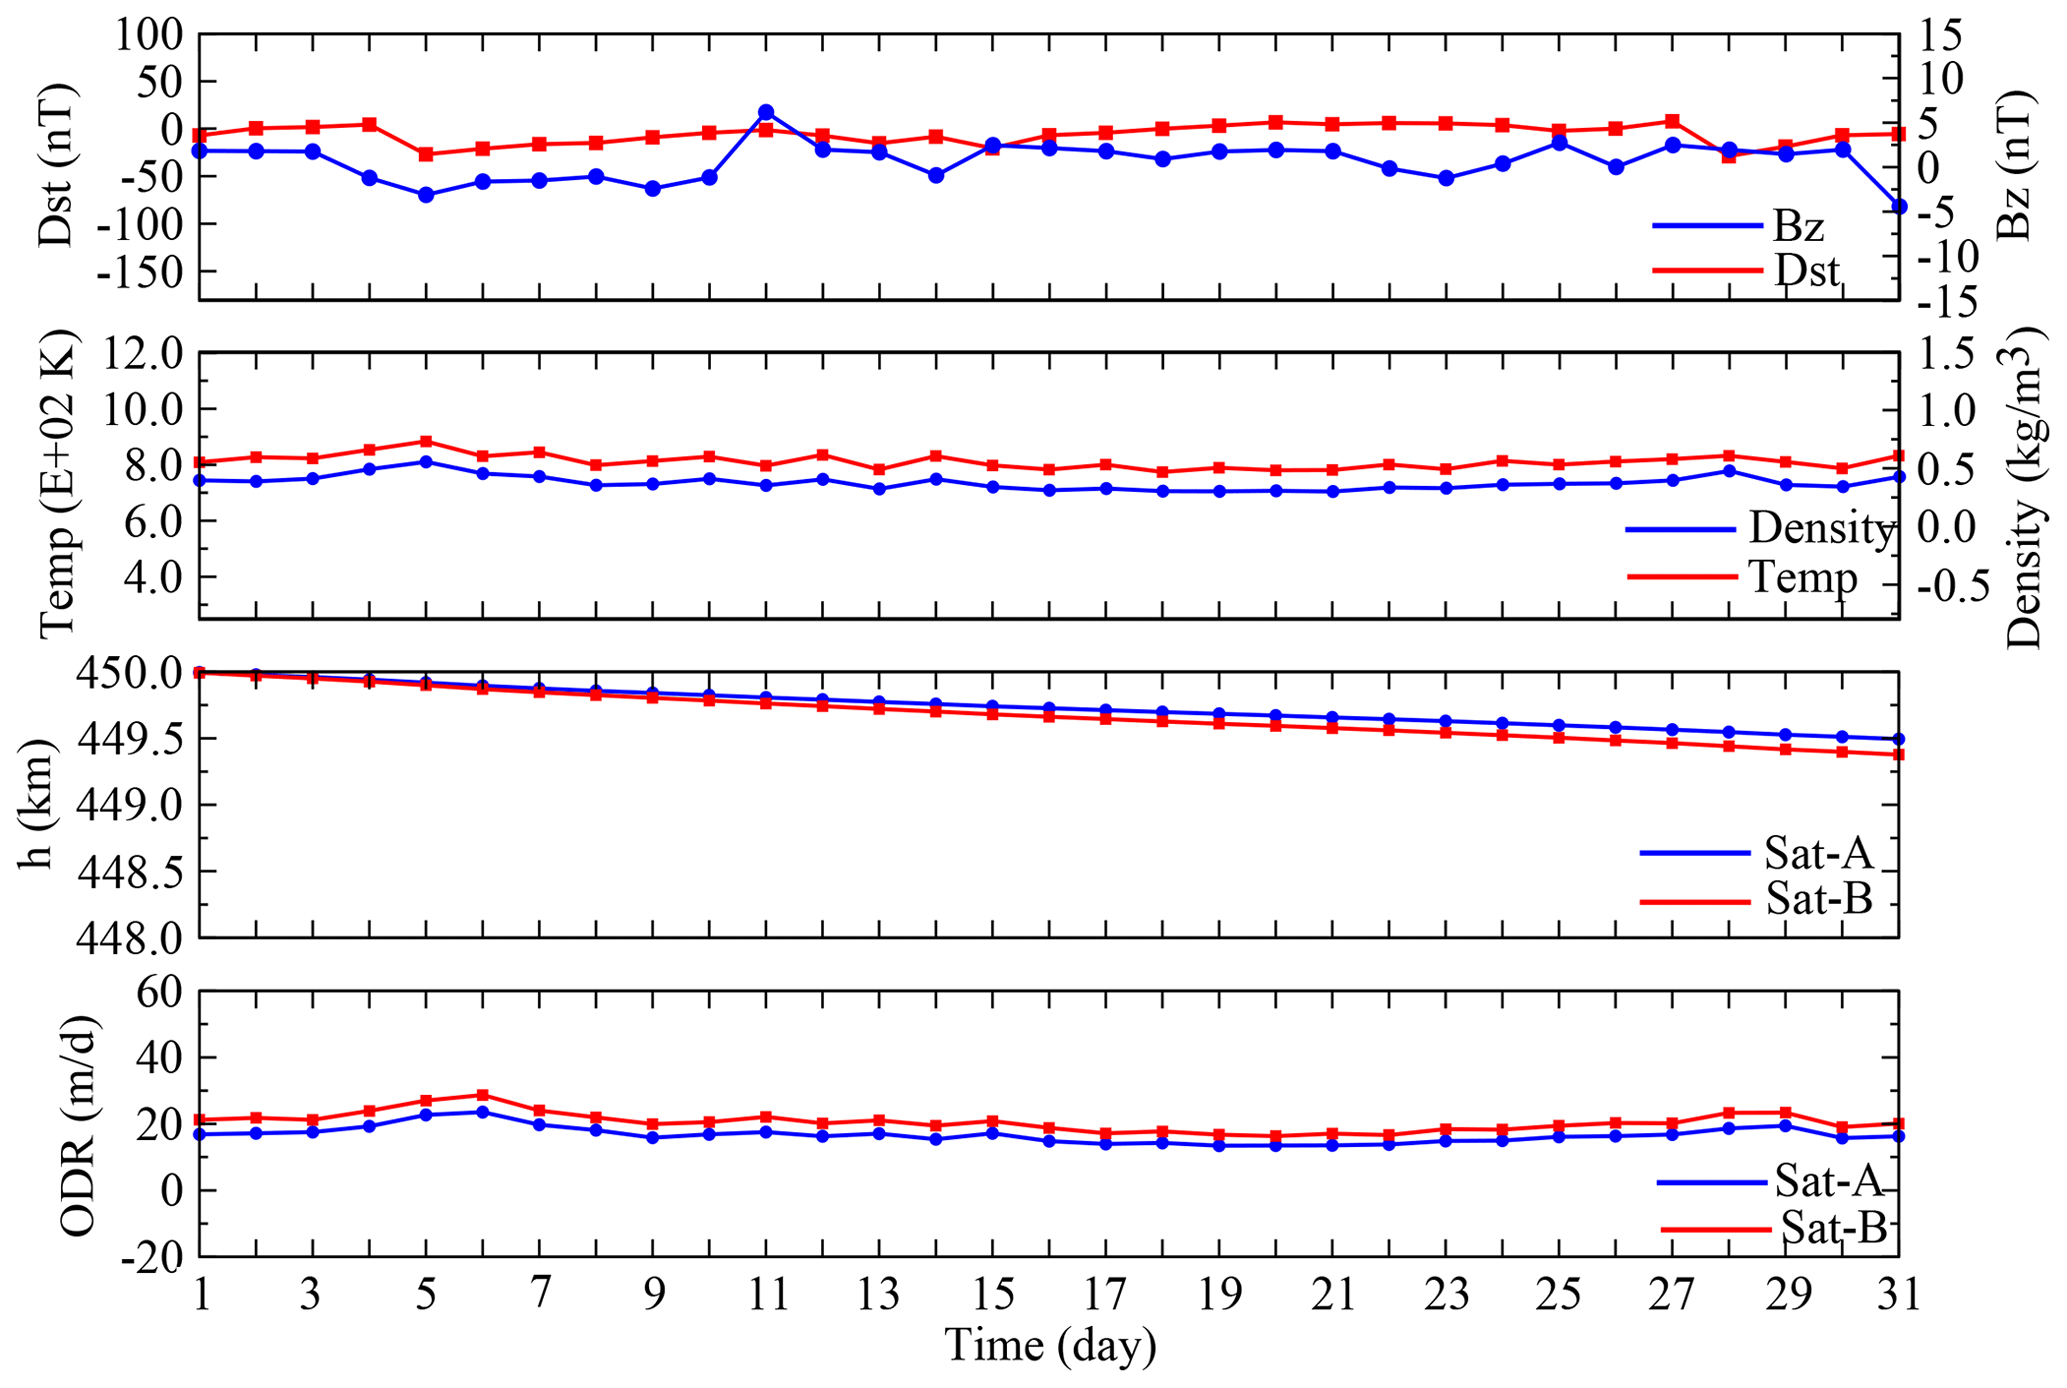
Figure 5Mean daily variations in Dst, Bz, ρ, T, h and ODR for Sat-A (blue) and Sat-B (red) for quiet conditions (July 2006).
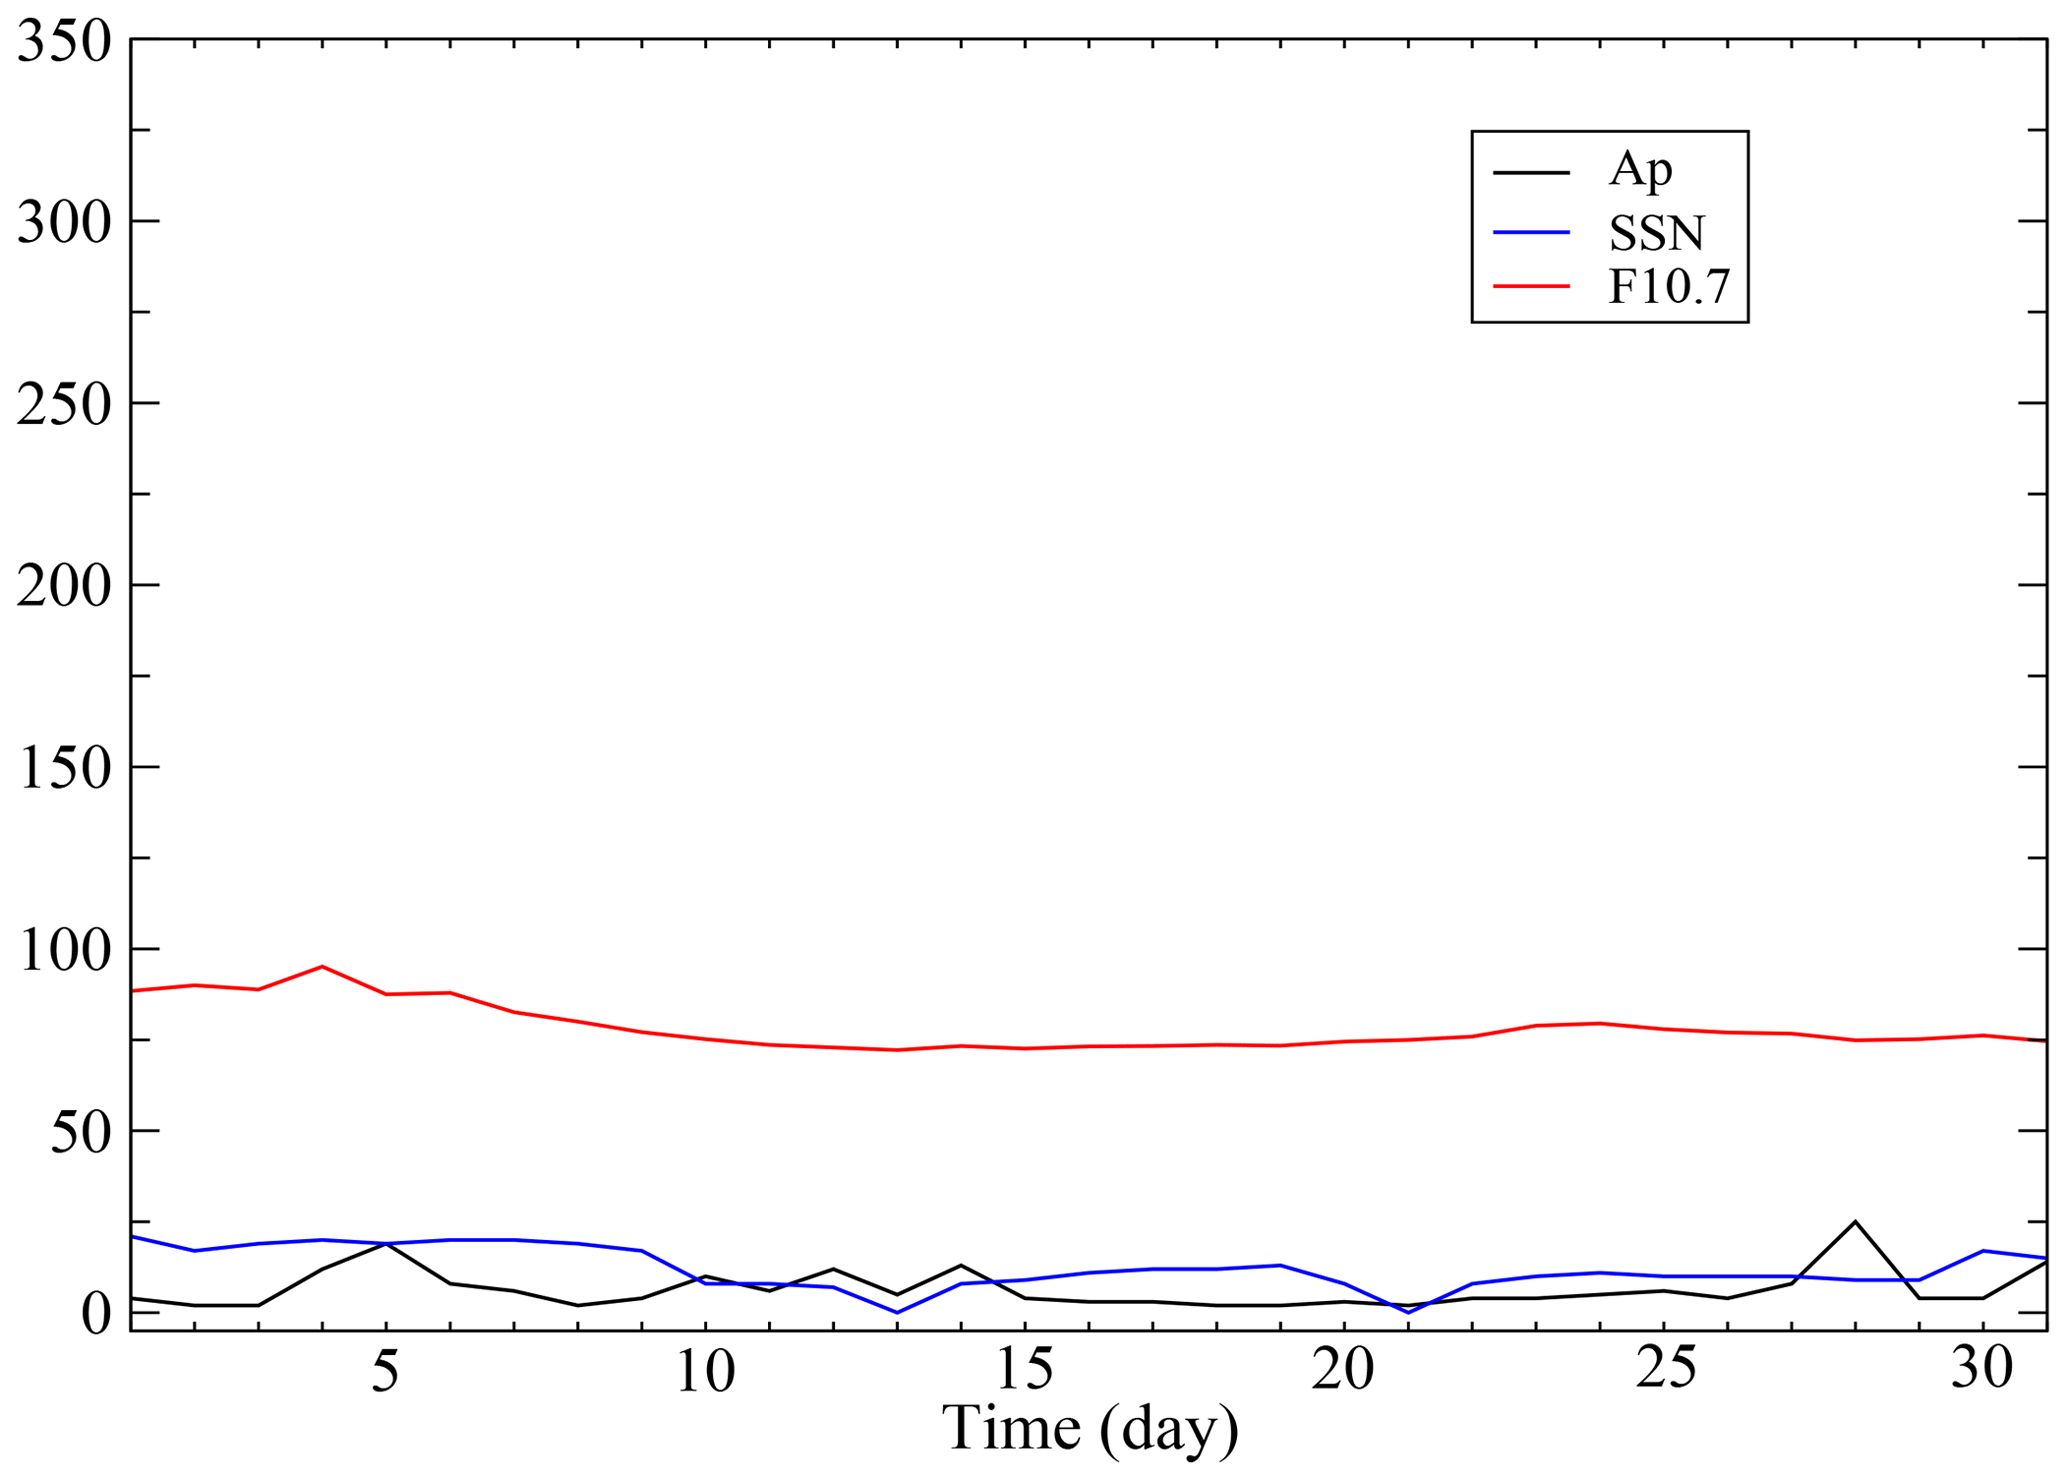
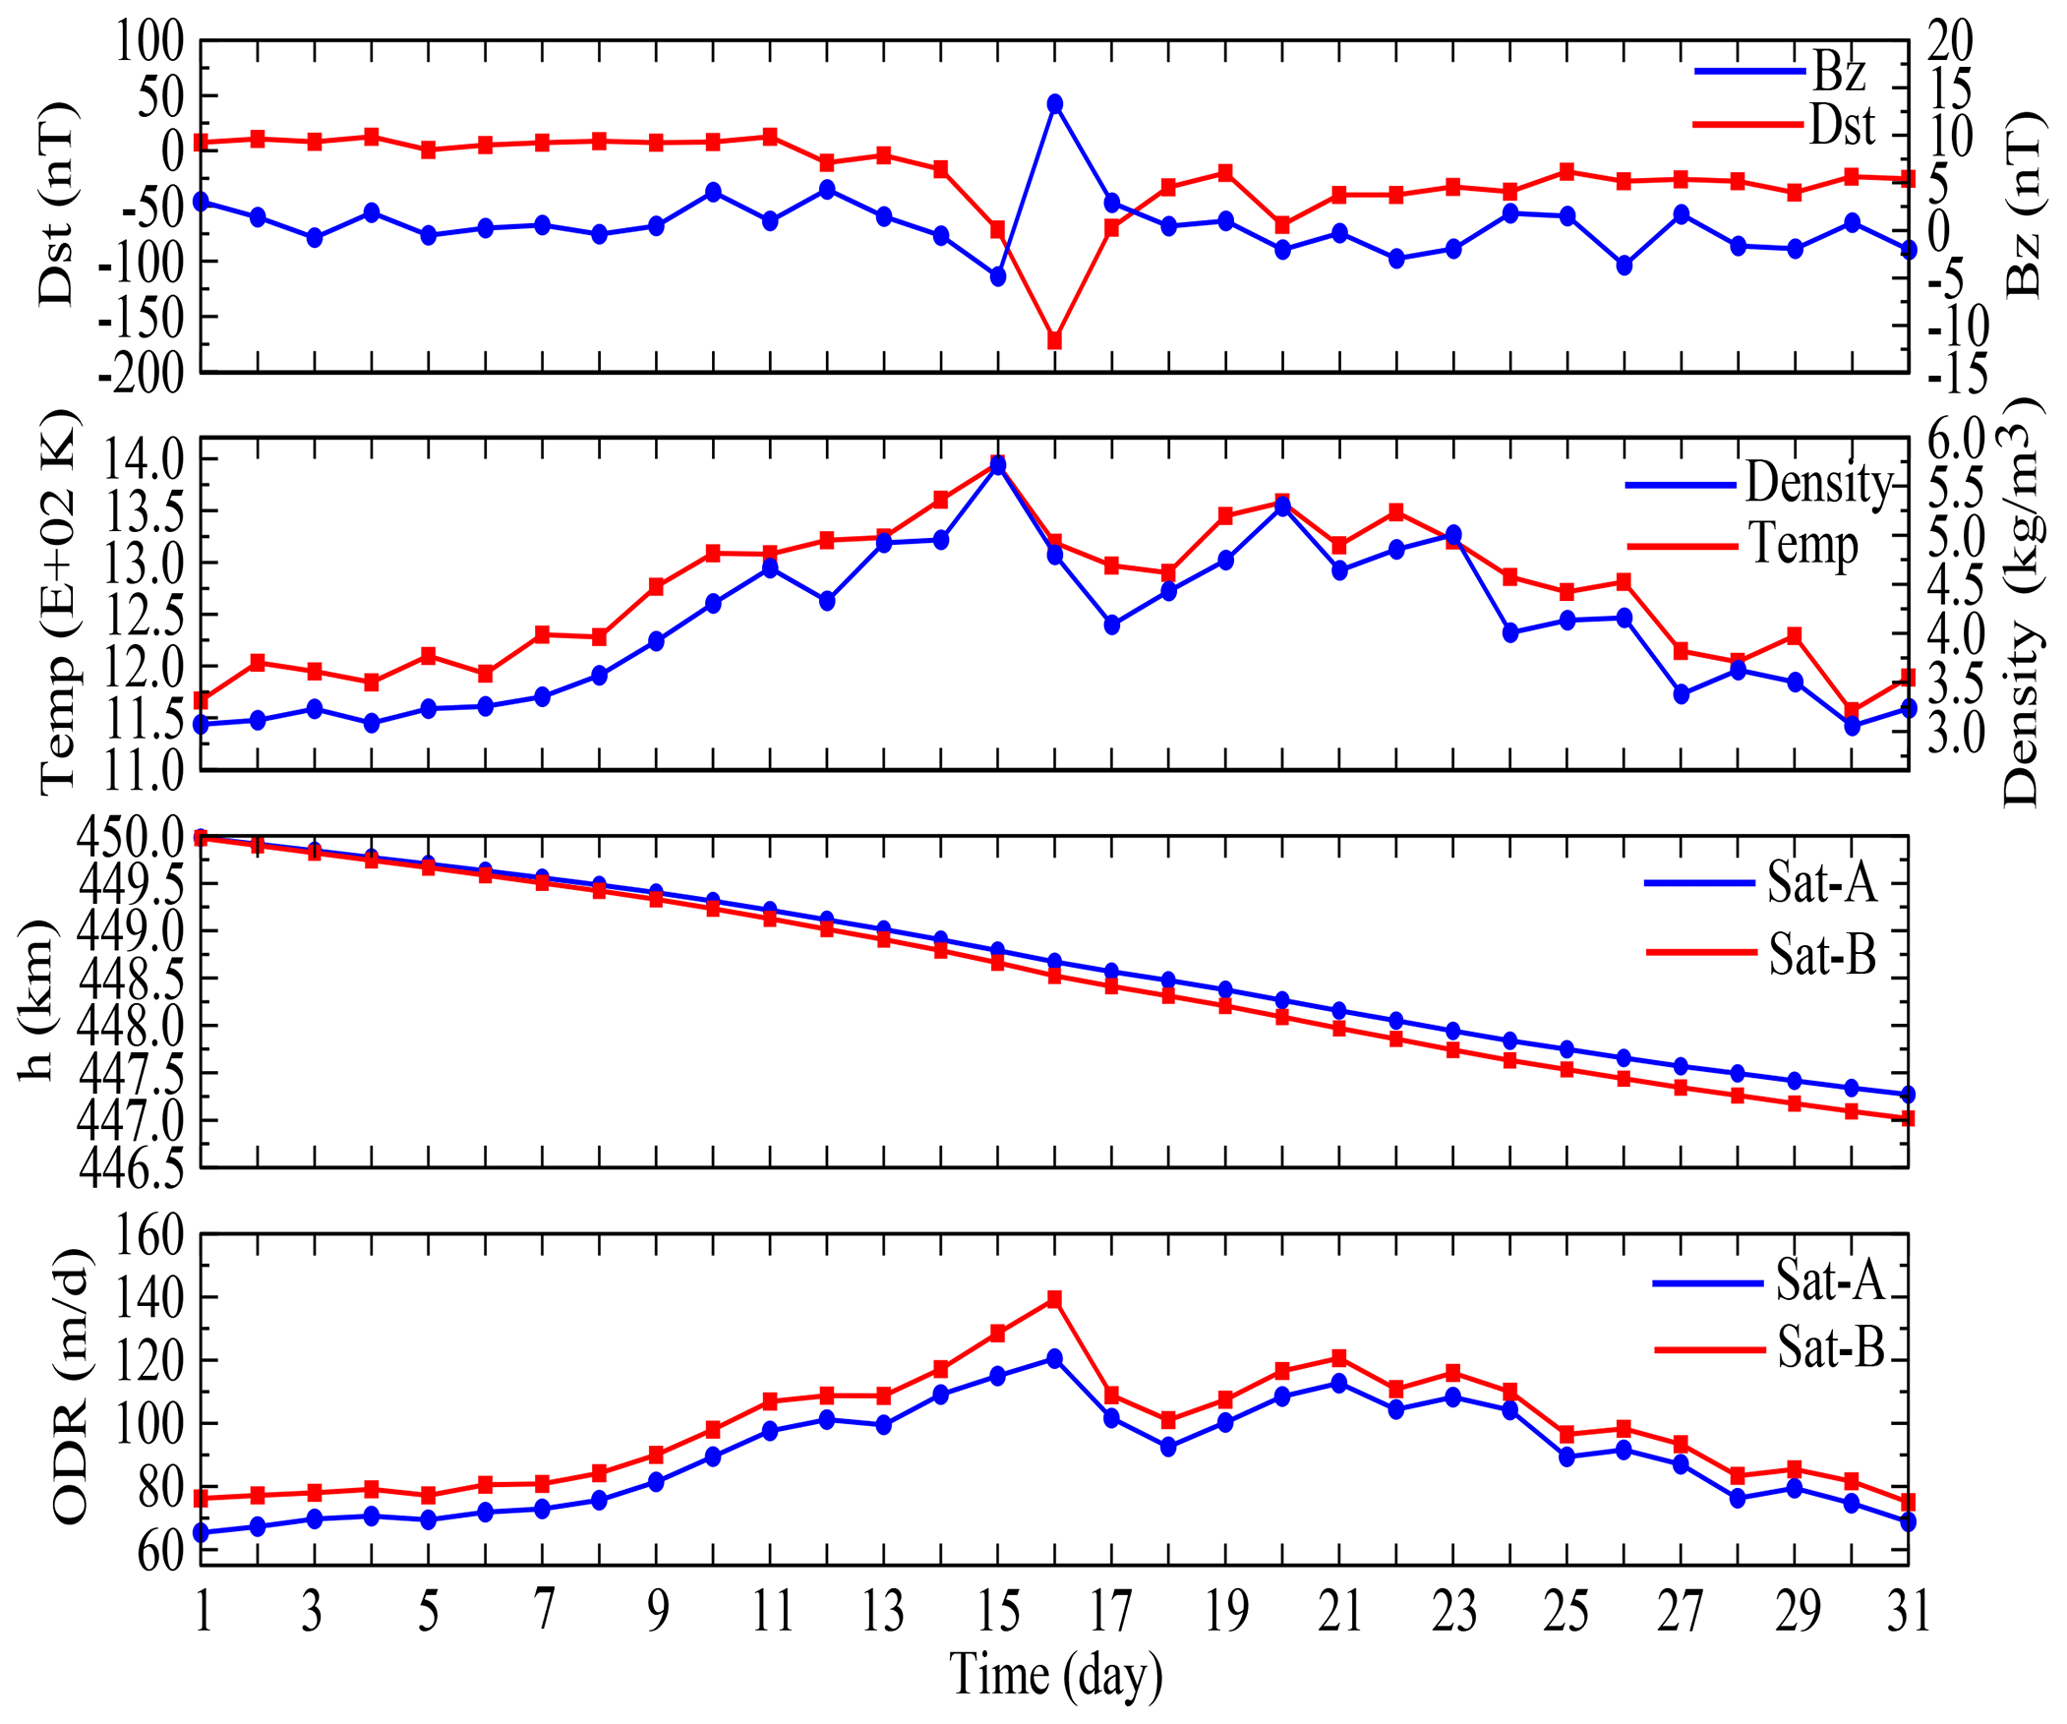
Figure 7Mean daily variations in Dst, Bz, ρ, T, h and ODR for Sat-A (blue) and Sat-B (red) for quiet conditions (July 2000).
4.1 Atmospheric drag effects for quiet solar–geomagnetic activity (July 2006)
Figure 5 depicts the mean daily variations in Dst, Bz, atmospheric density (ρ) and temperature (T) and the altitude (h) and orbit decay rates (ODRs) of Sat-A and Sat-B under the quiet solar–geomagnetic conditions of July 2006. During this 1-month interval of relatively low environmental stress, the ranges of Dst and Bz (daily mean) are −28.71 to 7.75 (nT) and −1.18 to 1.84 (nT), respectively. T varied between 770 and 880 K, whereas ρ varied between and kg m−3. These atmospheric parameters are consistent with low geomagnetic activity solar minimum conditions (Fujiwara et al., 2009). The orbital drag calculations indicate that Sat-A decayed by 0.52 km during the month, with an ODR ranging from 13 to 23 m per day, whereas Sat-B decayed by 0.65 km, with an ODR range of 16–29 m per day. These modest yet consistent differences in ODR and decay for Sat-A and Sat-B reflect the differences in their respective ballistic coefficients (see Table 1). Figure 6 is a plot of the daily F10.7, SSN and Ap indices. While no significant geomagnetic storms occurred during the entire month, we note that the minor increases in the daily Ap for 5, 28 and, possibly, 31 July corresponded to slight increases in the atmospheric parameters and the peak ODRs of 23 m per day (29 m per day) for Sat-A (Sat-B). The baseline ODRs for July 2006 will be contrasted with the model decay rates for the solar maximum geomagnetically disturbed interval of July 2000.
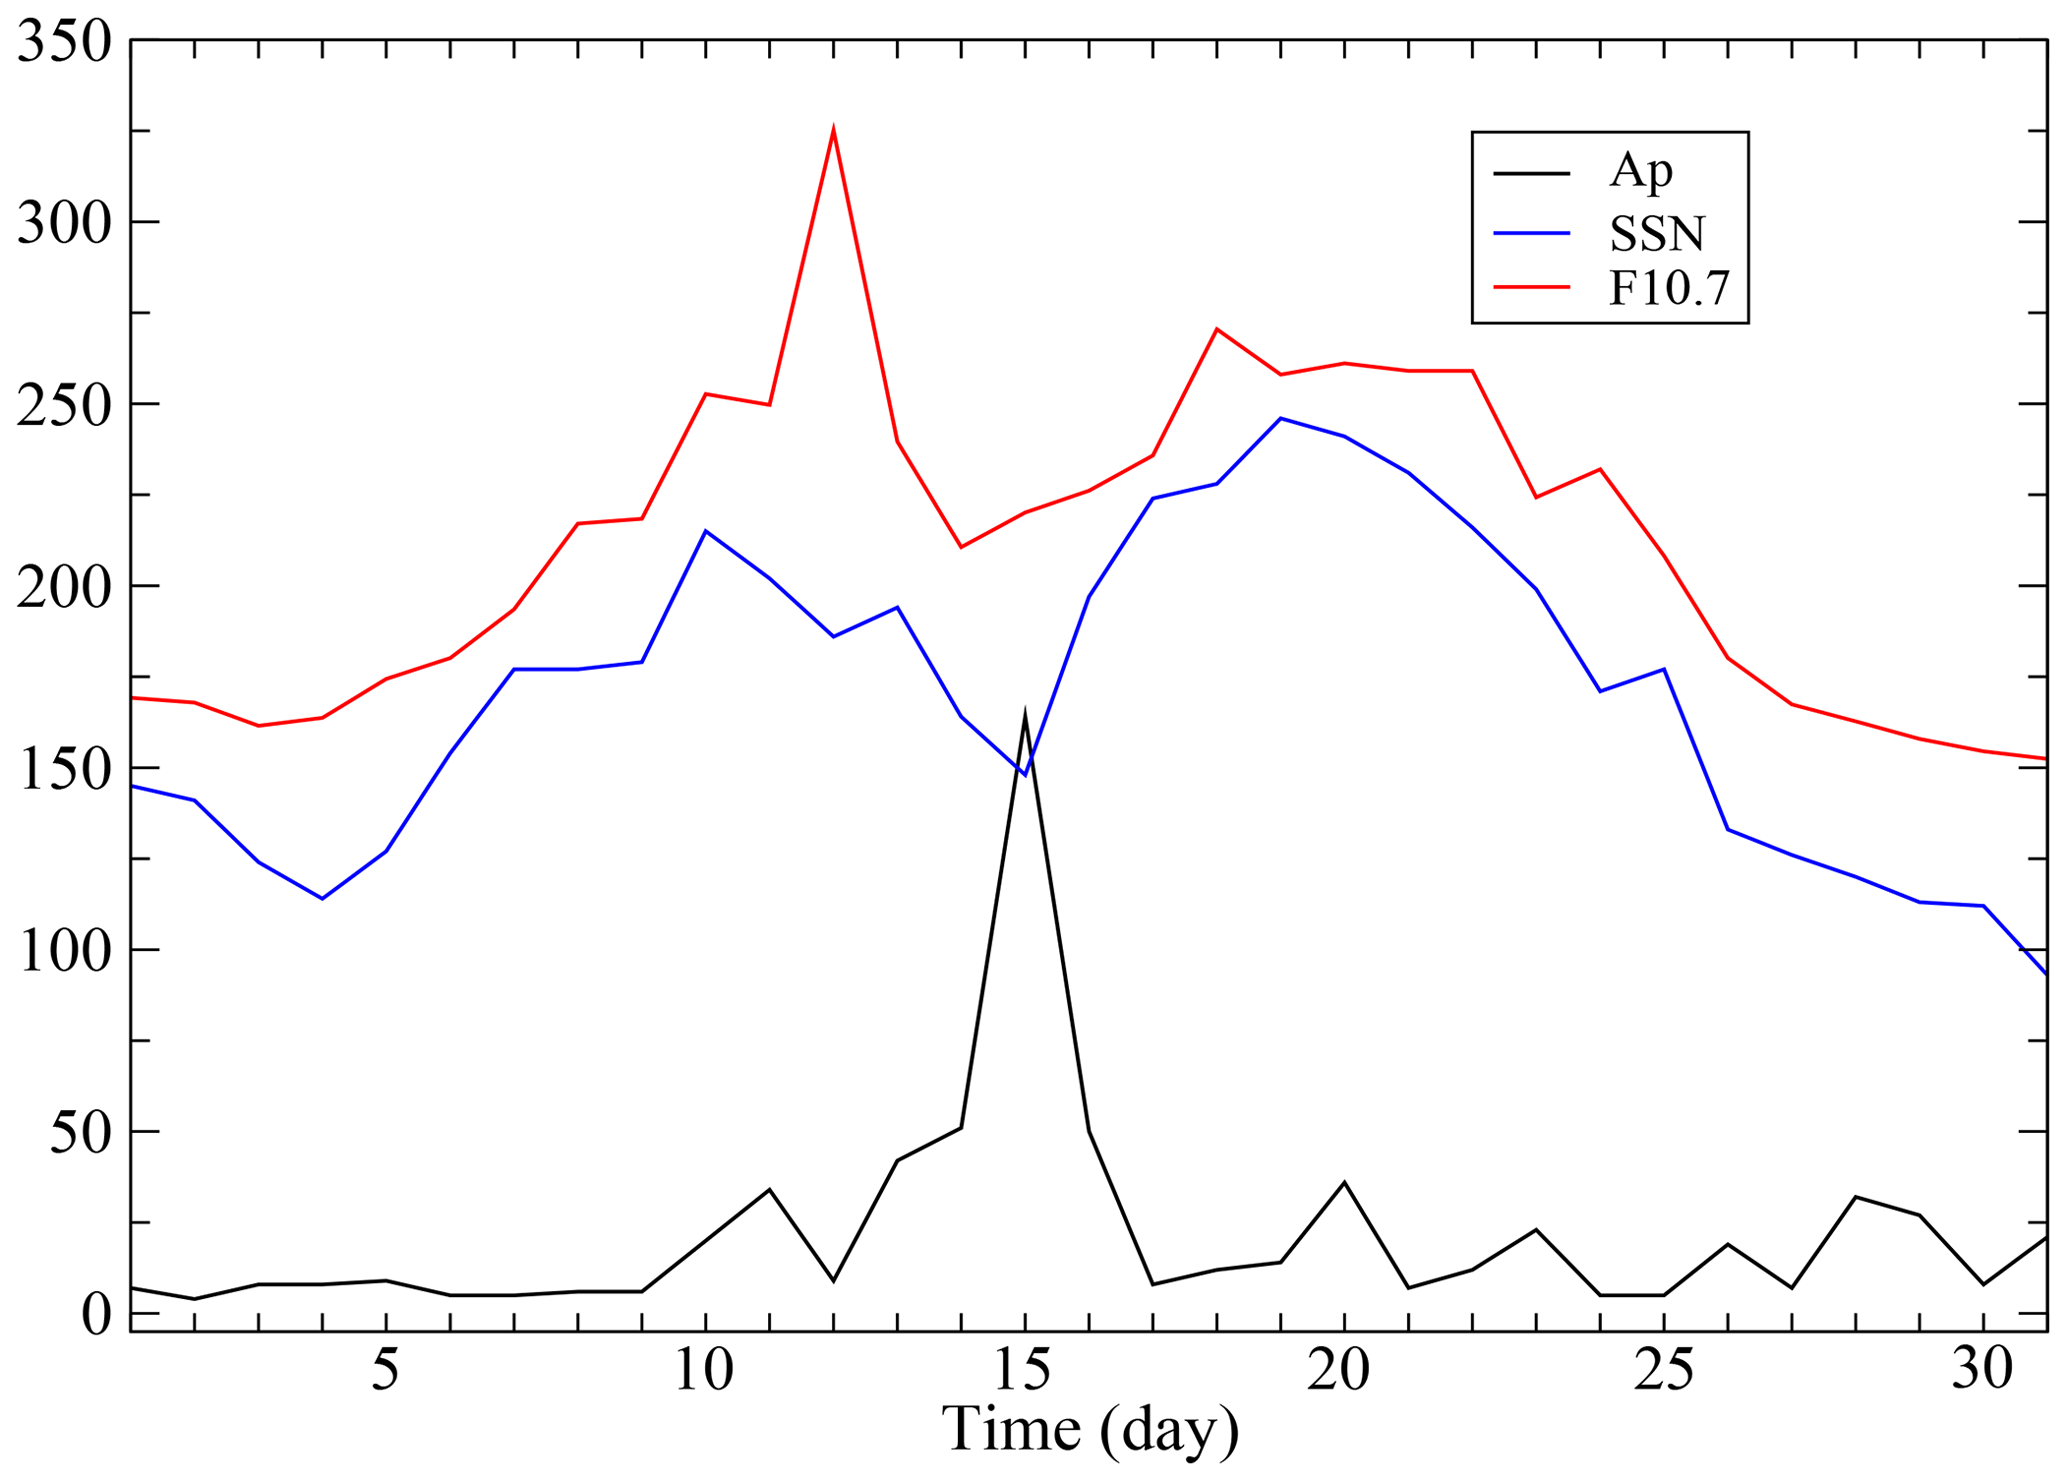

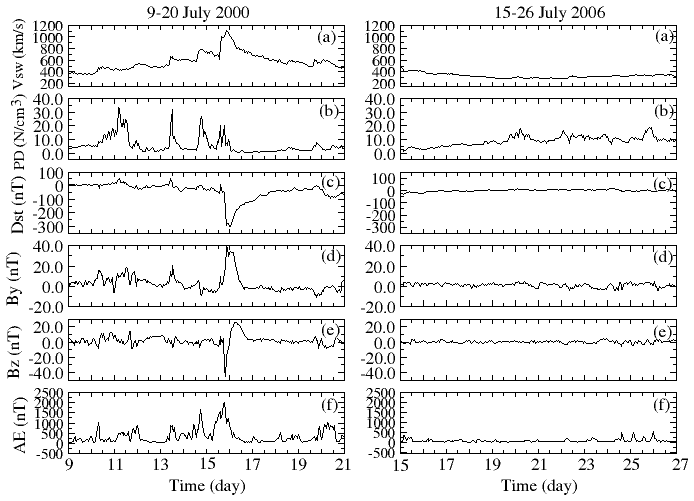
Figure 10The 1 h averaged values of Vsw, PD, Dst, IMF By and Bz and AE during 9–20 July 2000 (left) and 15–26 July 2006 (right) (Nwankwo et al., 2020a).
4.2 Atmospheric drag effects for enhanced solar–geomagnetic activity (July 2000)
Figure 7 depicts the mean daily variations in Dst, Bz, ρ, T, h and ODR for the environmentally enhanced interval of July 2000. During this month, the range of daily values of Dst and Bz were −171.63 to 12.75 and −4.84 to 13.30 nT, respectively. The modelled temperatures for the month varied between 1156 and 1580 K, which were indicative of a generally warm atmosphere near solar maximum (Fujiwara et al., 2009). In response, the thermospheric densities for an expanded atmosphere ranged from 2.4 to 5.7 kg m−3 (Fujiwara et al., 2009; Emmert, 2015). Accordingly, Sat-A decayed by about 2.77 km, whereas Sat-B decayed by about 3.09 km. Again, as expected, the integrated effect of atmospheric drag on Sat-B was greater than that experienced by Sat-A due to differences in the ballistic coefficients. The range of daily values for Sat-A's ODR was 65 to 120 m per day, whereas the range of ODR for Sat-B was 78 to 142 m per day. An interesting trend is the general increase and then decrease in ODR throughout the month, which is consistent with the variations in the modelled ρ and T.
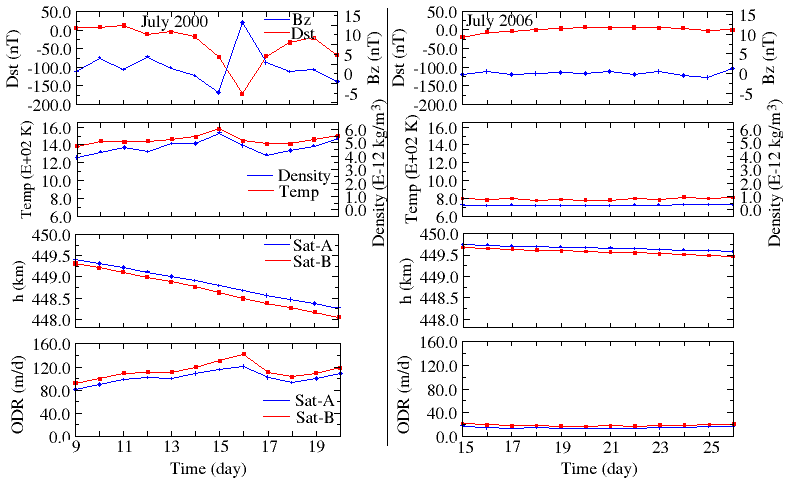
Figure 11Corresponding mean daily variations in Dst, Bz, ρ, T, h and ODR for Sat-A and Sat-B during 9–20 July 2000 (left) and 15–26 July 2006 (right).
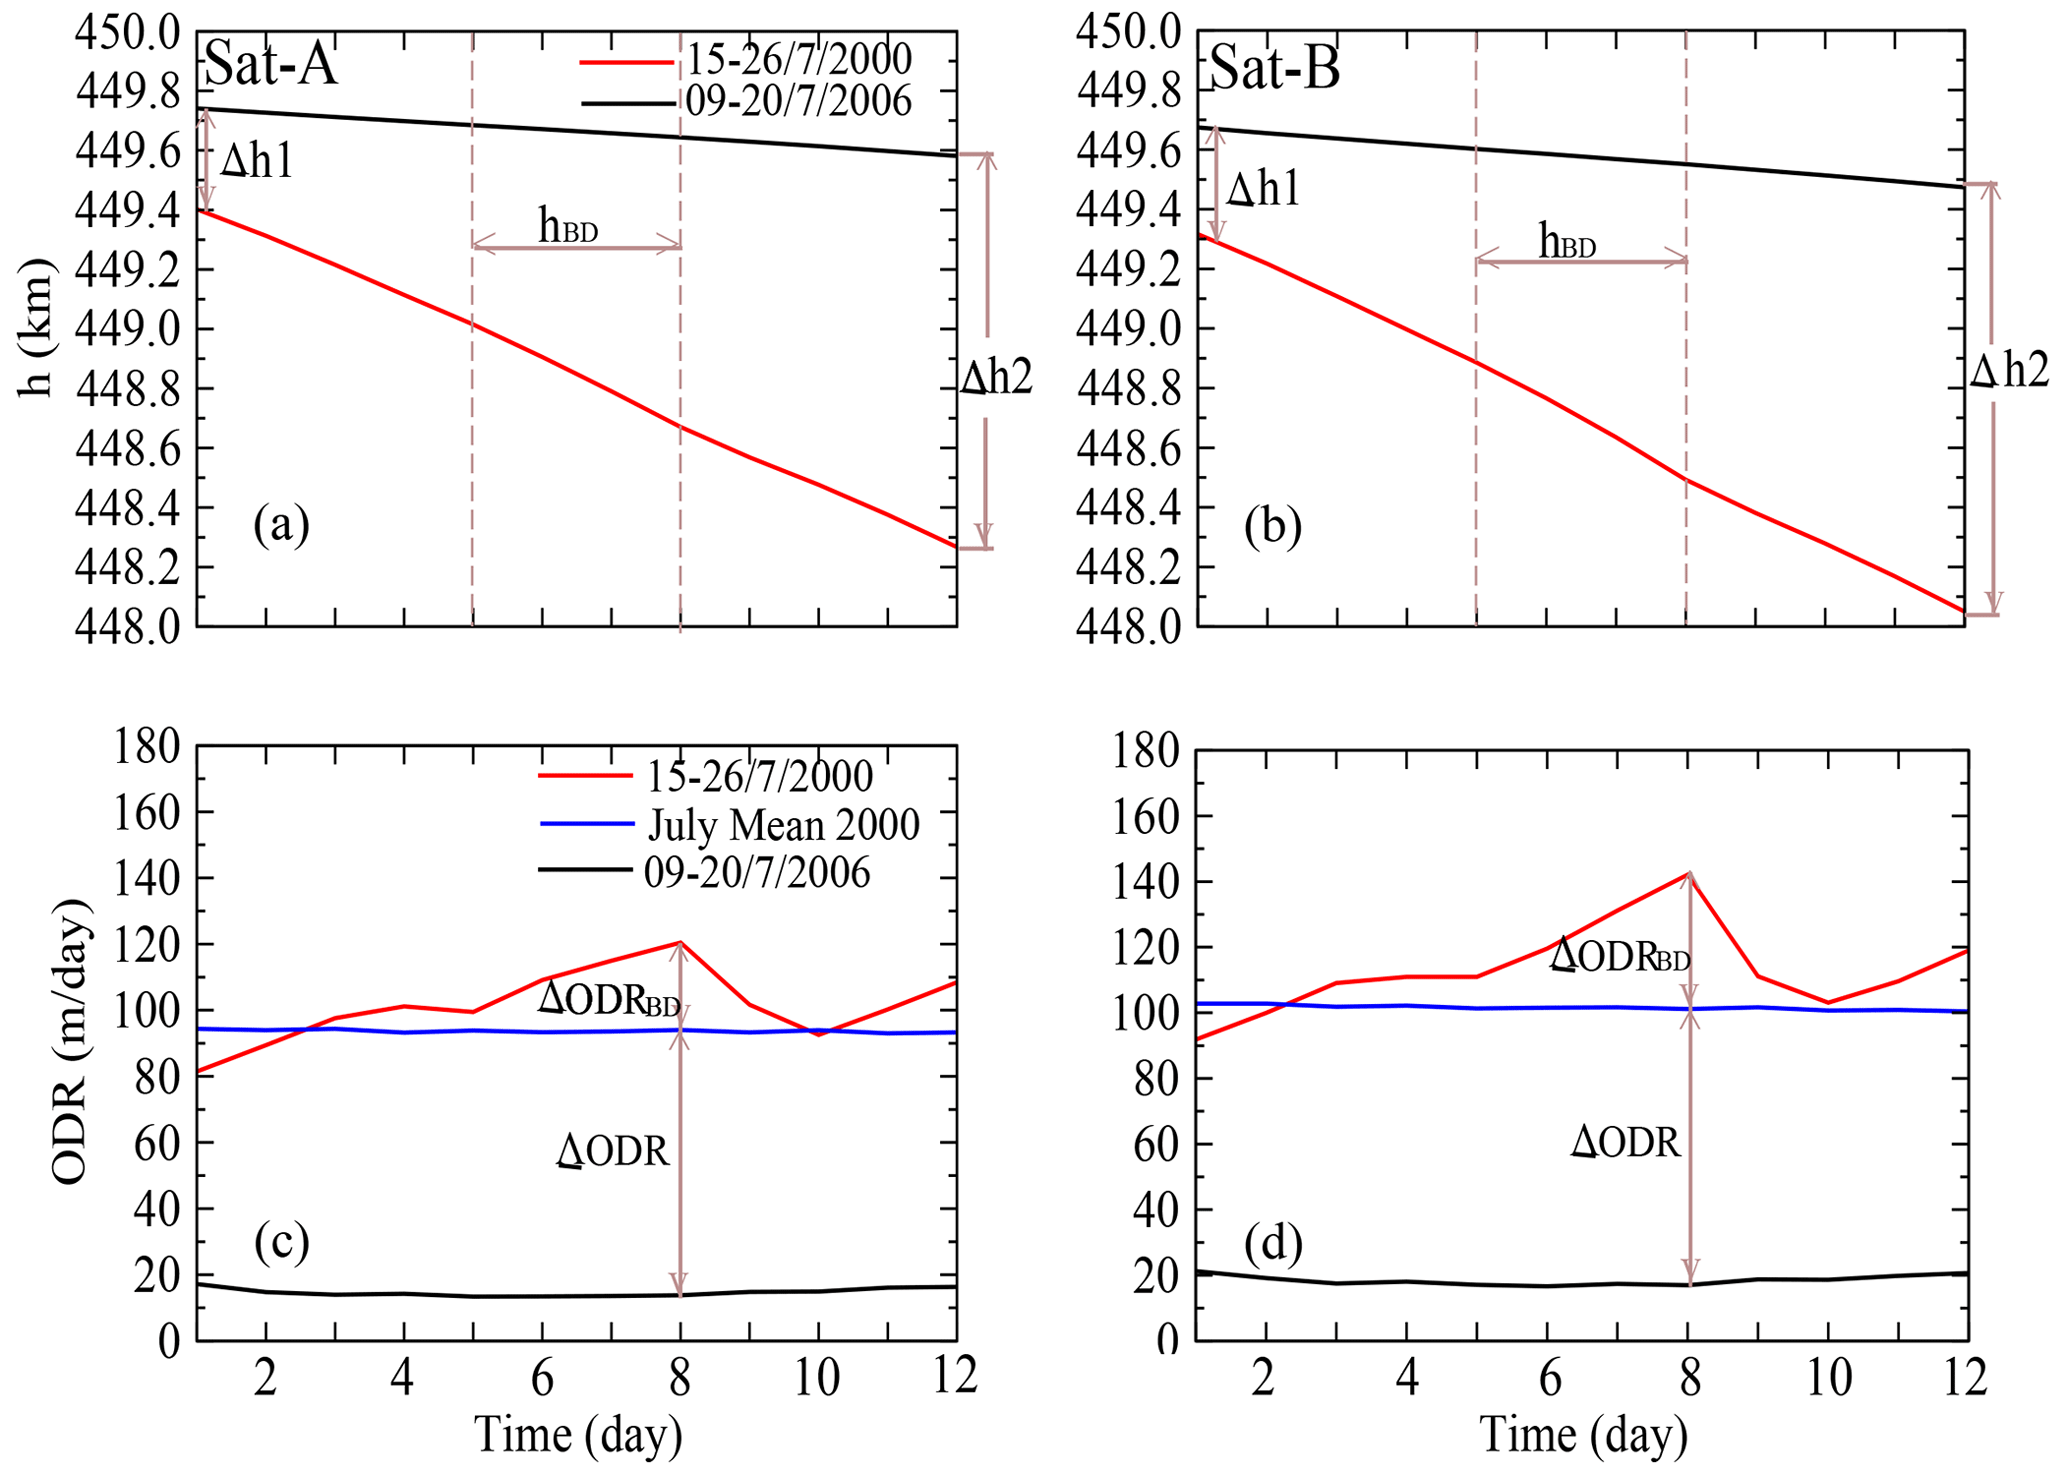
Figure 12Contrast between the daily variations in h and ODR of Sat-A (a, c) and Sat-B (b, d) during 9–20 July 2000 and 15–26 July 2006.
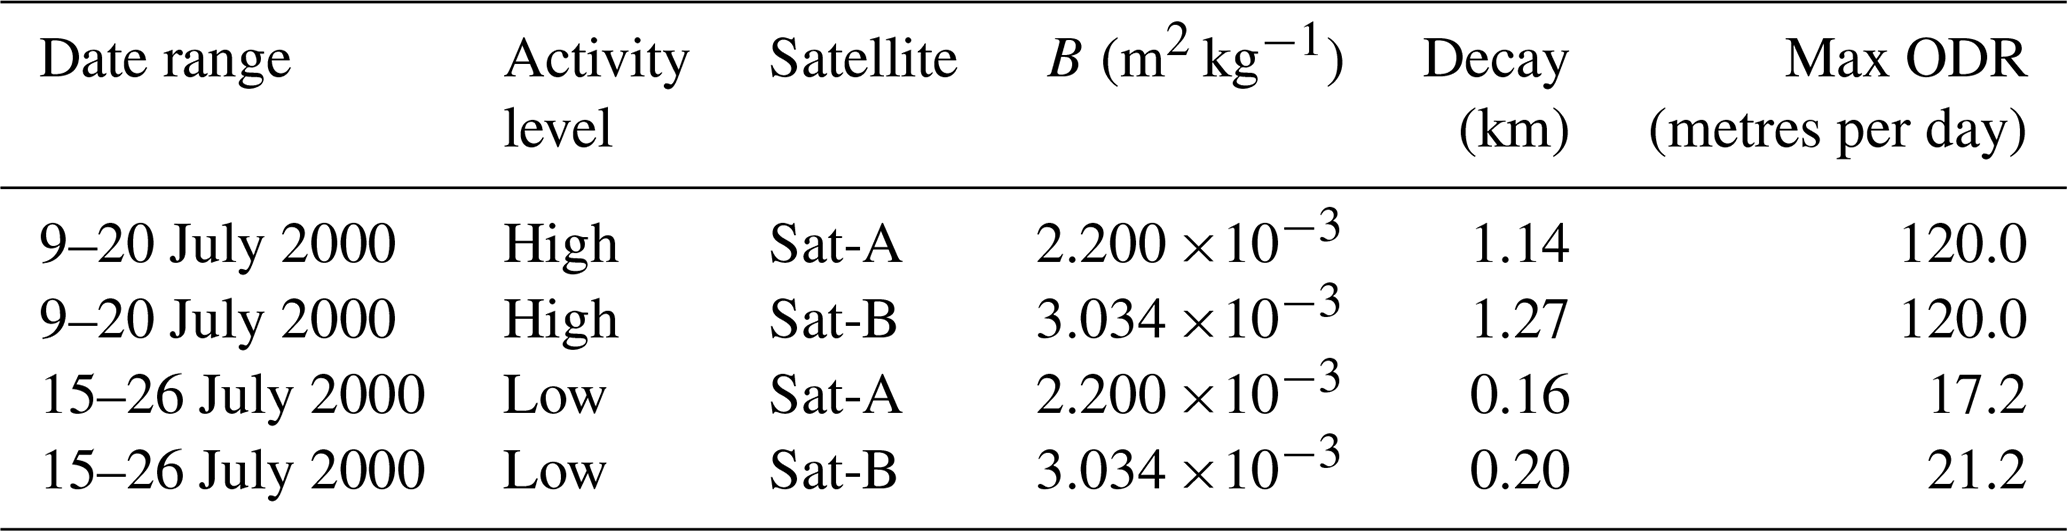
Table 2Summary of altitude decay and ODR of Sat-A and Sat-B for the extreme (12 d) activity levels.
In order to further investigate this trend, we plotted, in Fig. 8, the daily indices for F10.7, SSN and Ap and found that the density and temperature trends were consistent with the solar F10.7 and SSN indices. Again, this is not surprising in that F10.7 is a key input to the NRLMSISE-00 model. The apparent similarity in the behaviours of the daily SSN and daily F10.7 index was also reasonable given that intense radiant emissions from solar faculae are proportional to the number of sunspots (Ambelu et al., 2011). However, we note that the significant spike in F10.7 (due to the intense flare) did not reflect in the simulated ODR. This outcome is consistent with the findings of Knowles et al. (2001), who stated that “the effect of geomagnetic activity appears to be more important than that of prompt radiation”. The modelled values for ODR and the atmospheric density and temperature spiked, predictably, mid-month in response to the additional energy input from the Bastille Day geomagnetic storm. The thermospheric T and ρ on the peak storm day (16 July) were 1580 K and 5.7 kg m−3, and the corresponding values of ODRs for Sat-A and Sat-B were 120 m per day and 142 m per day, respectively. A more detailed plot of the 3 h magnetic Ap index included in Fig. 9 for 13–17 July indicates that the geomagnetic storm lasted about 1 d, starting near noon on 15 July and ending some 24 h later. We note that the start of the storm was consistent with the previously mentioned SSC that occurred at 14:37 UT on 15 July. Also occurring during the month of July 2000 was a series of minor disturbances (e.g. days 11, 20, 23, 26 and 28–29, as revealed by Fig. 8), which contributed to the enhanced temperatures and densities (beyond solar inputs alone) observed throughout the month.
Table 3Indices used for description effects of the 12 d intervals of elevated and exceptionally quiet geomagnetic activity (9–20 July 2000 and 15–26 July 2006). Note: EQGA – exceptionally quiet geomagnetic activity.
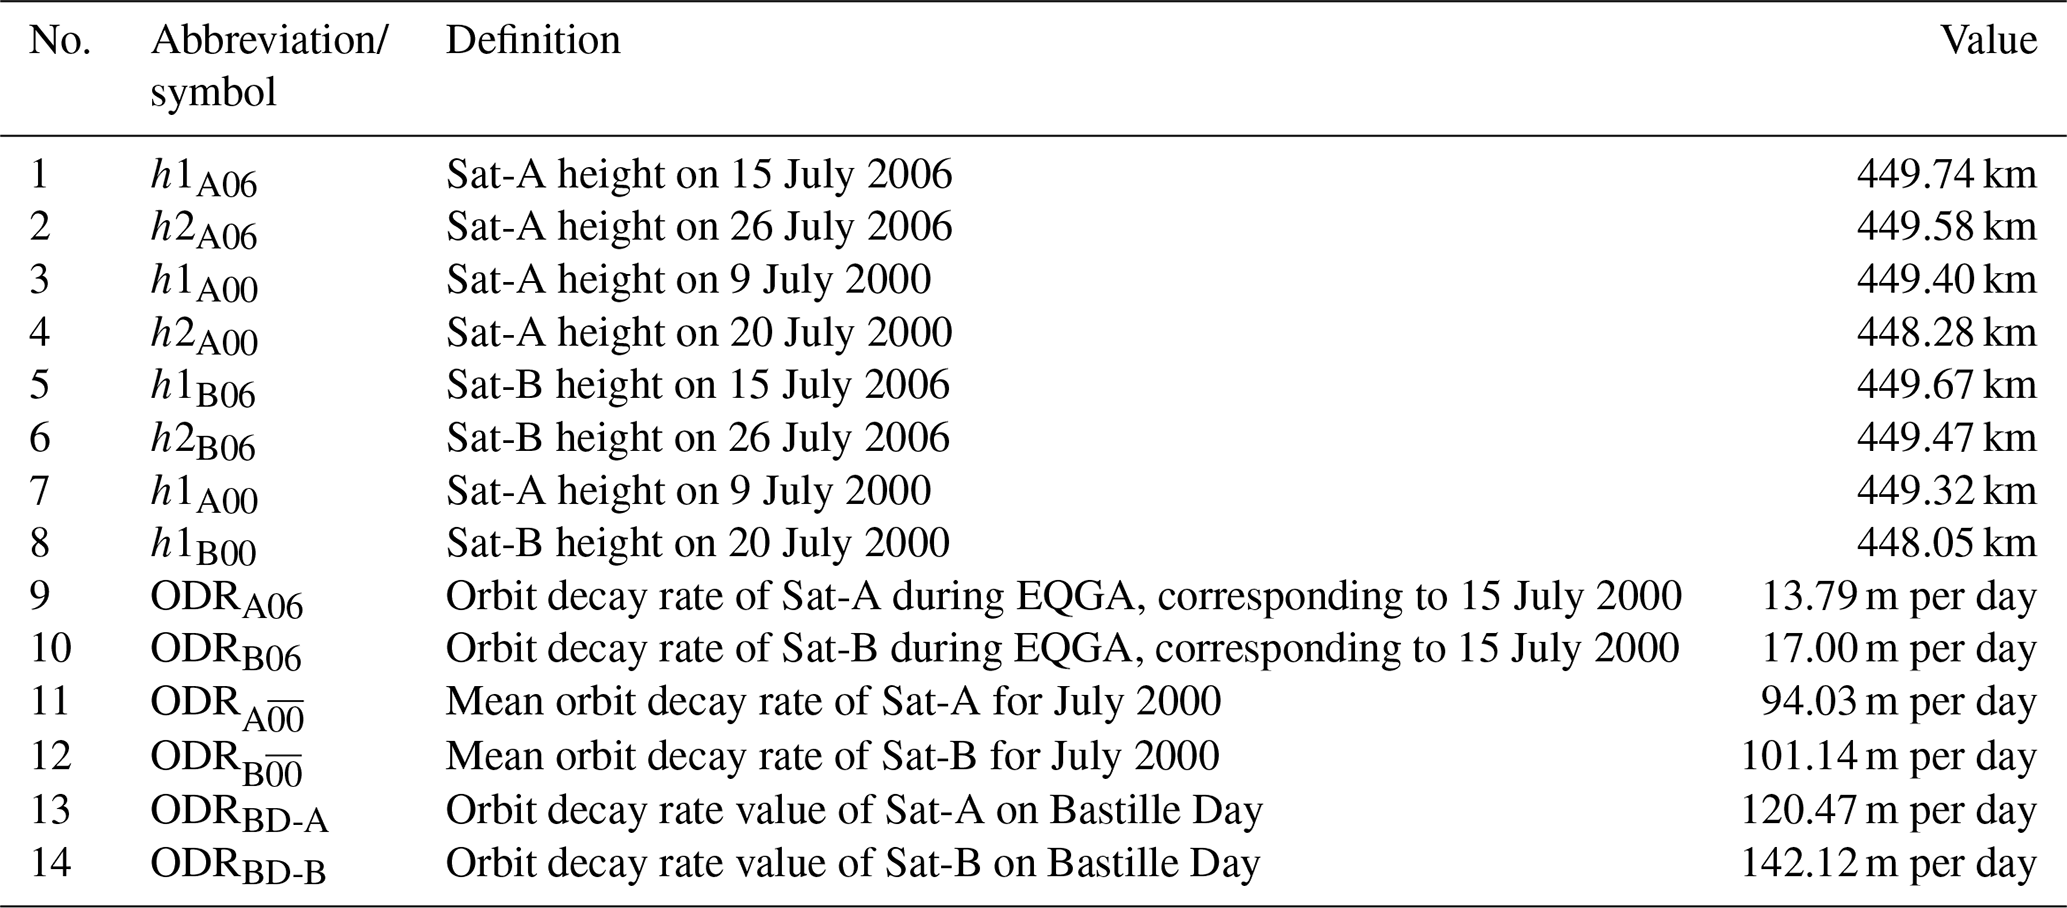
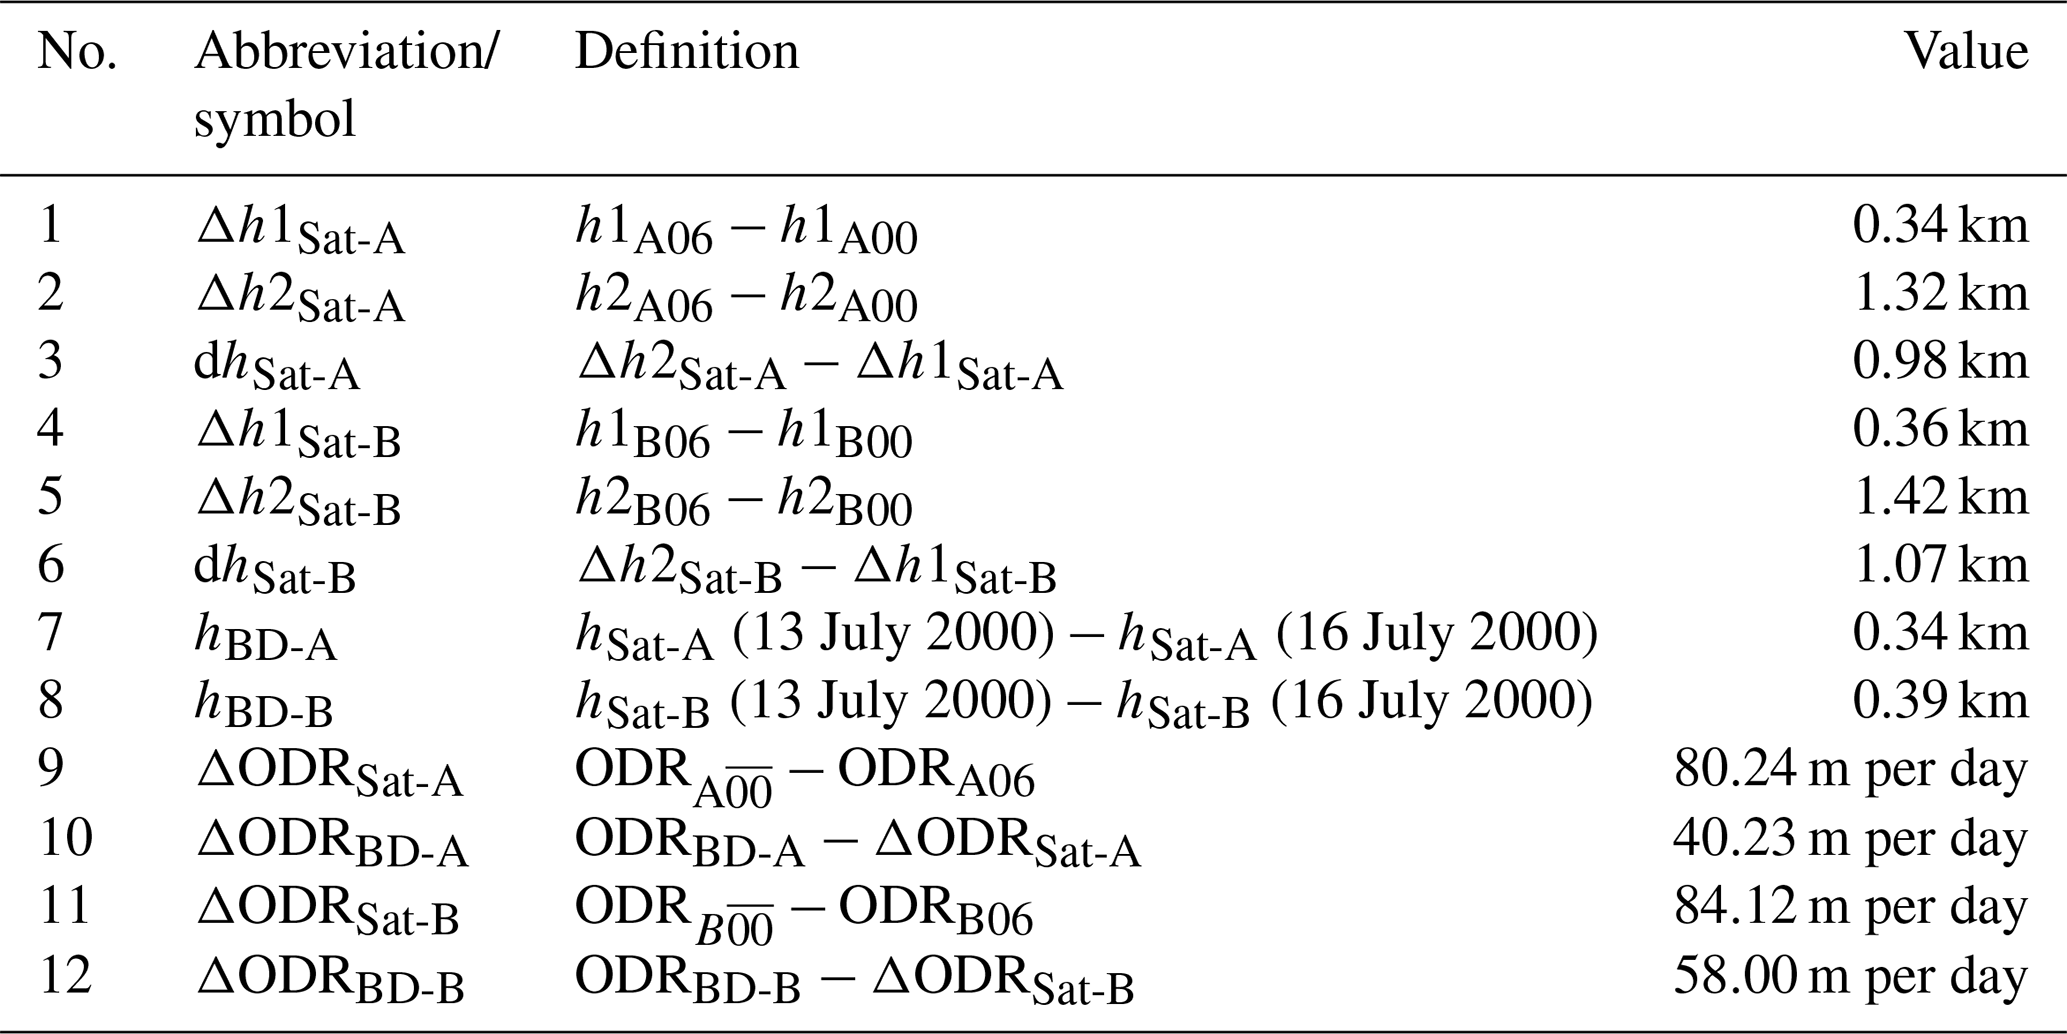
Table 4Indices used to analyse and contrast the effects of intervals of elevated and exceptionally quiet geomagnetic activity with those of the Bastille Day event.
The results of our simulation showed that the maximum ODRs for Sat-A and Sat-B were in response to the Bastille Day event. We glean from these results that the background atmospheric parameters were responsive to both the slowly varying solar irradiance inputs during the month and to the impulsive geomagnetic storm inputs. These results confirm that the transient response of satellite drag to impulsive geomagnetic storms lead to the largest uncertainties in orbit dynamics and pose a great risk to efficient satellite operations.
4.3 Intervals of exceptionally quiet and disturbed environmental stress
In this section, we focus on the 12 d sub-intervals of elevated solar and geomagnetic activity for 9–20 July 2000 and of exceptionally quiet activity for 15–26 July 2006. For these intervals, we compare and contrast the activity levels on the satellite trajectory (via h and ODR) with the corresponding perturbations in T and ρ. Figure 10 depicts 1 h averaged variations in Vsw, PD, Dst, IMF By and Bz and AE for the intervals of high activity (left) and low activity (right). In Fig. 11, we show the corresponding daily variations in Dst, Bz, ρ, T, h and ODR for Sat-A, with the lower ballistic coefficient (blue trace), and Sat-B, with the higher ballistic coefficient (red trace), within the intervals of elevated activity (left) and quiescent activity (right). During the sub-interval of elevated activity (left), the Sat-A orbit decayed by 1.14 km, and the ODR increased from 81.46 m per day on 9 July to 120 m per day on 16 July, which is just after the peak of the Bastille Day storm. Similarly, Sat-B decayed by about 1.27 km, and the ODR increased from 91.85 m per day on 9 July to 142 m per day on 16 July. Considering the sub-interval of low activity (right) Sat-A (blue trace) decayed by a total of 0.16 km, with an ODR ranging from 13.41 to 17.17 m per day, whereas Sat-B (red trace) decayed by a total of 0.20 km, with an ODR ranging from 16.67 to 21.25 m per day. The salient features for the orbital decay and maximum ODR for both satellites for the active versus quiet conditions are summarized in Table 2. The stark contrast between the two regimes indicates that solar–geomagnetic activity had a more than 6-fold (7-fold in this case) impact on the orbital parameters for the modelled conditions. This dramatic effect makes it imperative that the orbital parameters for relevant space objects in LEO be frequently updated (Knowles et al., 2001).
In Fig. 12, we show detailed analysis (and comparison) of how h and ODR of the two satellites varied during the regimes of elevated and exceptionally quiet solar and geomagnetic activity. The goal of this analysis is to demonstrate how enhanced atmospheric drag caused by the July 2000 Bastille Day event affected LEO satellites in contrast to the interval of exceptionally quiet geomagnetically activity conditions during 15–26 July 2006. We describe new indices in Tables 3 and 4 for the analysis. Associating the Tables with the geometry of curves in Fig. 12 gives a better understanding of the analysis to follow. When compared with the 12 d interval of exceptionally quiet geomagnetic activity, the total decay (h) and ODR increase (from the background or initial values) during the elevated geomagnetic activity are 0.98 km and 80.24 m per day for Sat-A (described by dhSat-A and ΔODRSat-A, respectively), and 1.07 km and 84.12 m per day for Sat-B (described by dhSat-B and ΔODRSat-B). The decay caused by the Bastille Day event are 0.34 and 0.39 km for Sat-A and Sat-B, respectively (described by hBD-A and hBD-B). The respective ODR increments (due to the Bastille Day event) are 40.23 and 58.00 m per day (described by ΔODRBD-A and ΔODRBD-B). The corresponding percentage increase of the two parameters (h and ODR), when contrasted with the interval of exceptionally quiet geomagnetic activity, are 74.24 % and 66.74 % for Sat-A and 75.35 % and 59.18 % for Sat-B. However, the additional percentage increase in the Bastille Day event to the monthly mean values of July 2000 are 34.69 % (h) and 50.13 % (ODR) for Sat-A and 36.45 % and 68.95 % for Sat-B. This result implies that storms of this magnitude can add more than 30 % and 50 %–70 % increase to background h and ODR during the interval.
Solar activity, in the form of increased solar irradiance and flux of energetic particles, forms important channels through which the Earth's atmosphere is impacted. Atmospheric heating and expansion can significantly increase orbital drag which, in turn, perturbs satellite trajectories and results in accelerated orbital decay. In this work, we simulated the effect of atmospheric drag on two hypothetical SmallSats in LEO with different ballistic coefficients during 1-month long intervals of disturbed and quiet solar–geomagnetic activity. During a 1-month period of enhanced activity (1–31 July 2000), the increased density of the upper atmosphere caused a modelled mean decay of 2.77 km (3.09 km) for the satellite with the smaller (larger) ballistic coefficient. Conversely, for the more quiescent period (1–31 July 2006), the mean decay was only 0.52 km (0.65 km) for the respective satellites. Further analysis and simulation of atmospheric drag for periods of elevated (or extreme) solar–geomagnetic activity during 9–15 July 2000 and exceptionally quiet geomagnetic activity (15–26 July 2006) resulted in Sat-A (Sat-B) modelled orbital decays of 1.14 km (1.27 km) and 0.16 km (0.20 km), respectively. We also estimated the enhanced atmospheric drag effect on the satellites's parameters caused by the July 2000 Bastille Day event, which is in contrast to the interval of geomagnetically quiet conditions. While the percentage increase in h and ODR, due to elevated geomagnetic activity (of 9–20 July 2000), is 74.24 % and 66.74 % (75.35 % and 59.18 %) for Sat-A (Sat-B), the additional (daily) percentage increase due to the Bastille Day event (14–15 July 2000) to the monthly mean values is 34.69 % and 50.13 % (36.45 % and 68.95 %) for Sat-A (Sat-B). The results of our simulation confirm the dependencies of satellite drag on the ballistic coefficient and on the level of solar–geomagnetic activity. While such dependencies are generally intuitive, our model is useful in quantifying these relationships and can, thus, contribute to an improved situational awareness and mitigate the potential threat posed by solar–geomagnetic activity in modulating satellite trajectories. In addition (to this and other contributions outlined earlier in this paper), this work motivated the development of new method and indices for describing and estimating atmospheric drag effects on satellite ephemeris (when comparing between regimes of varying solar–geomagnetic activity).
Our underlying software code is not publicly accessible at the moment due to time-to-time modifications (that builds on the gains of published work like this) that include robust prediction using artificial intelligence. Also, our laboratory is presently developing a database and/or repository where relevant data sets will be deposited in the future. In the meantime, requests related to the underlying software code should be directed to the corresponding author at vnwankwo@aul.edu.ng. In this work, we incorporated the NRLMSISE-00 empirical atmospheric model into our drag model, from which we obtained the corresponding density for the location traversed by the modelled satellite. According to the authors, users may acquire the file by downloading it from their website (http://uapwww.nrl.navy.mil/models_web/msis/msis_home.htm, last access: 2 June 2020) or by sending e-mail to NRLMSISE-00@uap2.nrl.navy.mil (no subject or message), which will result in a reply with the file as an attachment (see Picone et al., 2002).
VUJN conceived the idea of the study, designed the methodology and led the implementation of the model, data processing and analysis. VUJN also coordinated the interpretation and discussion of the results and writing the paper. WD assisted in conceiving the study, contributed to the data processing and analysis and interpretation and led the editing of the paper. SKC led the model and equation formulation, coding and implementation. JF moderated the interpretation of computed results and numerical analysis. J-PR and EC moderated the interpretation of geophysics data and assisted in editing the paper. MPA and AWA were involved in the solar data analysis and helped with the results interpretation. JEE moderated the interpretation and the inclusion of the applications of the study, and PIA was saddled with the data analysis and incorporating artificial intelligence (AI) for predictions based on interpreted results.
The authors declare that they have no conflict of interest.
We acknowledge use of NASA's GSFC Space Physics Data Facility's OMNIWeb service for the 1 h averaged values of Vsw, PD, Dst, IMF By and Bz and AE. The yearly averaged SSN (version 1.0) was obtained from the World Data Center Sunspot Index and Long-term Solar Observations (SILSO), Royal Observatory of Belgium, Uccle, Belgium. The daily and monthly averaged values for SSN, F10.7 and Ap were provided by the GFZ German Research Centre for Geosciences and Space Weather Canada. Other data sources include the Observatori de l'Ebre (Spain) and the SOHO LASCO CME catalogue. The authors also acknowledge Felix Oke of the Language Laboratory, Department of Languages and Linguistics, Anchor University, Lagos, for providing us with the temporal space to complete this paper at a critical moment when our facility suffered a power fault.
This paper was edited by Johan De Keyser and reviewed by Olugbenga Ogunmodimu and one anonymous referee.
Ambelu, T., Falayi, E. O., Elemo, E. O., and Oladosu, O.: Estimation of total solar irradiance from sunspot number, Lat. Am. J. Phys. Educ., 5, 741–745, available at: http://www.lajpe.org/dec11/LAJPE_576_Ambelu_Tebabal_prreprint_corr.pdf (last access: 25 March 2020), 2011. a
Ben-Yaacov, O., Edlerman, E., and Gurfil, P.: Analytical technique for satellite projected cross-sectional area calculation, Adv. Space Res., 56, 205–217, 2015. a
Bhatnagar, V. P., Germany, G. A., and Tan, A.: Satellite ballistic coefficients and the lower thermosphere, Geophys. Res. Lett., 32, L03109, https://doi.org/10.1029/2004GL021627, 2005. a
Bobrinsky, N. and Del Monte, L.: The Space Situational Awareness Program of the European Space Agency, Cosmic Res.+, 48, 392–398, https://doi.org/10.1134/S0010952510050035, 2010. a
Borovsky, J. E. and Denton, M. H.: Differences between CME‐driven storms and CIR‐driven storms, J. Geophys. Res., 111, A07S08, https://doi.org/10.1029/2005JA011447, 2006. a
Boteler, D. H.: A 21st century view of the March 1989 magnetic storm, Space Weather, 17, 1427–1441, https://doi.org/10.1029/2019SW002278, 2019. a
Bowman, B. R.: True Satellite Ballistic Coefficient Determination for HASDM, in: AIAA/AAS Astrodynamics Specialist Conference and Exhibit, Monterey, California, USA, 5–8 August 2002, Paper AIAA 2002-4887, available at: http://sol.spacenvironment.net/~JB2008/pubs/JB2006_AIAA_2002_4887.pdf (last access: 11 March 2020), 2002. a
Bowman, B. R., Tobiska, W. K., Marcos, F. A., Huang, C. Y. Lin, C. S., and Burke, W. J.: New Empirical Thermospheric Density Model JB2008 Using New Solar and Geomagnetic Indices, in: AIAA/AAS Astrodynamics Specialist Conference, Honolulu, Hawaii, 18–21 August 2008, Paper 6438, available at: http://sol.spacenvironment.net/~JB2008/pubs/AIAA_2008-6438_JB2008_Model.pdf (last access: 5 March 2020), 2008. a
Bruinsma, S., Thuillier, G., and Barlier, F.: The DTM-2000 empirical thermosphere model with new data assimilation and constraints at lower boundary: accuracy and properties, J. Atmos. Terr. Phys., 65, 1053–1070, https://doi.org/10.1016/S1364-6826(03)00137-8, 2003. a
Chobotov, V. A.: Orbital Mechanics, edn. 3, AIAA Education series, American Institute of Aeronautics Inc., Virginia, USA, 193–213, 2002. a, b, c
Clette, F., Svalgaard, L., Vaquero, J. M., and Cliver, E. W.: Revisiting the Sunspot Number: A 400-Year Perspective on the Solar Cycle, Space Sci. Rev., 186, 35–103, https://doi.org/10.1007/s11214-014-0074-2, 2014. a
Closs, R. L.: A possible explanation of the sudden commencement and initial phase of a magnetic storm in terms of induced ionospheric currents, J. Geophys. Res., 72, 3987–3993, https://doi.org/10.1029/JZ072i015p03987, 1967. a
Cooke, G. E.: Satellite drag coefficients, Planet. Space Sci., 13, 929–946, https://doi.org/10.1016/0032-0633(65)90150-9, 1965. a
Davis, T. N. and Sugiura, M.: Auroral electrojet activity index AE and its universal time variations, J. Geophys. Res., 71, 785–801, https://doi.org/10.1029/JZ071i003p00785, 1966. a
Denig, W. F., Wilkinson, D. C., and Redmon, R. J.: Extreme Space Weather Events: A GOES Perspective, in: Extreme Events in Geospace – Origins, Predictability and Consequences, edited by: Buzulukova, N., Elsevier, USA, 283–347, https://doi.org/10.1016/B978-0-12-812700-1.00012-1, 2018. a, b
Eddy, J.: The Sun, the Earth, and Near-Earth Space: A Guide to the Sun-Earth System, US Government Printing Office, ISBN 978-0-16-08308-8, available at: https://lwstrt.gsfc.nasa.gov/images/pdf/john_eddy/SES_Book_Interactive.pdf (last access: 16 March 2020), 2009. a
Emmert, J. T.: Thermospheric mass density: A review, Adv. Space Res., 56, 773–824, https://doi.org/10.1016/j.asr.2015.05.038, 2015. a
Fujiwara, H., Miyoshi, Y., Jin, H., Shinagawa, H., Otsuka, Y., Saito, A., and Ishii, M.: Thermospheric temperature and density variations, Proc. IAU, 5, 310–319, https://doi.org/10.1017/S1743921309992857, 2009. a, b, c, d
Gonzalez, W. D., Joselyn, J. A., Kamide, Y., Kroehl, H. W., Rostoker, G., Tsurutani, B. T., and Vasyliunas, V. M.: What is a geomagnetic storm?, J. Geophys. Res., 99, 5771–5792, https://doi.org/10.1029/93JA02867, 1994. a
Gosling, J. T. and Pizzo, V.: Formation and Evolution of Co-rotating Interaction Regions and their Three Dimensional Structure, Space Sci. Rev., 89, 21–52, https://doi.org/10.1023/A:1005291711900, 1999. a
Gosling, J. T., Bame, S. J., McComas, D. J., and Phillips, J. L.: Coronal mass ejections and large geomagnetic storms, Geophys. Res. Lett., 17, 901–904, https://doi.org/10.1029/GL017i007p00901, 1990. a
Guarnieri, F. L., Tsurutani, B. T., Gonzalez, W. D., Echer, E., and Gonzalez, A. L. C.: ICME and CIR storms with particular emphasis on HILDCAA events, in: ILWS Workshop 2006, Goa, India, 19–20 February 2006, available at: https://cdaw.gsfc.nasa.gov/publications/ilws_goa2006/266_Guarnieri.pdf (last access: 20 March 2020), 2006. a
Jakhu, R. S.: Iridium-Cosmos collision and its implications for space operations, in: Yearbook on Space Policy 2008/2009, edited by: Schrogl, K.-U. et al., Springer, Wien, New York, 254–275, 2009. a
Kelso, T. S.: Analysis of the Iridium 33Cosmos 2251 Collision, AAS 09-368, available at: https://celestrak.com/publications/AAS/09-368/AAS-09-368.pdf (last access: 16 March 2020), 2009. a
Kepko, L., McPherron, R. L., Amm, O., Apatenkov, S., Baumjohann, W., Birn, J., Lester, M., Nakamura, R., Pulkkinen, T. I., and Sergeev, V.: Substorm Current Wedge Revisited, Space Sci. Rev., 190, 1–46 https://doi.org/10.1007/s11214-014-0124-9, 2015. a
King-Hele, D.: Satellite Orbits in an Atmosphere: Theory and Applications, Kluwer Academic Publisher Group, the Netherlands, 1987. a
Knipp, D.: Understanding Space Weather and the Physics Behind It, Space Technology Series, American Geophysical Union, USA, 727 pp., ISBN 978-0-07-340890-3, 2011. a
Knowles, S., Picone, J., Thonnard, S., and Nicholas, A. C.: The Effect of Atmospheric Drag on Satellite Orbits During the Bastille Day Event, Sol. Phys., 204, 387–397, https://doi.org/10.1023/A:1014223807360, 2001. a
Mayaud, P. N.: Derivation, Meaning, and Use of Geomagnetic Indices, in: Geophysical Monograph 22, American Geophysical Union, Washington D.C., USA, 1980. a
McPherron, R. L., Russell, C. T., and Aubry, M. P.: Satellite studies of magnetospheric substorms on 15 August 1968: 9. Phenomenological model for substorms, J. Geophys. Res., 78, 3131–3149, https://doi.org/10.1029/JA078i016p03131, 1973. a
Mitra, A. P.: Ionospheric Effects of Solar Flares, Astrophysics and Space Science Library (ASSL), 46, Springer, Dordrecht, The Netherlands, 305 pp., https://doi.org/10.1007/978-94-010-2231-6, 1974. a
Nwankwo V. U. J.: Effects of Space Weather on Earth's Ionosphere and Nominal LEO Satellites' Aerodynamic Drag, PhD Thesis, University of Calcutta, Kolkata, India, 2016. a, b, c, d, e
Nwankwo, V. U. J.: Space Weather: Responses of the Atmosphere to Solar Activity and Its Implications for LEO Satellites Aerodynamic Drag, in: Exploring the Universe: From Near Space to Extra-Galactic, edited by: Mukhopadhyay, B. and Sasmal, S., Springer Int. Publ., Switzerland, 2018. a
Nwankwo, V. U. J. and Chakrabarti, K. S.: Effects of plasma drag on low Earth orbiting satellites due to heating of Earth's atmosphere by coronal mass ejections, arXiv:1305.0233c1, https://arxiv.org/abs/1305.0233, 2013. a
Nwankwo, V. U. J and Chakrabarti, K. S.: Theoretical modeling of drag force impact on a model international space station (ISS) during variation of solar activity, T. Jpn. Soc. Aeronaut. S., 12, 47–53, 2014. a
Nwankwo, V. U. J. and Chakrabarti, K. S.: Analysis of planetary and solar-induced perturbations on trans-Martian trajectory of Mars missions before and after Mars orbit insertion, Indian J. Phys., 89, 1235–1245, https://doi.org/10.1007/s12648-015-0705-9, 2015. a, b, c, d, e
Nwankwo, V. U. J. and Chakrabarti, K. S.: Effects of space weather on the ionosphere and LEO satellites' orbital trajectory in equatorial, low and middle latitude, Adv. Space Res., 61, 1880–1889, https://doi.org/10.1016/j.asr.2017.12.034, 2018.
Nwankwo, V. U. J., Chakrabarti, K. S., and Weigel, R. S.: Effects of plasma drag on low Earth orbiting satellites due to solar forcing induced perturbations and heating, Adv. Space Res., 56, 47–56, https://doi.org/10.1016/j.asr.2015.03.044, 2015. a, b, c
Nwankwo, V. U. J., Denig, W., Ajakaiye, M. P., Wahabbi Akanni, J. F., Raulin, J.-P., Correia, E., and Enoh, J. E.: Simulation of atmospheric drag effect on low Earth orbit satellites during intervals of perturbed and quiet geomagnetic conditions in the magnetosphere-ionosphere system, in: 2020 International Conference in Mathematics, Computer Engineering and Computer Science (ICMCECS), Ayobo, Nigeria, 18–21 March 2020, 1–7, https://doi.org/10.1109/ICMCECS47690.2020.247003, 2020a. a, b
Nwankwo, V. U. J., Jibiri, N. N., and Kio, M. T.: The impact of space radiation environment on satellites operation in near-Earth space, in: Satellites Missions and Technologies for Geosciences, edited by: Demyanov, V. and Becedas, J., InTech Open Publishing, London, UK, https://doi.org/10.5772/intechopen.90115, 2020b. a
Parker, E. N.: Dynamics of the Interplanetary Gas and Magnetic Fields, Astrophys. J., 128, 664–676, https://doi.org/10.1086/146579, 1958. a
Phillips, K. J. H.: Solar flares: A review, Vistas Astron., 34, 353–365, https://doi.org/10.1016/0083-6656(91)90014-J, 1991. a
Picone, J. M., Hedin, A. E., Drobm, D. P., and Aikin, A. C.: NRLMSISE‐00 empirical model of the atmosphere: Statistical comparisons and scientific issues, J. Geophys. Res., 107, 468–1484, https://doi.org/10.1029/2002JA009430, 2002. a
Pokhotelov, D., Mitchell, C. N., Jayachandran, P. T. MacDougall, J. W., and Denton, M. H.: Ionospheric response to the corotating interaction region – driven geomagnetic storm of October 2002, J. Geophys. Res., 114, A12311, https://doi.org/10.1029/2009JA014216, 2009. a
Posner, A., Bothmer, V., Thompson, B. J., Kunow, H., Heber, B., Müller‐Mellin, R., Lazarus, A. J., Szabo, A., Mikić, Z., and Linker, J. A.: In‐ecliptic CIR‐associated energetic particle events and polar coronal hole structures: SOHO/COSTEP observations for the Whole Sun Month Campaign, J. Geophys. Res., 104, 9881–9890, https://doi.org/10.1029/98JA02654, 1999. a
Pudovkin, M. I., Semenov, V. S., Kotikov, A. L., and Shishkina, E. M.: Dynamics of auroral electrojets and energetics of substorms, J. Atmos. Terr. Phys., 57, 187–192, https://doi.org/10.1016/0021-9169(93)E0033-6, 1995. a
Raeder, J., Wang, Y. L., Fuller-Rowell, T. J., and Singer, H. J.: Global simulation of magnetospheric space weather effects of the Bastille day storm, Sol. Phys., 204, 325–338, 2001. a
Rose, D. C. and Ziauddin, S.: The polar cap absorption effect, Space Sci. Rev., 1, 115–134, https://doi.org/10.1007/BF00174638, 1962. a
Rostoker, G.: Geomagnetic indices, Rev. Geophys., 10, 935–950, https://doi.org/10.1029/RG010i004p00935, 1972. a
Ryan, J. M., Lockwood, J. A., and Debrunner, H.: Solar Energetic Particles, Space Sci. Rev., 93, 35–53, https://doi.org/10.1023/A:1026580008909, 2000. a
Sauer, H. H. and Wilkinson, D. C.: Global mapping of ionospheric HF/VHF radio wave absorption due to solar energetic protons, Space Weather, 6, S12002, https://doi.org/10.1029/2008SW000399, 2008. a
Schatten, K.: Large Scale Properties of the Interplanetary Magnetic Field, NASA Goddard Space Flight Center, N71-20467, available at: https://ntrs.nasa.gov/archive/nasa/casi.ntrs.nasa.gov/19710010992.pdf (last access: 16 March 2020), 1971. a
Sidi M. J.: Spacecraft Dynamics and Control, Cambridge University Press, Cambridge, UK, 1997. a
Song, P., Singer, H. J., and Siscoe, G. L.: Space Weather, AGU Geophysical Monograph Series, AGU, Washington, DC, Number 125, 96, 440 pp., ISBN 13:9780875909844, 2001. a
Srivastava, N. and Venkatakrishnan, P.: Relationship between CME Speed and Geomagnetic Storm Intensity, Geophys. Res. Lett., 29, 9, https://doi.org/10.1029/2001GL013597, 2002. a
Tapping, K. F.: The 10.7 cm solar radio flux (F10.7), Space Weather, 11, 394–406, https://doi.org/10.1002/swe.20064, 2013. a
Walterscheid, R. L.: Solar cycle effects on the upper atmosphere – Implications for satellite drag, Journal of Spacecraft and Rockets, in: Proc. AIAA, Aerospace Engineering Conference and Show, Los Angeles, California, USA, 14–16 February 1989, 439–444, available at: https://doi.org/10.2514/3.26089, 1989. a
Watari, S., Kunitake, M., and Watanabe, T.: The Bastille day (14 July 2000) event in historical large Sun-Earth connection events, Sol. Phys., 204, 423–436, 2001. a, b
Webber, W. R., McDonald, F. B., Lockwood, J. A., and Heikkila, B.: The effect of the 14 July 2000 “Bastille Day” solar flare event on > 70 MeV galactic cosmic rays observed at V1 and V2 in the distant heliosphere, Geophys. Res. Lett., 29, 1377, https://doi.org/10.1029/2002GL014729, 2002. a
Wertz, J. and Larson, W. J.: Space Mission Analysis and Design, edn. 3, Kluwer Academy, El Segundo, California, USA, 145 pp., 1999. a
Yermolaev, Y. I., Lodkina, G. I., Nikolaeva, N. S., and Yermolaev, M. Y.: Geoeffectiveness of Solar and Interplanetary Structures and Generation of Strong Geomagnetic Storms, in: Extreme Events in Geospace – Origins, Predictability and Consequences, Elsevier, USA, edited by: Buzulukova, N., 99–113, https://doi.org/10.1016/B978-0-12-812700-1.00004-2, 2018. a
- Abstract
- Introduction
- Solar and geomagnetic activities and their implications for atmospheric drag
- Modelling atmospheric drag effect on LEO satellites' trajectory
- Results and discussion
- Conclusions
- Code and data availability
- Author contributions
- Competing interests
- Acknowledgements
- Review statement
- References