the Creative Commons Attribution 4.0 License.
the Creative Commons Attribution 4.0 License.
Characteristics of the layered polar mesosphere summer echoes occurrence ratio observed by EISCAT VHF 224 MHz radar
Shucan Ge
Hailong Li
Tong Xu
Mengyan Zhu
Maoyan Wang
Lin Meng
Safi Ullah
Abdur Rauf
Polar mesosphere summer echoes (PMSEs) are strong radar echoes observed in the polar mesopause during the local summer. Observations of layered PMSEs carried out by the European Incoherent Scatter Scientific Association very-high-frequency (EISCAT VHF) radar during 2004–2015 in the latest solar cycle are used to study the variations of the PMSE occurrence ratio (OR). Different seasonal behavior of PMSEs is found by analyzing the seasonal variation of PMSE mono-, double-, and tri-layer OR. A method was used to calculate the PMSE mono, double-, and tri-layer OR under a different electron density threshold. In addition, a method to analyze the correlation of the layered PMSE OR with the solar 10.7 cm flux index (F10.7) and geomagnetic K index is proposed. Based on it, the correlation of the layered PMSE OR with solar and geomagnetic activities is not expected to be affected by discontinuous PMSEs. It is found that PMSE mono-, double-, and tri-layer ORs are positively correlated with the K index. The correlation of the PMSE mono- and double-layer OR with F10.7 is weak, whereas the PMSE tri-layer OR shows a negative correlation with F10.7.
- Article
(5630 KB) - Full-text XML
- BibTeX
- EndNote
The ionosphere is an important part of the near-Earth space environment, and the mesosphere is the coldest region in the Earth's atmosphere. Polar mesosphere summer echoes (PMSEs) are strong echoes detected by radars from medium-frequency (MF) to ultra-high-frequency (UHF) bands in the polar summer mesopause, and PMSEs have been considered to be possible indicators of global climate change (Thomas and Olivero, 2001). The observation range is from 75 to 100 km, where the strongest echo occurs at the altitude of about 86 km on average (Czechowsky et al., 1979). Radar waves in the very-high-frequency (VHF) band are backscattered due to the irregularities of electron density with spatial scales of about half the wavelength of the radar. This has been confirmed by Blix et al. (2003) from simultaneous rocket and radar observations. The most extensively accepted theory is that the irregularities of electron density are sustained due to the reduction in electron diffusion characterized by the slowest ambipolar diffusion mode associated with the charged ice grains (Cho et al., 1992). Varney et al. (2011) scrutinized one particular aspect of the turbulent theory of PMSEs: the electron density dependence of the echo strength. One remarkable feature of all PMSEs is the fact that the radar echoes often occur in the form of two or more distinct layers which can persist for periods of up to several hours. Until now, the layering mechanism leading to these multiple structures has only been poorly understood in spite of some previous attempts involving gravity waves, the general thermal structure, and Kelvin–Helmholtz instabilities (Röttger, 1994; Klostermeyer, 1997; Hill et al., 1999; Hoffmann, 2005).
Palmer et al. (1996) statistically analyzed the PMSEs in the Northern Hemisphere observed by the EISCAT VHF radar during 1988–1993. They suggested that (1) PMSEs are summer phenomena, lasting from June to August; (2) PMSEs occur mostly around noon and midnight, following a semidiurnal pattern; and (3) the echoing structures move bodily, perhaps in response to gravity waves. Based on measurements at Andenes, Norway, observed by the 53.5 MHz ALOMAR SOUSY radar during 1994–1997 and the ALWIN radar during 1999–2001, Bremer et al. (2003) found that the variation of PMSEs is markedly controlled by solar cycle variations and precipitating high energetic particle fluxes. Bremer et al. (2006) discussed how the strength of PMSEs depends on the level of ionization because of the long-term changes in mesospheric summer echoes caused by the incident solar wave radiation and precipitating high energetic particle fluxes from about 20 May to the end of August during 1998–2006. Smirnova et al. (2010) used the ESRAD MST (Esrange Mesosphere–Stratosphere–Troposphere) radar's measurements and found that the inter-annual variations of the PMSE OR (occurrence ratio) and length of the season anticorrelated with solar activity (F10.7 index, the daily solar activity proxy) but not significantly, and that the PMSE OR correlates with geomagnetic activity (AP index). However, no statistically significant trends in PMSE yearly strengths were found in their work. Smirnova et al. (2011) concentrated on the accurate calculation of PMSE absolute strength as expressed by radar volume reflectivity and found that the inter-annual variations of PMSE volume reflectivity strongly correlate with the local geomagnetic K index and anticorrelate with solar 10.7 cm flux. However, they did not find any statistically significant trend in PMSE volume reflectivity during 1997–2009. Li and Rapp (2011) reported that the PMSE OR at 224 MHz shows a positive correlation with both the solar and geomagnetic activities. PMSEs have been detected and widely studied based on long-term observations of many different MST radars (Reid et al., 1989; Thomas et al., 1992; Smirnova et al., 2011). Since the first observation of PMSEs in 1979, it has been well known that the PMSE observations are different when observed by different-frequency radar even at the same sites, and PMSEs often show obvious layered events.
Many studies have widely reported that there is a significant correlation between the ionization level and PMSEs observed by 53.5 MHz radar (Inhester et al., 1990; Belova et al., 2007; Latteck et al., 2008). The correlation of the ionization level with PMSEs at 224 MHz is as significant as that of the correlation of the ionization level with PMSEs at 53.5 MHz; previous studies provide the research basis and ideas for the PMSE study detected by 224 MHz radar. There are still a few significant problems that must be solved with the characteristics of the layered PMSE OR. Hence, it is necessary to analyze the layered PMSE OR and study layered PMSE characteristics deeply with data measured by 224 MHz EISCAT VHF radar under different observation conditions. The statistical results of the layered PMSE OR with the same radar at the same site over the period 2004–2015 are given in this paper, which was based on the experimental data detected by 224 MHz EISCAT VHF radar. In addition, the correlation of the PMSE OR with the geomagnetic K index and F10.7 is analyzed and discussed. The method of the correlation analysis between the layered PMSE OR and solar activity and between the layered PMSE OR and geomagnetic activity is given in this paper without being affected by the defect of discontinuous PMSE measurements of EISCAT radar. It is helpful for describing the characterization of the layered PMSE OR. The aim of the current work is to provide a definitive data foundation for further analysis of layered PMSEs, and we try to identify important open issues for future investigations.
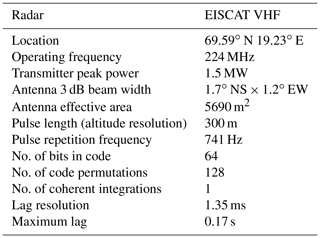
The PMSE observations used here were obtained with 224 MHz EISCAT VHF radar from 2004 to 2015. The EISCAT VHF radar is located at Tromsø, Norway (69.35∘ N, 19.14∘ E), using a parabolic cylindrical 120 m × 40 m antenna. It is a powerful tool to study the lower ionosphere. Detailed descriptions of the radar can be found in Baron (1986). The measurements by EISCAT radar are very well suited for investigating the characteristics of PMSEs (for previous work, see, e.g., Li et al., 2010, and references therein). It has frequency and phase modulation capability with a pulse length of 1 µs to 2 ms. The parameters are shown in Table 1 for accuracy control of EISCAT VHF radar.
EISCAT VHF radar ran several standard experimental modes: manda, beata, bella, tau7, arcd (arc_dlayer), and tau1. The main differences between these experimental modes are illustrated in Table 2. The manda and arcd modes are mainly used for low-altitude detection and provide spectral measurements at mesospheric altitude. Therefore, the accurate data used in this study are mainly provided by manda and arcd modes.
In this study, we use the EISCAT VHF radar data from 2004 to 2015. The GUISDAP software package (Grand Unified Incoherent Scatter Design and Analysis Program) (see Lehtinen and Huuskonen, 1996, and visit http://www.eiscat.se, last access: 27 May 2019, for details) was used to analyze the radar data. The electron density Ne analyzed by the GUISDAP software was obtained between 106 and 1014 m−3. The level of electron density represents the intensity of echoes.
First of all, the heating parts were removed from the data set to avoid the heating effect. After that, the presence of PMSEs was defined as the threshold of electron density ( m−3). We have used the PMSE threshold given by Hocking and Röttger (1997) and Appendix A Table A2 of Li and Rapp (2011). In addition, some abnormal echoes are related to meteors. It is not considered to be a PMSE and is neglected in later discussion. PMSEs are not continuous in time. If the electron density satisfies the threshold ( m−3), we considered it to be a PMSE event. We have considered only those events whose PMSEs are continuous for time (t≥1 min).
4.1 Layered PMSE events
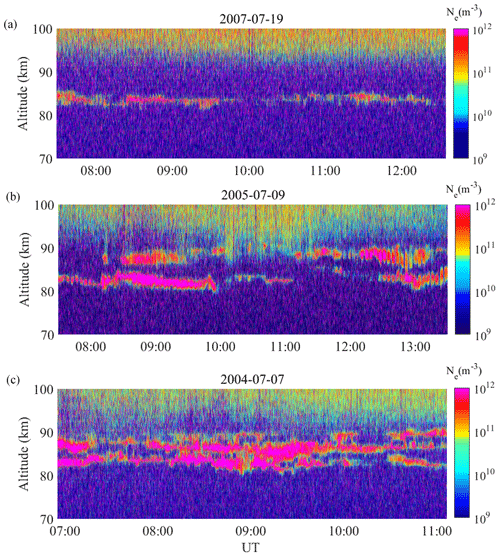
PMSEs occur in thin layers with an average thickness of up to 3–4 km of the monolayer, and the mean altitude distribution of PMSE events is 80–90 km. It is considered to be the area of independent anomalous echoes. Figure 1a, b, and c show the typical events of PMSE monolayer, double-layer, and tri-layer, respectively. As mentioned in the introduction, a notable feature of PMSEs observed by radar is that the radar echoes typically occur in the form of two or more layers. However, the systematic theories of the layering mechanism led to these multiple structures not coming into being. Here we will study the occurrence of these layered PMSE events and their relationships with solar and geomagnetic activity. This content will be discussed in detail later in the paper.
4.2 Layered PMSE OR calculation method
The calculation method is based on individual horizontal profiles. When the electron density satisfies the PMSE threshold ( m−3), then that time was taken as the starting time of the PMSE occurrence and until the time when the electron density fails to satisfy the threshold was taken as the end time of PMSE occurrence. The time of PMSE duration is the time difference between the end and starting times of the PMSE occurrence. The time interval cannot be regarded as a PMSE occurrence time if the time interval between them is shorter than 1 min (t<1 min). Taking the calculation method of the monolayer PMSE OR as an example: we defined the ratio between the sustained time of monolayer PMSEs and the total observation time as the monolayer PMSE OR. The applied procedure for the detection of multiple PMSE layers is based on individual vertical profiles with a high temporal resolution (Hoffmann, 2005). The layer ranges are identified by an electron density threshold of 2.6×10¹¹ m−3 ( m−3). Once a vertical profile of the electron density has two peaks and these two peaks are higher than the threshold ( m−3), we select it as a double layer. The PMSE double-layer OR is the ratio between the sustained time of the PMSE double layer and the total observation time. The tri-layer OR is also calculated in the same way.
4.3 The variations of layered PMSE occurrence ratios
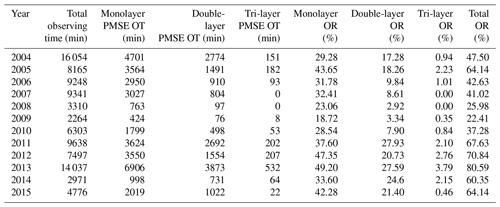
The layered PMSE OR, layered PMSE occurrence time (OT), and total observing time detected by EISCAT VHF radar from 2004 to 2015 are illustrated in Table 3. PMSE monolayer, double-layer, tri-layer, and total OR are also presented in Table 3.
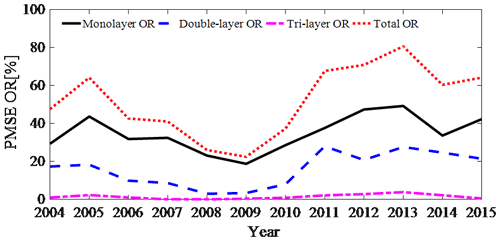
Figure 2Annual mean layered PMSE occurrence ratio. The OR of the total (red dot line). The OR of the monolayer (black solid line). The OR of the double layer (blue dashed line). The OR of the tri-layer (pink dot–dashed line).
Figure 2 shows that the annual mean mono-, double-, and tri-layer ORs agree with the total PMSE OR. We calculated the correlation of the annual mean monolayer with the double-layer OR, tri-layer OR, and total OR using the Spearman rank correlation coefficients (it will be particularly described in Sect. 4.3.2). The correlation coefficients (rs) of the monolayer with double-layer OR, tri-layer OR, and total OR are 0.7922, 0.7718, and 0.9480, respectively. All the correlation coefficients are statistically significant with P<0.05. These high values of correlation coefficients show that the correlation of annual mean monolayers with an annual mean double-layer OR, tri-layer OR, and total OR is very high. In addition, the annual mean layered PMSE OR from 2008 to 2010 is relatively low, and the solar activity is relatively “quiet” in these years.
Figure 2 shows two significant phenomena. (1) The variation trends of the annual mean mono-, double-, and tri-layer PMSE ORs have rules to follow: i.e., the OR of the monolayer is the highest, the double layer lies in the middle, and the tri-layer is the lowest. (2) The annual mean layered PMSE and total OR values show a similar shape of the sinusoidal, which has an obvious wave peak and wave valley. One wave peak lies in 2005, and the other lies in 2013. The values of two wave peaks are different and the values in 2005 are smaller than that in 2013. The values of the wave valley lie in 2008–2009. Here we only give the results of the data analysis and no longer do the cause analysis, because the stratification of PMSEs is affected by many factors and has not been decided yet. The analyzing method and results given in this paper have a significant reference value for studying the PMSE phenomenon.
4.4 Seasonal behavior
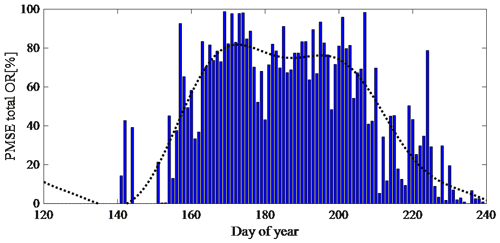
The mean seasonal variations of the layered PMSE OR and PMSE total OR observed by EISCAT VHF radar during 2004–2015 are shown in Figs. 3 and 4, respectively. Figure 3 illustrates the mean seasonal variation of the mono- (blue bars), double- (yellow bars), and tri-layer (red bars) PMSE OR and quartic polynomial fitting for the monolayer PMSE OR (black dot curve) during 2004–2015. Figure 4 shows the mean seasonal variation of the total PMSE OR (blue bars) and 3∕π harmonic fitting for the total PMSE OR (black dot curve) during 2004–2015. It is clear from Figs. 3 and 4 that the monolayer PMSE in Tromsø, Norway, often begins in late May, reaches its maximum in early June or mid-June, keeps this level until the end of July or beginning of August, and gradually decreases or vanishes when it is close to the end of August or the beginning of September in general, which is in agreement with Smirnova et al. (2011). The double-layer PMSE also begins in late May, but its maximum value appears in mid-July. In addition, it keeps the larger value in June and July, and it simply fades away in early August. The tri-layer PMSE appears a lot less in comparison with mono- and double-layer PMSEs. In terms of time, it appears later and disappears earlier. Furthermore, the tri-layer PMSE OR is large at the end of June and early July, which is different from the monolayer and double-layer PMSE ORs.
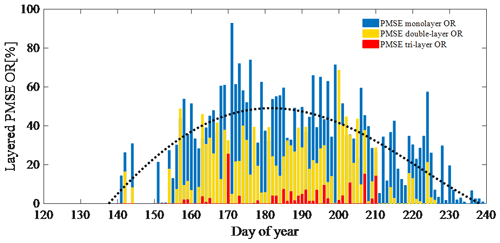
Figure 3Mean seasonal variation of the mono- (in blue), double- (in yellow), and tri-layer (in red) PMSE occurrence ratio from 2004 to 2015.
According to the statistical results, the monolayer, double-layer, and tri-layer PMSE ORs have seasonal variation. Moreover, there is fluctuation in the trends of F10.7 and the geomagnetic K index. Therefore, it is necessary to investigate the correlation of solar and geomagnetic activity with a differently layered PMSE OR during 2004–2015, and we should try to explain the occurrence mechanism of PMSEs. It is well known that other missions apart from PMSE regular observations are performed by EISCAT VHF radar, so EISCAT radar does not provide continuous PMSE observations. We raise an important question: Table 3 indicates a difference in total observation time for the individual years. How has this been taken into account for the determination of occurrence ratios? To solve this problem, we use another method to recalculate the layered PMSE OR. Then, the correlations between the layered PMSE OR and the F10.7 and between the layered PMSE OR and the K index are studied. As mentioned in the calculation method section, we only select the days when PMSEs are present, and calculate the layered ORs of PMSEs.
The layered PMSE OR was calculated and the relations among PMSE mono-, double-, and tri-layer ORs were analyzed statistically. At the same time, the mean seasonal variations of the layered PMSE OR and PMSE total OR have been presented. Hoffmann (2005) shows that the layering occurs because of subsequent nucleation cycles of ice particles in the uppermost (and coldest) gravity-wave-induced temperature minimum (see Hoffmann, 2005, Fig. 3a). Subsequently, these newly created ice particles grow and sediment down and lead to the distinct layering. In addition, Rapp and Lübken (2004) found that charged ice particles and atmospheric turbulence play major roles in the change in the electron number density that leads to PMSEs in the mesopause region. We know that solar and geomagnetic activities have a certain degree of influence on the occurrence of PMSEs; however, the effects of solar and geomagnetic activities on layered PMSEs are not understood well. Therefore, it is necessary to study the effects of solar and geomagnetic activities on layered PMSEs. The occurrence ratio obtained by the ratio of the occurrence time of PMSEs to the total observation time is the calculation method in the traditional sense. It is easy to understand and accurately analyze the short-term variations, such as diurnal variation and seasonal variation of PMSEs. However, the long-term trend is subject to error and dispute by this calculation method. Furthermore, it is difficult to discuss and analyze the correlation of the layered PMSE OR with solar and geomagnetic activities. Therefore, we have presented a new calculation method for calculating the layered PMSE occurrence ratio, which is different from the method given in Sect. 4.2, so that the layered PMSE OR is relatively accurate. The correlation of PMSEs with solar and geomagnetic activities is not expected to be affected by discontinuous PMSEs. The study of relations between PMSEs and solar activities and between PMSEs and geomagnetic activities is significant.
5.1 Another method for layered PMSE OR calculation
The emphasis of this section is to present a hybrid algorithm based on grid partitioning. The calculation method is based on altitude. A large number of literatures and experimental observations have shown that the altitude range of PMSEs is 80–90 km (Li and Rapp, 2011; Smirnova et al., 2010; Latteck and Bremer, 2013). Hoffmann (2005) shows a mean height of 84.8 km for monolayer PMSEs. In the case of multiple-layer PMSEs, the lower layer occurs at a mean height of ∼83.4 km. The second layer in the case of multiple PMSE layer structures shows a maximum at about 86.3 km (the judging criteria in regard to the multiple-layer PMSE; see Sect. 4.3). Firstly, we counted the total number of electron density at altitudes of 80–90 km and then counted the number of electron density satisfying the PMSE threshold ( m−3) in the period when the PMSE is known to be present (if electron density satisfies the threshold m−3, we identify layered PMSEs existing at this moment). The ratio between the numbers of layered PMSE electron density values larger than the threshold and the numbers of total electron density at altitudes of 80–90 km was calculated. The double-layer and tri-layer PMSE ORs calculated by this method are higher than the layered PMSE OR calculated by the method given in Sect. 4.2. The correlation coefficients were calculated between the PMSE OR and the 10.7 cm of the solar flux index (F10.7) and between the PMSE OR and geomagnetic K index, respectively. The PMSEs have been identified only for the time of PMSE duration longer than 1 min (t≥1 min). Because the integration times of the manda and arcd models are 4.8 and 2 s, respectively, on the basis of the condition (t≥1 min), the PMSE is needed to be for ≥12 and 30 data points, respectively.
5.2 Layered PMSE OR under different electron density thresholds
In this section, the day of the first occurrence of PMSEs in 2004 (regardless of duration) was recorded as 1, and the day with the later occurrence of PMSEs increased by sequence. Using this sequence as the horizontal axis and layered PMSE ORs with different electron density thresholds as the vertical axis, the results are shown in Figs. 5, 6, and 7. That is, Figs. 5, 6, and 7 show PMSE mono-, double-, and tri-layer ORs under different electron density thresholds, respectively. In the calculation method section we have defined the electron density threshold ( m−3). Here, we give the layered PMSE ORs with thresholds m−3, m−3, m−3, m−3, and m−3, respectively. We found that the variation trends of the layered PMSE ORs with different thresholds are largely consistent. In addition, the larger the threshold, the smaller the ratio. Smirnova et al. (2010) analyzed day-to-day and year-to-year variations of the PMSE ORs for different thresholds. They found that the choice of the threshold does not influence the shape of the variation curves for the PMSE ORs. Zeller and Bremer (2009) indicated that different threshold values are for the investigations of the influence of geomagnetic activity on PMSEs, however, of less importance. They both think that the variation trends of PMSE ORs with different thresholds are consistent. The aim of choosing five different thresholds is also to increase the number of samples for calculating the correlation coefficients between the layered PMSE OR and F10.7 and between the layered PMSE OR and K index. Since these occurrence ratios are calculated in the case where the occurrence of PMSEs is determined, it is recognized that these occurrence rates are reliable. It is well known that the period of 2006–2009 is solar minimum and 2012 is solar maximum, but the PMSE mono- and double-layer average OR in 2007 is not consistent with solar activity. In other words, there is no obvious correlation between the mono- and double-layer PMSE OR and solar activity. In addition, we found that the tri-layer PMSE OR and solar activity are in opposite directions. To prove the conclusion, we will calculate the correlation coefficient between the layered PMSE ORs and solar activity and between the layered PMSE ORs and geomagnetic activity in the next section. Therefore, the correlation between them can be judged directly.

Figure 5PMSE monolayer occurrence ratio under different electron density thresholds, with the axis at the top showing the time in years.

Figure 6PMSE double-layer occurrence ratio under different electron density thresholds, with the axis at the top showing the time in years.
5.3 Effect of solar and geomagnetic activity on the PMSE OR
5.3.1 F10.7 index and K index
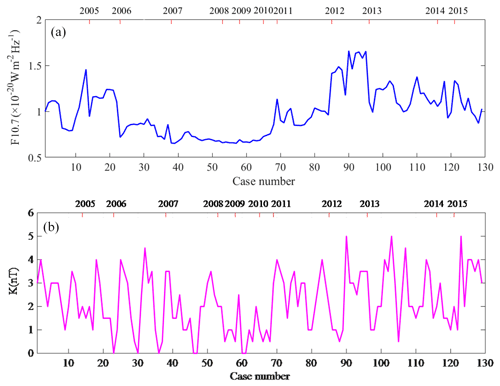
The F10.7 index is a measure of the solar radio flux per unit frequency at a wavelength of 10.7 cm, near the peak of the observed solar radio emission. F10.7 is often expressed in SFU or solar flux units (1 SFU = 10−22 W m−2 Hz−1). It represents a measure of diffuse, nonradiative coronal plasma heating. It is an excellent indicator of overall solar activity levels and correlates well with solar UV emissions. The K index quantifies disturbances in the horizontal component of Earth's magnetic field with an integer in the range 0–9, with 1 being calm and 5 or more indicating a geomagnetic storm. It is derived from the maximum fluctuations of horizontal components observed on a magnetometer during a 3 h interval. The K index was introduced by Julius Bartels in 1939 (Bartels et al., 1939). The K-index values used in the paper are the median of the K index observed on a magnetometer during a day, where the effect of the heating experiments was removed.
5.3.2 Correlation coefficients
A correlation coefficient is a numerical measure of some type of correlation, meaning a statistical relationship between two variables (Boddy and Smith, 2009). The Pearson correlation coefficient known as Pearson's r is a measure of the strength and direction of the linear relationship between two variables that is defined as the covariance of the variables divided by the product of their standard deviations. Given a pair of random variables (X,Y), the formula for Pearson's correlation coefficient r is (Wilks, 1995)
where cov is the covariance, σX is the standard deviation of X, and σY is the standard deviation of Y.
Spearman's rank correlation coefficient is a measure of how well the relationship between two variables can be described by a monotonic function. The Spearman correlation between two variables is equal to the Pearson correlation between the rank values of those two variables. While Pearson's correlation assesses linear relationships, Spearman's correlation assesses monotonic relationships (whether linear or not) (Myers and Well, 2003). For a sample of size n, the n raw scores Xi and Yi are converted to ranks and , and rs is computed from
where cov(rgX,rgY) is the covariance of the rank variables, and and are the standard deviations of the rank variables.
A high value (approaching +1.00) is a strong direct relationship, values near 0.50 are considered moderate, and values below 0.30 are considered to show a weak relationship. A low negative value (approaching −1.00) is similarly a strong inverse relationship, and values near 0.00 indicate little if any relationship.
To determine whether a result is statistically significant, a P value is calculated which is the probability of observing an effect of the same magnitude or more extreme given that the null hypothesis is true (Devore, 2011). The null hypothesis is rejected if the P value is less than a predetermined level (usually α=0.05), where α is called the significance level, and it is the probability of rejecting the null hypothesis given that it is true (a type I error).
5.3.3 Correlation between the layered PMSE OR, F10.7, and K index
Figure 8 shows the variations of F10.7 and geomagnetic K-index values corresponding to the occurrence of PMSEs. The correlation of PMSEs with solar and geomagnetic activities is not expected to be affected by discontinuous PMSEs because of the F10.7 and K values corresponding to the occurrence of PMSEs with a threshold of m−3. So, the study of relations between PMSEs and solar activities and between PMSEs and geomagnetic activities makes sense. The relation between the layered PMSE OR and F10.7 and between layered PMSE OR and K values can be analyzed for the results shown in conjunction with Figs. 5 through 8. In order to examine the correlation between the layered PMSE OR and F10.7 and between the layered PMSE OR and K index, all the data points of the PMSE OR, F10.7, and K index with simultaneous occurrence were combined. Figure 9 shows the correlation coefficients computed by combing all the points of the PMSE OR (with thresholds m−3, m−3, m−3, m−3, and m−3), and F10.7 and the K index with simultaneous occurrence, and we apply a significant test. It is seen from Fig. 9 that the layered PMSE OR is positively correlated with the K index and that the coefficients indicate a moderate correlation between the variables, whereas the correlation coefficients between the PMSE monolayer and F10.7, and the double-layer OR and F10.7, both are very low, indicating that their correlation is weak or even irrelevant. Interestingly, we found that the PMSE tri-layer OR has a negative correlation with F10.7, although the correlation was lower than what we have supposed. This finding has never been published in the previous literature. Hence, it is indicated that the cases with positive values play a decisive role when calculating the correlation coefficient between the data points of PMSEs and the K index occurring simultaneously, and events with negative values dominate in the calculation of the correlation coefficient between the tri-layer PMSE OR and F10.7. But a mono- or double-layer PMSE OR has rare relevance with F10.7.
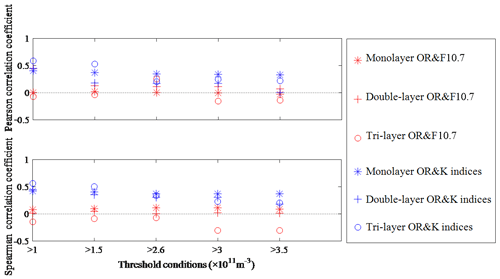
Figure 9Pearson linear and Spearman rank correlation computed between the layered PMSE OR (with thresholds m−3, m−3, m−3, m−3, and m−3, respectively) and F10.7 corresponding to the occurrence of PMSEs and between the layered PMSE OR and K index corresponding to the occurrence of PMSEs, respectively. For each correlation coefficient, the P value is less than 0.05. The horizontal dotted line is drawn to separate positive and negative correlation coefficients.
The correlations between the layered PMSE OR and F10.7 and between the layered PMSE OR and K index have been obtained. They indicate that there are many complicated factors for the formation and development of PMSEs besides solar and geomagnetic activities. There are explanations for these results: on the one hand, the enhanced solar activity increases the electron density due to the increase in ionization, and with the increase in solar radiation, the photodissociation enhances and the water vapor content is reduced. On the other hand, the positive correlation between the PMSE OR and K index may be apprehensible, because the enhanced magnetic activity caused precipitating particles to increase in the mesosphere and led to an increase in electron densities. Latteck and Bremer (2013) show that PMSEs are caused by inhomogeneities in the electron density of the radar Bragg scale within the plasma of the cold summer mesopause region in the presence of negatively charged ice particles. Thus, the occurrence of PMSEs contains information about mesospheric temperature and water vapor content but also depends on the ionization due to solar electromagnetic radiation and precipitating high-energetic particles. However, we still cannot explain why there is a negative correlation between the tri-layer PMSE OR and F10.7. This should be noted in future research.
In this paper, the PMSE occurrence ratios with monolayers, double layers and tri layers detected by EISCAT VHF radar during a solar cycle have been presented. The daily and seasonal variation of the layered PMSEs was analyzed. We implemented a method to provide more accurate conclusions about the study of the long-term variation of PMSEs with different thresholds. The correlation between layered PMSEs and solar radiation flux (F10.7) and between layered PMSEs and geomagnetic activity (K index) was given. The following conclusions were reached.
-
Mono-, double-, and tri-layer PMSEs have different seasonal behaviors. Monolayer PMSEs often begin in late May, reach their maximum in early June or mid-June, keep this level until the end of July or beginning of August, and gradually decrease or vanish when they are close to the end of August or the beginning of September in general, which is in agreement with the earlier report (Smirnova et al., 2011). The double-layer PMSE OR reaches its maximum in mid-July and simply fades away in early August. The tri-layer PMSE appears later and disappears earlier in comparison with mono- and double-layer PMSEs, and it is large at the end of June and in early July.
-
The variation trends of mono-, double-, and tri-layer PMSE ORs under different electron density thresholds are greatly consistent. It is found that the larger the threshold, the smaller the ratio. Beyond that, PMSE mono- and double-layer ORs are not associated with solar activity. The PMSE tri-layer OR is inversely proportional to solar activity.
-
The layered PMSE OR is positively correlated with the K index. The correlation between the PMSE mono- and double-layer OR and F10.7 is relatively weak, and the PMSE tri-layer OR has a negative correlation with F10.7.
All EISCAT data used in this work have been downloaded at https://www.eiscat.se/schedule/schedule.cgi (last access: 27 May 2019).
SG designed this study, carried out statistics, analyzed the results and wrote the manuscript. HL participated in the design of the study and the analysis of the results. TX and MZ helped with the conceptual ideas for the paper. MW and LM managed this study and participated in language grammar modification. SU and AR participated in modifying language issues and provided a lot of suggestions about the revised manuscript. All authors read and approved the final manuscript.
The authors declare that they have no conflict of interest.
This article is part of the special issue “7th Brazilian meeting on space geophysics and aeronomy”. It is a result of the Brazilian meeting on Space Geophysics and Aeronomy, Santa Maria/RS, Brazil, 05–09 November 2018.
We acknowledge EISCAT, which is an international association supported by China, Finland, Japan, Norway, Sweden, and the UK. We would like to thank Wen Yi, who gave us valuable opinions and suggestions for the revised manuscript.
This study is supported by the National Natural Science Foundation of China (no. 41104097 and no. 41304119). This study is also supported by the National Key Laboratory of Electromagnetic Environment, China Research Institute of Radiowave Propagation (no. 201702003).
This paper was edited by Igo Paulino and reviewed by Mani Sivakandan and one anonymous referee.
Bartels, J., Heck, N. A. H., and Johnston, H. F.: The Three-Hour-Range Index Measuring Magnetic Activity, J. Geophys. Res., 44, 411–454, https://doi.org/10.1029/TE044i004p00411, 1939.
Baron, M.: EISCAT progress 1983–1985, J. Atmos. Terr. Phys., 48, 767–772, https://doi.org/10.1016/0021-9169(86)90050-4, 1986.
Belova, E., Dalin, P., and Kirkwood, S.: Polar mesosphere summer echoes: a comparison of simultaneous observations at three wavelengths, Ann. Geophys., 25, 2487–2496, https://doi.org/10.5194/angeo-25-2487-2007, 2007.
Blix, T. A., Rapp, M., and Lübken, F. J.: Relations between small scale electron number density fluctuations, radar backscatter, and charged aerosol particles, J. Geophys. Res.-Atmos., 108, 1–10, https://doi.org/10.1029/2002JD002430, 2003.
Boddy, R. and Smith, G.: Statistical Methods in Practice: for Scientists and Technologists, John Wiley & Sons Ltd, Chichester, 2009.
Bremer, J., Hoffmann, P., Latteck, R., and Singer, W.: Seasonal and long-term variations of PMSE from VHF radar observations at Andenes, Norway, J. Geophys. Res.-Atmos., 108, 8438, https://doi.org/10.1029/2002JD002369, 2003.
Bremer, J., Hoffmann, P., Höffner, J., Latteck, R., Singer, W., Zecha, M., and Zeller, O.: Long-term changes of mesospheric summer echoes at polar and middle latitudes, J. Atmos. Sol.-Terr. Phy., 68, 1940–1951, https://doi.org/10.1016/j.jastp.2006.02.012, 2006.
Cho, J. Y. N., Hall, T. M., and Kelley, M. C.: On the Role of Charged Aerosols in Polar Mesosphere Summer Echoes, J. Geophys. Res.-Atmos., 97, 875–886, https://doi.org/10.1029/91JD02836, 1992.
Czechowsky, P., Ruester, R., and Schmidt, G.: Variations of mesospheric structures in different seasons, Geophys. Res. Lett., 6, 459–462, https://doi.org/10.1029/GL006i006p00459, 1979.
Devore, J. L.: Probability and Statistics for Engineering and the Sciences, 8th Edn., Boston, MA, Cengage Learning, 300–344, ISBN 978-0-538-73352-6, 2011.
Hill, R. J., Gibson-Wilde, D. E., Werne, J. A., and Fritts, D. C.: Turbulence-induced fluctuations in ionization and application to PMSE, Earth Planets Space, 51, 499–513, https://doi.org/10.1186/BF03353211, 1999.
Hocking, W. K. and Röttger, J.: Studies of polar mesosphere summer echoes over EISCAT using calibrated signal strengths and statistical parameters, Radio Sci., 32, 1425–1444, https://doi.org/10.1029/97RS00716, 1997.
Hoffmann, P.: On the occurrence and formation of multiple layers of polar mesosphere summer echoes. Geophys. Res. Lett., 32, L05812, https://doi.org/10.1029/2004gl021409, 2005.
Inhester, B., Ulwick, J., Cho, J., Kelley, M., and Schmidt, G.: Consistency of rocket and radar electron density observations: implications about the anisotropy of turbulence, J. Atmos. Sol.-Terr. Phy., 52, 855–873, https://doi.org/10.1016/0021-9169(90)90021-e, 1990.
Klostermeyer, J.: A height- and time-dependent model of polar mesosphere summer echoes, J. Geophys. Res.-Atmos., 102, 6715–6727, https://doi.org/10.1029/96JD03652, 1997.
Latteck, R. and Bremer, J.: Long-term changes of polar mesosphere summer echoes at 69∘ N, Journal of Geophys. Res.-Atmos., 118, 10441–10448, https://doi.org/10.1002/jgrd.50787, 2013.
Latteck, R., Singer, W., Morris, R. J., Hocking, W. K., Murphy, D. J., Holdsworth, D. A., and Swarnalingam, N.: Similarities and differences in polar mesosphere summer echoes observed in the Arctic and Antarctica, Ann. Geophys., 26, 2795–2806, https://doi.org/10.5194/angeo-26-2795-2008, 2008.
Lehtinen, M. S. and Huuskonen, A.: General incoherent scatter analysis and GUISDAP, J. Atmos. Sol.-Terr. Phy., 58, 435–452, https://doi.org/10.1016/0021-9169(95)00047-x, 1996.
Li, Q. and Rapp, M.: PMSE-observations with the EISCAT VHF and UHF-radars: Statistical properties, J. Atmos. Sol.-Terr. Phy., 73, 944–956, https://doi.org/10.1016/j.jastp.2010.05.015, 2011.
Li, Q., Rapp, M., Röttger, J., Latteck, R., Zecha, M., Strelnikova, I., Baumgarten, G., Hervig, M., Hall, C., and Tsutsumi, M.: Microphysical parameters of mesospheric ice clouds derived from calibrated observations of polar mesosphere summer echoes at Bragg wavelengths of 2.8 m and 30 cm, J. Geophys. Res., 115, D00I13, https://doi.org/10.1029/2009JD012271, 2010.
Myers, J. L. and Well, A. D.: Research Design and Statistical Analysis, 2nd Edn., Lawrence Erlbaum, ISBN 978-0-8058-4037-7, 2003.
Palmer, J. R., Rishbeth, H., Jones, G. O. L., and Williams, P. J. S.: A statistical study of polar mesosphere summer echoes observed by EISCAT, J. Atmos. Sol.-Terr. Phy., 58, 307–315, https://doi.org/10.1016/0021-9169(95)00038-0, 1996.
Rapp, M. and Lübken, F.-J.: Polar mesosphere summer echoes (PMSE): Review of observations and current understanding, Atmos. Chem. Phys., 4, 2601–2633, https://doi.org/10.5194/acp-4-2601-2004, 2004.
Reid, I. M., Czechowsky, P., Ruster, R., and Schmidt, G.: First VHF radar measurements of mesopause summer echoes at mid-latitudes, Geophys. Res. Lett., 16, 135–138, https://doi.org/10.1029/GL016i002p00135, 1989.
Röttger, J.: Middle atmosphere and lower thermosphere processes at high latitudes studied with the EISCAT radars, J. Atmos. Sol.-Terr. Phy., 56, 1173–1195, https://doi.org/10.1016/0021-9169(94)90056-6, 1994.
Smirnova, M., Belova, E., Kirkwood, S., and Mitchell, N.: Polar mesosphere summer echoes with ESRAD, Kiruna, Sweden: Variations and trends over 1997–2008, J. Atmos. Sol.-Terr. Phy., 72, 435–447, https://doi.org/10.1016/j.jastp.2009.12.014, 2010.
Smirnova, M., Belova, E., and Kirkwood, S.: Polar mesosphere summer echo strength in relation to solar variability and geomagnetic activity during 1997–2009, Ann. Geophys., 29, 563–572, https://doi.org/10.5194/angeo-29-563-2011, 2011.
Thomas, G. E. and Olivero, J.: Noctilucent clouds as possible indicators of global change in the mesosphere, Adv. Space Res., 28, 937–946, 2001.
Thomas, L., Astin, I., and Prichard, I. T.: The characteristics of VHF echoes from the summer mesopause region at mid-latitudes, J. Atmos. Terr. Phys., 54, 969–977, https://doi.org/10.1016/0021-9169(92)90063-q, 1992.
Varney, R. H., Kelley, M. C., Nicolls, M. J., Heinselman, C. J., and Collins, R. L.: The electron density dependence of polar mesospheric summer echoes, J. Atmos. Sol.-Terr. Phy., 73, 2153–2165, https://doi.org/10.1016/j.jastp.2010.07.020, 2011.
Wilks, D. S.: Statistical Methods in the Atmospheric Sciences, Academic Press, Burlington, MA, 1995.
Zeller, O. and Bremer, J.: The influence of geomagnetic activity on mesospheric summer echoes in middle and polar latitudes, Ann. Geophys., 27, 831–837, https://doi.org/10.5194/angeo-27-831-2009, 2009.


