the Creative Commons Attribution 4.0 License.
the Creative Commons Attribution 4.0 License.
 | 19 Mar 2019
Emergence of a localized total electron content enhancement during the severe geomagnetic storm of 8 September 2017
Carlos Sotomayor-Beltran
Laberiano Andrade-Arenas
In this work, the results of the analysis on total electron content (TEC) data before, during and after the geomagnetic storm of 8 September 2017 are reported. One of the responses to geomagnetic storms due to the southern vertical interplanetary magnetic field (Bz) is the enhancement of the electron density in the ionosphere. Vertical TEC (VTEC) from the Center for Orbit determination in Europe (CODE) along with a statistical method were used to identify positive and/or negative ionospheric storms in response to the geomagnetic storm of 8 September 2017. When analyzing the response to the storm of 8 September 2017 it was indeed possible to observe an enhancement of the equatorial ionization anomaly (EIA); however, what was unexpected was the identification of a local TEC enhancement (LTE) to the south of the EIA (∼40∘ S, right over New Zealand and extending towards the southeastern coast of Australia and also eastward towards the Pacific). This was a very transitory LTE that lasted approximately 4 h, starting at ∼ 02:00 UT on 8 September where its maximum VTEC increase was of 241.2 %. Using the same statistical method, comparable LTEs in a similar category geomagnetic storm, the 2015 St. Patrick's Day storm, were looked for. However, for the aforementioned storm no LTEs were identified. As also indicated in a past recent study for a LTE detected during the 15 August 2015 geomagnetic storm, an association between the LTE and the excursion of Bz seen during the 8 September 2017 storm was observed as well. Furthermore, it is very likely that a direct impact of the super-fountain effect along with traveling ionospheric disturbances may be playing an important role in the production of this LTE. Finally, it is indicated that the 8 September 2017 LTE is the second one to be detected since the year 2016.
- Article
(4282 KB) - Full-text XML
- BibTeX
- EndNote


Anomalies in the ionosphere can be the product of different natural phenomena (Afraimovich et al., 2013). For instance, earthquakes can produce positive or negative ionospheric anomalies (e.g., Zakharenkova et al., 2008; Yao et al., 2012; Guo et al., 2015; Li et al., 2015; Sotomayor-Beltran, 2019), although such variations are expected to be localized within the earthquake's preparation region (Dobrovolsky et al., 1979). On the other hand, major changes in the ionosphere are caused by geomagnetic storms (e.g., Buonsanto, 1999; Danilov, 2013). The responses of the Earth's ionosphere to the geomagnetic storms are known as ionospheric storms. These ionospheric storms can disrupt technologies relying on transmission of radio frequencies (e.g., Buonsanto, 1999; Borries et al., 2015), and thus they can have an impact on modern society in general.
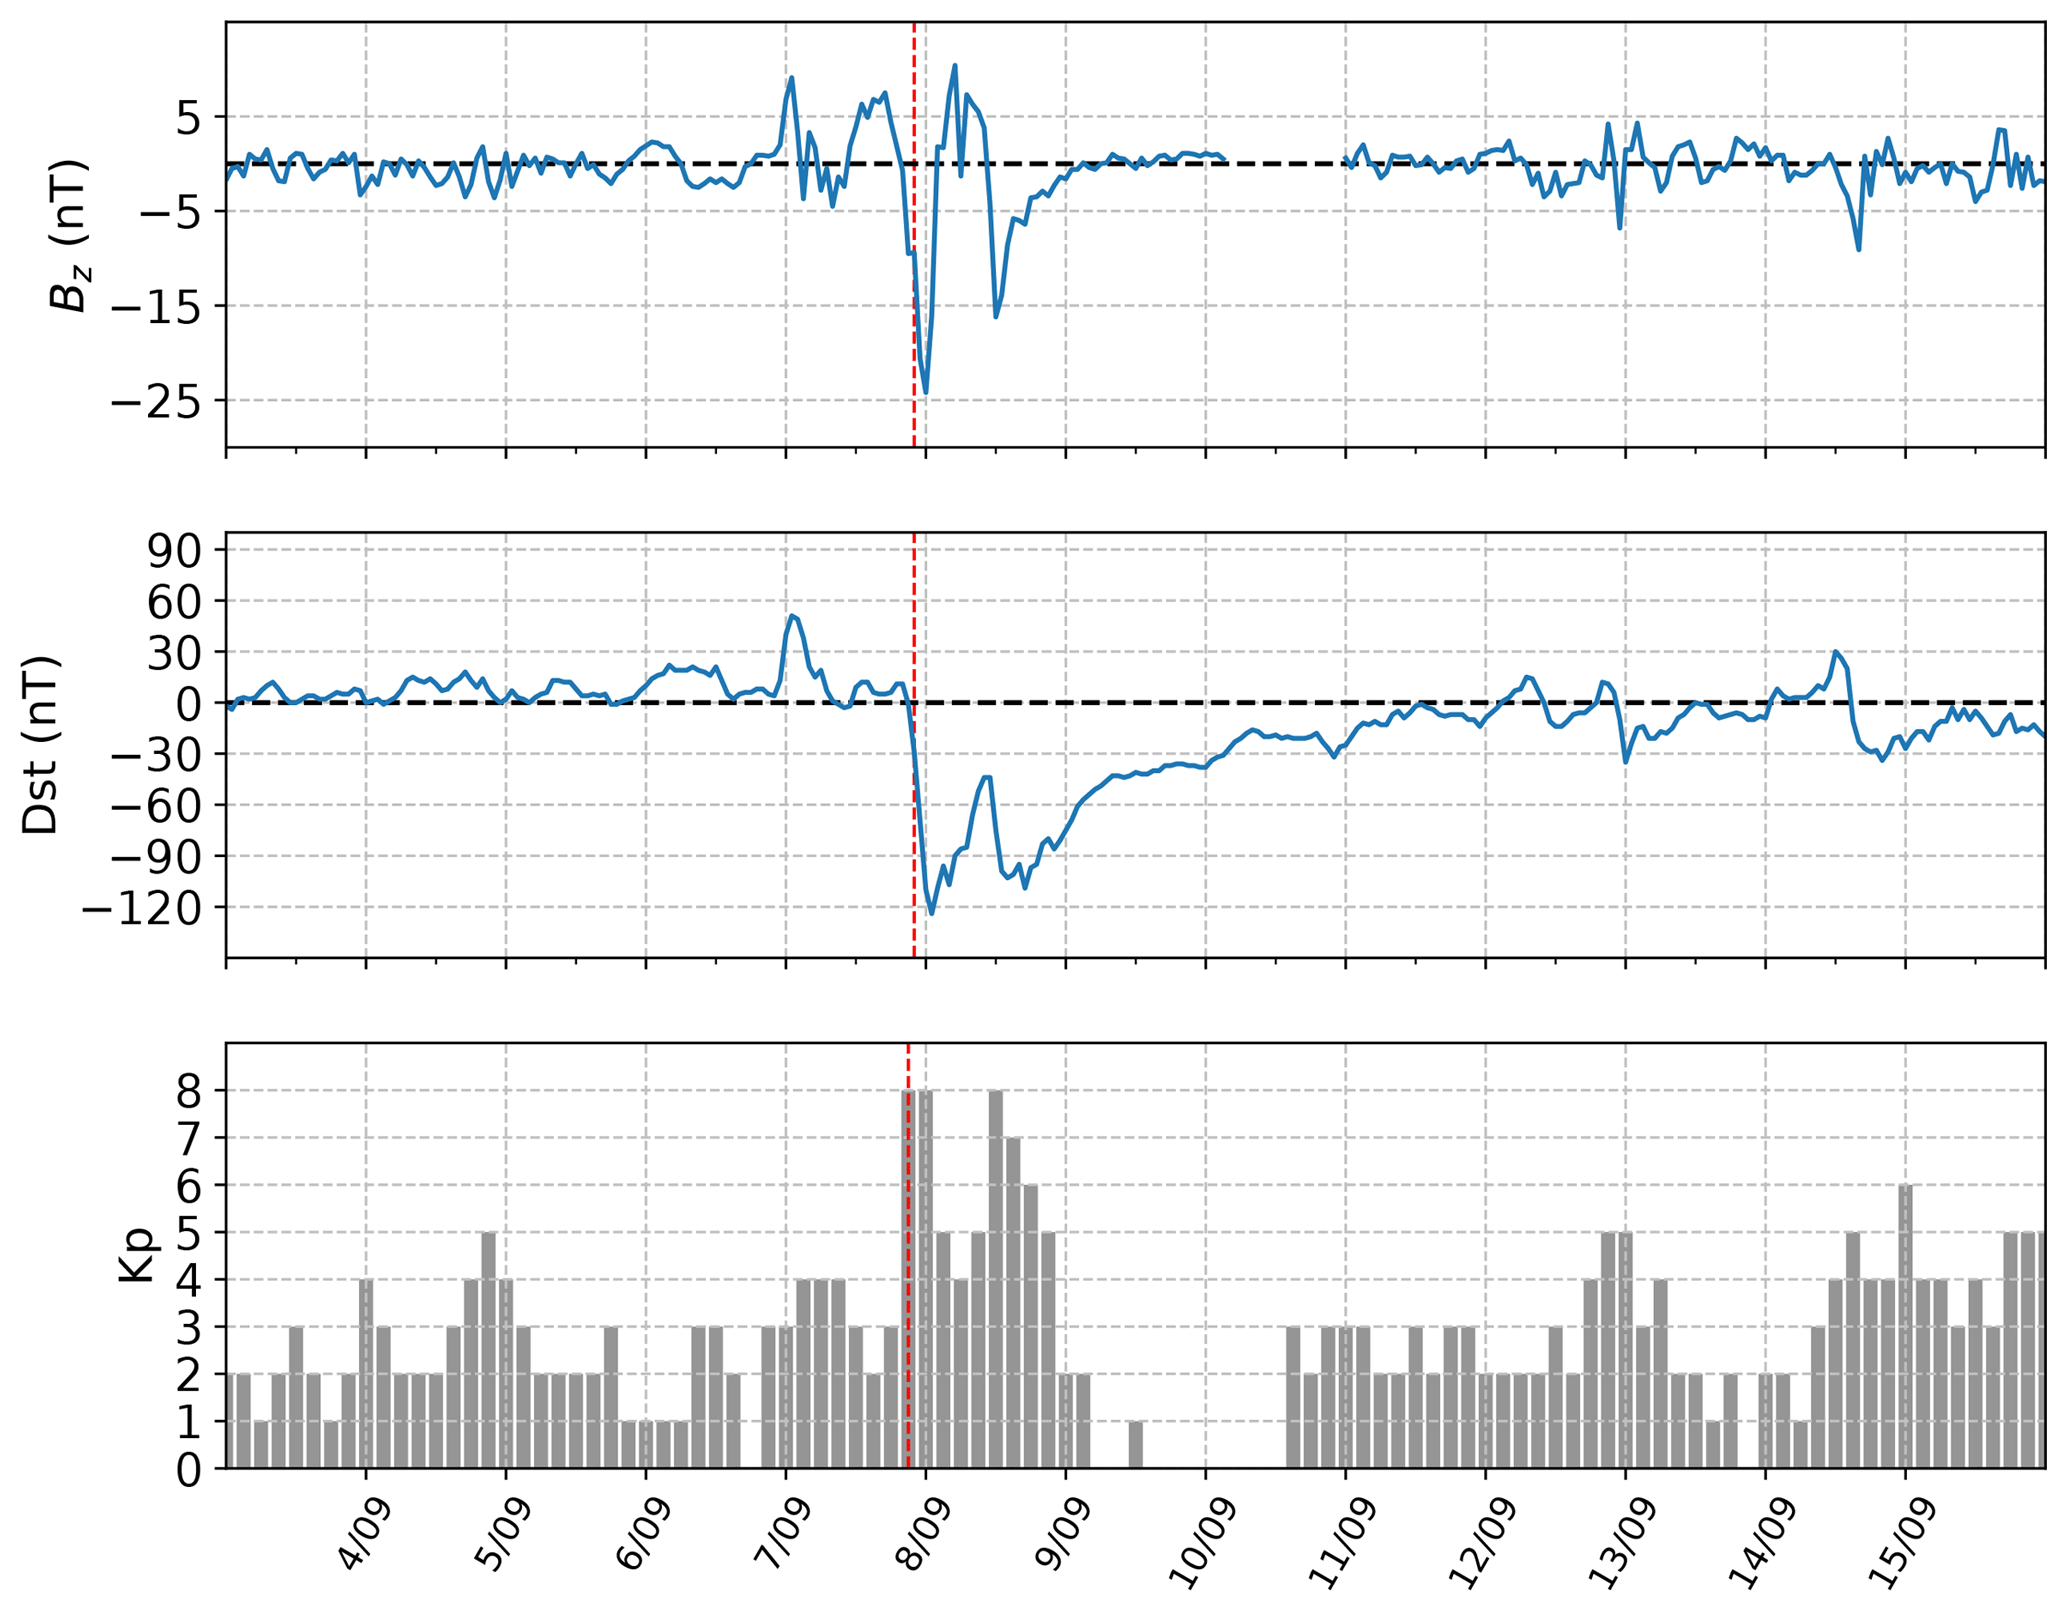
Figure 1The vertical component of the interplanetary magnetic field (Bz) and the Dst and Kp indices between 3 and 16 September 2017. The vertical dashed red line in all the plots points to the storm sudden commencement.
In order to better understand ionospheric variability in time and space produced by geomagnetic storms, Global Navigation Satellite System (GNSS) receivers, due to its global coverage, are used as one of the tools for ionospheric studies. According to several studies (e.g., Huang et al., 2005; Mannucci et al., 2005; Astafyeva, 2009), one common response to a geomagnetic storm due to the excursion of the southward interplanetary magnetic field is the significant increment in the equatorial and midlatitude total electron content (TEC), which manifests as an enhancement of the equatorial ionization anomaly (EIA; Appleton, 1946; McDonald et al., 2011). Such increase in TEC in the EIA is possible to visualize in global ionospheric maps (GIMs). Besides changes in the EIA, it was recently observed by Edemskiy et al. (2018) and Sotomayor-Beltran (2018) that localized TEC enhancements (LTEs) can also emerge as a response to geomagnetic storms.
In this paper vertical TEC (VTEC) maps, also known as global ionospheric maps, due to their reliability on ionospheric information (Hernández-Pajares et al., 2009), were used to analyze the response to the geomagnetic storm of 8 September 2017. Section 2 introduces the ionospheric data and the technique for the corresponding analysis. In Sect. 3 the results and the discussion are presented. Section 4 presents the final remarks or conclusions.
VTEC maps were downloaded via ftp (ftp://ftp.aiub.unibe.ch/CODE/, last access: 23 April 2018) from the Center for Orbit Determination in Europe (CODE) between 21 August and 20 September 2017. VTEC maps, which have a resolution of 2.5∘ × 5∘ (latitude and longitude, respectively), come in daily Ionosphere Map Exchange (IONEX) files (Schaer et al., 1998) and they are produced every hour. Due to the format of the IONEX files, which consists of headers and the actual VTEC data, a code entirely written in Python was implemented for this work. Using the NumPy (http://www.numpy.org/, last access: 24 April 2018) library, which handles N-dimensional arrays relatively easily, the VTEC data were stored in a 3-D cube for further analysis. The x, y and z axes in the 3-D cube are longitude, latitude and number of maps, respectively.
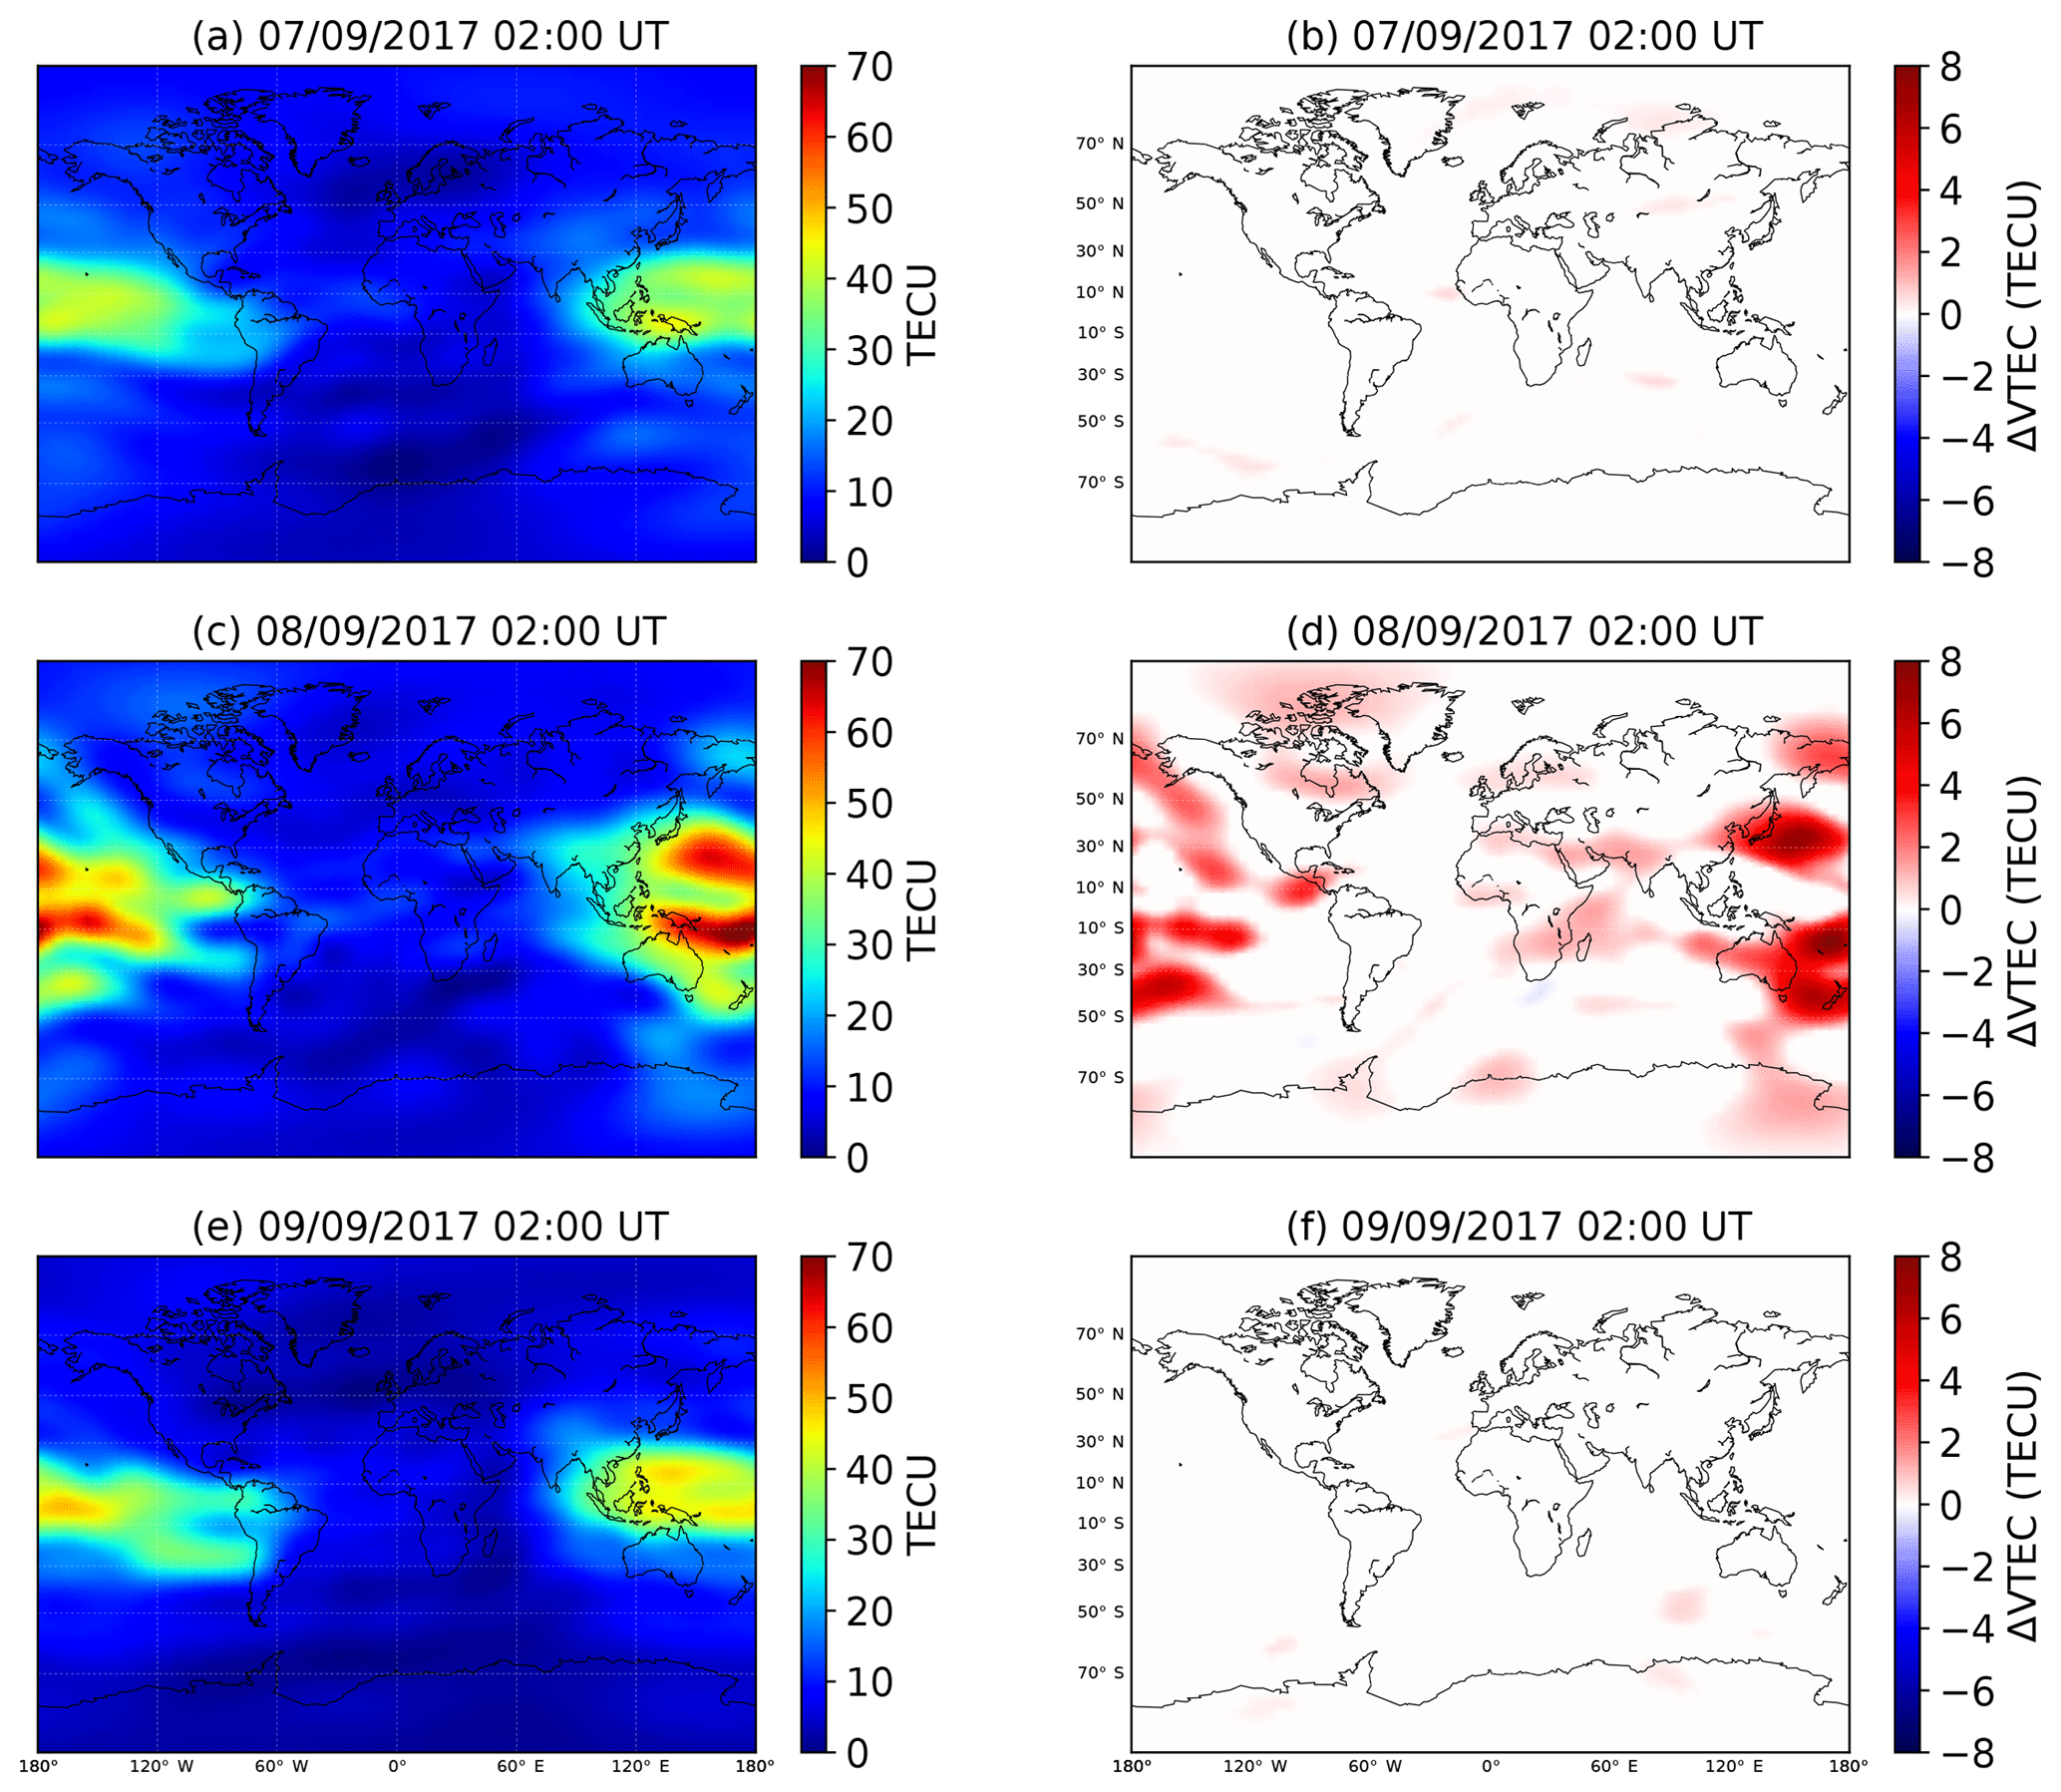
Figure 2(a) Global ionospheric maps for 7, 8 and 9 September 2017 at 02:00 UT. (b) Differential VTEC maps for 7, 8 and 9 September 2017 at 02:00 UT.
In order to identify ionospheric anomalies, a running window of 8 days was applied to every cell in the 3-D VTEC cube (e.g., Liu et al., 2004; Zhu et al., 2010; Zou and Zhao, 2010; Sotomayor-Beltran, 2018). Assuming that for each cell or line of sight the VTEC follows a Gaussian distribution, the mean (μ) VTEC and its associated standard deviation (σ) are calculated in order to define the upper and lower bounds (UB and LB):
If a VTEC value for a certain day at a particular time falls above the UB, then a positive ionospheric anomaly is detected with a confidence level of 95 %. The difference between the VTEC and UB or LB is defined as differential VTEC (ΔVTEC). On the other hand, if the VTEC falls bellow the LB, then a negative anomaly is detected. In this way, a cube of ΔVTEC was created, with a total of 744 maps. If UB > VTEC > LB, then ΔVTEC = 0.
Some important geomagnetic parameters also had to be taken into account for the analysis. The Dst index (Sugiura, 1964) provides information about the strength of the ring current around the Earth. According to Loewe and Prölss (1997) a magnetic storm can be considered weak when −50 nT < Dst ≤ −30 nT. A moderate and strong storm occurs when −100 nT < Dst ≤ −50 and −200 nT < Dst ≤ −100 nT, respectively. Finally, a severe storm happens when Dst ≤ −200 nT. For this study Dst data for the month of September 2017 were downloaded from the World Data Center for Geomagnetism in Kyoto (http://wdc.kugi.kyoto-u.ac.jp/wdc/Sec3.html, last access: 30 April 2018). Another very important index which measures the fluctuations caused in the Earth's magnetic field by a geomagnetic storm is the Kp index. According to Gosling et al. (1991) when Kp ≥ 8− and Kp ≥ 6− for at least three 3 h intervals, the storm can be considered a major one. A large storm occurs when 7− ≤ Kp ≤ 7 and Kp ≥ 6− for at least three 3 h intervals. For other cases when Kp ≥ 6 for at least three 3 h intervals the storm can be considered to be of medium strength. Finally, a small storm happens when 5− ≤ Kp ≤ 5. Kp data for September 2017 were retrieved from the German Research Centre for Geosciences (GFZ, https://www.gfz-potsdam.de/en/kp-index/, last access: 30 April 2018). The vertical interplanetary magnetic field (Bz; Tsurutani et al., 1988) is also a good indicator of a geomagnetic storm. When there is a strong southward Bz for more than 3 h a geomagnetic storm is in development (Gonzalez et al., 1994; Liu and Li, 2002). Hourly averages for Bz also for the month of September 2017 were downloaded from the OMNI database (https://omniweb.gsfc.nasa.gov/form/dx1.html, last access: 30 April 2018). In Fig. 1 the Dst and Kp indices and also Bz (in the geocentric solar magnetospheric coordinate system) can be observed for a range of days (3–16 September) within the month of September 2017.
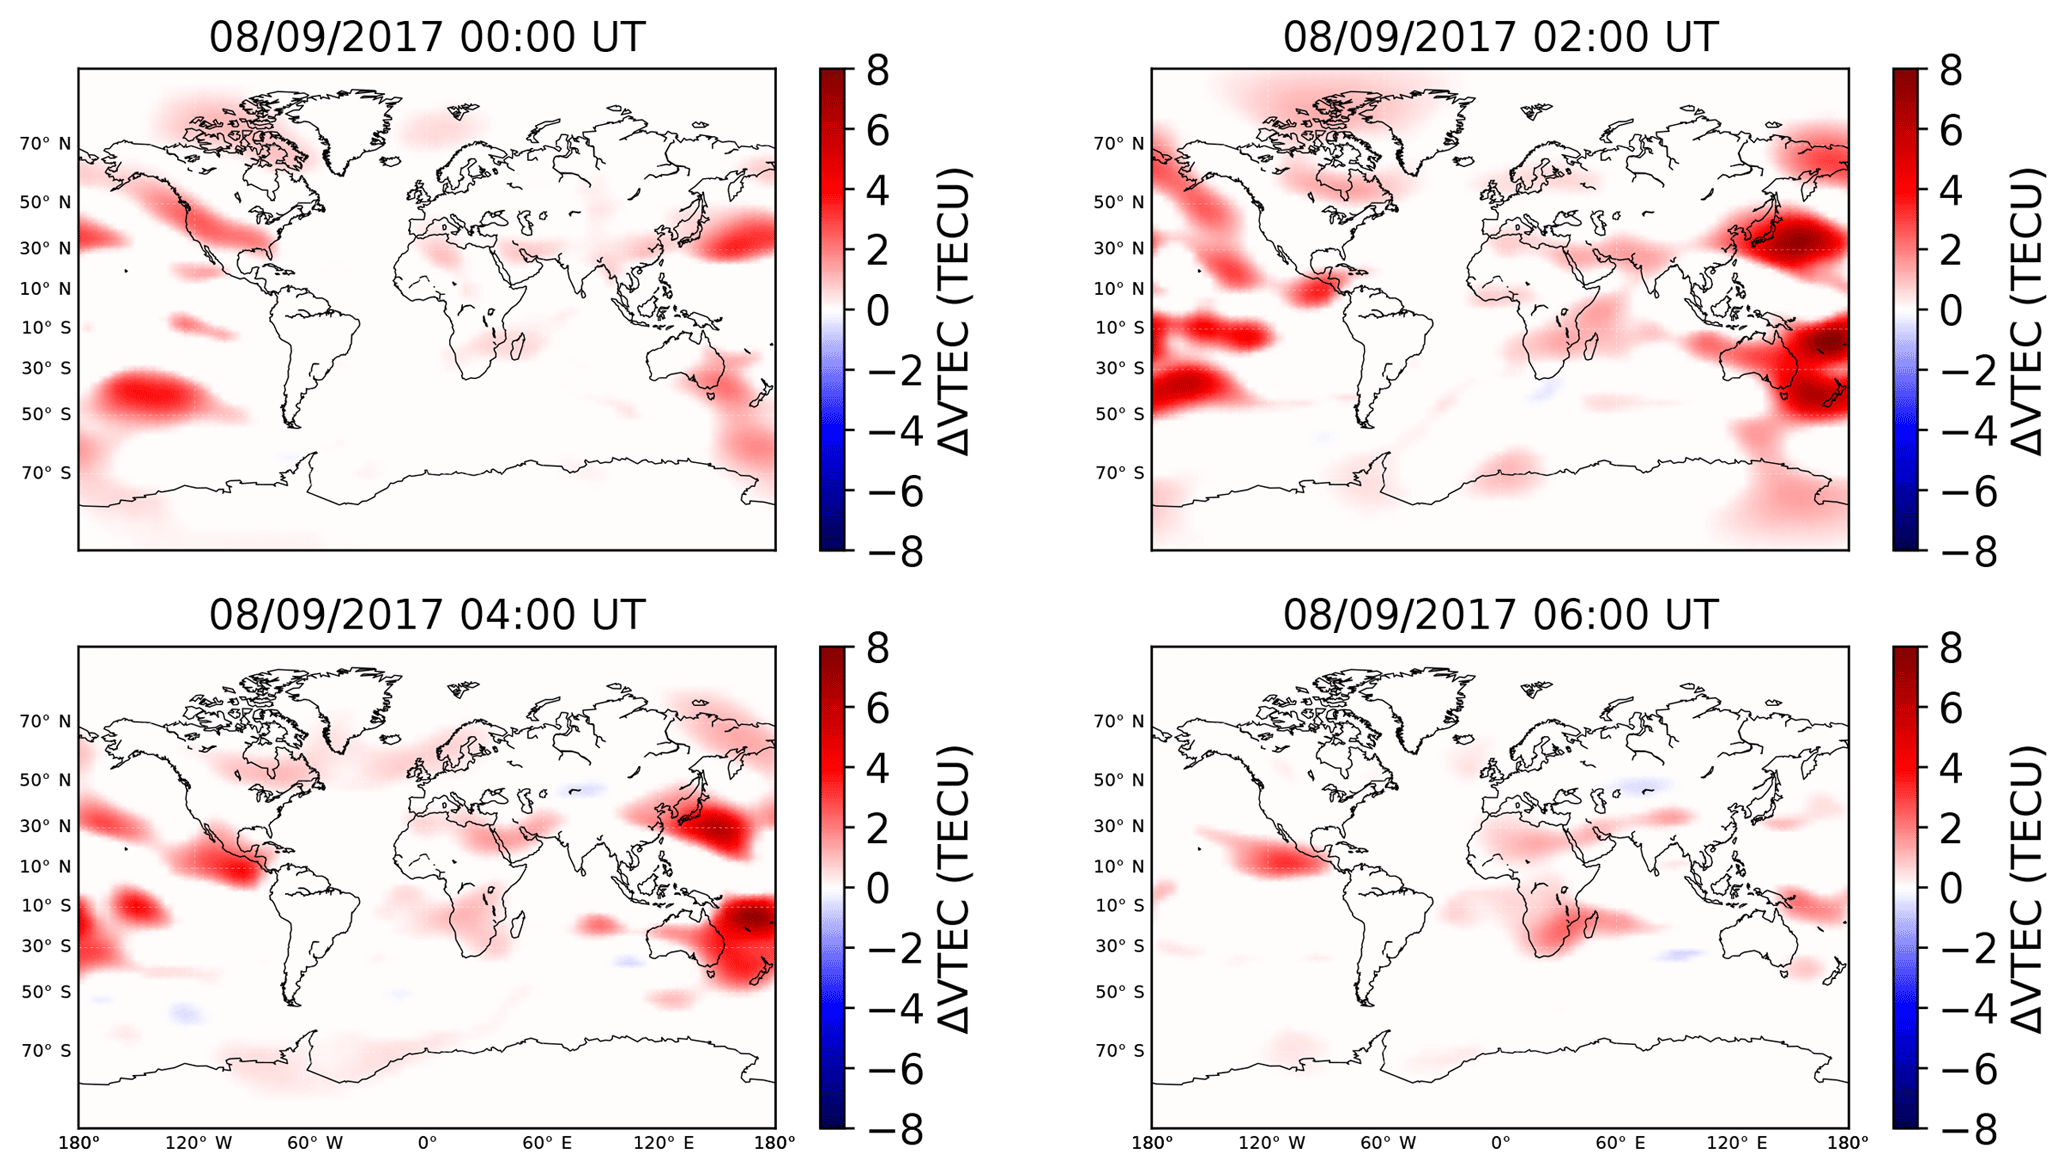
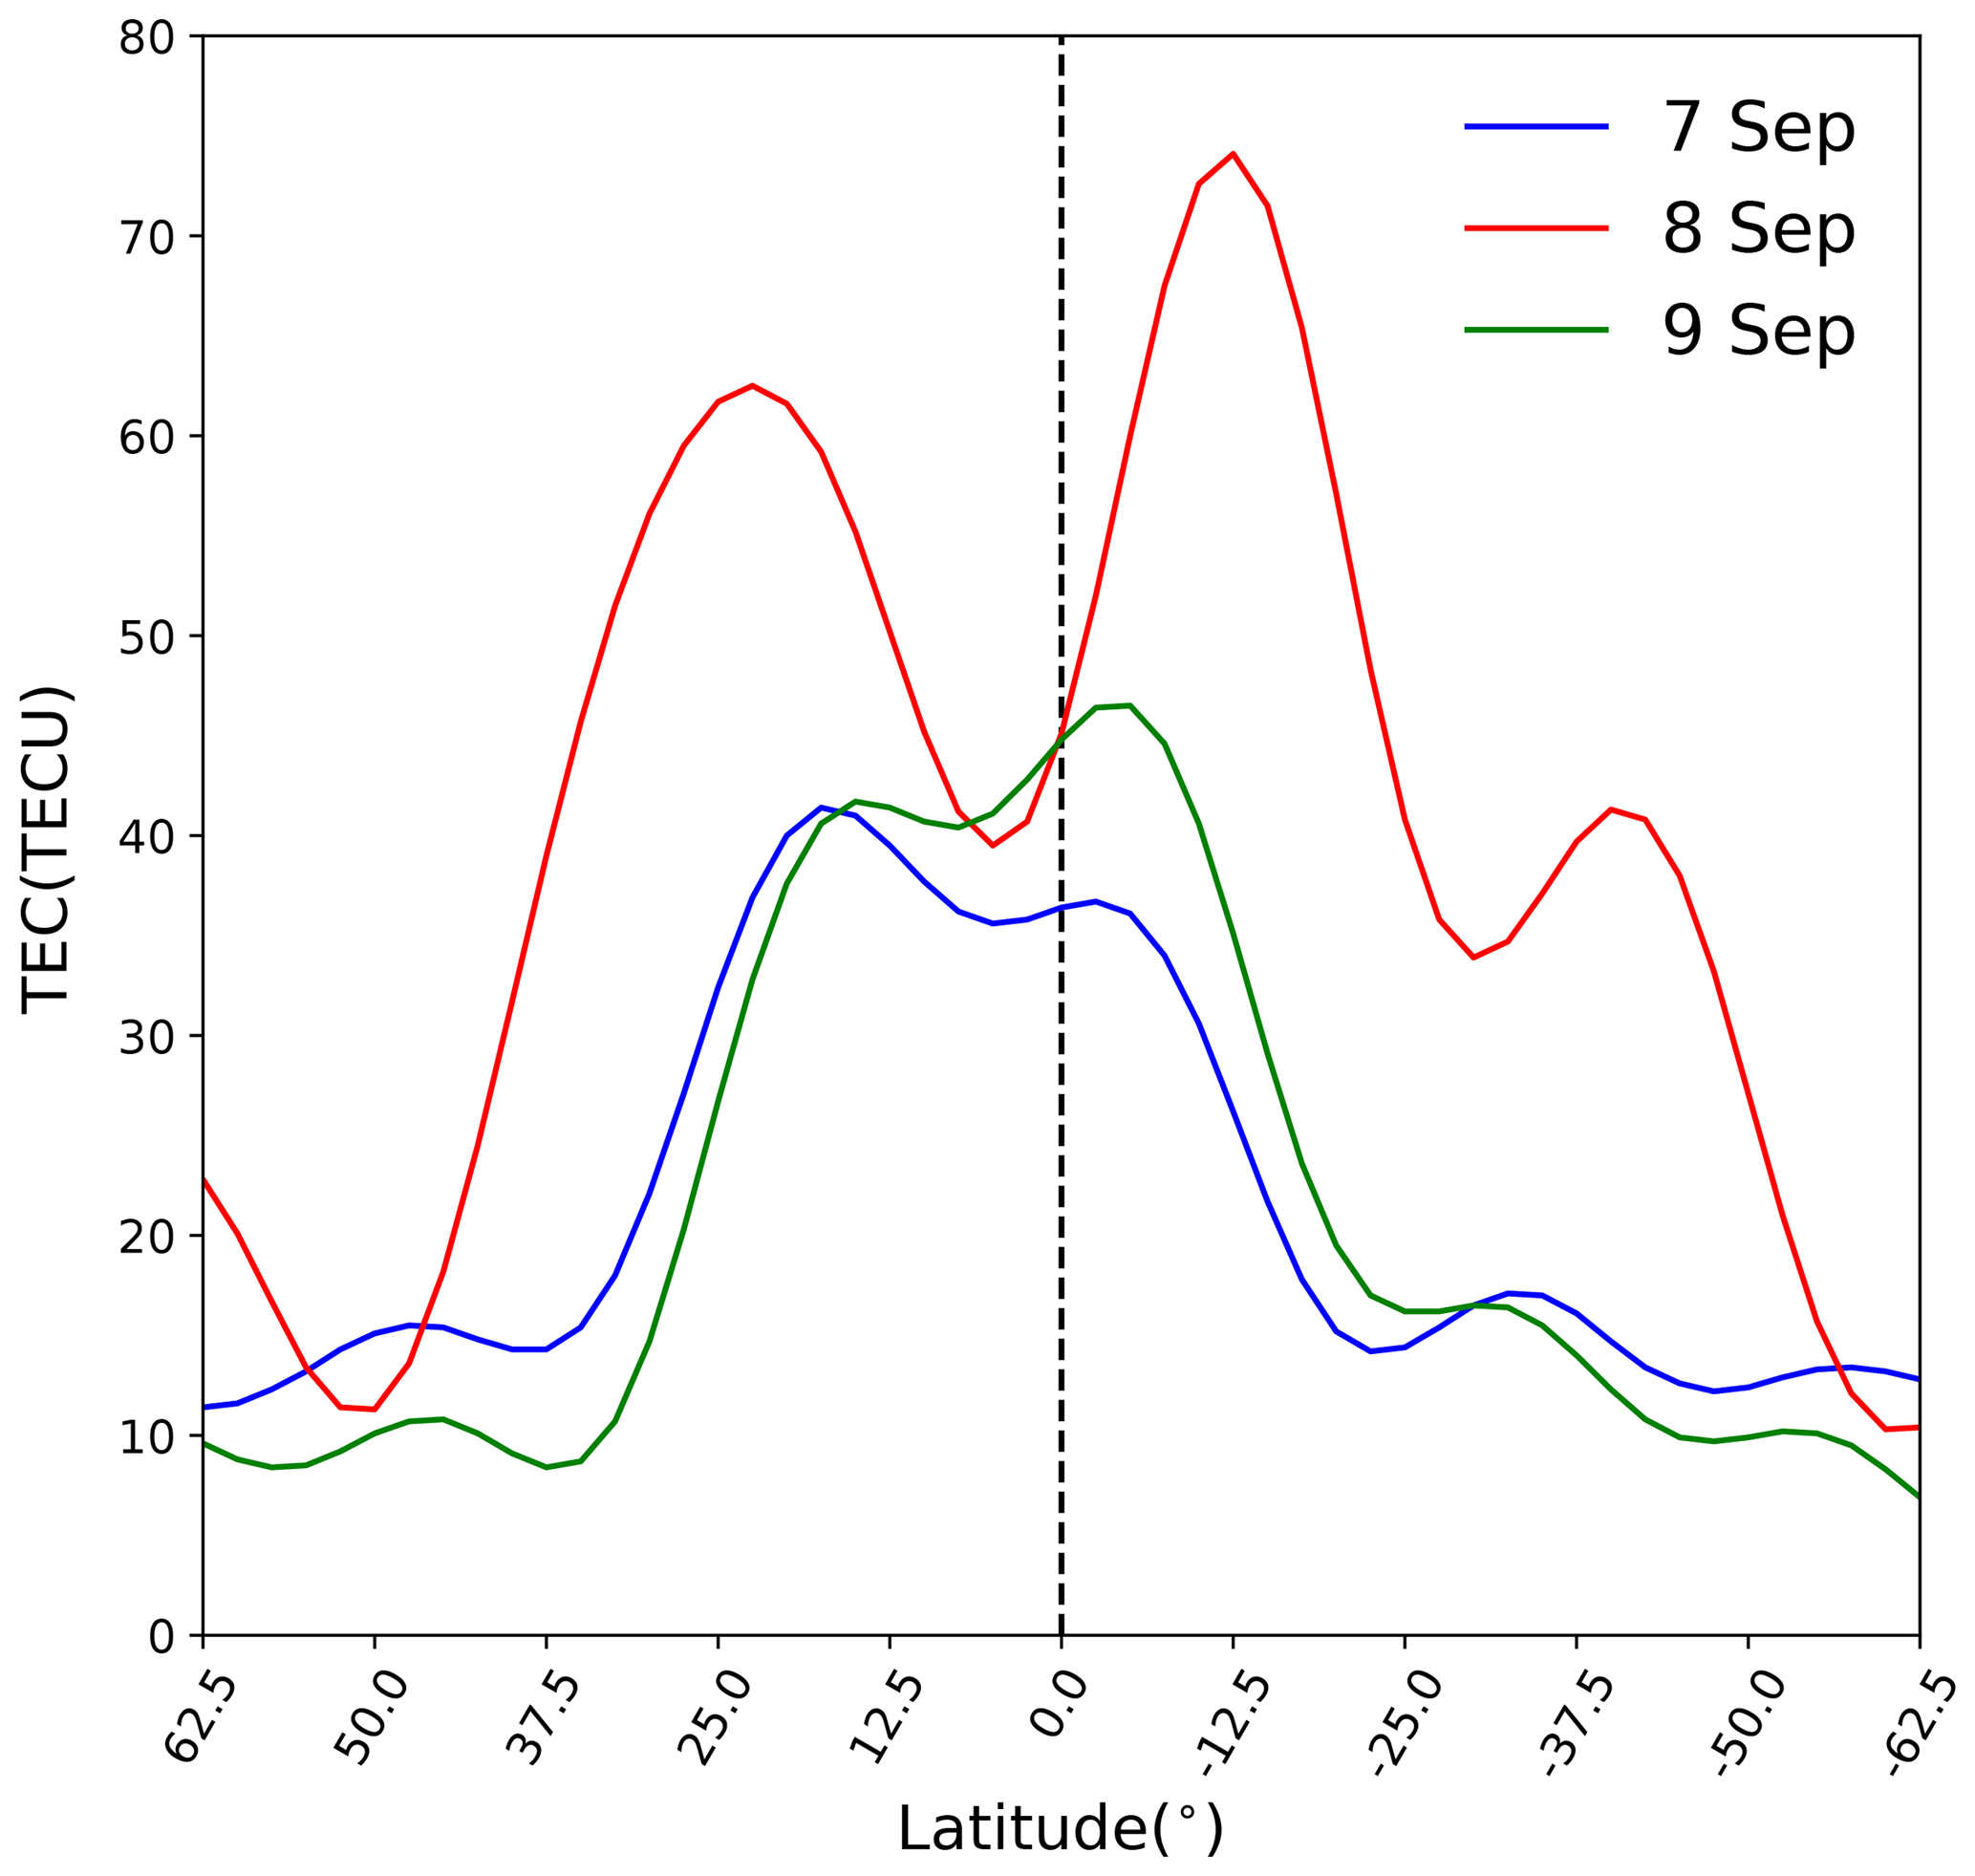
Figure 4Structure of the VTEC for the 170∘ E meridian at 02:00 UT between 7 and 9 September 2017. A relevant range of latitudes is shown (62.5∘ N–62.5∘ S). The vertical dashed black line indicates the Equator (latitude = 0∘).
Figure 1 shows that Kp = 8 during the last 3 h (UT) of 7 September and the first 3 h of 8 September. According to the National Oceanic and Atmospheric Administration (NOAA) space weather service (https://www.swpc.noaa.gov/noaa-scales-explanation, last access: 30 April 2018), this geomagnetic storm can be classified as a G4 severe storm (Kp = 8). Additionally, for 8 September 2017 between 00:00 and 04:00 UT the Dst index had values lower than −100 nT (Fig. 1).
The origin of this geomagnetic storm lies in the coronal mass ejection (CME) that occurred on 6 September 2017 at ∼ 12:40 UT. This CME was observed with Camera 2 of the Large Angle and Spectrometric Coronagraph on board of the Solar and Heliospheric Observatory (SOHO, https://sohowww.nascom.nasa.gov/, last access: 30 April 2018). Figure 1 also shows that on 8 September at ∼ 00:00 UT the vertical interplanetary magnetic field decreased significantly to a minimum of −24 nT. One hour before (7 September at 23:00 UT), Bz had already decreased considerably to −20.6 nT (time of the storm sudden commencement, Fig. 1). In addition, it can be noticed that, almost simultaneously with the drastic change in Bz, the Dst index reached its peak at 01:00 UT on 8 September 2017. As it is already well-known, this relationship between Bz and the Dst index hints to a physical response of the ring current in the magnetosphere to the interplanetary field Bz (Patel and Desai, 1973; Gonzalez and Echer, 2005).
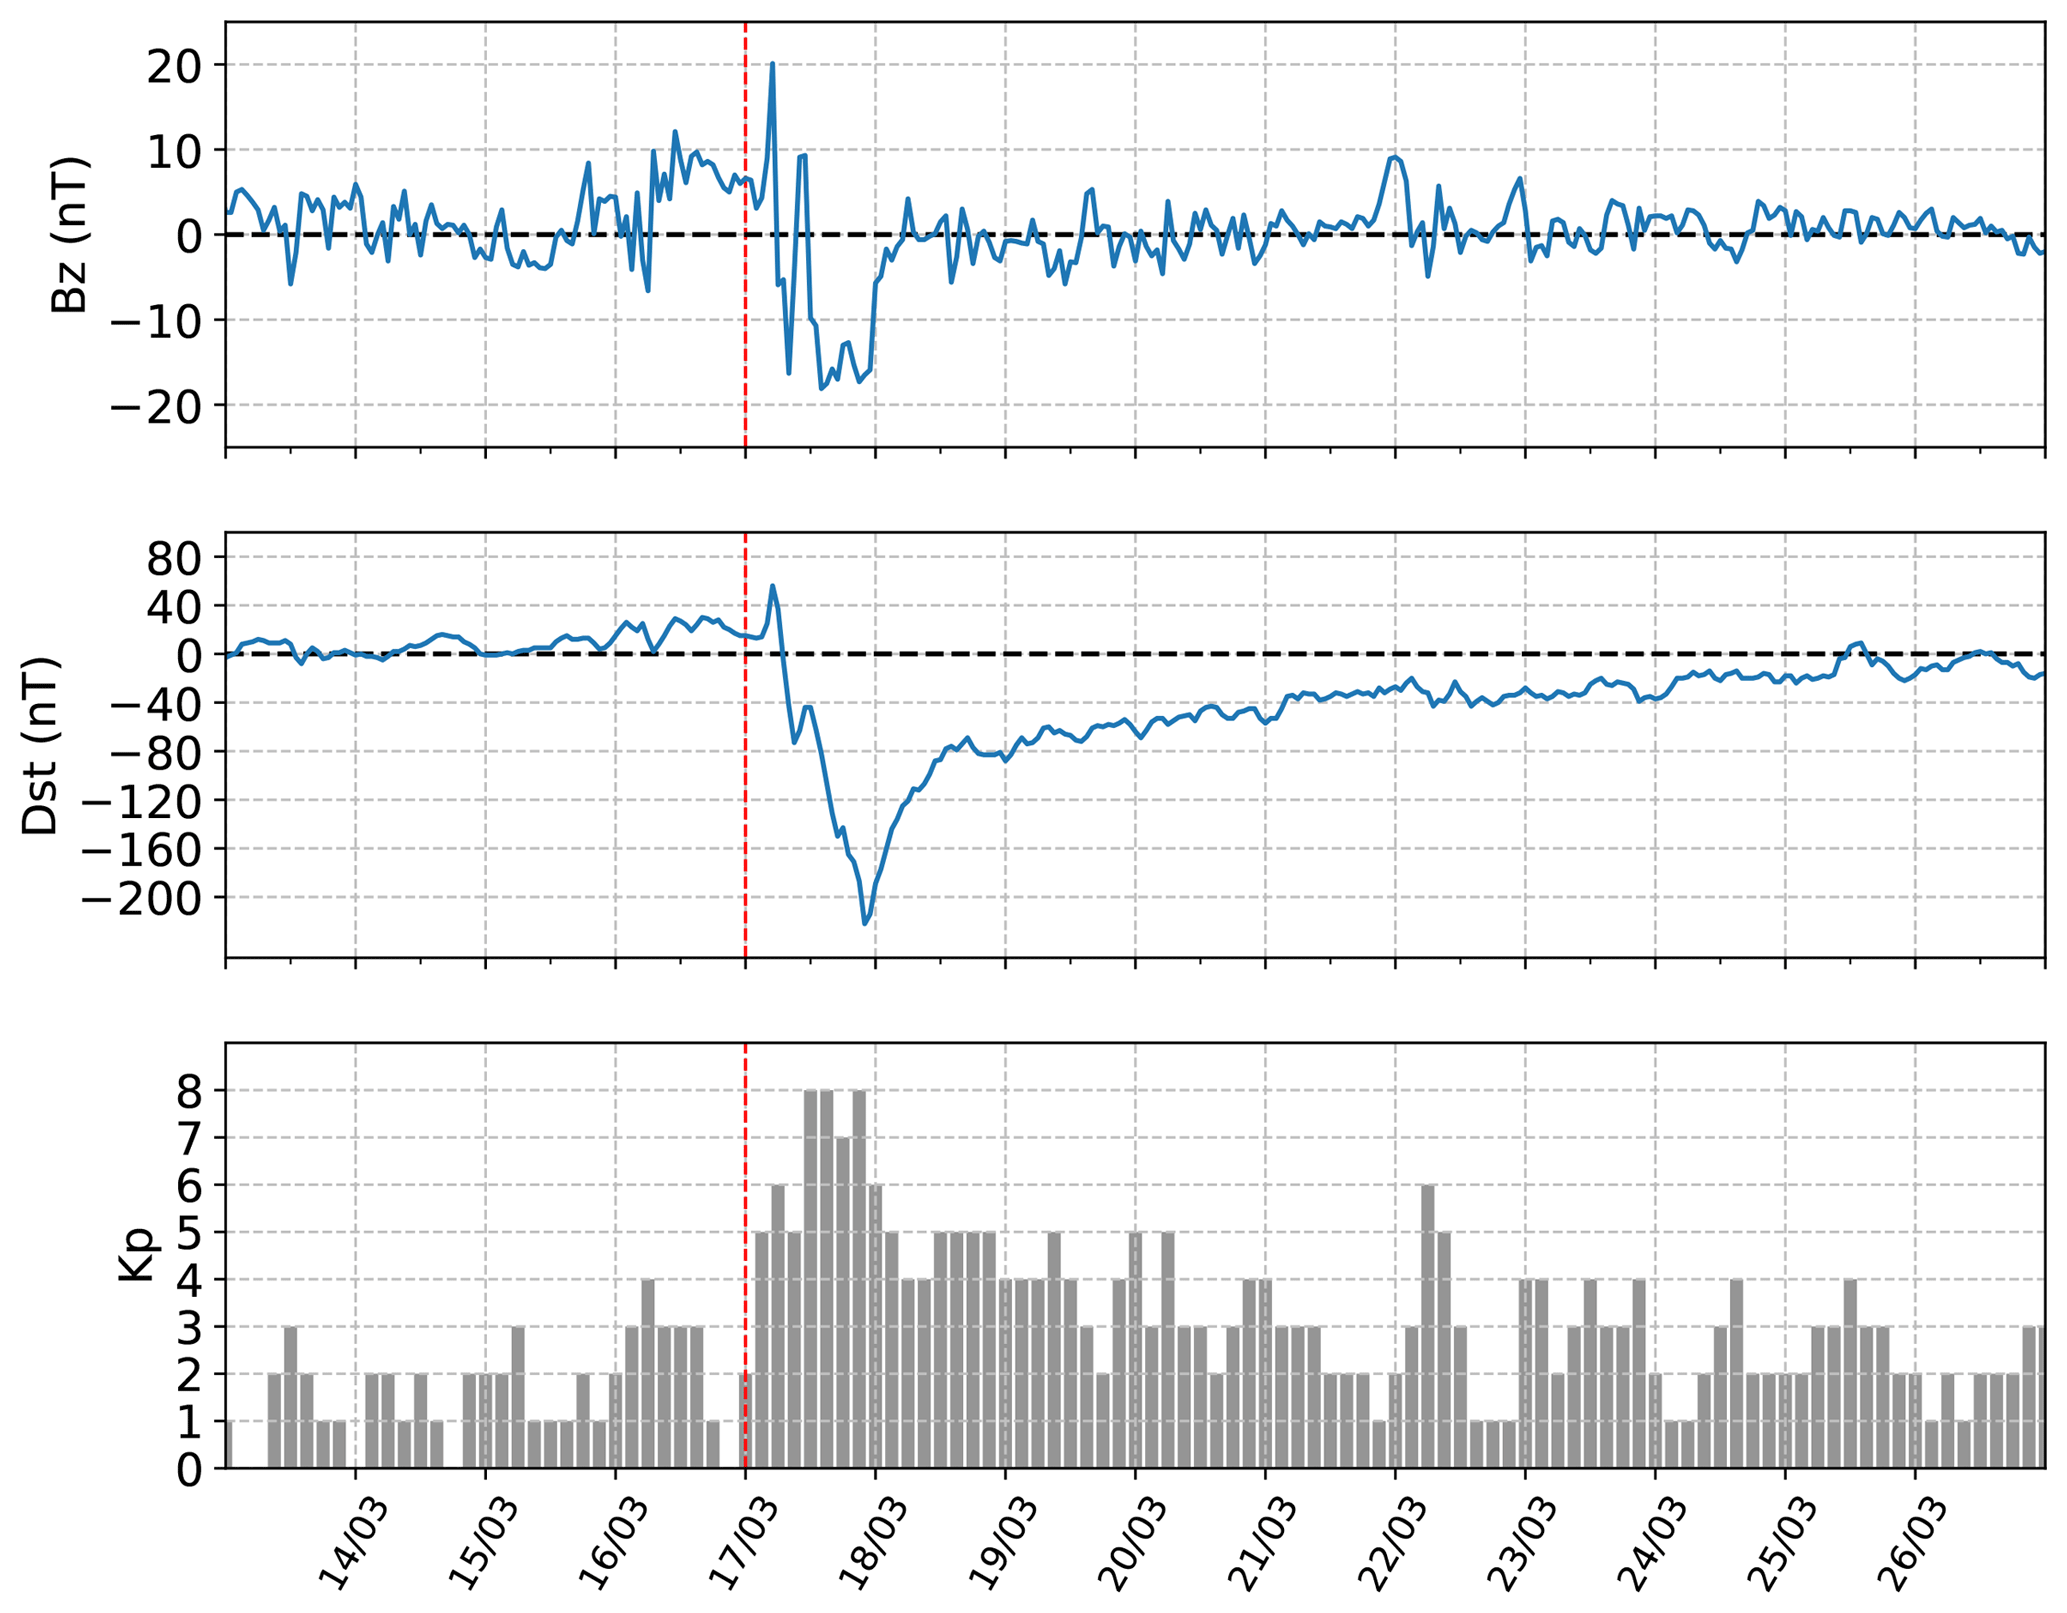
Figure 5The vertical component of the interplanetary magnetic field (Bz) and the Dst and Kp geomagnetic indices between 13 and 27 March 2015. The vertical dashed red line in all the plots indicates the day that the 2015 St. Patrick's Day storm occurred (17 March 2015).

Figure 6(a) Global ionospheric maps for 17, 18 and 19 March 2015 at 02:00 UT. (b) Differential VTEC maps for 17, 18 and 19 March 2015 at 02:00 UT.
3.1 GIM maps
In the left column of Fig. 2, GIMs for 7, 8 and 9 September 2017 at 02:00 UT are presented. It is clearly seen in the GIM of 8 September at 02:00 UT (just 3 h after the storm sudden commencement) that the VTEC was enhanced in the EIA region with respect to the day before (7 September) and the day after (9 September) at the same hour. A recent study by Lei et al. (2018), using diverse instruments (e.g., satellites and ionosondes), has also observed this TEC enhancement in the Asian–Australian region for this geomagnetic storm. The increment of VTEC in the EIA was already observed in previous studies about ionospheric responses to geomagnetic storms (e.g., Zhao et al., 2005; Pedatella et al., 2009; Astafyeva et al., 2015; Chakraborty et al., 2015).
3.2 Differential VTEC maps
What was quite compelling was the detection of an ionospheric localized anomaly (∼40∘ S) – or as named by Edemskiy et al. (2018), a localized TEC enhancement – to the south of the southern geomagnetic conjugate region of the EIA. This LTE can be identified in the GIM map of 8 September 2017 at ∼ 02:00 UT (Fig. 2). In the right column of Fig. 2, ΔVTEC maps for 7, 8 and 9 September 2017 at 02:00 UT are also presented. It can be seen from these ΔVTEC maps that, a day before and after the LTE appeared, no anomalies were visible. However as already indicated, the day that the ionospheric storm occurred (8 September), the dramatic enhancement of the VTEC to the south of the EIA, manifested as a LTE, was observed.
In Fig. 3 the dynamics of the LTE can be clearly seen. It can be noticed that this LTE was very transitory – in the ΔVTEC maps it appeared at ∼ 02:00 UT on 8 September and at ∼ 06:00 UT it was already gone. This unforseen positive ionospheric storm covers most of New Zealand and extends westward towards the southeastern part of Australia and eastward towards the Pacific. The maximum peak of this LTE also happened on 8 September at 02:00 UT with ΔVTEC = 6.47 TECU Units (TECU; where 1 TECU = 1016 electrons m−2).
3.3 Shape of the EIA
To better visualize this LTE to the south of the EIA, the shape of the VTEC along the meridional line of 170∘ E is shown in Fig. 4 between 7 and 9 September 2017 at 02:00 UT. From the ΔVTEC maps (Fig. 2), it can be confirmed that the EIA follows its normal variability 1 day after (9 September at 02:00 UT) and before (7 September at 02:00 UT) the storm occurred (no anomalous VTEC enhancements are visible). However, on 8 September at 02:00 UT the EIA was significantly enhanced and hence this translated into a much sharper definition of the double crest with a trough shape observed in Fig. 4. This shape is expected because when the LTE is above New Zealand, it is still daytime – the local time is 14:00 (02:00 UT). In addition to the two crests from the EIA, a third one in the Southern Hemisphere is visible (Fig. 4). This third crest is simply the LTE observed in the ΔVTEC and GIM maps for 8 September at 02:00 UT (Figs. 2 and 3). The peak increment for this day and this time in the southern crest of the EIA is of 172 % and in the LTE of 241.2 %. Edemskiy et al. (2018) have also reported for the 15 August 2015 G3 geomagnetic storm that the two LTEs they observed were located to the south of the EIA (between Africa and Antarctica), whereas Sotomayor-Beltran (2018) has also identified to the south of the EIA a LTE over the Indian Ocean during the G2 moderate storm of 20 April 2018.
3.4 The St. Patrick's Day 2015 geomagnetic storm
In order to look for comparable LTEs in a similar geomagnetic storm category, the author turned to the G4 geomagnetic storm that occurred during St. Patrick's Day in 2015 which has been thoroughly studied (Astafyeva et al., 2015; Cherniak et al., 2015; Nava et al., 2016; Yao et al., 2016; Jin et al., 2017; Zhang et al., 2018). In Fig. 5, the variability in the geomagnetic indices, Dst and Kp, and the vertical interplanetary magnetic field for a period of days (13–27 March) in the month of March 2015 can be observed. GIMs and ΔVTEC maps are shown in Fig. 6. In the ΔVTEC maps it was possible to observe a positive ionospheric storm starting on 17 March 2015 at ∼ 18:00 UT right over the southern Atlantic, just north of the Antarctic coast. This positive storm started to move westward and it reached its maximum strength on 18 March 2015 at ∼ 02:00 UT with a peak of ΔVTEC = 12.88 TECU (Fig. 6). In this case, however, the enhancement of VTEC observed in the Southern Hemisphere is not a LTE it is only the southern crest of the EIA which underwent an increment of VTEC and shifted several degrees southward. On the other hand, in the ΔVTEC maps of 17 March 2015 starting at ∼ 22:00 UT, negative ionospheric storms were also observed and they lasted until the end of the day of 18 March 2015. Both of these results agree well with the ones from previous studies, using different methods, for the St. Patrick's Day 2015 storm (Astafyeva et al., 2015; Yao et al., 2016). It can also be finally noticed in Fig. 6, in the ΔVTEC maps, that at 02:00 UT the day before and the day after the maximum peak of the positive ionospheric storm there are no anomalous variations of the observed TEC.
3.5 Creation of 8 September 2017 LTE
For the case of the St. Patrick storm of 2015, for the observed positive storm in the Southern Hemisphere and negative storm in the Northern Hemisphere, Astafyeva et al. (2015) and Yao et al. (2016) indicated three suitable candidates as the origin mechanisms: the strength of the geomagnetic field, the By component of the interplanetary magnetic field and composition changes in the thermosphere. On the other hand, for the moderate G3 storm of 15 August 2015 there was not a clear mechanism put forward by Edemskiy et al. (2018) to account for the observed LTEs. Only a dependence of the emergence of these LTEs to the interplanetary Bz was hinted at, but still as indicated by the authors of that study it was not their definite conclusion.
For the LTE observed during the 8 September 2017 severe storm in this work, an excursion of the interplanetary Bz along with a consequent decrease in the Dst index was also observed (Fig. 1). Thus, it can be suggested that there is also an association between the interplanetary Bz and the emergence of the LTE. In this vein, Lei et al. (2018) have gone further and indicated that for the 8 September 2017 geomagnetic storm not only could Bz produce prompt penetration electric fields (PPEFs) which enhance the EIA (super-fountain effect) but could also produce traveling atmospheric disturbances (TADs). These TADs, which originate in the polar regions, can transport equatorward winds that drive plasma upwards in the middle and lower latitudes, and as a consequence the ionosphere moves to higher altitudes (Chen et al., 2016). It is very likely then, as suggested by Lei et al. (2018), that the combined effect of TADs and the PPEFs is responsible for the creation of the LTE observed in Figs. 2 and 3. Regarding the overall enhancement of the EIA (Figs. 2 and 3) and shifting of the crests in the direction of the poles observed in Fig. 4, as previously mentioned and suggested by many studies (e.g., Tsurutani et al., 2004; Mannucci et al., 2005; Astafyeva, 2009; Astafyeva et al., 2014; Chakraborty et al., 2015), the mechanism at work is the ionospheric super-fountain effect. Finally, it is also worth mentioning that this would be the second time a LTE has been detected since 2016, as the first one was the one observed during the 20 April 2018 geomagnetic storm (Sotomayor-Beltran, 2018).
Ionospheric response to the G4 severe geomagnetic storm of 8 September 2017 was analyzed by using VTEC maps from CODE along with a statistical method to identify ionospheric anomalies. By producing differential VTEC maps it was possible to identify not only an enhancement of the EIA but also a localized TEC enhancement. The maximum intensity of this LTE was on 8 September 2017 at 02:00 UT and it was localized right over New Zealand and extending towards the southeastern coast of Australia and eastward towards the Pacific. The LTE was quite transitory – it lasted only for about 4 h and on 8 September at 06:00 UT it faded away. This LTE is the second one to be observed since 2016. By analyzing the latitudinal profiles, it could be determined that the maximum VTEC increment, where the LTE was observed, was of 241.2 %.
Due to its category, the G4 storm from 17 March 2015 was also investigated in order to look for comparable LTEs. However, there were no LTE detections and instead a hemispheric asymmetry of ionospheric storms in the Northern and Southern Hemisphere was observed. One geomagnetic storm which presented the same traits (LTEs) as in the one of 8 September 2017 was the G3 15 August 2015 moderate storm. During this storm, LTEs were also identified south of the geomagnetic conjugate region of the EIA. These LTEs, as was indicated, seem to be associated with the negative excursion of Bz.
For the 8 September 2017 storm in the present study, we also observed such negative excursion of the vertical component of the interplanetary magnetic field; hence, it can be suggested then that this has an effect on the origin of the LTE. Furthermore, it is very likely that TADs along with the super-fountain effect, the two of them due to Bz, are having a significant effect in the generation of the observed LTE. To shed more light into how these LTEs are created, further observations of these events along with physical modeling of the effects of the Bz on the super-fountain effect, TADs and possibly other contributing ionospheric mechanisms would be needed.
The IONEX files are available at ftp://ftp.aiub.unibe.ch/. (last access: 23 April 2018). Kp index data can be found in: http://wdc.kugi.kyoto-u.ac.jp/dst realtime/index.html (last access: 30 April 2018). Data for the Dst index is in: ftp://ftp.gfz-potsdam.de/ (last access: 30 April 2018). Data for Bz can be accessed at: (https://omniweb.gsfc.nasa.gov/, last access: 30 April 2018).
CSB concieved the project, processed and analyzed all data. CSB also wrote the first version of the draft. LAA contributed with theoretical insight during the revision process and also reprocessed the data to produce the last versions of Figs. 1, 2, 3, 5 and 6.
The authors declare that they have no conflict of interest.
The authors are very grateful to the anonymous referees for their constructive and insightful comments that helped in improving the manuscript. The authors would like to thank CODE for making publicly available IONEX files and also would like to acknowledge the World Data Center for Geomagnetism in Kyoto, the German Research Center for Geosciences, and the OMNI database for providing data for the Dst index, the Kp index and the vertical interplanetary Bz, respectively.
This paper was edited by Dalia Buresova and reviewed by Loredana Perrone and two anonymous referees.
Afraimovich, E. L., Astafyeva, E. I., Demyanov, V. V., Edemskiy, I. K., Gavrilyuk, N. S., Ishin, A. B., Kosogorov, E. A., Leonovich, L. A., Lesyuta, O. S., Palamartchouk, K. S., Perevalova, N. P., Polyakova, A. S., Smolkov, G. Y., Voeykov, S. V., Yasyukevich, Y. V., and Zhivetiev, I. V.: A review of GPS/GLONASS studies of the ionospheric response to natural and anthropogenic processes and phenomena, J. Space Weather Spac., 3, 19 pp., 2013. a
Appleton, E. V.: Two anomalies in the Ionosphere, Nature, 157, p. 691, 1946. a
Astafyeva, E.: Effects of strong IMF Bz southward events on the equatorial and mid-latitude ionosphere, Ann. Geophys., 27, 1175–1187, https://doi.org/10.5194/angeo-27-1175-2009, 2009. a, b
Astafyeva, E., Yasyukevich, Y., Maksikov, A., and Zhivetiev, I.: Geomagnetic storms, super-storms, and their impacts on GPS-based navigation systems, Adv. Space Res., 12, 508–525, 2014. a
Astafyeva, E., Zakharenkova, I., and Förster, M.: Ionospheric response to the 2015 St. Patrick's Day storm: A global multi-instrumental overview, J. Geophys. Res.-Space, 120, 9023–9037, 2015. a, b, c, d
Borries, C., Berdermann, J., Jakowski, N., and Wilken, V.: Ionospheric storms – A challenge for empirical forecast of the total electron content, J. Geophys. Res.-Space, 120, 3175–3186, 2015. a
Buonsanto, M.: Ionospheric Storms – A Review, Space Sci. Rev., 88, 563–601, 1999. a, b
Chakraborty, M., Kumar, S., De, B. K., and Guha, A.: Effects of geomagnetic storm on low latitude ionospheric total electron content: A case study from Indian sector, J. Earth Syst. Sci., 124, 1115–1126, 2015. a, b
Chen, X., Lei, J., Wang, W., Burns, A. G., Luan, X., and Dou, X.: A numerical study of nighttime ionospheric variations in the American sector during 28–29 October 2003, J. Geophys. Res.-Space, 121, 8985–8994, 2016. a
Cherniak, I., Zakharenkova, I., and Redmon, J.: Dynamics of the high-latitude ionospheric irregularities during the 17 March 2015 St. Patrick's day storm: Ground-based GPS measurements, Adv. Space Res., 13, 585–597, 2015. a
Danilov, A. D.: Ionospheric F-region response to geomagnetic disturbances, Adv. Space Res., 52, 343–366, 2013. a
Dobrovolsky, I. P., Zubkov, S. I., and Miachkin, V. I.: Estimation of the size of earthquake preparation zones, Pure Appl. Geophys., 117, 1025–1044, 1979. a
Edemskiy, I., Lastovicka, J., Buresova, D., Habarulema, J. B., and Nepomnyashchikh, I.: Unexpected Southern Hemisphere ionospheric response to geomagnetic storm of 15 August 2015, Ann. Geophys., 36, 71–79, https://doi.org/10.5194/angeo-36-71-2018, 2018. a, b, c, d
Gonzalez, W. D. and Echer, E.: A study on the peak Dst and peak negative Bz relationship during intense geomagnetic storms, Geophys. Res. Lett., 32, 4 pp., 2005. a
Gonzalez, W. D., Joselyn, J. A., Kamide, Y., Kroehl, H. W., Rostoker, G., Tsurutani, B. T., and Vasyliunas, V. M.: What is a geomagnetic storm?, J. Geophys. Res.-Space, 99, 5771–5792, 1994. a
Gosling, J. T., McComas, D. J., Phillips, J. L., and Bame, S. J.: Geomagnetic activity associated with earth passage of interplanetary shock disturbances and coronal mass ejections, J. Geophys. Res.-Space, 96, 7831–7839, 1991. a
Guo, J., Li, W., Yu, H., Liu, Z., Zhao, C., and Kong, Q.: Impending ionospheric anomaly preceding the Iquique Mw 8.2 earthquake in Chile on 2014 April 1, Geophys. J. Int., 203, 1461–1470, 2015. a
Hernández-Pajares, M., Juan, J. M., Sanz, J., Orus, R., Garcia-Rigo, A., Feltens, J., Komjathy, A., Schaer, S. C., and Krankowski, A.: The IGS VTEC maps: a reliable source of ionospheric information since 1998, J. Geodesy, 83, 263–275, 2009. a
Huang, C.-S., Foster, J. C., and Kelley, M. C.: Long-duration penetration of the interplanetary electric field to the low-latitude ionosphere during the main phase of magnetic storms, J. Geophys. Res.-Space, 110, 13 pp., 2005. a
Jin, S., Jin, R., and Kutoglu, H. J.: Positive and negative ionospheric response to the March 2015 geomagnetic storm from BDS observations, J. Geodesy, 91, 613–626, 2017. a
Lei, J., Huang, F., Chen, X., Zhong, J., Ren, D., Wang, W., Yue, X., Luan, X., Jia, M., Dou, X., Hu, L., Ning, B., Owolabi, C., Chen, J., Li, G., and Xue, X.: Was Magnetic Storm the Only Driver of the Long-Duration Enhancements of Daytime Total Electron Content in the Asian-Australian Sector Between 7 and 12 September 2017?, J. Geophys. Res.-Space, 123, 3217–3232, 2018. a, b, c
Li, J., You, X., Zhang, R., Meng, G., Shi, H., and Han, Y.: Ionospheric total electron content disturbance associated with May 12, 2008, Wenchuan earthquake, Geodesy and Geodynamics, 70, 126–134, 2015. a
Liu, J. Y., Chuo, Y. J., Shan, S. J., Tsai, Y. B., Chen, Y. I., Pulinets, S. A., and Yu, S. B.: Pre-earthquake ionospheric anomalies registered by continuous GPS TEC measurements, Ann. Geophys., 22, 1585–1593, https://doi.org/10.5194/angeo-22-1585-2004, 2004. a
Liu, S.-L. and Li, L.-W.: Study on Relationship between Southward IMF Events and Geomagnetic Storms, Chinese J. Geophys.-Ch., 45, 301–310, 2002. a
Loewe, C. A. and Prölss, G. W.: Classification and mean behavior of magnetic storms, J. Geophys. Res.-Space, 102, 14209–14213, 1997. a
Mannucci, A. J., Tsurutani, B. T., Iijima, B. A., Komjathy, A., Saito, A., Gonzalez, W. D., Guarnieri, F. L., Kozyra, J. U., and Skoug, R.: Dayside global ionospheric response to the major interplanetary events of October 29–30, 2003 “Halloween Storms”, Geophys. Res. Lett., 32, 4 pp., 2005. a, b
McDonald, S. E., Coker, C., Dymond, K. F., Anderson, D. N., and Araujo-Pradere, E. A.: A study of the strong linear relationship between the equatorial ionization anomaly and the prereversal E X B drift velocity at solar minimum, Radio Sci., 46, 1–9, 2011. a
Nava, B., Rodríguez-Zuluaga, J., Alazo-Cuartas, K., Kashcheyev, A., Migoya-Orué, Y., Radicella, S. M., Amory-Mazaudier, C., and Fleury, R.: Middle- and low-latitude ionosphere response to 2015 St. Patrick's Day geomagnetic storm, J. Geophys. Res.-Space, 121, 3421–3438, 2016. a
Patel, V. L. and Desai, U. D.: Interplanetary magnetic field and geomagnetic Dst variations, Astrophys. Space Sci., 20, 431–437, 1973. a
Pedatella, N. M., Lei, J., Larson, K. M., and Forbes, J. M.: Observations of the ionospheric response to the 15 December 2006 geomagnetic storm: Long-duration positive storm effect, J. Geophys. Res.-Space, 114, 110 pp., 2009. a
Schaer, S., Gurtner, W., and Feltens, J.: IONEX: The ionosphere map exchange format version 1, Astronomical Institute of the University of Bern, 233–247, http://ftp.aiub.unibe.ch/ionex/draft/ionex11.pdf, 1998. a
Sotomayor-Beltran, C.: Localized Increment and Decrement in the Total Electron Content of the Ionosphere as a Response to the April 20, 2018, Geomagnetic Storm, Int. J. Geophys., 2018, 2018. a, b, c, d
Sotomayor-Beltran, C.: Ionospheric anomalies preceding the low-latitude earthquake that occurred on April 16, 2016 in Ecuador, J. Atmos. Sol.-Terr. Phys., 182, 61–66, 2019. a
Sugiura, M.: Hourly value of equatorial Dst for the IGY, Annals of the International Geophysical Year, 35, 1964. a
Tsurutani, B., Mannucci, A., Iijima, B., Abdu, M. A., Sobral, J. H. A., Gonzalez, W., Guarnieri, F., Tsuda, T., Saito, A., Yumoto, K., Fejer, B., Fuller-Rowell, T. J., Kozyra, J., Foster, J. C., Coster, A., and Vasyliunas, V. M.: Global dayside ionospheric uplift and enhancement associated with interplanetary electric fields, J. Geophys. Res.-Space, 109, 16 pp., 2004. a
Tsurutani, B. T., Gonzalez, W. D., Tang, F., Akasofu, S. I., and Smith, E. J.: Origin of interplanetary southward magnetic fields responsible for major magnetic storms near solar maximum (1978–1979), J. Geophys. Res.-Space, 93, 8519–8531, 1988. a
Yao, Y., Liu, L., Kong, J., and Zhai, C.: Analysis of the global ionospheric disturbances of the March 2015 great storm, J. Geophys. Res.-Space, 121, 157–170, 2016. a, b, c
Yao, Y. B., Chen, P., Wu, H., Zhang, S., and Peng, W. F.: Analysis of ionospheric anomalies before the 2011 Mw 9.0 Japan earthquake, Chinese Sci. Bull., 57, 500–510, 2012. a
Zakharenkova, I. E., Shagimuratov, I. I., Tepenitzina, N. Y., and Krankowski, A.: Anomalous modification of the ionospheric total electron content prior to the 26 September 2005 Peru earthquake, J. Atmos. Sol.-Terr. Phys., 70, 1919–1928, 2008. a
Zhang, W., Zhao, X., Jin, S., and Li, J.: Ionospheric disturbances following the March 2015 geomagnetic storm from GPS observations in China, Geodesy and Geodynamics, 9, 288–295, 2018. a
Zhao, B., Wan, W., and Liu, L.: Responses of equatorial anomaly to the October–November 2003 superstorms, Ann. Geophys., 23, 693–706, https://doi.org/10.5194/angeo-23-693-2005, 2005. a
Zhu, F., Wu, Y., Lin, J., and Zhou, Y.: Temporal and spatial characteristics of VTEC anomalies before Wenchuan Ms 8.0 earthquake, Geodesy and Geodynamics, 1, 23–28, 2010. a
Zou, Y. and Zhao, T.: Ionospheric anomalies detected by GPS TEC measurements during the 15 August 2007 Peru earthquake, in: 2010 International Conference on Microwave and Millimeter Wave Technology, 1216–1219, 2010. a