the Creative Commons Attribution 4.0 License.
the Creative Commons Attribution 4.0 License.
Comparing high-latitude thermospheric winds from Fabry–Perot interferometer (FPI) and challenging mini-satellite payload (CHAMP) accelerometer measurements
Matthias Förster
Rosie Hood
Ian McWhirter
It is generally assumed that horizontal wind velocities are independent of height above the F1 region (> 300 km) due to the large molecular viscosity of the upper thermosphere. This assumption is used to compare two completely different methods of thermospheric neutral wind observation, using two distinct locations in the high-latitude Northern Hemisphere. The measurements are from ground-based Fabry–Perot interferometers (FPI) and from in situ accelerometer measurements onboard the challenging mini-satellite payload (CHAMP) satellite, which was in a near-polar orbit. The University College London (UCL) Kiruna Esrange Optical Platform Site (KEOPS) FPI is located in the vicinity of the auroral oval at the ESRANGE site near Kiruna, Sweden (67.8∘ N, 20.4∘ E). The UCL Longyearbyen FPI is a polar cap site, located at the Kjell Henriksen Observatory on Svalbard (78.1∘ N, 16.0∘ E). The comparison is carried out in a statistical sense, comparing a longer time series obtained during night-time hours in the winter months (DOY 300–65) with overflights of the CHAMP satellite between 2001 and 2007 over the observational sites, within ±2∘ latitude (±230 km horizontal range). The FPI is assumed to measure the line-of-sight winds at a height of ∼240 km, i.e. the peak emission height of the atomic oxygen 630.0 nm emission. The cross-track winds are derived from state-of-the-art precision accelerometer measurements at altitudes between ∼450 km (in 2001) and ∼350 km (in 2007), i.e. 100–200 km above the FPI wind observations. We show that CHAMP wind values at high latitudes are typically 1.5 to 2 times larger than FPI winds. In addition to testing the consistency of the different measurement approaches, the study aims to clarify the effects of viscosity on the height dependence of thermospheric winds.
- Article
(11404 KB) - Full-text XML
- BibTeX
- EndNote
Global circulation models (GCM) of the upper atmosphere (altitude from 80 to 600 km) appear in two forms: climatologies based on empirical measurements, and theoretical models that calculate atmospheric conditions using the principles of physics and chemistry. These models are important for space weather studies and are also applied in understanding and predicting drag on low-altitude satellites, space debris and the study of the re-entry of near-Earth objects. The theoretical and empirical models rely on observations from ground-based instruments around the world and global observations by satellites to provide constraints and boundary conditions. In particular, models must account for energy from sources external to the upper atmosphere (i.e., direct solar radiation, particle precipitation and heat flow from above; radiative, conductive and convective heating from below; and the magnetospheric electrodynamic driver at high-latitudes), which is divided between acceleration of the gas and heating. The empirical evidence for the energy budget can be provided by observations of winds and temperatures.
The use of accelerometers on satellites to measure thermospheric winds had rarely been reported in the literature until recently (Marcos and Forbes, 1985; Forbes et al., 1993); however, over the last few years challenging mini-satellite payload (CHAMP) and GOCE winds have been reported (e.g. Förster et al., 2008; Doornbos et al., 2010). The advantage of this technique consists in the fairly direct in situ measurement, with relatively high spatial (temporal) resolution, of the cross-track wind component along the orbital track with only a limited number of special assumptions regarding the data interpretation. Adding more satellites (e.g. GRACE and GRACE-FO), should allow better full wind vector reconstructions in terms of statistical averages (Förster et al., 2008, 2017) as well as parameterized statistical studies of the upper thermosphere dynamics in the near future. As a result, it makes it imperative that the derived winds are correct because satellites provide global coverage of the upper atmosphere, unlike the small number of ground-based instruments currently in existence. The larger databases and global coverage of the satellites will particularly influence semi-empirical models such as the Horizontal Wind Model (HWM; Drob et al., 2015), which is commonly used as a climatology of winds to provide initial boundary conditions and validation for physics-based global circulation models (GCMs).
In this paper we show that upper thermospheric winds measured by the CHAMP satellites are typically 1.5 to 2 times larger than those measured by ground-based Fabry–Perot interferometers (FPIs) at an auroral site and polar cap site. It is imperative to know whether this discrepancy is real (i.e. there is a variation of speed with respect to height), or whether we have uncovered a problem of the absolute scaling of wind measurements by comparing FPIs with CHAMP. With incorrect scaling, a problem arises with respect to the distortion of energy budget calculations of the upper atmosphere. A precise estimation of energy supply to the system is essentially hindered, as the partitioning of the kinetic and thermal energy channels becomes obscured. The acceleration of the neutral air in 3-D space with respect to the active driver of the plasma motion is important to estimate, for instance, the Joule heating rate, as one of the most important thermal energy inputs. This has a knock-on effect on the calculation of the absolute density of the gas, which is an important parameter used in, for example, satellite orbit calculations.
The challenging mini-satellite payload (CHAMP) was managed by the GFZ German Research Centre for Geosciences of the Helmholtz Centre Potsdam. This mission was designed to perform detailed studies of the Earth's gravitational and magnetic field with unprecedented accuracies and space/time resolutions as well as GPS atmosphere and ionosphere profiling. The spacecraft was launched in July 2000 into a circular near-polar orbit with an 87.3∘ inclination at an initial altitude of ∼460 km (Reigber et al., 2002). Its orbital altitude gradually decayed to ∼400 km in 2003, ∼330 km in 2008 and then ended in September 2010.
One key scientific instrument onboard CHAMP was a triaxial accelerometer. It was located at the spacecraft's centre of mass and effectively probed the in situ air drag. Thermospheric mass density and cross-track neutral wind can be obtained from the drag acceleration observations. It is very difficult to determine the error estimate because it depends on several variables, as discussed in Doornbos et al. (2010) and shown in Table 5 in Visser et al. (2019). For force-derived winds, this indicates that the largest sensitivity is to energy accommodation, which is of the order of several tens of metres per second.
A first analysis of the dependence of high-latitude thermospheric wind circulation on the IMF orientation was performed by Förster et al. (2008) using the preliminary methodology of cross-track wind estimations from accelerometer data as described in Liu et al. (2006). Förster et al. (2011) then presented an overview of the average transpolar thermospheric circulation in terms of the vorticity. Here, they made use of the newly calibrated and re-analysed data set that resulted from an ESA (European Space Agency) study, initiated for the Swarm satellites mission launched in November 2013 (Helleputte et al., 2009). The CHAMP neutral wind data, based on the cross-track accelerometer measurements, are available via the data repository at the GFZ Potsdam (Förster and Doornbos, 2019).
As pointed out by Doornbos et al. (2010), the along-track wind is not resolvable because it induces a similar signal in the acceleration as the density variation. This wind component is ignored, or the value from an empirical wind model is used, because the along-track wind is of a relatively small magnitude in comparison with the satellite speed of 7.6 km s−1. The empirical wind model used is, for example, HWM90 (Hedin et al., 1991) or its latest edition HWM14, as published by Drob et al. (2015). In polar areas the along-track wind velocity can achieve up to 10 % of the satellite speed. Consequently, the along-track mass density estimation can have an error of about 20 % at polar latitudes, because the acceleration is proportional to the wind velocity squared (e.g., Doornbos et al., 2010). However, it is not as easy to estimate the error in the cross-track wind in the polar region due to considerably smaller acceleration signals. There are also systematic contributions from other sources such as gas–surface interactions, surface properties, spacecraft shape, spacecraft attitude and radiation pressure accelerations, which make the satellite aerodynamic coefficients difficult to resolve (see Doornbos et al., 2010, and the error budget in Appendix A of that paper; Mehta et al., 2017; March et al., 2018). The preprocessed data of the accelerometer were resampled to 10 s averages for the further use in this study. Measurements of 10 s cadence correspond to a spatial separation of 76 km or about 2∕3∘ in latitude between the individual data points.
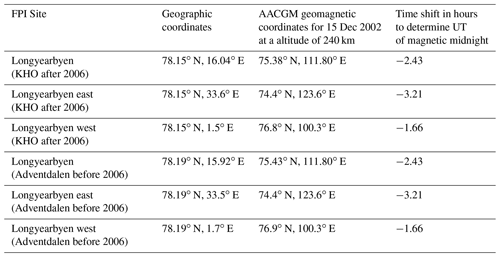
The advantage of using Fabry–Perot interferometers is that they make direct measurements of thermospheric wind speeds using only a few instrumental or geophysical assumptions. They are also generally reliable instruments that can be left to run for months at a time. The FPIs operated by University College London are located at the Kiruna Esrange Optical Platform Site (KEOPS) in northern Sweden, and on the island of Svalbard at the Adventdalen Observatory (before November 2006), the later of which was moved to the Kjell Henriksen Observatory (after November 2006). The geographic and geomagnetic coordinates of these two stations are given in Table 1 for Kiruna (KEOPS) and Table 2 for Longyearbyen (Svalbard). The altitude-adjusted corrected geomagnetic coordinates (AACGM) are obtained from http://sdnet.thayer.dartmouth.edu/aacgm/aacgm_calc.php, last access: 5 December 2019 (Shepherd, 2014). A date of 15 December 2002 was used, for an altitude of 240 km. Owing to the large field of view of the FPIs (discussed in the following) the locations of the volumes observed by the FPIs in the east and west viewing directions are also given, as is the corresponding magnetic local time (MLT).
Table 1Geographic and geomagnetic AACGM coordinates of the FPI facility related to the KEOPS site in Kiruna (see text).

Table 2The same as in Table 1, but for the FPI site in Longyearbyen. The observatory's historic names are given in parentheses.
A significant limitation of ground-based FPIs is that optical measurements of airglow and aurora at thermospheric altitudes are only possible during the night when the sun's zenith angle is greater than 98∘. This means that the high-latitude FPI observing season only runs in the winter months: from September to April at KEOPS; and from October to March at Longyearbyen. The FPIs have been almost continually observing the 630 nm emission from airglow and aurora every winter night since 1981 and 1986 respectively. Complete 24 h observations are possible from November to January at Longyearbyen. Thermospheric winds have been monitored by calculating the Doppler shifts in the 630 nm airglow radiation intensities. The FPI instrument has a mirror that rotates to look in several directions (e.g. north, north-east, east, south, west, north-west, zenith and a calibration lamp) to provide line-of-sight wind measurements at a fixed elevation angle. The exposure times can be as low as 10 s and up to 120 s. A typical complete scan cycle takes ∼4 min for Kiruna and ∼5 min for Longyearbyen. After 1999, when laser calibrations were made possible, thermospheric temperatures were measured from the thermal broadening of the emission line. More details of operation may be found in Aruliah et al. (2005) and references therein.
The 630 nm emission has a peak intensity at an altitude of around 240 km. Thus, measurements of the Doppler shifts and thermal broadening of the emission line are used to determine the winds and neutral temperatures of the upper thermosphere (an altitude of > 200 km). The elevation angle of the mirror is 45∘ for the Kiruna FPI and 30∘ for the Longyearbyen FPI. Thus, the radius of the field of view is 240 and 416 km respectively, which represents roughly a 5 and 8∘ separation in latitude of the north and south viewing volumes at the respective sites. At these high latitudes, where the magnetospheric dynamo dominates the plasma flows, ion-neutral coupling can create mesoscale structures in the upper thermosphere on horizontal scales of as little as ∼100 km (e.g. Aruliah et al., 2001). Therefore, average wind speeds have been determined for each of the four cardinal viewing directions so that the mesoscale structure is not lost. The winds are strongly dependent on universal time (UT), season, solar cycle, and geomagnetic activity due to the dominant forcing mechanisms of pressure gradients and ion-neutral coupling in the high-latitude upper thermosphere. The maximum average wind vector magnitudes measured by an FPI at Kiruna were shown to be in the range of 100–300 ms−1, and the errors of measurements were around 10–20 ms−1 (Aruliah et al., 1996). The main sources of error are as follows:
-
poor signal to noise when the 630 nm intensities are low, such as at solar minimum, or under geomagnetically quiet conditions;
-
the existence of large vertical winds. These break the assumption that the winds are predominantly horizontal. Vertical winds are generally small, but can be a few tens of metres per second at high latitudes (Aruliah and Rees, 1995; Ronksley, 2016). Large vertical winds introduce an error of a few per cent into the calculation of a horizontal wind component from the line-of-sight measurement;
-
the assumption that the neutral winds are nearly constant with respect to altitude above 200 km owing to the very low density and consequent high molecular viscosity of the upper thermosphere.
The UCL Coupled Middle Atmosphere Thermosphere-2 (CMAT2) model is a 3-D, time-dependent physics-based model, that numerically solves the non-linear coupled continuity equations of mass, momentum and energy (Harris et al., 2002). The model has a latitudinal resolution of 2∘, a longitudinal resolution of 18∘ and a one-third scale height for a height range from ∼15 km (top of the troposphere) to 300–600 km (top of the thermosphere). Thermospheric heating, photodissociation and photoionization are calculated for solar X-ray, EUV and UV radiation between 0.1 and 194 nm (Fuller-Rowell, 1992; Torr et al., 1980a, b; Roble, 1987). High-latitude ionospheric parameters of ion and electron densities and temperatures, plus field-aligned plasma velocities, are from the Coupled Sheffield University High-latitude Ionosphere Model (Quegan et al., 1982; Fuller-Rowell et al., 1996). The high-latitude auroral precipitation is provided by the TIROS/NOAA auroral precipitation model (Fuller-Rowell and Evans, 1987) and the high-latitude electric field model is from Foster et al. (1986). Other features are detailed in Harris et al. (2002). The CMAT2 winds will be presented as part of the discussion below.
Data were chosen from the two 3-year periods 2001–2003 and 2005–2007, when the CHAMP satellite was in orbit. These represent periods of solar maximum and minimum respectively. CHAMP data were collected all year round, but the FPI data were limited to night-time periods only.
5.1 CHAMP average winds
Figures 1 and 2 show plots of average CHAMP accelerometer measurements of the cross-track thermospheric wind component during the whole period from 2001 to 2003, which were obtained during direct overflights above the FPI stations at Longyearbyen (Fig. 1) and KEOPS (Fig. 2). The cross-track wind component is defined as pointing in the positive y direction of the satellite coordinate system with its x axis along the orbital trace, its z axis toward nadir and its y axis completing the right-hand system. Therefore, the y wind component is orientated perpendicular to the orbital plane to the right side, when looking in the direction of flight. Given the high inclination (87.3∘) of the CHAMP satellite, this approximately corresponds to the geographically eastward direction for the ascending orbital track (blue lines in Fig. 1) except for very high geographic latitudes (discussed in the following). The cross-track wind measurements of the descending orbital tracks (red lines in Fig. 1) have been inverted in sign to get roughly the same eastward wind component.
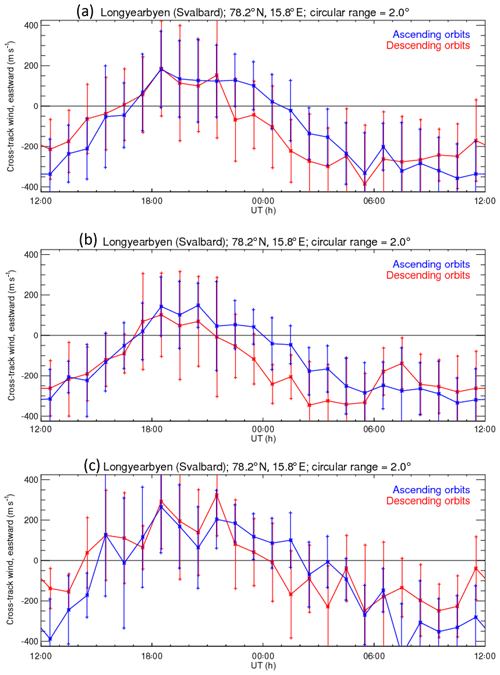
Figure 1CHAMP observations over Longyearbyen during solar maximum 2001–2003. Panel (a) shows the average values for all data – ascending (blue) and descending (red), panel (b) shows summer (May–August) averages and panel (c) shows winter (end October–early March) averages.
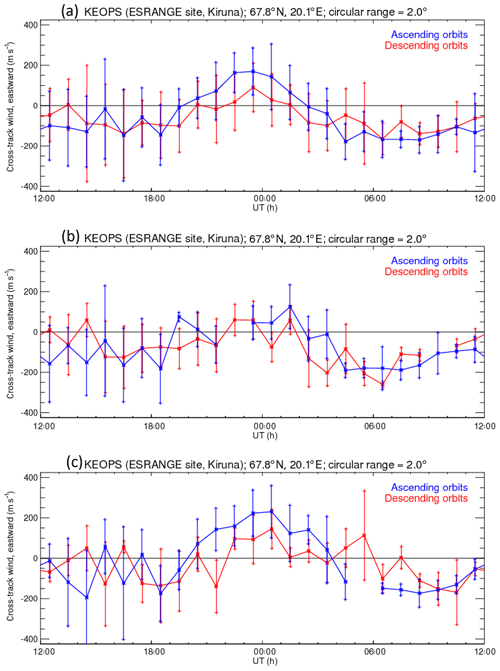
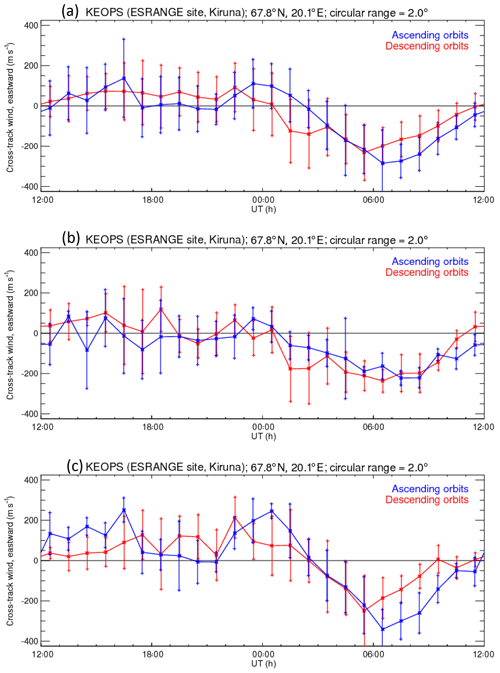
Figure 2CHAMP observations over KEOPS during solar maximum 2001–2003. Panel (a) shows the average values for all data – ascending (blue) and descending (red), panel (b) shows summer (May–August) averages and panel (c) shows winter (end October–early March) averages.
Figures 1a and 2a show average values for all data, while Figs. 1b and c show the summer averages and 2b and c show the winter averages. There are many more data points for the Longyearbyen station at a higher geographic latitude compared with KEOPS. This confirms the fact that the relative probability of overhead crossings of high-latitude stations by low Earth orbiting (LEO) satellites with a near-polar circular orbit augments with increasing latitude. A statistical study has to make some compromise with respect to the area of accepted local coincidences of the satellite recordings above the ground-based observations and also with regard to the further data binning. Here, a circular area based on a 2∘ latitude radius and hourly bins versus local time have been used which produces a sufficiently good coverage. Further binning has been tested to investigate the effect on the results. A shorter radius deteriorates the statistics within the bin, while larger bins tend to smear the spatial and temporal variations. Data filtering with respect to other parameters like, e.g., season, solar wind and interplanetary magnetic field (IMF) values, solar radiation and geomagnetic activity indices should be taken into account if they appear to have a significant effect.
The variance of the cross-track neutral wind magnitude is considerably larger during the whole day above the station at higher latitudes. The average phase of the diurnal eastward wind variation also differs considerably between the data sets from the two observatories. The eastward wind maximizes during the pre-midnight hours over Longyearbyen, whereas a smaller maximum and a shorter interval of eastward wind is seen at lower latitudes above the KEOPS station (2–3 h versus about 6 h). The eastward neutral thermospheric wind is approximately sinusoidal for Longyearbyen (Fig. 1a), but reveals two maxima/minima over the KEOPS station (Fig. 2a). The westward wind maximizes at KEOPS at about 17:00 UT and prior to midday (∼08:00–09:00 UT). Finally, the variance of the cross-track neutral wind magnitude over the lower-latitude KEOPS station is relatively large during the afternoon to the early night-time hours (∼13:00–18:00 UT). This might be due to the position of this station relative to the large dusk cell which is known to be strongly dependent on (in particular) the IMF-By component (cf., e.g., Rees et al., 1986; Killeen et al., 1995; Förster et al., 2008, 2011). In contrast to KEOPS, the higher-latitude station Longyearbyen is located close to or even poleward of the dusk cell's focus, so that the cross-polar cap circulation of the neutral thermospheric air dominates.
Figures 1b and c repeat the statistical plot of Fig. 1a for Longyearbyen for the years 2001–2003 with high solar activity, but are confined to the winter and summer months respectively. Figure 2b and c present respective KEOPS data. Therefore, the statistical significance is reduced, in particular for the KEOPS station, but seems to still be sufficient. The winter recordings (Figs. 1c, 2c) during night-time hours can be directly compared with the FPI observations (Figs. 6, 7).
The principle behaviour of the Longyearbyen and KEOPS eastward wind component is similar to that for the full year coverage, but there are also obvious seasonal differences. The wind component amplitudes, in particular the eastward maxima, are smaller during summer compared with the winter months, while the phases are almost the same. The statements about the variance of the eastward/westward wind component for both stations that have been made with respect to the full year statistics in Fig. 1 also hold for both winter and summer plots, maybe with slightly larger values for the winter months.
The ascending and descending orbits are analysed separately with respect to their statistical behaviour (blue and red lines respectively), and show distinct differences (vertical bars). This points to the problem of co-alignment of the ascending and descending orbital tracks (despite the simple sign inversion). The small offset of ∼2.7∘ from a strict polar orbit of the satellite causes some deviation from the east/westward pointing of the cross-track measurements. At low to midlatitudes, the deviation from a purely geographically eastward direction corresponds in good approximation to this colatitude angle of the satellite's inclination β≈2.7∘, but at high latitudes and in particular near the poles it can deviate considerably. This non-alignment angle α (deviation from purely eastward) can be estimated depending on the observer's colatitude θ with spherical angle relations using a simplified spherical geometry of the Earth as in Eq. (1):
Using the geographic coordinates of the observatories in Table 1, an α-angle of 7.2 and 13.3∘ is found for KEOPS and Longyearbyen respectively. The angular difference (2⋅α) between the two one-component cross-track wind measurements of the ascending and descending orbital tracks is already considerable for the most northward station at Longyearbyen, and this offset can be noticed in, for example, Fig. 1a as an offset between the wind averages for the ascending and descending orbital tracks during certain intervals, where the wind component perpendicular to the zonal wind direction, i.e. the north–south meridional wind, is large. This is obviously the case for the night-time hours between 22:00 and 04:00 UT and the daytime hours between ∼09:00 and 15:00 UT for Longyearbyen and for a few night-time hours between 21:00 and 02:00 UT for the KEOPS FPI station.
If the FPI technique, in particular the tristatic measurements for certain periods (Aruliah et al., 2005; Griffin et al., 2008), allows for the determination of specified neutral wind directions, one might consider comparing the wind magnitudes for the descending and ascending orbital tracks separately for an eastward ±α orientation respectively. Here, one should note, that at an observation point with an even higher geographic latitude (ideally at a ∼86.2∘ geographic latitude, where the two branches of one-component observations would be perpendicular to each other) it would, in principle, be possible to derive the full thermospheric horizontal wind vector from the cross-track accelerometer measurements. This is, strictly spoken, valid in a statistical mean with characteristic times of a few days, i.e. with the repetition period of ascending and descending orbits over one and the same high-latitude location.
The meridional component is much larger than the zonal component during considerable periods of the night-time observation. Thus, to minimize the error in comparing the neutral wind magnitude, it would be better to compare the full vectors. A small error of the measurement orientation could already have a large effect on the relatively small eastward wind component, which could lead to incorrect conclusions about the characteristics of the differences between FPI and CHAMP accelerometer measurements. The offset between the geographic and geomagnetic coordinates allows for the construction of the full horizontal vector plots as statistical averages taken over a period of at least 131 d of CHAMP's precession period in order to cover all local times. This statistical mapping is limited to magnetic latitudes poleward of about > 60∘ for both hemispheres (cf. Förster et al., 2008).
Figure 3 illustrates the projection of the horizontal wind component from the north and east FPI viewing directions onto the cross-track orientation of the CHAMP ascending direction. It also illustrates how the average of the CHAMP ascending and descending winds gives the zonal wind component. The projections of the FPI wind vectors onto each of the ascending and descending directions are used later to determine the ratio of the CHAMP/FPI wind magnitudes (see Sect. 5.2, Fig. 10).
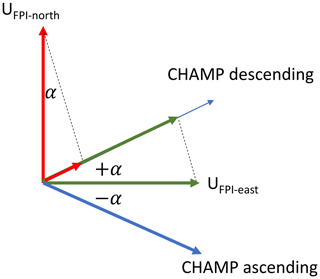
Figure 3Geometry illustrating the projection of the FPI viewing direction horizontal wind components onto the CHAMP cross-track orientation for the ascending and descending tracks.
Figures 4 and 5 show the corresponding plots for Figs. 1 and 2, but for low-solar-activity conditions during the years 2005–2007. They reveal some differences such as generally smaller amplitudes and different wind phases. Here, the zonal wind above KEOPS seems to point eastward at most times of the day except during the morning hours from 02:00 to 10:00 UT.
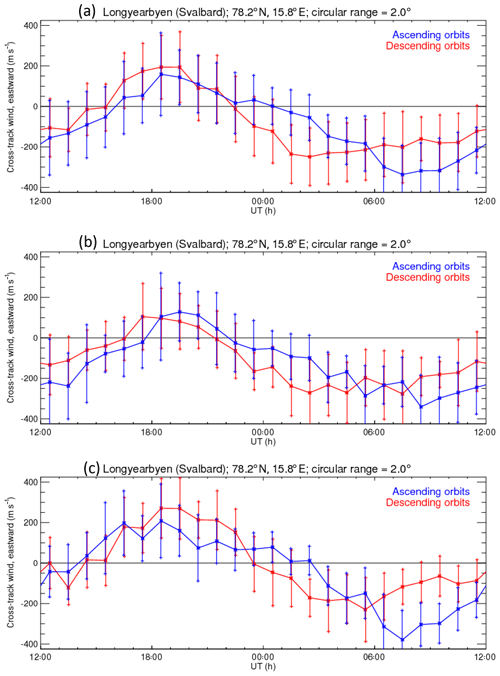
Figure 4CHAMP observations over Longyearbyen during solar minimum 2005–2007. Panel (a) shows the average values for all data – ascending (blue) and descending (red), panel (b) shows summer (May–August) averages and panel (c) shows winter (end October–early March) averages.
5.2 FPI average winds
The average winds observed at Kiruna and Longyearbyen are presented in Figs. 6 and 7. Local time is 1 h ahead of universal time for both sites. The format of these figures is that Fig.6a and c and Fig.7a and c show the average zonal wind component, comparing observations from the volumes to the east and west of the site. Figure 6b and d and Fig.7b and d show the average meridional wind component from the volumes observed to the north and south. The full set of cardinal direction measurements are presented to provide a context for the comparison with the zonal wind measurements made by CHAMP, especially as the CHAMP y axis is only roughly zonal. The standard error of the mean ε is added as an error bar to the FPI east and north data, where , σ is the standard deviation and N is the number of data points. The standard errors of the mean (rather than the standard deviations) demonstrate the distinctly different trends in the winds observed in the volumes to the east and west of the sites, i.e. the mesoscale structure of the high-latitude thermosphere.
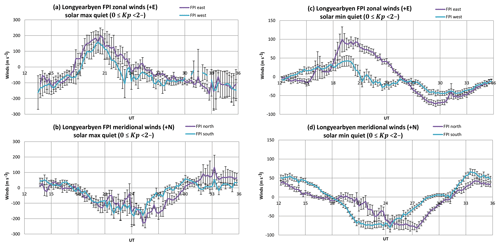
Figure 6Panels (a) and (b) show the solar maximum (2001–2003) FPI winter average wind components at Longyearbyen for geomagnetically quiet conditions (0≤ Kp < 2−). Zonal (a) and meridional (b) average winds and the standard errors of the mean are plotted. North and east are shown using purple lines in (b) and (a) respectively, whereas south and west are shown using light blue lines in (b) and (a) respectively. Panels (c) and (d) show the solar minimum (2005–2007) FPI winter average wind components at Longyearbyen for geomagnetically quiet conditions (0≤ Kp < 2−). Zonal (c) and meridional (d) average winds and the standard errors of the mean are plotted. North and east are shown using purple lines in (d) and (b) respectively, whereas south and west are shown using light blue lines (d) and (b) respectively.
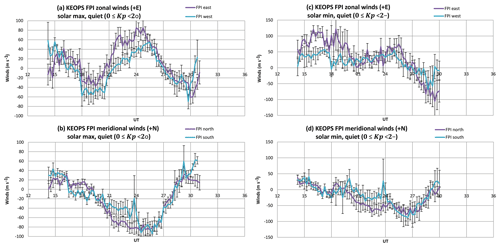
Figure 7Panels (a) and (b) show the solar maximum (2001–2003) FPI winter average wind components at KEOPS for geomagnetically quiet conditions (0≤ Kp < 2∘). Zonal (a) and meridional (b) average winds and the standard errors of the mean are plotted. North and east are shown using purple lines in (b) and (a) respectively, whereas south and west are shown using light blue lines in (b) and (a) respectively. Panels (c) and (d) show the solar minimum (2005–2007) FPI winter average wind components at KEOPS for geomagnetically quiet conditions (0≤ Kp < 2−). Zonal (a) and meridional (b) average winds and the standard errors of the mean are plotted. North and east are shown using purple lines in (d) and (b) respectively, whereas south and west are shown using light blue lines (d) and (b) respectively.
The periods of data cover the winter months of 2001–2003 and 2005–2007 to match with the CHAMP data sets. The FPIs cannot measure winds during cloudy periods owing to the scatter of light by clouds, and are only able to observe the emission during the hours of darkness. Thus, the observing days cannot be identical to the dates when CHAMP passed overhead of the two sites. Longyearbyen has 24 h of darkness during the months of November to January, so there are almost 24 h of observations, but the longest period of darkness at Kiruna is around 18 h in mid-winter. Meanwhile, CHAMP, is able to provide a full 24 h of observations from drag measurements.
There are consistent differences in the winds observed to the geographic east and west, or to the north and south. This is understandable because the Kiruna site is, on average, at the equatorward edge of the auroral oval, whereas Longyearbyen is mostly in the polar cap, although towards the poleward edge of the auroral oval. The expansion and contraction of the auroral oval during an active period means that the northern half of the FPI field of view can be very different from the southern half. In fact, Emmert et al. (2006) have shown that high-latitude neutral winds are better ordered in geomagnetic coordinates of magnetic latitude and magnetic local time than in geographic coordinates and universal time. The AACGM geomagnetic coordinates shown in Tables 1 and 2 give an indication of how different the magnetic latitudes for the east and west viewing directions are.
Figure 6 shows average zonal and meridional winds from FPI observations at Longyearbyen. Figure 6a and b show solar maximum years (2001–2003), whereas Fig. 6c and d show solar minimum years (2005–2007). Figure 6a and c show the zonal winds to the east and west using the convention of +East, while Fig. 6b and d show the meridional winds to the north and south, using +North. The average standard deviations σ are ±103 and ±64 ms−1 for the solar maximum zonal and meridional winds respectively.
Longyearbyen is just within the polar cap. The winds are predominantly anti-sunward despite the geomagnetic activity level, as this is the direction for both the pressure gradient and ionospheric convection. As a result, Longyearbyen observations are a somewhat less obvious indicator of ion-neutral coupling behaviour than observations at KEOPS in the 18:00–21:00 UT period. The Longyearbyen solar maximum (2001–2003) winter winds (DOY 300–65), during geomagnetically quiet conditions (0≤ Kp < 2−) are shown in Fig. 6a and b. The zonal winds (Fig. 6a) show westward winds before 18:00 UT and then eastward winds for ∼6 h that subsequently turn westward. The maximum wind speed is about 200 ms−1 eastward between 18:00 and 24:00 UT. The meridional winds (Fig. 6b) are slightly northward before 17:00 UT, then turn southward until 06:00 UT, before returning northward. The maximum speed is about 200 ms−1 southward at approximately 01:00 UT. The standard errors of the mean are around ±30 ms−1; however, the values vary systematically throughout the night. Between 18:00 and 21:00 UT the standard error is around 3 times larger than between 03:00 and 09:00 UT, when it is very small.
Figure 6c and d show the Longyearbyen FPI winds for clear nights during winter (DOY 300–65) for the period from 2005 to 2007 under geomagnetically quiet conditions (0≤ Kp < 2−). There is a full 24 h period of observations in this data set, and the extreme quiet of this solar minimum period provided a large number of observations for this category. The anti-sunward flow appears clearly. There is a strong phase lag between the observations to the north and south. This is puzzling because it cannot be explained in terms of ordering high-latitude winds in geomagnetic coordinates. This category is for the most geomagnetically quiet conditions possible: solar minimum during a prolonged solar minimum, and the lowest Kp values. Under these conditions the geographic coordinate system, under which the solar flux heating operates, should be the most appropriate. The average standard deviations are ±55 ms−1 and ±47 ms−1 for the zonal and meridional winds respectively. The standard errors of the mean are very small, averaging less than ±10 ms−1, although again there is a clear systematic UT-dependent trend. Between 21:00 and 03:00 UT the standard error of the meridional wind is about 2–3 times larger than at other times. Between 15:00 and 20:00 UT the zonal wind standard error becomes considerably larger. Figure 7 shows the KEOPS FPI winds for clear nights during winter (DOY 300–65) under geomagnetically quiet conditions. The general diurnal trends are similar for both solar maximum (Fig. 7a, b) and minimum (Fig. 7c, d). The solar minimum data range is 0≤ Kp < 2−; however, it was necessary to increase the geomagnetic activity spread for the solar maximum data to improve the statistics, so Fig. 7a and b show 0≤ Kp < 2∘. The meridional winds show anti-sunward flow that is predominantly driven by the pressure gradient from dayside EUV heating, resulting in fairly weak southward winds reaching a maximum value of nearly 100 ms−1. The standard errors of the mean are around ±10–15 ms−1. The zonal winds are eastward before 18:00 UT, reaching a maximum speed of a few 10 s ms−1. After 18:00 UT the zonal winds turn westward for a few hours before turning eastwards again at around 21:00 UT. Between 21:00 and 03:00 UT the zonal winds reach their maximum speed of up to 80 ms−1 before turning westward again. The zonal winds are more variable, and their standard errors of the mean are slightly larger than for the meridional winds, averaging 16 ms−1.
The few hours of westward flowing zonal winds between 18:00 and 21:00 UT are particularly interesting (Fig. 7a, c). The westward flow indicates that the winds are briefly under the influence of the clockwise dusk cell of ionospheric convection. Due to collisions between the ions and neutral gas, momentum is transferred to the neutrals, which diverts them from the direction of the pressure-gradient-driven anti-sunward/eastward flow. The action of the centrifugal force balancing the Coriolis force keeps the winds entrained in the cell (Fuller-Rowell and Rees, 1984). As the KEOPS site passes under the region of the Harang discontinuity (Harang, 1946), the FPI west zonal winds turn back to eastward about 40 min after the FPI east zonal winds. This is because the KEOPS FPI east observing volume is a horizontal distance of 480 km away from the FPI west volume (note that the distance between the viewing volumes depends on the altitude of the 630 nm emission). However, at the latitude of KEOPS, the time taken for the Earth to rotate through a distance of 480 km is 46 min. The difference between 40 and 46 min is partly due to the difference in magnetic latitude. It is also due to the Harang discontinuity being dependent on the IMF-By orientation, resulting in a smearing out of the MLT interval.
Figure 7c and d show the KEOPS FPI winds for clear nights for the years 2005–2007 during winter (DOY 300–65) under geomagnetically quiet conditions (0≤ Kp < 2−). These years were during the unusually extended solar minimum of the last solar cycle, when the solar flux levels were extremely low and observations of aurora were rare. Consequently, the plasma density was smaller, and the thermosphere was more compressed, resulting in smaller neutral densities at a given height. Under these conditions the ion drag driver is less efficient, and the pressure gradients, along with the Coriolis and centrifugal forces, play a larger role. Thus, although the trends are similar to the solar maximum winds, the zonal winds are strongly eastward throughout the evening sector. There are no westward zonal winds until after 03:00 UT, and generally the wind amplitudes are smaller. The maximum meridional wind is about 80 ms−1 southward around 03:00 UT. The maximum zonal winds are seen to the east, and these are around 100 ms−1 eastward in the evening sector and start to increase westwards towards 100 ms−1 by 06:00 UT. The average standard errors of the mean are around ±20 ms−1, which are larger than for solar maximum conditions.
The general trends seen in the northern winter geomagnetically quiet CHAMP zonal winds (Figs. 1, 2, 4, 5) are also seen in the FPI winds (Figs. 6, 7). The phases match well for both sites; however, there is a considerable difference in magnitude. The next two figures (Figs. 8, 9) show the direct comparisons of CHAMP and FPI winds along the cross-track direction for moderately active conditions (2 Kp < 4+). There is a lot of modelling effort that goes into studying the active ionosphere–thermosphere, which makes this comparison useful. In particular, it is relevant to the argument in Sect. 6.4 where CHAMP and FPI neutral winds are compared with typical ion velocities actively observed by ground-based radars at high latitudes.
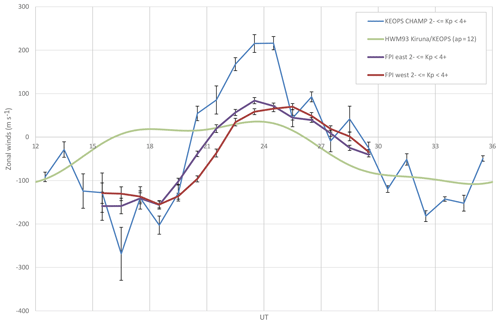
Figure 8Longyearbyen (Svalbard) winters 2001–2003, 2 Kp < 4+: average zonal winds measured using CHAMP and FPI, including standard errors of the mean. These are compared with FPI winds observed by the University of Alaska in 1980 and the HWM93 model winds.
Figure 8 is a direct comparison between CHAMP cross-track winds at Longyearbyen and several different sources. The winds represent moderately active conditions (2 Kp < 4+) during the winter months (DOY 300–65) for solar maximum years. The HMW93 model conditions are for the 31 December with ap = 12 (Kp = 3−), F10.7 = 150 and a height of 400 km (Hedin et al., 1996). At Longyearbyen the FPI can provide 24 h coverage owing to continual darkness between November and January. A direct comparison is made by projecting the components of the FPI and HMW93 (Hedin et al., 1996) wind vectors along the CHAMP ascending and descending cross-track directions using . CHAMP cross-track winds and UCL Longyearbyen FPI observations are averages for 2001–2003 (a failure occurred in the rotating mirror mechanism in late December 2003 so CHAMP 2004 data were not included). The data are then the averages of the ascending and descending components to give a zonal wind.
FPI wind values taken from Fig. 9 in Hedin et al. (1991) are also plotted. These values are measurements from the University of Alaska (U.Alaska) FPI that collected Longyearbyen data in 1980, 1981 and 1983. The aim is to demonstrate that the FPI technique of measuring Doppler shifts gives consistent results, which is discussed in Sect. 6.2. The U.Alaska FPI winds were an average of the east and west viewing directions, justified by the assumption of a uniform horizontal wind field over the field of view. This was a common practice at that time owing to (a) the assumption of a large molecular viscosity of the thermosphere which reduces wind shear, and (b) the longer exposure times of the earlier FPIs (6–12 min) which used photomultipliers with piezoelectric scanning of the FPI etalon gap size in order to view the full free spectral range (Deehr et al., 1980). The UCL FPIs were amongst the first FPIs to use fixed gap etalons to image the full FSR onto a 2-D array of pixels. This allowed for shorter exposure times, and a rapid cycle of viewing directions, which consequently revealed mesoscale spatial and temporal structures of the order of a few hundred kilometres horizontally and minutes respectively (e.g. Aruliah and Griffin, 2001; Aruliah et al., 2005). During the 1980s and 1990s we used state-of-the-art UCL-designed and -built imaging photon detectors (McWhirter et al., 1982). Astrocam Antares cameras replaced the IPD in the Svalbard FPI from 1998, and in the KEOPS 630 nm FPI in 2002. However, these cameras had the disadvantage of slow readout times which were essential for the best noise performance – therefore time resolution was compromised. In 2003 the first electron multiplying CCDs revolutionized low-light level imaging. These cameras combined a superior signal-to-noise ratio with very fast readout times. The first one was put into service at KEOPS in 2003, followed by Svalbard in 2005 (McWhirter, 2008). The huge advancement over the last 30 years in low-light detectors has allowed atmospheric gravity wave observations using exposure times of as little as 10 s at auroral latitudes (Ford et al., 2007). Note that the upgrade of the detector is to improve the photon sensitivity, which reduces the error of measurement. It does not change the calibration of the wind speeds.
Any changes of etalon required recalibration of the measured Doppler shift to calculate winds, as discussed in Sect. 6.2. The KEOPS FPI used a 10 mm etalon gap until January 2002, when it was replaced by an 18.5 mm gap etalon. Then in January 2003 a 14 mm etalon was installed, which is still utilized at present. For the Longyearbyen FPI, there was a 14 mm etalon until April 2005, which was replaced by an 18.5 mm etalon from September 2005 until the present time.
All sources show generally similar phases, with peak eastward winds in the evening sector, between 18:00 and 24:00 UT, and westward winds in the morning sector, between 06:00 and 12:00 UT, as expected for anti-sunward flows. Table 2 shows that the AACGM MLT for Longyearbyen is about 2.4 (±0.8 for the east and west volumes) hours ahead, so magnetic midnight is at approximately 21:36 UT. The standard errors of the mean are plotted for all data. The U.Alaska Longyearbyen FPI standard deviations are around ±150 ms−1, which are similar to the UCL FPI. For the purpose of comparison, a standard error of ±30 ms−1 is plotted for the U. Alaska FPI data, similar to the average UCL FPI standard error. In Hedin et al. (1991), it was noted that the average high-latitude winds from the FPIs at Sondrestrom, Longyearbyen and College in the Northern Hemisphere, and Mawson in the Southern Hemisphere, showed a systematically smaller diurnal variation than the DE 2 satellite data. The more recent measurements from CHAMP and the UCL FPI are typically distinctly different regarding magnitude, but consistent with respect to the trend noticed by Hedin et al.(1991). The diurnal amplitude of the UCL zonal winds is about 170 ms−1, whereas for the U. Alaska winds it is about 125 ms−1. The CHAMP zonal winds are the largest in magnitude, with a diurnal amplitude of around 300 ms−1.
The average of the monthly F10.7 fluxes is 184 for the winter periods from November to February of 1980–1981, 1981–1982 and 1983–1984, and 160 for the winters of 2001–2003. However, despite the higher average solar flux in 1980, the UCL FPI zonal wind magnitudes have a significantly larger amplitude than the U. Alaska zonal winds. Closer inspection of the three winter periods of 2001–2003 shows a spike in the average monthly F10.7 for November 2001–February 2002 (i.e. < F10.7 >is 214 for November 2001–February 2002, 145 for November 2002–February 2003 and 123 for November–December 2003) which may account for the three winter average UCL FPI winds being larger than for U. Alaska. The geomagnetic activity levels are similar, averaging Kp values in the range from 3− to 3∘ for all three winters. These are interannual and inter-solar cycle discussions for a later paper.
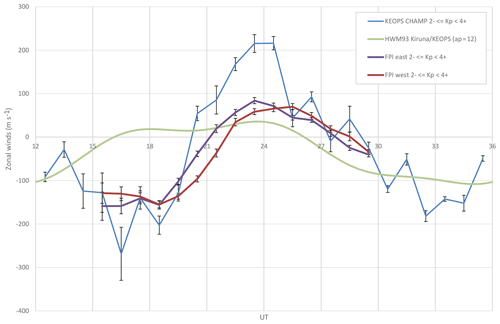
Figure 9Comparison of CHAMP and FPI measurements of KEOPS zonal average winds to the FPI east and west volumes, including standard errors of the mean, for the winters of 2001–2003. These are compared to the HWM93 model winds.
Figure 9 shows a comparison of the CHAMP zonal winds against the UCL FPI winds at Kiruna/KEOPS for the solar maximum winters of 2001–2003. The FPI and CHAMP data are selected for moderately active conditions (2 Kp < 4+), as in Fig. 8. At Kiruna the hours of darkness are between 15:00 and 06:00 UT for the period from November to January. The direct comparison is made by taking the component of the FPI and HMW93 (Hedin et al., 1996) wind vectors in the CHAMP cross-track direction using . The UCL FPI average zonal winds for 2 Kp < 4+ are shown separately for the east and west viewing directions. There is a smaller difference between these viewing directions than for the Longyearbyen zonal winds. The evening winds for moderately active solar maximum conditions are around −150 ms−1 (westward), and reach a peak of around 70 ms−1 (eastward) in the midnight sector. The AACGM MLT for Kiruna is about 1.9 (±0.3 for the east and west volumes) hours ahead, so magnetic midnight is at approximately 22.1 UT, which is the time separating the period of the evening eastward electrojet and the morning westward electrojet in magnetic local time coordinates. The behaviour of the zonal winds shows strong ion-neutral coupling for these moderately active conditions, so that there is a semidiurnal variation representative of the twin-cell ionospheric convection pattern at auroral latitudes. This is in addition to the day–night diurnal variation of winds driven by the pressure gradient.
The phase of the CHAMP zonal winds is in good agreement, but the amplitude is considerably larger. The peak evening wind reaches −200 ms−1 (westward) and 200 ms−1 (eastward) by 02:00 UT. What is particularly interesting about this comparison is the difference between the CHAMP and FPI winds in the period from 15:00 to 20:00 UT. The CHAMP winds are considerably less westward, and are more similar to FPI average zonal winds for geomagnetically quieter conditions at solar maximum, as shown in Fig. 7a. The large standard error of the mean during the 15:00–20:00 UT period shows how sensitive the winds are to ion drag within the dusk cell.
Figure 10a shows the histogram of the frequency distribution of the ratios of CHAMP/FPI 1 h averaged cross-track zonal wind magnitudes from Figs. 7 and 8. Figure 10b shows the UT dependence. The Longyearbyen ratios cluster in the range from 1.0 to 2.5, whereas the Kiruna ratios are far more widely spread. Overall there is a general trend for the satellite wind magnitudes to be larger by a factor of 1.5–2.0, with median values of 1.7 for Longyearbyen (24 h coverage) and 1.3 for Kiruna (15:30–05:30 UT coverage). There does not seem to be any clear pattern when the UT-dependent frequencies of the ratios are plotted in Fig. 10b, except for a tendency for the more extreme ratios to occur during the midnight period, when the 630 nm emission is weakest, and the FPI winds have the largest error bars. Even if the midnight measurements are excluded, there is a wide range of values generally greater than 1.0.
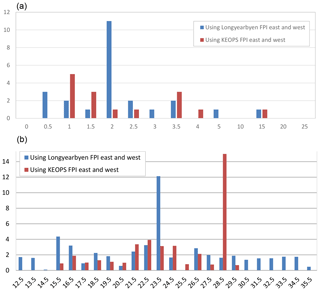
Figure 10Frequency distribution of the ratios of CHAMP/FPI 1 h averaged zonal wind magnitudes observed in the winter period for solar max under moderately active conditions ( Kp < 4+) for Longyearbyen (blue) and KEOPS (red). Panel (a) shows the frequency distribution of the CHAMP/FPI ratios. Panel (b) shows the UT dependence of the ratios.
We have shown that there is a similar phase, but a considerable difference between the average zonal wind magnitudes measured by the CHAMP satellite and the ground-based FPIs for a polar cap and auroral site during northern winter months. Our premise is that the large molecular viscosity of the upper thermosphere should minimize any vertical structure in the winds above and altitude of around 250 km. The difference in wind magnitudes could have various explanations. It could be that (a) we are mistaken about the vertical structure of winds, (b) that there is a problem with the scaling of the two methods of measurement or (c) the measurement procedures introduce differences, e.g. in situ versus remote integration or the comparison of different spatial and/or temporal resolutions. There may be other unexpected reasons for the mainly amplitude-related differences in the measurements.
With respect to hypothesis (a), the CHAMP satellite average cross-track winds are of a similar magnitude to the original GOCE satellite winds (Liu et al., 2016; Visser et al., 2019) and to the UCL CMAT2 model simulations. However, while the CHAMP satellite altitude was between 350 and 400 km, the GOCE satellite had an unusually low altitude of around 250 km, which was close to the FPI 630 nm emission peak altitude. The CMAT2 winds are typical of values from other GCMs, which were largely calibrated against measurements by satellites in the 1970s and 1980s, in particular the DE-2 satellites. Killeen et al. (1984) found a good agreement between the FPI at Longyearbyen (then called the University of Ulster FPI, and subsequently the University of Alaska FPI) for observations in December 1981. However, Hedin et al. (1991) later found that the satellite wind measurements were larger on average. The DE-2 satellite measurements were made using the Wind and Temperature Spectrometer (WATS), rather than derived from satellite drag measurements. The DE-2 satellite flew from August 1981 to February 1983, which means that the average monthly F10.7 flux included some of the highest solar flux values of the last 30 years. This may account for the fact that physical and empirical GCMs calibrated from that period have such large wind values. In contrast, the 2 decades since 2000 have recorded the most sustained and low F10.7 flux levels since the satellite era began. However, it is also possible that the fact that two different methods of satellite measurements gave winds systematically larger than ground-based FPI measurements might support the existence of a vertical structure in the upper thermosphere.
With respect to hypothesis(b), the satellite drag community are already aware of a scaling issue. Defining the drag coefficient is the largest source of error. Bruinsma et al. (2014) had to multiply GOCE densities by a factor of 1.29 to match the real-time High Accuracy Satellite Drag Model (HASDM; Storz et al., 2005). HASDM uses data assimilation from the orbits of 75–85 inactive payloads and debris over an altitude of 200–900 km that are tracked by the Space Surveillance Network (SSN) and is considered a benchmark by that community. Recently, March et al. (2019) reanalysed thermospheric densities derived from very precise satellite accelerometers and GPS acceleration using high-fidelity satellite geometries. The densities for all the spacecraft surveyed were greater than those derived using surfaces defined by flat panels, and were more consistent with each other. The CHAMP and GOCE densities were found to be 11 % and 9 % larger. Although there is no simple link between densities and winds, this rescaling of densities gives an indication that it may be necessary to scale winds down for the same measured acceleration (see Sect. 6.3 and Eq. 5).
With respect to hypothesis (c), the assumptions of the FPI and CHAMP measurement techniques are discussed in Sect. 6.1–6.3.
6.1 Considering the molecular viscosity of the upper thermosphere
Let us first consider hypothesis (a): that the CHAMP and ground-based FPI average zonal measurements are both correct, and that the factor of 1.5–2.0 difference in wind magnitudes is due to the 100-150 km difference in the altitude of the measurements. Conventional fluid dynamics theory predicts that the molecular viscosity is very high in the upper thermosphere owing to the very low particle densities at these altitudes. The viscosity of a fluid determines how resistant it is to shear forces that cause adjacent layers to move at different speeds. Turbulent viscosity dominates the atmosphere below about 100 km, but molecular viscosity dominates the upper atmosphere. The molecular viscosity of the upper thermosphere is very large, and in the CMAT2 model the molecular viscosity η, is given by Eq. (2) (Harris, 2001; Hood, 2018), which is the SI version based on Dalgarno and Smith (1962) where it is given in units of micropoise.
As a consequence of large viscosity, there is little shear between the different altitude layers above ∼200 km for both winds and neutral temperatures (hence the name thermosphere representing an isothermal behaviour). The issue raised in this paper is that the difference between CHAMP and FPI wind magnitudes is too large to be consistent with the assumption of large viscosity over this range of altitudes.
Figure 11 shows two versions of the CMAT2 zonally averaged zonal winds for 00:00 UT for the December solstice 2008 (solar minimum conditions) from Hood (2019). These are latitude–height plots, where the height is from 15 to 300 km. From about 250 km the contour lines become near vertical because the large molecular viscosity of the upper thermosphere minimizes the shear in the winds. Figure 11a is the standard run using standard values of molecular viscosity. Figure 11b shows the contours for a simulation where the molecular viscosity has been reduced by a factor of 100. The variation of the molecular viscosity with respect to temperature (and consequently height for our purposes) has been tested theoretically and experimentally by Dalgarno and Smith (1962), and the factor of 100 is an unrealistic extreme used to test the model. The consequence is that the height at which contours become vertical is raised to closer to 280 km. This is a small difference and certainly does not account for the apparent vertical gradient indicated by the difference between the CHAMP and FPI zonal winds.
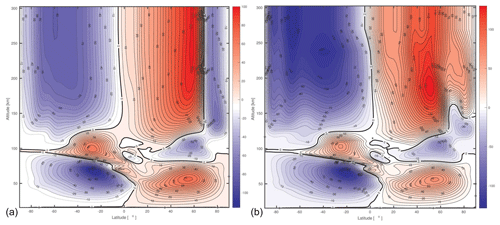
Figure 11CMAT2 zonally averaged zonal winds for 00:00 UT at the December solstice 2008 (solar minimum conditions) to demonstrate the effect of drastically reducing the molecular viscosity in order to raise the altitude where winds become independent of altitude. Panel (a) shows isobars for a standard simulation, whereas panel (b) represents a simulation where the molecular viscosity is 100 times smaller (from Hood, 2018).
To end this section on the molecular viscosity of the upper thermosphere, two papers are referenced that report observations and suggest other possible mechanisms to support winds varying with height. Recently Vadas and Crowley (2017) published results from observations of 10 travelling ionospheric disturbances at an altitude of ∼283 km, observed in 2007 with the TIDDBIT ionospheric sounder near Wallops Island, USA. They used ray tracing on the TIDs and simultaneously measured a peak in the neutral wind at an altitude of ∼325 km using a sounding rocket. They found a serious discrepancy between where the gravity waves were predicted to dump energy using conventional dissipative theory, and the observations from TIDDBIT and the rocket. Conventional theory predicted that all the gravity waves should have dispersed at a scale height below the rocket measurement. Consequently, they have challenged convention and proposed that the molecular viscosity should not increase as rapidly with altitude above 220 km. This may account for some of the differences between the CHAMP and FPI zonal winds, but will need to be tested in future modelling studies.
The second paper by Song et al. (2009) states that the fastest acceleration of the neutrals occurs near 350 km in the F layer, where the effective neutral-ion collision frequency maximizes (see their Figs. 6 and 7). Considering the dynamic character of frequent changes of the IMF and the magnetospheric convection, the stronger accelerations at F2 layer heights could result in temporary vertical neutral wind gradients. However, the 1-D model approach neglects forces due to neutral pressure and effective molecular viscosity in the 3-D continuum of the upper thermosphere. To correctly describe the long-range coupling on timescales from longer than few seconds to less than 30 min, the inductive effect (Faraday's law) as well as the dynamic effect of the neutrals (in particular acceleration terms) need to be considered (Song and Vasyliunas, 2013).
6.2 FPI Doppler shift to wind speed procedure
Hypothesis (b) is that the FPI and/or CHAMP observations may need to be rescaled. To start with the FPIs, we will look at the calculation of the Doppler shift and then at the height-integration procedure of a ground-based FPI.
The calculation of the wind speed requires few assumptions, although the process of fitting the FPI fringes is more complicated (e.g. Makela et al., 2011). The wind speed u is determined from the Doppler shift of the wavelength Δλ of the moving volume of gas which emits at wavelength λ, where the free-space wavelength is λo and the speed of light c (Eq. 3).
The speed of the volume of gas u is given by Eq. (4), which is proportional to the ratio of the Doppler shift in fringe peak position (in bins) Δx; and the free spectral range (FSR), ΔxFSR. The FSR is the equivalent wavelength shift to reposition a fringe from overlapping one order of the baseline wavelength λo, to the next order. The other terms in Eq. (4) are the refractive index μ of the medium between the etalon plates and the separation of the plates, d (Hecht and Zajak, 1980).
The etalon gap is evacuated so μ=1, and the other parameters are known. Thus, for example, for an etalon gap of d=10 mm, emission λo=630 nm and free spectral range ΔxFSR=150 bins, a Doppler shift of 1 bin (Δx=1 bin) would represent a wind of 63 ms−1.
All the parameters for the scaling of the FPI winds in this equation are known. There is the issue of determining the zero Doppler shift baseline because there is no laboratory source of the excited atomic oxygen. However, the method used to determine the baseline (i.e. using a helium–neon source with the assumption that the vertical component of the wind is negligible) introduces an average systematic offset error of 10–20 ms−1 at most, which is small compared with horizontal wind magnitudes (Aruliah and Rees, 1995).
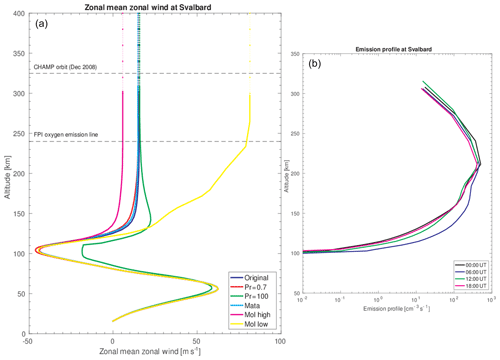
Figure 12(a) Height profile of CMAT2 zonal winds at Svalbard. (b) Height profile of the red line emission intensity profile from the Vlasov et al. (2005) model.
Figure 12 illustrates how ground-based FPIs make measurements of the neutral winds at an altitude of 240 km. Figure 12a shows a height profile of the CMAT2 zonal mean zonal winds at the latitude of Longyearbyen. There are six simulations to demonstrate the effect on the height profile of the zonal mean zonal winds when changing the viscosity. CMAT2 uses a viscosity term that is the weighted mean divided by the scale height of two coefficients of viscosity: the molecular viscosity μm; and the turbulent viscosity μt. The simulations represent a comparison with the original molecular viscosity (dark blue). The other lines are for low (yellow – divided by 100) and high molecular viscosities (pink – doubled). The low and high turbulent viscosities are represented by the Prandtl numbers 0.7 (red) and 100 (green), where 2 is the default value used in CMAT2. The Prandtl number is related to the height at which gravity waves deposit momentum (Liu et al., 2013) and so may have relevance for the Vadas and Crowley experiment (2017). The light blue line labelled “Mata” is an intermediate profile. As can be seen, the molecular viscosity dominates in the thermosphere above 100 km and at the altitudes where the FPI is measuring. The dark blue and yellow lines are representative of a vertical slice of Fig. 11a and b respectively for the latitude of Longyearbyen.
Figure 12b is a CMAT2 height profile of the 630 nm (red) line emission intensity based on the Vlasov et al. (2005) model at 00:00, 06:00, 12:00 and 18:00 UT. The red line emission at night is dominated by dissociative recombination of molecular oxygen ( e − > O* + O). The altitude distribution of the 630 nm emission has a peak emission altitude of between 220 and 250 km. However, the emission profile also has a full width at half maximum intensity of around 50–70 km, i.e. sampling altitudes tens of kilometres below and above the emission peak. The ground-based FPI observes a height-integration of the emission along the line-of-sight. Therefore, the measured Doppler shift is an integration of the Doppler shifts at all altitudes, weighted by the emission profile. However, there are several reasons to justify why we are confident that the FPI provides a good sample of the winds at an altitude of ∼240 km. The excited atomic oxygen state in the O (1D−3P) transition is a forbidden transition with a long lifetime of ∼110 s (Rees, 1989), which allows the excited atoms to thermalize before emission and to be representative of the surrounding gas. Below 200 km the molecular composition increases significantly, and the long lifetime means that the 630 nm emission is quenched due to molecular collisions with N2 and O2. Consequently, we can assume that there is minimal contribution of Doppler shifts from below an altitude of 200 km, which is a region where the neutral wind magnitude has a large height dependence (note that the emission intensity x axis is a log scale; furthermore, the horizontal winds at an altitude of 100 km are a few tens of metres per second, whereas they are a few hundreds of metres per second at an altitude of 250 km). Above the altitude of the emission peak the flux falls off rapidly with altitude, and also with distance from the FPI, which minimizes the contribution of winds from the region above. In addition, above 250 km the wind magnitudes begin to reach an asymptote. Therefore, it would be expected that the satellites and ground-based FPIs should see very similar speeds and phases. With respect to the FPI-measured winds, the contribution of winds below the peak emission height may result in a small underestimate of the winds at an altitude of ∼240 km, which is investigated later in this section by modelling.
The tristatic FPI experiments by Aruliah et al. (2005) and bistatic experiments by Anderson et al. (2012) indicated that the winds, neutral temperatures and 630 nm intensities were closely matched if the geometry assumed an emission altitude of around 240 km. However, during auroral activity, when there is E-region precipitation, the red line emission altitude can be lower, perhaps as low as 200 km. This means that the FPI samples lower altitudes. Recently Gillies et al. (2017) used all-sky imagers to triangulate the peak emission height of the 630 nm emission. They found that discrete auroral arcs showed a characteristic height of 200 km. The effect of particle precipitation in lowering the emission height was earlier noted by Sica et al. (1986). They illustrated how decreased thermospheric temperatures measured by a Fabry–Perot spectrometer at College, Alaska, were consistent with lower MSIS temperatures (Hedin et al., 1977) when weighted by a modelled emission height profile. However, aurorae are limited to high latitudes and occur infrequently as illustrated in Fig. 13, which shows the frequency distributions of Kp values for the years (Fig. 13a) 2001–2003 representing solar maximum and (Fig. 13b) 2000–2009, i.e., for most of the period of the CHAMP lifetime. Aurora generally occur during active periods when Kp > 4–5. Thus, emission heights of 200 km are the exception rather than the rule, and only minimally affect the average.
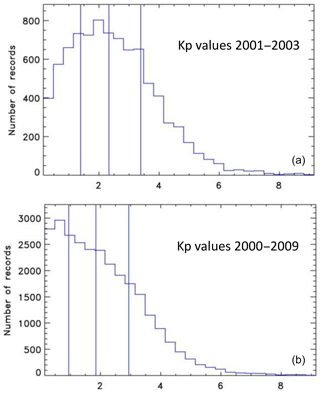
Figure 13Frequency distribution of Kp values. (a) From 2001 to 2003 representing solar maximum. (b) From 2000 to 2009 covering most of the period of the CHAMP lifetime.
In order to assess the degree to which the FPI height integration method underestimates winds, CMAT2 winds at 240 km are compared to a column-integrated average of CMAT2 winds weighted by the emission intensity profile. Here the Vlasov et al. (2005) model is applied with constants provided by Yiu (2014), and with CMAT2 winds interpolated to 10 km intervals for the integration. Figure 14 compares the CMAT2 zonally averaged zonal winds at three heights – 180 (blue), 200 (green) and 240 km (black) – with height-integrated winds (red) for a quiet day run on 1 December 2007 (Fig. 14a, b) and an active day run on the 20 March 2015 (Fig. 14c, d) for both Longyearbyen (Fig. 14a, c) and Kiruna (Fig. 14b, d). Figure 15 outlines the CMAT2 model global view of the unweighted and weighted winds at 240 km for 00:00, 06:00, 12:00 and 18:00 UT.
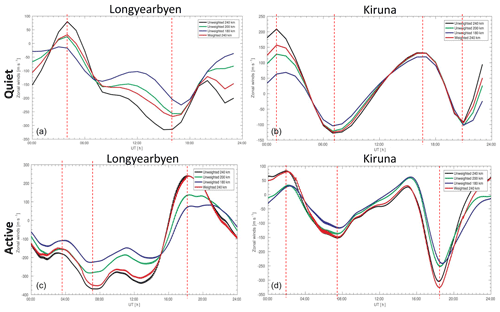
Figure 14(a, b) CMAT2 zonally averaged zonal winds for a quiet day on 1 December 2007 at Longyearbyen (a, c) and Kiruna (b, d) for winds at 180, 200 and 240 km for comparison with the height-integrated winds weighted using an emission intensity profile from the Vlasov et al. (2005) model. (c, d) The same for active conditions on 20 March 2015.
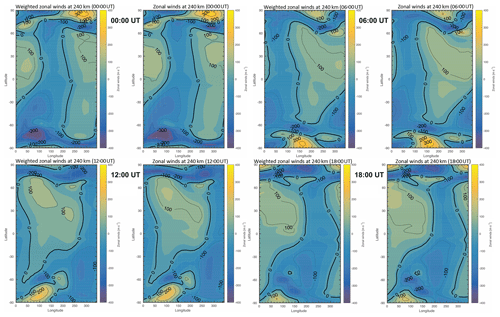
Figure 15CMAT2 global zonal winds for a quiet day on 1 December 2007 for the winds at 240 km and the height-integrated winds weighted using an emission profile from Vlasov et al. (2005) model. The top row shows 00:00 UT (the two left panels) and 06:00 UT (the two right panels); the bottom shows 12:00 UT (the two left panels) and 18:00 UT (the two right panels).
Figure 14 indicates that there are some significant differences between zonally averaged zonal winds with or without height integration. The lower the altitude, the smaller the wind magnitude. There is also a slight change in phase (to aid the eye these are indicated by vertical dashed lines placed at turning points for the weighted winds). This is due to the increased collision frequency at lower altitudes owing to greater density, and the consequent shift in balance between pressure gradient and ion drag. When we look at the averaged diurnal variation of the CHAMP and FPI winds, their phases are almost exactly the same. This would not be the case if the FPI was observing winds dominated by Doppler shifts at an altitude of 190 km, where the phase would be significantly different because the pressure gradient increases its dominance at lower altitudes. Comparing the CMAT2 December 2007 model zonally averaged zonal winds at 240 km with the height-integrated winds, the most significant difference is for Longyearbyen during quiet conditions, which on calculating overall mean values produces a 19 % difference; during active conditions, this decreases to a difference of 12 %. The reverse seems to be the case for Kiruna, as the mean percentage difference increases from 3 % to 14 % between the quiet and active days respectively. Note that the wind speed scales are different for each panel. For each time series there is no simple systematic trend. Figure 15 demonstrates these dissimilarities on a global scale; here, the zonal winds appear to be slightly more westward, as the eastward winds are diminished and the westward winds enhanced. However, this is not the case for all times of day shown here, and does not visibly affect the wind distributions to any large extent.
6.3 CHAMP cross-track wind procedure
Satellites have provided global coverage of accelerometer measurements since 2001, particularly the CHAMP satellite (e.g. Schlegel et al., 2005) and GRACE satellites (e.g. Tapley et al., 2004). These measurements of satellite drag have been converted to measurements of thermospheric mass density (e.g. Liu et al., 2005) and cross-track thermospheric wind measurements (e.g. Sutton et al, 2007; Liu et al., 2006; Förster et al., 2008). Thermospheric mass density was primarily estimated using Eq. (5) where a is the satellite acceleration; ρ is the neutral mass density of the air; Cd refers to a dimensionless drag coefficient, using a constant frontal area Aref of the satellite with mass m and total velocity V relative to the atmosphere in the ram direction given by the unit vector . This equation has been used for a first simple cross-track wind estimation, where the area and wind component were replaced by the horizontal side view and neutral wind direction perpendicular to the bulk flow respectively.
For the first analysis, Liu et al. (2005) explained that they used a fixed drag coefficient value of Cd=2.2. This is a de facto standard value that has been used for compact satellite orbit computations since the 1960s (e.g. Cook, 1965). This value was adopted by Jacchia when constructing his thermosphere density model, based on physical drag modelling of spherical satellites (Jacchia and Slowey, 1972). The drag coefficient is acknowledged to be very difficult to quantify, as is discussed extensively by, for example, Moe et al. (1995). The importance of the value of Cd is acknowledged by Liu et al. (2006) and others who use the data, as it affects the scaling of the density and wind calculations. However, their interest was in the relative density and wind structures, rather than absolute values.
Since then the analysis has been refined considerably by taking lift, sideways and drag forces on the satellite into account, resulting in smaller wind magnitudes as described by Doornbos et al. (2010). The GOCE satellite winds are closer in magnitude to ground-based FPI measurements (Dhadly et al., 2017), although still systematically larger in magnitude, where the difference has been found to increase with latitude. The systematic residual line-of-sight GOCE wind varied between 20 ms−1 at 50∘ MLAT (magnetic latitude) and a maximum of 150 ms−1 at 85∘ MLAT (see Fig. 2 from Dhadly et al., 2018).
Another consideration is that CHAMP measures the cross-track wind component (Figs. 1, 2, 3, 4) which deviates from the pure zonal direction as measured by the FPIs (Figs. 6, 7). The geometry can be critical, in particular for the high-latitude Longyearbyen FPI, because the cross-track deviates from the zonal direction by about 13.3∘ in each respective direction for the ascending and descending orbits. The meridional wind component at these high latitudes is much larger than the zonal component, so that the larger CHAMP measurements at this FPI could also (at least partially) be due to an “admixture” of the meridional wind component and the zonal wind. This has been discussed in Sect. 5.1 to account for the difference between the average zonal winds measured during the ascending and descending orbits. To deal with this the UCL FPI zonal winds observed to the east and west are projected onto the CHAMP ascending and descending cross-track directions, and then averaged into 1 h bins, thus replicating the CHAMP zonal wind averages (see Figs. 7 and 8). Despite this recalculation, there is a wide range of values of the CHAMP/FPI ratios (see Fig. 10); this reinforces the message that the satellite aerodynamic coefficients are difficult to determine absolutely, which is in addition to some systematic factors between the CHAMP and FPI measurements. This difficulty is well known in the satellite engineering community, but perhaps less so in the aeronomy community.
6.4 Comparison with EISCAT radar ion velocities
Finally, a very important consideration is how the average winds compare with ion velocities. At high latitudes the ion velocities are generally larger than the neutral winds owing to the E×B drift driven by the magnetospheric electric field. Davies et al. (1995) provided a statistical analysis of E- and F-region ion velocities observed on 20 March 1996 in order to compare measurements by the European incoherent scatter (EISCAT) radars and the co-operative UK twin-located auroral sounding system (CUTLASS) coherent scatter radar. The scatter plot of ion velocities from this study (their Fig. 5) indicated a cluster of values in the range of a few hundred metres per second, with only a small fraction of measurements greater than 500 ms−1.
Fiori et al. (2016) compared ion velocities measured by the electric field instrument on Swarm with the CS10 statistical ionospheric convection model by Cousins and Shepherd (2010) which is based on 8 years of data (1998–2005) collected by 16 Super Dual Auroral Radar Network (SuperDARN) coherent scatter radars. The climatology represented by the CS10 model in Fig. 3a in Fiori et al. (2016) indicates speeds of the order of few hundreds of metres per second, whereas the instantaneous values along the Swarm satellite pass (their Fig. 3d) show much stronger drift peak values on the resolution level of seconds or shorter. Even after allowing for offsets, their 1 s resolution corrected cross-track ion drifts achieve horizontal velocities well over 1000 ms−1, which probably indicates the highly dynamic behaviour in the auroral regions compared with quasi-stable conditions used for empirical models. However, Koustov et al. (2019) recently compared the Swarm cross-track ion drifts with the SuperDARN radar network and found that the Swarm ion velocities are a factor of 1.5 larger. They suggest reasons for the disparity, including refining the calibration of Swarm and the differences in spatial/temporal resolution.
Aruliah et al. (1996) presented the seasonal and solar cycle variation of hourly averaged ion velocities from 300 d of EISCAT Tromsø UHF radar measurements between 1984 and 1990. The tristatic EISCAT radar observations for an altitude of 275 km were collected from Common Programmes 1, 2 and 3, at time resolutions of 2–3 h, with full 24 h coverage. The hourly averaged ion velocities for the December solstice periods were up to 100–200 ms−1, and the largest average ion velocities were around 300 ms−1 during the March equinox period at solar maximum. Aruliah et al. (2005) later reported observations of a common volume using a configuration of tristatic FPI observations of the thermospheric winds and temperatures co-located with tristatic EISCAT radar measurements of ionospheric parameters at an altitude of 250 km. The observations showed that the neutral winds were around 50 % of the magnitude of the ion velocities on average when averaged over 15 min.
Griffin et al. (2004) determined seasonal and solar cycle climatologies of meridional winds at Kiruna using FPI Doppler shifts, and derived from field-aligned ion velocities (Salah and Holt, 1974), which were compared with physical (CTIM, Fuller-Rowell et al., 1988) and empirical models (HWM, Hedin et al., 1988; MWM, Miller et al., 1997). The climatologies all showed meridional winds up to ∼250 ms−1. Although this method does not give the zonal wind magnitude, it gives some indication of typical magnitudes owing to the diurnal variation of winds seen by a single site as the Earth rotates.
Förster et al. (2008) presented a statistical comparison of observed averaged neutral wind velocities within the polar cap (magnetic latitudes > 80∘) for the year 2003 showing the dependence on the IMF orientation based on statistical analyses of CHAMP accelerometer data with average ion drift estimates for the same time interval and IMF conditions based on EDI cluster measurements. These comparisons were carried out for both the Northern Hemisphere and the Southern Hemisphere (separately) and are shown in their Tables 1 and 2 respectively. Depending on the IMF clock angle orientation, the ratio between average neutral wind magnitudes and average ion drift speeds varies between about 60 % and 100 %. Interestingly, there is a characteristic interhemispheric difference with respect to the IMF orientation and slightly larger ion drift velocities on average in the Northern Hemisphere (cf. Förster and Cnossen, 2013; Förster et al., 2017), but the overall average amounts to a ratio of about 0.90 to 0.95 within the polar cap region > 80∘ magnetic only. The FPI in Longyearbyen at 75.4∘ N (see Table 2) comes closest to this region. Ion drag is the dominating forcing term here for the neutral gas, while near the auroral oval, where the KEOPS FPI station in Kiruna at 65.1∘ N is located, the balance between the different forces, in particular pressure gradient terms, Coriolis and centrifugal forces, and ion drag, play a role. There the ratio between the average neutral wind and ion drag magnitudes is certainly smaller, corresponding to the EISCAT observations cited above.
A comparison is presented here of thermospheric zonal winds during winter months between 2001 and 2007 measured by the CHAMP satellite in the altitude region between 350 and 400 km, and by ground-based FPIs, at Kiruna and Longyearbyen, measured at an altitude of about 240 km. The satellite accelerometer measurements of drag are used to derive cross-track winds, whereas the FPIs use the Doppler shift of the 630 nm emission. The satellite measurements are collected for a region within 2∘ latitude of the FPI sites, which is within the field of view of the FPI east and west viewing directions. The phases of the winds agree very well, but the CHAMP average zonal winds are a factor 1.5–2.0 larger than the FPI average zonal winds. The factor is not simple. In particular, there is a difference in the factor for the auroral site and the polar cap site; thus, it appears that the factor is dependent on location, possibly latitude. The factor also appears to have an irregular time dependence.
The UCL Longyearbyen FPI winds are consistent with FPI measurements made 20 years prior by the University of Alaska using a different FPI and detector (photometer in 1980, EMCCD in 2001). Earlier studies of average ion velocities from the EISCAT Tromsø UHF radar compared with the UCL FPI at KEOPS indicate that the average ion velocities in the auroral zone are about twice the average neutral wind speeds (Aruliah et al., 1996, 2005). However, the CHAMP average zonal winds at KEOPS presented here have magnitudes similar to the average ion velocities of the December solstice values presented by Aruliah et al. (1996). This is probably the key argument indicating that the CHAMP magnitudes are too large. It is important to determine the absolute wind values correctly as the difference between the ion flow and neutral wind vectors determine the acceleration of the neutral gas, and the amount of Joule heating of the thermosphere.
Satellites play a crucial role in upper atmosphere research by filling in the extensive gaps between ground-based observations. But for satellite drag measurements, we note that satellite aerodynamic coefficients are difficult to determine absolutely. Satellites provide 3-D coverage at high spatial resolution, in addition to high temporal resolution. Meanwhile, ground-based instruments are sparse, land-based, and not always operational on a 24∕7 basis owing to operational costs (e.g. incoherent scatter radars) or observation constraints (e.g. only night-time and clear-sky observations for optical instruments). Having uncovered this discrepancy between ground-based FPI optical measurements and satellite drag measurements of winter winds, it is imperative to determine if it is a real altitude dependence, or if some rescaling of winds is necessary for winds determined from either, or both, FPI height-integrated Doppler shifts or satellite drag measurements. Both possibilities will affect our current modelling of the upper atmosphere. We may also need to rethink the procedure of comparing different spatial and temporal resolutions of in situ satellite versus remote ground-based FPI measurements at high latitudes.
The CHAMP accelerometer neutral wind observations used in this study are available at https://doi.org/10.5880/GFZ.1.1.2019.001 (Förster and Doornbos, 2019).
This paper is the result of many years of collaboration between AA and MF after noticing the significant difference between FPI and CHAMP winds. AA provided the FPI data, and MF provided the CHAMP data. RH provided the model simulations, IM provided technical support for the FPIs and ED provided expertise on converting accelerometer data to winds.
The authors declare that they have no conflict of interest.
We thank the staff at the Kjell Henriksen Observatory and ESRANGE for hosting the FPIs as well as their generous on-site assistance. Support for the FPI operations has come from the European Office of Aerospace Research and Development (grant no FA9550-17-1-0019). There has been NERC support of ALA (grant nos. NE/P001556/1 and NE/N004051/1). The CHAMP mission is sponsored by the Space Agency of the German Aerospace Center (DLR) via funds from the Federal Ministry of Economics and Technology, following a decision by the German Federal Parliament (grant no. 50EE0944). The data retrieval and operation of the CHAMP satellite by the German Space Operations Center (GSOC) of the DLR is acknowledged. EISCAT is an international association supported by research organizations in China (CRIRP), Finland (SA), France (CNRS, until the end of 2006), Germany (DFG), Japan (NIPR and STEL), Norway (NFR), Sweden (VR) and the United Kingdom (STFC). We also acknowledge support from the International Space Science Institute with respect to sponsoring meetings of the international team no. 308 on 'M-I-T Coupling: Differences and similarities between the two hemispheres', which helped this collaboration (http://www.issibern.ch/teams/twohemispheres/, last access: 29 November 2019).
This research has been supported by the Space Agency of the German Aerospace Center (DLR) (grant no. 50EE0944), the NERC (grant nos. NE/P001556/1 and NE/N004051/1), and the European Office of Aerospace Research and Development (grant no. FA9550-17-1-0019).
This paper was edited by Christoph Jacobi and reviewed by two anonymous referees.
Anderson, C., Conde, M., and McHarg, M. G.: Neutral thermospheric dynamics observed with two scanning Doppler imagers: 1. Monostatic and bistatic winds, J. Geophys. Res., 117, A03304, https://doi.org/10.1029/2011JA017041, 2012.
Aruliah, A. L. and Griffin, E.: Evidence of meso-scale structure in the high-latitude thermosphere, Ann. Geophys., 19, 37–46, https://doi.org/10.5194/angeo-19-37-2001, 2001.
Aruliah, A. L. and Rees, D.: The Trouble with Thermospheric Vertical Winds: Geomagnetic, Seasonal and Solar Cycle Dependence at High Latitudes, J. Atmos.-Terr. Phys., 57, 597–609, 1995.
Aruliah A. L., Farmer, A. D., Rees, D., and Brändström, U.: The Seasonal Behaviour of High-Latitude Thermospheric Winds and Ion Velocities Observed Over One Solar Cycle, J. Geophys. Res., 101, 15701–15711, 1996.
Aruliah, A. L., Griffin, E. M., Aylward, A. D., Ford, E. A. K., Kosch, M. J., Davis, C. J., Howells, V. S. C., Pryse, S. E., Middleton, H. R., and Jussila, J.: First direct evidence of meso-scale variability on ion-neutral dynamics using co-located tristatic FPIs and EISCAT radar in Northern Scandinavia, Ann. Geophys., 23, 147–162, https://doi.org/10.5194/angeo-23-147-2005, 2005.
Bauer, S. J.: Physics and chemistry in space, Vol. 6, Physics of planetary ionospheres, Springer-Verlag, 17 pp., 1973.
Bruinsma, S. L., Doornbos, E., and Bowman, B. R.: Validation of GOCE densities and evaluation of thermosphere models, Adv. Space Res., 54, 576–585, https://doi.org/10.1016/j.asr.2014.04.008, 2014.
Cook, G. E.: Satellite drag coefficients, Planet. Space Sci., 13, 929–945, 1965.
Cousins, E. D. P. and Shepherd, S. G.: A dynamical model of high-latitude convection derived from SuperDARN plasma drift measurements, J. Geophys. Res., 115, A12329, https://doi.org/10.1029/2010JA016017, 2010.
Dalgarno, A. and Smith, F. J.: The thermal conductivity and viscosity of atomic oxygen, Planet. Spac. Sci., 9, 1–2, 1962.
Davies, J. A., Lester, M., Milan, S. E., and Yeoman, T. K.: A comparison of velocity measurements from the CUTLASS Finland radar and the EISCAT UHF system, Ann. Geophys., 17, 892–902, https://doi.org/10.1007/s00585-999-0892-9, 1999.
Deehr, C. S., Sivjee, G. G., Egeland, A., Henriksen, K., Sandholt, P. E., Smith, R., Sweeney, P., Duncan, C., and Gilmer, J.: Ground-based observations of F region aurora associated with the magnetospheric cusp, J. Geophys. Res., 85, 2185–2192, https://doi.org/10.1029/JA085iA05p02185, 1980.
Dhadly, M., Emmert, J., Drob, D., Conde, M., Doornbos, E., Shepherd, G., Makela, J., Wu, Q., Niciejewski, R., and Ridley, A.: Seasonal dependence of northern high-latitude upper thermospheric winds: A quiet time climatological study based on ground-based and space-based measurements, J. Geophys. Res.-Space, 122, 2619–2644, https://doi.org/10.1002/2016JA023688, 2017.
Dhadly, M., Emmert, J., Drob, D., Conde, M., Shepherd, G., Makela, J., Wu, Q., Niciejewski, R., and Ridley, A.: Seasonal Dependence of geomagnetic active-time northern high-latitude upper thermospheric winds, J. Geophys. Res., 123, 739–754, https://doi.org/10.1002/2017JA024715, 2018.
Doornbos, E, Ijssel, J., Lühr, H., Förster, M., and Koppenwallner, G:. Neutral density and crosswind determination from arbitrarily oriented multiaxis accelerometers on satellites, J. Spacecraft Rockets, 47, 580–589, https://doi.org/10.2514/1.48114, 2010.
Drob, D. P., Emmert, J. T., Meriwether, J. W., Makela, J. J., Doornbos, E, Conde, M., Hernandez, G., Noto, J., Zawdie, K. A., McDonald, S. E., Huba, J. D., and Klenzing, J. H.: An update to the Horizontal Wind Model (HWM): The quiet time thermosphere, Earth Space Sci., 2, 301–319, 10.1002/2014EA000089, 2015.
Emmert, J.T., Hernandez, G., Jarvis, M. J., Niciejewski, R. J., Sipler, D. P., and Vennerstrom, S.: Climatologies of nighttime upper thermospheric winds measured by ground-based Fabry-Perot interferometers during geomagnetically quiet conditions: 2. High-latitude circulation and interplanetary magnetic field dependence, J. Geophys. Res., 111, A12303, https://doi.org/10.1029/2006JA011949, 2006b.
Fiori, R. A. D., Koustov, A. V., Boteler, D. H., Knudsen, D. J., and Burchill, J. K.: Calibration and assessment of Swarm ion drift measurements using a comparison with a statistical convection model, Earth Planet. Space, 68, 100, https://doi.org/10.1186/s40623-016-0472-7, 2016.
Forbes, J. M., Roble, R. G., and Marcos, F. A.: Magnetic activity dependence of high–latitude thermospheric winds and densities below 200 km, J. Geophys. Res., 98, 13693–13702, 1993.
Ford, E. A. K., Aruliah, A. L., Griffin, E. M., and McWhirter, I.: High time resolution measurements of the thermosphere from Fabry-Perot Interferometer measurements of atomic oxygen, Ann. Geophys., 25, 1269–1278, https://doi.org/10.5194/angeo-25-1269-2007, 2007.
Förster, M. and Cnossen, I.: Upper atmosphere differences between northern and southern high latitudes: The role of magnetic field asymmetry, J. Geophys. Res.-Space, 118, 5951–5966, 2013.
Förster, M. and Doornbos, E.: Upper thermosphere neutral wind cross-track component deduced from CHAMP accelerometer data, GFZ German Research Centre for Geosciences, https://doi.org/10.5880/GFZ.1.1.2019.001, 2019.
Förster, M., Rentz, S., Köhler, W., Liu, H., and Haaland, S. E.: IMF dependence of high-latitude thermospheric wind pattern derived from CHAMP cross-track measurements, Ann. Geophys., 26, 1581–1595, https://doi.org/10.5194/angeo-26-1581-2008, 2008.
Förster, M., Haaland, S. E., and Doornbos, E.: Thermospheric vorticity at high geomagnetic latitudes from CHAMP data and its IMF dependence, Ann. Geophys., 29, 181–186, https://doi.org/10.5194/angeo-29-181-2011, 2011.
Förster, M., Doornbos, E., and Haaland S.: The role of the upper atmosphere for dawn-dusk differences in the coupled magnetosphere-ionosphere-thermosphere system, in: Dawn-Dusk Asymmetries in Planetary Plasma Environments, edited by: Haaland, S., Runov, A., and Forsyth, C., John Wiley Publications, AGU Geophysical Monograph, Vol. 230, 125–142, ISBN: 978-1-119-21632-2, 2017.
Foster, J. C., Holt, J. M., Musgrove, R. G., and Evans, D. S.: Ionospheric convection associated with discrete levels of particle precipitation, Geophys. Res. Lett., 13, 656–659, 1986.
Fuller-Rowell, T. J.: Modelling the solar cycle change in nitric oxide in the thermosphere and upper mesosphere, J. Geophys. Res., 98, 1559–1570, 1992.
Fuller-Rowell, T. J. and Evans, D. S.: Height Integrated Pedersen and Hall Conductivity Patterns Inferred from the TIROS-NOAA Satellite Data, J. Geophys. Res., 92, 7606–7618, 1987.
Fuller-Rowell, T. J. and Rees, D.: Interpretation of an Anticipated Long-Lived Vortex in the Lower Thermosphere Following Simulation of an Isolated Substorm, Planet. Space Sci., 32, 69–85, 1984.
Fuller-Rowell, T. J., Rees, D., Quegan, S., Moffett, R. J., and Bailey, G. J.: Simulations of the seasonal and UT variations of the thermosphere and ionosphere using a coupled, three-dimensional, global model, Pur. A. Geophys., 127, 189–217, 1988.
Fuller-Rowell, T. J., Rees, D., Quegan, S., Moffett, R. J., Codrescu, M. V., and Millward, G. H.: A coupled thermosphere ionosphere model, Solar terrestrial energy program (STEP), handbook of ionospheric models, edited by: Schunk, R. W., 217–238, 1996.
Gillies, M. D., Knudsen, D., Donovan, E., Jackel, B., Gillies, R., Spanswick, E.: Identifying the 630 nm auroral arc emission height: A comparison of the triangulation, FAC profile, and electron density methods, J. Geophys. Res.-Space, 122, 8181–8197, https://doi.org/10.1002/2016JA023758, 2017.
Griffin, E. M., Aruliah, A., Müller-Wodarg, I. C. F., and Aylward, A.: Comparison of high-latitude thermospheric meridionalwinds II: combined FPI, radar and model Climatologies, Ann. Geophys., 22, 863–876, https://doi.org/10.5194/angeo-22-863-2004, 2004.
Griffin, E. M., Aruliah, A. L., McWhirter, I., Yiu, H.-C. I., Charalambous, A., and McCrea, I.: Upper thermospheric neutral wind and temperature measurements from an extended spatial field, Ann. Geophys., 26, 2649–2655, https://doi.org/10.5194/angeo-26-2649-2008, 2008.
Harang, L.: The mean field of disturbance of polar geomagnetic storms, Terr. Mag. Atmos. Elec., 51, 353–380, 1946.
Harris, M.: A New Coupled Middle Atmosphere and Thermosphere General Circulation Model: Studies of Dynamic, Energetic and Photochemical Coupling in the Middle and Upper Atmosphere, PhD Thesis, University of London, 2001
Harris, M. J., Arnold, N. F., and Aylward, A. D.: A study into the effect of the diurnal tide on the structure of the background mesosphere and thermosphere using the new coupled middle atmosphere and thermosphere (CMAT) general circulation model, Ann. Geophys., 20, 225–235, https://doi.org/10.5194/angeo-20-225-2002, 2002.
Hecht, E. and Zajac, A.: Optics, Addison-Wesley Publishing Company, p. 17, 1980.
Hedin, A. E., Salah, J. E., Evans, J. V., Reber, C. A., Newton, G. P., Spencer, N. W., Kayser, D. C., Alcayde, D., Bauer, P., Cogger, L., and McClure, J. P.: A Global Thermospheric Model Based on Mass Spectrometer and Incoherent Scatter Data MSIS 1, N2 Density and Temperature, J. Geophys. Res., 82, 2139–2147, 1977.
Hedin, A. E., Biondi, M. A., Burnside, R. G., Hernandez, G., Johnson, R. M., Killeen, T. L., Mazaudier, C., Meriwether, J. W., Salah, J. E., Sica, R. J., Smith, R. W., Spencer, N. W., Wickwar, V. B., and Virdi, T. S.: Revised Global Model of Thermospheric Winds Using Satellite and Ground-Based Observations, J. Geophys. Res.-Space, 96, 7657–7688, 1991.
Hedin, A. E., Fleming, E. L., Manson, A. H., Schmidlin, F. J., Avery, S. K., Clark, R. R., Franke, S. J., Frase, G. J., Tsuda, T., Vial, F., and Vincent, R. A.: Empirical wind model for the upper, middle and lower atmosphere, J. Atmos.-Terr. Phys., 58, 1421–1447, https://doi.org/10.1016/0021-9169(95)00122-0, 1996.
Helleputte, T. V., Doornbos, E., and Visser, P.: CHAMP and GRACE accelerometer calibration by GPS-based orbit determination, Adv. Space Res., 43, 1890–1896. https://doi.org/10.1016/j.asr.2009.02.017, 2009.
Hood, R. K. E.: Effects of field-aligned currents in the ionosphere-thermosphere system, PhD Thesis, University College London, UK, 2018
Jacchia, L. G. and Slowey, J. W.: A supplemental catalog of atmospheric densities from satellite-drag analysis (No. 348), SAO Special Report, 324 pp., 1972.
Killeen, T. L., Smith, R. W., Hays, P. B., Spencer, N. W., Wharton, L. E., and McCormac, F. G.: Neutral winds in the high latitude winter F-region: Coordinated observations from ground and space, Geophys. Res. Lett., 11, 311–314, 1984.
Killeen, T. L., Won, Y.-I., Niciejewski, R. J., and Burns, A. G.: Upper Thermosphere Winds and Temperatures in the Geomagnetic Polar Cap: Solar Cycle, Geomagnetic Activity and IMF Dependencies, J. Geophys. Res., 100, 21327–21342, 1995.
Koustov, A. V., Lavoie, D. B., Kouznetsov, A. F., Burchill, J. K.,Knudsen, D. J., and Fiori, R. A. D.: A comparison of cross-track ion drift measured by the Swarm satellites and plasma convection velocity measured by SuperDARN, J. Geophys. Res.-Space, 124, 4710–4724, https://doi.org/10.1029/2018JA026245, 2019.
Liu, H., Lühr, H., Henize, V., and Köhler, W.: Global distribution of the thermospheric total mass density derived from CHAMP, J. Geophys. Res., 110, A04301, https://doi.org/10.1029/2004JA010741, 2005.
Liu, H., Lühr, H.,Watanabe, S., Köhler,W., Henize, V., and Visser, P.: Zonal winds in the equatorial upper thermosphere: Decomposing the solar flux, geomagnetic activity, and seasonal dependencies, J. Geophys. Res., 111, A07307, https://doi.org/10.1029/2005JA011415, 2006.
Liu, H., Doornbos, E., and Nakashima, J.: Thermospheric wind observed by GOCE: Wind jets and seasonal variations, J. Geophys. Res.-Space, 121, 6901–6913, https://doi.org/10.1002/2016JA022938, 2016.
Liu, X., Xu, J., Yue, J., and Vadas, S. L.: Numerical modeling study of the momentum deposition of small amplitude gravity waves in the thermosphere, Ann. Geophys., 31, 1–14, https://doi.org/10.5194/angeo-31-1-2013, 2013.
Makela, J. J., Meriwether, J. W., Huang, Y., and Sherwood, P. J.: Simulation and analysis of a multi-order imaging Fabry-Perot interferometer for the study of thermospheric winds and temperatures, Appl. Opt., 50, 4403–4416, 2011.
March, G., Doornbos, E. N., and Visser, P. N. A. M.: High-fidelity geometry models for improving the consistency of CHAMP, GRACE, GOCE and Swarm thermospheric density data sets, Adv. Space Res., 63, 213–238, https://doi.org/10.1016/j.asr.2018.07.009, 2018.
March, G., Doornbos, E. N., and Visser, P. N. A. M.: High-fidelity geometry models for improving the consistency of CHAMP, GRACE, GOCE and Swarm thermospheric density data sets, Adv. Space Res., 63, 213–238, https://doi.org/10.1016/j.asr.2018.07.009, 2019.
Marcos, F. A. and Forbes, J. M.: Thermospheric wind from the satellite electrostatic triaxial accelerometer system, J. Geophys. Res., 90, 6543–6552, 1985.
McWhirter, I.: Electron Multiplying CCDs – New Technology for Low Light Level Imaging, Proceedings of 33rd Annual European Meeting on Atmospheric Studies by Optical Methods, IRF Sci. Rep., 292, 61–66, 2008.
McWhirter, I., Rees, D., and Greenaway, A. H.: Miniature Imaging Photon Detectors III. – An Assessment of the Performance of the Resistive Anode IPD, J. Phys. E., 15, 145–150, 1982.
Mehta, P. M., Walker, A. C., Sutton, E., and Godinez, H. C.: New density estimates derived using accelerometers on-board the CHAMP and GRACE satellites, Space Weather, 15, 558–576, https://doi.org/10.1002/2016SW001562, 2017.
Moe, M., Wallace, M., Steven, D., and Moe, K.: The upper mesosphere and lower thermosphere, A review of experiment and theory, Geophys. Monogr., 87, 349–356, 1995
Quegan, S., Bailey, G. J., Moffett, R. J., Heelis, R. A., Fuller-Rowell, T. J., Rees, D., and Spiro, A. W.: A theoretical study of the distribution of ionisation in the high-latitude ionosphere and the plasmasphere: First results of the mid-latitude trough and the light ion trough, J. Atm.-Terr. Phys., 44, 619–640, 1982.
Rees, D., Fuller-Rowell, T. J., Gordon, R., Smith, M. F., Maynard, N. C., Heppner, J. P., Spencer, N. W., Wharton, L., Hays, P. B., and Killeen, T. L.: A theoretical and empirical study of the response of the high latitude thermosphere to the sense of the “Y” component of the interplanetary magnetic field, Planet. Space Sci., 34, 1–40, 1986.
Rees, M. H.: Physics and chemistry of the upper atmosphere, Cambridge atmospheric and space science series, Cambridge University Press, ISBN 0-521-32305-3, 1989.
Reigber, C., Lühr, H., and Schwintzer, P.: CHAMP mission status, Adv. Space Res., 30, 129–134, 2002.
Roble, R. G., Ridley E. C., and Dickenson, R. E.: On the global mean structure of the thermosphere, J. Geophys. Res., 92, 8745–8758, 1987.
Ronksley, A.: Optical remote sensing of mesoscale thermospheric dynamics above Svalbard and Kiruna, PhD thesis, UCL, London, UK, 2016.
Salah, J. E. and Holt, J. M.: Midlatitude thermospheric winds from incoherent scatter radar and theory, Radio Sci., 9, 301–313, 1974.
Schlegel, K., Lühr, H., St.-Maurice, J.-P., Crowley, G., and Hackert, C.: Thermospheric density structures over the polar regions observed with CHAMP, Ann. Geophys., 23, 1659–1672, https://doi.org/10.5194/angeo-23-1659-2005, 2005.
Shepherd, S. G.: Altitude-adjusted corrected geomagnetic coordinates: Definition and functional approximations, J. Geophys. Res.-Space, 119, 7501–7521, https://doi.org/10.1002/2014JA020264, 2014.
Sica, R. J., Rees, M. H., Roble, R. G., Hernandez, G., and Romick, G. J.: The Altitude Region Sampled by Ground-Based Doppler Temperature Measurements of the OI 15867K Emission Line in Aurorae, Planet. Space Sci., 34, 483–488, 1986.
Song, P. and Vasyliūnas, V. M.: Inductive-dynamic coupling of the ionosphere with the thermosphere and the magnetosphere, in: 'Modeling the Ionosphere-Thermosphere System', edited by: Huba, J., Schunk, R., and Khazanov, G., American Geophysical Union, Washington DC, Geoph. Monog. Series, 201, 201–215, 2013.
Song, P., Vasyliūnas, V. M., and Zhou, X.-Z.: Magnetosphere-ionosphere/thermosphere coupling: Self-consistent solutions for a one-dimensional stratified ionosphere in three-fluid theory, J. Geophys. Res., 114, A08213, https://doi.org/10.1029/2008JA013629, 2009.
Storz, M. F., Bowman, B. R., Branson, M. J. I., et al.: 2005. High accuracy satellite drag model (HASDM), Adv. Space Res., 36, 2497–2505, https://doi.org/10.1016/j.asr.2004.02.020, 2005.
Sutton, E. K., Nerem, R. S., and Forbes, J. M.: Density and Winds in the Thermosphere Deduced from Accelerometer Data, J. Spacecraft Rockets, 44, 1210–1219, https://doi.org/10.2514/1.28641, 2007.
Tapley, B. D., Bettadpur, S., Watkins, M., and Reigber, C.: The gravity recovery and climate experiment: Mission overview and early results, Geophys. Res. Lett., 31, L09607, https://doi.org/10.1029/2004GL019920, 2004.
Torr, M. R., Richards, P. G., and Torr, D. G.: A new determination of ultraviolet heating ef?ciency in the thermosphere, J. Geophys.Res., 85, 6819–6826, 1980a.
Torr, M. R., Richards, P. G., and Torr, D. G.: The solar ultraviolet heating efficiency in the mid-latitude thermosphere, Geophys. Res. Lett., 6, 673–376, 1980b.
Vadas, S. L. and Crowley, G.: Neutral wind and density perturbations in the thermosphere created by gravity waves observed by the TIDDBIT sounder, J. Geophys. Res.-Space, 122, 6652–6678, https://doi.org/10.1002/2016JA023828, 2017.
Visser, T., March, G., Doornbos, E., de Visser, C., and Visser, P.: Horizontal and vertical thermospheric cross-wind from GOCE linear and angular accelerations, Adv. Space Res., 63, 3139–3153, https://doi.org/10.1016/j.asr.2019.01.030, 2019.
Vlasov, M. N., Nicolls, M. J., Kelley, M. C., Smith, S. M., Aponte, N., and Gonzalez, S. A: Modeling of airglow and ionospheric parameters at Arecibo during quiet and disturbed periods in October 2002, J. Geophys. Res., 110, A07303, https://doi.org/10.1029/2005JA011074, 2005.
Yiu, H. C. I: High latitude thermosphere meso-scale studies and long-term database investigations with the new Scanning Doppler Imager and Fabry-Perot Interferometers, Ph.D. Thesis, Univ. of London, London, UK, 2014.


