the Creative Commons Attribution 4.0 License.
the Creative Commons Attribution 4.0 License.
 | 18 Jan 2018
Pulsating aurora and cosmic noise absorption associated with growth-phase arcs
Derek McKay
Noora Partamies
Juha Vierinen
The initial stage of a magnetospheric substorm is the growth phase, which typically lasts 1–2 h. During the growth phase, an equatorward moving, east–west extended, optical auroral arc is observed. This is called a growth-phase arc. This work aims to characterize the optical emission and riometer absorption signatures associated with growth-phase arcs of isolated substorms. This is done using simultaneous all-sky camera and imaging riometer observations. The optical and riometric observations allow determination of the location of the precipitation within growth-phase arcs of low- (<10 keV) and high- (> 10 keV) energy electrons, respectively. The observations indicate that growth-phase arcs have the following characteristics:
-
The peak of the cosmic noise absorption (CNA) arc is equatorward of the optical emission arc. This CNA is contained within the region of diffuse aurora on the equatorward side.
-
Optical pulsating aurora are seen in the border region between the diffuse emission region on the equatorward side and the bright growth-phase arc on the poleward side. CNA is detected in the same region.
-
There is no evidence of pulsations in the CNA.
-
Once the equatorward drift starts, it proceeds at constant speed, with uniform separation between the growth-phase arc and CNA of 40±10 km.
Optical pulsating aurora are known to be prominent in the post-onset phase of a substorm. The fact that pulsations are also seen in a fairly localized region during the growth phase shows that the substorm expansion-phase dynamics are not required to closely precede the pulsating aurora.
Keywords. Ionosphere (auroral ionosphere)
- Article
(996 KB) - Full-text XML
- BibTeX
- EndNote


Polar magnetospheric substorms follow a sequence starting with a latitudinally narrow auroral arc, called the growth-phase arc, which extends hundreds of kilometres east–west. This arc evolves until the sudden commencement of complex and conspicuous activity, referred to as the expansion phase. The start of the expansion phase is accompanied by a deviation from the mean ground-level magnetic field (the onset) and an increase in high-energy precipitation (Wing et al., 2013). The onset can be identified by an abrupt decrease of the north–south component of the ground-level magnetic field (e.g. local electrojet index IL of more than 80 nT in 15 min) (Tanskanen, 2009). At approximately the same time, there is an auroral break up – a dramatic increase in auroral intensity lasting 10–15 min and resulting in aurora of north–south, as well as east–west, extent. The time at which the IL index reaches its minimum value is often used to mark the end of the expansion phase. The substorm then enters the recovery phase (with the IL index returning to the pre-substorm values). The substorm recovery process usually lasts 1–3 h (Tanskanen, 2009).
Although the most intense optical and magnetic effects for a given substorm occur during the expansion phase, significant physical processes are apparent during the time leading up to the expansion. This initial stage of the substorm is the growth phase, lasting 1–2 h, and first categorically described by McPherron (1970). The starting point of the growth phase is not always clear. Tanskanen (2009) defines it as commencing with first signs of a negative magnetic deflection. During the growth phase, the magnetotail stretches as energy is transferred to it from the solar wind. As the tail stretches, the auroral arc moves equatorward until finally the build-up of energy is released at the time of the substorm onset (Lessard et al., 2007). Other auroral arcs can form poleward but, by tracing the magnetic field lines into the magnetotail, it can be seen that it is the equatorward arc that maps to the inner edge of the plasma sheet, where there are significant gradients in plasma properties (Fukunishi, 1975).
The growth-phase arc refers to the optically bright emission band. However, a broad region of diffuse emission coexists equatorward and parallel to this bright emission. The diffuse region has been shown to be proton aurora (Ono et al., 1987). Lessard et al. (2007) show that the regions of diffuse proton aurora and the bright electron aurora of the growth-phase arc clearly overlap in latitude. They also point out the separation between the peak emission in the electron and proton bands.
The energetic particles released into the atmosphere during a substorm originate from the plasma sheet (Wing et al., 2013). They travel along the field lines and precipitate into the ionosphere. Because the field-aligned acceleration mechanism is stable, the resulting electrons are quasi-monoenergetic and form the diffuse and bright arc aurorae during the growth phase, as well as contributing to the upward current system into the plasma sheet. Pytte et al. (1976) noted that high-energy electron precipitation associated with arcs during the growth phase occurs prior to when there has been a quiet period before the onset. During the events they studied, there were low-to-moderate geomagnetic conditions (Kp=2–6).
Cosmic radio noise absorption (CNA) by the ionosphere, first demonstrated by Shain (1951), is the relative enhancement of absorption of VHF radio waves by increases in the electron density in the D region of the ionosphere (approximately 90–100 km altitude). CNA can be observed during all phases of substorms. Because the absorption is dominated by the plasma collision frequency, it occurs at these lower altitudes and is indicative of higher-energy electron precipitation of tens of keV (Johansen, 1965).
CNA observations have been used to investigate the relationship of the growth-phase arc and high-energy electron precipitation. Ranta et al. (1981) used chains of single-beam riometers to infer the geographic distribution of the absorption. Each chain was located at a different longitude, with the riometers in each chain spanning a range of latitudes. The measured temporal and spatial extents of enhanced absorption in four events were studied in detail (2 May 1975, 22 May 1976, 4 May 1977, 4 January 1979). They reported the equatorward progression to be 100–250 m s−1. The four substorms occurred during times of varied geomagnetic activity (Kp 4, 1, 5 and 6, respectively), solar wind speeds (461, 510, 448 and 427 km s−1) and interplanetary magnetic field (IMF Bz, −3, −2, no data and −8 nT).
Jussila et al. (2004) also examined CNA during growth-phase arcs, noting that it lies on the equatorward edge of the bright optical arc. They examined two examples to determine that neither plasma instabilities nor enhanced electron temperatures in the E region play a significant role in causing the CNA associated with the arc. In both examples the Kp index was 3. They conclude that the CNA is caused by energetic electron precipitation reaching down into the D region, with a maximum between 80 and 90 km. The measured equatorward drift of the arcs were 170 and 120 m s−1.
CNA is also commonly seen during the recovery phase, a time when optical pulsating aurorae are also observed. During the recovery phase, patches of pulsating auroral emission of ≈100 km horizontal extent switch on and off with a recurrence period ranging from a few seconds to a minute (Lessard et al., 2007). Satellite-based observations suggest that they are caused by time-varying flux of high-energy (>10 keV) electrons (Wing et al., 2013). Weak pulsations in the CNA with close correlation to the optical phenomena have been reported (Brekke, 1971; Grandin et al., 2017).
Optical pulsating aurora electrons originate from near the magnetic equator with possible mechanisms being injection via bursts of, for instance, chorus wave energy (Nishimura et al., 2010) or electromagnetic ion cyclotron (EMIC) wave energy (e.g. Miyoshi et al., 2008). The wave activity travels radially outwards at the equatorial plane, where it encounters energetic particles trapped in the Earth's radiation belts. These particles are then scattered through resonance with the waves. The bursts of a lower chorus spectrum are repetitive and occur every ≈10 s which, allowing for statistical variation and evolving morphologies, is characteristic of the luminosity variation seen in pulsating aurora events (Thorne et al., 2010). Although the EMIC wave mechanism explains the rapid loss of relativistic electrons from the outer belt, the frequency of variation is associated with flickering aurora, rather than the optically pulsating patches (Kataoka et al., 2015).
Early literature refers to the optical pulsating aurora in terms of magnetic time, rather than relating it to substorm phases. Kvifte and Pettersen (1969) report that pulsating aurora start in the auroral oval at approximately magnetic midnight, corresponding to the time of typical substorm onset (Tanskanen, 2009). Pulsations are mentioned to occur in diffuse aurorae by Swift (1979), but it is not made clear whether these are in the growth phase or during the post-onset recovery. However, Royrvik and Davis (1977) state that “in the quiet times prior to an isolated auroral substorm, pulsating auroras are not observed on the darkside of the earth”.
Optical pulsating aurora can occur before magnetic midnight, and this occurrence has a higher probability (25–50 %) during times of low magnetic activity (ΣK≤20) than at times of higher magnetic activity. Oguti et al. (1981) report that in their observations the occurrence probability of pulsating aurora at magnetic midnight is about 30 % and it rapidly increases to 100 % at about 4 h magnetic local time. Their conclusion is that pulsating aurora are a common occurrence along the auroral oval in the morning sector. However, this does not preclude the possibility of seeing pulsating aurora in the evening sector when compared to typical substorm timings (e.g. Tanskanen, 2009). If a substorm occurs early, then the recovery phase may begin well ahead of magnetic midnight. Observations of pulsating aurora in this case indicate that it is still a recovery-phase phenomenon. Chorus waves are present in the evening sector (Thorne et al., 2010). What has been missing has been the observation of the pulsating aurora in the growth phase.
In this paper, we report that when there is an isolated substorm, an arc of CNA is observed on the equatorward edge of the discrete growth-phase arc. We observe that the CNA does not extend across all of the diffuse aurora, nor the main growth-phase electron-precipitation arc, but is concentrated on the boundary region between the two. Additionally, we note that pulsations in the optical emission occur in this boundary region and suggest that this is the same source population of particles as that which generates post-onset optical pulsating aurorae.
The remainder of the paper is structured as follows. Section 2 describes the instruments used, the measurement technique and the expected performance capability. Section 3 describes the event selection criteria and the cases that were found. One canonical event is described in detail in Sect. 4. In Sect. 5, we explain the two key results that were found, with a discussion of these following in Sect. 6 and conclusions thereafter.
For this study, the two main instruments used were the Finnish Meteorological Institute's multi-wavelength All-Sky Camera (FMI-ASC) at Kilpisjärvi (Sangalli et al., 2011b), and the Kilpisjärvi Atmospheric Imaging Receiver Array (KAIRA, McKay-Bukowski et al., 2015).
The geographic and magnetic locations are given in Table 1. The close proximity (2.27 km ground separation) of these two instruments make them suitable for direct comparison studies, with features in the ionosphere being seen from a similar vantage point.
Table 1Parameters for the instruments used. Magnetic coordinates were
calculated using aacgmv2 Python libraries for the epoch
20 December 2016. The FMI-ASC altitude was estimated from
NLS karttapaikka data.
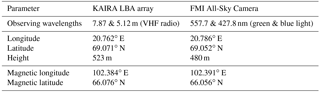
2.1 FMI ASC
The FMI-ASC camera system incorporates an electron multiplication CCD. Fish-eye optics capture a circular area with about 600 km diameter at the ionospheric altitudes. The filter wheel contains filters for the main auroral emission lines at 427.8, 557.7 and 630.0 nm with a bandpass of 2.0 nm. These correspond to N, O(1S) and O(1D), respectively, and are referred to as blue, green and red for simplicity. A standard imaging mode of about 20 images per minute also includes images through background filters, dark frames and unfiltered (panchromatic) images. The frame rate of green and blue line data in a standard imaging mode is approximately one image every 10 s, which is sufficient to study the slowly evolving growth-phase arcs and is sensitive to pulsations of comparable timescales. Exposure times for green and blue filtered images are 0.8 and 1.2 s, respectively. All FMI ASC imaging is automatically activated whenever the sun is at least 10∘ below the horizon. Thus, the imaging season in Lapland typically extends from September until April. Image data are stored in 16 bit PNG files, and scaled and converted to 8 bit JPEG files for further analysis. Displayed levels for the keograms are in arbitrary units, but are linear to the received luminance.
Images are 512×512 pixels (for the E region at zenith, this corresponds to a lateral resolution of ≈1 km pixel−1). The alignment of the FMI-ASC camera is 7.2∘ east of geographic North, which is approximately aligned to magnetic north (≈9.5∘ for the epochs of the observations in this paper). The camera lens' azimuthal equidistant projection is approximately linear to pixels, so that the error in zenith angle, Z, is ±1∘. This level of accuracy is sufficient for comparison with the riometry images which have significantly lower resolution.
2.2 KAIRA
KAIRA is passive radio-telescope system operating in the HF–VHF part of the spectrum, comprising two phased arrays (low-band and high-band), with a shared digital signal-processing back end. For the riometry experiments, the Low-Band Antenna (LBA) array of KAIRA is used which has a frequency coverage of 8–80 MHz. The LBA array has 48 antennas, which are dual-linear-polarization inverted-V dipoles, each with a wide beam pattern centred on zenith Z=0∘, down to 3 dB at Z≈60∘ dropping to 10 dB at Z≈80∘. Interferometric cross-correlation products can be formed for all 1128 antenna-pair combinations for one subband. Subbands are frequency channels of uniform spacing such that the centre frequency, ν, of subband, s, is given by MHz. The subbands used in this experiment were either 195 or 300, which thus have a central frequency and channel bandwidth of 38.086±0.098 and 58.594±0.098 MHz, respectively. The relatively narrow bandwidth makes the interferometer approximately monochromatic and there is therefore no significant baseline decorrelation or bandwidth smearing effects. The phased-array layout is in a quasi-random pattern in a circular area of approximately 34 m diameter, which results in a beam size of approximately 15×15sec (Z) degrees – equivalent to a zenith spatial resolution of approximately 24 km at 90 km altitude. Any positional error in the riometric measurements is negligible compared to this beam size.
The observational technique used is interferometric riometry imaging (McKay et al., 2015). All-sky images are formed every second using the cross-correlation products through application of a 2-D discrete Fourier transform. The power for any given direction at any given time is compared against the expected power from that direction at an equivalent sidereal time. The distribution of this expected power is referred to as the “quiet-sky” image. It is determined by taking the median of all data for a given position in the image plane for sidereal times equivalent to the sidereal time of the all-sky image, over a period of time prior to the observation. In practice, for a given image instance, we accumulate all images within ±30 s of the sidereal time of the instance over a 2-week period and take the median image from that collection. The amount of radio noise absorption, A, is then defined as , where Pq is the quiet-sky power, P is the observed power and A is absorption in dB. This calculation is made for each pixel in each image, which can be set at arbitrarily fine resolution. As a result, the interferometric riometry is spatially continuous. Riometric keograms, as opposed to full 2-D interferometric riometry, are used to reduce the processing time by 2 orders of magnitude and assist visual inspection of data (McKay et al., 2017).
The current FMI ASC at Kilpisjärvi has been operating since 2008. KAIRA is a more recent instrument with routine interferometric riometry only starting operation in October 2013. Since then, comparison plots between the optical and riometric keograms have been produced for whenever the two instruments have been both operating. Comparison plots of ASC and KAIRA (McKay et al., 2017) have been used to identify events meeting the following criteria:
-
equatorward drifting auroral arc prior to an auroral breakup (growth-phase arc);
-
a corresponding CNA signature;
-
the data must be free from interference (scintillation, radio-interference, weather, light pollution, etc.);
-
the event must not be complicated by overlapping substorms (min. 4 h quiet magnetic conditions prior to the onset).
Optical data can be obscured by cloud cover, snow, moonlit conditions or light pollution. The riometer is neither diurnally nor seasonally affected, but is subject to signal fluctuations due to ionospheric scintillation of bright radio sources, which cause artefacts in the resultant absorption images. It is also subject to radio-frequency interference (RFI).
A total of 10 events were identified from KAIRA/FMI-ASC data spanning four winter seasons (2013–2017). The dates of these case are listed chronologically in Table 2, grouped by winter season – the period of the year when optical measurements are possible. At the latitude of Kilpisjärvi, the winter imaging season extends from September until April. The approximate time in UT of when the growth phase mainly took place is given as a guide. The geomagnetic planetary index, Kp, is used to indicate general magnetic conditions during the growth phase. The hourly average solar wind speed, vsw in km s−1 from the ACE spacecraft is used as a comparison. Optical data for these events were measured using wavelength λ=557.7 nm and riometry data are subband s=195 (≈38 MHz), unless marked otherwise.
Table 2Dates of substorm events which have a growth-phase arc with associated CNA. The UT is the approximate time of the growth phase (MLTKilpisjärvi = UT + 2.5 h). Horizontal lines divide the seasons. For each, the Kp geomagnetic index and average solar wind speed vsw in km s−1 is shown. Events showing optical pulsating aurora (PA; Sect. 5.2) are marked. The example event, discussed in detail in Sect. 4, is indicated.
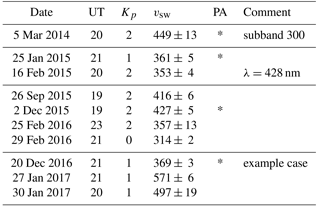
In addition to the cases that matched the search criteria, seven cases existed where the substorm was not isolated and three cases were found where there was an optical arc, but no CNA was detected. A further three cases were also found where CNA was detected, but where this CNA did not correlate to any optical arc. In earlier seasons, KAIRA was still undergoing commissioning. As a result, there was initially less time spent on observations and fewer events found as a result. As the instrument has matured, and become more reliable, it has been run in a continuous observing mode and thus more optical/riometric events were detected. It is not believed that there is any long-term bias present other than this issue of instrument availability.
In the 10 cases identified there is a CNA arc equatorward of the bright optical arc during the growth phase prior to the auroral breakup. These events are not uncommon, but are limited to cases of isolated growth-phase arcs. During the substorm expansion phase, CNA and optical emission extend across the entire sky as seen from single locations, thus precluding identification of any separation.
For the remainder of this paper, the height of the D region is assumed to be 90 km, corresponding to the approximate maximum of riometric absorption at 30 MHz (Kero et al., 2014). The E region is assumed to be 110 km, corresponding to typical heights of 557.7 nm optical auroral emission (Sangalli et al., 2011a). In both cases, the heights are an approximation as the absorption can cover a range of altitudes, with the altitude of the maximum being dependent on the energy distribution. In all 10 events, the observed meridian angle of the riometry was consistently equatorward of the visible aurora. If the discrepancy in the observed meridian angle was mostly due to height dependence, then the absorption arc would be poleward of the visible aurora when it crossed the magnetic zenith. This is not seen in any of the cases.
The substorm that occurred on 20 December 2016 is one of the 10 events exhibiting the relationship between the growth-phase arc and CNA, as well as showing clear auroral pulsations during the growth phase. In order to put this into context an overview of the entire substorm is presented in Fig. 1. Optical and riometric keograms are shown along with the magnetic signature at ground level.
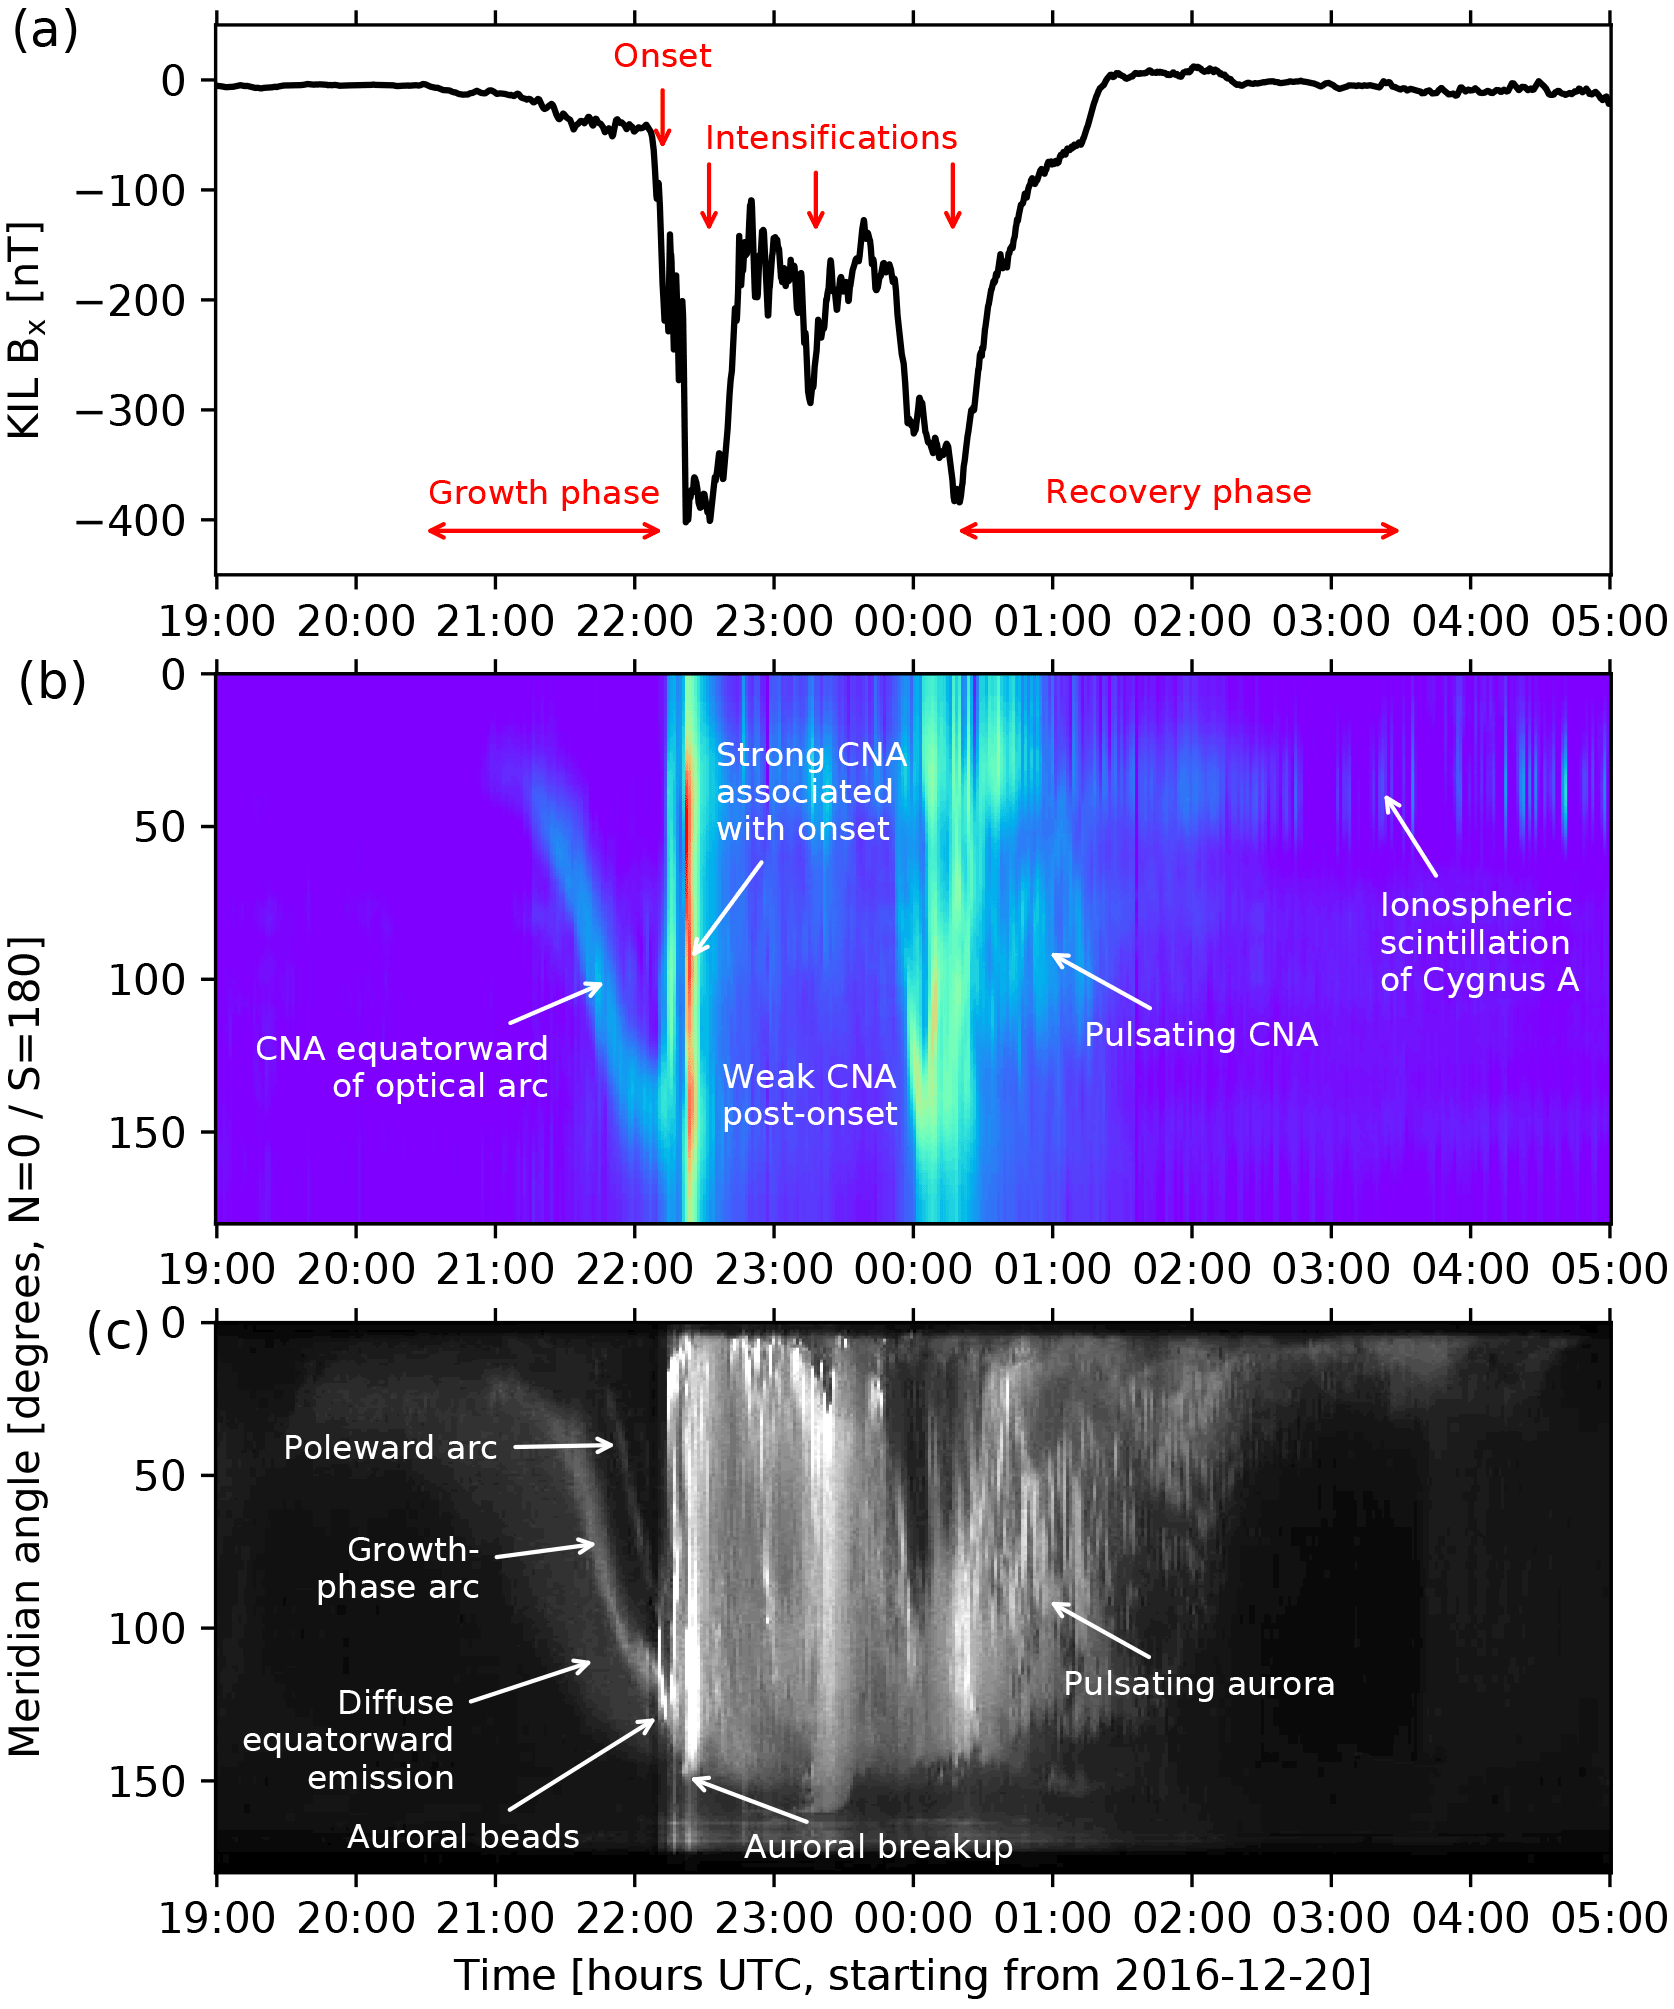
Figure 1An example event with the distinct signatures of the substorm indicated. Panel (a) is the magnetic signature, panel (b) is the riometric keogram from KAIRA and panel (c) is the optical 557.7 nm emission observed with the FMI-ASC at Kilpisjärvi.
Between 19:20 and 19:30 a band of broad diffuse optical emission establishes and persists until breakup. At 20:30 the first negative deflection of the magnetic field is noticeable, indicating the start of the growth phase. At 21:00 a second stage of optical emission begins with the appearance of a bright arc – the growth-phase arc – accompanied by the first detectable riometric absorption. As time continues, the growth-phase arc and the diffuse equatorward emission move southward (i.e. equatorward) leading to the onset and auroral breakup. The onset is marked at the point where the local horizontal magnetic field component, Bx, deviates by more than 80 nT in 15 min (as per the Tanskanen, 2009, definition). A second bright arc (the poleward arc) appears from 21:50 onward, although this does not have any appreciable absorption. It also drifts southward with a similar rate to the main growth-phase arc and does not change in morphology during that process. An example all-sky frame from 21:30 is shown in Fig. 2, illustrating the extent and spatial relationship of the optical and CNA arcs.
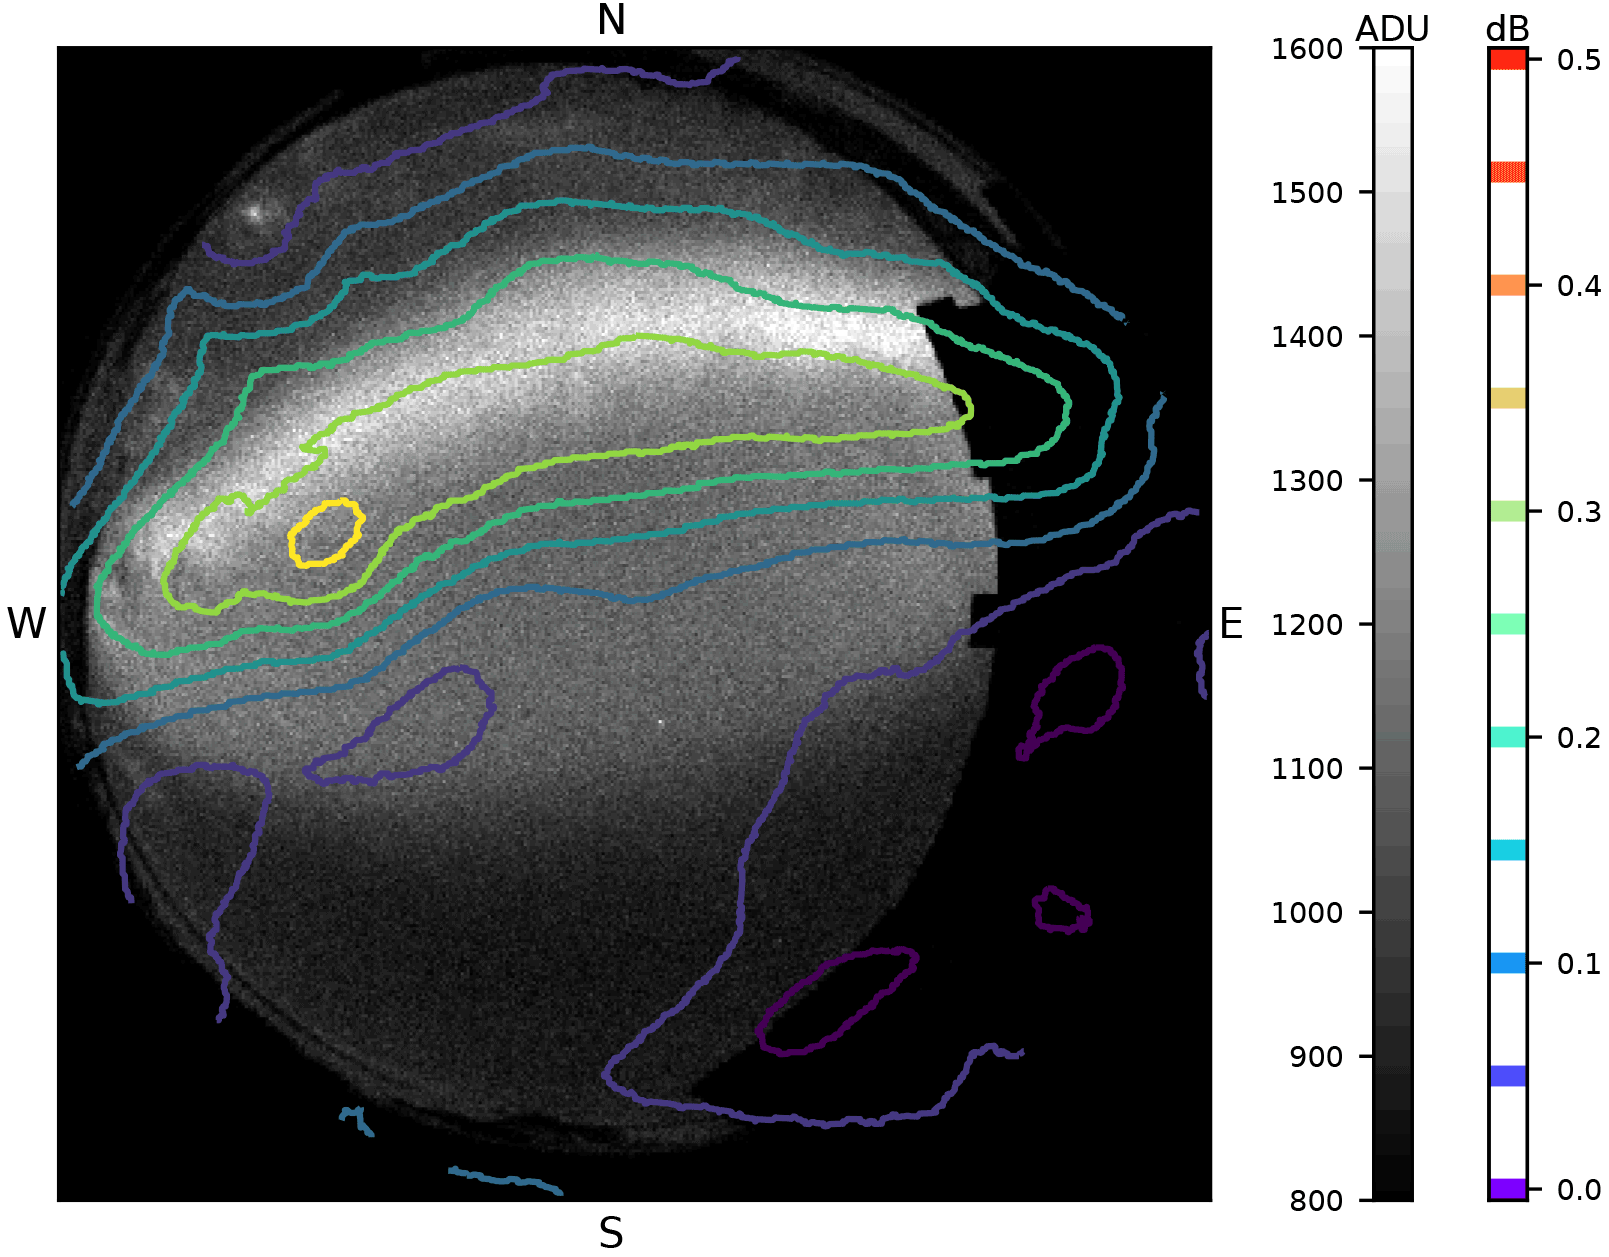
Figure 2Imaging riometer contour lines plotted over an optical all-sky image 20 December 2016 21:30 UTC. The dislocation of the optical growth-phase arc and the CNA absorption can be clearly seen. The CNA > 0.35 dB in the centre left of the image is an artefact from ionospheric scintillation of the radio source Cassiopeia A. Approximate cardinal directions are marked for reference. See Sect. 2.1 for a detailed description of the projection.
Throughout the entire growth phase, the diffuse optical emission is also evolving, with the southern edge moving equatorwards. Although it is not possible to discern the exact northern edge of the emission, it does not exceed that of the bright arc, which is also moving southwards. Between 22:02 and 22:05, auroral beads begin to appear; these are growth-phase arc fine structures of enhanced luminosity which are common in the pre-onset interval (a phenomenon described by, e.g., Motoba et al., 2012). After their initial appearance, the auroral beads evolve into wave-like undulations. Then at approx. 22:10, the onset occurs and the arc structures are lost in the increase of emission and absorption of the substorm expansion phase. The dislocation between the optical and CNA arcs is also lost at this time. This is the first large deviation of the north–south component of the magnetic field and the strongest CNA.
After the onset, there is CNA across most of the sky. There is a weak absorption enhancement along with optical emission, at the time of the second negative magnetic deflection at ≈ 23:15. A third negative magnetic deflection is present between ≈ 00:00 and 00:20. Co-temporal with this, a second surge of CNA occurs. The recovery phase starts from 00:20 and the major part of the CNA moves poleward. However, a weak but significant CNA region, along with optical pulsating aurora, remain, fading away commensurate with the decrease in the magnetic deflection.
The pulsating CNA patches are first seen in the entire sky and later in the north. The bursts of CNA seen at meridian angles between 20 and 50∘, particularly after 23:00, are not true absorption features, but are due to ionospheric scintillation of the radio galaxy Cygnus A. Because of the beam pattern of the KAIRA array, scintillation also appears in the sidelobes at the 0.05 dB level and is therefore seen at other meridian angles.
In the example shown in Fig. 1, the planetary index during the growth phase was Kp=1 and the solar wind conditions from the period 18:00–21:00 (starting with the first availability of data at 18:00 and continuing up to the approximate time of the start of the equatorial drift) were steady at km s−1. This is slow solar wind with no significant loading. The IMF Bz was nT during the growth phase.
In Fig. 3, only this growth-phase arc period is shown, with the CNA marked as coloured contour lines over the greyscale optical keogram background. The CNA is equatorward of the bright growth-phase arc throughout this phase of the substorm. There is no CNA associated with the second poleward arc at any stage during the growth phase.
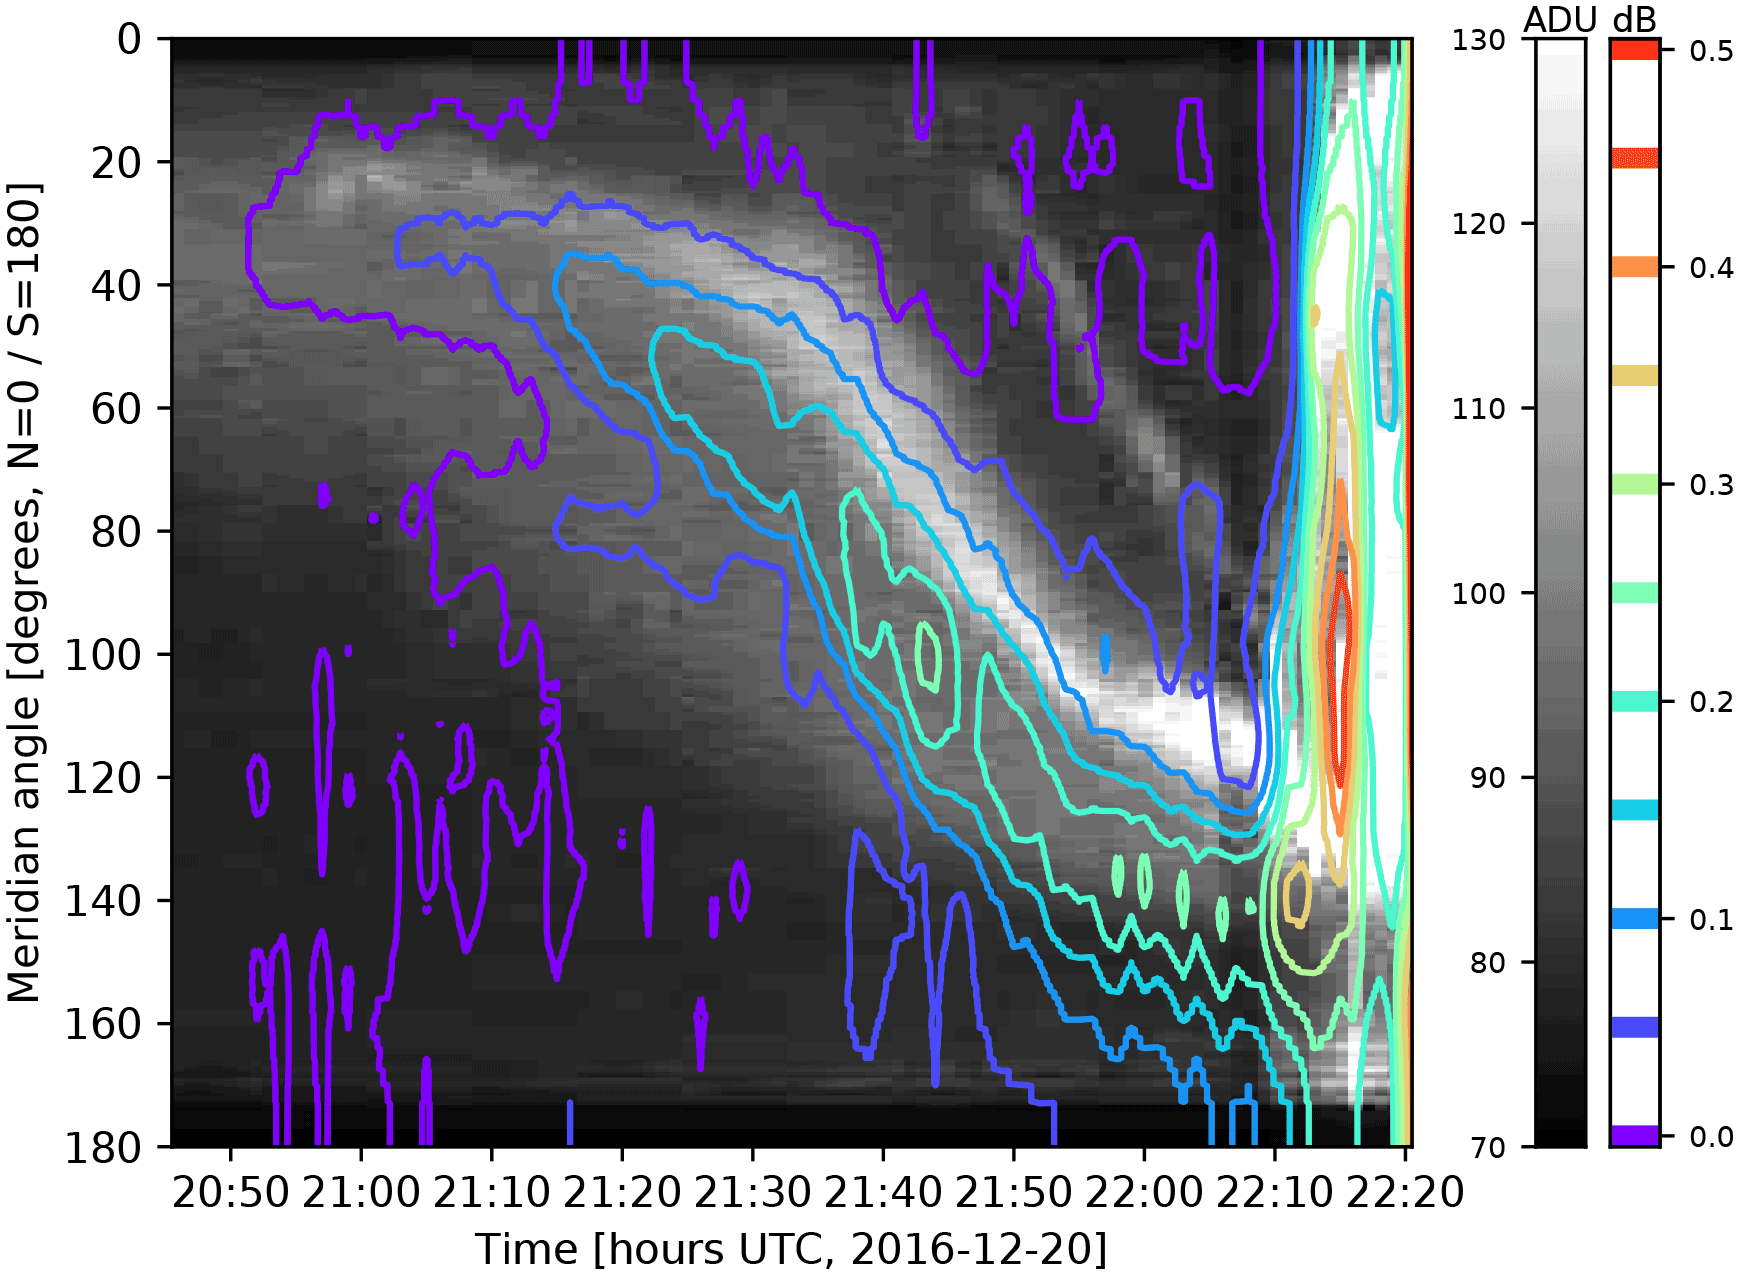
To compare the relative position and velocity of the growth-phase arc and the CNA arc, the position on the meridian where each arc has maximum intensity is determined. All optical and interferometric riometry images are calibrated giving positional accuracy of ≈0.5 and ≈4∘, respectively. For each time slice in the keogram a 1-D Gaussian function is fitted to the intensity distribution, spanning a meridian angle range of ±20∘ about the maximum pixel. This reduces the measurement's susceptibility to pixel noise. Extraneous bright pixels (e.g. low-elevation noise, such as car lights on the horizon, or known celestial objects, such as Jupiter) are excluded. A similar technique is applied to the CNA measurements. Noise remains in individual CNA data from ionospheric scintillation of bright radio sources. Although the noise is only approximately ± 0.1 dB, it can result in the algorithm failing to locate the peak of the CNA arc. However, these outliers are not significant in subsequent fitting.
By using the assumed D- and E-region heights, the 3-D geographic coordinates of the features can be determined, and their positions projected onto the ground plane. A least-squares fit on these positions is done as a function of time and, thus, the displacement and equatorward velocity is derived; shown in Fig. 4. In this case, an equatorward drift velocity of 69 ± 5 m s−1 can be determined for the CNA, and estimated equatorward drift velocity of 71 ± 7 m s−1 for the growth-phase arc based on the bright optical emission. The error estimates were derived from a combination of the statistical error from the fit, the error based on the temporary cut-off points (i.e. the start and the stop time of when the data are fitted), an uncertainty of ±5 km in the height assumption and the distribution of the phenomenon about that characteristic height (that is, the emission or absorption occur over a range of heights).
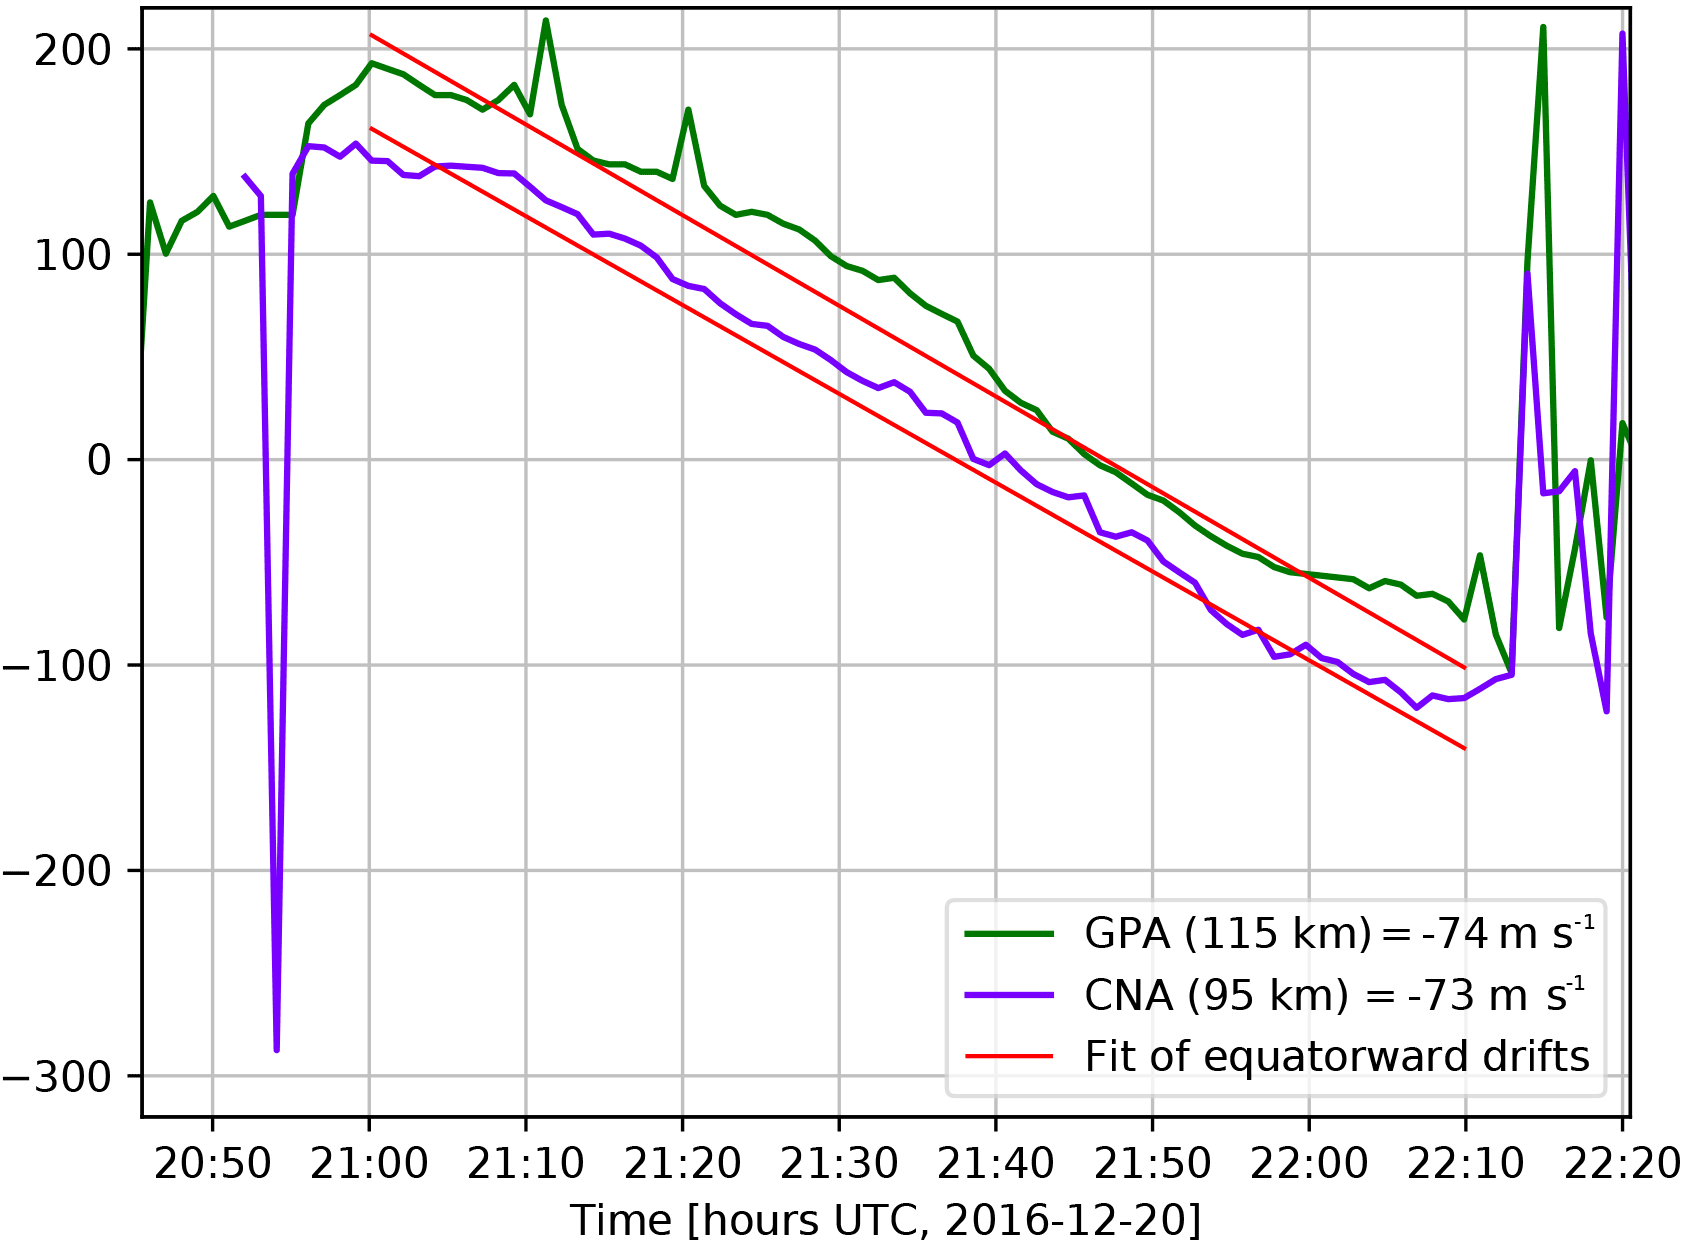
Figure 4Position of the strongest optical emission of the growth-phase arc (GPA) and cosmic-noise absorption (CNA) projected onto a common plane as a function of time. Fitted lines demonstrate the linear equatorward drift during the growth phase. The time range is the same as in Fig. 3.
5.1 Growth-phase arc dislocation
In all events studied, there was a separation between the brightest part of the growth-phase arc and the region of the maximum CNA. Using the observed elevation angle along the meridian and the assumed heights of the D and E regions, and the method described for use in Fig. 4, it is possible to estimate the geographic latitude of the arc and the CNA. Thereafter, the ground-separation – or dislocation – of the two phenomena can be determined.
For each of the 10 events in Table 2 the brightest pixel or strongest CNA was fitted with a Gaussian spanning ±20∘ of meridian angle. This was done for all times between the appearance of the growth-phase arc and the onset. Then the events are superimposed, such that the onset of each event is aligned.
Onset is determined by a local magnetic variation of more than 80 nT in 15 min (as per the Tanskanen, 2009, definition) combined with a double-check against a sharp rise in O×R, where O=Σ(optical pixel values) and R=Σ(riometry dB), for all meridian positions at a given time.
The position of the optically brightest part of the growth-phase arc and the maximum CNA signal are determined for each time prior to the event, in a manner similar to that used in Fig. 4. Data with no signal or clear interference are excised and the remaining points are plotted. A median, μt, is determined at each time and the median residual is calculated, where mi,t is the dislocation between the maximum optical and CNA signals for event i at time t. The error then associated with each measurement time is , where Nt is the number of measurements at time t. The median, μt and ±2σ values are shown.
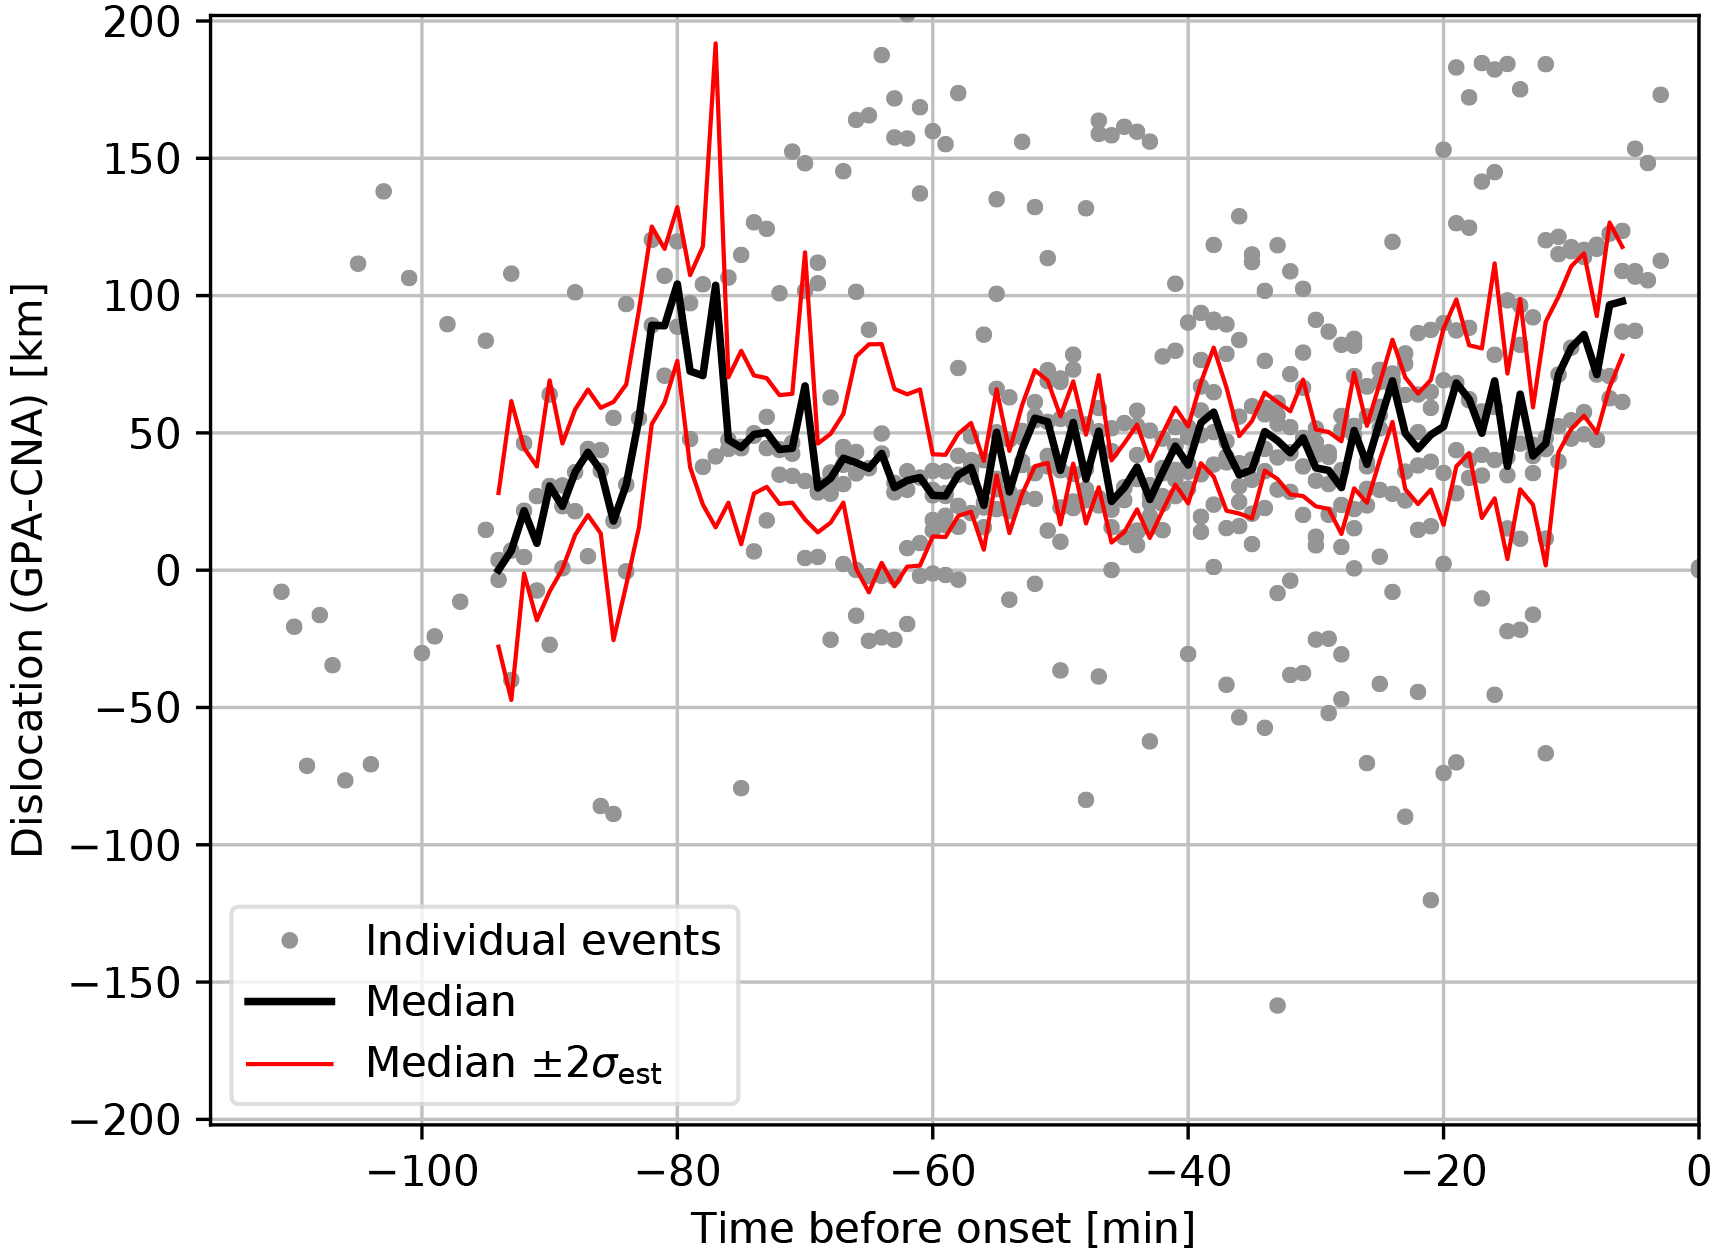
Figure 5Dislocation of the brightest part of the growth-phase arc with respect to the CNA maximum for all 10 events. Data are aligned to the moment of onset (right-hand side).
It can be seen that the co-existence of the growth-phase arc and the CNA arc commences 60–90 min prior to onset and that during this period the median dislocation is 40±10 km. This time represents the commencement of more energetic precipitation. Although there is variation between individual events, the median remains at 40±10 km, with no positive or negative trend, from 70 to 10 min prior to the auroral breakup. A slight upturn just prior to breakup may be due to imprecision in determining the breakup time or anomalies caused by the CNA proceeding to extremely low elevations at the southern horizon.
5.2 Optical pulsating aurora in the growth phase
Of particular note during this event was the appearance of optical pulsating aurora occurring between the region of the bright optical growth-phase arc and the peak of the CNA arc. A detailed optical keogram showing this is presented in Fig. 6. The auroral pulsations can be seen in the figure as thin vertical lines between the brightest part of the arc and the diffuse emission. These lines do not extend into the growth-phase arc itself, nor into the equatorward side of the diffuse region. The lines are not correlated with brightness variations in the poleward arc. In the same area as the pulsations, faint arc-like fine structures appear and disappear. In addition to the event of 20 December 2016 shown here, pulsating aurora associated with the growth-phase arc were also seen in the events of 5 March 2014, 25 January 2015 and 2 December 2015 (marked in Table 2). There is no pulsation seen in the CNA to the level of ±0.1 dB.
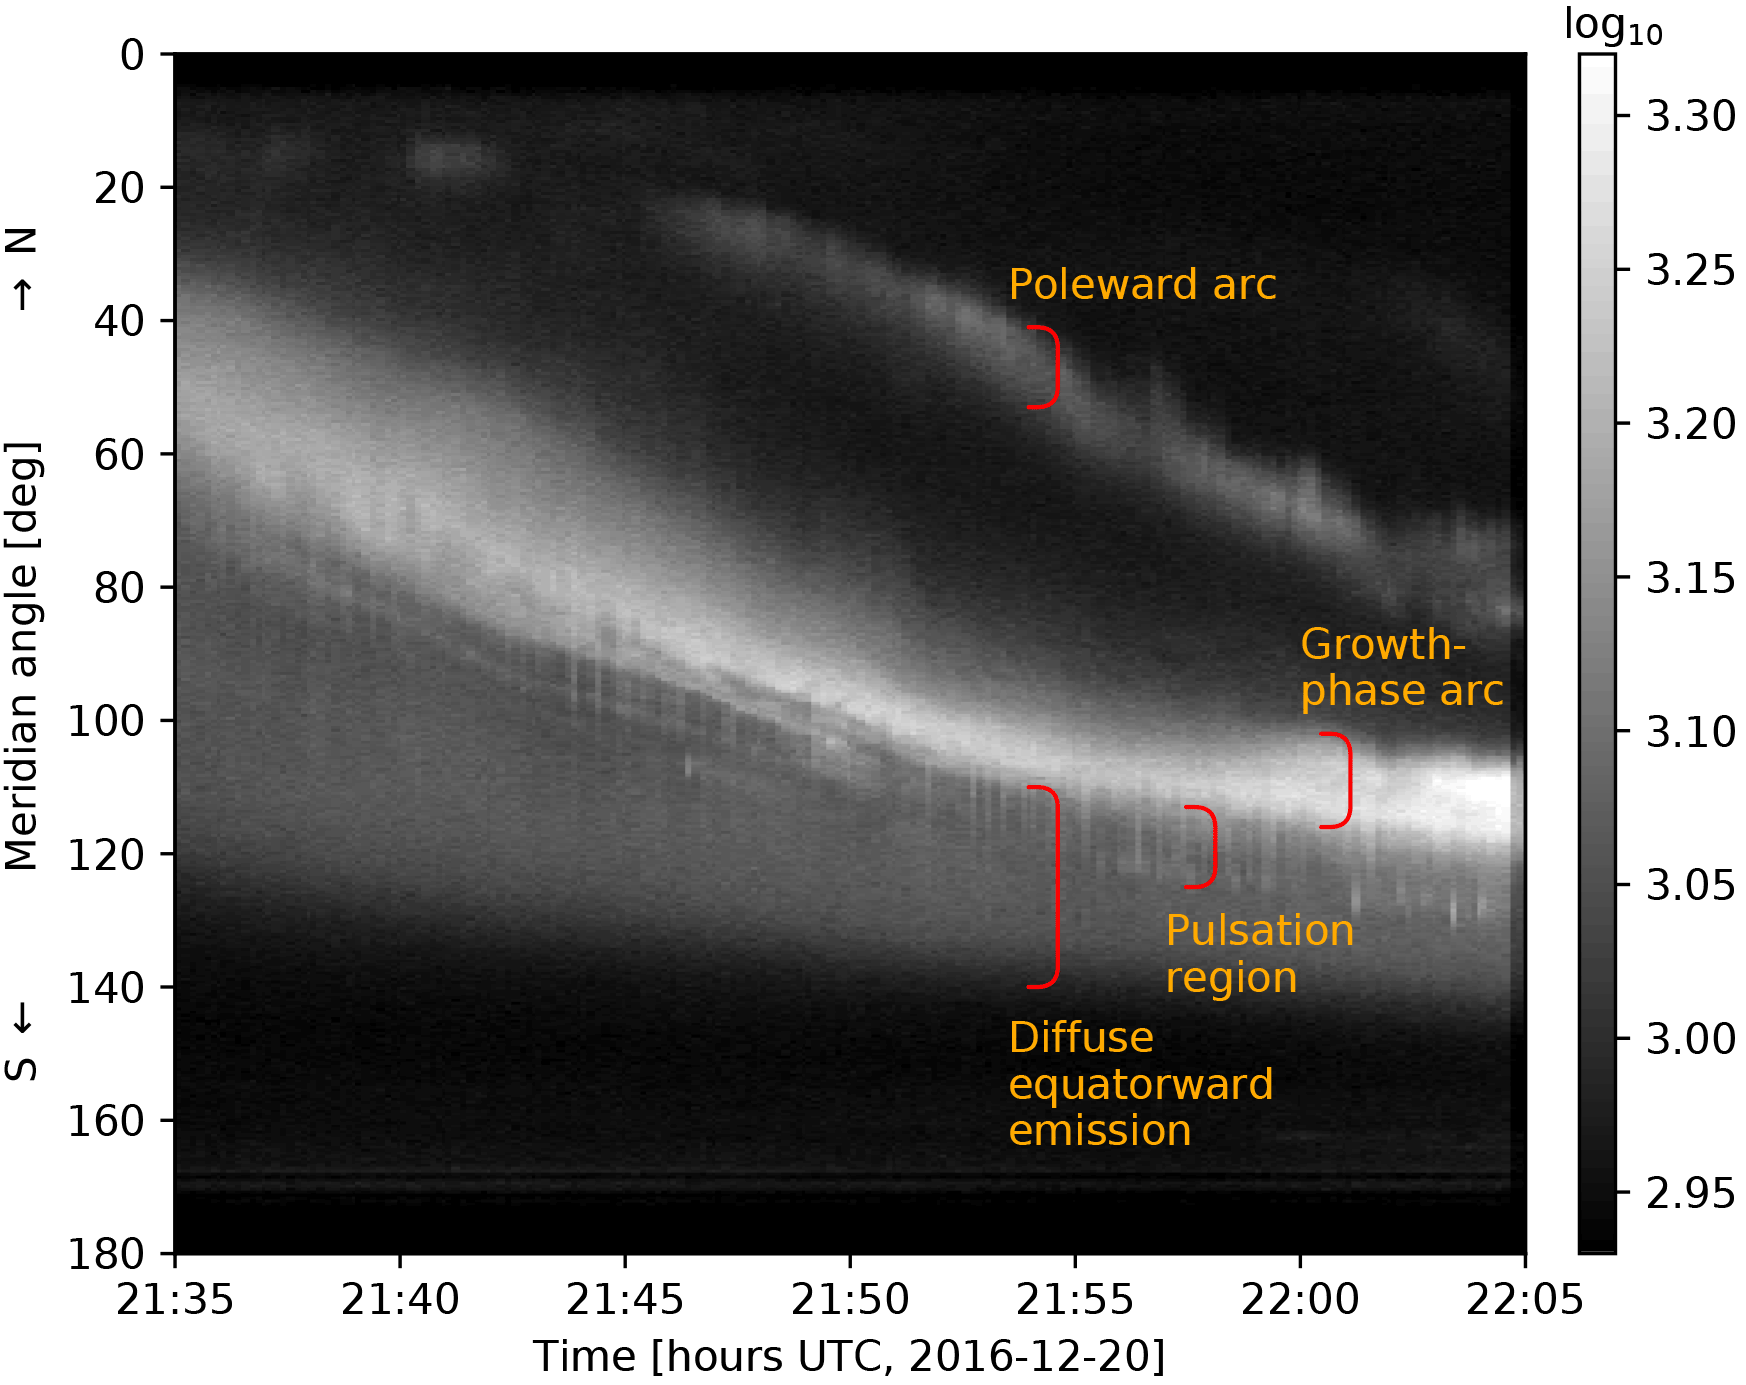
Figure 6High-time-resolution optical keogram, showing pulsating aurora centred meridionally at the location of CNA.
In the growth-phase events studied, the electron precipitation starts at lower northern elevations (corresponding to a region between the mainland and Bjørnøya, latitude 70–75∘ N) approximately 1 h before the auroral breakup. As some parts of the initial phases of the substorm are beyond the northern horizon of the instrument it is not possible to investigate the genesis of the signals. However, during the subsequent evolution, the features move southwards and into the field of view of the instrumentation. An east–west elongated region of CNA occurs off the equatorward edge of the growth-phase arc. Optical pulsating aurora are seen during the growth phase in the same location as where this CNA band occurs. There is no CNA associated with a second, poleward optical arc. This suggests that one plausible mechanism of the wave–particle interaction is located in the magnetosphere connected to the equatorward side of the most-equatorward arc. Wave–particle interaction seems not to work at the equatorward side of the poleward arc.
Lessard et al. (2007) used 486.1 nm emission (Hβ) as a proxy for high-energy precipitation, instead of riometry. They substantiate this with satellite measurements. Use of 486.1 nm permits detection of the entire diffuse aurora region and led them to the conclusion of the overlapping boundary zone. Proton aurora can also cause 557.7 nm O(1S) emission, thus the main growth-phase arc could be contaminated with proton aurora contributions. In this study, CNA is only seen equatorward of the edge of the bright optical arc. The CNA is not seen in the optical arc itself and the pulsating aurora is only seen in the region where the CNA occur. This study does not show the poleward boundary of the diffuse region because of the bright optical arc.
Lessard et al. (2007) reported latitudinal separations between the peak 486.1 and 557.7 nm emission of 1, 1, 0.5–1.5, and 0∘, for the four events they considered. This corresponds to a mean dislocation of 85±14 km. It is greater than the median value derived from Fig. 5, but there is a difference in the measurement technique and the number of events examined was small.
The planetary Kp values during the events in this work (range 0–2) are consistent with earlier statistical studies (e.g. Oguti et al., 1981). Expansion/recovery-phase pulsations are mainly observed in magnetically moderate conditions with the tendency of fast solar wind driving (Partamies et al., 2017). Apart from the high solar wind speed, the events listed in Table 2 have similar conditions. It is therefore possible that pulsating growth-phase aurora are not only associated with extreme solar wind conditions.
Although pulsations in CNA during the recovery phase have been reported before (Grandin et al., 2017), no evidence of CNA pulsations are seen in any of the growth-phase events reported in this study. One possible reason is that the pulsation region is relatively narrow in latitude in the growth phase. If observing across field lines, then different regions with different pulsation signatures may interfere with each other masking the effect. Although optical pulsating aurora is considered to be a thin horizontal layer of emission, the electrons contributing to the CNA are not necessarily limited to a single altitude in the D region, and absorption occurs over a range of heights (Kero et al., 2014). Another limitation is the coarse angular resolution of the KAIRA. The optical pulsating patches are relatively narrow and will not fill the beam, thus being more difficult to detect.
It cannot be ruled out that the conditions for pulsations in the growth-phase case are dissimilar to cases of optical pulsating aurora seen in later substorm phases and the structures may be of different sizes between the growth and recovery cases.
It is suggested that the cause of the CNA equatorward of the main arc is a low population density of high-energy particles. These seed particles are from the equatorial plasma sheet, which have been supplied to the radiation belts from previous substorms and have been redistributed through radial diffusion. The driving mechanism of the pulsations is chorus waves (Thorne et al., 2010). As these are also reported to occur in the evening sector, we conclude that the chorus wave mechanism would apply in the growth phase, thus possibly causing the optical pulsating aurora seen in association with the growth-phase arc.
The results in this study reaffirm the 60–90 min time period prior to the onset when CNA is seen with that reported in previous studies (e.g. Pytte et al., 1976; Ranta et al., 1981; Jussila et al., 2004). The onset time in the CNA sometimes lags the magnetic onset, although it is undetermined if this effect is temporal or spatial (Lessard et al., 2007). However, improvements are made over early works by use of imaging riometry, as opposed to single-beam riometers. Better clarification of the processes is provided by this work in comparison to the two events studied by Jussila et al. (2004). In the 7 December 1999 case in Jussila et al. (2004), the examined growth-phase arc was not isolated, but a complex recurring substorm event. Therefore, it is difficult to prove if there is a proper growth phase and thus conclude it is growth-phase precipitation alone.
In the 8 April 1998 case given by Jussila et al. (2004), the event was weak and the arc was not followed, thus precluding conclusion regarding the growth-phase arc environment. None of these previous studies report optical pulsating aurora in the growth phase. Because the pulsations in the growth phase occur during slowly evolving conditions, it is possible to conclude that the source of the particles is the natural loss from the magnetic confinement of the field constraining the outer radiation belt.
The source of the particles can be the same in pre- and post-onset optical pulsating aurorae. In the pre-onset case, pulsations are driven by chorus propagating through the outer radiation belt. The expanding auroral oval (mapped to the magnetic equator) corresponds to the eroding of the belt, encroaching on the pulsating particle populations. The source of the growth-phase precipitation may be the high-energy part of the plasma sheet electrons. Thus, the equatorward movement of the precipitation region should correspond to the observed movement of the outer and inner borders of the plasma sheet. In the post-onset environment, the material from the magnetotail, injected by the substorm, mixes with the pulsating populations, resulting in a large spatial distribution.
One of the limitations of this study is the coarse angular resolution of the riometer. This could be overcome by using longer baselines, although this requires considerable investment in the facility or new instrumentation. To a lesser extent, improvements could be made using higher frequencies (although at the cost of sensitivity, which is already close to the riometer limits). Another improvement that could be made is sampling the optical emission with fast time cadences, permitting better characterization of the growth-phase pulsations. High-resolution imaging of proton and electron emissions would allow determination of the exact location of the optical pulsating aurora with respect to the proton band. An extensive study on the differences between growth-phase and recovery-phase pulsating aurora is warranted.
Before an isolated substorm, auroral emission comprises a diffuse optical component extending east–west with a bright arc on the poleward edge and CNA arc on the boundary between the bright and diffuse emission. The bright emission and CNA appear 60–90 min before the substorm onset and drift equatorward. In this work a census of growth-phase arcs was conducted, comparing optical keograms from the Kilpisjärvi all-sky camera and riometric keograms made using the KAIRA radio telescope. The observations of this study are summarized as follows:
-
CNA appears on the border between the diffuse emission region and the bright arc. This CNA is consistently equatorward of the discrete arc, but still contained within the region of diffuse aurora.
-
Optical pulsations are seen in the border region between the diffuse emission region and the equatorward side and the bright growth-phase arc on the poleward. CNA is detected in the same region.
-
There is no evidence of pulsations in the CNA.
-
Once the equatorward drift starts, it proceeds at constant speed, with uniform separation between the growth-phase arc and CNA of 40±10 km.
These results are significant because optical pulsating aurora have hitherto been associated with the post-onset phase of the substorm. While it is true that the pulsations seen in those periods are more prominent than those seen in the growth phase, the growth-phase case is not disturbed by turbulent magnetic conditions, thus allowing the source of the pulsation-generating particles to be constrained. This, in turn, will assist the pinpointing the mechanism of optical pulsating aurora in the expansion and recovery phases. It also means that the occurrence of high-energy precipitation may be much higher than previously thought if the growth phases also regularly contribute.
The interferometric riometry images and keograms are based
on cross-correlation statistics data, which are available on request from the
Head of Observations, Sodankylä Geophysical Observatory,
http://www.sgo.fi/KAIRA. FMI ASC keograms are available online at
http://www.space.fmi.fi/MIRACLE and all-sky images are available upon
request from the MIRACLE PI. Magnetic coordinates and directions were
determined using the aacgmv2 Python libraries and the US Dept. of
Commerce, NOAA National Geophysical Data Center online services,
https://www.ngdc.noaa.gov/geomag-web/. Magnetic data used were from the
online data service of Tromsø Geophysical Observatory, Norway. Public Kp
data are provided at the GeoForschungsZentrum (GFZ), Germany,
http://www.gfz-potsdam.de/en/kp-index/. Solar wind data are from the ACE
Satellite – Solar Wind Electron Proton Alpha Monitor, provided by NOAA,
Space Weather Prediction Center, http://www.swpc.noaa.gov/. The
kartapaikka mapping server is provided by the National Land Survey
of Finland http://www.maanmittauslaitos.fi/.
The authors declare that they have no conflict of interest.
The authors wish to thank Björn Gustavsson, Tuula Paavilainen,
Kirsti Kauristie and Antti Kero for their comments and discussion. We also
thank Shin-ichiro Oyama and an anonymous reviewer for their evaluation
of the work and suggestions for improvement. KAIRA was funded by the
University of Oulu and the FP7 European Regional Development Fund and is
operated by Sodankylä Geophysical Observatory with assistance from the
University of Tromsø, Norway. We thank the institutes who maintain the
IMAGE Magnetometer Array and the Finnish Meteorological Institute for their
operation of the FMI-ASC camera network. Derek McKay and Juha Vierienen are
supported by the Tromsø Research Foundation. Noora Partamies is supported
by the Research Council of Norway under CoE contract 223252. The support of
Rutherford Appleton Laboratory, UK, and Kilpisjärvi Biological Station of
the University of Helsinki, Finland, is also acknowledged.
The topical editor, Keisuke Hosokawa, thanks
Shin-ichiro Oyama and one anonymous referee for help in evaluating this
paper.
Brekke, A.: On the correlation between pulsating aurora and cosmic radio noise absorption, Planet. Space Sci., 19, 891–896, https://doi.org/10.1016/0032-0633(71)90140-1, 1971. a
Fukunishi, H.: Dynamic relationship between proton and electron auroral substorms, J. Geophys. Res., 80, 553–574, https://doi.org/10.1029/JA080i004p00553, 1975. a
Grandin, M., Kero, A., Partamies, N., McKay, D., Whiter, D., Kozlovsky, A., and Miyoshi, Y.: Observation of pulsating aurora signatures in cosmic noise absorption data, Geophys. Res. Lett., 44, 5292–5300, https://doi.org/10.1002/2017GL073901, 2017. a, b
Johansen, O. E.: Variations in energy spectrum of auroral electrons detected by simultaneous observation with photometer and riometer, Planet Space Sci., 13, 225–235, https://doi.org/10.1016/0032-0633(65)90072-3, 1965. a
Jussila, J. R. T., Aikio, A. T., Shalimov, S., and Marple, S. R.: Cosmic radio noise absorption events associated with equatorward drifting arcs during a substorm growth phase, Ann. Geophys., 22, 1675–1686, https://doi.org/10.5194/angeo-22-1675-2004, 2004. a, b, c, d, e
Kataoka, R., Fukuda, Y., Miyoshi, Y., Miyahara, H., Itoya, S., Ebihara, Y., Hampton, D., Dahlgren, H., Whiter, D., and Ivchenko, N.: Compound auroral micromorphology: ground-based high-speed imaging, Earth Planets Space, 67, 23, https://doi.org/10.1186/s40623-015-0190-6, 2015. a
Kero, A., Vierinen, J., McKay-Bukowski, D., Enell, C.-F., Sinor, M., Roininen, L., and Ogawa, Y.: Ionospheric electron density profiles inverted from a spectral riometer measurement, Geophys. Rev. Lett., 41, 5370–5375, https://doi.org/10.1002/2014GL060986, 2014. a, b
Kvifte, G. J. and Pettersen, H.: Morphology of the pulsating aurora, Planet Space Sci., 17, 1599–1607, https://doi.org/10.1016/0032-0633(69)90148-2, 1969. a
Lessard, M. R., Lotko, W., LaBelle, J., Peria, W., Carlson, C. W., Creutzberg, F., and Wallis, D. D.: Ground and satellite observations of the evolution of growth phase auroral arcs, J. Geophys. Res.-Space, 112, A09304, https://doi.org/10.1029/2006JA011794, 2007. a, b, c, d, e, f
McKay, D., Fallows, R., Norden, M., Aikio, A., Vierinen, J., Honary, F., Marple, S., and Ulich, T.: All-sky interferometric riometry, Radio Sci., 50, 1050–1061, https://doi.org/10.1002/2015RS005709, 2015. a
McKay, D., Partamies, N., and Kauristie, K.: Acquisition of optical and riometric keograms for studying auroral electron precipitation, in: XVIII Geofysiikan Päivät, Geofysiikan seura r.y., 35–38, available at: https://geofysiikanseura.yhdistysavain.fi/@Bin/174016/GFP2017_kirja.pdf (last access: 13 January 2018), 2017. a, b
McKay-Bukowski, D., Vierinen, J., Virtanen, I. I., Fallows, R., Postila, M., Ulich, T., Wucknitz, O., Brentjens, M., Ebbendorf, N., Enell, C., Gerbers, M., Grit, T., Gruppen, P., Kero, A., Iinatti, T., Lehtinen, M., Meulman, H., Norden, M., Orispää, M., Raita, T., de Reijer, J. P., Roininen, L., Schoenmakers, A., Stuurwold, K., and Turunen, E.: KAIRA: The Kilpisjärvi Atmospheric Imaging Receiver Array – System Overview and First Results, IEEE T. Geosci. Remote Sens., 53, 1440–1451, https://doi.org/10.1109/TGRS.2014.2342252, 2015. a
McPherron, R. L.: Growth phase of magnetospheric substorms, J. Geophys. Res., 75, 5592, https://doi.org/10.1029/JA075i028p05592, 1970. a
Miyoshi, Y., Sakaguchi, K., Shiokawa, K., Evans, D., Albert, J., Connors, M., and Jordanova, V.: Precipitation of radiation belt electrons by EMIC waves, observed from ground and space, Geophys. Res. Lett., 35, L23101, https://doi.org/10.1029/2008GL035727, 2008. a
Motoba, T., Hosokawa, K., Kadokura, A., and Sato, N.: Magnetic conjugacy of northern and southern auroral beads, Geophys. Res. Lett., 39, L08108, https://doi.org/10.1029/2012GL051599, 2012. a
Nishimura, Y., Bortnik, J., Li, W., Thorne, R. M., Lyons, L. R., Angelopoulos, V., Mende, S. B., Bonnell, J. W., Le Contel, O., Cully, C., Ergun, R., and Auster, U.: Identifying the Driver of Pulsating Aurora, Science, 330, 81–84, https://doi.org/10.1126/science.1193186, 2010. a
Oguti, T., Kokubun, S., Hayashi, K., Tsuruda, K., Machida, S., Kitamura, T., Saka, O., and Watanabe, T.: Statistics of pulsating auroras on the basis of all-sky TV data from five stations. I – Occurrence frequency, Can. J. Phys., 59, 1150–1157, https://doi.org/10.1139/p81-152, 1981. a, b
Ono, T., Hirasawa, T., and Meng, C. I.: Proton auroras observed at the equatorward edge of the duskside auroral oval, Geophys. Res. Lett., 14, 660–663, https://doi.org/10.1029/GL014i006p00660, 1987. a
Partamies, N., Whiter, D., Kadokura, A., Kauristie, K., Nesse Tyssøy, H., Massetti, S., Stauning, P., and Raita, T.: Occurrence and average behavior of pulsating aurora, J. Geophys. Res.-Space, 122, 5606–5618, https://doi.org/10.1002/2017JA024039, 2017. a
Pytte, T., Trefall, H., Kremser, G., Jalonen, L., and Riedler, W.: On the morphology of energetic /not less than 30 keV/electron precipitation during the growth phase of magnetospheric substorms, J. Atmos. Terr. Phys., 38, 739–755, https://doi.org/10.1016/0021-9169(76)90112-4, 1976. a, b
Ranta, H., Ranta, A., Collis, P. N., and Hargreaves, J. K.: Development of the auroral absorption substorm – Studies of pre-onset phase and sharp onset using an extensive riometer network, Planet. Space Sci., 29, 1287–1313, https://doi.org/10.1016/0032-0633(81)90095-7, 1981. a, b
Royrvik, O. and Davis, T. N.: Pulsating aurora – Local and global morphology, J. Geophys. Res., 82, 4720–4740, https://doi.org/10.1029/JA082i029p04720, 1977. a
Sangalli, L., Gustavsson, B., Partamies, N., and Kauristie, K.: Estimating the peak auroral emission altitude from all-sky images, Opt. Pura Apl., 44, 593–598, 2011a. a
Sangalli, L., Partamies, N., Syrjäsuo, M., Enell, C.-F., Kauristie, K., and Mäkinen, S.: Performance study of the new EMCCD-based all-sky cameras for auroral imaging, Int. J. Remote Sens., 32, 2987–3003, https://doi.org/10.1080/01431161.2010.541505, 2011b. a
Shain, C. A.: Galactic Radiation at 18.3 Mc/s, Aust. J. Sci. Res. Ser. A, 4, 258–267, 1951. a
Swift, D. W.: Auroral mechanisms and morphology, Rev. Geophys. Space Phys., 17, 681–696, https://doi.org/10.1029/RG017i004p00681, 1979. a
Tanskanen, E. I.: A comprehensive high-throughput analysis of substorms observed by IMAGE magnetometer network: Years 1993-2003 examined, J. Geophys. Res.-Space, 114, A05204, https://doi.org/10.1029/2008JA013682, 2009. a, b, c, d, e, f, g
Thorne, R. M., Ni, B., Tao, X., Horne, R. B., and Meredith, N. P.: Scattering by chorus waves as the dominant cause of diffuse auroral precipitation, Nature, 467, 943–946, https://doi.org/10.1038/nature09467, 2010. a, b, c
Wing, S., Gkioulidou, M., Johnson, J. R., Newell, P. T., and Wang, C.-P.: Auroral particle precipitation characterized by the substorm cycle, J. Geophys. Res.-Space, 118, 1022–1039, https://doi.org/10.1002/jgra.50160, 2013. a, b, c