the Creative Commons Attribution 4.0 License.
the Creative Commons Attribution 4.0 License.
 | 06 Mar 2018
Aerosol indirect effects on summer precipitation in a regional climate model for the Euro-Mediterranean region
Nicolas Da Silva
Sylvain Mailler
Philippe Drobinski
Aerosols affect atmospheric dynamics through their direct and semi-direct effects as well as through their effects on cloud microphysics (indirect effects). The present study investigates the indirect effects of aerosols on summer precipitation in the Euro-Mediterranean region, which is located at the crossroads of air masses carrying both natural and anthropogenic aerosols. While it is difficult to disentangle the indirect effects of aerosols from the direct and semi-direct effects in reality, a numerical sensitivity experiment is carried out using the Weather Research and Forecasting (WRF) model, which allows us to isolate indirect effects, all other effects being equal. The Mediterranean hydrological cycle has often been studied using regional climate model (RCM) simulations with parameterized convection, which is the approach we adopt in the present study. For this purpose, the Thompson aerosol-aware microphysics scheme is used in a pair of simulations run at 50 km resolution with extremely high and low aerosol concentrations. An additional pair of simulations has been performed at a convection-permitting resolution (3.3 km) to examine these effects without the use of parameterized convection.
While the reduced radiative flux due to the direct effects of the aerosols is already known to reduce precipitation amounts, there is still no general agreement on the sign and magnitude of the aerosol indirect forcing effect on precipitation, with various processes competing with each other. Although some processes tend to enhance precipitation amounts, some others tend to reduce them. In these simulations, increased aerosol loads lead to weaker precipitation in the parameterized (low-resolution) configuration. The fact that a similar result is obtained for a selected area in the convection-permitting (high-resolution) configuration allows for physical interpretations. By examining the key variables in the model outputs, we propose a causal chain that links the aerosol effects on microphysics to their simulated effect on precipitation, essentially through reduction of the radiative heating of the surface and corresponding reductions of surface temperature, resulting in increased atmospheric stability in the presence of high aerosol loads.
Keywords. Atmospheric composition and structure (aerosols and particles)
- Article
(1750 KB) - Full-text XML
- BibTeX
- EndNote


The hydrological cycle in the Mediterranean is a key environmental and socioeconomic question for a wide region including southern Europe, northern Africa, and the Middle East (Drobinski et al., 2014). The Mediterranean climate is characterized by hot summers and mild winters, and by the fact that wintertime is much more rainy than summertime. Historically, it has been proposed to define the Mediterranean climate by the criterion that wintertime precipitation total exceeds 3 times the summertime precipitation total (Köppen and Geiger, 1936). Xoplaki et al. (2004) show that wintertime precipitation accounts for at least 50–60 % of the total annual rainfall in the western and northern parts of the Mediterranean basin and up to 70–90 % in the southern and eastern parts.
There is a need for better understanding precipitation variability, including intensity and frequency, in the Mediterranean region. This is one of the main objectives of the HyMeX (Hydrological cycle in the Mediterranean Experiment) international program (Drobinski et al., 2014). Regional climate models (RCMs) have frequently been used for that purpose (Lionello and Giorgi, 2007; Somot et al., 2008; Flaounas et al., 2013; Berthou et al., 2014; Drobinski et al., 2016, 2017) with horizontal scales ranging from 20 to 50 km and parameterized convection. While direct effects of aerosol have already been examined on the regional scale over the Mediterranean (Nabat et al., 2015, 2016), these simulations do not usually take into account the indirect effects of aerosols. Therefore, the present study aims at exploring the possible impacts of aerosol indirect effects in such models on precipitation over that region. For that purpose, we perform a pair of simulations using the WRF (weather research and forecasting model version 3.7.1; Skamarock et al., 2008) at a 50 km resolution which is within the range of the typical long-term regional climate simulations, with the Kain (2004) convection scheme and the Thompson and Eidhammer (2014) aerosol-aware microphysics. One simulation is forced with extremely strong concentrations of cloud condensation nuclei (CCN), and the other one with extremely low concentrations. The use of this configuration permits us to disconnect the direct effect of the aerosols from their indirect effect, thereby isolating the indirect effect of aerosols on precipitation in a RCM for the Mediterranean area. The processes governing precipitation occurrence markedly differ between wintertime and summertime: while large-scale stratiform precipitation largely dominates wintertime precipitation, the contribution of small-scale convective precipitation is significant in summertime. Therefore, restricting the focus of the study to summertime precipitation permits us to examine in a more detailed way the processes and causal chains by which the indirect effect of the aerosols affect precipitation, allowing to examine both large-scale and parameterized precipitation. As the representation of precipitation in RCMs is very sensitive to the choice of the convection scheme (Di Luca et al., 2014), and also because it has been found that the use of parameterized convection might hinder the correct representation of the microphysical effects of the aerosols (Khain et al., 2015), two additional simulations for a smaller domain at a convection-permitting resolution (3.3 km) have been performed (HR for high resolution). These two simulations allow us to check that the effects observed in the two low resolution (LR) simulations are not mere artifacts of the convection scheme, and also to examine how the aerosol indirect effect affects summertime precipitation in a convection-permitting model.
The Mediterranean area is an area in which it is particularly important to include all aerosol effects in RCM studies because it is located at the crossroads of air masses carrying strong concentrations of both natural and anthropogenic aerosols (Lelieveld et al., 2002; Rea et al., 2015). Natural sources are mineral dust from arid areas, secondary organic aerosols due to biogenic emissions, biomass burning, volcanic emissions, and sea-salt emissions. Anthropogenic sources are mainly due to fossil fuel burning by industrial facilities, power plants, vehicles, and ships, as well as agricultural processes (Querol et al., 2009).
Apart from their direct radiative effect (Schulz et al., 2009; Myhre et al., 2009; Loeb and Su, 2010; Su et al., 2013; Myhre et al., 2013), interactions between aerosols and cloud water and ice occur through several processes. Aerosols act as nuclei for the formation of cloud water and ice, changing the number and size of the cloud droplets and ice particles, which affects the atmospheric physics and dynamics in several ways. Aerosols have been hypothesized to increase the liquid water content, the lifetime of clouds, and cloud height through a decrease in droplet radius and the corresponding decrease of the precipitation efficiency (Charlson et al., 1987; Radke et al., 1989; Pincus and Baker, 1994; Rosenfeld, 2000), an effect often called the Albrecht effect (Albrecht, 1989). However, recent studies suggest that the Albrecht effect on liquid water content could be compensated by enhanced evaporation and dry air entrainment (Small et al., 2009; Seifert et al., 2015). Such an effect may depend on cloud types and properties (Fan et al., 2016) and on the microphysics scheme (Zhou and Penner, 2017). Another process known as the Twomey effect refers to increased cloud optical depth (COD) with increased aerosol concentrations due to the diminished droplet radius and increased droplet number (Twomey, 1977). Under certain conditions, aerosols may also invigorate deep convective clouds by increasing the release of latent energy (Rosenfeld et al., 2008).
Indirect effects are not as well understood as direct effects because many different physical processes are involved and partly compensate each other (Stevens and Feingold, 2009). The buffered characteristic of clouds has been diagnosed in several aerosol indirect effect studies (Fan et al., 2013; Grabowski and Morrison, 2011; Morrison and Grabowski, 2011; Seifert et al., 2012; van den Heever et al., 2011). In numerical simulation, Seifert et al. (2012) observed compensations between several of these feedbacks, which explained a reduced overall aerosol indirect effect on summertime precipitation over Germany. Although similar to our HR simulations, they used day-by-day simulations and on a rather small domain, which potentially prevents the long-term effects described by Fan et al. (2013) from being captured. Our simulation domain and duration are large enough for such behaviors to be possibly observable.
Among them, there is the aerosol cooling effect on the surface caused by reduced solar energy reaching the surface with increased aerosol concentrations. This cooling can be due to the direct effect of the aerosols or to their indirect effects. Surface cooling due to aerosol effects and the consecutive reduction of precipitation have been mostly described on the global scale by studies such as Ramanathan et al. (2001), Salzmann et al. (2014), Bollasina et al. (2011), and by Lelieveld et al. (2002) for the Mediterranean area. On the cloud-resolving scale, the effect on precipitation of the surface cooling due to the indirect effect of aerosols has been studied by Seifert et al. (2012) and Fan et al. (2013). Both of these studies find a surface cooling due to the aerosol indirect effect, with weak effects on precipitation in spite of the stabilization of the atmospheric columns. Morrison and Grabowski (2011) examine the stabilization of the atmosphere due to upper-tropospheric warming as a consequence of the aerosol indirect effects, yielding a small reduction of precipitation. However, stabilization of the atmospheric column does not always cause a reduction of precipitation, since this effect is in competition with the invigoration effect discussed by Fan et al. (2013). This aerosol invigoration effect has been shown to potentially enhance precipitation in certain conditions but cannot act on the global overall amount of precipitation since it does not modify the evaporation flux.
Observational studies of these effects are hindered by the fact that observations can not easily separate the aerosol indirect effects from other effects (Denman et al., 2007); therefore, global or regional models can be used for this purpose. However, quite often, such studies are performed by changing aerosol concentrations simultaneously in the radiative and microphysical schemes of the model, which does not permit us to separate direct and indirect effects from each other. This is the case for studies performed with high-resolution models (Fan et al., 2012; Li et al., 2008; Lerach et al., 2008; Lynn et al., 2005; van den Heever and Cotton, 2007) or low-resolution climate models (Lohmann et al., 2007; Song and Zhang, 2011; Jacobson, 2001). In the present study, as discussed above, we will use the model configurations to modulate the aerosol indirect effects without affecting the aerosol direct effects.
Section 2 details the configuration of the WRF model used and the simulations that have been performed for this sensitivity analysis. Section 3 analyses the sensitivity experiment in both the HR and LR simulations, and compare their sensitivities to the change in CCN concentration. Section 4 discusses the results and proposes a synthesis of the various processes and interrelations involved in the aerosol indirect effects on the Mediterranean summer precipitation.
The model used in this study is version 3.7.1 of the Weather Research and Forecasting model (WRF). WRF is a non-hydrostatic limited-area model with mass coordinate vertical discretization designed to serve both operational and research needs (Skamarock et al., 2008). The WRF simulations presented here have been performed with a 50 km (LR) and a 3.3 km (HR) horizontal resolution and 33 vertical layers from the surface to 50 hPa, with about 8 levels in the lowest 1000 m of the atmosphere. The simulation domain is shown in Fig. 1. The Global Forecast System (GFS) model (National Centers for Environmental Prediction National Weather Service, 2000) provided the initial and lateral conditions updated every 6 h, with a 1∘ resolution in longitude and latitude. A Newtonian-type nudging with relaxation towards GFS analysis data and a coefficient of s−1 has been applied for temperature, humidity, geopotential, and velocity components, as recommended by Salameh et al. (2010) and Omrani et al. (2013, 2015).
The sea surface temperature (SST) is provided by GFS. The geographical data are from 5′ resolution United States Geophysical Survey data. Soil type is based on a combination of the 10′ resolution, 17 category United Nations Food and Agriculture Organization soil data and US State Soil Geographic 10′ soil data. The set of parameterizations used for these simulations include the improved Mellor–Yamada closure scheme (MYNN; Nakanishi, 2000, 2001; Nakanishi and Niino, 2004, 2006) for the boundary layer. The surface layer is the revised Monin–Obukov scheme (Jiménez et al., 2012). The microphysics scheme is the most important for this study. The new Thompson and Eidhammer “aerosol-aware” formulation (Thompson and Eidhammer, 2014) has been chosen for its ability to explicitly represent cloud droplet nucleation and ice activation by aerosols. The scheme gives one-moment prediction (mass mixing ratio) for snow, and a hybrid graupel–hail category and two-moment predictions (mass mixing ratio and number concentration) for cloud water, cloud ice, rain, and aerosols. The latter are divided into two categories depending on their capacity to serve as CCN (“water friendly aerosol”, WFA) or ice nuclei (“ice friendly aerosol”, IFA). During model integration, the number of WFA (NWFA) and the number of IFA (NIFA) are advected and diffused exactly as other scalars. Aerosol number concentration is initialized and forced at domain boundaries by a climatology. For WFA, a virtual surface emission flux is computed from the horizontal grid spacing and the initial NWFA values to approximately balance the loss of WFA due to nucleation and scavenging, as described in Thompson and Eidhammer (2014). No surface emissions are applied for NIFA. The 2-D tendency field is added at each time step to the first model vertical level NWFA value. The radiation scheme is RRTMG (rapid radiative transfer model for general circulation models; Iacono et al., 2008), which uses the correlated-k approach to calculate longwave fluxes and heating rates efficiently and accurately for application to global climate models. We choose this scheme so that the microphysics scheme can communicate cloud water droplets, ice, and snow effective radii to the radiation scheme, which will then use these values to resolve the equations for radiative transfer in each model column, providing quantities such as shortwave (SW) and longwave (LW) radiative fluxes and the COD. It is important to note at this point that the Tegen et al. (1997) climatology provided to the RRTMG radiative scheme will be unchanged when we perform sensitivity experiments by modifying the microphysical NWFA and NIFA climatologies, which enables us to modulate the indirect aerosol effect without changing the direct aerosol effect.
The convection is parameterized using the Kain (2004) scheme. This scheme triggers convection whenever a given atmospheric layer is diagnosed as unstable, taking into account its temperature and moisture, the temperature gap between the adiabatically lifted atmospheric parcel and its environment at its lowest condensation level (LCL), and the large-scale vertical wind speed. If a given atmospheric layer (60 hPa thick) is diagnosed to be able to reach its LCL given the above-mentioned parameters, then it is released at this altitude with an initial vertical velocity of up to several meters per second, depending on the atmospheric conditions. A Lagrangian parcel method including entrainment, detrainment, and water loading is applied. If the atmospheric parcel is able to raise by at least 3–4 km, convection is triggered, and lasts until when the Convective Available Potential Energy (CAPE) is consumed. It is worth noting that at that point the microphysical effects of aerosols are not taken into account explicitly in this parameterization. However, they can modulate the occurrence and intensity of parameterized convection because they affect the background temperature and moisture profiles through the above-mentioned indirect effects, taken into account by the Thompson and Eidhammer (2014) scheme.
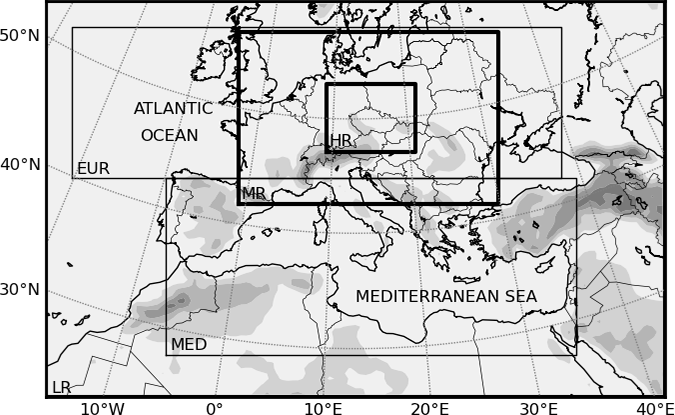
Figure 1Simulation domain with gray-shaded area indicating a topography higher than 500 m. The EUR and MED boxes indicate the regions that will be used below. The Low Resolution domain is the entire map (LR) and the small box inside the EUR box indicate the High Resolution domain (HR).
The model was run with two different NWFA and NIFA microphysical forcings for 6 months covering spring and summer 2013. The two simulations start on 1 April 2013 (after 1 month spin-up) and end on 30 September 2013. We performed two “extreme” simulations in terms of NWFA and NIFA concentrations. In the first simulation, hereafter referred to as MAX or polluted simulation, a very high aerosol emission level is applied (1.75×10⁷ kg s−1 for the whole domain), whereas for the other simulation, hereafter referred to as MIN or pristine simulation, a very low aerosol emission level is applied ( kg s−1 for the whole domain). Although emission rates are extreme between MIN and MAX simulations, the application of the microphysics scheme constrains the range of variation in NWFA to be between ∼10 cm−3 and ∼10 000 cm−3 and of NIFA to be between 0.005 cm−3 and 10 000 cm−3, so that the extreme emission rates imposed in the MAX and MIN simulations only ensure that NIFA and NWFA concentrations in the MAX (resp. MIN) simulation stay close to their maximal (resp. minimal) permitted values, corresponding to a factor of ∼103 for NWFA and for NIFA between the MAX and MIN simulations. These extreme values ensure that aerosol indirect effects emerge from the “natural noise” between MIN and MAX simulations. Except this difference in the NWFA and NIFA concentrations between the MAX and MIN simulations, the configuration of both simulations is strictly the same, so that all the observed differences between the MAX and MIN simulations can be attributed to these different concentrations of NIFA and NWFA.
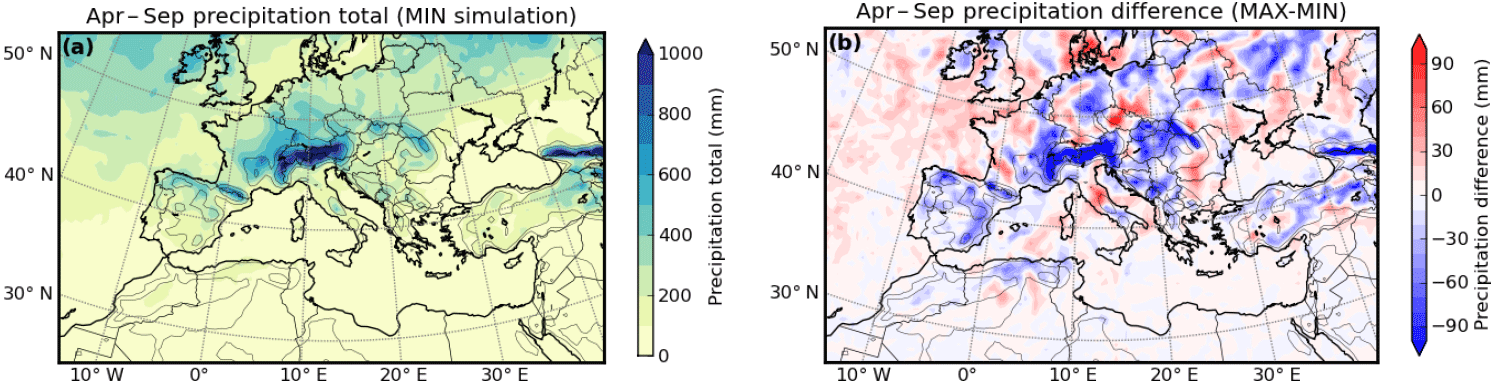
Figure 2Accumulated precipitation (April–September 2013) from the MIN simulation (a) and difference between MAX and MIN simulations of accumulated precipitation (b).
Apart from these two simulations on the LR domain, two companion simulations have been performed at a convection-permitting resolution (3.3 km) on the HR domain, which is a smaller domain (to keep computational cost under control) shown on Fig. 1. The location of the domain was chosen far from the oceans (to avoid sea contamination) and from the edges of the LR domain (to avoid boundary condition contamination). One simulation on this HR domain has been performed with maximal concentrations of NWFA and NIFA, the other one with minimal concentrations. These simulations are forced at their boundaries by the LR MAX and MIN simulations, respectively, through one-way nesting, using an intermediate resolution domain at 16.6 km resolution, also shown in Fig. 1. Due to these successive increases in the resolution by a factor of 5 and then by a factor of 3, each grid cell of the LR domain corresponds to exactly 15×15 grid cells of the HR domain. The configuration of the low-resolution and intermediate resolution simulations is exactly the same. Regarding the high-resolution simulations, the only difference in model configuration is that the Kain (2004) convection scheme is turned off since model horizontal resolution becomes sufficient to explicitly resolve the convection processes.
The analysis of the simulations will be conducted on two distinct sub-domains in Europe (EUR) and the Mediterranean region (MED; see Fig. 1). In the absence of an interactive ocean model, the SST remains prescribed and is the same in both simulations. Therefore, the SST is not in equilibrium with the heat fluxes at the air–sea interface, which is the reason why we will focus all our analyses on atmospheric columns above the continental surface in this study.
3.1 Sensitivity of the LR simulation to the CCN load
Figure 2 displays the geographical pattern of total accumulated precipitation from the MIN simulation. Except for the northeastern part of the Atlantic Ocean, summer precipitation is mostly located over land, particularly over central and eastern Europe as well as over the main mountain ranges. Figure 2 also shows the total accumulated precipitation difference between MAX and MIN simulations (MAX-MIN). Differences are ranging around 5–10 %. Such values are large compared to those found in the study of Thompson and Eidhammer (2014) with the same model and microphysics scheme (the difference between their polluted and clean simulations for a winter cyclone in the USA is 1.1 %). This is as expected because in our study the ratio of aerosol concentrations between our clean and polluted numerical experiments is much larger (103 vs. 10 in Thompson and Eidhammer, 2014). The pattern of accumulated precipitation differences displays neighboring dipoles of positive and negative differences, suggesting compensating effects or shifts in the precipitation maxima.
Let us first evaluate the first indirect aerosol effect and assess its consequences on precipitation. Figure 3 displays downward surface SW, LW, and total radiation differences as a function of COD differences over the continental regions of the EUR and MED domains. The COD is computed using the following simplified equation:
where LWC is the liquid water content, ρw the water density, and Re the droplet radius, and the integral is performed from the surface to the top of atmosphere (or, in our case, from the surface to the model top which is at 50 hPa). Only results for cloud liquid water are shown as results for ice are comparatively negligible. It shows that the effect of this increased COD is twofold, reducing the downward SW radiative flux at the surface (due to increased cloud albedo), but increasing the downward LW radiation due to LW emissions by the optically thicker clouds. However, the effect in the SW band largely dominates the effect in the LW band, leading in our case to a radiative cooling proportional to the change in COD between both simulations. The fact that the modifications of the SW flux dominate those of the LW flux in our study is in line with the findings of Fan et al. (2013) for the United States, China, and the tropical western Pacific. The fact that the modifications of the SW flux dominate those of the LW flux cannot be generalized to all conditions, since the comparison between these two terms depend on several parameters such as the solar zenith angle, surface albedo, cloud optical depth, and cloud altitude, as described by Randall et al. (1984), Stephens and J (1984), Ackerman et al. (1988), and Shupe and Intrieri (2004).
These results are a logical consequence of the Twomey effect, which tends to increase the COD in the presence of stronger concentrations of WFA. On the one side, the increase in the total cross section of cloud droplets leads to higher cloud albedo and therefore to lower downward surface solar radiation. On the other side, the larger the COD, the larger the LW radiation emission by clouds. As discussed before, the difference in surface radiative heating which accounts for both SW and LW radiations remains systematically negative in our study.
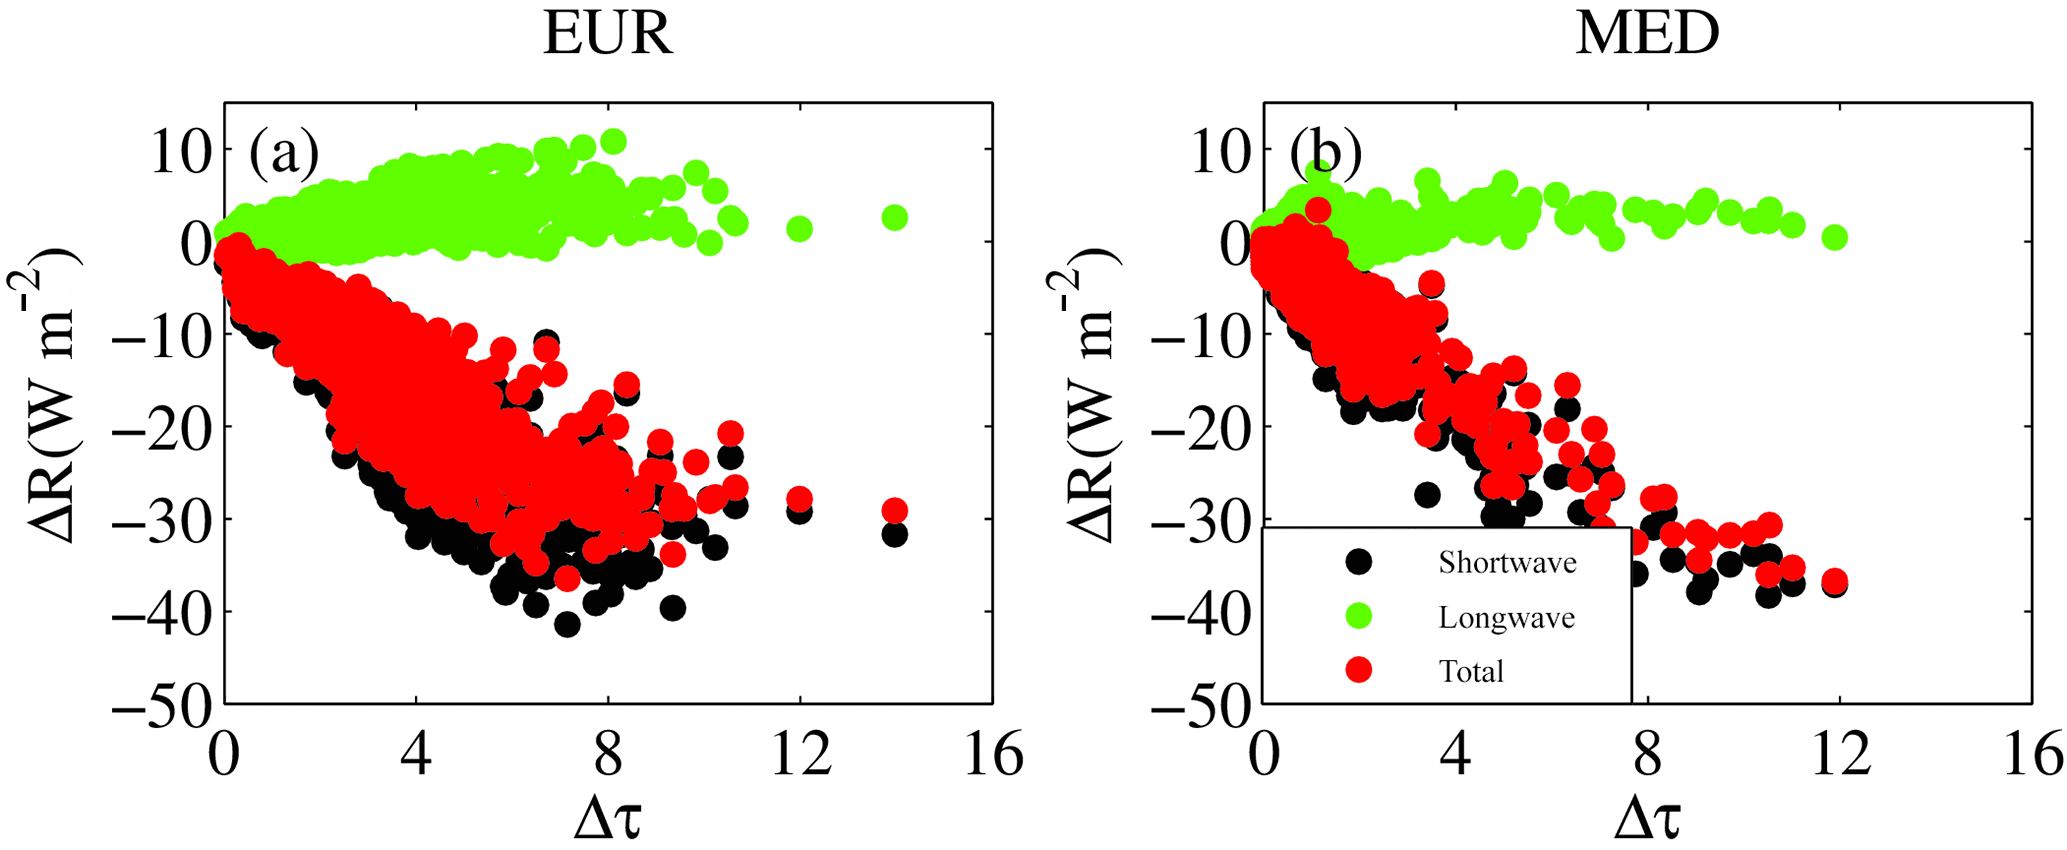
Figure 3Mean downward surface shortwave (ΔRSW, black), longwave (ΔRLW, green), and total (ΔRtot, red) radiation differences as a function of the mean COD difference (Δτ) over the EUR (a) and MED (b) domains.
Let us split total precipitation (ΔPtot∕Ptot) into their explicit (i.e., large-scale; ΔPexpl∕Pexpl) and convective (i.e. parameterized; ΔPconv∕Pconv) components. Figure 4 shows the relative difference between MAX and MIN simulations of convective, explicit, and total precipitation over continent as a function of the fraction of convective precipitation (Pconv∕Ptot) in the EUR and MED domains (Fig. 1). At each grid point in each domain, the relative differences in accumulated convective, explicit, and total precipitation are paired with convective precipitation fraction. The pairs are placed in bins with an equal number of samples in each bin (50 samples) and therefore varying ranges of convective precipitation fraction for each bin. For each bin, the median convective precipitation fraction and median relative precipitation difference are computed. Summer convective precipitation are clearly weakened by the addition of aerosols, while it is the opposite for large-scale precipitation. Similar results are obtained for low precipitation rate (20th percentile) and high precipitation rate (80th percentile; not shown), which therefore confirm the robustness of the results. Figure 4 suggests a compensating effect between explicit and convective precipitation leading to a non-significant difference for total accumulated precipitation. To explain this, a similar pair of simulations have been performed without activating the convection scheme. The analysis of these two simulations also confirm an increase in large-scale precipitation when aerosol concentrations increase, thus discarding the compensating effect (not shown). On the contrary, it suggests an independent positive effect of aerosols on non-convective precipitation.
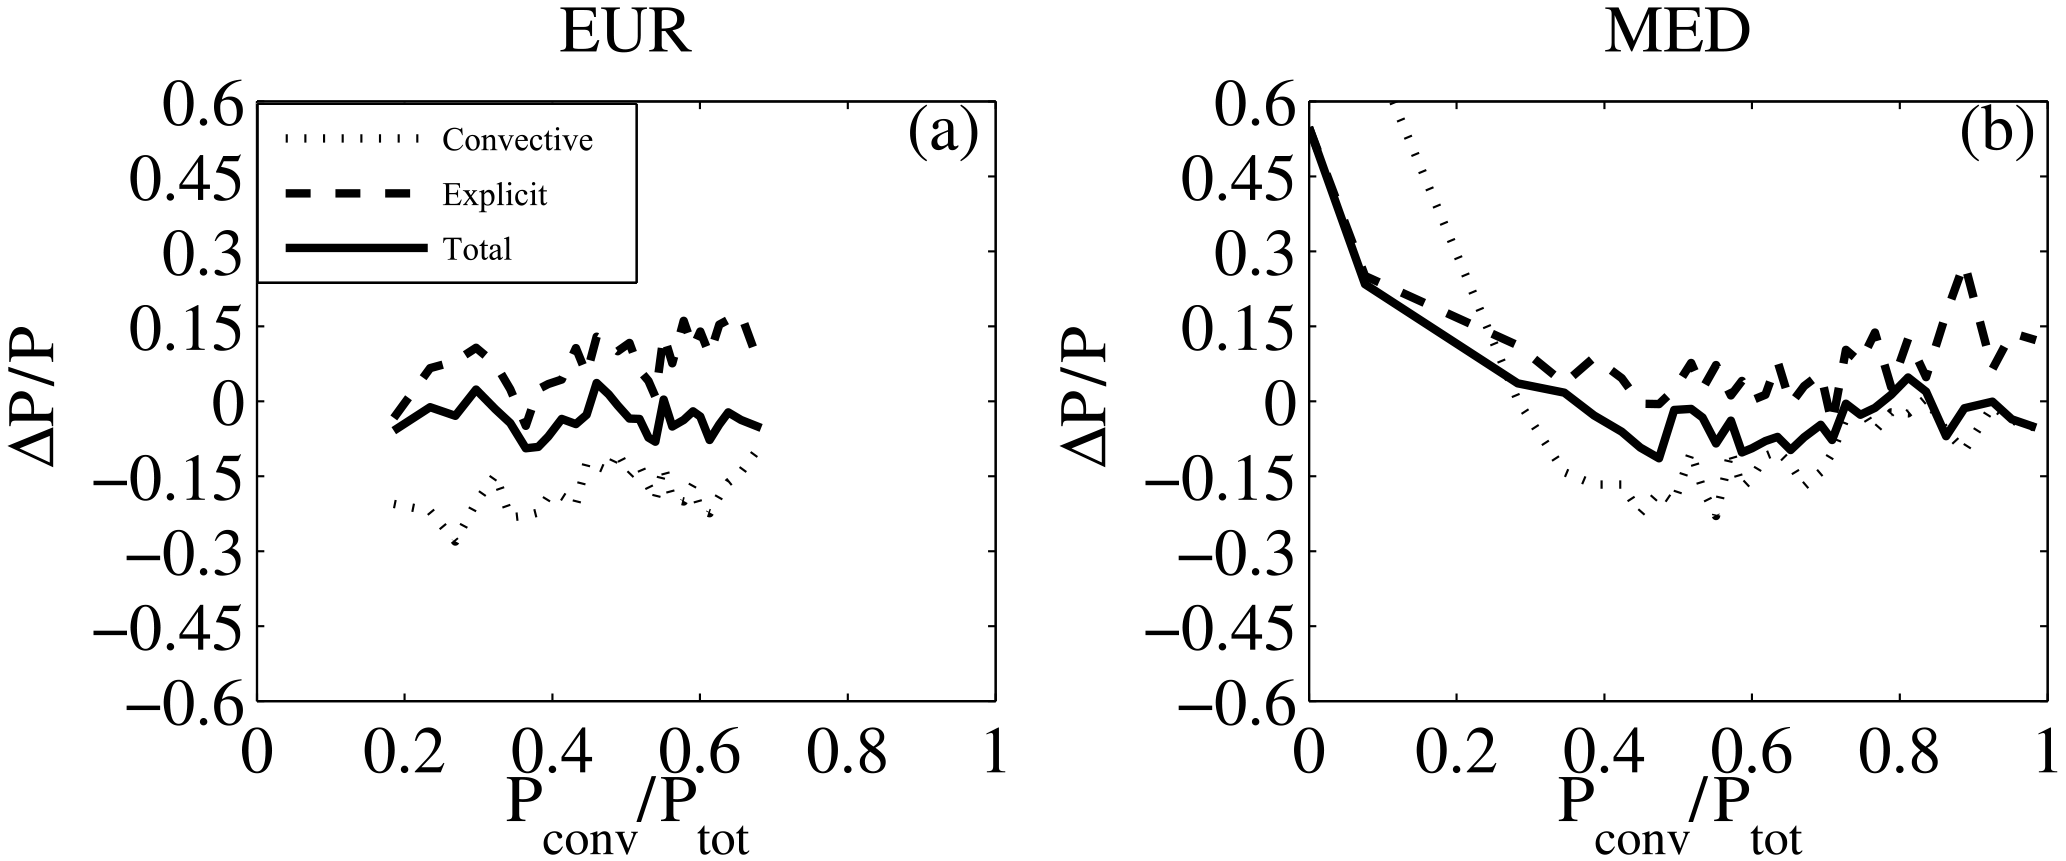
Figure 4Relative difference between the MAX and MIN simulations of continental summer convective (ΔPconv∕Pconv, dotted), not convective (ΔPexpl∕Pexpl, dashed), and total (ΔPtot∕Ptot, solid) accumulated precipitation as a function of convective precipitation fraction (Pconv∕Ptot) over Europe (EUR domain, Fig. 1) (a) and the Mediterranean region (MED domain, Fig. 1) (b).
Since 50–85 % of the radiative heating is balanced by evaporation (Kiehl and Trenberth, 1997), a correlated modification of low-level water vapor mixing ratio should be observed. Figure 5 displays the relationship between the difference between MAX and MIN simulations of convective precipitation (ΔPconv) and of surface water mixing ratio (Δq). For each grid points, the differences in hourly convective precipitation (ΔPconv) are paired with the difference of surface water mixing ratio (Δq). The pairs are placed in bins with an equal number of samples in each bin (20 000 samples). For each bin, the median values are computed as well as the 20th and 80th percentiles and are displayed in Fig. 5. Figure 5 shows that a decrease (increase) in surface water mixing ratio is associated almost systematically with a decrease (increase) in convective precipitation. Despite less local evaporation, some convective events are characterized by higher available surface water vapor with an associated increase in convective precipitation. The origin may be a “contamination” by the sea. Indeed, since the SST is imposed and is not in equilibrium with the reduction of downward solar radiation and because evaporation flux at the surface of the sea is in part driven by the temperature difference between the air and the sea surface (e.g., Mahrt and Ek, 1984; on which the Unified NOAH Land Surface Model – which is used in this study – is based), erroneous evaporation fluxes are expected to be simulated over the sea.
In the coastal land of the Mediterranean region in summertime, sea breezes advect marine moist air over a few tens of kilometers inland (e.g., Bastin et al., 2006, 2007; Drobinski et al., 2006, 2017), which can cause inland precipitation. The absence of air–sea feedbacks in this simulation therefore affects inland humidity advection and convective precipitation in the coastal areas (e.g., Lelieveld et al., 2002; Lebeaupin Brossier et al., 2013).
In these simulations, aerosols reduce total precipitation through their parameterized part. In order to check if this effect is not only a parameterization effect, we performed a 3.3 km resolution simulation without activating the convective scheme. The following part aims at determining if the same precipitation reduction effect is also present in the convection-permitting simulation.

Figure 5Difference between MAX and MIN simulations of convective precipitation (ΔPconv) and of surface water mixing ratio (Δq) for EUR (a) and MED (b) domains. The thick black line corresponds to the ensemble average. The lower and upper dotted lines delimiting the shaded area are the 20th and 80th percentiles, respectively.
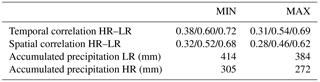
Table 1Comparison of precipitation statistics between LR and HR simulations. Space-averaged temporal correlation for the hourly, daily, and weekly precipitation amounts, respectively (first row); same for the time-averaged spatial correlation (second row); accumulated precipitation (mm) averaged over the HR domain from the whole LR and HR simulation time series (third and fourth rows).
3.2 Sensitivity of the HR simulations and impact of the resolution
At this point, it is suitable to check how the LR simulation behaves in terms of precipitation amount, localization, and timing compared to the convection-permitting HR simulation. Figure 6 shows daily MIN time series of precipitation for a LR grid point that is inside the HR domain. HR precipitation time series were made considering the average of the 15×15 grid cell that are inside the LR grid cell. This time series shows that the LR simulation is able to reproduce the main features of the HR simulation, including the succession of long-lasting rainy and dry sequences, as well as the occurrence of precipitation maxima for individual days, even though some of these peaks are stronger in the LR simulation than in the HR simulation or conversely. Table 1 shows a comparison of temporal and spatial statistics of precipitation between the LR and HR simulations. In the first line we can see the spatial average of the hourly, daily, and weekly correlations of precipitation amounts between LR and HR simulations, performed by first calculating the correlation of the hourly (resp. daily, weekly) precipitation amount between each of the cells of the LR model vs. the corresponding precipitation amount for the 15×15 matching cells of the HR domain, and then averaging all these local time correlations over the whole intersection of the HR and LR domains.
One can note a correlation around 0.3 in both MIN and MAX simulations on the hourly timescale between the LR and the HR simulations. The correlation coefficient increases for longer timescales, reaching 0.57 on daily timescale and around 0.71 on weekly timescale for both MAX and MIN simulations, which shows that even though the LR simulation does not succeed in having the precipitation events with exactly the same timing and intensity as in the HR simulation, these differences tend to be strongly reduced on the weekly timescale, which is satisfying since RCMs are usually used for climate studies.
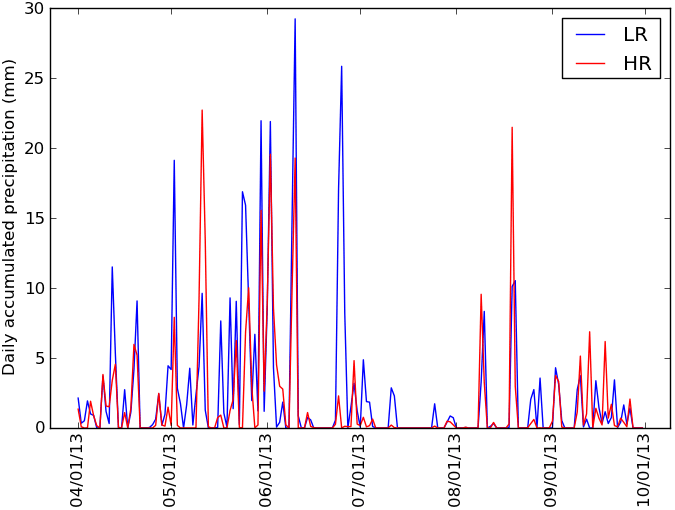
Figure 6Daily MIN precipitation time series for the LR (blue) and HR (red) simulations in one LR grid cell located close to the center of the HR domain.
Let us now evaluate the spatial distribution of precipitation in the LR simulation. Figure 7 displays the MIN hourly cumulated precipitation for the day of 12 May 2013 in the HR domain, for the HR simulation (top left), the LR simulation (top right), and for the HR precipitation aggregated on the LR grid by averaging on each LR grid cell the 15×15 matching HR grid cells (bottom right). We can see that the spatial distributions of the HR and LR simulations are rather similar on a large scale, even though the precipitation tends to be spread over larger areas in the LR simulation than in the HR simulation, even after aggregation of the latter on the LR grid, with a corresponding reduction of the maximal values of precipitation rates in the LR simulation.
As seen in the second line of Table 1, averaged spatial correlation increases from around 0.30 on an hourly timescale to around 0.65 on a weekly timescale for both MIN and MAX simulations. Similarly, averaged spatial correlations increase when we cluster grid points (not shown). It shows that even if precipitation is not exactly located at the same grid point and at the right time, spatial patterns are globally respected as seen in our example (Fig. 7). Therefore, as for the temporal correlations, the examination of spatial correlations shows that the spatial agreement between the HR and LR becomes satisfactory when the analysis is focused on daily or weekly timescales, which once again is in line with the typical uses of long-term RCM simulations.
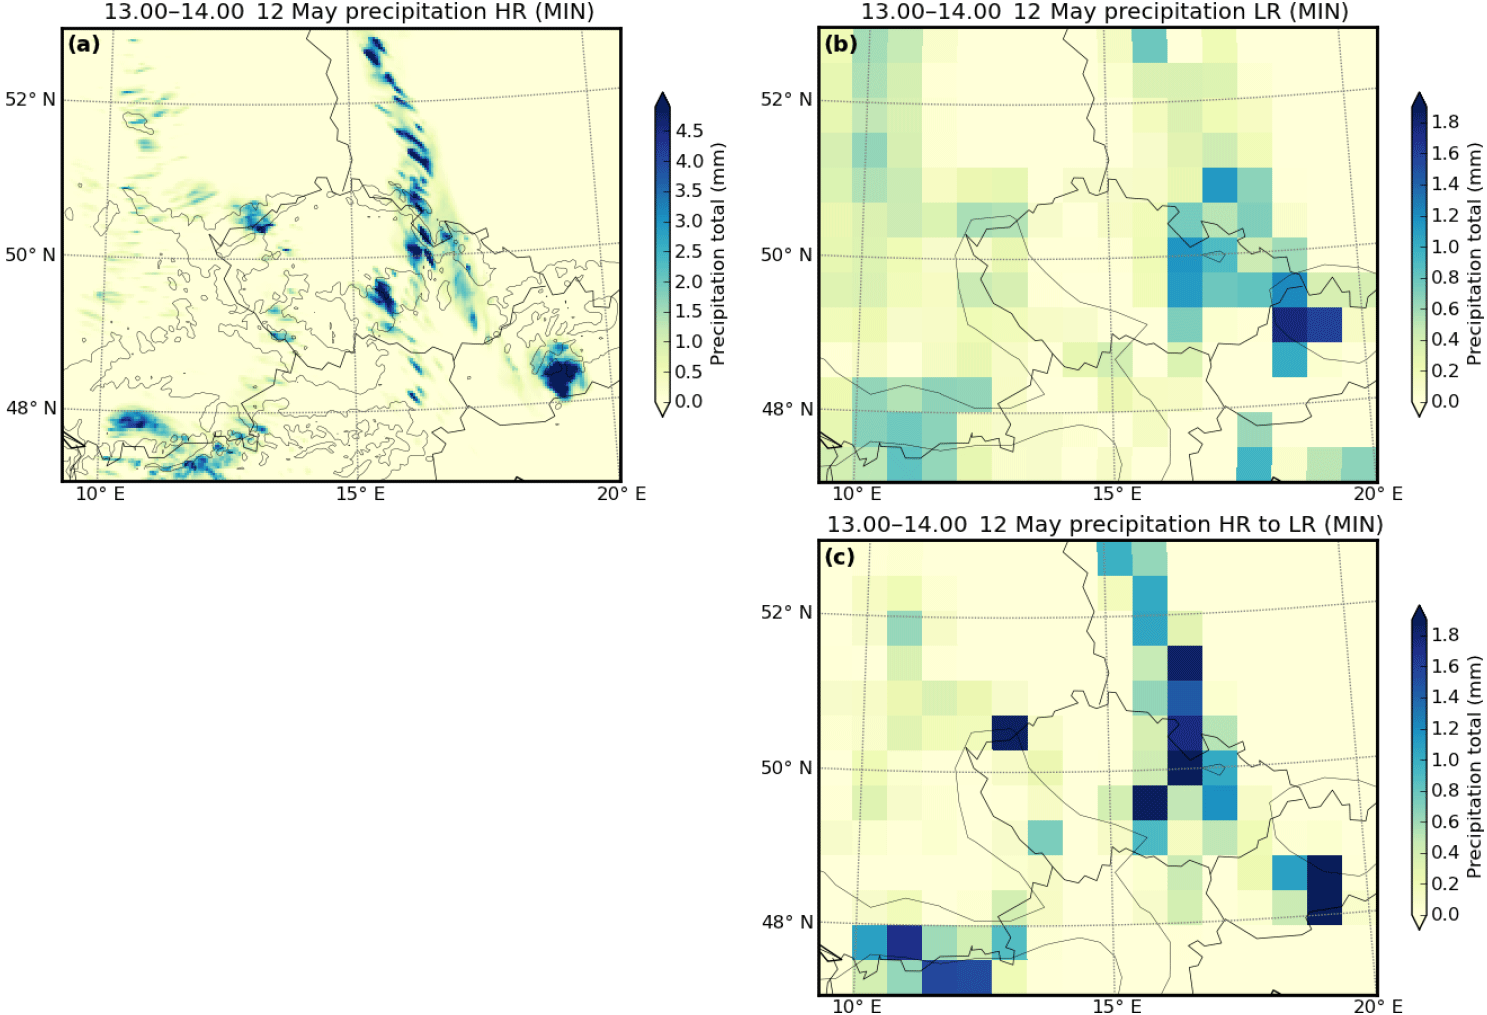
Figure 7Precipitation amount (in mm) between 13:00 and 14:00 UTC on 12 May 2013 for the MIN HR simulation (a), MIN LR simulation (b) and the HR simulation aggregated on the LR grid by averaging on each LR grid cell the 15×15 matching HR grid cells (c).
A comparison of the accumulated precipitation over the whole HR domain for the entire 6 months of simulation between the HR and LR simulations (Table 1) reveals that the accumulated precipitation in the LR simulation is significantly stronger than in the HR simulation, both for the MIN and MAX experiments. However, the indirect effect of aerosols on the precipitation is similar in the LR simulation than in the HR simulation (−11 % in the HR simulation and −7 % in the LR simulation). This shows that even though the LR simulation with the Kain–Fritsch convection scheme simulates stronger precipitation than the convection-permitting HR simulation, the microphysical effects of aerosols on precipitation in the LR simulation are of the same sign and magnitude than in the HR simulation, which tends to strengthen the results presented for the LR simulation in Sect. 3.1.
Table 2 displays various key variables averaged over all of the simulation period and over the EUR and MED domains. By examining the sensitivity of these key variables to the CCN load in both the HR and LR simulations, we will try to discuss the plausible processes involved in the simulated reduction of precipitation due to the aerosol indirect effects, which we sum up in Fig. 8 – a summary of most of the effects discussed in the present study.
Table 2Key variables for the MIN and MAX simulations: number of cloud condensation nuclei (NCCN), number of liquid cloud drops (Ndrops), liquid water content (LWC), cloud drops effective radii (Reff), cloud optical depth (COD), shortwave downward radiations (SWD), longwave downward radiations (LWD), latent heating (LH), surface temperature (Tsurf), surface water vapor mixing ratio (Qsurf), number of hours per grid point with strictly positive MuCAPE (Nhour MuCAPE), MuCAPE, MuCIN, convective precipitation (Pconv) and total precipitation (Ptot). All the values are averaged in space and time over the indicated domain from April to September 2013, except Ptot and Pconv (precipitation totals averaged over space only) and Nhour MuCAPE (number of hours averaged over space only).
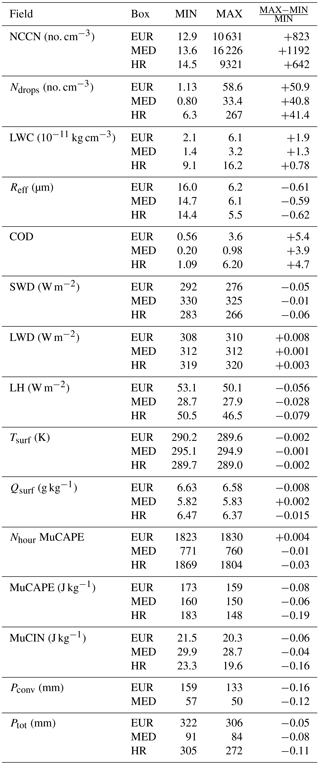
The ratio of CCN between the MIN and MAX simulations is about 1000, with no major difference between the EUR and MED domains as the forcing climatology is uniform over the whole domain. In detail, the NCCN is larger in the MED region in spite of the identical forcing emissions since a smaller NCCN is used for condensation, and wet scavenging of CCN is less active due to the weak amount of precipitation (Fig. 2a). As expected, the number of liquid cloud droplets (Ndrops) increases massively with increasing aerosol concentration (this number is multiplied by 40 to 50 between the MIN and MAX experiment in the three examined simulation pairs). One can note that the relative difference in Ndrops is smaller than that of NCCN as only a fraction of aerosols is used for condensation, especially in the MAX simulation in which the number of aerosols does not limit the condensation of the available water. An increase in the number of droplets due to increased availability of CCN is the first step in the process relating the increase in aerosol concentration to the reduction of convective precipitation as shown in Fig. 8. This larger number of droplets is associated with smaller droplet radius (Reff) as a given amount of water is distributed over more droplets (Table 2 and Fig. 8). The relative difference between the MAX and MIN simulations of the droplet radii is significant and on average equal to −60 %.
Table 2 also shows that the available amount of water is sensitive to the aerosol load, with an increase in the liquid water content (LWC) in the MAX experiment by about 78 to 190 % in the three simulation pairs. An increase in the cloud lifetime in the MAX simulation might be the main explanation (Warner, 1968; Albrecht, 1989; Rosenfeld, 1999). However, on the one hand, the aerosol cloud lifetime effect has been challenged in recent studies (Small et al., 2009; Seifert et al., 2015), and on the other hand, even if this effect stands in reality, it is not sure that our model is able to correctly simulate it since the representation of entrainment and droplet evaporation has been showen to be poor in parameterized models (Zhou and Penner, 2017).
Equation (1) shows that the COD is proportional to the LWC and inversely proportional to the droplet radius. Therefore, the increase in the COD between the MIN and MAX experiments (COD is multiplied by 4.9 up to 6.4 in the three simulation pairs) is in part due to the increase in the LWC, and in part due to the diminished droplet radius, these two effects being of similar magnitude in our simulations. As a consequence of a massive increase in the COD, the surface downward shortwave radiation (SWD) is reduced by about −1 to −6 % (Table 2 and Fig. 8).
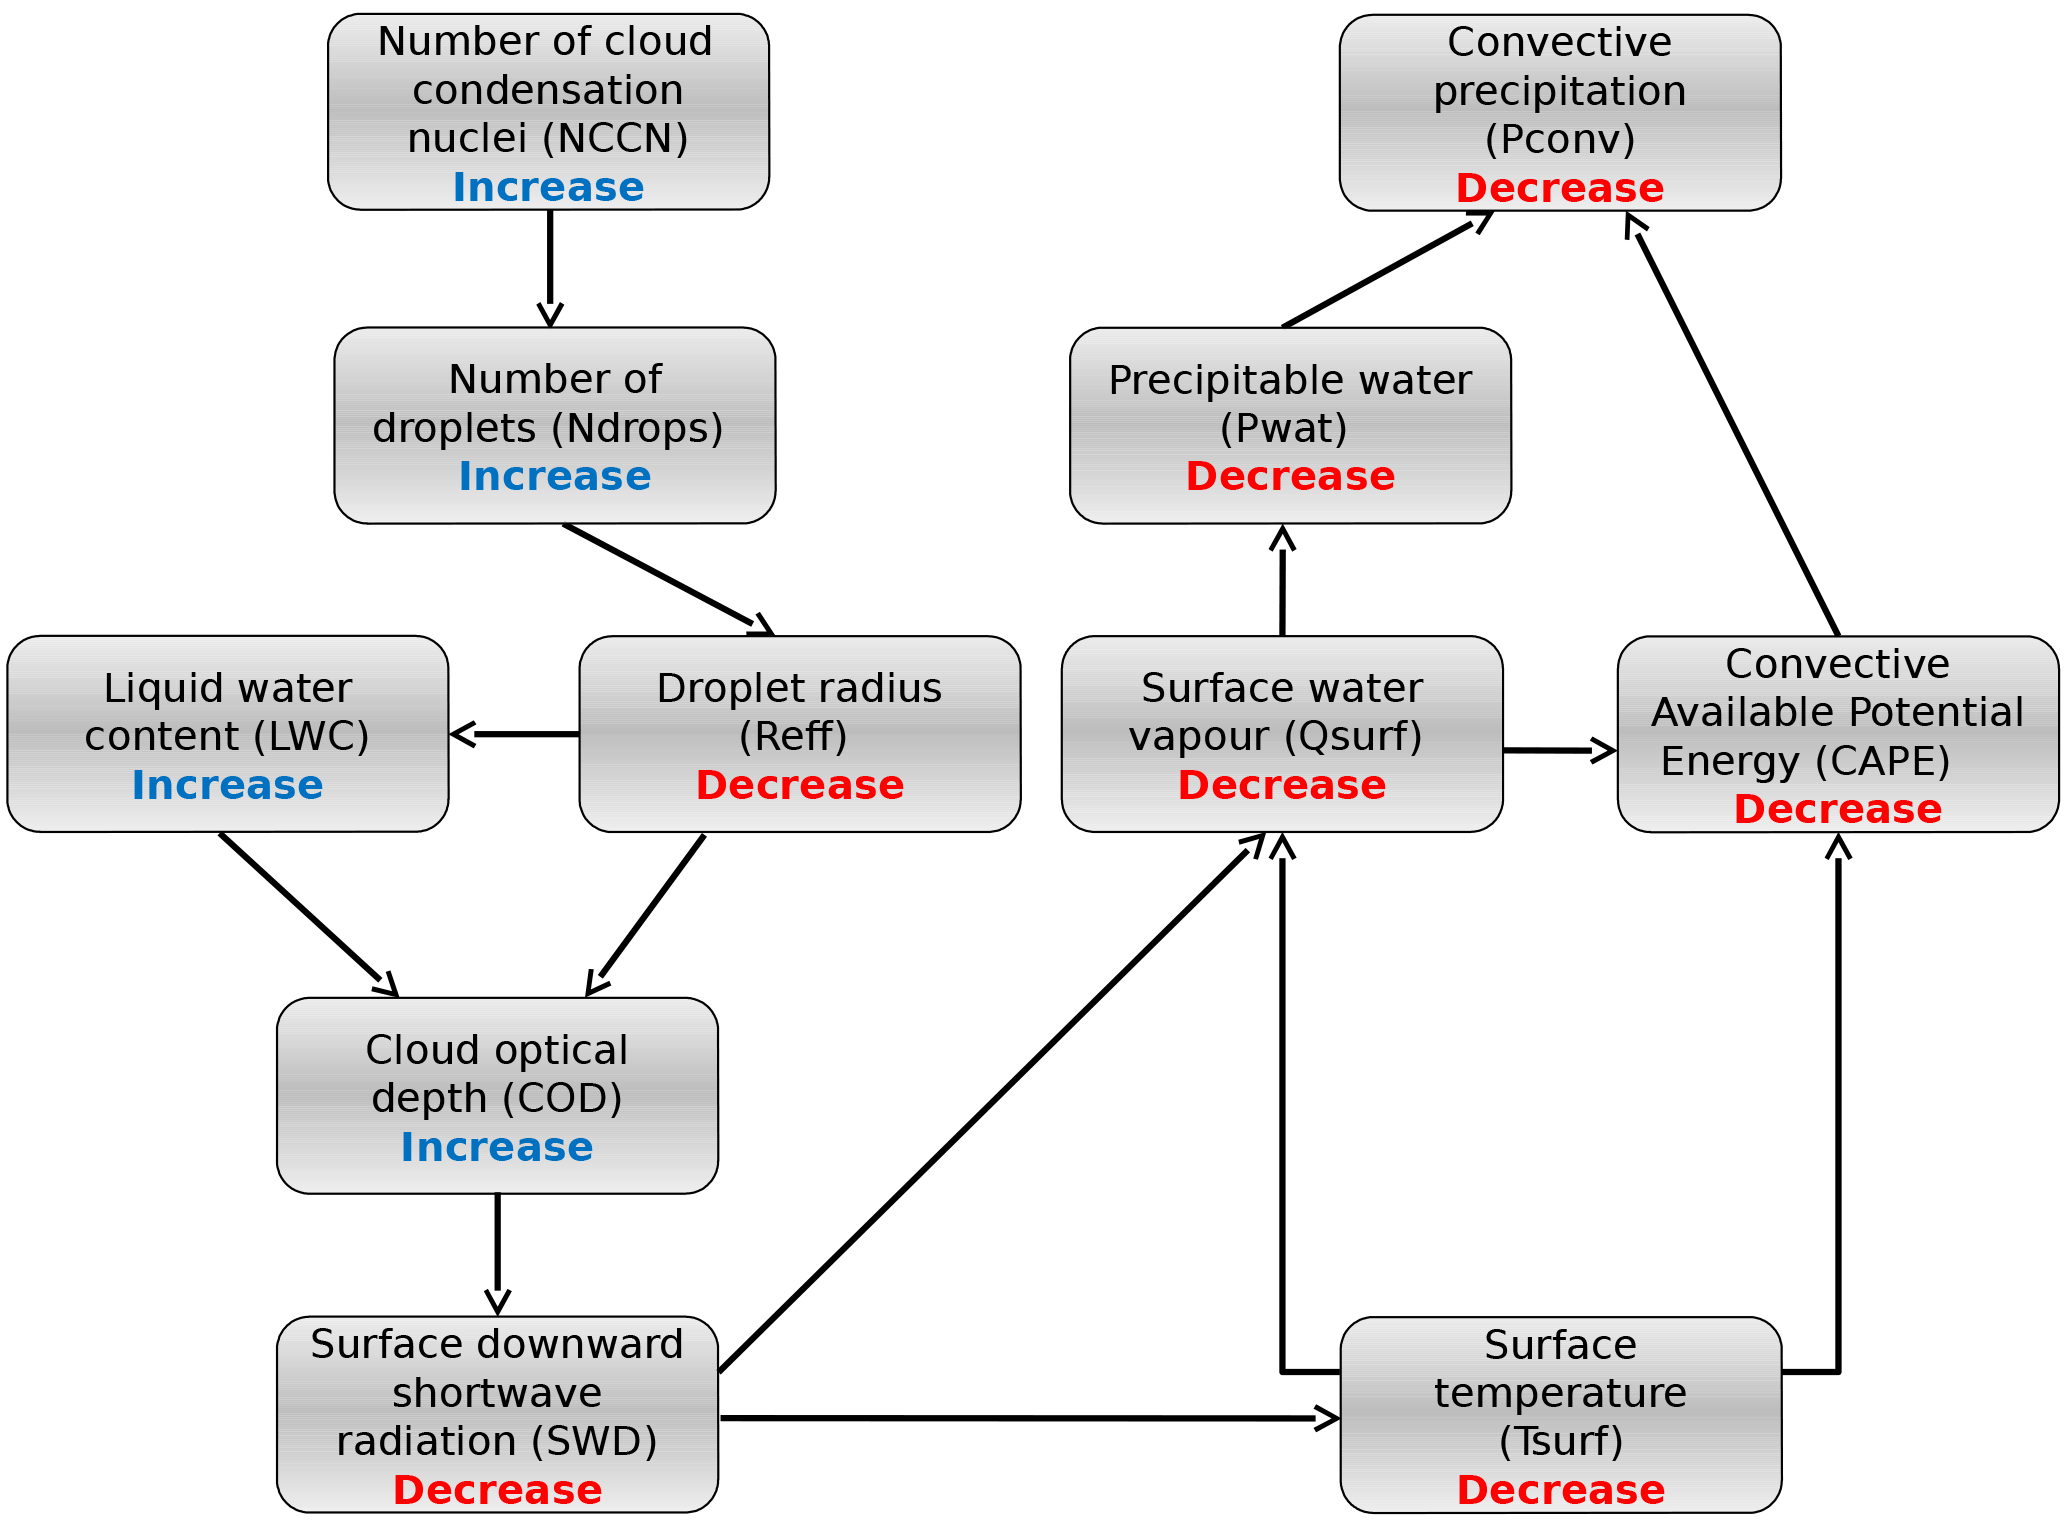
Figure 8Schematic summary of the proposed aerosol causal chain sequence for the indirect effect of aerosols on convective precipitation
The decrease in SWD implies a decrease in the surface temperature (Table 2) with the same order of magnitude (−0.2 to −0.6 K) as in Seifert et al. (2012) in Germany. The combination of SWD decrease and surface temperature decrease sum up to cause a decrease in surface evaporation (LH) by about 3 to 6 % due to the smaller quantity of energy available for evaporation and to the reduced capacity of the colder air to transport water vapor (Clausius–Clapeyron law). A consequence is the reduction of the surface water vapor mixing ratio. On average, it is the case over the EUR domain (−0.8 %) but not over the MED domain (+0.2 %) due to the “sea contamination” (prescribed sea surface temperature; Table 2). A reduced surface water vapor mixing ratio is associated with reduced convective precipitation (Fig. 5; with the exception of the contaminated coastal convective precipitation). The reduction of precipitable water (increase in LWC does not compensate the decrease in water vapor) available for convection partly inhibits convective precipitation (Fig. 8). The terms Most unstable Convective Available Potential Energy (MuCAPE) and Most unstable Convective Inhibition (MuCIN) have been chosen to characterize the stability of the atmosphere. MuCAPE represents the total amount of potential energy available to the most unstable parcel of the atmospheric column while being lifted to its level of free convection, and MuCIN represents the energy barrier needed for this parcel to reach its level of free convection. By construction, the MuCAPE parameter is always positive. Therefore, the difference in MuCAPE between both simulations can only be non-zero when there is a potentially unstable layer in at least one of the simulations. MuCAPE differences between both simulations at a given time and place can reveal very diverse situations. If, on one hand, MuCAPEMIN>0 and MuCAPEMAX=0, there is a potentially unstable atmospheric layer in the MIN simulation but not in the MAX simulation (and conversely). If, on the other hand, MuCAPEMIN>0 and MuCAPEMAX>0, then the atmospheric column is potentially unstable in both simulations, and MuCAPEMIN−MuCAPEMAX describes the difference in the potential intensity of convection between both simulations.
To only analyze the potential intensity of the convection, we averaged values of MuCAPEMIN−MuCAPEMAX when both energies are non-zero (which makes a sample of about 2.4 million hours spread over 1499 grid points in the EUR domain and about 1.1 million hours spread over 1606 grid points in the MED domain).
On the other hand, MuCIN is defined only when a level of free convection exists, i.e., only when MuCAPE is strictly positive. For all these reasons, we averaged MuCAPE and MuCIN considering only the events with strictly positive MuCAPE in both simulations. Because of increased relative humidity, MuCIN is reduced by about 4 to 6 % in the LR simulations, and up to 16 % in the HR simulation. MuCAPE is also weaker by 6 to 8 % in the LR domain, and up to 19 % for the HR simulation, mostly due to the lack of water vapor and to lower surface temperatures. When convection is actually triggered, this reduced MuCAPE induces weaker convective updraft and therefore weaker convective precipitation. This reduction in convective precipitation (Fig. 8) is of 16 % in the EUR domain, and 12 % in the MED domain, and causes a reduction in total precipitation of 5 to 8 % in the EUR and MED domains of the LR simulation, and 11 % in the HR simulation (Table 2).
The effect of the stabilization of the atmospheric columns due to the indirect effect of the aerosols has already been examined by Morrison and Grabowski (2011), Seifert et al. (2012), and Fan et al. (2013). While Morrison and Grabowski (2011) find small reductions in the precipitation amounts due to this stabilization, Seifert et al. (2012) and Fan et al. (2013) find a slight increase in precipitation in a polluted atmosphere, due to the convective invigoration linked to increased ice formation in the upper troposphere, an effect that cannot be represented in our LR simulation since the Kain–Fritsch convective scheme we use here does not explicitly take into account the effect of aerosols and nucleation. While it can be represented by our HR simulation, it does not appear to play a dominant role in the conditions of our study.
Aerosols affect atmospheric dynamics and precipitation through their direct and semi-direct radiative effects as well as through their indirect effects. In this study, we investigated the indirect effects of aerosols on summer precipitation in the Euro-Mediterranean region. While it is difficult to disentangle the indirect effects of aerosols from the direct and semi-direct effects in reality, we have carried out a numerical sensitivity experiment using the WRF model, which allows us to isolate indirect effects, all other things being equal, while introducing uncertainties linked to the model formulation. Very large and unrealistic perturbations were chosen in order to allow the indirect effect of aerosols to emerge from these uncertainties. For this purpose, the Thompson aerosol-aware microphysics scheme has been used in a pair of simulations run at 50 km resolution for the spring and summer of 2013 (April–September) with extremely high and low aerosol concentrations, respectively. The outputs of these simulations have been analyzed in two areas, one over continental northern Europe and the other for the continental areas of the Mediterranean basin (Fig. 1). In order to strengthen the results obtained on precipitation with this first set of simulations, we performed an additional pair of simulations at a convection-permitting resolution (3.3 km) for a continental subdomain.
Analysis of the LR simulation outputs has revealed two opposite responses to this increase in aerosols concentrations. In the polluted simulation, the amount of convective (parameterized) precipitation is reduced in comparison to the pristine simulation (Fig. 4). The total precipitation is also reduced, even though an increase in stratiform precipitation partly compensates the reduction of convective precipitation (Table 2). An examination of the differences in several relevant variables between the pristine and polluted simulation reveals that the polluted simulation has more water droplets than the pristine simulation, and that these water droplets tend to be smaller (Table 2). Additionally, the liquid water content of the atmosphere is also generally increased in the polluted simulation (Table 2), probably in part because the smaller droplets tend to stay longer in the atmosphere before precipitating. Both the quantity and the size effect contribute to an increase in the COD, and a subsequent reduction in the SWD flux at the surface, which is only partly compensated by a much smaller increase in the net longwave radiative flux (Fig. 3 and Table 2). The reduction of radiative heating at the surface has consequences on the atmospheric stability through a reduced evaporation and lower surface temperature in the polluted simulation (Table 2). The reduced evaporation leads to a lower surface water vapor mixing ratio in the polluted simulation (Fig. 5 and Table 2) that accounts not only for the reduction of potential energy for convection (Table 2) but also the reduction of precipitable water. The increase in stability and the reduction of surface water vapor content contributes to the reduction of convective precipitation in the polluted simulation (Table 2). A visual summary of this causal chain has been presented in Fig. 8. In these simulations with parameterized convection, the stratiform (explicitly resolved) precipitation increase partly compensates the decrease in convective (parameterized) precipitation. Since it could be envisioned that this increase in stratiform precipitation could just be a consequence of the reduction of convective precipitation, for example through a greater availability of water for stratiform precipitation due to reduced convective rainfall, we performed an additional pair of pristine and polluted simulations at the same resolution but without activating the convection scheme. Analysis of these simulations has shown that an increase in stratiform precipitation also occurs in this additional pair of simulations where parameterized convection is turned off, thereby excluding the hypothesis that the increase in stratiform precipitation is just an effect of decreased convective precipitation. Therefore, the reasons for this increase in large-scale precipitation in the polluted case remains an open question.
In order to confirm and strengthen this result of a net reduction of total precipitation due to aerosol secondary effect in a regional climate model, at least in the study area, and to show that this result is not just a consequence of the choice of a particular scheme for parameterized convection (in our case the Kain-Fritsch scheme), we analyzed the same variables as in the low-resolution simulation in the pair of convection-permitting simulations. Even though differences exist between the behavior of the convection-permitting simulation pair compared to its large-scale counterpart, the main features are similar to those of the large-scale simulations: a strong increase in the number of cloud droplets and their liquid water content in the polluted simulation compared to the pristine simulation, a strong decrease in their size, a decrease in the SWD radiative flux, a decrease of the surface temperature and surface humidity, and a marked decrease in the MuCAPE, yielding an overall reduction of total precipitation during the simulation period (Table 2). Convective invigoration, which numerically can not occur in LR simulations because the cumulus scheme is insensitive to the aerosol concentration, actually may not be important in the convection-permitting simulation either. This result was expected since it has been shown that this invigoration effect is stronger in weak wind shear and warm cloud-bases (> 15 ∘C) conditions (Li et al., 2011; Fan et al., 2009), which may not be the situations that occur most often in mid-latitude regions. Rosenfeld et al. (2008) evaluated the amplitude of the invigoration effect as a function of the CCN concentration. They claimed that the weight of the parcel condensate increases with CCN concentration since aerosols tend to suppress precipitation by the Albrecht effect. The increasing weight of parcels with CCN load tends to counteract the release of more freezing latent heating (due to invigoration effect) with increasing CCN. They stated the existence of an optimal CCN concentration at 1200 cm−3 for the strongest invigoration effect. Beyond this optimal CCN concentration value, the invigoration effect tends to be weakened by the increasing weight of parcels. The effect is even negative when reaching extreme values such as 10 000 cm−3, which is the typical order of magnitude of our MAX simulation (see Table 2). This is another possible explanation for the weak invigoration effect observed in our simulations.
Even though the reduction of precipitation occurs through their parameterized part, the fact that the reduction of the total precipitation amount persists in a high-resolution convection-permitting simulation, at least in the central Europe domain used, suggests that this impact of indirect aerosol effects on precipitation is not just a consequence of the formulation of the convection scheme but reflects underlying physical processes for which we propose a summary under the form of a causal chain (Fig. 8).
The magnitude of the simulated impact of the secondary aerosol effects on precipitation is estimated as a reduction of total precipitation by 5 to 11 % in our simulations, but since these simulations have been performed with extremely low or extremely high concentrations of CCN, these values need to be interpreted as an upper bound of the magnitude of this effect rather than as a realistic estimate. Our result can also be seen as a buffered response of atmosphere to the aerosol indirect forcing as mentioned in Stevens and Feingold (2009). Indeed, analysis of the LR simulation shows that stratiform clouds act in two opposite ways for surface precipitation in a polluted environment: in a direct way they produce more stratiform rain, and in an indirect way they decrease convective rain through their stabilization effect. This compensation explains why extreme changes in aerosol concentrations produce only small changes in total precipitation. If all of the mentioned aerosol indirect effects have already been discussed in past studies, in particular those of Seifert et al. (2012) and Fan et al. (2013), the present study makes it possible to analyze which effects are dominant for summertime in the Euro-Mediterranean area with a regional simulation, and comparing a low-resolution simulation with parameterized convection to a cloud-resolving simulation. Compared to studies such as the ones of Morrison and Grabowski (2011), Seifert et al. (2012), and Fan et al. (2013), our study permits us to observe this effect in the same region and period with these two different model configurations, showing that a model configuration with parameterized convection can represent precipitation reduction due to stabilization related to the indirect effect of aerosols in a way that is very similar to a cloud-resolving simulation. Therefore, the present study suggests that, for the mid-latitudes in summertime, global or regional climate models with parameterized convection may be able to capture the precipitation changes due to the effect of radiative cooling by the aerosol indirect effect in a realistic way, at least when compared to similar models in a convection-permitting configuration over the same area. Using such configurations with parameterized convections also permits us to clearly separate the processes affecting stratiform precipitation from the ones affecting convective precipitation, as we have done above.
Because of the time of computation, our high-resolution domain is rather small, which would limit the physical interpretation to that selected area. However, the typical scale of the precipitation difference patterns in Fig. 2 is less than half the size of the HR domain, so that the differences observed in the HR domain do not reflect only a particular case of positive or negative effect on precipitation but a reasonable sample of continental Europe. Of course, for future studies, it would be interesting to have such a high-resolution study for an entire continental-scale domain.
To strengthen the analysis of these processes and evaluate in a more realistic way their magnitude, it will be necessary to perform simulations with models that are able to take into account realistic aerosol levels as well as their variations in space and time, which will be possible in particular through the use of online-coupled models that treat aerosol emission and transport in a realistic way, such as described in Baklanov et al. (2014). Also, our study was not able to examine these effects over oceanic surfaces since the forcing by fixed SSTs that are not in equilibrium with the perturbed atmospheric forcings does not permit to obtain meaningful results over the oceans; this could be overcome by using models which are coupled with an oceanic model. Finally, to resolve the full lifetime of clouds and water vapor in the atmosphere, it would also be useful to use a larger domain (global or hemispheric).
The data used in this study are available upon request to the authors.
The authors declare that they have no conflict of interest.
This work is a contribution to the HyMeX program (HYdrological cycle in the
Mediterranean EXperiment) through INSU-MISTRALS support. This research has
received funding from the French National Research Agency (ANR) project
REMEMBER (contract ANR-12-SENV-001).
The
topical editor, Marc Salzmann, thanks two anonymous referees for help in
evaluating this paper.
Ackerman, T. P., Liou, K.-N., Valero, F. P. J., and Pfister, L.: Heating Rates in Tropical Anvils, J. Atmos. Sci., 45, 1606–1623, https://doi.org/10.1175/1520-0469(1988)045<1606:HRITA>2.0.CO;2, 1988. a
Albrecht, B.: Aerosols, cloud microphysics, and fractional cloudiness, Science, 245, 1227–1230, 1989. a, b
Baklanov, A., Schlünzen, K., Suppan, P., Baldasano, J., Brunner, D., Aksoyoglu, S., Carmichael, G., Douros, J., Flemming, J., Forkel, R., Galmarini, S., Gauss, M., Grell, G., Hirtl, M., Joffre, S., Jorba, O., Kaas, E., Kaasik, M., Kallos, G., Kong, X., Korsholm, U., Kurganskiy, A., Kushta, J., Lohmann, U., Mahura, A., Manders-Groot, A., Maurizi, A., Moussiopoulos, N., Rao, S. T., Savage, N., Seigneur, C., Sokhi, R. S., Solazzo, E., Solomos, S., Sørensen, B., Tsegas, G., Vignati, E., Vogel, B., and Zhang, Y.: Online coupled regional meteorology chemistry models in Europe: current status and prospects, Atmos. Chem. Phys., 14, 317–398, https://doi.org/10.5194/acp-14-317-2014, 2014. a
Bastin, S., Drobinski, P., Guénard, V., Caccia, J.-L., Campistron, B., Dabas, A., Delville, P., Reitebuch, O., and Werner, C.: On the Interaction between Sea Breeze and Summer Mistral at the Exit of the Rhône Valley, Mon. Weather Rev., 134, 1647–1668, https://doi.org/10.1175/MWR3116.1, 2006. a
Bastin, S., Champollion, C., Bock, O., Drobinski, P., and Masson, F.: Diurnal Cycle of Water Vapor as Documented by a Dense GPS Network in a Coastal Area during ESCOMPTE IOP2, J. Appl. Meteorol. Clim., 46, 167–182, https://doi.org/10.1175/JAM2450.1, 2007. a
Berthou, S., Mailler, S., Drobinski, P., Arsouze, T., Bastin, S., Béranger, K., and Lebeaupin-Brossier, C.: Prior history of Mistral and Tramontane winds modulates heavy precipitation events in southern France, Tellus A, 66, 24064, https://doi.org/10.3402/tellusa.v66.24064, 2014. a
Bollasina, M. A., Ming, Y., and Ramaswamy, V.: Anthropogenic Aerosols and the Weakening of the South Asian Summer Monsoon, Science, 334, 502–505, 2011. a
Charlson, R. J., Lovelock, J. E., Andreae, M. O., and Warren, S. G.: Oceanic phytoplankton, atmospheric sulphur, cloud albedo and climate, Nature, 326, 655–661, https://doi.org/10.1038/326655a0, 1987. a
Denman, K., Brasseur, G., Chidthaisong, A., Ciais, P., Cox, P., Dickinson, R., Hauglustaine, D., Heinze, C., Holland, E., Jacob, D., Lohmann, U., Ramachandran, S., da Silva Dias, P., Wofsy, S., and Zhang, X.: Couplings Between Changes in the Climate System and Biogeochemistry, book section 7, 500–588, Cambridge University Press, Cambridge, UK and New York, NY, USA, 2007. a
Di Luca, A., Flaounas, E., Drobinski, P., and Lebeaupin Brossier, C.: The atmospheric component of the Mediterranean Sea water budget in a WRF multi-physics ensemble and observations, Clim. Dynam., 43, 2349–2375, https://doi.org/10.1007/s00382-014-2058-z, 2014. a
Drobinski, P., Bastin, S., Dabas, A., Delville, P., and Reitebuch, O.: Variability of three-dimensional sea breeze structure in southern France: observations and evaluation of empirical scaling laws, Ann. Geophys., 24, 1783–1799, https://doi.org/10.5194/angeo-24-1783-2006, 2006. a
Drobinski, P., Ducrocq, V., Alpert, P., Anagnostou, E., Béranger, K., Borga, M., Braud, I., Chanzy, A., Davolio, S., Delrieu, G., Estournel, C., Boubrahmi, N. F., Font, J., Grubišić, V., Gualdi, S., Homar, V., Ivančan-Picek, B., Kottmeier, C., Kotroni, V., Lagouvardos, K., Lionello, P., Llasat, M. C., Ludwig, W., Lutoff, C., Mariotti, A., Richard, E., Romero, R., Rotunno, R., Roussot, O., Ruin, I., Somot, S., Taupier-Letage, I., Tintore, J., Uijlenhoet, R., and Wernli, H.: HyMeX: A 10-Year Multidisciplinary Program on the Mediterranean Water Cycle, B. Am. Meteorol. Soc., 95, 1063–1082, https://doi.org/10.1175/BAMS-D-12-00242.1, 2014. a, b
Drobinski, P., Da Silva, N., Panthou, G., Bastin, S., Muller, C., Ahrens, B., Borga, M., Conte, D., Fosser, G., Giorgi, F., Güttler, I., Kotroni, V., Li, L., Morin, E., Önol, B., Quintana-Segui, P., Romera, R., and Torma, C. Z.: Scaling precipitation extremes with temperature in the Mediterranean: past climate assessment and projection in anthropogenic scenarios, Clim. Dynam., https://doi.org/10.1007/s00382-016-3083-x, online first, 2016. a
Drobinski, P., Bastin, S., Arsouze, T., Bëranger, K., Flaounas, E., and Stëfanon, M.: 2017: North-Western Mediterranean Sea-Breeze Circulation in a Regional Climate System Model, Clim. Dynam., https://doi.org/10.1007/s00382-017-3595-z, online first, 2017. a, b
Fan, J., Yuan, T., Comstock, J. M., Ghan, S., Khain, A., Leung, L. R., Li, Z., Martins, V. J., and Ovchinnikov, M.: Dominant role by vertical wind shear in regulating aerosol effects on deep convective clouds, J. Geophys. Res.-Atmos., 114, d22206, https://doi.org/10.1029/2009JD012352, 2009. a
Fan, J., Rosenfeld, D., Ding, Y., Leung, L. R., and Li, Z.: Potential aerosol indirect effects on atmospheric circulation and radiative forcing through deep convection, Geophys. Res. Lett., 39, l09806, https://doi.org/10.1029/2012GL051851, 2012. a
Fan, J., Leung, L. R., Rosenfeld, D., Chen, Q., Li, Z., Zhang, J., and Yan, H.: Microphysical effects determine macrophysical response for aerosol impacts on deep convective clouds, P. Natl. Acad. Sci. USA, 110, E4581–E4590, https://doi.org/10.1073/pnas.1316830110, 2013. a, b, c, d, e, f, g, h, i
Fan, J., Wang, Y., Rosenfeld, D., and Liu, X.: Review of Aerosol–Cloud Interactions: Mechanisms, Significance, and Challenges, J. Atmos. Sci., 73, 4221–4252, https://doi.org/10.1175/JAS-D-16-0037.1, 2016. a
Flaounas, E., Drobinski, P., Vrac, M., Bastin, S., Lebeaupin-Brossier, C., Stéfanon, M., Borga, M., and Calvet, J.-C.: Precipitation and temperature space-time variability and extremes in the Mediterranean region: evaluation of dynamical and statistical downscaling methods, Clim. Dynam., 40, 2687–2705, https://doi.org/10.1007/s00382-012-1558-y, 2013. a
Grabowski, W. W. and Morrison, H.: Indirect Impact of Atmospheric Aerosols in Idealized Simulations of Convective–Radiative Quasi Equilibrium. Part II: Double-Moment Microphysics, J. Climate, 24, 1897–1912, https://doi.org/10.1175/2010JCLI3647.1, 2011. a
Iacono, M. J., Delamere, J. S., Mlawer, E. J., Shephard, M. W., Clough, S. A., and Collins, W. D.: Radiative forcing by long-lived greenhouse gases: Calculations with the AER radiative transfer models, J. Geophys. Res.-Atmos., 113, d13103, https://doi.org/10.1029/2008JD009944, 2008. a
Jacobson, M. Z.: Global direct radiative forcing due to multicomponent anthropogenic and natural aerosols, J. Geophys. Res.-Atmos., 106, 1551–1568, https://doi.org/10.1029/2000JD900514, 2001. a
Jiménez, P. A., Dudhia, J., González-Rouco, J. F., Navarro, J., Montávez, J. P., and García-Bustamante, E.: A Revised Scheme for the WRF Surface Layer Formulation, Mon. Weather Rev., 140, 898–918, https://doi.org/10.1175/MWR-D-11-00056.1, 2012. a
Kain, J. S.: The Kain–Fritsch Convective Parameterization: An Update, J. Appl. Meteorol., 43, 170–181, https://doi.org/10.1175/1520-0450(2004)043<0170:TKCPAU>2.0.CO;2, 2004. a, b, c
Khain, A. P., Beheng, K. D., Heymsfield, A., Korolev, A., Krichak, S. O., Levin, Z., Pinsky, M., Phillips, V., Prabhakaran, T., Teller, A., van den Heever, S. C., and Yano, J.-I.: Representation of microphysical processes in cloud-resolving models: Spectral (bin) microphysics versus bulk parameterization, Rev. Geophys., 53, 247–322, https://doi.org/10.1002/2014RG000468, 2015. a
Kiehl, J. and Trenberth, K. E.: Earth's Annual Global Mean Energy Budget, B. Am. Meteorol. Soc., 78, 197–208, https://doi.org/10.1175/1520-0477(1997)078<0197:EAGMEB>2.0.CO;2, 1997. a
Köppen, W. and Geiger, R.: Das geographische System der Klimate, Borntraeger, Germany, 1936. a
Lebeaupin Brossier, C., Drobinski, P., Béranger, K., Bastin, S., and Orain, F.: Ocean memory effect on the dynamics of coastal heavy precipitation preceded by a mistral event in the northwestern Mediterranean, Q. J. Roy. Meteor. Soc., 139, 1583–1597, https://doi.org/10.1002/qj.2049, 2013. a
Lelieveld, J., Berresheim, H., and Borrmann, S.: Global air pollution crossroads over the Mediterranean, Science, 298, 794–799, https://doi.org/10.1126/science.1075457, 2002. a, b, c
Lerach, D. G., Gaudet, B. J., and Cotton, W. R.: Idealized simulations of aerosol influences on tornadogenesis, Geophys. Res. Lett., 35, l23806, https://doi.org/10.1029/2008GL035617, 2008. a
Li, G., Wang, Y., and Zhang, R.: Implementation of a two-moment bulk microphysics scheme to the WRF model to investigate aerosol-cloud interaction, J. Geophys. Res.-Atmos., 113, d15211, https://doi.org/10.1029/2007JD009361, 2008. a
Li, Z., Niu, F., Fan, J., Liu, Y., Rosenfeld, D., and Ding, Y.: Long-term impacts of aerosols on the vertical development of clouds and precipitation, Nat. Geosci., 4, 888–894, https://doi.org/10.1038/ngeo1313, 2011. a
Lionello, P. and Giorgi, F.: Winter precipitation and cyclones in the Mediterranean region: future climate scenarios in a regional simulation, Adv. Geosci., 12, 153–158, https://doi.org/10.5194/adgeo-12-153-2007, 2007. a
Loeb, N. G. and Su, W.: Direct Aerosol Radiative Forcing Uncertainty Based on a Radiative Perturbation Analysis, J. Climate, 23, 5288–5293, https://doi.org/10.1175/2010JCLI3543.1, 2010. a
Lohmann, U., Stier, P., Hoose, C., Ferrachat, S., Kloster, S., Roeckner, E., and Zhang, J.: Cloud microphysics and aerosol indirect effects in the global climate model ECHAM5-HAM, Atmos. Chem. Phys., 7, 3425–3446, https://doi.org/10.5194/acp-7-3425-2007, 2007. a
Lynn, B. H., Khain, A. P., Dudhia, J., Rosenfeld, D., Pokrovsky, A., and Seifert, A.: Spectral (Bin) Microphysics Coupled with a Mesoscale Model (MM5). Part II: Simulation of a CaPE Rain Event with a Squall Line, Mon. Weather Rev., 133, 59–71, https://doi.org/10.1175/MWR-2841.1, 2005. a
Mahrt, L. and Ek, M.: The Influence of Atmospheric Stability on Potential Evaporation, J. Clim. Appl. Meteorol., 23, 222–234, https://doi.org/10.1175/1520-0450(1984)023<0222:TIOASO>2.0.CO;2, 1984. a
Morrison, H. and Grabowski, W. W.: Cloud-system resolving model simulations of aerosol indirect effects on tropical deep convection and its thermodynamic environment, Atmos. Chem. Phys., 11, 10503–10523, https://doi.org/10.5194/acp-11-10503-2011, 2011. a, b, c, d, e
Myhre, G., Berglen, T. F., Johnsrud, M., Hoyle, C. R., Berntsen, T. K., Christopher, S. A., Fahey, D. W., Isaksen, I. S. A., Jones, T. A., Kahn, R. A., Loeb, N., Quinn, P., Remer, L., Schwarz, J. P., and Yttri, K. E.: Modelled radiative forcing of the direct aerosol effect with multi-observation evaluation, Atmos. Chem. Phys., 9, 1365–1392, https://doi.org/10.5194/acp-9-1365-2009, 2009. a
Myhre, G., Samset, B. H., Schulz, M., Balkanski, Y., Bauer, S., Berntsen, T. K., Bian, H., Bellouin, N., Chin, M., Diehl, T., Easter, R. C., Feichter, J., Ghan, S. J., Hauglustaine, D., Iversen, T., Kinne, S., Kirkevåg, A., Lamarque, J.-F., Lin, G., Liu, X., Lund, M. T., Luo, G., Ma, X., van Noije, T., Penner, J. E., Rasch, P. J., Ruiz, A., Seland, Ø., Skeie, R. B., Stier, P., Takemura, T., Tsigaridis, K., Wang, P., Wang, Z., Xu, L., Yu, H., Yu, F., Yoon, J.-H., Zhang, K., Zhang, H., and Zhou, C.: Radiative forcing of the direct aerosol effect from AeroCom Phase II simulations, Atmos. Chem. Phys., 13, 1853–1877, https://doi.org/10.5194/acp-13-1853-2013, 2013. a
Nabat, P., Somot, S., Mallet, M., Sevault, F., Chiacchio, M., and Wild, M.: Direct and semi-direct aerosol radiative effect on the Mediterranean climate variability using a coupled regional climate system model, Clim. Dynam., 44, 1127–1155, https://doi.org/10.1007/s00382-014-2205-6, 2015. a
Nabat, P., Somot, S., Mallet, M., Sevault, F., and Michou, M.: Aerosol Variability and Weather Regimes over the Mediterranean Region, Springer International Publishing, Cham, 91–95, https://doi.org/10.1007/978-3-319-24478-5_15, 2016. a
Nakanishi, N.: Large-Eddy Simulation Of Radiation Fog, Bound.-Lay. Meteorol., 94, 461–493, https://doi.org/10.1023/A:1002490423389, 2000. a
Nakanishi, N.: Improvement of the Mellor–Yamada turbulence closure model based on large-eddy simulation data, Bound.-Lay. Meteorol., 99, 349–378, https://doi.org/10.1023/A:1018915827400, 2001. a
Nakanishi, N. and Niino, H.: An Improved Mellor–Yamada Level-3 Model with Condensation Physics: Its Design and Verification, Bound.-Lay. Meteorol., 112, 1–31, https://doi.org/10.1023/B:BOUN.0000020164.04146.98, 2004. a
Nakanishi, N. and Niino, H.: An Improved Mellor–Yamada Level-3 Model: Its Numerical Stability and Application to a Regional Prediction of Advection Fog, Bound.-Lay. Meteorol., 119, 397–407, https://doi.org/10.1007/s10546-005-9030-8, 2006. a
National Centers for Environmental Prediction National Weather Service (NOAA, U. D. o. C.): NCEP FNL Operational Model Global Tropospheric Analyses, continuing from July 1999, https://doi.org/10.5065/D6M043C6, 2000. a
Omrani, H., Drobinski, P., and Dubos, T.: Optimal nudging strategies in regional climate modelling: investigation in a Big-Brother experiment over the European and Mediterranean regions, Clim. Dynam., 41, 2451–2470, https://doi.org/10.1007/s00382-012-1615-6, 2013. a
Omrani, H., Drobinski, P., and Dubos, T.: Using nudging to improve global-regional dynamic consistency in limited-area climate modeling: What should we nudge?, Clim. Dynam., 44, 1627–1644, https://doi.org/10.1007/s00382-014-2453-5, 2015. a
Pincus, R. and Baker, M. B.: Effect of precipitation on the albedo susceptibility of clouds in the marine boundary layer, Nature, 372, 250–252, https://doi.org/10.1038/372250a0, 1994. a
Querol, X., Alastuey, A., Pey, J., Cusack, M., Pérez, N., Mihalopoulos, N., Theodosi, C., Gerasopoulos, E., Kubilay, N., and Koçak, M.: Variability in regional background aerosols within the Mediterranean, Atmos. Chem. Phys., 9, 4575–4591, https://doi.org/10.5194/acp-9-4575-2009, 2009. a
Radke, L. F., Coakley, J. A. Jr., and King, M. D.: Direct and Remote Sensing Observation of the Effects of Ships on Clouds, Science, 246, 1146–1149, https://doi.org/10.1126/science.246.4934.1146, 1989. a
Ramanathan, V., Crutzen, P. J., Kiehl, J. T., and Rosenfeld, D.: Aerosols, Climate, and the Hydrological Cycle, Science, 294, 2119–2124, https://doi.org/10.1126/science.1064034, 2001. a
Randall, D. A., Coakley, J. A. J., Lenschow, D. H., Fairall, C. W., and Kropfli, R. A.: Outlook for Research on Subtropical Marine Stratification Clouds, B. Am. Meteorol. Soc., 65, 1290–1301, https://doi.org/10.1175/1520-0477(1984)065<1290:OFROSM>2.0.CO;2, 1984. a
Rea, G., Turquety, S., Menut, L., Briant, R., Mailler, S., and Siour, G.: Source contributions to 2012 summertime aerosols in the Euro-Mediterranean region, Atmos. Chem. Phys., 15, 8013–8036, https://doi.org/10.5194/acp-15-8013-2015, 2015. a
Rosenfeld, D.: TRMM observed first direct evidence of smoke from forest fires inhibiting rainfall, Geophys. Res. Lett., 26, 3105–3108, https://doi.org/10.1029/1999GL006066, 1999. a
Rosenfeld, D.: Suppression of rain and Snow by urban and Industrial Air Pollution, Science, 287, 1793–1796, https://doi.org/10.1126/science.287.5459.1793, 2000. a
Rosenfeld, D., Lohmann, U., Raga, G. B., O'Dowd, C. D., Kulmala, M., Fuzzi, S., Reissell, A., and Andreae, M. O.: Flood or Drought: How Do Aerosols Affect Precipitation?, Science, 321, 1309–1313, https://doi.org/10.1126/science.1160606, 2008. a, b
Salameh, T., Drobinski, P., and Dubos, T.: The effect of indiscriminate nudging time on large and small scales in regional climate modelling: Application to the Mediterranean basin, Q. J. Roy. Meteor. Soc., 136, 170–182, https://doi.org/10.1002/qj.518, 2010. a
Salzmann, M., Weser, H., and Cherian, R.: Robust response of Asian summer monsoon to anthropogenic aerosols in CMIP5 models, J. Geophys. Res.-Atmos., 119, 11321–11337, https://doi.org/10.1002/2014JD021783, 2014. a
Schulz, M., Chin, M., and Kinne, S.: The Aerosol Model Comparison Project, AeroCom, phase II: Clearing up diversity, International Global Atmospheric Chemistry, 41, 2–11, 2009. a
Seifert, A., Köhler, C., and Beheng, K. D.: Aerosol-cloud-precipitation effects over Germany as simulated by a convective-scale numerical weather prediction model, Atmos. Chem. Phys., 12, 709–725, https://doi.org/10.5194/acp-12-709-2012, 2012. a, b, c, d, e, f, g, h
Seifert, A., Heus, T., Pincus, R., and Stevens, B.: Large-eddy simulation of the transient and near-equilibrium behavior of precipitating shallow convection, J. Adv. Model. Earth Sy., 7, 1918–1937, https://doi.org/10.1002/2015MS000489, 2015. a, b
Shupe, M. D. and Intrieri, J. M.: Cloud Radiative Forcing of the Arctic Surface: The Influence of Cloud Properties, Surface Albedo, and Solar Zenith Angle, J. Climate, 17, 616–628, https://doi.org/10.1175/1520-0442(2004)017<0616:CRFOTA>2.0.CO;2, 2004. a
Skamarock, W., Klemp, J., Dudhia, J., Gill, D., Barker, D., Wang, W., Huang, X.-y., Duda, M., and Powers, J.: A Description of the Advanced Research WRF Version 3, NCAR Tech. Note NCAR/TN-475+STR, https://doi.org/10.5065/D68S4MVH, 113 pp., 2008. a, b
Small, J. D., Chuang, P. Y., Feingold, G., and Jiang, H.: Can aerosol decrease cloud lifetime?, Geophys. Res. Lett., 36, l16806, https://doi.org/10.1029/2009GL038888, 2009. a, b
Somot, S., Sevault, F., Déqué, M., and Crépon, M.: 21st century climate change scenario for the Mediterranean using a coupled atmosphere–ocean regional climate model, Global Planet. Change, 63, 112–126, https://doi.org/10.1016/j.gloplacha.2007.10.003, 2008. a
Song, X. and Zhang, G. J.: Microphysics parameterization for convective clouds in a global climate model: Description and single-column model tests, J. Geophys. Res.-Atmos., 116, d02201, https://doi.org/10.1029/2010JD014833, 2011. a
Stephens, G. L. and Webster, P. J.: Cloud Decoupling of the Surface and Planetary Radiative Budgets, J. Atmos. Sci., 41, 681–686, https://doi.org/10.1175/1520-0469(1984)041<0681:CDOTSA>2.0.CO;2, 1984. a
Stevens, B. and Feingold, G.: Untangling aerosol effects on clouds and precipitation in a buffered system, Nature, 461, 607–613, https://doi.org/10.1038/nature08281, 2009. a, b
Su, W., Loeb, N. G., Schuster, G. L., Chin, M., and Rose, F. G.: Global all-sky shortwave direct radiative forcing of anthropogenic aerosols from combined satellite observations and GOCART simulations, J. Geophys. Res.-Atmos., 118, 655–669, https://doi.org/10.1029/2012JD018294, 2013. a
Tegen, I., Hollrig, P., Chin, M., Fung, I., Jacob, D., and Penner, J.: Contribution of different aerosol species to the global aerosol extinction optical thickness: Estimates from model results, J. Geophys. Res.-Atmos., 102, 23895–23915, https://doi.org/10.1029/97JD01864, 1997. a
Thompson, G. and Eidhammer, T.: A Study of Aerosol Impacts on Clouds and Precipitation Development in a Large Winter Cyclone, J. Atmos. Sci., 71, 3636–3658, https://doi.org/10.1175/JAS-D-13-0305.1, 2014. a, b, c, d, e, f
Twomey, S.: The Influence of Pollution on the Shortwave Albedo of Clouds, J. Atmos. Sci., 34, 1149–1152, https://doi.org/10.1175/1520-0469(1977)034<1149:TIOPOT>2.0.CO;2, 1977. a
van den Heever, S. C. and Cotton, W. R.: Urban Aerosol Impacts on Downwind Convective Storms, J. Appl. Meteorol. Clim., 46, 828–850, https://doi.org/10.1175/JAM2492.1, 2007. a
van den Heever, S. C., Stephens, G. L., and Wood, N. B.: Aerosol Indirect Effects on Tropical Convection Characteristics under Conditions of Radiative–Convective Equilibrium, J. Atmos. Sci., 68, 699–718, https://doi.org/10.1175/2010JAS3603.1, 2011. a
Warner, J.: A Reduction in Rainfall Associated with Smoke from Sugar-Cane Fires – An Inadvertent Weather Modification?, J. Appl. Meteorol., 7, 247–251, https://doi.org/10.1175/1520-0450(1968)007<0247:ARIRAW>2.0.CO;2, 1968. a
Xoplaki, E., González-Rouco, J. F., Luterbacher, J., and Wanner, H.: Wet season Mediterranean precipitation variability: influence of large-scale dynamics and trends, Clim. Dynam., 23, 63–78, https://doi.org/10.1007/s00382-004-0422-0, 2004. a
Zhou, C. and Penner, J. E.: Why do general circulation models overestimate the aerosol cloud lifetime effect? A case study comparing CAM5 and a CRM, Atmos. Chem. Phys., 17, 21–29, https://doi.org/10.5194/acp-17-21-2017, 2017. a, b