the Creative Commons Attribution 4.0 License.
the Creative Commons Attribution 4.0 License.
 | 23 Oct 2018
Dynamics of a geomagnetic storm on 7–10 September 2015 as observed by TWINS and simulated by CIMI
James Edmond
Shannon Hill
Hanyun Xu
Natalia Buzulukova
Mei-Ching Fok
Jerry Goldstein
David J. McComas
Phil Valek
For the first time, direct comparisons of the equatorial ion partial pressure and pitch angle anisotropy observed by TWINS and simulated by CIMI are presented. The TWINS ENA images are from a 4-day period, 7–10 September 2015. The simulations use both the empirical Weimer 2K and the self-consistent RCM electric potentials. There are two moderate storms in succession during this period. In most cases, we find that the general features of the ring current in the inner magnetosphere obtained from the observations and the simulations are similar. Nevertheless, we do also see consistent contrasts between the simulations and observations. The simulated partial pressure peaks are often inside the observed peaks and more toward dusk than the measured values. There are also cases in which the measured equatorial ion partial pressure shows multiple peaks that are not seen in the simulations. This occurs during a period of intense AE index. The CIMI simulations consistently show regions of parallel anisotropy spanning the night side between approximately 6 and 8 RE, whereas the parallel anisotropy is seen in the observations only during the main phase of the first storm. The evidence from the unique global view provided by the TWINS observations strongly suggests that there are features in the ring current partial pressure distributions that can be best explained by enhanced electric shielding and/or spatially localized, short-duration injections.
- Article
(8720 KB) - Full-text XML
- BibTeX
- EndNote


The Earth's inner magnetosphere contains a large-scale current system, the ring current, in which the current is carried by trapped ions that are injected from the magnetotail and generally drift westward. It is a major contributor to magnetic depressions measured in the Earth's equatorial region that are expressed in terms of the Dst or SYM-H indices which characterize the time evolution of geomagnetic storms. The plasma sheet is a primary source of particles in the inner magnetosphere. Therefore understanding and predicting the dynamics of the injected particles is a key factor in understanding the formation and decay of the ring current. This challenge can be addressed by a comparison of model and simulation results with observations.
There have been many studies which have compared model results to observations. Kistler and Lawson (2000) used two different magnetic field models, dipole and Tsy89 (Tsyganenko, 1989), along with two different electric potential models, Volland–Stern (Volland, 1973; Stern, 1975) and Weimer96 (Weimer, 1996), to calculate ion paths in the inner magnetosphere. They compared the results with in situ proton energy spectra measured by the Active Magnetospheric Particle Tracer Explorers (AMPTE) (Gloeckler et al., 1985) over a range of local times. They found that, in the inner magnetosphere, the electric field has a much stronger effect on the particle paths than the magnetic field and that the Weimer96 model gave a better match to the features of the observed energy spectra than the Volland–Stern model. But the energy at which the drift paths became closed, 40–50 keV, was not in agreement with the observations. It is to be noted that the effects of induction electric fields were not included in this analysis. Angelopoulos et al. (2002b) added co-rotation electric fields to Volland–Stern, Weimer 96, and Weimer 2000 along with modifications to improve fits to instantaneous electric field measurements by POLAR/HYDRA (Scudder et al., 1995) and Defense Meteorological Satellite Program satellites to compare with in situ measurements of ion spectrograms from POLAR/HYDRA, EQUATOR-S (Kistler et al., 1999) and FAST (Carlson et al., 2001). They found differences that seemed to require the inclusion of local inductive electric fields and/or particle injections. Ebihara et al. (2004) modeled discrete energy bands observed by POLAR using a dipole magnetic field and a realistic electric field to show that changes in the convection electric field produced better results.
De Michelis et al. (1999) obtained images of pressure in the equatorial plane, both orthogonal and parallel, and anisotropy using 2-year averages of proton distributions measured by AMPTE/CCE-CHEM (Dassoulas et al., 1985; Gloeckler et al., 1985). They located two current systems, the inner portion of the cross-tail current and the ring current during times of AE > 100 nT, and both the full and partial ring current along with Region 2 currents for 100 nT < AE < 600 nT. Ebihara et al. (2002) compared statistically averaged data from POLAR/MICS (Wilken et al., 1992) with simulations of proton drift paths using the Volland–Stern electric potential and found reasonable agreement. Lui et al. (2004) used the AMPTE/CCE-CHEM and MEPA (McEntire et al., 1985) to construct the plasma pressure distribution over an extended energy range from 1 keV to 4 MeV. They found that the statistical pressure distribution obtained from the in situ measurements differed from the results obtained from ENA images obtained from IMAGE/HENA (Brandt et al., 2004). Wang et al. (2011) compared average spatial profiles of the Time History of Events and Macroscale Interaction during Substorms (THEMIS) (Angelopoulos, 2008) in situ observations with simulations using the Rice Convection Model (RCM) self-consistent electric and magnetic fields (Toffoletto et al., 2003). The agreement with key spatial features of the particle fluxes confirms the importance of the magnetic and electric transport in determining features of the ring current. With the advent of missions dedicated to energetic neutral atom (ENA) imaging, e.g., (1) the three instruments LENA (Moore et al., 2000), MENA (Pollock et al., 2000), and HENA (Mitchell et al., 2000) onboard IMAGE (Burch, 2000), (2) the Energetic Neutral Atom Detector Unit (NUADU) (McKenna-Lawlor et al., 2005), and (3) Two Wide-angle Imaging Neutral-atom Spectrometers (TWINS) (McComas et al., 2009a; Goldstein and McComas, 2013, 2018), it became possible to test simulations against full images of the inner magnetosphere.
Fok et al. (2003) compared simulations using the CRCM (Fok et al., 2001b) model with ENA images from IMAGE/MENA and HENA. They were able to match the magnitude and trends of the observed Dst but not all of the short time variations. The empirical Weimer96 electric field model was not able to explain the fact that the peaks of the proton flux in the inner magnetosphere were in the midnight/dawn sector rather than the expected dusk/midnight sector during a strong storm on 12 August 2000, but the self-consistent CRCM electric field model did explain this feature. They also used the MHD fields computed by the BATS-R-US (Block-Adaptive-Tree Solar-wind Roe Upwind Scheme) (Groth et al., 2000) model to provide electric and magnetic fields and ion temperature and density at the model boundary (10 RE) at the Equator to model a large storm that occurred on 15 July 2000. The simulated ENA images matched the general features of the HENA ENA images.
Buzulukova et al. (2010) studied the effects of electric shielding on ring current morphology by comparing the results of CRCM simulations from a moderate and a strong storm with ENA images from TWINS and IMAGE/HENA. The Tsy96 empirical magnetic field, the Weimer 2000 electric potential model (Weimer, 2001), and the empirical Tsyganenko and Mukai (2003) model of the plasma sheet density and temperature were employed. They achieved agreement between the magnitude and trends of the observed SYM-H and the simulated values for both storms, and were able to explain the post-midnight enhancements of the pressure due to electric shielding. They did not include the effects of inductive electric fields or time dependence due to substorms.
Fok et al. (2010) used ENA images from both TWINS1 and TWINS2 along with in situ THEMIS observations during a storm on 22 July 2009 to validate the CRCM simulations. They found that, when a time-dependent magnetic field is included, the electric potential pattern is less twisted and the ion flux peak did not move as far eastward, giving better agreement with the ENA observations.
It is clear that present-day simulations are able to explain the general features of the observations of the ring current in the inner magnetosphere, both from in situ measurements and in ENA images. It is also clear that questions remain as to the contributions of various shielding mechanisms. Self-consistent dynamic electric potentials give better results. Inclusion of magnetic induction effects is also necessary for the best results. But to date effects on short timescales, e.g., injections from sub-storms, bubbles, and bursty bulk flows, have not been included in a self-consistent manner.
It is also important to note that the cases treated have been either statistical averages or single events in which there was no evidence for multiple peaks in the ring current pressure distribution. The existence of multiple peaks, however, has been observed in data from the AMPTE Charged Particle Explorer mission (Liu et al., 1987; Ebihara et al., 1985) and in ion distributions extracted from TWINS ENA images (Perez et al., 2015).
The science question to be addressed by this study is the following: are there features in the global ring current pressure that are caused by enhanced electric shielding and/or spatially localized, short-duration injections? We present for the first time a direct comparison between simulations of ring current equatorial partial pressure and anisotropy distributions with the unique global images extracted from the TWINS ENA images. We present cases in which the general characteristics of the observed partial pressure distribution are reproduced by the simulations and others in which the observed ion partial pressure peaks are at larger radius, are in different magnetic local time (MLT) sectors, and display multiple peaks that are not found in the simulations. We also compare for the first time global images of the pressure anisotropy extracted from the TWINS ENA images with the results of simulations using the Comprehensive Inner Magnetosphere Ionosphere (CIMI) model (Fok et al., 2014).
In Sect. 2, we describe the measurement of the TWINS ENA images and the process by which ion partial pressures and anisotropy are extracted, and briefly discuss how this technique has been validated against in situ measurements. In Sect. 3, we describe the important aspects of the CIMI model and how it has been compared with geomagnetic activity indices, in situ measurements, and ENA images. The particular storms on 7–10 September 2015, which are the focus of this study, are described in Sect. 4. The comparison of results of the measurements and simulations are presented in Sect. 5. They are discussed in Sect. 6. Section 7 summarizes the results and the conclusions.
2.1 TWINS ENA images
The NASA TWINS mission of opportunity (McComas et al., 2009a; Goldstein and McComas, 2013, 2018) obtains ENA images of the inner region of the Earth's magnetosphere. The instrument concept is described in McComas et al. (1998). Every 72 s with an integration (sweep) time of 60 s, full images are obtained. In this study, in order to obtain sufficient counts for the deconvolution process described in Sect. 2.2, the images are integrated over 15–16 sweeps. This means data are collected for ∼15 min over an ∼20 min time period. The energies of the neutral atoms span a range from 1 to 100 keV amu−1. In the images used in this study, the energy bands are such that for H atoms. In order to enhance the processed image, a statistical smoothing technique and background suppression algorithms described in detail in Appendix A of McComas et al. (2012) are employed. This combined approach is an adapted version of the statistical smoothing technique used successfully for IBEX (McComas et al., 2009b) data.
2.2 Ion pressures
For the comparison with simulation results using the CIMI program (see Sect. 3), the spatial and temporal evolution of equatorial ion partial pressure and pressure anisotropy are routinely obtained from the TWINS ENA images. To extract this information from the ENA images, the ion equatorial pitch angle distribution is expanded in terms of tri-cubic splines (deBoor, 1978). To fit the data and to obtain a smooth solution, the sum of normalized chi-squared and a penalty function derived by Wahba (1990) is minimized. The penalty function is what produces the smoothness of the result (in the sense of a minimum second derivative), and the normalized chi-squared is what ensures that the calculated image corresponds to the measured ENA image. This means that the spatial structure obtained in the equatorial ion partial pressure distributions is no more than is required by the observations (Perez et al., 2004). In order to obtain pressures from the energy-dependent ENA images, which are integrated over energy bands with widths equal to the central energy, e.g., 40 keV images are integrated from 20 to 60 keV, a technique using singular valued decomposition as described in Perez et al. (2012, Appendix B) is employed. The energy range included in the partial pressures presented in this paper is 2.5–97.5 keV, i.e., the energy range observed by TWINS. It is to be noted that higher energies do make significant contributions to the total ring current pressure (Smith and Hoffman, 1973).
In order to obtain the ion distributions from the ENA images, models for both the magnetic field and the exospheric neutral hydrogen density are required. In this study, we use the Tsyganenko and Sitnov (2005) magnetic field model and the TWINS exospheric neutral hydrogen density model (Zoennchen et al., 2015).
We must also deal with the fact that there are two components to the ENA emissions: the energetic ions created in charge exchange interactions with neutral hydrogen in the geocorona, the so-called high-altitude emissions (HAE), and those due to charge exchange with neutral oxygen at low altitudes (below ∼600 km), the so-called low-altitude emissions (LAE) (Roelof, 1997). The former are treated as optically thin emissions, and the latter with a thick target approximation developed by Bazell et al. (2010) and validated by comparisons with DMSP data (Hardy et al., 1984).
A full range of the ion characteristics obtained from the TWINS ENA images have been compared with in situ measurements. Measurements of the spatial and temporal variations of the flux in specific energy bands from the Time History of Events and Macroscale Interactions during Substorms (THEMIS) (Angelopoulos, 2008) have been compared with ion flux obtained from the TWINS ENA images (Grimes et al., 2013; Perez et al., 2015). A similar comparison (Perez et al., 2016) has been made with measurements made on the Van Allen probes (formerly known as Radiation Belt Storm Probes (RBSP) A and B) (Mauk et al., 2013; Spence et al., 2013) by the Radiation Belt Storm Probes Ion Composition Experiment (RBSPICE) (Mitchell et al., 2013) instrument. Pitch angle distributions and pitch angle anisotropy have been compared with THEMIS observations (Grimes et al., 2013). Energy spectra have also been compared with THEMIS measurements (Perez et al., 2012). Partial pressure and anisotropy from TWINS have been compared with RBSP-SPICE-A (Perez et al., 2016) observations. While the in situ measurements show more detailed temporal and spatial features, there is good agreement with the overall trends. Goldstein et al. (2017) compared the TWINS ENA images with in situ data from THEMIS and the Van Allen probes. They found evidence for bursty flows and ion structures in the plasma transport during the 2015 St. Patrick's Day storm.
The CIMI model is a combination of the Comprehensive Ring Current Model (CRCM) (Fok et al., 2001b) and the Radiation Belt Environment (RBE) model (Fok et al., 2008). The CRCM is a combination of the classic Rice Convection Model (RCM) (Harel et al., 1981) and the Fok kinetic model (Fok et al., 1993).
The CRCM simulates the evolution of an inner magnetosphere plasma distribution that conserves the first two adiabatic invariants. The Fok kinetic model solves the bounce-averaged Boltzmann equation with a specified electric and magnetic field to obtain the plasma distribution. It is able to include arbitrary pitch angles with a generalized RCM Birkeland current algorithm. The Fok model advances in time the ring current plasma distribution using either a self-consistent RCM field or the semi-empirical Weimer electric field model. A specified height-integrated ionospheric conductance is required for the RCM calculation of the electric field. The Hardy model (Hardy et al., 1987) provides auroral conductance. Losses along the particle drift paths are a key feature of the CIMI model. The CIMI pressure distributions utilized in this study cover an energy range from 75 eV to 133 keV.
Simulated results from CIMI or its predecessors have been tested against a variety of measurements from a number of satellite missions. Some examples are (1) AMPTE/CCE (Fok et al., 2001b), (2) IMAGE ENA images (Fok et al., 2003), (3) Polar/CEPPAD (Ebihara et al., 2008), (4) IMAGE/EUV (Buzulukova et al., 2008), (5) TWINS ENA images (Fok et al., 2010), (6) radiation belt measurements and Akebono (Glocer et al., 2011), (7) TWINS plasma sheet boundary conditions (Elfritz et al., 2014), and (8) TWINS ENA images and Akebono (Fok et al., 2014). Using the Dessler–Parker–Schopke relation (Dessler and Parker, 1959; Sckokpe, 1966), it has also been shown that the simulated CIMI pressures match well with the observed SYM-H (see Fig. 9, Buzulukova et al., 2010). In this study, we present the first direct comparison between CIMI and TWINS ion partial pressure and anisotropy.
Important inputs to the CIMI simulations are the particles injected into the inner magnetosphere along the outer boundary of the simulation. In the simulations shown here, it has been assumed that the particles have a Maxwellian distribution with density and temperature determined by a linear relationship with the solar wind density and velocity, respectively (Borovsky et al., 1998; Ebihara and Ejiri, 2000). A 2 h time delay between the arrival of the solar wind parameters at the nose of the magnetopause and its effect on the ions crossing into the inner magnetosphere has also been assumed (Borovsky et al., 1998). The pitch angle distribution of the incoming ions is taken to be isotropic.
Results from simulations with the CIMI model using two different forms of the electric potential are compared in this investigation. One is the Weimer 2K empirical model (Weimer, 2001) and the other is a self-consistent electric potential from the RCM.
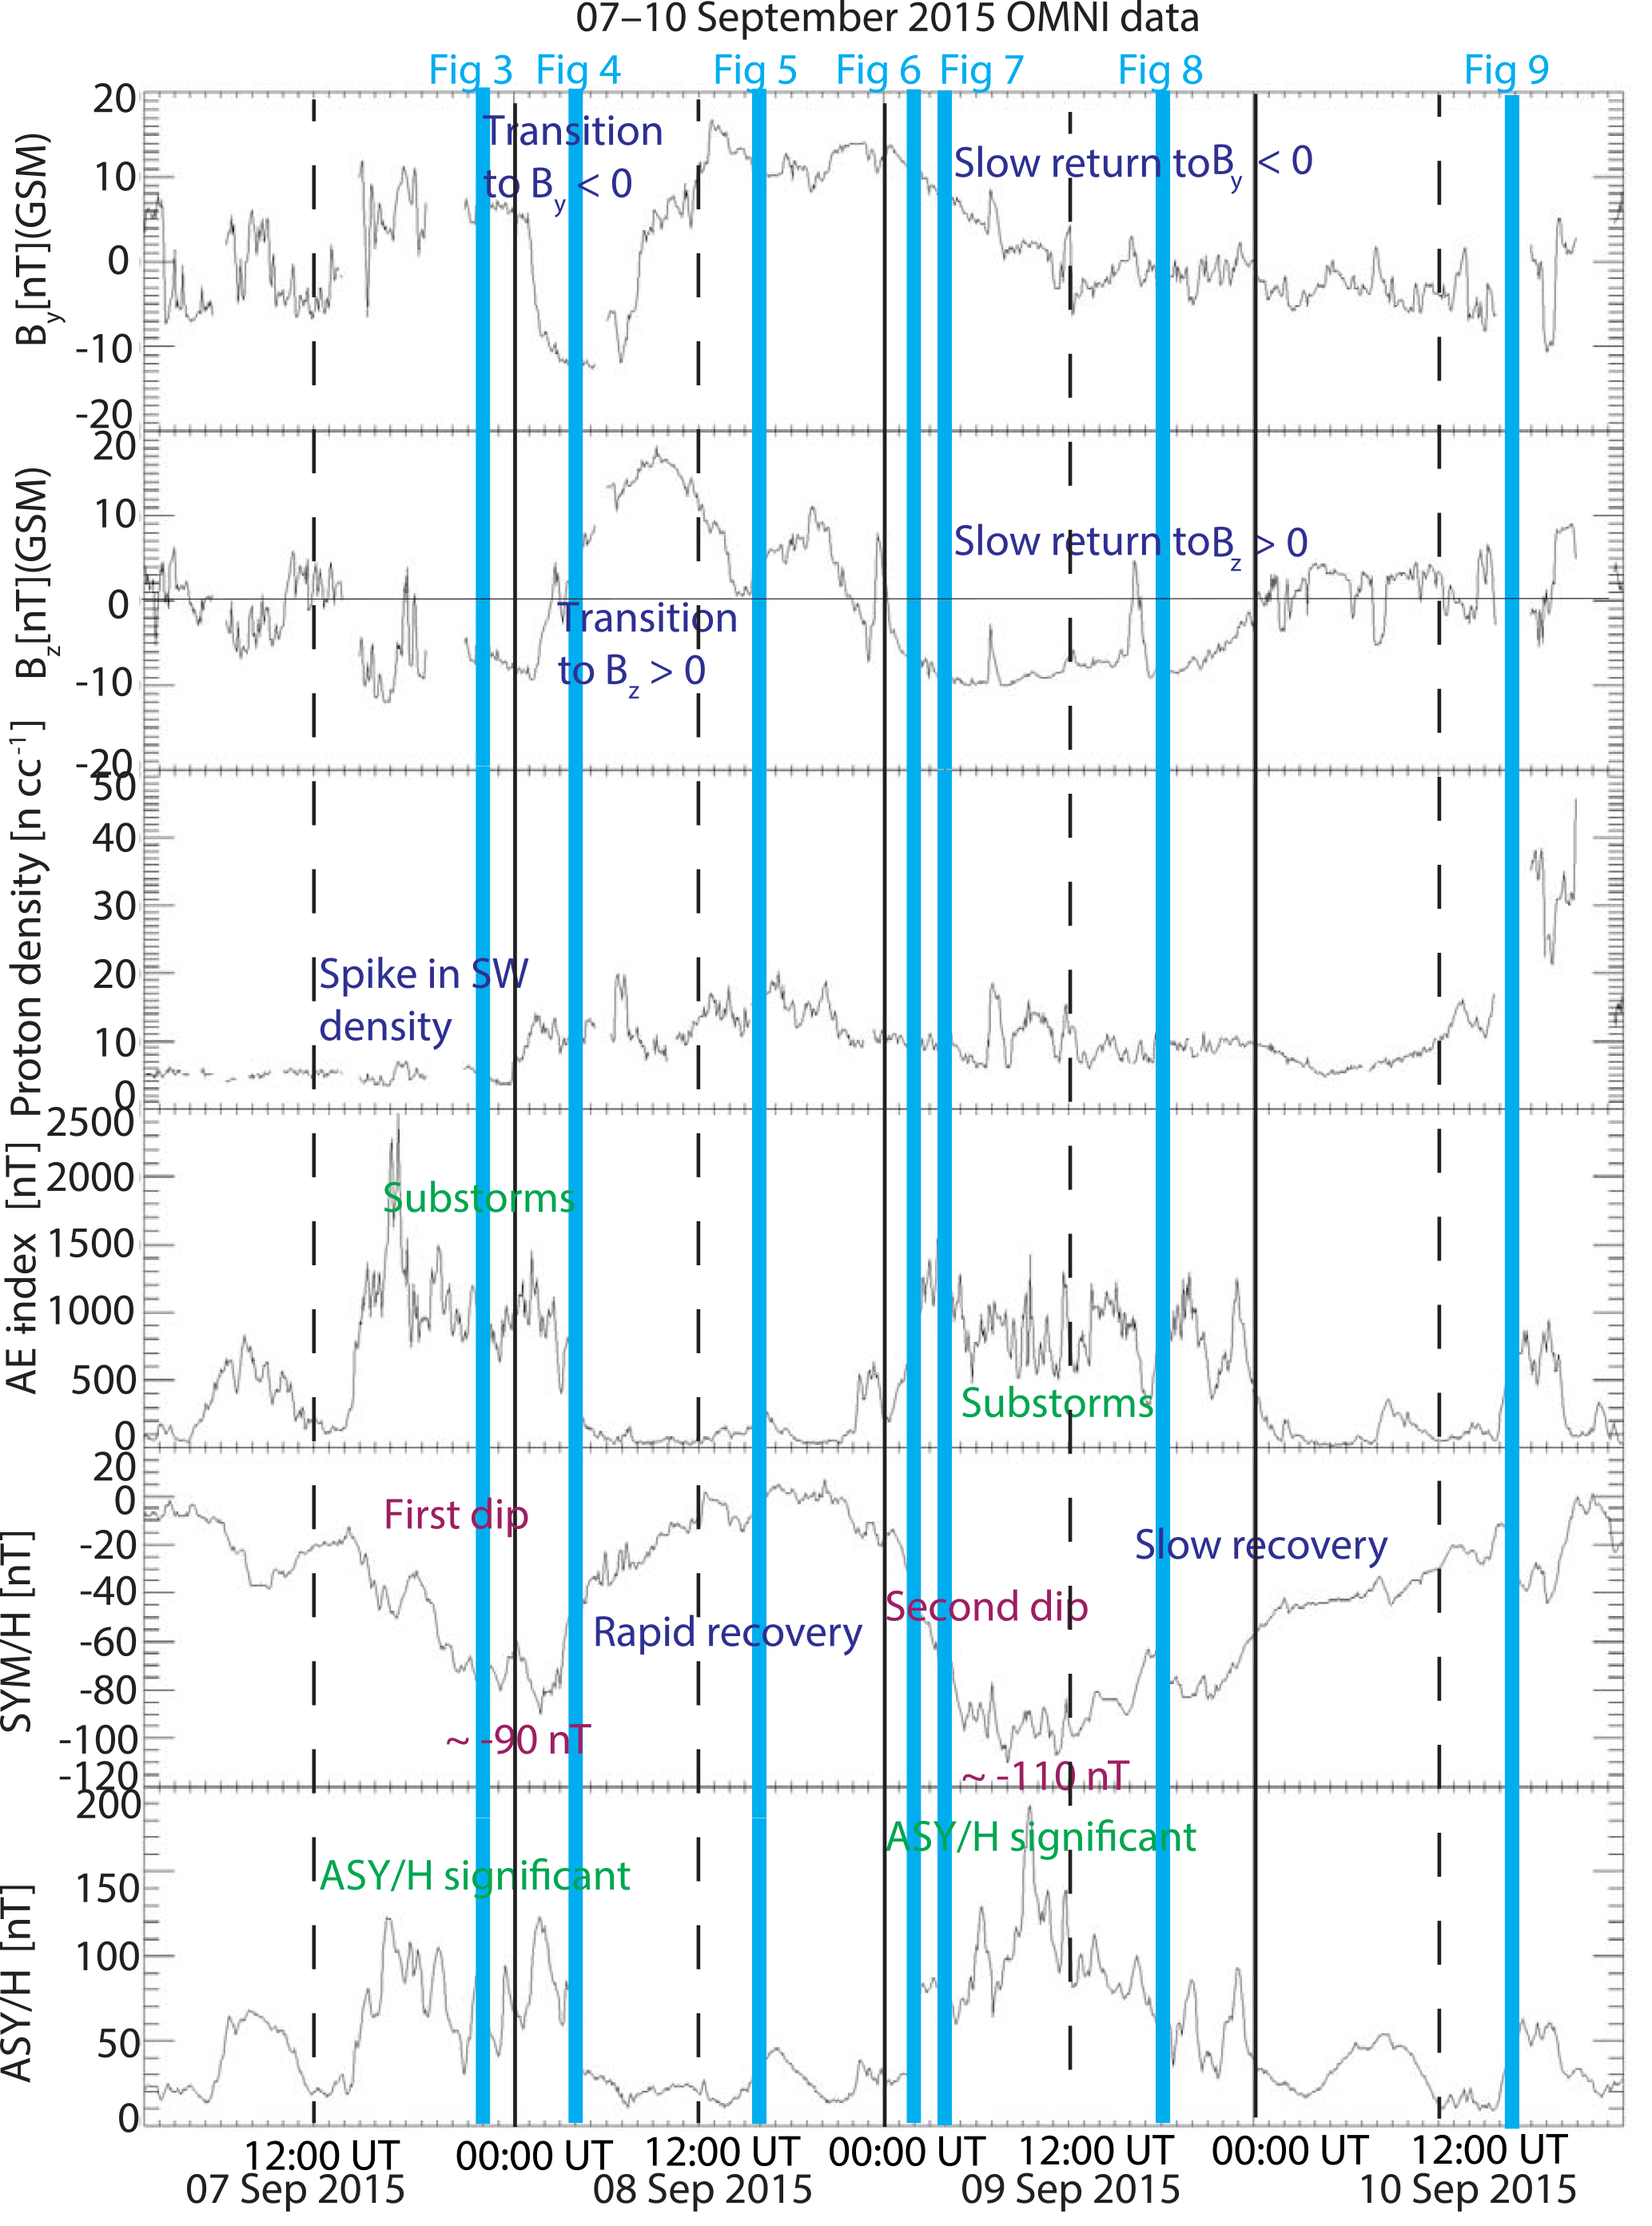
Figure 1The solar wind parameters and geomagnetic indices for the two storms during the period 7–10 September 2015. The data are from the OMNI database (https://omniweb.gsfc.nasa.gov/html/omni_min_data.html, last access: 14 October 2018).
Figure 1 shows solar wind parameters and geomagnetic activity indices from the OMNI data service for 4 days, i.e., 7–10 September 2015. During this 4-day period, there were two SYM-H minima in succession. The first came early on 8 September 2015 after a 1-day long main phase on 7 September 2015. The minimum SYM-H was approximately −90 nT, so it was a relatively weak storm. There was a rapid recovery for approximately 3 h coinciding with a sharp transition of Bz from negative, i.e., −8 or −9 nT, to positive, i.e., +18 or +19 nT, along with a sharp transition of By from positive, i.e., +5 nT, to negative, i.e., −12 or −13 nT. There was also a sharp spike in the solar wind density at the inception of this first recovery phase. After the recovery was completed, there followed about a 12 h period of near 0 nT SYM-H. The main phase of the second storm showed a relatively steady decline in SYM-H to a minimum near −110 nT in about 12 h. The recovery from this second minimum was slow, with a duration of about 1.5 days. The second main phase and minimum corresponded to a slow swing of Bz back to negative and By to a slightly negative value. Also to be noted is the strong AE index, indicative of possible substorm activity during the main phases and early recovery of both minima. There is also some AE activity near the end of the second storm. During those same periods, the ASY-H index also had significant values during the main phase and early recovery of both minima (see Fig. 1).
5.1 Comparison of the location of the equatorial ion partial pressure peaks
Figure 2 shows the location of the equatorial ion partial pressure peaks as measured from the TWINS ENA images (green diamonds) and simulated by CIMI with both the Weimer 2K (red lines) and RCM (orange lines) electric fields. Figure 2a is the radial location for the 4 days of the 7–10 September 2015 storms, and Fig. 2b is the MLT location.
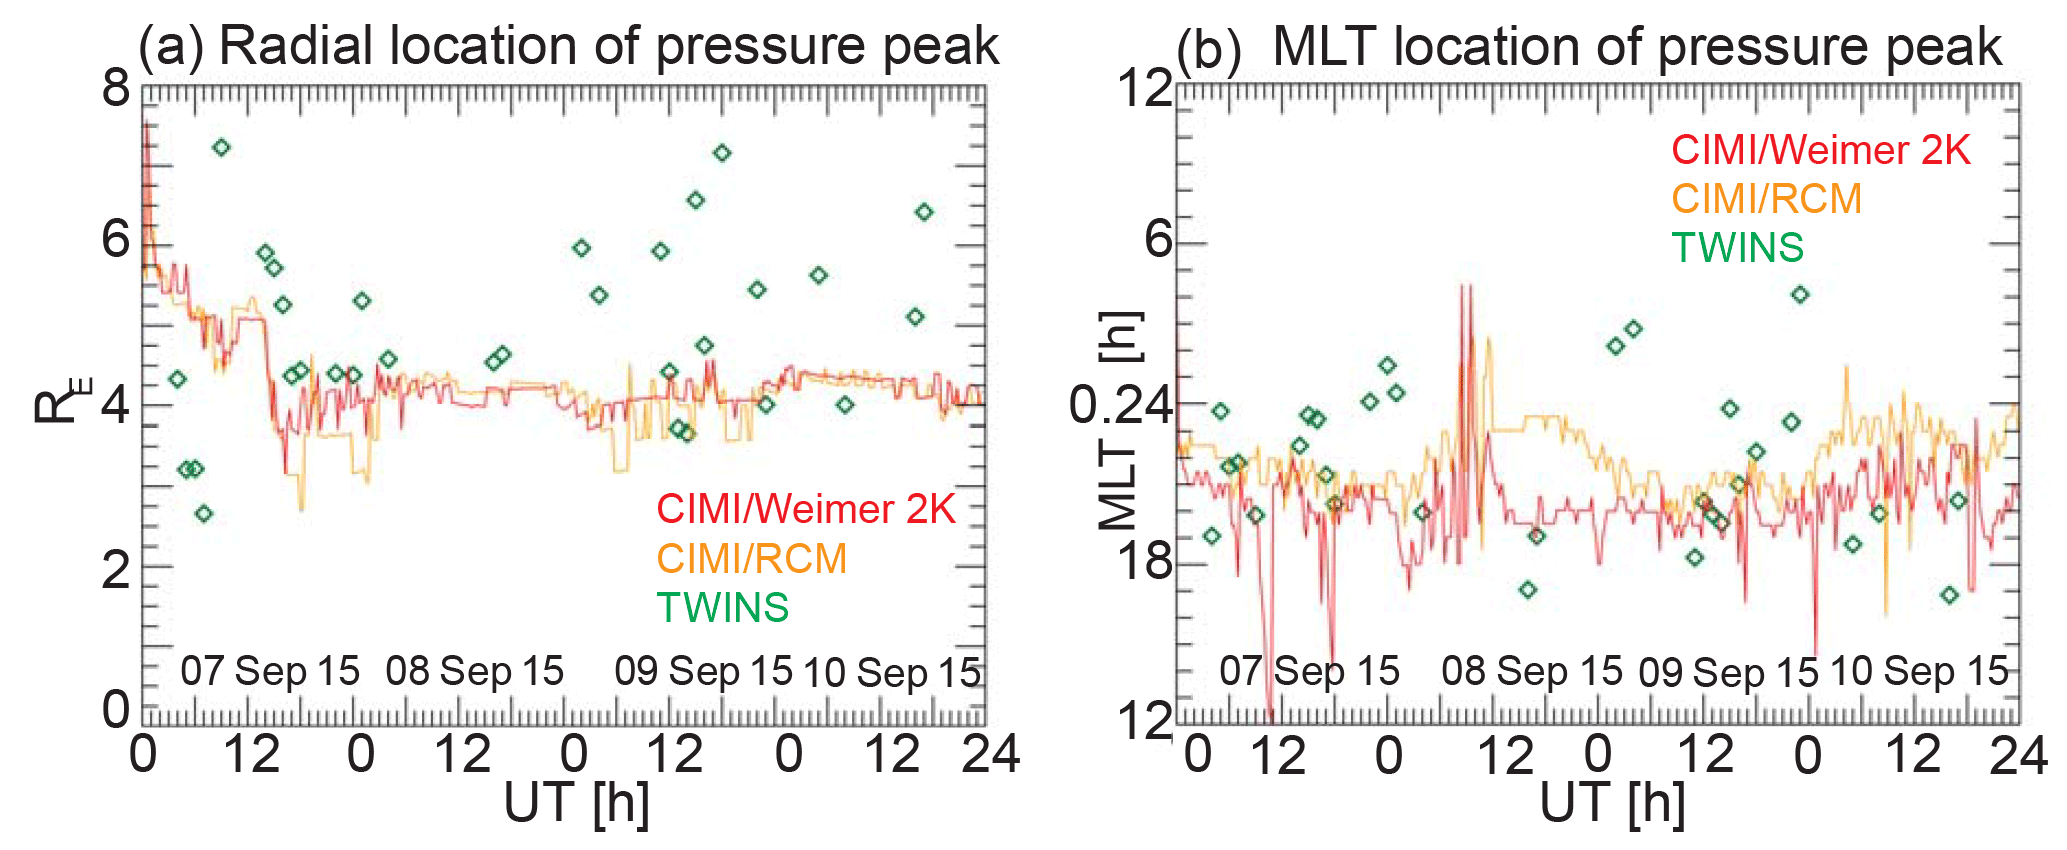
Figure 2Plot of the ion equatorial pressure peak as a function of time during the 4-day period 7–10 September 2015. (a) The radial location and (b) the MLT location. The green triangles mark the locations obtained from the TWINS ENA images, the red line from the CIMI/Weimer simulations, and the orange line from the CIMI/RCM simulations.
The radial positions of the partial pressure peaks for the CIMI simulations are similar, i.e., about 4 RE, for both the Weimer 2K and RCM electric potentials. The RCM results do show more variation. Many of the radial positions for the TWINS observations are also near 4 RE, but others are at larger values. The MLT locations of the peaks are generally in the dusk/midnight sector. This is consistent with statistical analysis of proton fluxes from the database of the magnetospheric plasma analyzer (MPA) instrument aboard Los Alamos satellites at geosynchronous orbit (Korth et al., 1999). But the CIMI simulations, with both the Weimer 2K and RCM potentials, show a brief time early on 8 September 2015 where some of the peaks are in the midnight/dawn sector. Given the assumed 2 h delay in the propagation of the solar wind parameters into the inner magnetosphere, this seems to correlate with a sharp swing in By shown in Fig. 1. The TWINS observations show several instances of the partial pressure peaks being near midnight and in the midnight/dawn sector. As described earlier, ion flux peaks in this region have been seen from ENA images for very strong storms (Fok et al., 2003).
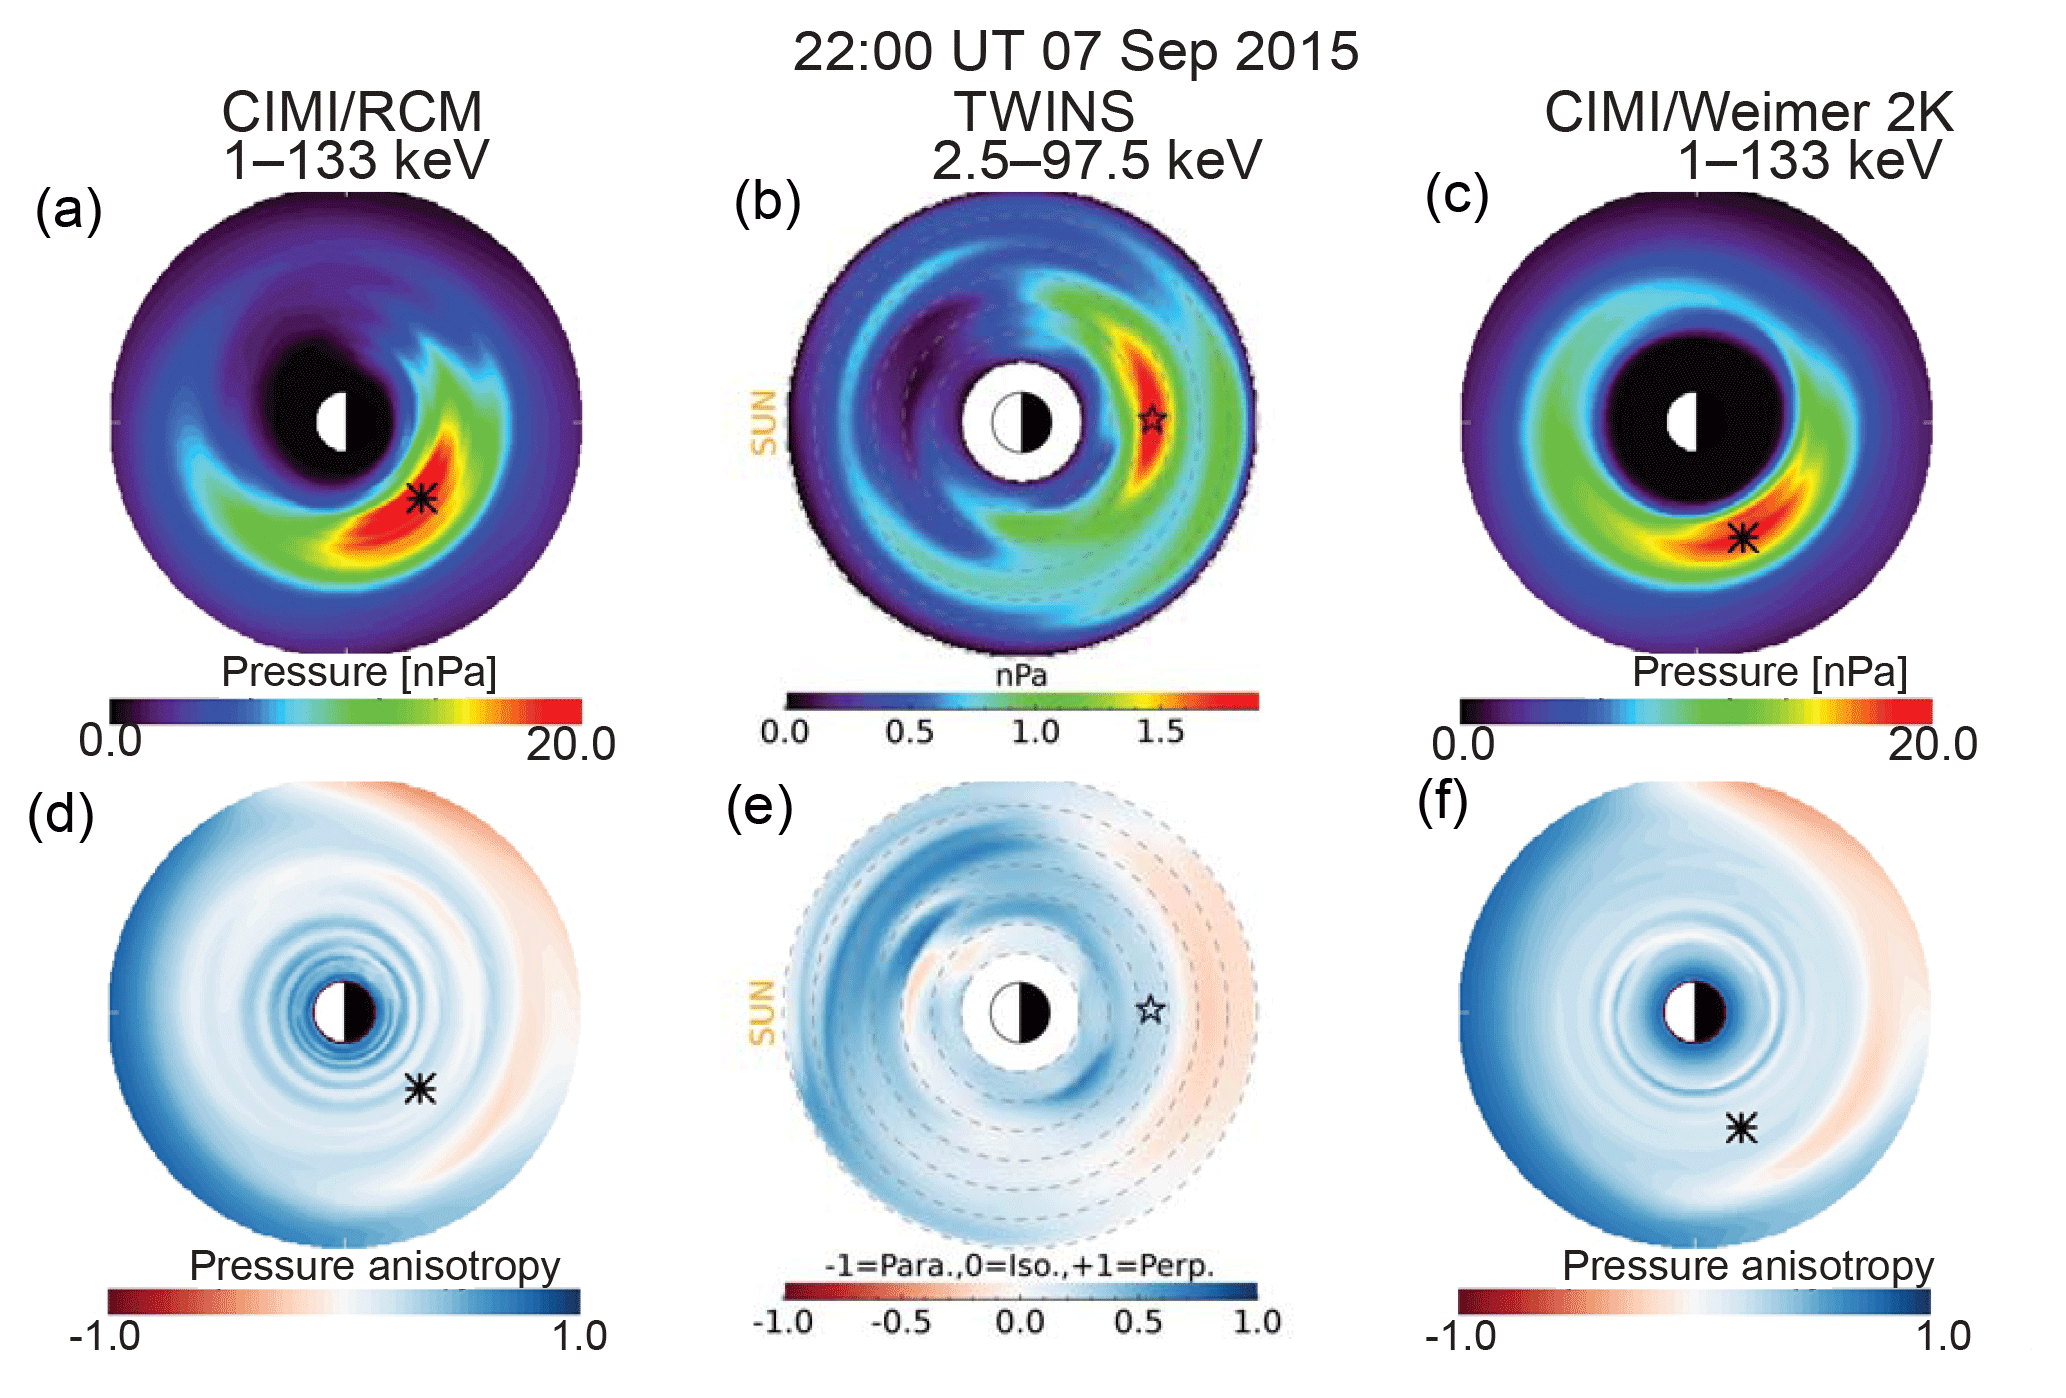
Figure 3The ion equatorial pressure (a–c) and pressure anisotropy (d–f) for 22:00 UT 7 September 2015 from the CIMI/RCM simulations (a, d), from the TWINS ENA images (b, e), and the CIMI/Weimer simulations (c, f). The stars mark the locations of the peaks.
5.2 Comparison of equatorial ion partial pressure peaks and anisotropies at specific times
The following subsections will examine in detail a number of specific times during these two storms in order to address similarities and differences in the simulations with an empirical and self-consistent electric field model and with observations. One apparent difference in what follows is the magnitude of the equatorial partial pressure for the three cases. The maxima on the color bars for Figs. 3–9 were chosen to be different for each time in order to emphasize the spatial dependence of the pressure distribution. The maxima for the two CIMI simulations are very similar; i.e., the RCM vary from 20 to 38 nPa and the Weimer 2K from 15 to 30 nPa. But the maxima of the TWINS peaks vary from 1 to 4 nPa, which is significantly smaller.
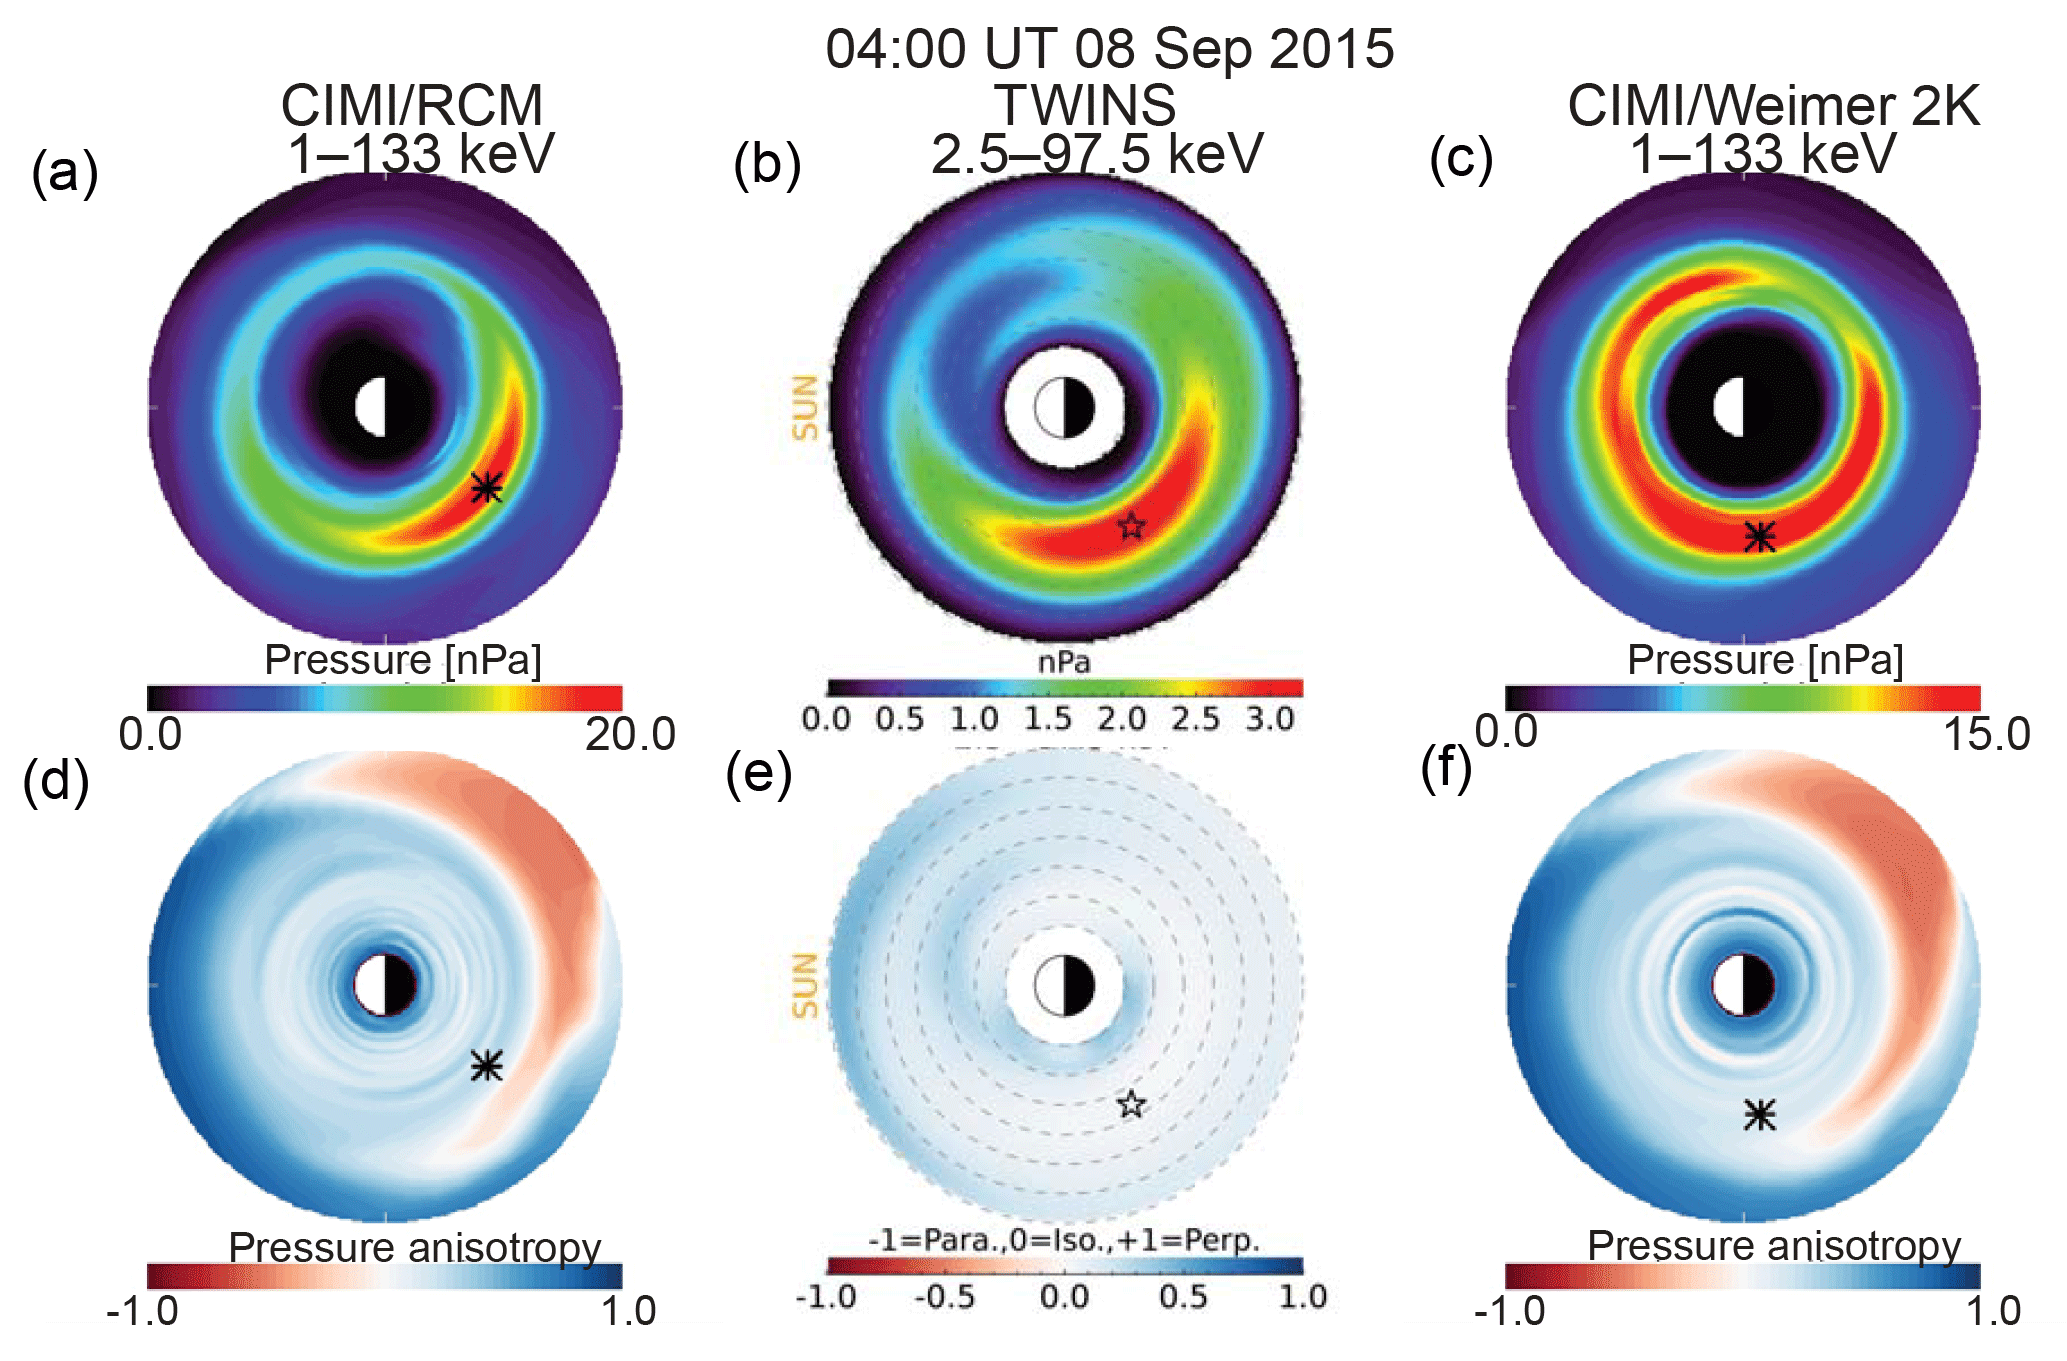
Figure 4The ion equatorial pressure and pressure anisotropy for 04:00 UT 8 September 2015 in the same format as Fig. 3.
The magnitude of the ion intensities derived from the ENA images has been addressed in several previous comparisons with in situ measurements. Vallat et al. (2004) compared Cluster-CIS (Réme et al., 2001) and IMAGE-HENA observations and found that for relatively strong fluxes, the agreement was excellent for two cases, but for another the ion flux determined from the ENA images was somewhat higher than the in situ observations, and in another it was significantly lower. Grimes et al. (2013) compared THEMIS (Angleopoulos, 2008) spectral measurements with spectra obtained from TWINS ENA images and found that the in situ fluxes were a factor of 3 times greater than those obtained from the ENA images. Perez et al. (2016) compared 30 keV ion fluxes obtained from TWINS ENA images with in situ measurements by RBSPICE-A (Mauk et al., 2013) and found good agreement in both the average time-dependent trend and in the magnitude. The in situ measurements, of course, showed more structure given their much higher spatial and temporal resolution. Goldstein et al. (2017) analyzed data from THEMIS, Van Allen probes, and TWINS for a large storm to find that the ion fluxes obtained from the ENA images were generally lower than those from the in situ measurements. They also found significant variations in the in situ data. So while some parts of the difference in the partial pressures obtained from TWINS measurements and CIMI simulations are due to the larger energy range included in the CIMI pressures, it is not the entire explanation. The issue of the absolute magnitude remains an important, unresolved issue, but the fluxes obtained from ENA images have been shown to reflect the global structure of the trapped ring current particles, and that is the emphasis in this study.
5.2.1 22:00 UT 7 September 2015
Figure 3 shows the equatorial partial pressure profiles and the pressure anisotropy from the CIMI/RCM simulation, the TWINS observations, and the CIMI/Weimer 2K simulation at 22:00 UT on 7 September 2015. This was late in the main phase of the first storm (see Fig. 1). The radial locations of the peaks differ by less than 1 RE. The MLT locations of the partial pressure peaks, however, differ by 3 h in MLT. While the TWINS peak is near midnight, the CIMI peaks are well into the dusk/midnight sector, with the CIMI/Weimer even closer to dusk. Results for the Weimer96 when compared with the RCM for a very strong storm showed even greater shielding for the RCM when compared to the empirical Weimer model (Fok et al., 2003). Note, however, that for this weaker storm, the MLT spread in the peaks of the partial pressure distributions do overlap. It is also to be noted that the TWINS results show more radial structure.
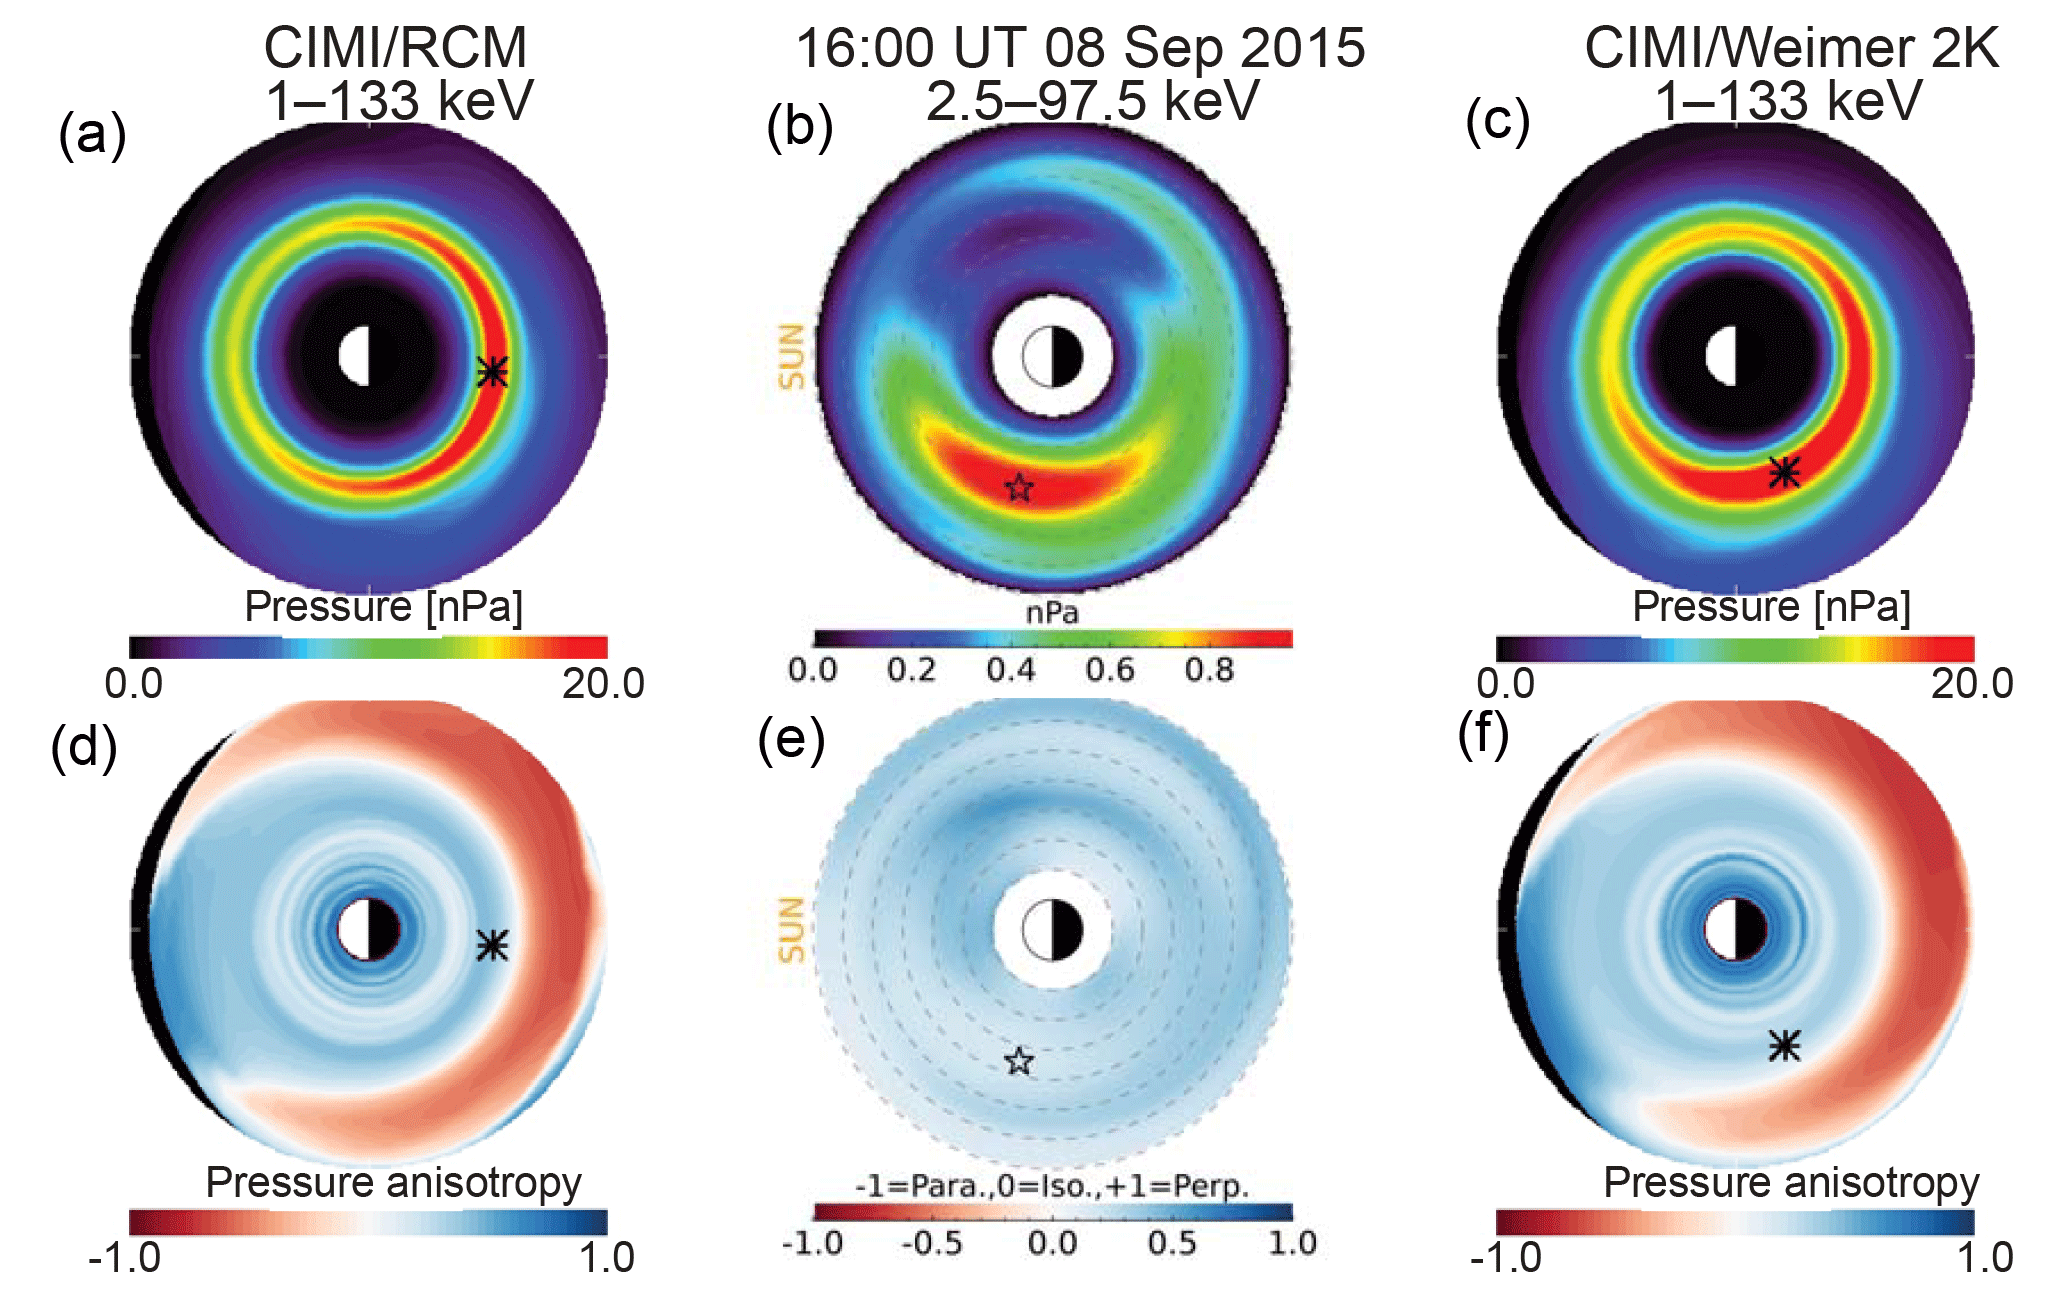
Figure 5The ion equatorial pressure and pressure anisotropy for 16:00 UT 8 September 2015 in the same format as Fig. 3.
The pressure anisotropy shown in Fig. 3 is defined as
with
where α is the ion pitch angle, E is the ion energy, n is the ion density, m is the ion mass, and F (E, n, cos α) is the number flux per unit area, energy, time, and steradian. This definition is derived from Braginskii (1965) and is consistent with previous formulations, e.g., Lui et al. (1987).
The pressure anisotropy at the pressure peaks is somewhat perpendicular in all three cases. We also note a region of parallel anisotropy at R> 6–7 RE from pre-midnight to dawn in all three.
5.2.2 04:00 UT 8 September 2015
Figure 4 shows results for 04:00 UT 8 September 2015 in the same format. This was early in the rapid recovery phase of the first minimum in SYM-H (see Fig. 1). The radial locations of the partial pressure peaks again differ by less than 1 RE. This time, however, all the peaks are in the dusk/midnight sector. Again, the CIMI/Weimer 2K is closer to dusk than the CIMI/RCM pressure profiles. The TWINS peak is between the two simulations. The CIMI/Weimer 2K pressure distribution is more symmetric than the others even though the ASY-H shown in Fig. 1 is > 50 nT. The region of parallel pressure anisotropy in the CIMI results does not appear in the TWINS results, which are more nearly isotropic in general compared to the CIMI simulations.
5.2.3 16:00 UT 8 September 2015
Figure 5 shows results for 16:00 UT 8 September 2015 in the same format. This was during the period of near 0 nT SYM-H between the two storm minima. It was during a time period when both Bz and By are positive (see Fig. 1). Again, the radial locations of the partial pressure peaks are similar. The TWINS peak, however, has moved to the noon/dusk sector. It has continued to move westward from its positions in Figs. 3 and 4. This could be the classic drift due to magnetic field gradient and curvature as originally observed in IMAGE/HENA ENA images by Brandt et al. (2001). In contrast to the TWINS pressure profile, the CIMI pressures reflect a nearly symmetric ring current. While ASY-H was relatively low at this time, it did show a small peak (see Fig. 1). Both the CIMI/RCM and CIMI/Weimer 2K results show a region of parallel pressure anisotropy at large radii that almost circles the Earth. The TWINS results show only perpendicular pressure anisotropy.
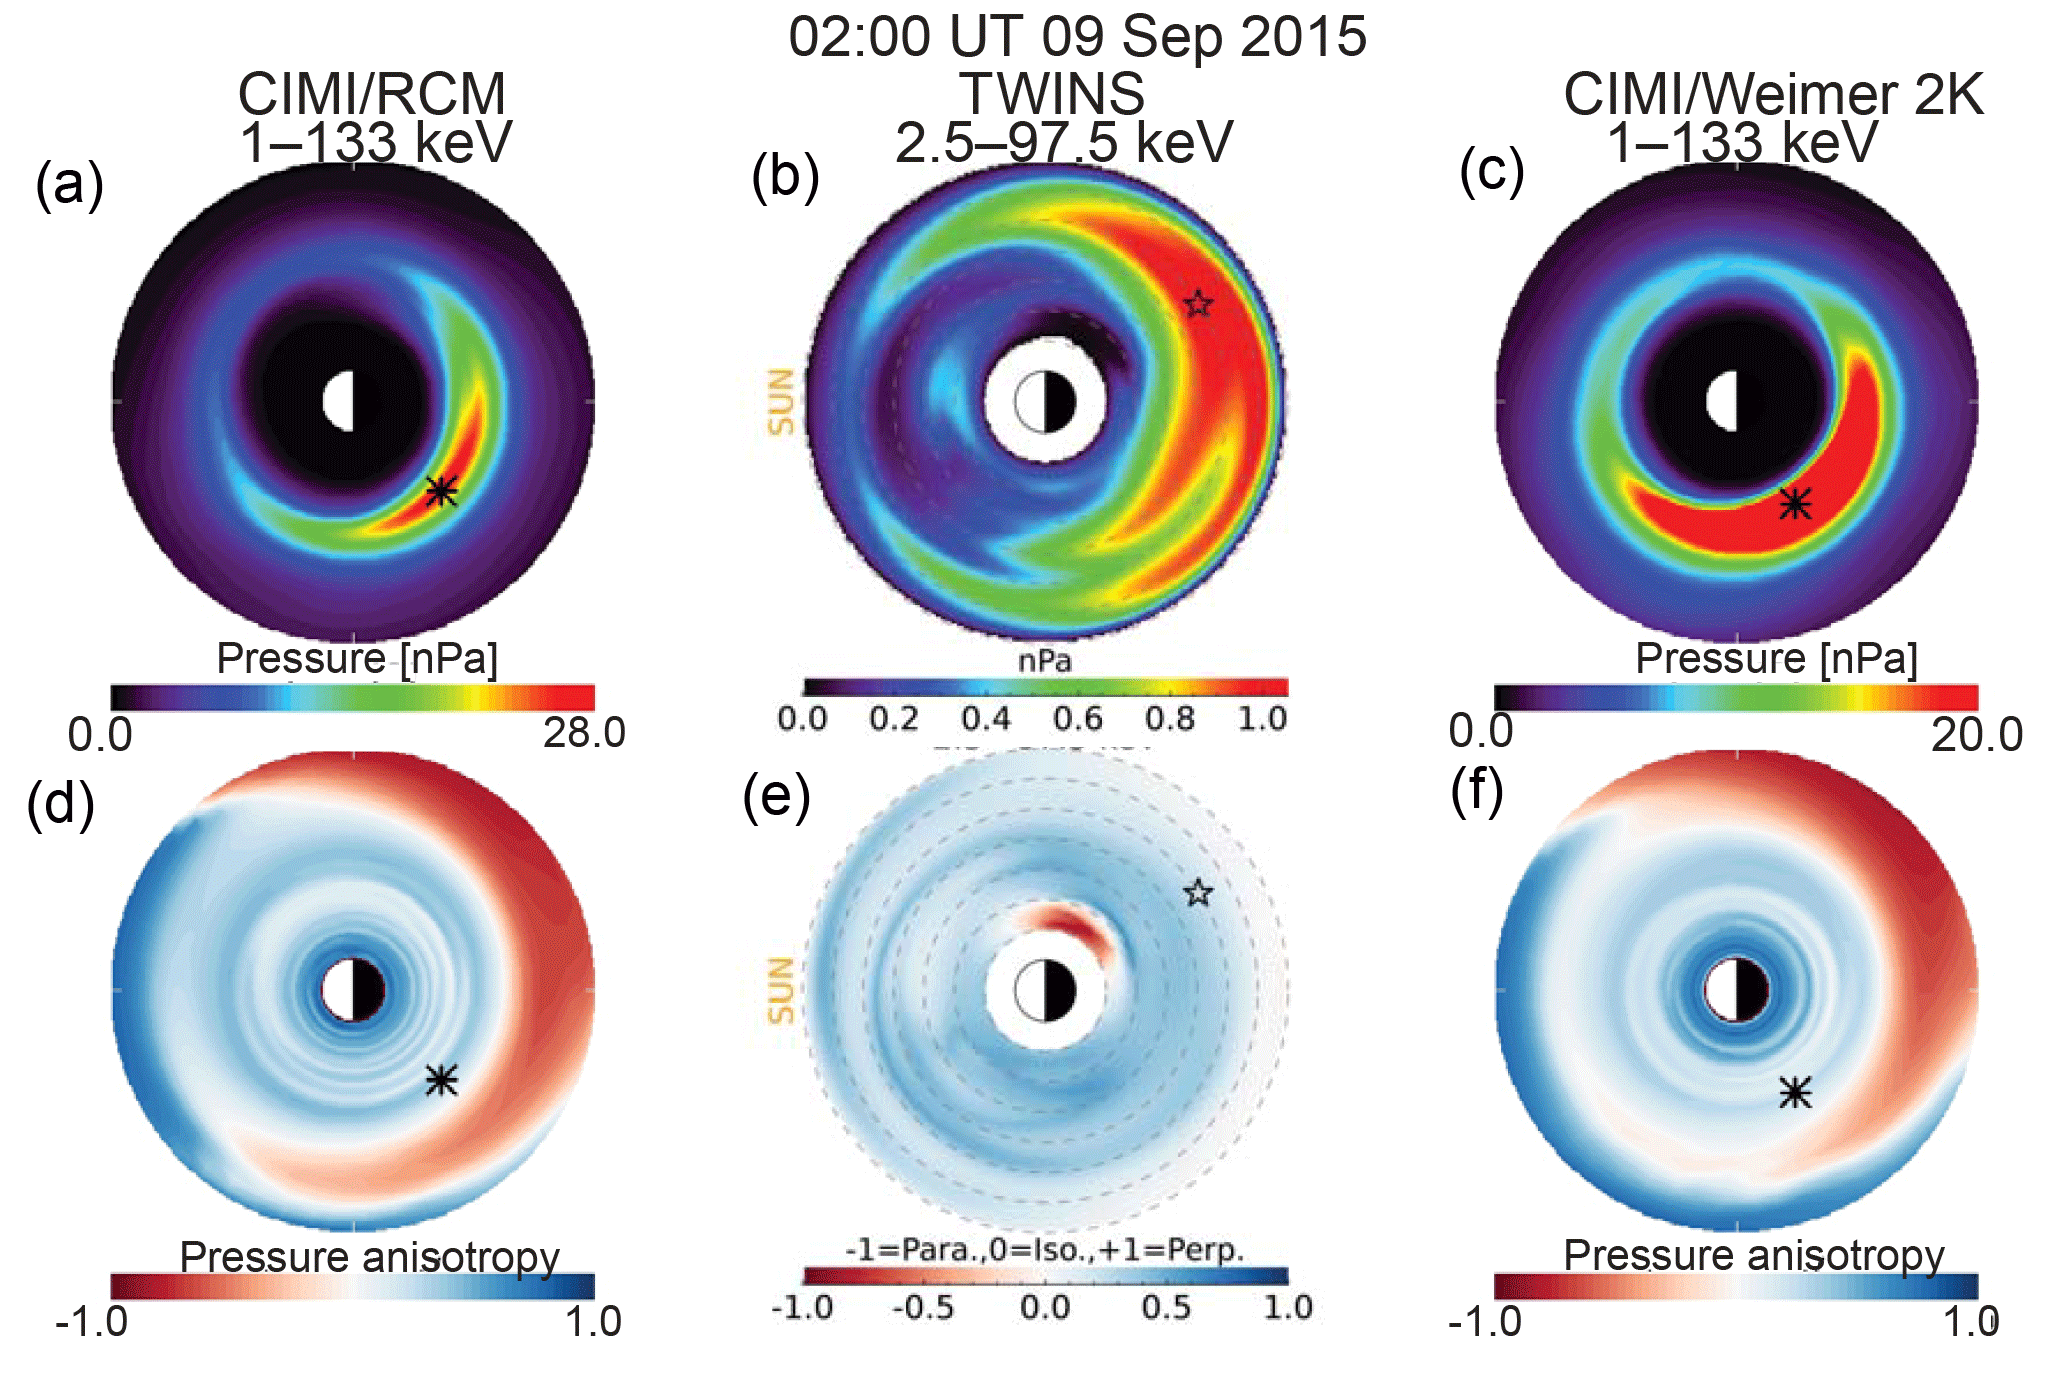
Figure 6The ion equatorial pressure and pressure anisotropy for 02:00 UT 9 September 2015 in the same format as Fig. 3.
5.2.4 02:00 UT 9 September 2015
Figure 6 shows results for 02:00 UT 9 September 2015 in the same format. This is early in the main phase of the second minimum in SYM-H (see Fig. 1). The TWINS equatorial ion partial pressure peak is at a larger radius and in the midnight/dawn sector, in contrast to the CIMI results, where the peaks are in the dusk/midnight sector. There is considerably more spatial structure in the TWINS results. The strongest TWINS peak extends well into the dusk/midnight sector with a region near the same location as the CIMI peaks and with another at a larger radius in the dusk/midnight sector. There is an even larger difference in the pressure anisotropy. The parallel region at large radii in the CIMI result is even more parallel but is again absent in the TWINS result. The small intense parallel region at a very small radius in the TWINS plot is a region of very low flux and therefore not a reliable ratio. At this time, the AE index was rising sharply, as was the ASY-H index (see Fig. 1).
5.2.5 04:00 UT 9 September 2015
Figure 7 shows results for 04:00 UT 9 September 2015 in the same format. This was just 2 h later than the time shown in Fig. 6. It was near the end of the main phase of the second minimum in SYM-H (see Fig. 1). Again, the TWINS peak is in the midnight/dawn region, whereas the CIMI peaks appear in the dusk/midnight region, but the radial location is very nearly the same. This time, however, the TWINS peak extends past dawn and not into the pre-midnight region. Even though the MLT locations of the CIMI/RCM and CIMI/Weimer 2K peaks are nearly the same, the CIMI/Weimer 2K maximum extends to almost noon. The pressure anisotropy shows features very similar to those seen 2 h previously (see Fig. 6). The AE index has been at fairly high values for about an hour and the ASY-H index is beginning to rise sharply again (see Fig. 1).
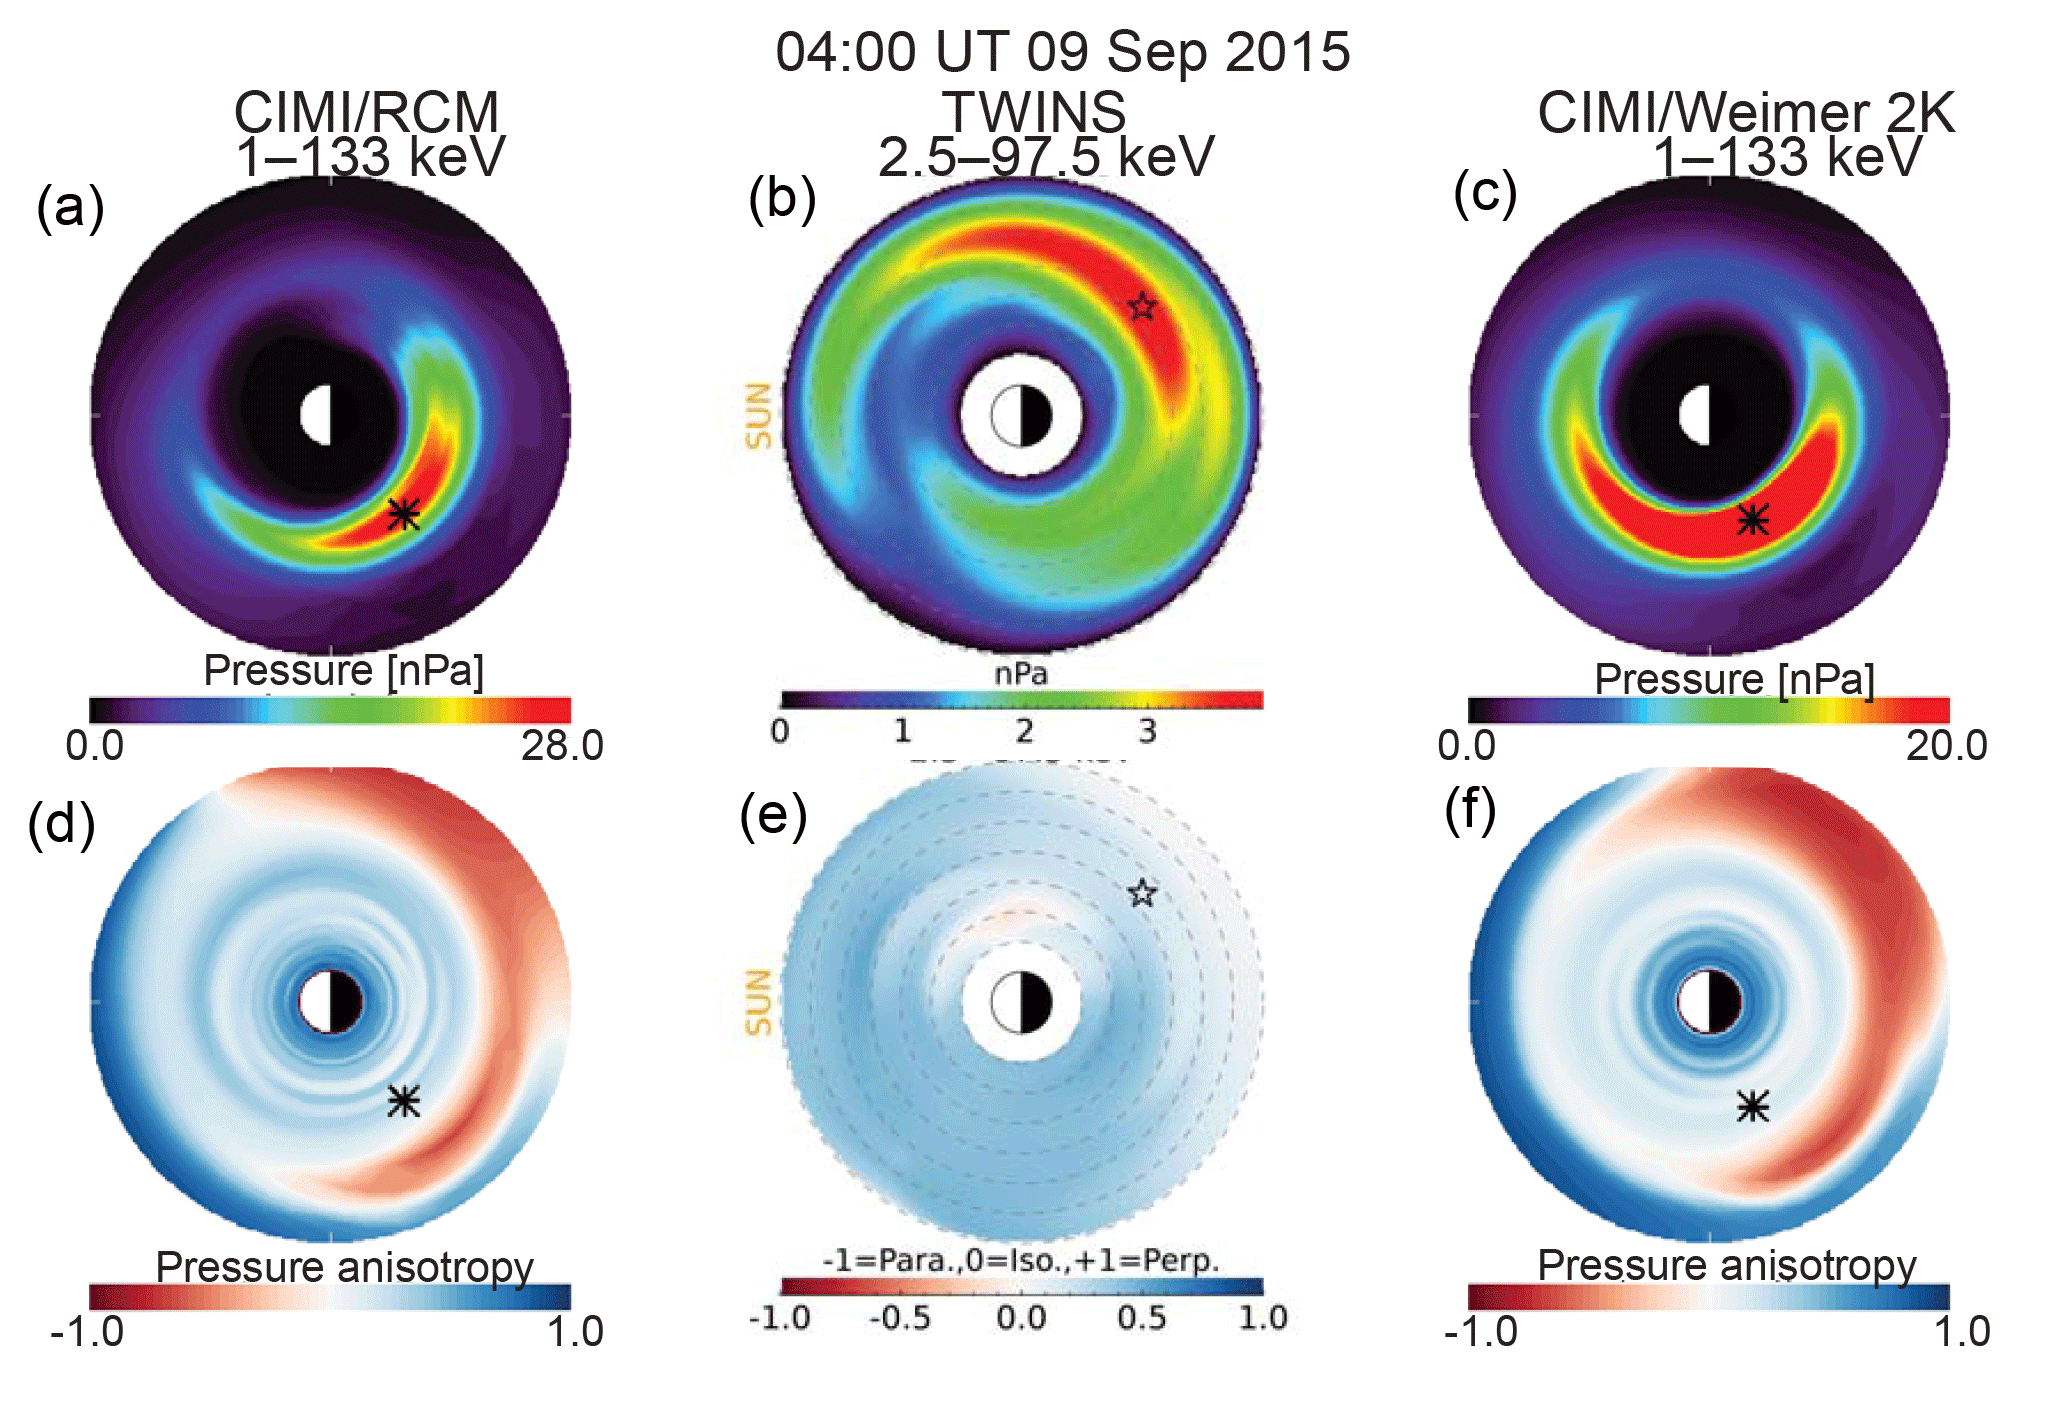
Figure 7The ion equatorial pressure and pressure anisotropy for 04:00 UT 9 September 2015 in the same format as Fig. 3.
5.2.6 18:00 UT 9 September 2015
Figure 8 shows results from 18:00 UT 9 September 2015 in the same format. At this time SYM-H (see Fig. 1) shows that the second storm was a few hours into a slow recovery. There are four distinct peaks in the TWINS equatorial ion partial pressure distribution. The highest is at large radius, about 7 RE, in the dusk/midnight sector. There is another lower peak, also at large radius in the noon/dusk sector. There are two peaks at a similar radius to the CIMI peaks. This interval is an example of multiple peaks in the ring current that have been inferred from in situ measurements (Liu et al., 1987) and seen in analysis of ENA images (Perez et al., 2015). The parallel pressure anisotropy in the CIMI results is again present, but it is smaller and weaker than at previous times. Again, TWINS does not show this feature.
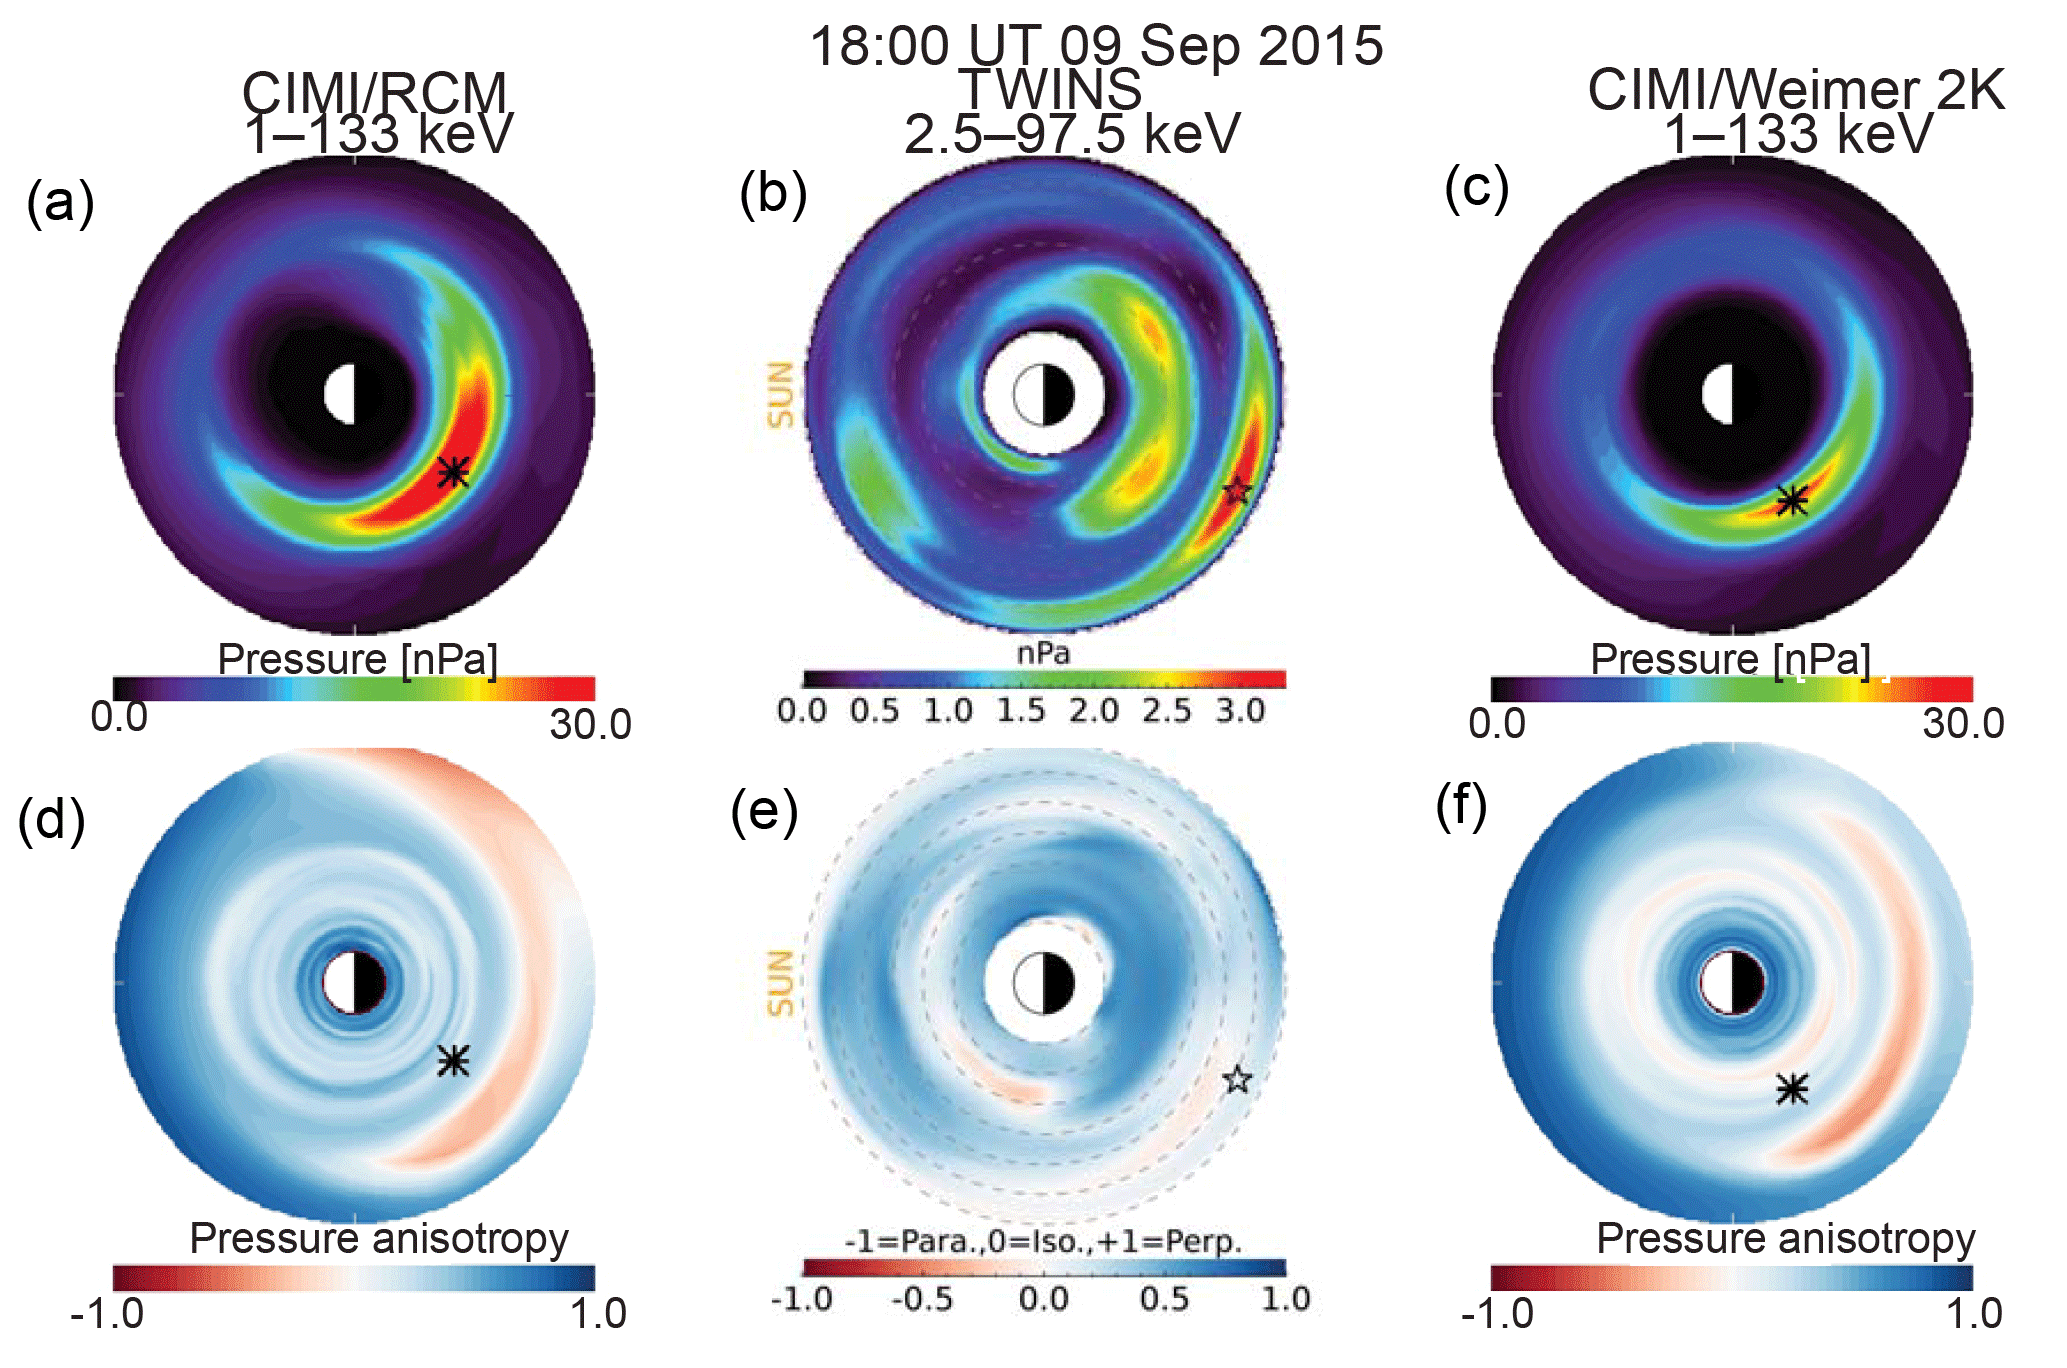
Figure 8The ion equatorial pressure and pressure anisotropy for 18:00 UT 9 September 2015 in the same format as Fig. 3.
5.2.7 17:00 UT 10 September 2015
Figure 9 shows results from 17:00 UT 10 September 2015 in the same format. At this time the second storm was well into its slow recovery, SYM-H was beginning a small dip, there was a peak in the AE index, and ASY-H had a weak peak (see Fig. 1). The partial pressure profiles for CIMI/RCM and CIMI/Weimer 2K are symmetrical with a peak in the dusk/midnight sector. The TWINS partial pressure peak is closer to dusk. This interval is in contrast to results at earlier times in the storm. The TWINS partial pressure peak is at a larger radius, and there is very little flux in the dawn/noon sector. The CIMI pressure anisotropies again show a region of strong parallel pitch angles that is not seen in TWINS.
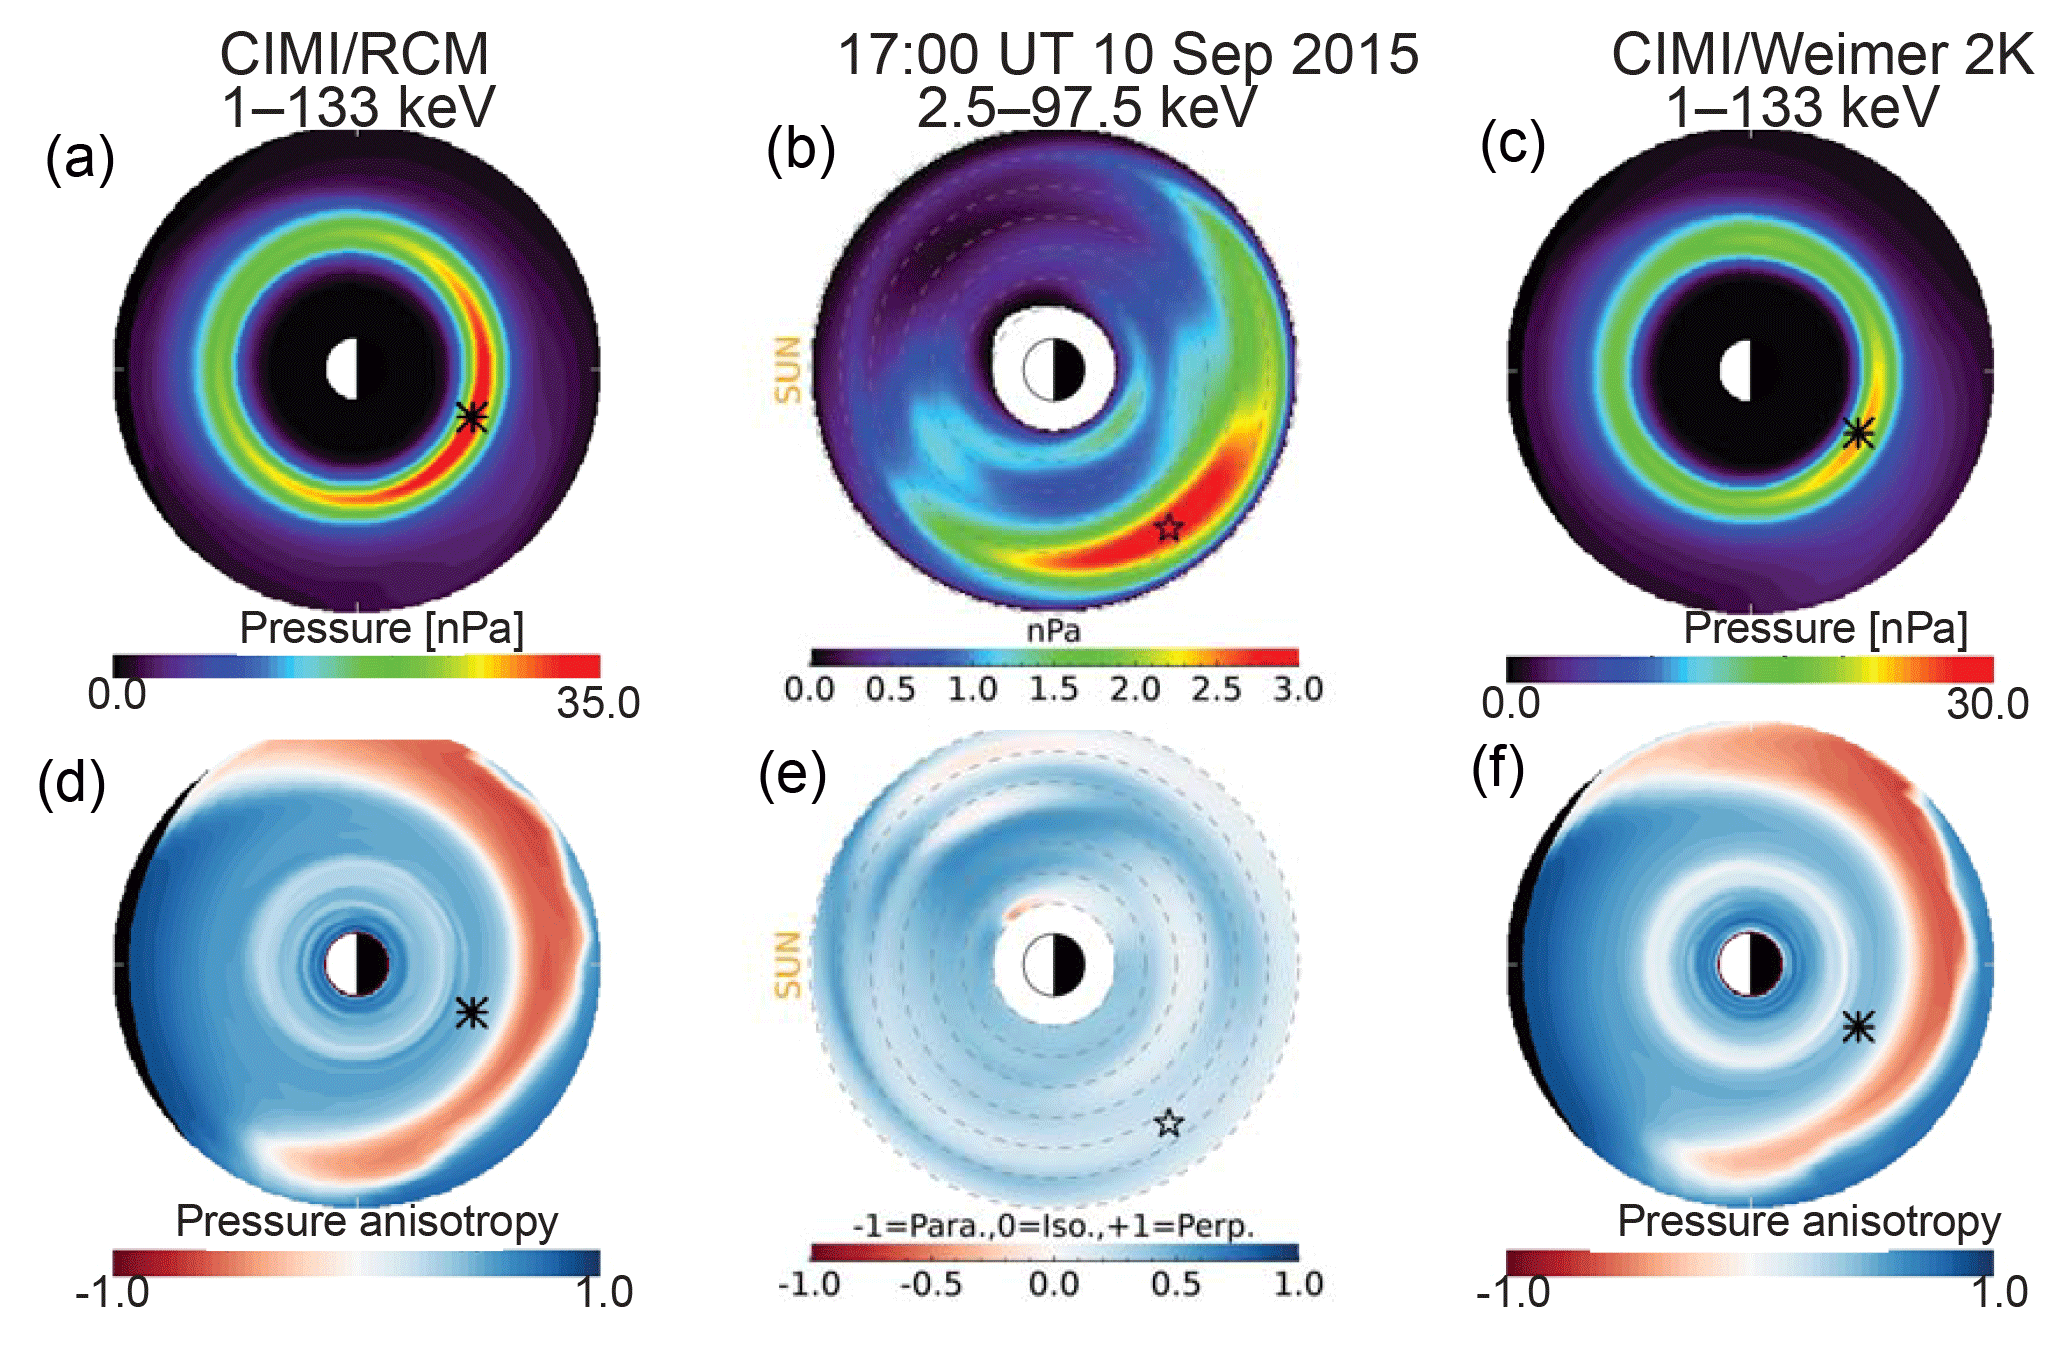
Figure 9The ion equatorial pressure and pressure anisotropy for 17:00 UT 10 September 2015 in the same format as Fig. 3.
Injections from the plasma sheet are thought to be the primary source of ring current protons in the inner magnetosphere, i.e., those that are observed by TWINS. Electric and magnetic fields determine the ultimate path of the injected ions, i.e., whether they reach locations close enough to the Earth where the magnetic gradient and curvature drifts are strong enough to exceed the electric drift forming the ring current or whether they drift out to the magnetopause. The locations of the partial pressure peaks from the CIMI/RCM and CIMI/Weimer 2K simulations and the TWINS observations during the 4-day period, 7–10 September 2015, show that the peaks are usually in the dusk/midnight sector (see Fig. 2b). This phenomenon is consistent with analysis of data at geosynchronous orbit (Birn et al., 1997). Nevertheless the TWINS observations show partial pressure peaks that are often at larger radii than the CIMI simulations, even when they are in the dusk/midnight sector (see Fig. 2a). The fact that the CIMI/Weimer peaks are generally closer to dusk than the CIMI/RCM (see Fig. 2b) is consistent with simulations reported by Fok et al. (2003). The TWINS MLT locations are closer to midnight and in the midnight/dawn sector more frequently than the CIMI results. This suggests that there are often enhanced electric shielding and effects from localized and short time injections that are not present in the CIMI simulations.
To understand how the electric shielding works to affect the paths of the injected particles, we note that the convection electric field from the solar wind is mapped into the magnetosphere along open field lines into the polar ionosphere. It is then shielded from penetrating to lower latitudes and therefore further into the inner magnetosphere by the Birkeland Region 2 currents driven by pressure gradients in the ring current. During geomagnetic storms when there is a sharp turn in the z-component of the interplanetary magnetic field (IMF) from negative to positive (see row 2 of Fig. 1), the accompanying electric field in the ionosphere associated with the Region 2 currents can produce what is referred to as over-shielding. See for example Jaggi and Wolf (1973). There are also neutral disturbance dynamo electric fields in the ionosphere that affect electric shielding. Localized and short time injections may contribute to the complexity of these effects.
Looking in detail reveals an even more complex story. Figures 3–9 show comparisons of the partial pressure profiles during different phases of the storms. In the main phase of the first storm (see Fig. 3), while there is a significant AE index and ASY-H asymmetry (see Fig. 1), the observed TWINS peak is at midnight while the simulated peaks are more toward dusk. During the rapid recovery phase of the first storm (see Fig. 4) when the AE index is smaller (see Fig. 1), the observed and simulated partial pressure peaks are at approximately the same radius, and all are in the dusk/midnight sector. During the period between the two storms (see Fig. 5) when there is very little geomagnetic activity, i.e., SYM-H near 0 nT (see Fig. 1), the observed partial pressure peak has drifted more westward than the simulated peaks, even going past dusk (see Fig. 5). Another feature to note is the symmetry of the ring current in the CIMI simulations, whereas the TWINS observations show a gap in the dawn/noon sector. The ASY-H index shows a small peak at this time (see Fig. 1). This suggests time dependence in the electric and magnetic fields that is not present in the CIMI simulations.
It is in the second storm (Figs. 6–8) that the TWINS observations begin to show more spatial and temporal structure than the CIMI simulations. In Fig. 6, early in the main phase, the TWINS observations show the main partial pressure peak near 6 RE and 03:00 MLT, while the simulated peaks are near 4 RE and 20:00 MLT. But there is also a strong observed pressure region in the same area as the simulated peaks. Just 2 h later, the simulated pressure shows little change, but the observed main peak extends farther eastward, and the relative pressure in the dusk/midnight region has weakened relative to the main peak. Fourteen hours later in the recovery phase of the second storm, the simulated peaks have not changed significantly, whereas the TWINS observed peaks are dramatically different (see Fig. 8). There are four pressure peaks. The strongest peak is at 7 RE and just westward of midnight. At smaller radii, there is a weaker peak near the location of the simulated peaks as well as one on the dawn side past midnight. There is another weaker peak at large radius near noon. It should be noted that there is strong AE activity and that ASY-H has significant values during this period (see Fig. 1). This activity suggests that there may be variations in the electric and magnetic fields produced by spatial and time dependence of the location of the ion injections that are not present in the CIMI simulations.
The increased structure in the partial pressure distributions as observed by TWINS is especially dramatic during the recovery phase of the second storm (see Fig. 8). There is strong AE activity and the largest values of ASY-H during this period. In the late recovery of the second storm (see Fig. 9), the CIMI simulations show a symmetric ring current, as expected (Pollock et al., 2001). The TWINS results are not symmetric and have a peak at large radius in the dusk/midnight sector. There is some AE activity and a rise in the ASY-H index at this time.
Figures 3–9 also show comparisons of the pressure anisotropy during the different phases of the storm. The pressure anisotropies at the partial pressure peaks are generally in good agreement among the three results presented here; i.e., the pitch angle distributions are more perpendicular than parallel. The CIMI simulations, however, show a consistent region of parallel anisotropy at radii outside the pressure peak. The degree to which the pitch angle distributions are more parallel increases until the early recovery phase of the second storm (see Fig. 8) where it weakens but then strengthens again in the late recovery phase. This feature is seen by TWINS only in the main phase of the first storm (see Fig. 3) and perhaps very faintly in the early recovery phase of the second storm (see Fig. 8). The ions that are injected at the boundary of the CIMI simulations, located at 10 RE for those shown here, have an isotropic pitch angle distribution. As they are accelerated while conserving the first adiabatic invariant to enter the region observed by TWINS, i.e., an outer radius of 8 RE, their pitch angle distributions become parallel because the energy increase exceeds what can be absorbed in the perpendicular pitch angles while still conserving the first adiabatic invariant. One mechanism for reducing the parallel anisotropy is wave–particle interactions which are not included in the CIMI simulations.
Another possible contributing factor to the differences between the observations and simulations is the input to the CIMI model used in these simulations. Following Fok et al. (2014), the ion distribution at the boundary of the CIMI simulations in this study is an isotropic, Maxwellian distribution at a radius of 10 RE at all MLT. The density and temperature of the Maxwellian is taken to have a linear relation to the solar wind density and solar wind velocity, respectively (Borovsky et al., 1998; Ebihara and Ejiri, 2000). This produces a relatively smooth time variation in the input which has been shown to be successful in matching the general features of SYM-H (Buzulukova et al., 2010), but does not match the more rapid variations as a function of time. It has also been shown that varying the spatial dependence of the input along the boundary can have a significant effect on the location of the pressure peaks (Zheng et al., 2010). Likewise, Buzulukova et al. (2010) showed that input of non-isotropic pitch angle distributions can affect the comparison between the CIMI simulations and the ENA observations.
There is significant experimental evidence for temporal and spatial variations in the injection of ions into the trapped particle region of the ring current (e.g., Birn et al., 1997; Daglis et al., 2000; Lui et al., 2004). Bursty bulk flows associated with near-Earth magnetic reconnection events have been frequently observed in the magnetotail (Angelopoulos et al., 1992). These fast flows have been observed to have a 1–3 RE width in the dawn–dusk direction (e.g., Angelopoulos et al., 1996, 2002; Nakamura et al., 2001). Magnetic flux ropes flowing earthward have also been observed (e.g., Slavin et al., 2003; Eastwood et al., 2005; Imber et al., 2011). Short time, spatially limited injections into the inner magnetosphere have also been seen in 3-D hybrid simulations (e.g., see Lin et al., 2014). Thus it is reasonable to suppose that the additional spatial and temporal structure in the partial pressure profiles observed during this storm is due to effects not yet incorporated into the simulations.
Buzulukova et al. (2008) combined the Comprehensive Ring Current Model (CRCM) (Fok et al., 2001) and the Dynamical Global Core Plasma Model (Ober et al., 1997) to model features of the plasmasphere observed by the Extreme UltraViolet (EUV) instrument on the Imager for Magnetosphere-to-Aurora Global Exploration (IMAGE) (Burch, 2000) on 17 April 2002. They found that injections from the plasma sheet that were localized in MLT explained observed undulations of the plasmasphere. Some features of an inductive electric field were included through the use of a time-dependent magnetic Tsy96 (Tsyganenko and Stern, 1996) magnetic field model.
Likewise, Ebihara et al. (2009) compared CRCM simulations with midlatitude Super Dual Auroal Radar Network (SuperDARN) Hokkaido radar observations of fluctuating iononspheric flows on 15 December 2006. Using input from geosynchronous satellites to model the temporal and spatial variations of the plasma sheet input to the inner magnetosphere, they were able to show that the resulting pressure variations in the ring current were responsible for field aligned currents and matched the dynamics of the observed subauroral flows. The results from the CRCM also showed multiple pressure peaks inside of 4 RE. This is indicative of a strong connection between the dynamics of the ring current pressure distribution and the rapid temporal characteristics of the subauroral plasma flow during a geomagnetic storm.
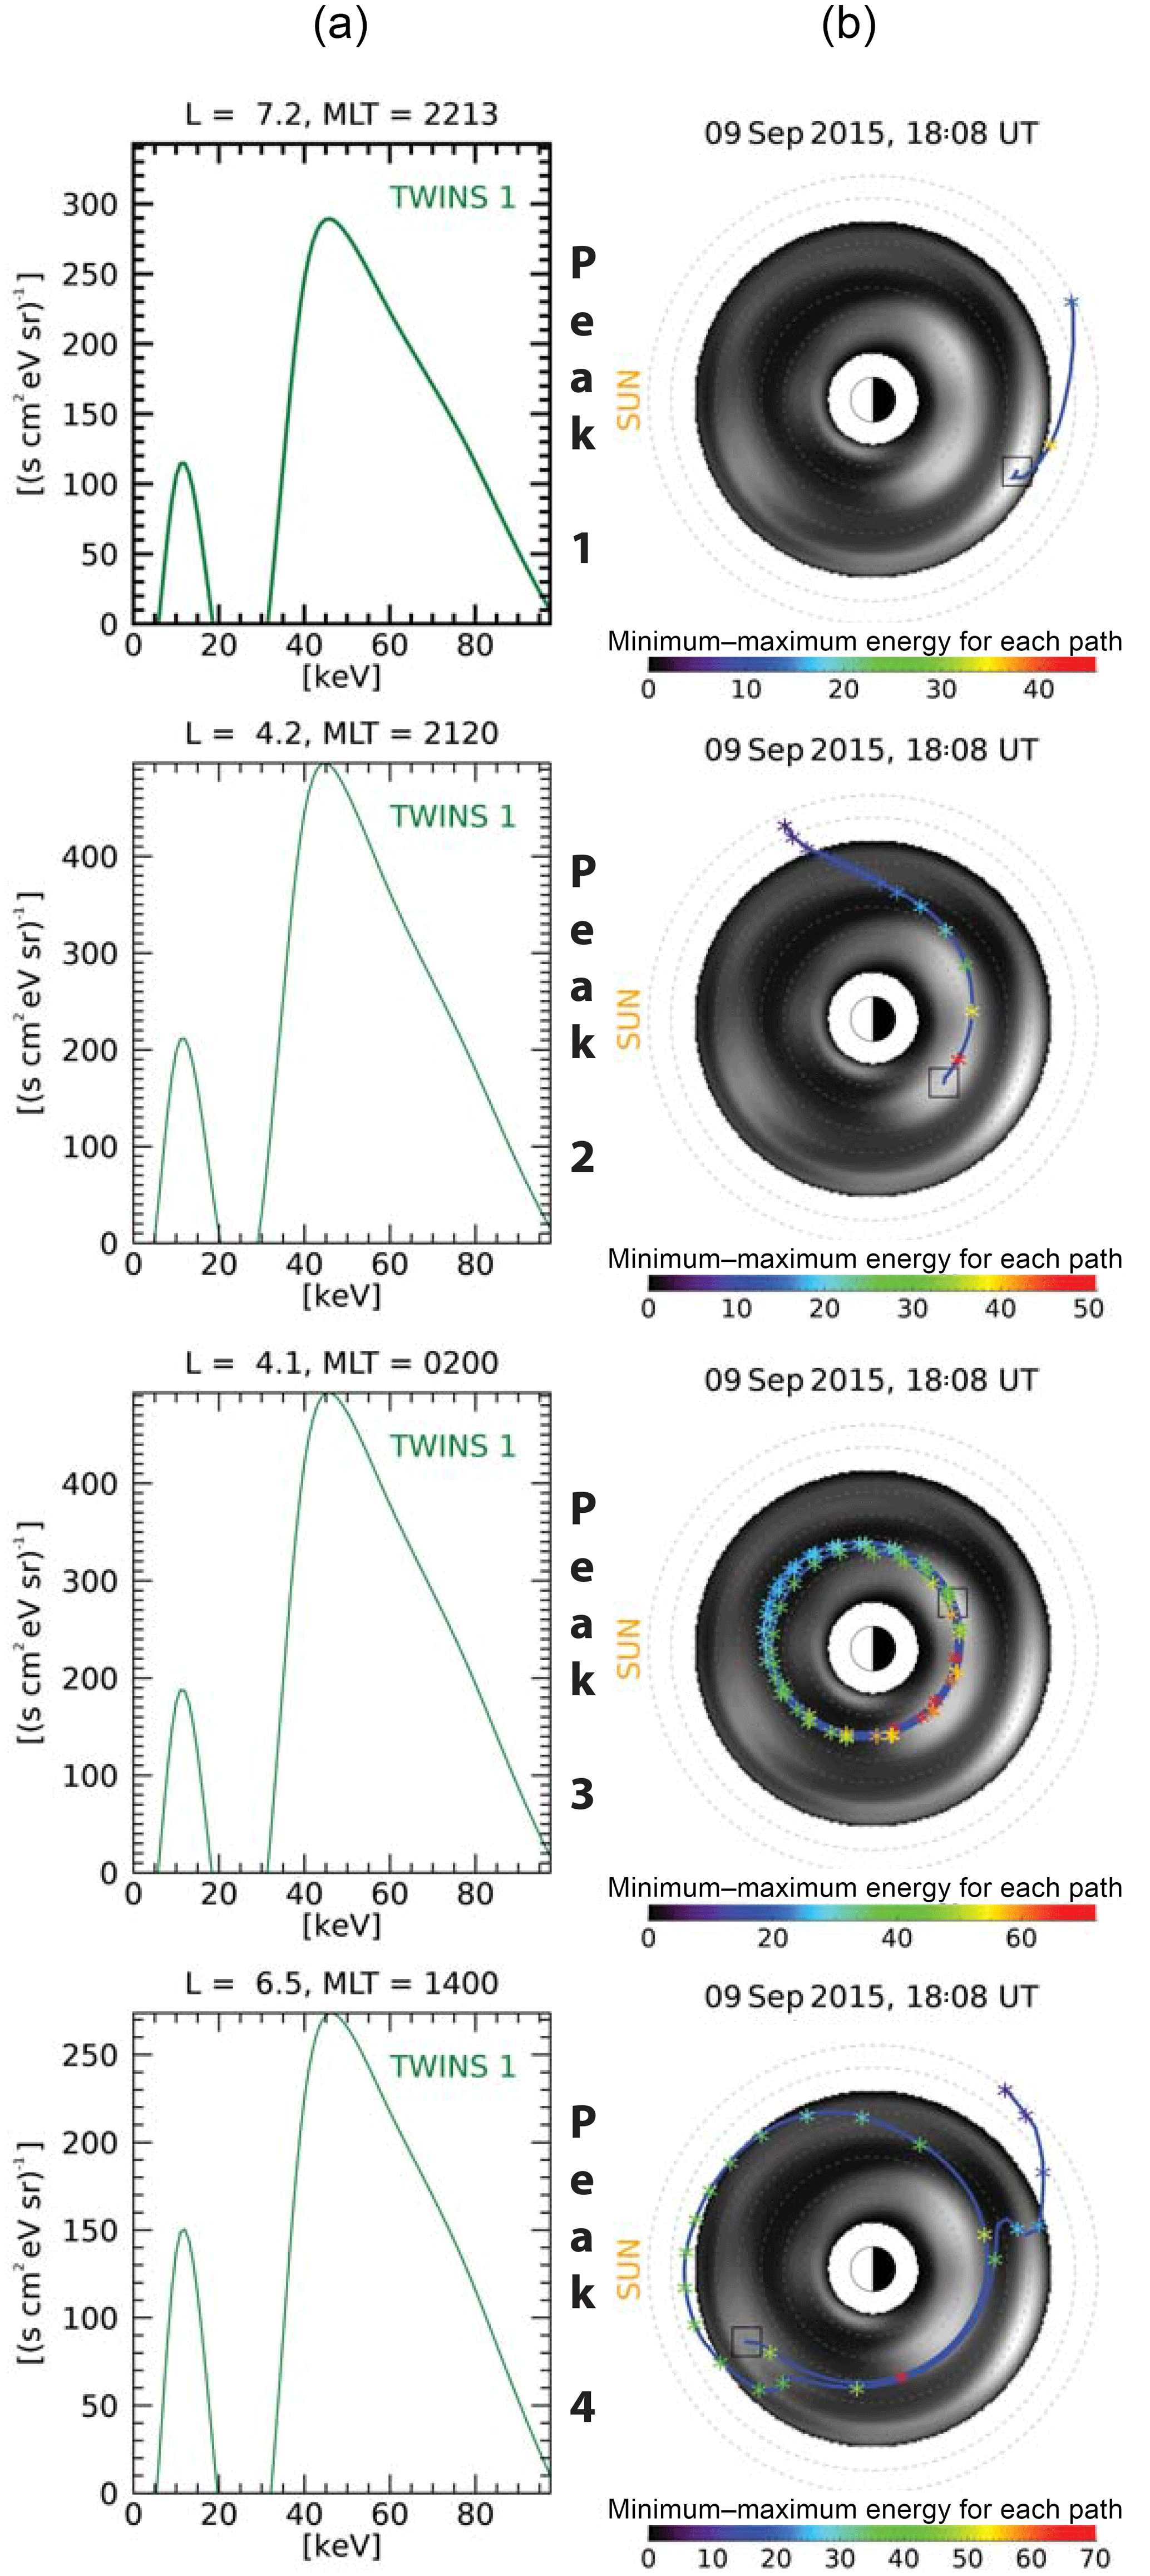
Figure 10Paths of 46 keV particles, the energy of protons at the maximum flux (see left column) that reach the four pressure peaks observed by TWINS as shown in Fig. 8. The observed pressure is shown in gray scale. The locations of the peaks are shown by black squares. The energy of the particle is indicated by the color of the stars that are spaced 10 min apart. The unit of the color bars is keV. The energies span the range of the particle energies along their paths.
The comparisons between the observations and the simulations presented here give a view not available from in situ measurements. To further elucidate this phenomenon, we present in Fig. 10 the paths of particles injected into the inner magnetosphere calculated using the CIMI simulations that provide additional support for concluding that the observations may show effects from enhanced electric shielding and localized and short time injections. The focus is upon the time 18:00 UT on 9 September 2015 during the second storm. As shown in Fig. 8, the TWINS observations show multiple peaks in contrast to the single peak in the CIMI simulations. For each of the four partial pressure peaks observed by TWINS, we show the energy spectrum (left column) and the paths of particles that reach the locations of the pressure peaks (right column). The energy spectra show two energy maxima, one below 20 keV and the largest maximum above 40 keV. The ion paths are calculated with the CIMI model using the RCM fields. The path shown is of a particle with an energy of 46 keV when it reaches the respective pressure peaks, i.e., the energy at the maximum of the energy spectra shown in the left-hand column. The TWINS partial pressure configuration from Fig. 8 is repeated in gray scale so as to highlight the paths. In each case the pressure peak is shown by a black square. Along the path there are stars every 10 min. The colors of the stars indicate the ion energy as it moves along its path (see color bar).
For Peak 1, the 46 keV particle enters at 10 RE in the midnight/dawn sector. The time from injection to reaching this peak in the outer magnetosphere is approximately 20 min. For Peak 2, which is at a smaller radius, a 46 keV ion arrives at the peak from the dawn/midnight sector after approximately 2.5 h. This peak observed by TWINS is very near the pressure peak that appears in the CIMI simulations (see Fig. 8). Peak 3 is at a similar radius to Peak 2, but it is on the dawn side of midnight. The path of a 46 keV particle followed backwards in time from this peak location does not show an injection location after completing nearly three orbits of the Earth in approximately 12 h. This partial pressure peak observed by TWINS may not be consistent with the RCM fields in the CIMI model. Peak 4 is in the noon/dusk sector. A 46 keV particle reaches this peak after approximately 3 h 45 min and one orbit of the Earth. It enters the inner magnetosphere in the same sector, i.e., the midnight/dawn sector, as the particle that reached the location of Peak 1, but it was injected much earlier. The different locations and times of the entrance of the ions at the peaks of the energy spectra at three of the four pressure peaks 1, 2, and 4 observed by TWINS at 18:08 UT on 9 September 2015 suggest spatial and temporal variations in the injections from the plasma sheet. The fact that the calculated path for Peak 3 does not show an injection may indicate variations in the fields not captured in the models.
We have presented, for the first time, direct comparisons of the equatorial ion partial pressure distributions and pitch angle anisotropy obtained from TWINS ENA images and CIMI simulations using both an empirical Weimer 2K and the self-consistent RCM electric potentials for a 4-day period, 7–10 September 2015. There were two moderate storms in succession during this period (see Fig. 1). In most cases, we find that the comparison of the general features of the ring current in the inner magnetosphere obtained from the observations and simulations are in agreement. Nevertheless, we do see consistent indications of effects of enhanced electric shielding and localized and short time injections from the plasma sheet in the observations. The simulated partial pressure peaks are often inside the measured peaks and are more toward dusk than the measured values (see Fig. 2). There are also cases in which the measured equatorial ion partial pressure distribution shows multiple peaks that are not seen in the simulations (see Fig. 8). This occurs during a period of intense AE index. The observations suggest time and spatially dependent injections from the plasma sheet that are not included in the simulations. The paths of the ions that enter the inner magnetosphere calculated with the CIMI model using the self-consistent RCM fields support this interpretation.
The simulations consistently show regions of parallel anisotropy spanning the night side between approximately 6 and 8 RE (see Figs. 3–9). This is thought to be a result of the increasing energy of the particles as they enter the simulation region at 10 RE with isotropic pitch angle distributions. The particles are entering regions of stronger magnetic fields, so conservation of the first adiabatic invariant requires the perpendicular velocity to increase, but it is not adequate to accommodate the increase in energy. So the parallel velocity must increase. Nevertheless the parallel anisotropy is seen in the observations only during the main phase of the first storm. Localized and short time injections may produce ions that are injected with perpendicular pitch angle distributions that would result in the observed nearly isotropic pressure anisotropy.
OMNI solar wind data are accessible via CDAWeb (2018) at https://cdaweb.gsfc.nasa.gov/ (last access: 11 October 2018). TWINS (2018) data are accessible to the public at http://twins.swri.edu (last access: 11 October 2018). Geomagnetic activity indices are also available from the World Data Center for Geomagnetism in Kyoto (WDC, 2018), http://wdc.kugi.kyoto-u.ac.jp/wdc/Sec3.html (last access: 11 October 2018).
JDP led the investigation. JE, SH, and HX performed the simulations and created the figures. MCF and NB provided the CIMI codes. JG, DJM, and PV are responsible for the TWINS data. All participated in the interpretation of the results.
The authors declare that they have no conflict of interest.
This work was supported by the TWINS mission, a part of NASA's Explorer program. We thank the World Data Center for Geomagnetism, Kyoto, for supplying real-time Dst and AE indices. We also thank the ACE and Wind plasma and magnetometer teams for L1 data and the OMNI dataset for their propagation of these data.
Significant parts of the calculations in this study were performed on the
Auburn University High Performance and Parallel Computing Facility.
Edited by: Vincent Maget
Reviewed by: two anonymous referees
Angelopoulos, V.: The THEMIS mission, Space Sci. Rev., 141, 5–34, https://doi.org/10.1007/s11214-008-9336-1, 2008.
Angelopoulos, V., Baumjohann, W., Kennel, C. F., Coroniti, F. V., Kivelson, M. G., Pellat, R., Walker, R. J., Lühr, H., and Paschmann, G.: Bursty bulk flows in the inner central plasma sheet, J. Geophys. Res., 97, 4027–4039, https://doi.org/10.1029/91JA02701, 1992.
Angelopoulos, V., Baumjohann, W., Kennel, C. F., Coroniti, F. V., Kivelson, M. G., Pellat, R., Walker, R. J., Lühr, H., and Paschmann, G.: Multi-point analysis of a bursty bulk flow event on April 11, 1985, J. Geophys. Res., 101, 4967–4987, 1996.
Angelopoulos, V., Chapman, J. A., Mozer, F. S., Scudder, J. D., Russell, C. T., Tsuruda, K. Mukai, T., Hughes, T. J., and Yumoto, K.: Plasma sheet electromagnetic power generation and its dissipation along auroral field lines, J. Geophys. Res., 107, 1181, https://doi.org/10.1029/2001JA900136, 2002a.
Angelopoulos, V., Temerin, M., Roth, I., and Mozer, F. S.: Testing global storm-time electric field models using particle spectra on multiple spacecraft, J. Geophys. Res., 107, 1194, https://doi.org/10.1029/2001JA900174, 2002b.
Bazell, D., Roelof, E. C., Sotirelis, T., Brandt, P. C., Nair, H., Valek, P., Goldstein, J., and McComas, D. J.: Comparison of TWINS images of low-altitude emission of energetic neutral atoms with DMSP precipitating ion fluxes, J. Geophys. Res., 115, A10204, https://doi.org/10.1029/2010JA015644, 2010.
Birn, J., Thomsen, M. F., Borovsky, J. E., Reeves, G. D., McComas, D. J., and Belian, R. D.: Characteristic plasma properties during dispersionless substorm injections at geosynchronous orbit, J. Geophys. Res., 102, 2309–2324, 1997.
Borovsky, J. E., Thomsen, M. F., and Elphic, R. C.: The driving of the plasma sheet by the solar wind, J. Geophys. Res., 103, 17617–17639, https://doi.org/10.1029/97JA02986, 1998.
Braginskii, S. I.: Transport Processes in a Plasma, Rev. Plasma Phys., 1, 205–311, 1965.
Brandt, P. C., Mitchell, D. G., Roelof, E. C., and Burch, J. L.: Bastille Day Storm: Global Response of the Terrestrial Ring Current, Sol. Phys., 204, 377–386, 2001.
Brandt, P. C., Roelof, E. C., Ohtani, S., Mitchell, D. G., and Anderson, B.: IMAGE/HENA: pressure and current distributions during the 1 October 2002 storm, Adv. Space Res., 33, 719–722, 2004.
Burch, J. L.: Image mission review, Space Sci. Rev., 91, 1–14, 2000.
Buzulukova, N., Fok, M.-C., Moore, T. E., and Ober, D. M.: Generation of plasmaspheric undulations, Geophys. Res. Lett., 35, L13105, https://doi.org/10.1029/2008GL034164, 2008.
Buzulukova, N., Fok M.-C., Goldstein J., Valek P., McComas D. J., and Brandt P. C.: Ring current dynamics in moderate and strong storms: Comparative analysis of TWINS and IMAGE/HENA data with the Comprehensive Ring Current Model, J. Geophys. Res., 115, A12234, https://doi.org/10.1029/2010JA015292, 2010.
Carlson, C. W., McFadden, J. P., Turin, P., Curtis, D. W., and Magonhcelli, A.: The electron and ion plasma experiment for FAST, Space Sci. Rev., 98, 33–66, 2001.
CDAWeb: OMNI solar wind data, available at: https://cdaweb.gsfc.nasa.gov/, last access: 11 October 2018.
Daglis, I. A., Thorne, R. M., Baumjohann, W., and Orsini, S.: “Fine Structure” of the storm substorm relationship: ion injections during DST decrease, Adv. Space Res., 25, 2369–2372, 2000.
Dassoulas J., Margolies, D. L., and Peterson, M. R.: The AMPTE/CCE spacecraft, IEEE T. Geosci. Remote., GE-23, 182–191, 1985.
deBoor, C.: A Practical Guide to Splines, Springer, New York, USA, ISBN 0-387-90356-9, 1978.
De Michelis, P., Daglis, I. A., and Consolini, G.: An average image of proton plasma pressure and of current systems in the equatorial plan derived from AMPTE/CCE-CHEM measurements, J. Geophys. Res., 104, 28615–28624, 1999.
Dessler, A. J. and Parker, E. N.: Hydromagnetic theory of geomagnetic storms, J. Geophys. Res., 64, 2239–2252, https://doi.org/10.1029/JZ064i012p02239, 1959.
Eastwood, J. P., Sibeck, D. G., Slavin, J. A., Goldstein, M. L., Lavraud, B., Sitnov, M., Imber, S., Balogh, A., Lucek, E. A., and Dandouras, I.: Observations of multiple X-line structure in the Earth's magnetotail current sheet: A Cluster case study, Geophys. Res. Lett., 32, L11105, https://doi.org/10.1029/2005gl022509, 2005.
Ebihara, Y. and Ejiri, M.: Simulation study on fundamental properties of the storm time ring current, J. Geophys. Res., 105, 15843–15859, https://doi.org/10.1029/1999JA900493, 2000.
Ebihara, Y., Ejiri, M., Nilsson, H., Sandahl, I., Milillo, A., Grande, M., Fennell, J. F., and Roeder, J. L.: Statistical distribution of the storm-time proton ring current: POLAR measurements, Geophys. Res. Lett., 29, 1969, https://doi.org/10.1029/2002GL015430, 2002.
Ebihara, Y., Ejiri, M., Nilsson, H., Sandahl, I., Grande, M., Fennell, J. F., Roeder, J. L., Weimer, D. R., and Fritz, T. A.: Multiple discrete-energy ion features in the inner magnetosphere: 9 February 1998, event, Ann. Geophys., 22, 1297–1304, https://doi.org/10.5194/angeo-22-1297-2004, 2004.
Ebihara, Y., Fok, M.-C., Blake, J. B., and Fennell, J. F.: Magnetic coupling of the ring current and the radiation belt, J. Geophys. Res., 113, A07221, https://doi.org/10.1029/2008JA013267, 2008
Ebihara, Y., Nishitani, N., Kikuchi, T., Ogawa, T., Hosokawa, K., Fok, M.-C., and Thomsen, M. F.: Dynamical property of storm time subauroral rapid flows as a manifestation of complex structures of the plasma pressure in the inner magnetosphere, J. Geophys. Res., 114, A01306, https://doi.org/10.1029/2008JA013614, 2009.
Elfritz, J. G., Keesee, A. M., Buzulukova, N., Fok, M.-C., and Scime, E. E.: First results using TWINS-derived ion temperature boundary conditions in CRCM, J. Geophys. Res.-Space, 119, 3345–3361, https://doi.org/10.1002/2013JA019555, 2014.
Fok, M.-C., Kozyra, J. U., Nagy, A. F., Rasmussen, C. E., and Khazanov, G. V.: Decay of equatorial ring current ions and associated aeronomical consequences, J. Geophys. Res., 98, 19381–19393, 1993.
Fok, M.-C., Moore, T. E., and Spjeldvik, T. E.: Rapid enhancement of radiation belt electron fluxes due to substorm dipolarization of the geomagnetic field, J. Geophys. Res., 106, 3873–3881, https://doi.org/10.1029/2000JA000150, 2001a.
Fok, M.-C., Wolf, R. A., Spiro, R. W., and Moore, T. E.: Comprehensive computational model of the Earth's ring current, J. Geophys. Res., 106, 8417–8424, https://doi.org/10.1029/2000JA000235, 2001b.
Fok, M.-C., Moore, T. E., Wilson, G. R., Perez, J. D., Zhang, X. X., Brandt, P. C., Mitchell, D. G., Roelof, E. C., Jahn, J.-M., Pollock, C. J., and Wolf, R. A.: Global ENA IMAGE simulations, Space Sci. Rev., 109, 77–103, 2003.
Fok, M.-C., Horne, R. B., Meredith, N. P., and Glauert, S. A.: The radiation belt environment model: Application to space weather nowcasting, J. Geophys. Res., 113, A03S08, https://doi.org/10.1029/2007JA012558, 2008.
Fok, M.-C., Buzulukova, N., Chen, S.-H., Valek, P. W., Goldstein, J., and McComas, D. J.: Simulation and TWINS observations of the 22 July 2009 storm, J. Geophys. Res., 115, A12231, https://doi.org/10.1029/2010JA015443, 2010.
Fok, M.-C., Buzulukova, N. Y., Chen, S.-H., Glocer, A., Nagai, Valek, P., and Perez, J. D.: The Comprehensive Inner Magnetosphere-Ionosphere Model, J. Geophys. Res.-Space, 119, 7522–7540, https://doi.org/10.1002/2014JA020239, 2014.
Glocer, A., Fok, M.-C., Nagai, T., Tóth, G., Guild, T., and Blake, J.: Rapid rebuilding of the outer radiation belt, J. Geophys. Res., 116, A09213, https://doi.org/10.1029/2011JA016516, 2011.
Gloeckler, G., Ipavich, L. S., Studemann, W., Wilken, B., Hamilton, D. C., Kremser, G., Hovestadt, D., Gliem, F., Lundgren, R. A., Rieck, W. , Tums, E. O., Cain, J. C., Masung, L. S., Weiss, W., and Winterhof, P.: The charge-energy-mass (CHEM) spectrometer for 0.3 to 300 keV/e ions on AMPTE-CCE, IEEE T. Geosci. Elect., GE-23, 234–240, 1985.
Goldstein, J. and McComas, D. J.: Five years of stereo magnetospheric imaging by TWINS, Space Sci. Rev., 180, 39–70, https://doi.org/10.1007/s11214-013-0012-8, 2013.
Goldstein, J. and McComas, D. J.: The big picture: Imaging of the global geospace environment by the TWINS mission, Rev. Geophys., 56, 1–27, https://doi.org/10.1002/2017RG000583, 2018.
Goldstein, J., Angelopoulos, V., De Paxcuale, S., Funsten, H. O., Kurth, W. S., Llera, K., McComas, D. J., Perez, J. D., Reeves, G. D., Spencer, H. E., Thaller, S. A., Valek, P. W., and Wyant, J. R.: Cross-scale observations of the 2015 St. Patrick's day storm: THEMIS, Van Allen Probes, and TWINS, J. Geophys. Res.-Space, 122, 368–392, https://doi.org/10.1002/2016JA023173, 2017.
Grimes, E. W., Perez, J. D., Goldstein, J., McComas, D. J., Valek, P., and Turner, D.: Comparison of TWINS and THEMIS observations of proton pitch angle distributions in the ring current during the 29 May 2010 geomagnetic storm, J. Geophys. Res.-Space, 118, 4895–4905, https://doi.org/10.1002/jgra.50455, 2013.
Groth, C. P. T., Zeeuw, D. L., Gombosi, T. I., and Powell, K. G.: Global three-dimensional MHD simulation of a space weather event: CME formation, interplanetary propagation, and interaction with the magnetosphere, J. Geophys. Res. 105, 25053–25078, 2000.
Hardy, D. A., Schmitt, L. K., Gussenhoven, M. S., Marshall, F. J., Yeh, H. C., Schumaker, T. L., Huber, A., and Pantazis, J.: Precipitating electron and ion detectors (SSJ 4) for the block 5D Flights 6–10 DMSP satellites: Calibration and data presentation, Rep. AFGL TR 84 0317, Air Force Geophys. Lab., Hanscom Air Force Base, MA, USA, 1984.
Hardy, D. A., Gussenhoven, M. S., Raistrick, R., and McNeil, W. J.: Statistical and functional representations of the pattern of auroral energy flux, number flux, and conductivity, J. Geophys. Res., 9, 12275–12294, https://doi.org/10.1029/JA092iA11p12275, 1987.
Harel, M., Wolf, R. A., Reiff, P. H., Spiro, R. W., Burke, W. J., Rich, F. J., and Smiddy, M.: Quantitative simulation of a magnetospheric substorrn, 1, Model logic and overview, J. Geophys. Res., 86, 2217–2241, 1981.
Imber, S. M., Slavin, J. A., Auster, H. U., and Angelopoulos, V.: A THEMIS survey of flux ropes and traveling compression regions: Location of the near-Earth reconnection site during solar minimum, J. Geophys. Res., 116, A02201, https://doi.org/10.1029/2010ja016026, 2011.
Jaggi, R. K. and R. A. Wolf: Self-consistent calculation of the motion of a sheet of ions in the magnetosphere, J. Geophys. Res., 78, 2852–2866, https://doi.org/10.1029/JA078i016p02852, 1973.
Kistler, L. M. and Larson, D. J.: Testing electric and magnetic field models of the storm-time inner magnetosphere, J. Geophys. Res. 105, 25221–25231, 2000.
Kistler, L. M., Klecker, B., Jordanova, V. K., Möbius, E., Popecki, M. A., Patel, D., Sauvaud, J. A., Rème, H., Di Lellis, A. M., Korth, A., McCarthy, M., Cerulli, R., Bavassano Cattaneo, M. B., Eliasson, L., Carlson, C. W., Parks, G. K., Paschmann, G., Baumjohann, W., and Haerendel, G.: Testing electric field models using ring current ion energy spectra from the Equator-S ion composition (ESIC) instrument, Ann. Geophys., 17, 1611–1621, https://doi.org/10.1007/s00585-999-1611-2, 1999.
Korth, H., Thomsen, M. F., Borovsky, J. E., and McComas, D. J.: Plasma sheet access to geosynchronous orbit, J. Geophys. Res, 104, 25045–25061, 1999.
Lin, Y., Wang, X. Y., Lu, S., Perez, J. D., and Lu, Q.: Investigation of storm time magnetotail and ion injection using three-dimensional global hybrid simulation, J. Geophys. Res.-Space, 119, 7413–7432, https://doi.org/10.1002/2014JA020005, 2014.
Lui, A., McEntire, R., and Krimigis, S.: Evolution of the ring current during two geomagnetic storms, J. Geophys. Res., 92, 7459–7470, https://doi.org/10.1029/JA092iA07p07459, 1987.
Lui, A. T. Y., Hori, T., Ohtani, S., Zhang, Y., Zhou, X. Y., Henderson, M. G., Mukai, T., Hayakawa, H., and Mende, S. B.: Magnetotail behavior during storm time “sawtooth injections,” J. Geophys. Res., 109, A10215, https://doi.org/10.1029/2004JA010543, 2004.
Mauk, B. H., Fox, N. J., Kanekal, S. G., Kessel, R. L., Sibeck, D. G., and Ukhorskiy, A.: Science objectives and rationale for the Radiation Belt Storm Probes mission, Space Sci. Rev., 179, 3–27, https://doi.org/10.1007/s11214-012-9908-y, 2013.
McComas, D. J., Funsten, H. O., and Scime, E. E.: Advances in low energy neutral atom imaging, in: Measurement Techniques in Space Plasmas-Fields, edited by: Pfaff, R. F., Borovsky, J. E., and Young, D. T., Geophys. Monogr. Ser., 103, 275–280, 1998.
McComas, D. J., Allegrini, F., Baldonado, J., Blake, B., Brandt, P. C., Burch, J., Clemmons, J., Crain, W., Delapp, D., DeMajistre, R., Everett, D., Fahr, H., Friesen, L., Funsten, H., Goldstein, J., Gruntman, M., Harbaugh, R., Harper, R., Henkel, H., Holmlund, C., Lay, G., Mabry, D., Mitchell, D., Nass, U., Pollock, C., Pope, S., Reno, M., Ritzau, S., Roelof, E., Scime, E., Sivjee, M., Skoug, R., Sotirelis, T. S., Thomsen, M., C. Urdiales, C., Valek, P., Viherkanto, K., Weidner, S., Ylikorpi, T., Young, M., and Zoennchen, J.: The Two Wide-angle Imaging Neutral-atom Spectrometers (TWINS) NASA Mission-of-Opportunity, Space Sci. Rev., 142, 157B231, https://doi.org/10.1007/s11214-008-9467-4, 2009a.
McComas, D. J., Allegrini, F., Bochsler, P., Bzowski, M., Christian, E. R., Crew, G. B., DeMajistre, R., Fahr, H., Fichtner, H., Frisch, P., Funsten, H. O., Fuselier, S. A., Gloeckler, G., Gruntman, M., Heerikhuisen J., Izmodenov, V., Janzen, P., Knappenberger, P., Krimigis, S., Kucharek, H., Lee, M., Livadiotis, G., Livi, S., MacDowall, R. J., Mitchell, D., Möbius, E., Moore, T., Pogorelov, N. V., Reisenfeld, D., Roelof, E., Saul, L., Schwadron, N. A., Valek, P. W., Vanderspek, R., Wurz, P., and Zank, G. P.: Global observations of the interstellar interaction from the Interstellar Boundary Explorer (IBEX), Science, 326, 959–962, https://doi.org/10.1126/science.1180906, 2009b.
McComas, D. J., Buzulukova, N., Connors, M. G., Dayeh, M. A., Goldstein, J., Funsten, H. O., Fuselier, S., Schwadron, N. A., and Valek, P.: Two Wide-Angle Imaging Neutral-Atom Spectrometers and Interstellar Boundary Explorer energetic neutral atom imaging of the 5 April 2010 substorm, J. Geophys. Res., 117, A03225, https://doi.org/10.1029/2011JA017273, 2012.
McEntire, R. W., Keath, E. P., Fort, D. E., Lui, A. T. Y., and Krimigis, S. M.: “The Medium-Energy Particle Analyzer (MEPA) on the AMPTE CCE Spacecraft”, IEEE T. Geosci. Remote, GE-23, 230–233, https://doi.org/10.1109/TGRS.1985.289518, 1985.
McKenna-Lawlor, S., Li, L., Barabash, S., Kudela, K., Balaz, J., Strharsky, I., Brinkfeldt, K., Gunell, H., Shen, C., Shi, J., Cao, J.-B., Zong, Q., Fu, S.-Y., Roelof, E. C., Brandt, P. C., and Dandouras, I.: The NUADU experiment on TC-2 and the first Energetic Neutral Atom (ENA) images recorded by this instrument, Ann. Geophys., 23, 2825–2849, https://doi.org/10.5194/angeo-23-2825-2005, 2005.
Mitchell, D. G., Jaskulek, S. E., Schlemm, C. E., Keath, E. P., Thompson, R. E., Tossman, B. E., Boldt, J. D., Hayes, J. R., Andrews, G. B., Paschalidis, N., Hamilton, D. C., Lundgren, R. A., Tums, E. O., Wilson IV, P., Voss, H. D., Prentice, D., Hsieh, K. C., Curtis, C. C., and Powell, F. R.: High Energy Neutral Atom (HENA) Imager for the IMAGE mission, Space Sci. Rev., 91, 67–112, 2000.
Mitchell, D. G., Lanzerotti, L. J., Kim, C. K., Stokes, M., Ho, G., Cooper, S., Ukhorskiy, A. Manweller, J. W., Jaskulek, S., Haggerty, D. K., Brandt, P., Sitnov, M., Keika, N., Hayes, J. F., Brown, L. E., Gurnce, R. S., Hutcheson, J. C., Nelson, K. S., Paschalldis, N., Rossano, E., and Kerem, S.: Radiation Belt Storm Probes Ion Composition Experiment RBSPICE, Space Sci. Rev., 179, 263–308, 2013.
Moore, T. E., Chornay, D. J., Collier, M. R., Herrero, F. A., Johnson, J., Johnson, M. A., Keller, J. W., Laudadio, J. F., Lobell, J. F., Ogilvie, K. W., Rozmarynowski, J. P., Fuselier, S. A., Ghielmetti, A. G., Hertzberg, E., Hamilton, D. C., Lundgren, R., Wilson, P., Walpolle, P., Stephen, T. M., Peko, B. L., Van Zyl, B., Wurz, P., Quinn, J. M., and Wilson, G. R.: The low-energy neutral atom imager for IMAGE, Space Sci. Rev. 91, 155–195, 2000.
Nakamura, R., Baumjohann, W., Brittnacher, M., Sergeev, V. A., Kubyshkina, M., Mukai, T., and Liou, K.: Flow bursts and auroral activations: Onset timing and foot point location, J. Geophys. Res., 106, 10777–10789, 2001.
Ober, D. M., Horwitz, J. L., and Gallagher, D. L.: Formation of density troughs embedded in the outer plasma sphere by subau roral ion drift events, J. Geophys. Res., 102, 14595–14602, https://doi.org/10.1029/97JA01046, 1997.
Perez, J. D., Zhang, X.-X., Brandt, P. C., Mitchell, D. G., Jahn, J.-M., and Pollock, C. J.: Dynamics of ring current ions as obtained from IMAGE HENA and MENA ENA images, J. Geophys. Res. 109, A05208, https://doi.org/10.1029/2003JA010164, 2004.
Perez, J. D., Grimes, E. W., Goldstein, J., McComas, D. J., Valek, P., and Billor, N.: Evolution of CIR storm on 22 July 2009, J. Geophys. Res., 117, A09221, https://doi.org/10.1029/2012JA017572, 2012.
Perez, J. D., Goldstein, J., McComas, D. J., Valek, P., Buzulukova, N., Fok, M.-C., and Singer, H. J.: TWINS stereoscopic imaging of multiple peaks in the ring current, J. Geophys. Res.-Space, 120, 368–383, https://doi.org/10.1002/2014JA020662, 2015.
Perez, J. D., Goldstein, J., McComas, D. J., Valek, P., Fok, M.-C., and Hwang, K.-J., Global images of trapped ring current ions during main phase of 17 March 2015 geomagnetic storm as observed by TWINS, J. Geophys. Res.-Space, 1–21, https://doi.org/10.1002/2016JA022375, 2016.
Pollock, C. J., Asamura, K., Baldonaldo, J., Balkey, M. M., Barker, P., Burch, J. L., Korpela, E. J., Cravens, J., Dirks, G., Fok, M.-C., Funsten, H. O., Grande, M., Gruntman, M., Hanley, J., Jahn, J.-M, Jenkins, M., Lampton, M., Marckwordt, M., McComas, D. J., Mukai, T., Penegor, G., Pope, S., Ritzal, S., Schattenburg, M. I., Scime, E., Skoug, R., Spurgeon, M., Stecklein, T., Storms, S., Urdiales, C., Valek, P., Van Bee, J. T. M., Weidner, S. E., Wüest, M., Young, M. K., and Zinsmeter, C.: Medium Energy Neutral Atom (MENA) imager for the IMAGE mission, Space Sci. Rev. 91, 113–154, 2000.
Pollock, C. J., Asamura, K., Balkey, M. M., Burch, J. L., Funsten, H. O., Grande, M., Gruntman, M., Henderson, M., Jahn, J. M., Lampton, M., Liemohn, M. W., McComas, D. J., Mukai, T., Ritanu, S., Schattenburg, M. L., Scime, E., Skoug, R., Valek, P., and Wüest, M.: First medium energy neutral atom (MENA) images of Earth's magnetosphere during substorm and storm-time, Geophys. Res. Lett., 28, 1147–1150, 2001.
Rème, H., Aoustin, C., Bosqued, J. M., Dandouras, I., Lavraud, B., Sauvaud, J. A., Barthe, A., Bouyssou, J., Camus, Th., Coeur-Joly, O., Cros, A., Cuvilo, J., Ducay, F., Garbarowitz, Y., Medale, J. L., Penou, E., Perrier, H., Romefort, D., Rouzaud, J., Vallat, C., Alcaydé, D., Jacquey, C., Mazelle, C., d'Uston, C., Möbius, E., Kistler, L. M., Crocker, K., Granoff, M., Mouikis, C., Popecki, M., Vosbury, M., Klecker, B., Hovestadt, D., Kucharek, H., Kuenneth, E., Paschmann, G., Scholer, M., Sckopke, N., Seidenschwang, E., Carlson, C. W., Curtis, D. W., Ingraham, C., Lin, R. P., McFadden, J. P., Parks, G. K., Phan, T., Formisano, V., Amata, E., Bavassano-Cattaneo, M. B., Baldetti, P., Bruno, R., Chionchio, G., Di Lellis, A., Marcucci, M. F., Pallocchia, G., Korth, A., Daly, P. W., Graeve, B., Rosenbauer, H., Vasyliunas, V., McCarthy, M., Wilber, M., Eliasson, L., Lundin, R., Olsen, S., Shelley, E. G., Fuselier, S., Ghielmetti, A. G., Lennartsson, W., Escoubet, C. P., Balsiger, H., Friedel, R., Cao, J.-B., Kovrazhkin, R. A., Papamastorakis, I., Pellat, R., Scudder, J., and Sonnerup, B.: First multispacecraft ion measurements in and near the Earth's magnetosphere with the identical Cluster ion spectrometry (CIS) experiment, Ann. Geophys., 19, 1303–1354, https://doi.org/10.5194/angeo-19-1303-2001, 2001.
Roelof, E. C.: ENA Emission from Nearly-Mirroring Magnetospheric Ions Interacting with the Exosphere, Adv. Space Res. 20, 361–366, 1997.
Sckopke, N.: A general relation between the energy of trapped particles and the disturbance field near the Earth, J. Geophys. Res., 71, 3125–3130, 1966.
Scudder, J., Hunsacker, F., Miller, G., Lobell, J., Zawistowski, T., Ogilvie, K., Keller, J., Chornay, D., Herrero, F., Fitzenreiter, R., Fairfield, D., Needell, J., Bodet, D., Googins, J., and Kletzing, C.: HYDRA: A 3-dimensional electron and ion hot plasma instrument for the POLAR spacecraft of the GGS mission, Space Sci. Rev., 71, 459–495, 1995.
Slavin, J. A., Lepping, R. P., Gjerloev, J., Fairfield, D. H., Hesse, M., Owen, C. J., Moldwin, M. B., Nagai, T., Ieda, A., and Mukai, T.: Geotail observations of magnetic flux ropes in the plasma sheet, J. Geophys. Res., 108, 1015, https://doi.org/10.1029/2002ja009557, 2003.
Smith, P. and Hoffman, R.: Ring current particle distributions during the magnetic storms of December 16–18, 1971, J. Geophys. Res., 78, 4731–4737, https://doi.org/10.1029/JA078i022p04731, 1973.
Spence, H. E., Reeves, G. D., Baker, D. N., Blake, J. B., Bolton, M., Bourdarie, S., Chan, A. A., Claudepherre, S. G., Clemmons, J. H., Cravens, J. P., Elkington, S. R., Fennell, J. F., Friedel, R. H. W., Funsten, H. O., Goldstein, J., Green, J. C., Guthrie, A., Henderson, M. G., Horne, R. B., Hudson, M. K., Jahn, J.-M, Jordanova, V. K., Kanekal, S. G., Klatt, B. W. L, Larsen, B. A., Li, X, MacDonald, E. A., Mann, I. R., Niehof, J., O'Brien, T. P., Onsaga, T. G., Salvaggio, D., Skoug, R. M., Smith, S. S., Suther, L. L., Thomsen, M. F., Thorne, R. M.: Science goals and overview of the Radiation Belt Storm Probes (RBSP) Energetic Particle, Composition, and Thermal Plasma (ECT) suite on NASA's Van Allen Probes mission, Space Sci. Rev., 179, 311–336, https://doi.org/10.1007/s11214-013-0007-5, 2013.
Stern, D. P.: The motion of a proton in the equatorial magnetosphere, J. Geophys. Res., 80, 595–599, 1975.
Toffoletto, F., Sazykin, S., Spiro, R., and Wolf, R.: Inner magnetospheric modeling with the Rice convection model, Space Sci. Rev., 107, 175–196, 2003.
Tsyganenko, N. A.: A magnetospheric magnetic field model with a warped tail current sheet, Planet. Space Sci., 37, 5–20, 1989.
Tsyganenko, N. A. and Mukai, T.: Tail plasma sheet models derived from Geotail particle data, J. Geophys. Res., 108, 1136, https://doi.org/10.1029/2002JA009707, 2003.
Tsyganenko, N. A. and Stern, D. P.: Modeling the global magnetic field of the large scale Birkeland current systems, J. Geophys. Res., 101, 27187–27198, https://doi.org/10.1029/96JA02735, 1996.
Tsyganenko, N. A. and Sitnov, M. I.: Modeling the dynamics of the inner magnetosphere during strong geomagnetic storms, J. Geophys. Res., 110, A03208, https://doi.org/10.1029/2004JA010798, 2005.
TWINS: TWINS data, available at: http://twins.swri.edu, last access: 11 October 2018.
Vallat, C., Dandouras, I., Brandt, P. C., DeMajistre, R., Mitchell, D. G., Roelof, E. C., Reme, H., Sauvaud, J.-A., Kistler, L., Mouikis, C., Dunlop, M., and Balgh, A.: First comparisons of local ion measurements in the inner magnetosphere with energetic neutral atom magnetospheric image inversions: Cluster-CIS and IMAGE-HENA observations, J. Geophys. Res., 109, A04213, https://doi.org/10.1029/2003JA010224, 2004.
Volland, H.: A semiempirical model of large-scale magnetospheric electric fields, J. Geophys. Res., 78, 171–180, 1973.
Wahba, G.: Spline Models for Observational Data, Soc. for Ind. and Appl. Math., Philadelphia, PA, USA, https://doi.org/10.1137/1.9781611970128, 1990.
Wang, C.-P., Gkioulidou, M., Lyons, L. R., Wolf, R. A., Angelopoulos, V., Nagai, T., Weygand, J. M., and Lui, A. T. Y.: Spatial distributions of ions and electrons from the plasma sheet to the inner magnetosphere: Comparisons between THEMIS-Geotail statistical results and the Rice convection model, J. Geophys. Res., 116, A11216, https://doi.org/10.1029/2011JA016809, 2011.
WDC: Geomagnetic activity indices, available at: http://wdc.kugi.kyoto-u.ac.jp/wdc/Sec3.html, last access: 11 October 2018.
Weimer, D. R.: A flexible, IMF dependent model of high-latitude electric potentials having “space weather” applications, Geophys. Res. Lett., 23, 2549–2552, 1996.
Weimer, D. R.: An improved model of ionospheric electric potentials including substorm perturbations and applications to the Geospace environment modeling November 24, 1996, event, J. Geophys. Res., 106, 407–416, https://doi.org/10.1029/2000JA000604, 2001.
Wilken, B., Weiss, W., Hall, D., Grande, M., Sorass, F., and Fennell, J. F.: Magnetospheric ion composition spectrometer onboard the CRRES spacecraft, J. Spacecraft Rockets, 29, 585–591, 1992.
Zheng, Y., Lui, A. T. Y., and Fok, M.-C.: Effects of plasma sheet properties on storm-time ring current, J. Geophys. Res., 115, A08220, https://doi.org/10.1029/2009JA014806, 2010.
Zoennchen, J. H., Nass, U., and Fahr, H. J.: Terrestrial exospheric hydrogen density distributions under solar minimum and solar maximum conditions observed by the TWINS stereo mission, Ann. Geophys., 33, 413–426, https://doi.org/10.5194/angeo-33-413-2015, 2015.