the Creative Commons Attribution 4.0 License.
the Creative Commons Attribution 4.0 License.
 | 03 Mar 2026
ESA/JUICE encounters Earth/Moon in 2024: overview of the Moons And Jupiter Imaging Spectrometer (MAJIS) observations
François Poulet
Giuseppe Piccioni
Yves Langevin
Cydalise Dumesnil
Vincent Carlier
Benoit Seignovert
Marc Dexet
Leigh N. Fletcher
Cédric Leyrat
Francesca Altieri
John Carter
Emiliano D'Aversa
Maria De Sanctis
Davide Grassi
Sandrine Guerlet
Stéphane Le Mouélic
Alessandra Migliorini
Fabrizio Oliva
Clément Royer
Sébastien Rodriguez
Katrin Stephan
Federico Tosi
Francesca Zambon
Alberto Adriani
Gabriele Arnold
Jean-Pierre Bibring
Dominique Bockelée
Rosario Brunetto
Fabrizio Capaccioni
Cristian Carli
Thibault Cavalié
Miriam Cisneros González
Mauro Ciarnello
Simone De Angelis
Pierre Drossart
Gianrico Filacchione
Thierry Fouchet
Jean-Claude Gérard
Denis Grodent
Patrick Irwin
Sophie Jacquinod
Ozgur Karatekin
Emmanuel Lellouch
Nicolas Ligier
Nicolas Mangold
Magali Mebsout
Frédéric Merlin
Alessandro Morbidelli
Alessandro Mura
Andreas Nathues
Maria E. Palumbo
Cédric Pilorget
Olivier Poch
Eric Quirico
Andrea Raponi
Séverine Robert
Elias Roussos
Agustin Sanchez-Lavega
Bernard Schmitt
Giuseppe Sindoni
Marcel Snels
Roberto Sordini
Stefania Stefani
Giovanni Strazzulla
Tim Trent
Gabriel Tobie
Diego Turrini
Ann-Carine Vandaele
Mathieu Vincendon
Olivier Witasse
Claire Vallat
Alessandro Moraino
The Lunar-Earth Gravitational Assist (LEGA) of 19–20 August 2024 marked the first in-flight opportunity beyond functional checks to perform MAJIS (Moons and Jupiter Imaging Spectrometer) observations on-board the ESA's Jupiter Icy Moons Explorer (JUICE) spacecraft. This unique double flyby involved sequential close approaches to the Moon and Earth, offering an unprecedented configuration to evaluate MAJIS under high radiance, rapidly changing geometric, and operationally constrained conditions. A total of 24 hyperspectral image cubes were acquired (5 targeting the Moon and 19 the Earth) providing a dataset of approximately 7.5 Gbit. This work presents the primary goal of this observation campaign, which was to verify key aspects of MAJIS performance, including radiometric and spectral calibration, straylight behavior, geometric alignment, the use of onboard browse products, and interference tests with other JUICE instruments. This event also enabled assessment of thermal behavior and susceptibility to electromagnetic interference, and provided a first operational benchmark for MAJIS and a basis for refining future observation strategies and data analyses during JUICE's cruise and science phases. In addition, despite limited spatial and temporal coverage of the observations, the analyses presented here and in a series of companion papers of the special issue “The first-ever lunar-Earth flyby: a unique test environment for JUICE” demonstrated the instrument's ability to characterize mineralogical features on the Moon and atmospheric constituents on Earth. Observations include detection of mafic minerals (some associated to fresh excavated materials), thermal emission, and emissivity variations on the Moon at spatial scale of 100–200 m. Characterization of atmospheric absorption features, thermal brightness, icy cloud properties are captured for the Earth at km-scale and briefly discussed in the framework of the atmospheric biosignatures relevant to exoplanet habitability studies. Near-coincident acquisitions with other JUICE instruments and Earth-orbiting spectrometers provided valuable inter-calibration and cross-validation opportunities.
- Article
(12514 KB) - Full-text XML
- BibTeX
- EndNote


The JUICE (JUpiter ICy moons Explorer) spacecraft was launched from Kourou on 14 April 2023 near the optimum moment within the launch window (Boutonnet et al., 2024). During its long cruise to the Jupiter system, several planetary gravitational assists are planned. The first one was the combined Lunar–Earth gravity assist (LEGA), which marked the first time a space mission executed a gravity assist sequence involving both the Moon and the Earth (Boutonnet et al., 2024). This occurred during the closest approach (C/A) to the Moon at 23:15 UTC on 19 August, at a distance of 750 km, and to the Earth at 23:56 UTC the following day, 20 August 2024, at a distance of 6840 km. The short time interval between the closest approaches to the Moon and Earth prevented any correction of the trajectory in between.
The observations of MAJIS (Moons And Jupiter Imaging Spectrometer) acquired during these two flybys provided a unique first insight into the instrument performance under operating conditions. The JUICE special issue of ANGEO contains seven MAJIS companion papers that present analyses of the dataset collected by this instrument during the LEGA. In addition to its importance for calibration and performance verification, the dataset also enables interesting scientific investigations of the surface of the Moon and the atmosphere of the Earth at high spatial resolution, and provides context for potential science at Jupiter. Exciting comparisons with data near-simultaneously collected by several space-based Earth observation instruments were also planned for this occasion and successfully carried out.
The series of MAJIS paper starts with two papers focused on the calibration and performance of the instrument. The first work by Langevin et al. (2026) presents the radiometric and spectral performance of the instrument and its post-launch evolution. A comparison of the MAJIS data on the Earth and the Moon with other datasets is presented for radiometric and spectral cross-comparison purposes. The second paper by Seignovert et al. (2026) tackles the calculation of the geometric calibration of MAJIS to verify the pointing of MAJIS boresight w.r.t. the spacecraft axes and the other remote sensing instruments and detect any launch-induced misalignments. In this respect, a comparison with the JANUS (Jovis Amorum ac Natorum Undique Scrutator) camera (Palumbo et al., 2025) and terrestrial features (clouds and lands) mapped by Earth observation satellite is shown. Three articles present the analysis of the rich dataset collected during the Earth GA (EGA) with a focus on the gaseous composition of a habitable planet (this work; Guerlet et al., 2026) and the water ice cloud properties (Oliva et al., 2026). Taking advantage of the wide spectral range of MAJIS, combined with its spatial capabilities, the retrieval of physical parameters through radiative transfer modeling is successfully applied, providing spatial characterization of icy cloud structures and gravity waves. Several emissions in the visible range were observed in one of the MAJIS data cubes. The identification and the interpretation of these unique spectral features, considered to be the first spectroscopic detection of terrestrial lightning from space, are reported in D'Aversa et al. (2026). Two additional papers are devoted to the data acquired during the Lunar GA (LGA). Despite the limited coverage of the lunar surface, the first paper explores the mafic mineralogy of the targeted regions (Zambon et al., 2026), while the second is focused on the thermal range of MAJIS (>3 µm) that can be used to derive the temperature on the dayside of the Moon together with the emissivity (Tosi et al., 2026).
The dataset and the techniques used for data processing in this series of papers are described in Sect. 2. We then present an overview of the instrument performance in Sect. 3 and data analyses illustrated by a selection of scientific results on lunar mineralogy (Sect. 4) and Earth's atmosphere (Sect. 5), which complement the scientific results presented in the companion papers.
2.1 MAJIS instrument
MAJIS is one of the four remote sensing instruments included in the JUICE payload. Together, this suite conducts observations from the ultraviolet to millimeter wavelengths to characterize the geology, surface composition, and exospheres of the Jovian satellites, as well as Jupiter's atmosphere, with high spatial and spectral resolution. The scientific objectives and core specifications of MAJIS are detailed in Poulet et al. (2024b). Here, we briefly describe the instrument, highlighting specific instrumental characteristics that were relevant to or validated thanks to the LEGA dataset, and refer the reader to Poulet et al. (2024b) for a comprehensive overview of its technical design and science goals.
The spectral range is covered by two channels: the VISNIR (Visible and Near-Infrared) channel (0.5–2.35 µm) and the IR (Infrared) channel (2.28–5.56 µm). The spectral sampling is about 3.6 nm per band and 6.5 nm per band for the VISNIR and IR channels, respectively. MAJIS is a cryogenic instrument that requires the optics and VISNIR detector to operate at temperatures below ∼135 K, and the IR detector below ∼95 K. This is achieved via a passive cooling system that uses two dedicated radiators: one cools the entire optical head (OH), while the other is connected directly to the IR detector via a thermal strap.
Teledyne H1RG detectors were selected for the two focal plane arrays (FPAs), each optimized for a different wavelength cutoff. These detectors feature a resolution of 1024×1024 pixels with an 18 µm pixel pitch (hereafter referred as to pixel18 µm). The effective photon collection area covers 800 lines of 1016 pixels. A 2× binning is applied in the spatial direction, yielding an instantaneous field of view (IFOV) of 150 µrad (corresponding to an effective pixel size of 36 µm) and a total field of view (FOV) of 60 mrad corresponding to 400 IFOVs along the Xsc axis. A windowing mode allows tunable readout from 400 to 32 binned pixels by step of 16. Windowing will be particularly useful when the target (such as an icy satellite, Io, or Jupiter) occupies only part of the FOV, or in specific observation geometries, including exosphere studies near the limb and stellar occultations. In addition to optimizing spatial coverage, windowing enables significantly shorter integration times within a single frame of a given data cube by reducing the conversion and transfer of data from the detector electronics to the proximity electronics. During the LEGA observations, this capability was critical for mitigating saturation effects caused by the high radiance of targets such as the Moon and Earth (Sect. 2.2) compared to that of Jupiter or its moons. In the spectral dimension, the nominal operating mode also includes a 2× binning in the spectral direction, providing 508 spectral samples. This nominal mode was selected during the LEGA observation (Sect. 2.2).
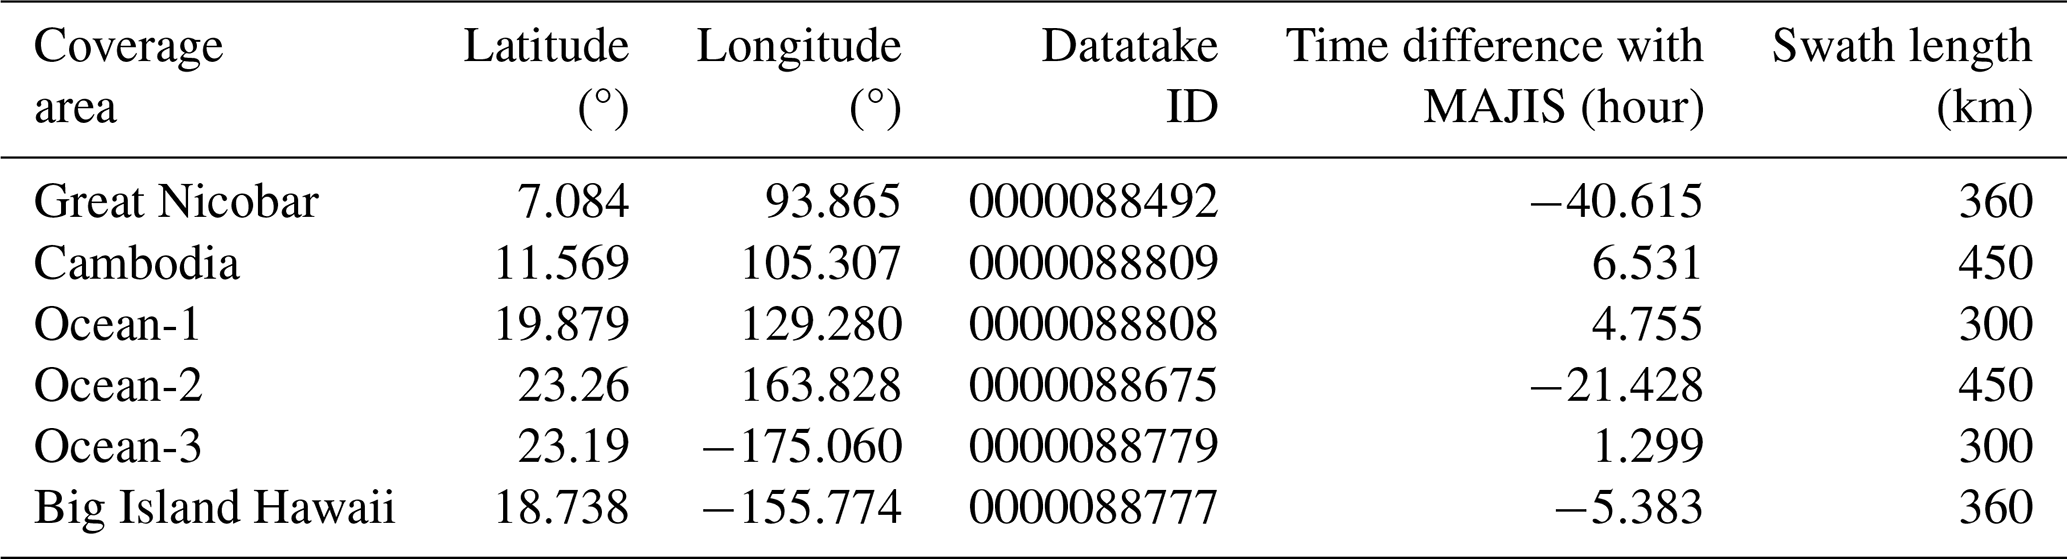
In addition to the windowing functionality described above, the electronics can initiate detector readout from a configurable starting row, independently for the VISNIR and IR channels. This feature was originally designed to compensate for a potential spatial offset between the two channels along the slit direction (Filacchione et al., 2024). It also enables the acquisition of out-of-FOV pixels for calibration and straylight assessment (Langevin et al., 2024, 2026). This capability was also employed during the LEGA observations (Table 1).
MAJIS can operate in push-broom mode, scanning mode, and motion compensation mode, depending on the scientific objectives and target characteristics. Optimum spatial sampling is achieved when the MAJIS line-of-sight (LOS) drifts by exactly one IFOV during one frame acquisition: in this configuration, the along-track spacing between lines matches the across-track spacing between data elements (binned pixels or samples). When JUICE points to the target, the across-slit FOV is built by acquiring successive frames either by actuating the scan mirror (within ± 2° limits corresponding to ±4° on the LOS) or by taking advantage of the slew of the spacecraft.
During a nominal observation, so-called “browse” data products can be requested by telecommand (TC) to the instrument's on-board main electronics (Poulet et al., 2024b). Each browse product contains a maximum of 32 wavelengths (out of the nominal 508 spectral channels) selected for their relevance to the science goals of the target being observed (Ganymede, Europa, Jupiter…). The general purpose of this MAJIS capability is to mitigate the mission's data volume constraints during the nominal science phase. A lower spatial resolution and a more effective compression scheme compared to the nominal dataset can also be selected so as to meet a 3 % data volume allocation (Poulet et al., 2024b). The low data volume browse cubes are planned to be downloaded within a few days using the X-band link, so that each of these quick-look products will help assess the relevance of the observation and determine whether the full spectral resolution data cube (“science data”) should be downloaded using the Ka-band link. As an example, this makes it possible for MAJIS to perform more observations during the low orbital phase around Ganymede than can be accommodated in the MAJIS data volume allocation, selecting for downlink those with the highest science ranking on the basis of their browse dataset. The LEGA observations offered the first opportunity to test this on-board data processing functionality in-flight using an external source, with one browse product acquired for each observation and each channel (Sect. 3.3).
The instrument was calibrated during a dedicated campaign at instrument level using various calibration sources and subsequently verified during the initial payload checkouts with the internal calibration unit (Langevin et al., 2024, 2026). The results were found to be highly consistent with radiometric, spectral, and geometrical performance models (Poulet et al., 2024a; Haffoud et al., 2024; Langevin et al., 2024; Royer et al., 2025). As briefly noted in the introduction, the LEGA offered a unique opportunity for post-launch calibration verification using external sources, aimed at validating and monitoring in-flight the results obtained during ground calibration and early checkouts. During the radiometric calibration of the VISNIR channel, straylight was identified across wavelengths from 0.5 to 1.4 µm. Observations using sources with the Sun black body temperature (∼5800 K) were not available during ground calibration. These are essential to confirm that the legitimate signal contribution significantly exceeds straylight contamination, in contrast to ground tests conducted with sources at lower black body temperatures (350–2800 K). One of the main objectives of the LEGA was thus to investigate straylight behavior using resolved observations of the Moon and Earth, illuminated by sunlight.
2.2 Operational constraints
Observational planning accounted for various operational constraints, including encounter geometry, fixed attitude and rapid motion of the spacecraft, data volume limitations, inter-instrument interference, target brightness, and the instrument's capabilities. The main constraints and the corresponding mitigation strategies are reviewed below.
In hot conditions (corresponding to spacecraft-to-Sun distance <1.34 AU for the JUICE cruise), the spacecraft is continuously protected from high solar flux and elevated temperatures, by orienting the high gain antenna towards the Sun. This configuration was maintained throughout the LEGA window, thus preventing true nadir pointing, which would have been more optimal for remote sensing instruments like MAJIS. Consequently, the actual observation window was only open for a short period, only when the Zsc (boresight of MAJIS) crossed the target surface (Fig. 1). The closest approach (C/A) distances were 750 km for the Moon and 6840 km for the Earth. Both C/As occurred near the terminator, with a transition from night to day for both targets, and a phase angle of approximately 90°, decreasing along the observation path (Fig. 2).
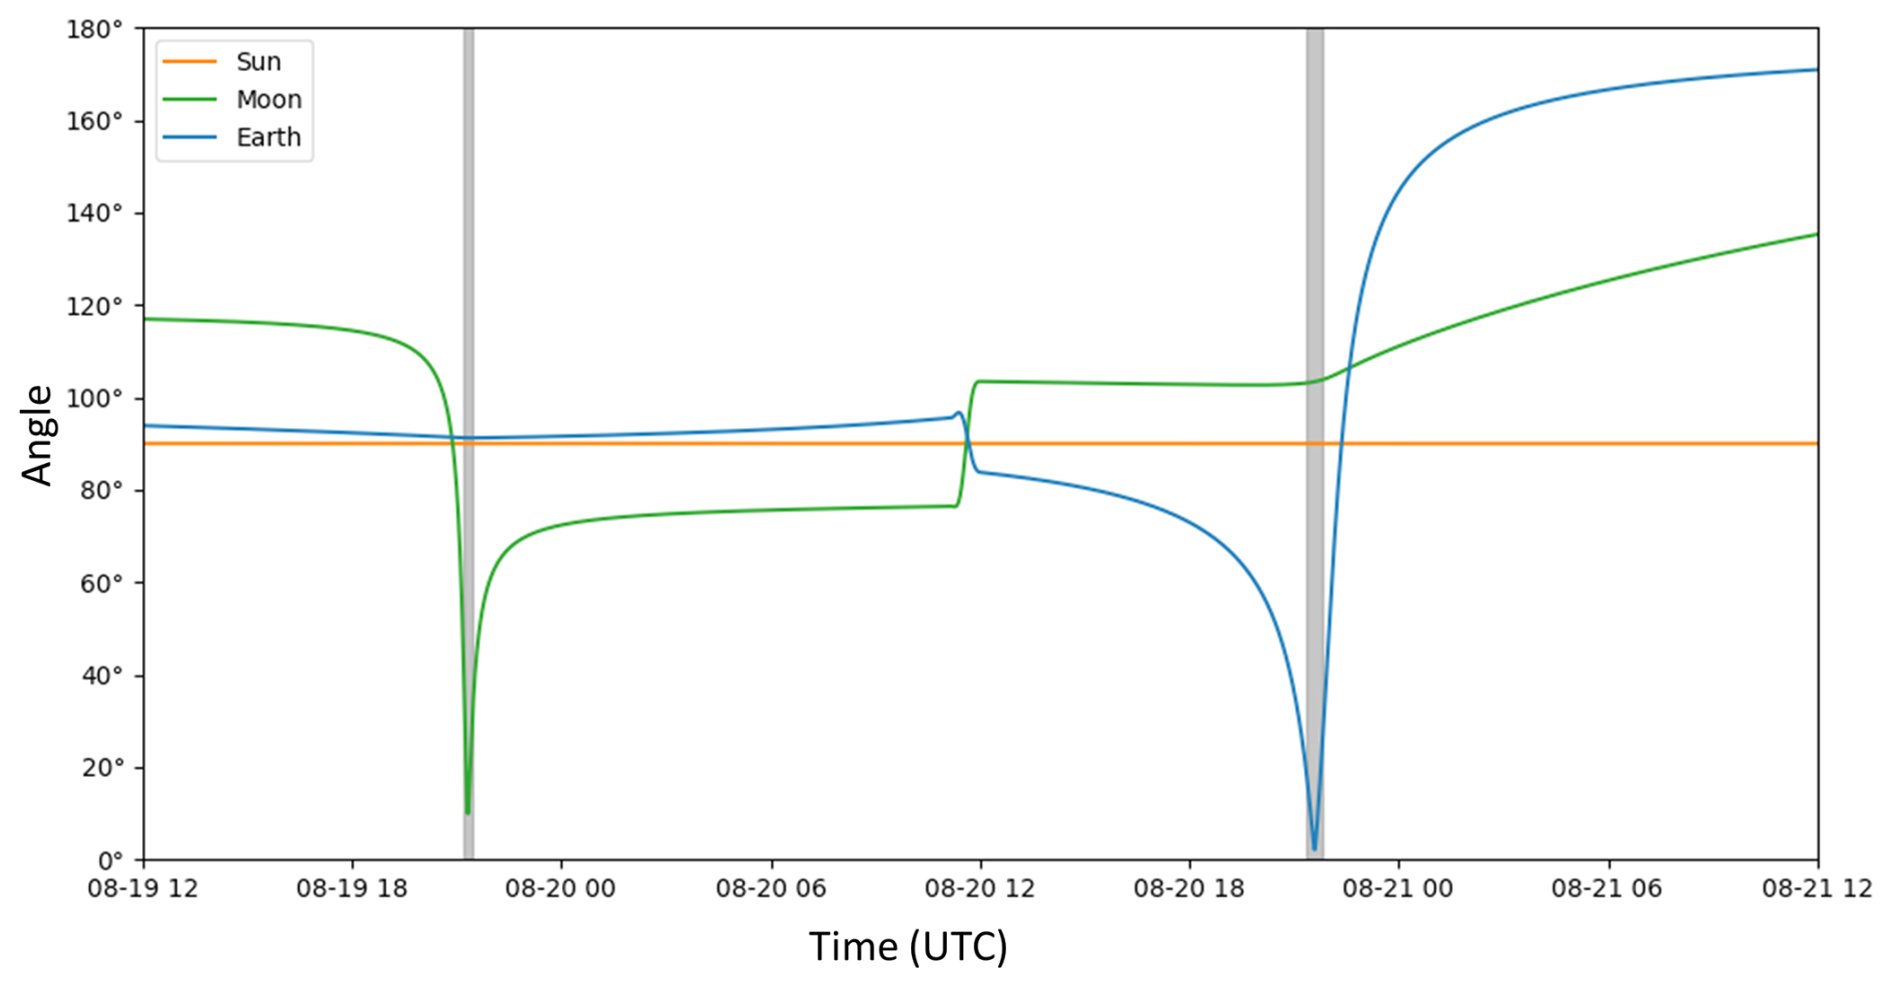
Figure 1Angle between JUICE boresight (+Zsc) and the Sun, Moon and Earth during the Earth/Moon encounter as a function of time (month–day–hour). Vertical grey lines indicate the time window during which the MAJIS boresight intersected the surface of the target. Due to thermal constraints, the Sun-pointed steady-state attitude (−Xsc towards the Sun) was maintained throughout the sequence, as shown by the orange line. A close-up on the C/A phases is provided in Fig. 2.
Integration times of a single MAJIS frame during LEGA were primarily set to 11 ms, with a few cases at 22 and 70 ms (Table 1). As a comparison, nominal MAJIS integration times at Jupiter will reach 800 ms or more for long dwell observations (e.g., during the 5000 km Ganymede orbit or for exospheres) and 100 ms for short dwell cases (e.g., high resolution observations of icy moons). High flux levels can lead to detector saturation in less than 200 ms, particularly when observing icy moons in the VISNIR or hot spots on Jupiter in the IR. The much shorter exposure times during LEGA were also necessary to prevent saturation, as MAJIS was designed for radiance levels of targets with low to bright albedo located at 5 AU. This was successful, in particular for EGA cubes obtained at relatively high incidence (65° for C10) with signal levels ranging up to 60 % of the full well capacity. The last two observations of the lunar surface reach saturation even in 11 ms at long wavelengths as the surface temperatures (up to 380 K) are much higher than that of Earth's clouds or oceans.
As introduced in Sect. 2, these short integration times can be achieved by reducing the instrument FOV to 64 or 128 samples (compared to the nominal 400 samples) for most acquisitions (Table 1), and by using the 1 MHz readout mode. This readout mode was specifically developed for MAJIS to read out the full projected MAJIS FOV (400 IFOVs) in less than 100 ms. This is required for short dwell times or high collection rates (Jupiter and icy satellites in the VISNIR range and Jupiter hot spots in the IR range) where rapid readout of the detector is essential to avoid saturation (Langevin et al., 2022) as stated above.
For all MAJIS observations, a dark signal acquisition must be available with the same operating parameters (FOV, integration time, spatial binning, spectral mask, frame binning…) before and after the observation. The dark signal is determined by closing a shutter and then averaging 9 frames. For the LEGA operations, the dark acquisition strategy was robust, with dark measurements requested both before and after each observation (except for C2 of the LGA, where only a pre-observation dark was performed in order to minimize the overhead during the very short lunar flyby). This enables testing the critical dark subtraction procedure (Sect. 2.3.1).
Straylight effects were identified in the VISNIR channel during on-ground calibration, with implications for radiometric calibration of this channel (Langevin et al., 2024). The straylight signal extends beyond the edge of the FOV, defined by the starting pixel18 µm 100 and 88 for the VISNIR and IR channels respectively. It exhibits spectral shapes similar to those of adjacent in-FOV pixels, though with slightly lower intensity. To assess this VISNIR straylight component, one LGA observation and 2 EGA observations were configured such that the FOV window, defined by the first or last pixels, included out-of-FOV pixels (Table 1). This approach enables straylight correction and evaluation of its impact on the legitimate signal (Langevin et al., 2026; Sects. 2.3.1 and 3.4).
During the first payload checkout, a dedicated test campaign was conducted to evaluate potential interferences from the RIME (Radar for Icy Moons Exploration) instrument on MAJIS. While RIME passive mode operation showed no impact on MAJIS data quality, interference tests revealed that the MAJIS infrared channel experiences perturbations when RIME emitter modes are activated, for both tested bandwidths (1 and 2.8 MHz; see Sect. 3.5). A complementary test using an external interference source was recommended to further characterize the impact under different configurations and to validate the joint performance of MAJIS and RIME during coordinated science operations onboard JUICE. In this context, the Moon flyby, with a C/A distance below 1000 km (the maximum range at which RIME can operate) offered a unique opportunity to perform this test. RIME was operated in both passive and emitter modes during the MAJIS observation window, and the acquired signals were representative of those expected during nominal FB C/A operations (e.g. the pushbroom phase of close flybys of satellite such as the first Europa flyby “7E1” or Ganymede circular 500 km orbit phase).
Lastly, it is important to report that a dry run of the LEGA operations was successfully performed in July 2024 to validate the full sequence of instrument operations, including those involving MAJIS.
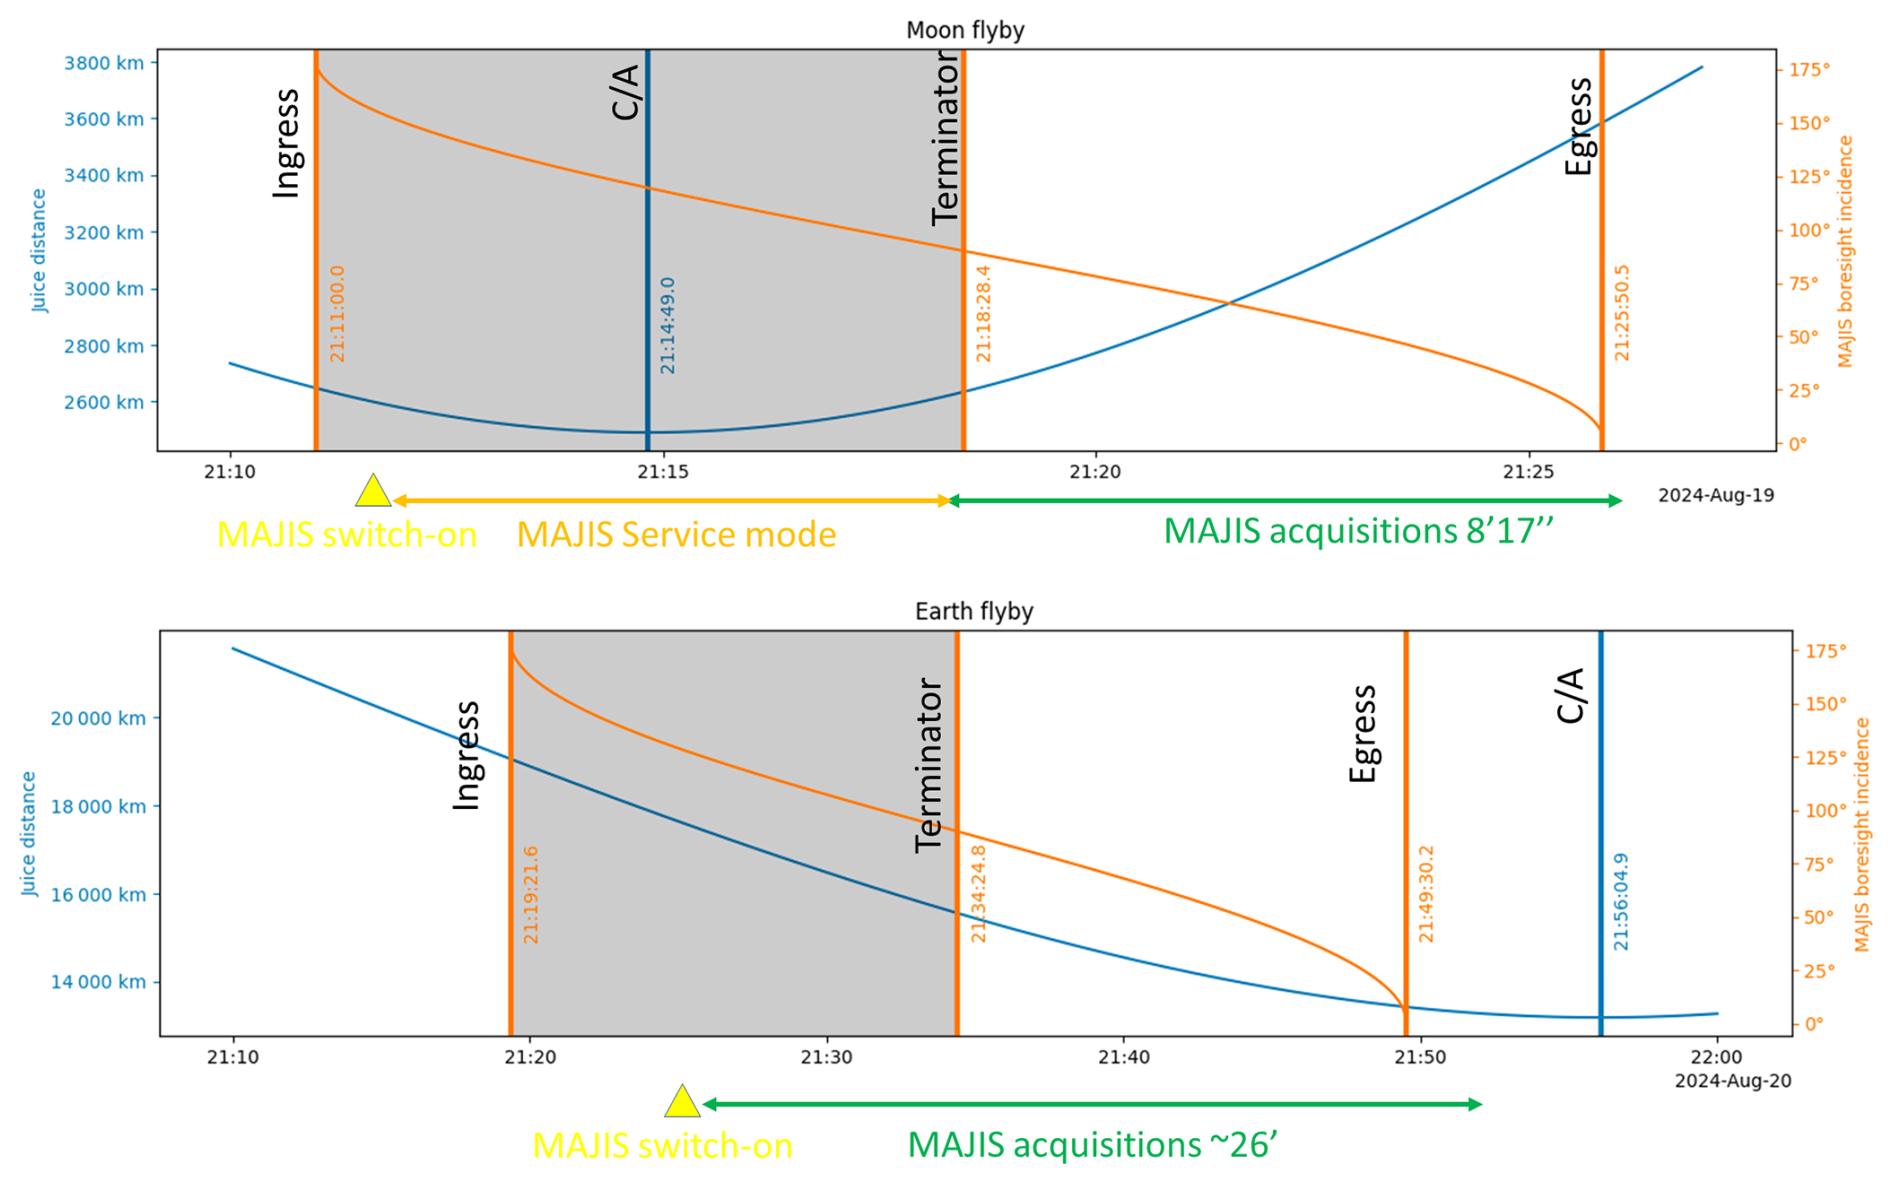
Figure 2Timeline of the MAJIS sequences for the Moon F/B (top) and the Earth F/B. The green lines represent to the slots of the MAJIS cube acquisitions. During the Moon flyby, due to operational constraints of the RIME instrument, MAJIS was switched on several minutes before the start of the first frame acquisition and was then kept in the so-called service mode, an instrumental stable mode that is ready to switch to science mode.
During the LEGA, MAJIS ultimately acquired 5 and 19 hyperspectral cubes of the Moon and Earth, respectively, for a total data volume of ∼7.5 Gbit. Only the first cube of LGA was acquired during a spacecraft slew; all subsequent cubes were obtained using the scan mirror. Lossless compression without despiking, corresponding to the (N, M, K) parameter set (1, 1, 0) as defined in Langevin et al. (2020), was applied to all cubes. Spatial resolution ranges roughly from 130 to 300 m for the Moon, and from 1 to 3 km for Earth observations.
Table 1Instrument setting and observational conditions of the MAJIS cubes acquired during the LEGA. The readout mode is 1 MHz for the 2 channels of all observations. No despiking and no frame binning has been applied.
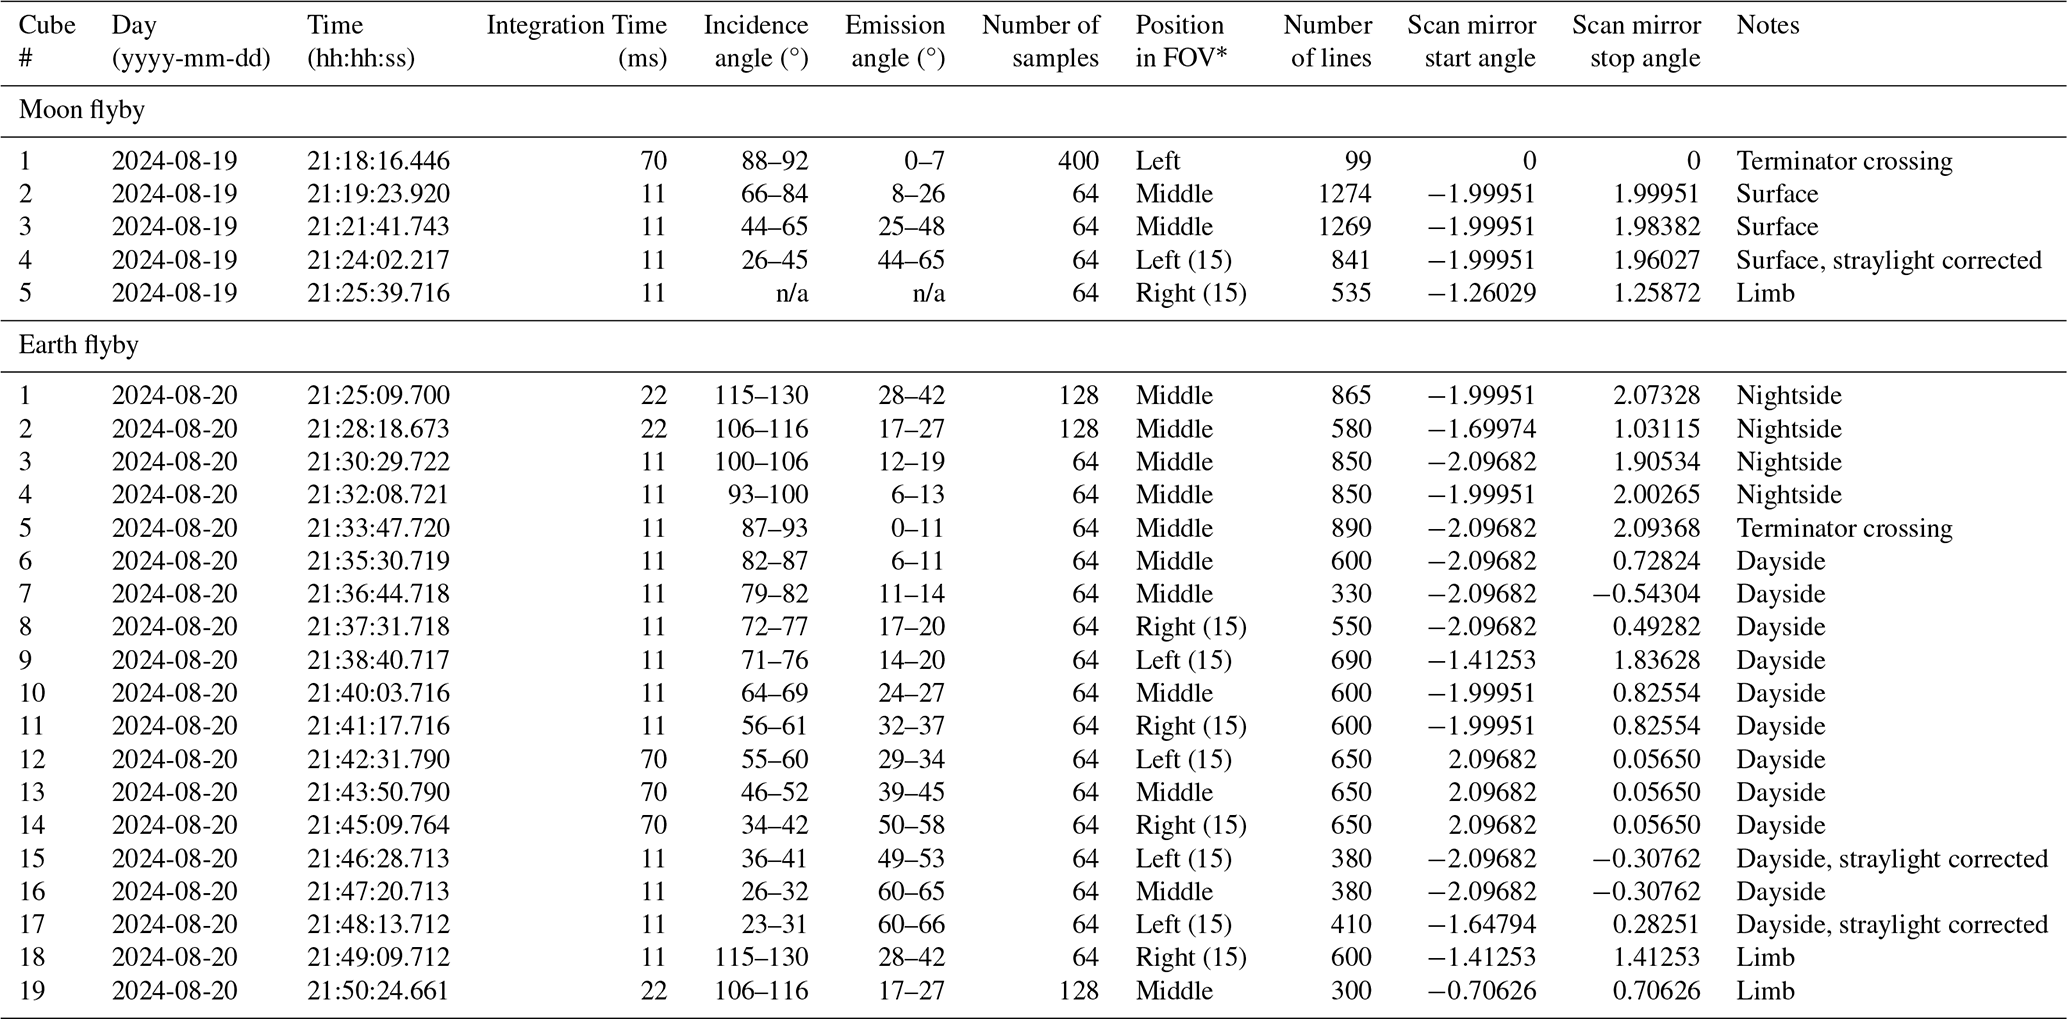
n/a: not applicable. ∗ Numbers in parenthesis indicates the number of samples MAJIS out-of-FOV for assessing the VISNIR straylight contribution
2.3 Footprints and illumination conditions
The four MAJIS image cubes targeting the lunar surface are concentrated along the equatorial band, with longitudes ranging approximately from 90 to 20° E (Fig. 3). Although spatial coverage is limited, the cubes encompass a variety of lunar terrains, including cratered highlands, low-albedo volcanic Mare Fecunditatis and southern portion of Mare Tranquillitatis, as well as impact structures such as the 137 km-diameter Langrenus crater, located on the eastern margin of Mare Fecunditatis. Owing to the spatial resolution of MAJIS, spectral analysis of small-scale features such as km-sized craters and ray systems is achievable (Zambon et al., 2026). The first cube crosses the terminator, providing ideal conditions for geometric calibration, as shadows cast by craters and other geological features are elongated, enhancing the visibility of these features in the image (Seignovert et al., 2026). In addition, the wide range of solar incidence angles enables investigation of the temperature profile from the terminator in C1 to the dayside covered by the three other cubes (Tosi et al., 2026).
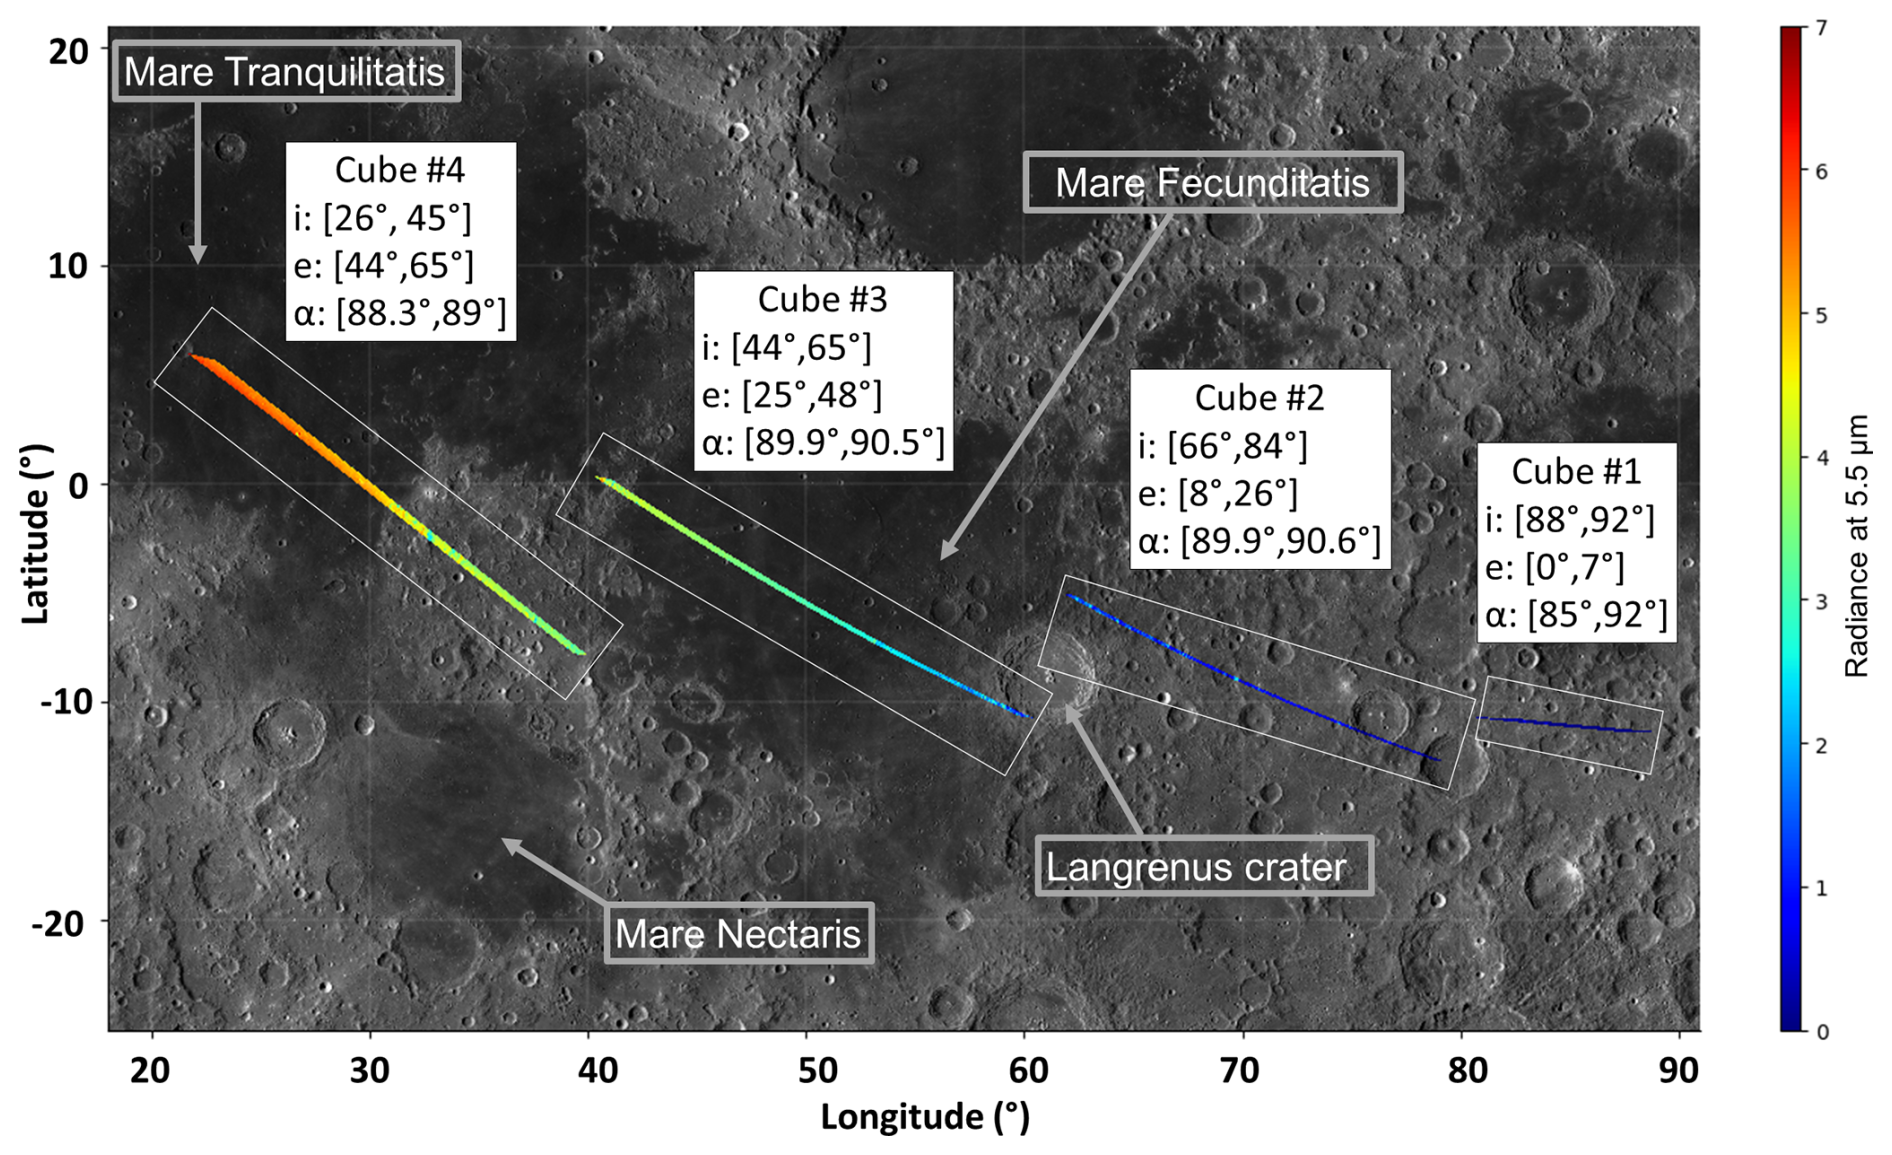
Figure 3Footprints of four cubes (C1 to C4) acquired during the LGA, which intersects the lunar surface. Color code of each track over the global LRO-WAC (LROC Wide Angle Camera) mosaic corresponds to the variation of the radiance at 5.5 µm. White rectangles have been plotted to outline each track. Ranges of incidence, emission, and phase angles are shown for each cube.
MAJIS imaged the Earth over a 25 min interval near the closest approach of 6840 km, acquiring spectra across 1016 spectels (spectral elements). The observation sequence began on the nightside, inbound over the southern Bay of Bengal, then concluded on the dayside in the middle of the Pacific Ocean very close to the Hawaiian Islands (Fig. 4). MAJIS obtained four nightside observations, with the first two capturing land surfaces. One observation crossed the terminator between Taiwan and the Philippines, followed by a series of cubes over the Pacific Ocean under tangent illumination. Later morning observations of tropical convective clouds reveal elongated shadows, enabling cloud-top altitude retrieval based on shadow geometry projected onto the ocean surface (Sect. 5.3). The pointing of Pacific ocean observations is limited to ocean and clouds, even if some small islands are in principle covered by the swath of some cubes. However, due to the illumination conditions and to the presence of clouds, it is very difficult to identify their signal in the data. Three observations over the ocean were acquired with long integration times to estimate in-band trace signatures. The last two observations were acquired in limb geometry (MAJIS slit in a tangent orientation wrt limb) for straylight assessment.
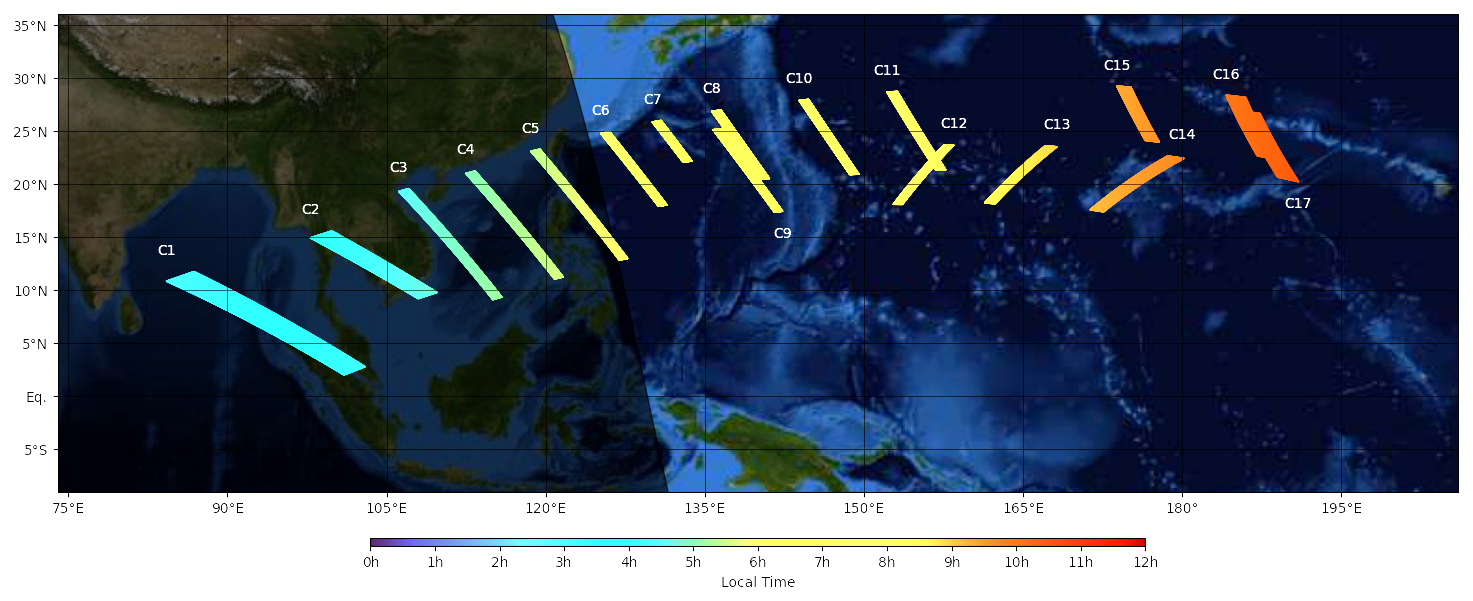
Figure 4Footprints of the cubes (C1 to C17) acquired during the EGA, with corresponding local times shown, over the Blue Marble Next Generation mosaic from Moderate Resolution Imaging Spectroradiometer.
2.3.1 MAJIS data processing
The procedure for converting raw signal cubes into radiance cubes is described in Section IV.B of Langevin et al. (2024). All LEGA data have been acquired with short integration times (requiring 1 MHz readout that will be the primary mode used during the Jupiter science phase), and no despiking or reversible compression has been applied (Sect. 2.2). The first three steps are identical for both the VISNIR and IR channels: (1) decompression; (2) de-spiking recovery (skipped for the LEGA data); (3) restoration of the raw values as acquired, by adding back the “before” dark signal which has been subtracted during on-board processing. During step 4 (linearity correction), a table of linearity coefficients specific to each channel and to the 1 MHz readout mode is applied. Step 5 defines the procedure for dark signal subtraction, which will be discussed in more detail in the companion paper of Langevin et al. (2026). For the VISNIR channel, the dark signal is dominated by a straylight contribution which is observed even when the shutter is closed, so that the safest approach consists in interpolating the dark signal on the basis of the dark acquisitions before and after the observation and the local on-board time (LOBT) of each frame acquisition. For the IR channel data, the dark signal is dominated by the dark current of the detector, so that the interpolation of the dark acquisitions before and after the observation is based on the IR FPA temperature for each frame acquisition as derived from a PT-1000 thermal sensor. The final step consists in applying the 2D Instrument Transfer Function (ITF), expressed in digital numbers (DN) per unit of radiance, to each frame of a given observation so as to derive the calibrated radiance for each data element of a cube. It is important to note that minor changes of the instrument response have been identified after launch, so that the ITF derived from ground calibration has been adjusted on the basis of the post-launch calibration and LEGA datasets (Langevin et al., 2026). A straylight mitigation procedure has been also applied on VISNIR channel data for the 3 cubes (#4 of LGA, #15 and #17 of EGA) for which the acquisition was extended beyond the edge of the FOV (Sect. 3.4). Finally, despite the shorter acquisition time used during the observations, detector saturation still occurred at high flux levels associated with scenes of the warm daytime lunar surface or icy clouds in the Earth's atmosphere. A specific mask was therefore defined for some observations to flag saturated pixels, using the following criteria: raw DN values greater than 20 000 and approximately 11 000 for the VISNIR and IR channels, respectively.
2.4 Near-coincident data from other instruments
One of the primary objectives of the LEGA campaign was to compare MAJIS data with contemporaneous datasets from other instruments. The relevant datasets are presented below.
2.4.1 JUICE instruments
JANUS imaged the Moon and the Earth during the same time intervals as MAJIS (Hueso et al., 2026). During the LEGA flyby, the JANUS camera acquired high-resolution imagery with a spatial resolution of up to ∼20 m per pixel (A. Lucchetti, personal communication, 2025; Hueso et al., 2026). Figure 5 shows the footprints of four MAJIS swaths overlaid with the JANUS FOV track in green. The overlaps enable a comparison between the two imagers and support the geometric calibration of MAJIS with respect to JANUS. This comparison is discussed by Seignovert et al. (2026).
As noted in Sect. 2.2, RIME was activated during the LEGA in both passive and active modes during the MAJIS acquisition window, allowing the quantification of interference impacts on MAJIS images. This topic is addressed in Sect. 3.5.2. In addition, the Submillimeter Wave Instrument (SWI) also performed simultaneous observations. A comparison of the two datasets is shown in Sect. 4.2.
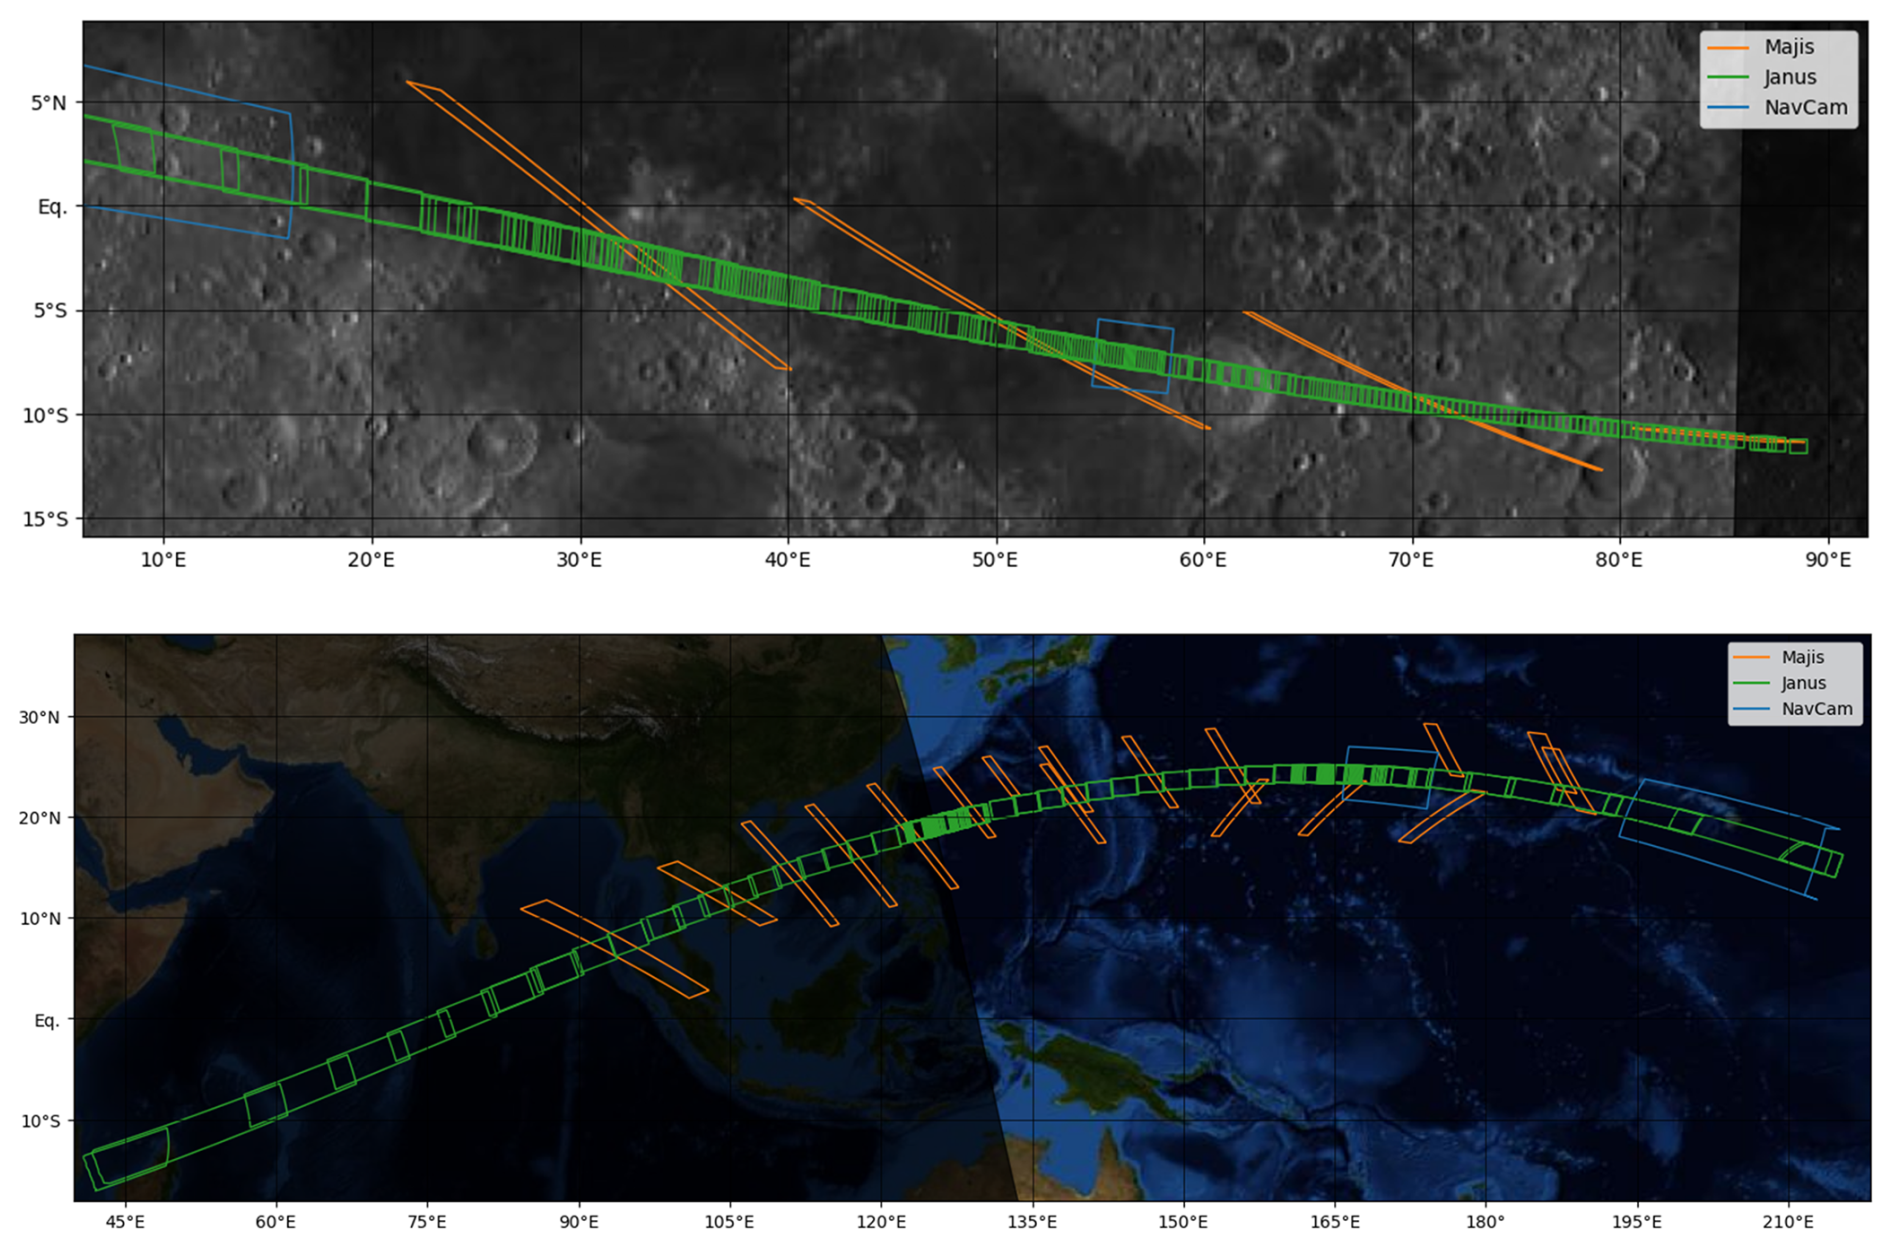
Figure 5Overlap between MAJIS footprints (orange boxes) and JANUS track (green footprints) and NacCam FOV (blue boxes) during the LGA (top) and EGA (bottom, with Blue Marble Next Generation mosaic from Moderate Resolution Imaging Spectroradiometer in background). During LGA, C1 (Fig. 3) was fully covered by JANUS image, while C2 to C4 were acquired using the scan mechanism allowing for cross-comparison over a portion of the JANUS FOV.
2.4.2 Earth-observing instruments
Several imaging spectrometers currently in terrestrial orbit are dedicated to tropospheric remote sensing of the Earth. Some of these instruments routinely provide spectral and geolocated data comparable to those acquired by MAJIS, although at different spatial and spectral resolutions and sensitivities. Tentative coordination with selected Earth-observing instruments was undertaken during the LEGA planning phase, resulting in near-coincident observations with MAJIS. Specifically, relevant observations have been acquired by the Environmental Mapping and Analysis Program (EnMAP) imaging spectrometer (Sang et al., 2019; Chabrillat et al., 2024), the Infrared Atmospheric Sounding Interferometer (IASI) (Blumstein et al., 2004), the PRISMA (PRecursore IperSpettrale della Missione Applicativa) imaging spectrometer (Galeazzi et al., 2009), and the Tropospheric Monitoring Instrument (TROPOMI) (Veefkind et al., 2012). All of these instruments partially overlap with the MAJIS spectral range (Fig. 6). On a comparative scale and beyond changes in localized cloud boundaries, the datasets of Earth observing instruments are sufficiently close in time (less than in a few hours) and space (same location) to be considered near-coincident. Below, we briefly describe these instruments and their datasets.
EnMAP, the first hyperspectral imager developed and built in Germany, includes two spectrometers covering the 418 and 2445 nm wavelength range with 224 spectral bands. Operating in a sun-synchronous orbit at approximately 650 km altitude, it provides data cubes with a swath width of 30 km and a spatial resolution of 30 m × 30 m. Six observations were planned by the EnMAP team near the LEGA event, matching the MAJIS footprints as closely as possible (Table 2).
IASI is a Fourier Transform Spectrometer onboard the MetOp-B and -C satellites, developed by the French space agency CNES (Phulpin et al., 2007). It covers the 3.63–15.5 µm range with a spectral resolution of ∼0.25 cm−1, approximately 10 to 20 times higher than that of MAJIS. With a nadir spatial resolution of 12 km and a swath width of 50 km, IASI enables high-precision atmospheric profiling. This instrument is considered to offer excellent radiometric stability and accuracy in retrieving atmospheric temperature, humidity, and gas concentrations (Blumstein et al., 2004). IASI data are available near the MAJIS cubes #8–16 acquired over the Pacific Ocean during EGA (Table 1). Co-location filtering was applied to optimize data overlap between the two instruments (Guerlet et al., 2026).
PRISMA, developed by the Italian Space Agency and launched in 2019, is a satellite that combines a hyperspectral sensor (400–2500 nm, 239 bands, ∼12 nm sampling) with a panchromatic camera (5 m resolution). The hyperspectral imager delivers data at 30 m spatial resolution across a 30 km swath, facilitating the mapping of surface chemical and physical properties. Although no temporal coincidence with MAJIS observations was possible due to orbital constraints, PRISMA acquisitions were scheduled to be as close as feasible to the JUICE EGA sequences (Oliva et al., 2026).
The TROPOspheric Monitoring Instrument (TROPOMI) instrument is a pushbroom hyperspectral imaging spectrometer aboard the Sentinel-5 Precursor satellite. It measures solar backscattered radiation across the UV, visible, near-infrared, and shortwave infrared (270–2385 nm) spectral ranges. TROPOMI has potentially 5 very narrow bands that could potentially be used for spectral inter-comparisons with MAJIS, but only NIR bands 5–6 (675–775 nm with 0.25 nm spectral resolution) and SWIR bands 7–8 (2.305–2.385 with spectral resolution 0.55 nm) are considered for comparison with MAJIS. With a spatial resolution of 7×3.5 km2 at nadir (lower than MAJIS observation), it provides daily global coverage at a local overpass time of 13:30 for key atmospheric trace gases and aerosols with higher spectral resolution than MAJIS. This difference in spatial and spectral resolution, and the lack of contemporaneous overlap, makes cross-comparison challenging. Nevertheless, TROPOMI can provide spatial context to the MAJIS scans, and validation of radiometric and spectral calibration (Langevin et al., 2026).
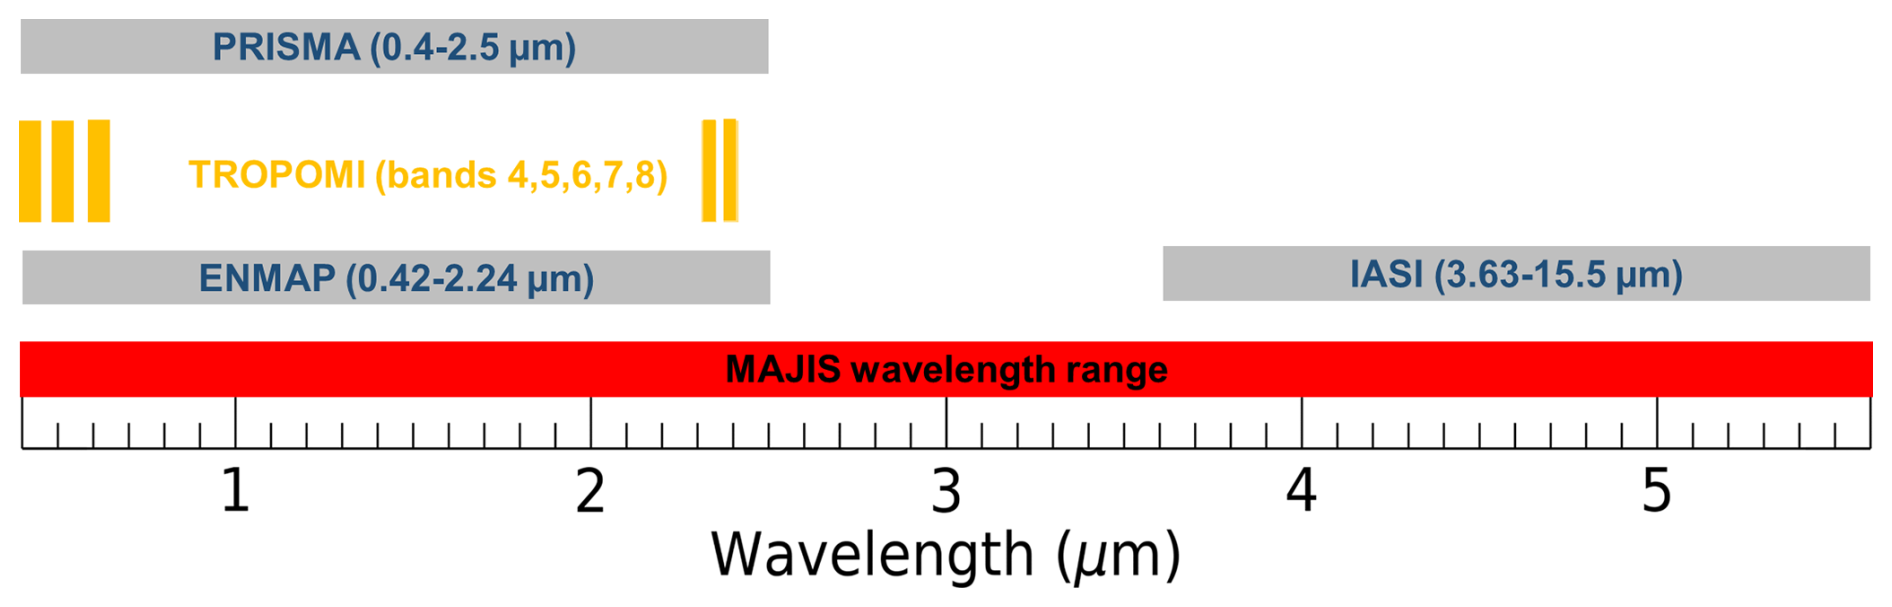
Figure 6Comparison of the MAJIS spectral range (in red) with the spectral ranges of Earth-observing instruments used in the analysis of the MAJIS EGA data.
Table 2List of the EnMAP observations coordinated with MAJIS team during the EGA.
3.1 SNR and implication for the science phase
We assess the MAJIS performances in terms of SNR from the EGA cubes. As shown in Fig. 7, the radiances measured by MAJIS on clouds and the Pacific Ocean at high incidence present many similarities with that expected in the Jupiter system. Significant absorption bands from gases and ices reduce the spectral radiance (or albedo/reflectivity) compared to the solar reflectance spectrum: H2O (gas/ice/water) and CO2 gas for the Earth, H2O ice for icy satellites, CH4 gas for Jupiter. For the Earth and Jupiter's infrared hotspots (gaps in the overlying clouds), the radiance is dominated by the thermal contribution for wavelengths larger than 4.5 µm (this is not the case for icy satellites, with much colder surfaces). It is interesting to note that the albedo of Jupiter (∼0.65) and icy satellites (∼0.65 to 0.75) in the visible range is similar to that of Earth clouds (up to 0.9), so that the radiances expected at low phase angles in the VISNIR range for Jupiter and icy satellites are typically a factor of 10 lower than the radiance observed for Earth clouds for an incidence of 65° (multiplied by 2.5 due to the cosine of the incidence and divided by 25 for the reduction of the solar radiance at 5 AU). The cloud-free ocean is much darker than clouds at short wavelengths, but it is hotter so that the signal at long wavelengths is larger. It is also interesting to note that for the Earth as well as for Jupiter and icy satellites there is a very large dynamic range along the spectrum, with signals reduced by factors of up to 100 in strong absorption bands.
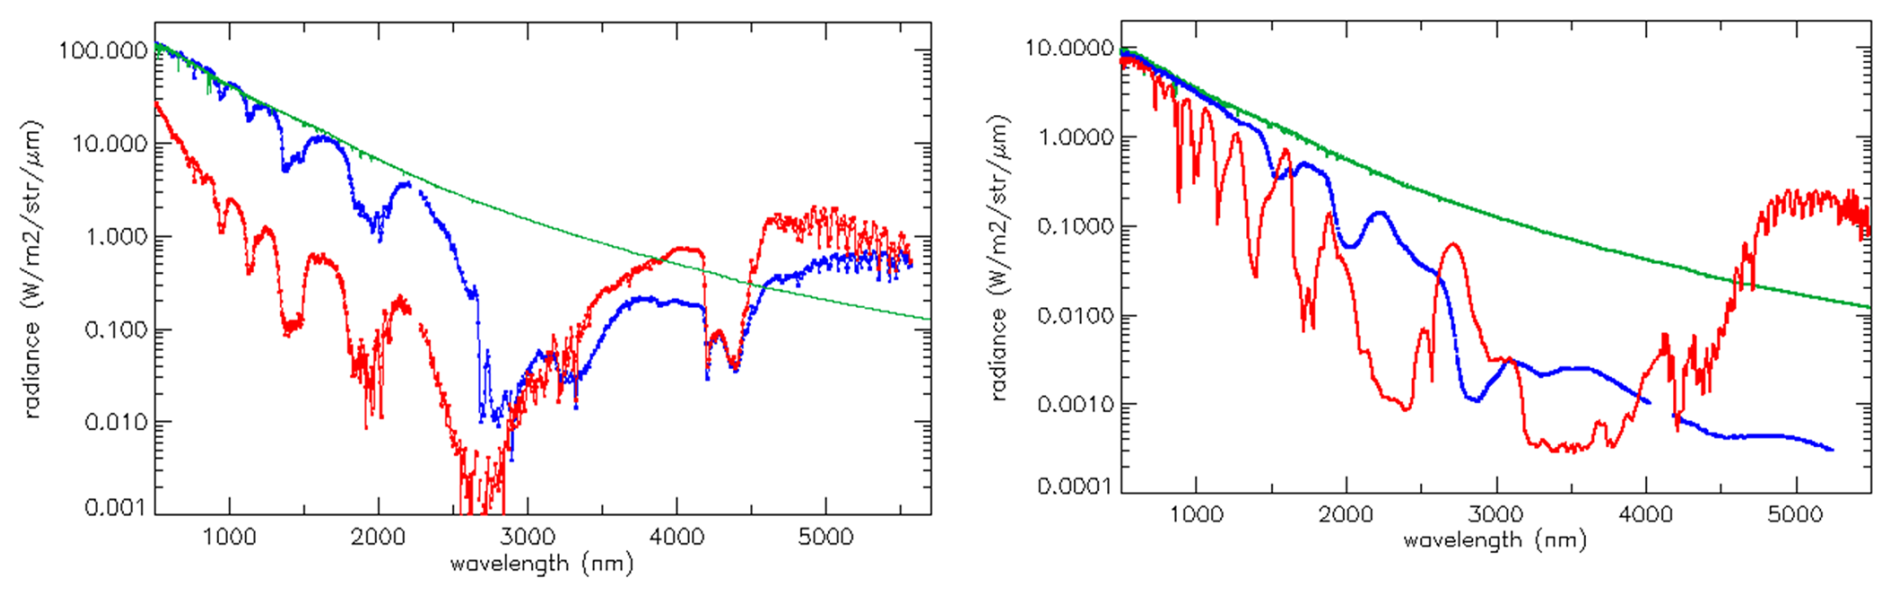
Figure 7Left panel: Radiances measured by MAJIS over the Pacific Ocean with a solar incidence of 65° for a cloudy pixel (blue) and a cloud-free pixel (red) and an integration time of 11 ms. The green line is the MODTRAN solar spectrum assuming an albedo of 0.8 throughout the spectrum. Right panel: Radiances simulated for a bright region of Europa at i=10° (blue) and for Jupiter at i=10° (red) come from Royer et al. (2025) with a thermal contribution at long wavelengths corresponding to a brightness temperature of 260 K (“hot spot”) for Jupiter. The green line is the solar spectrum, assuming an albedo of 0.75 across the spectrum.
As mentioned in Sect. 2.2, high resolution observations in the Jupiter system will be performed with an integration time of 100 ms, so that the SNR performance for the Earth observations at high incidence in 11 ms (with nominal spatial and spectral sampling) is representative of what can be expected for high resolution observations with nominal sampling during the science phase of MAJIS.
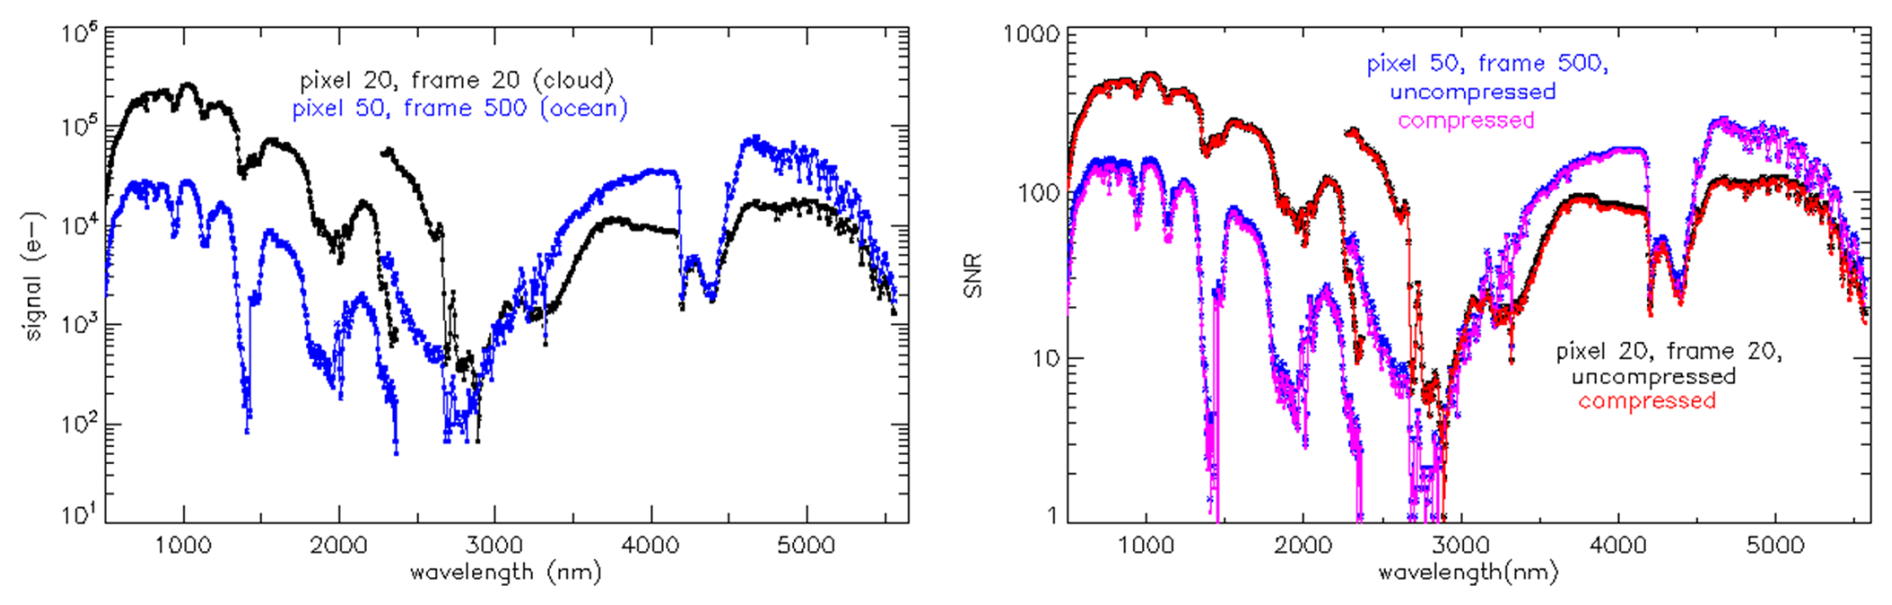
Figure 8Left panelL Signals in electron (e−) collected by MAJIS pixels in 11 ms for clouds and ocean (nominal sampling, 2×2 H1RG pixels, each with a well depth of 100 000 e− for the VISNIR channel, 50 000 e− for the IR channel). Right panel: SNR as a function of wavelength for the two MAJIS pixels displayed in the left panel (black for clouds, blue for the ocean). The optimized MAJIS data compression strategy discussed in the text has a very minor impact on the SNR as illustrated by the very small difference between uncompressed and compressed data (cloud in red and ocean in magenta).
The readout noise (RON) of the 1 MHz readout mode at the H1RG pixel18 µm level is ∼30 e− (Langevin et al., 2024). The noise (then the SNR) can be assessed for H1RG pixel18 µm by combining the shot noise and the RON, then dividing it by 2 for MAJIS data element with nominal sampling (2×2 H1RG pixel18 µm). The results for the most relevant EGA observation are shown in Fig. 8. The signal collected by MAJIS data elements ranged from a few 10 e− in deep absorption bands up to 250 000 e− (clouds near 1000 nm). Figure 8 shows that, except in very deep absorption bands, the SNR for high resolution observations in the Jupiter system will range from good (∼50) to very good (∼100) and excellent (∼500) even without stacking. In the crossover range (2280 to 2370 nm), the best SNR will be obtained with the IR channel. It is important to note that on-board stacking will be applied on most science data as a result of de-spiking strategies (Langevin et al., 2020) or when long repetition times are available (7.8 s for the orbit phase at an altitude of 5100 km over Ganymede). As an example, the most frequently used Jupiter observation mode (“disk scan”) averages 8 out of 12 independent samplings into a MAJIS data element, improving by a factor of 3 the SNR as displayed in Fig. 8 for representative Earth spectra. This estimate is consistent with previous radiometric modeling (Poulet et al., 2024b; Royer et al., 2025). For regional mapping of Ganymede, the SNR will exceed 1000 over a large part of the wavelength range due to longer integration time. Additional stacking can be considered on ground for further improving the SNR to detect very weak signals (rings, exospheres) or absorption bands.
3.2 Impact of the compression
The very large dynamic range of signal levels for a single acquisition raises a major challenge for the MAJIS data compression strategy. It implements reversible compression after shifting the DN levels to the right by 0 to 7 (Poulet et al., 2024b). This reduces the number of bits required for coding each value. Specifically, this procedure saves 1 bit/data per step as long as only noise bits are shifted out of the signal in DN. However, a shift by 1 to 7 multiplies the quantization noise (∼1.2 e− for the data as acquired) by 2 to 128, so that implementing a large shift to a relatively low signal increases the total noise. Data compression with a single value of the shift parameter for the full data cube would have been either very ineffective or very penalizing for spectral ranges with lower signal. Therefore, a specific shift can be selected by TC for up to 16 spectral bands per channel so as to adjust the level of shift to the signal level, maintaining the quantization noise at a lower level than the physical noise (Poulet et al., 2024b). For the EGA, a shift of 0 (reversible compression) was applied to all spectral bands (8 per channel for the EGA), leading to an average data volume of 6.43 bits per datum after compression (already a significant reduction from the 16 bits before compression). An optimum set of shifts, as will be applied during the JUICE science phase, would have reduced the data volume to 3.5 bits per datum. As shown in the right panel of Fig. 8, the SNR (which is good to excellent) is reduced by at most a factor 1.1 except in the deepest absorption bands. This is definitely a small price to pay for nearly doubling the number of observations which can be implemented within the MAJIS data volume allocation.
3.3 Browse validation
For observations with selective downlink, two files are produced by MAJIS: a nominal data file with the full spatial and spectral resolution, and a “browse” file. LEGA data provided the opportunity to validate the browse production during the LEGA by checking that the browse dataset is correctly extracted on-board from the nominal dataset, and that a more effective compression scheme does not negatively impact the relevance of the browse dataset for selection on the basis of the science interest of the data. Selective downlink is not implemented during cruise, so that downloading of the nominal dataset for all 24 MAJIS observations (5 Moon, 19 Earth) was planned. However, the selective downlink procedure has been tested by preparing browse files for each LEGA observation. The browse spectral table (which can be selected by TC) included 52 wavelengths for this test (32 for the VISNIR channel, 20 for the IR channel). The spatial resolution was retained for the browse dataset, but a more effective compression scheme was selected, with the browse data shifted by 4 to the right before reversible compression while reversible compression was applied to the nominal data as such.
Figure 9 (top panel) displays the DN levels of the raw data for the decompressed nominal and browse datasets. It shows that the browse spectels were correctly extracted from the nominal dataset. The shift by 4 to the right before reversible compression reduced the data volume of the browse file from ∼7.7 to ∼4 bits per datum, 2.8 % of the nominal data file (reversible compression, ∼7 bits per datum), in line with the 3 % target defined for the data volume allocated to browse data. The error introduced by this shift ranges from −7 to +8 DN. As can be seen on the top panel, this error is small compared to a signal from 900 to 12 000 DN for all but one of the selected browse spectels so that the ratio between browse and nominal DN levels is close to 1 (blue line). In the VISNIR spectral range, the last selected browse spectel (2.309 µm) in the VISNIR spectral range had a very low signal hence the error introduced by compression is ∼10 % (due to the low SNR, this spectel will not be selected in updated versions of the browse spectral tables). As can be seen in Fig. 9 (bottom panel), the browse data for the 51 remaining wavelengths would have made it possible to assess the science interest of radiance spectra from this observation of the Moon in the selected spectral ranges.
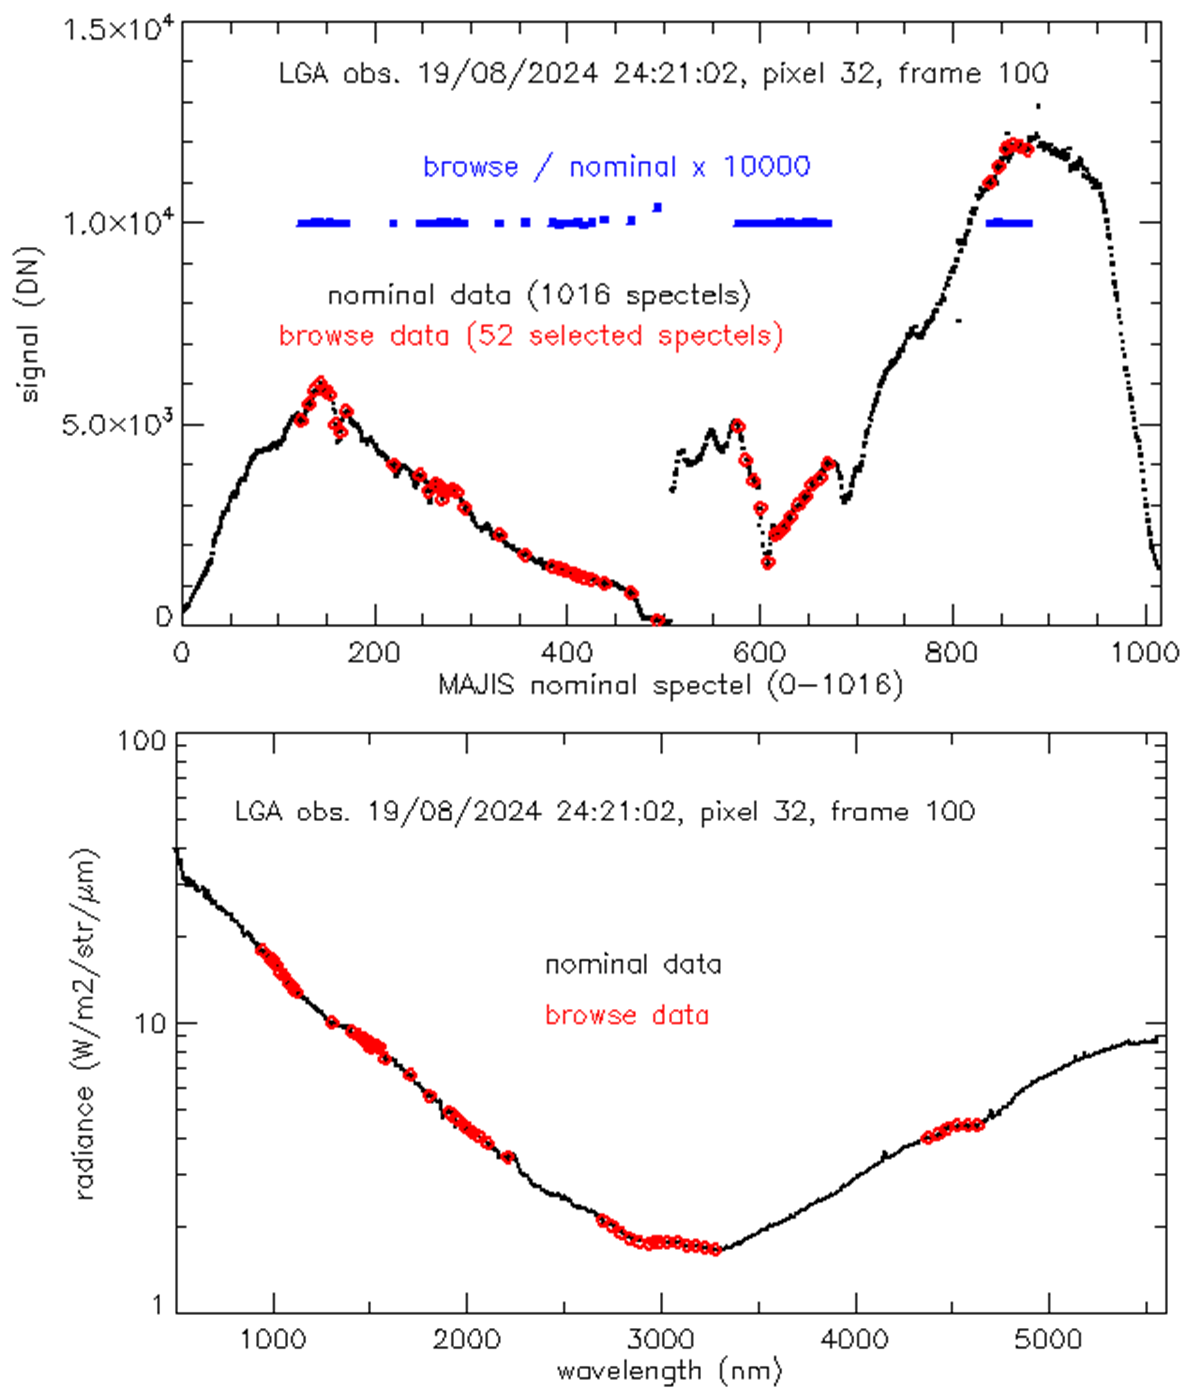
Figure 9Nominal and browse datasets for one of the observations of the Moon; top panel: DN levels along the spectrum for the nominal dataset (black) and browse dataset (red) for one of the MAJIS pixels. The blue line corresponds to the ratio between the browse and nominal data for the 52 selected spectels out of 1016 multiplied by 10 000 for legibility; bottom panel: radiances for the nominal dataset (black) and the browse dataset (red); the longest wavelength browse spectel of the VISNIR channel (2309 nm) has poor SNR (as shown in the top panel) and it has not been displayed.
3.4 VISNIR straylight assessment
The 9 cubes extending beyond the FOV show that the relative contribution of straylight observed at short VISNIR wavelengths is larger for LGA data than for EGA data (see Langevin et al., 2026). This confirms that the VISNIR straylight photons have wavelengths in the 1.5–2.5 µm range, as shown during calibration (Langevin et al., 2024). Due to the strong absorption bands of H2O and CO2 at wavelengths larger than 1 µm, Earth spectra exhibit a blue slope in the near-IR, with higher reflectance at short wavelengths (impacted by VISNIR straylight, Sect. 5.2) than in the source region of straylight photons, while Moon spectra exhibit a red slope in the near IR (Pieters et al., 2013).
Calibration results have shown that the spectral shape of the VISNIR straylight exhibits only minor changes in spectral shape between neighbor pixels, with a signal level slowly increasing toward the center of the detector. This made it possible to consider a straylight mitigation approach for regions close to the edge of the FOV by applying a coefficient to the spectral shape observed out of the FOV. Three conditions must be met:
-
The read-out window must extend beyond the edge of the FOV. This was the case for 9 cubes (see Table 1): C4 of the LGA (extending left of the FOV) and C8 for the EGA (4 extending left of the FOV and 4 extending right of the FOV)
-
The in-FOV spectra are not saturated
-
The straylight signal can be characterized with good SNR when the straylight with in-FOV spectra not reaching saturation and out-of-FOV spectra exhibiting enough signal for evaluating this contribution straylight with high SNR.
The C4 spectra are not saturated, and the VISNIR straylight level is high for such a red target, hence conditions 2 and 3 are met for this observation. The VISNIR straylight level is a factor of 10 or more lower than the total signal for EGA observations, hence conditions 2 and 3 were met only for two observations (C15 and C17). Straylight corrected data cubes were then determined for the 3 cubes previously cited. For observations around Jupiter, we plan to shift by ∼10 pixels left the full read-out window of MAJIS (400 pixels) so that straylight corrected spectra are available for the leftmost pixels of the FOV.
3.5 RIME interference impact
3.5.1 RIME interference impact during LGA dry-run
During the LGA dry-run conducted without external signal sources, the MAJIS instrument was tested for susceptibility to electromagnetic interference from the RIME radar. Previous ground and in-flight tests (including the Near-Earth Commissioning phases and initial payload checkouts) had already indicated that the MAJIS IR channel is disturbed when RIME operates in transmitter (Tx) mode, while the passive (Rx) mode has no observable impact. The dry-run simulated nominal LGA science observation conditions, with both instruments operating simultaneously. Specifically, RIME was in active mode (2.8 MHz bandwidth) except for a ∼4 min interval during which it operated in passive mode (Fig. 10).
The data analyses confirmed very minor perturbations on the VISNIR signal, but significant disturbances on the IR channel when RIME Tx was enabled (Fig. 10). The noise in cube #3, acquired during the RIME passive interval, was dominated by quantization effects (8 DN), resulting in a readout noise of ∼15 e− (consistent with the estimate reported by Langevin et al., 2024). In contrast, cube #1, the beginning of cube #2, and the end of cube #4 exhibited spurious spikes with amplitudes reaching 40–50 DN, corresponding to a noise increase by a factor of ∼2.5. The noise distribution in the perturbed cube #1 follows a Lorentzian profile, characteristic of radiated interference. These disturbances are most likely due to electromagnetic coupling between the RIME transmitter and the MAJIS IR thermal harness. In addition, the increase in noise observed in the IR channel closely matches that seen during the initial interference tests, indicating that the perturbation is reproducible.
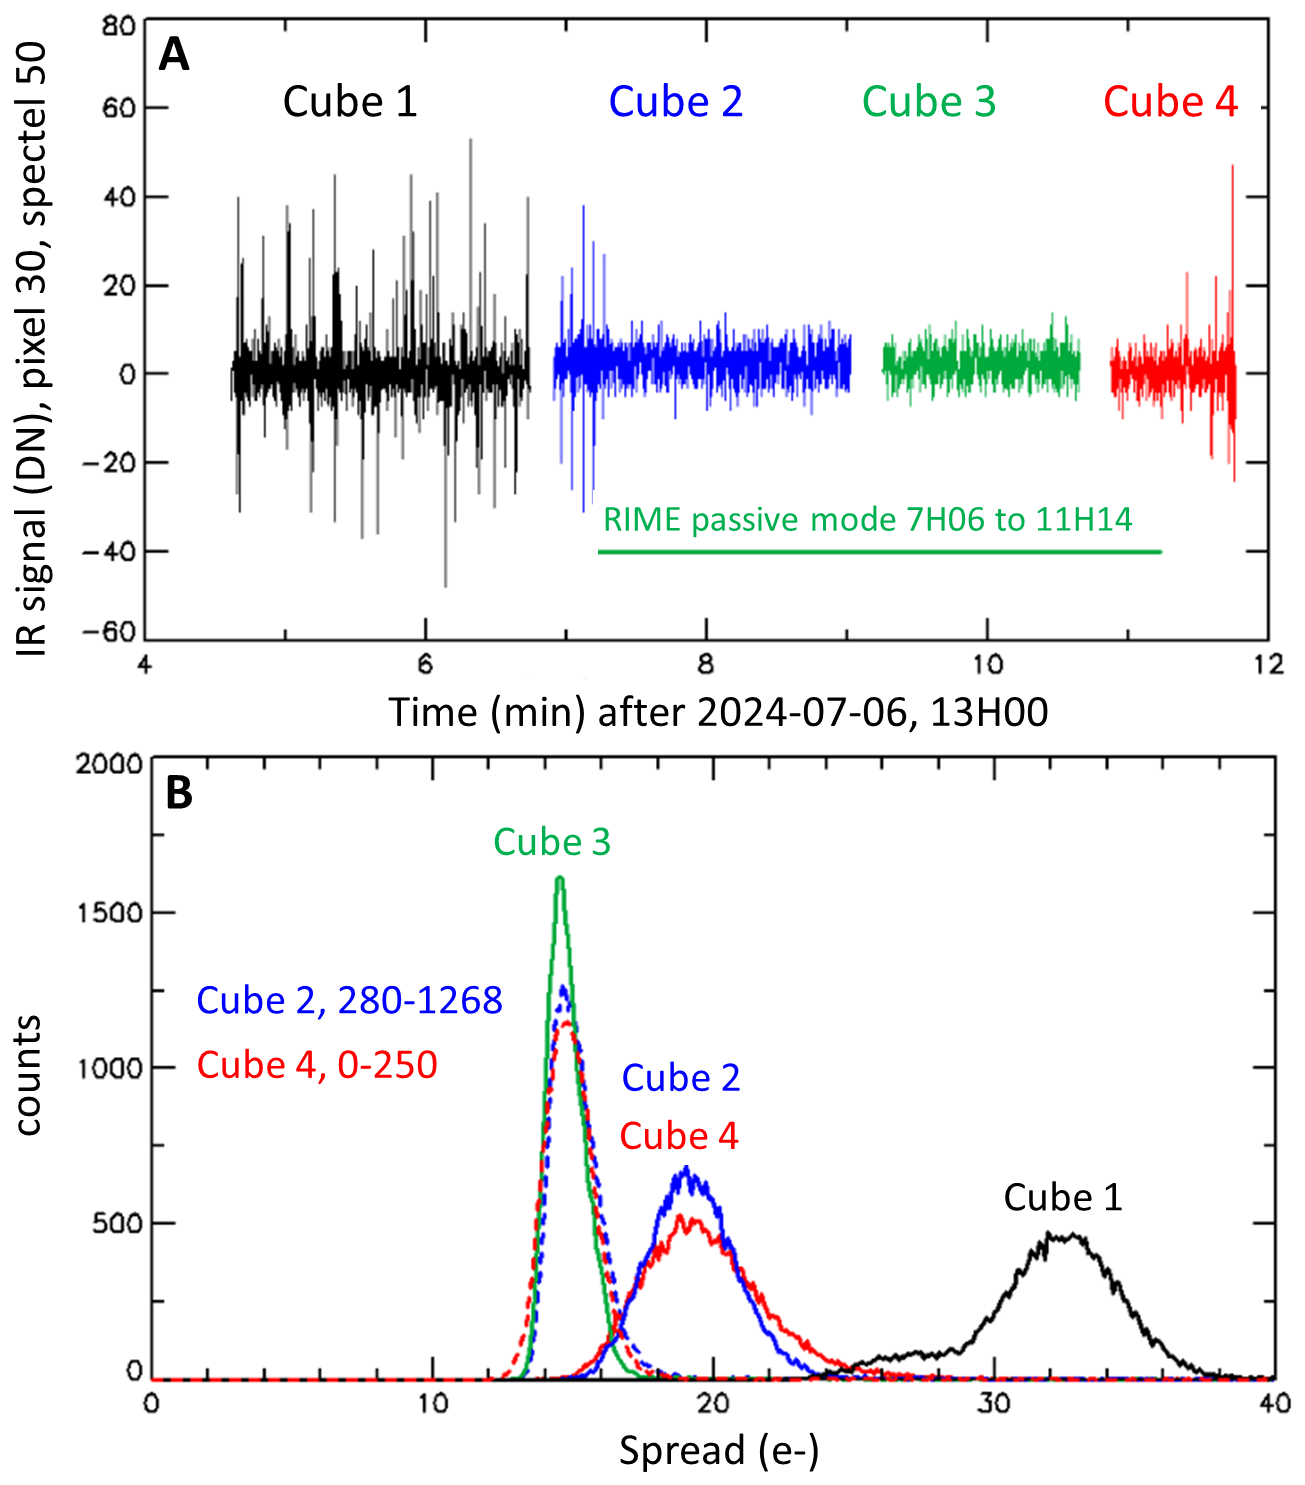
Figure 10(A) Time profile of the IR signal for a single pixel during the four cubes acquired during LGA, with the RIME passive mode time window indicated in green. (B) Noise histogram (in the absence of an external source during LGA). Cube #3, along with portions of cubes #2 and #4, exhibits a significantly lower noise level compared to the perturbed cube #1.
3.5.2 RIME interference impact during LGA
The sequence of observations run during the actual encounter was the same as during the LGA dry-run (Sect. 3.5.1): the first MAJIS observation acquired during LGA was conducted while the RIME radar was transmitting (Tx mode) and the cube consisted of 99 frames with a 70 ms integration time, covering the full field of view (Table 1). The initial frames, acquired before the spacecraft crossed the terminator, contain no scene signal. As expected, the VISNIR channel exhibited standard noise behavior, while the IR channel showed “spiky” spatial profiles, indicative of perturbations, with approximately 10 % of the samples being significantly affected (Fig. 11A). In subsequent frames acquired on the sunlit side of the Moon, where signal levels reached ∼15 000 e− ( of full well capacity), the total shot noise (∼120 e−) exceeded the interference noise (∼30–50 e−, Fig. 10). For low signals (∼250 e− per pixel18 µm), the SNR under nominal spatial and spectral binning is expected to drop from 20 to 9. However, superimposed “spikes” with amplitudes ranging from 100 to 200 e− were still present as seen on the panel (B) of Fig. 11. These spikes degraded the SNR from the nominal level to approximately 160 e−, corresponding to a loss in performance by a factor of 1.3. This confirms that even in high-signal conditions, RIME-induced interference can measurably impact MAJIS IR data quality, and emphasizes the importance of considering this effect in future science planning.
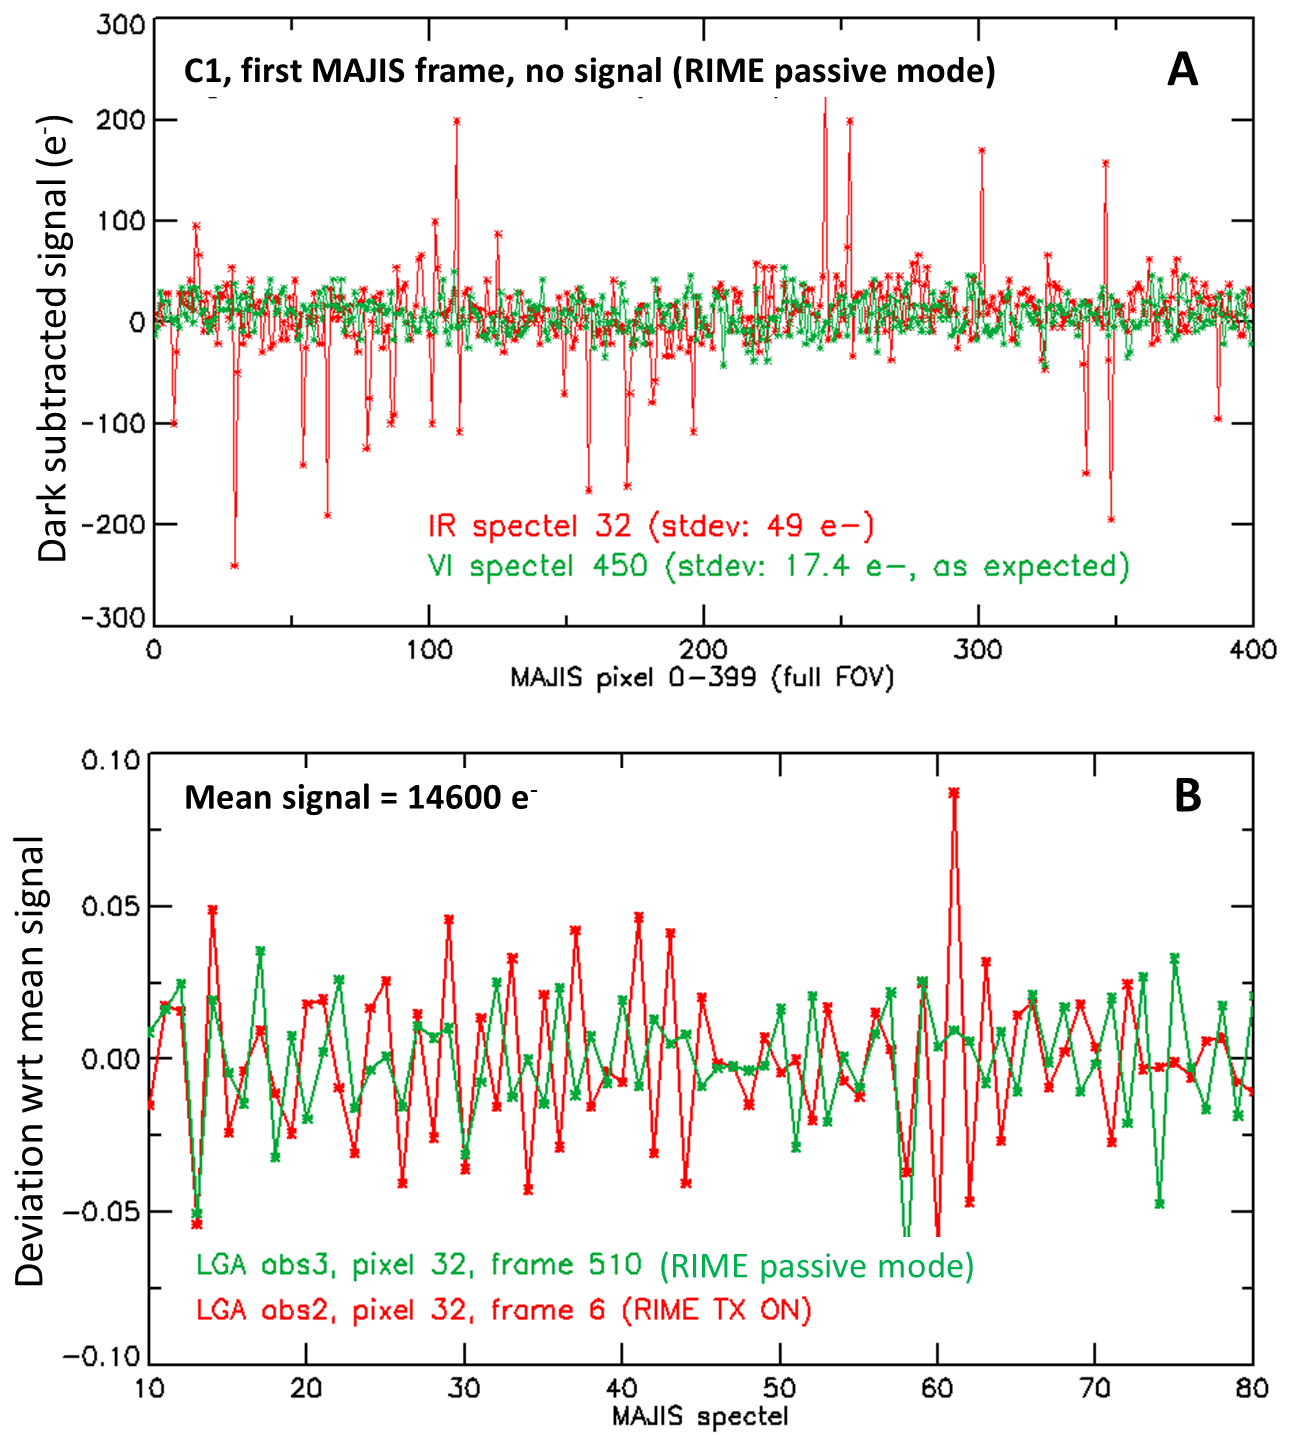
Figure 11(A) Signal of the VISNIR channel in green and IR channel in red extracted from the first frame of the C1 acquired during LGA. The noise is indicated for the 2 channels and is consistent with the previous interference tests without signal. (B) Deviation with the mean IR signal acquired with signal with RIME Tx activation (C2, red curve) and RIME on passive mode (C3, green curve).
3.6 Thermal evolution of the instrument
Several thermal sensors are available to monitor the thermal behavior of the instrument, which critically affects its performance in terms of operability and dark signal level and subtraction procedure (Langevin et al., 2024). The LGA flyby serves as a representative case of a typical satellite flyby during the nominal science phase, characterized by arrival from the nightside, a spacecraft velocity of ∼3 km s−1 (compared to ∼3.7 km s−1 for the first Europa flyby, “7E1” or 5.2 km s−1 for most of the Callisto flybys), and signal levels reaching saturation. Figure 12 shows the temperature evolution of the OH and the IR focal plane array over a few days surrounding the LEGA event. During LGA operations that lasted about 8 min, the IR FPA temperature increased from 88 to 88.7 K. Subsequently, a ∼30 K increase was observed about 1 h later (with a spacecraft being at a distance of ∼ 1000 km from the Moon at this time) due to radiator illumination by the dayside lunar disk. Using Stefan-Boltzmann's law, this heating can be extrapolated to a ∼1 K increase during 7E1, assuming subsolar temperatures of 380 K for the Moon and 160 K for Europa. While a more refined estimate will require dedicated thermal modeling, this preliminary analysis is reassuring regarding the thermal stability of the instrument during critical events such as close satellite flybys. A detailed assessment of the impact of the thermal evolution on the dark signal and instrument operability is presented in Langevin et al. (2026).
Cruise-phase temperature measurements also provide insights into the thermal conditions anticipated for the science phase. The temperatures recorded since the launch closely follow a linear trend with the solar flux scaled as 1/r², where r is the heliocentric distance. Extrapolation to Jupiter's distance by assuming the same spacecraft attitude yields temperatures of about 82 K for the IR FPA and 129 K for the OH. These values fall within the range predicted during the design phase, at the lower end for the IR FPA and the higher end for the OH (Poulet et al., 2024b).
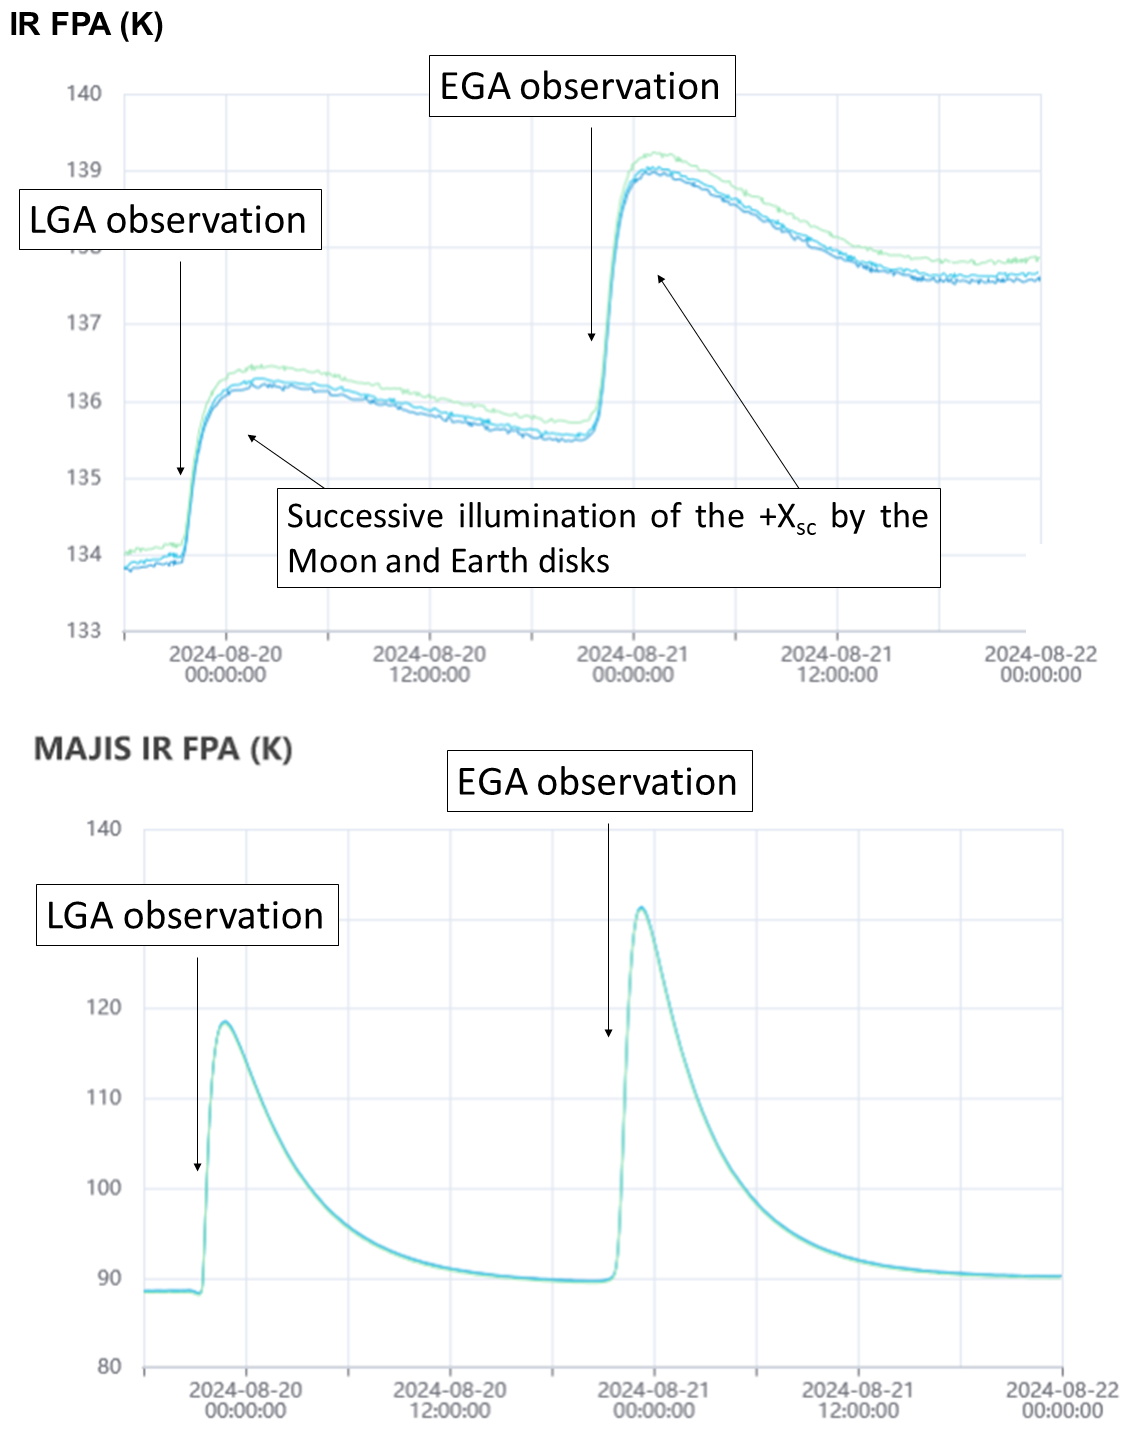
Figure 12Temperature (K) of the optical head (OH) (top) and IR FPA (bottom) around the time of the LEGA encounter. Key events (including the LGA and EGA phases, as well as the illumination of the MAJIS radiators (+Xsc) by the lunar and Earth disks) are indicated by arrows.
4.1 Main observables
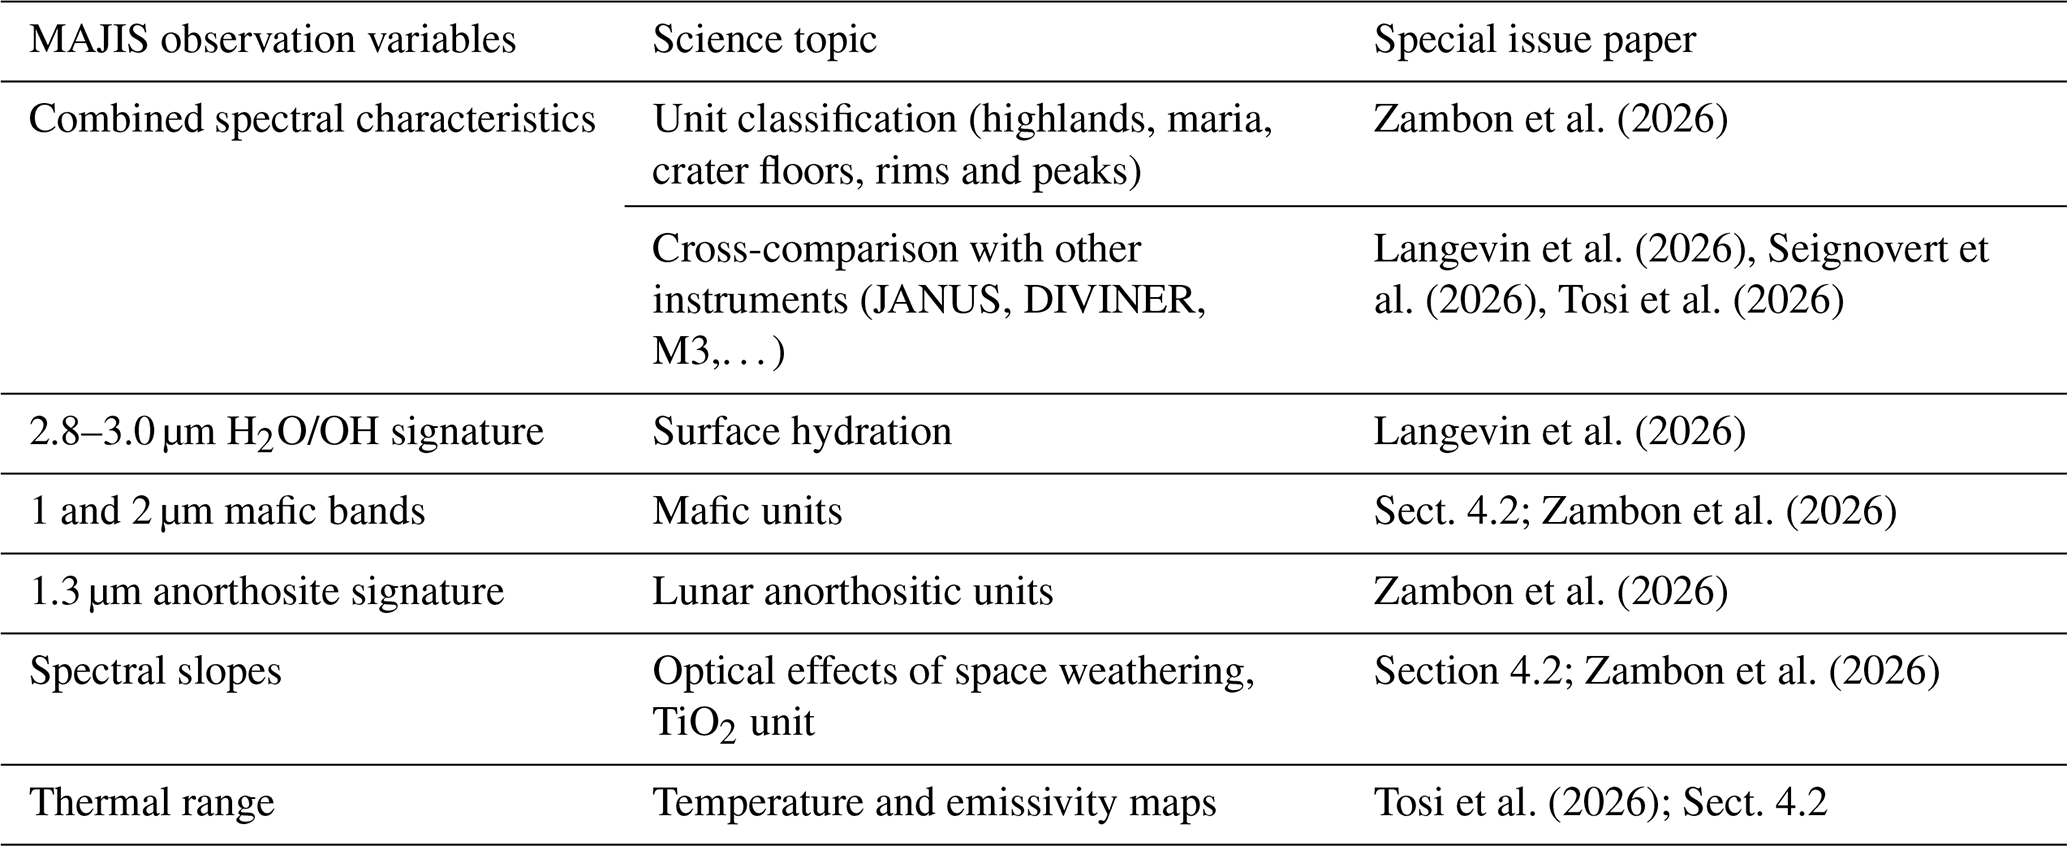
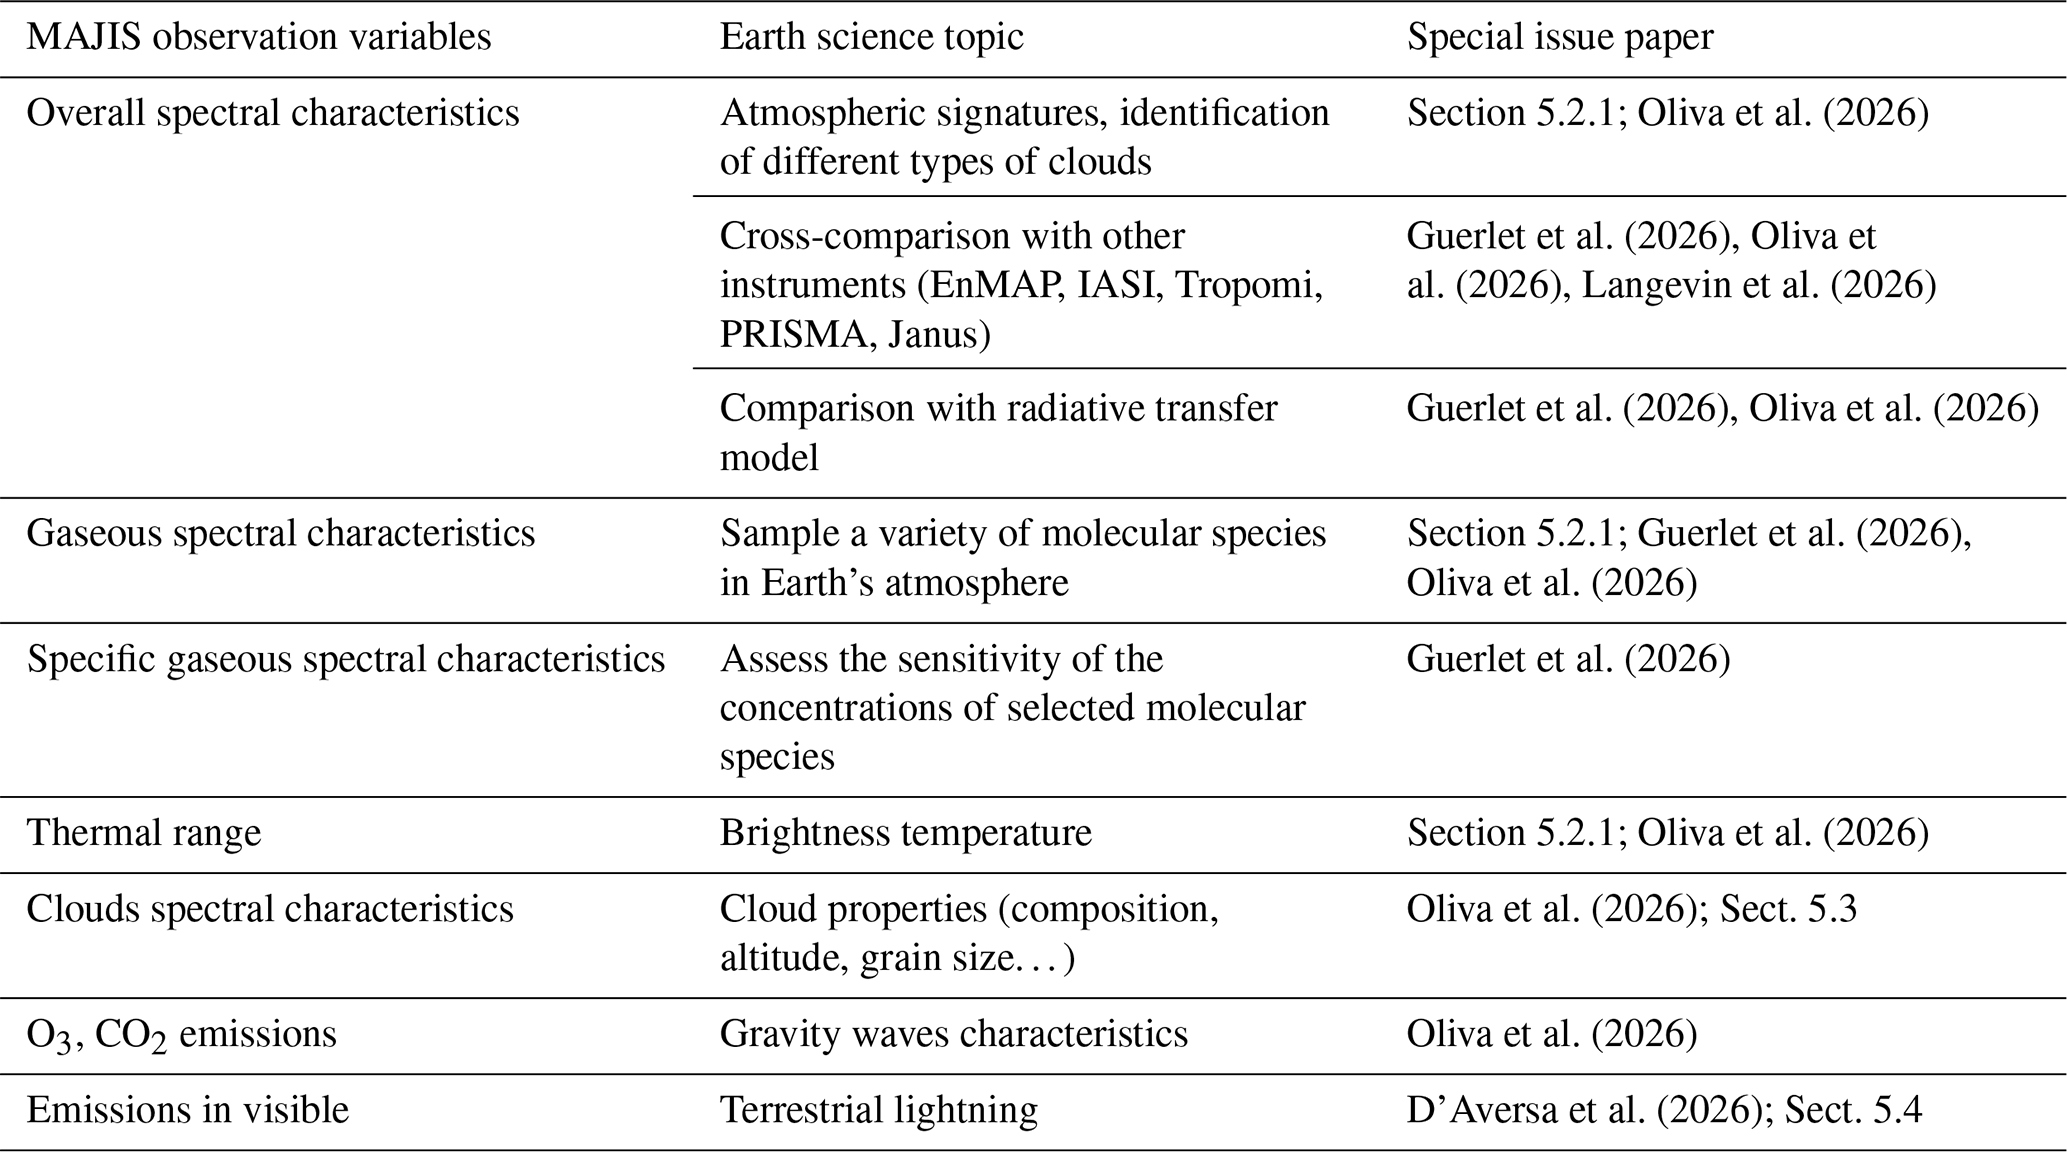
Previous lunar hyperspectral observations by Cassini (Bellucci et al., 2002) and Juno (Adriani et al., 2016) provided valuable VISNIR spectral data but were limited by coarse spatial resolutions that restricted detailed mapping. The Moon Mineralogy Mapper (M3) on Chandrayaan-1 (Pieters et al., 2009) provided the most impressive near-global mineral mapping at ∼140 m per pixel but covered only wavelengths <3 µm. MAJIS mitigates these limitations by providing sub-kilometer-scale hyperspectral reflectance and thermal imaging capabilities, thereby addressing an observational gap. Table 3 summarizes the key metrics that can be derived from MAJIS data, their relevance to calibration and lunar science objectives, and the corresponding publications within the ANGEO special issue.
In the VISNIR range, MAJIS measurements capture common diagnostic absorption features near 1, 1.25, and 2 µm, attributable to the presence of olivine, low- and high-calcium pyroxenes, anorthosite, arising from both electronic and vibrational transitions. These absorption bands form as solar radiation interacts with multiple randomly oriented mineral grains within the uppermost mm of the regolith, producing reflectance spectra that integrate signals from all surface particles. As lunar soils mature under space weathering, individual grains develop silicate glass coatings enriched in nanophase metallic iron (npFe°), which significantly darkens the soils and reduces the depth of absorption features, particularly in FeO-rich mare regions (e.g., Noble et al., 2007). Spectral indicators such as band depths and continuum slopes can thus be used to assess soil maturity. Another distinctive phase can be observed in the VISNIR range (Mustard et al., 2011). It is characterized by a generally featureless continuum, except for a prominent reflectance maximum near 0.75 µm. In addition, it displays a broad, poorly defined absorption band near 1 µm and a very weak feature near 2 µm. These signatures are typical of that expected for synthetic glasses as well as some lunar pyroclastic glasses (Tompkins and Pieters, 2010). Finally, the 3 µm spectral region enables the detection of hydration features due to hydroxyl (OH) and water (H2O) molecules (Pieters et al., 2009). As indicated in Sect. 2.3, the lunar flyby was restricted to equatorial latitudes, where surface hydration is known to be the lowest or nearly absent (Li and Milliken, 2016). A detailed analysis of the mineralogical indicators corresponding to the spectral features discussed above is provided in the companion paper by Zambon et al. (2026), while Langevin et al. (2026) examines the detection limits for hydration features, leveraging the high signal-to-noise ratio of the MAJIS data.
Lunar spectra acquired by MAJIS are influenced by thermally emitted radiation beyond 2 µm. Sun visibility and scattering geometry due to topography determine the observed surface temperature. The challenge of quantifying and removing the thermal contribution complicates the identification of spectral features in the shorter wavelength range. The importance of thermal emission has been previously recognized in M3 data (e.g. Li and Milliken, 2016), where initial corrections relied on empirical approaches due to the absence of independent surface temperature measurements acquired at the same local time. Despite its limited spatial coverage, MAJIS data offer the opportunity to investigate thermal emission across a wide range of local times, allowing for an assessment of the accuracy of temperature retrievals and thermal correction methods. An additional outcome of this analysis is the derivation of surface emissivity. Tosi et al. (2026) present a comparison of three methods for extracting surface temperature, and explore the sensitivity of both emissivity and thermally corrected spectra to the adopted retrieval approach.
Table 3MAJIS metrics and the related topics that are addressed in the series of papers from the LGA dataset.
4.2 Selected spectral observations
We refer the reader to the MAJIS papers in this special issue for detailed analyses of the LGA dataset. Below, we present a few representative results that illustrate the instrument's ability to retrieve valuable spectral properties of the lunar surface despite not being specifically designed for this purpose.
The recorded signal ranges from noise levels (as observed in the first lines of C1, where no illumination is present) to saturated values in some spectels, particularly in the IR, due to thermal emission. This variability is driven by the Sun's illumination path being nearly orthogonal to the instrument's pointing direction. The area imaged by MAJIS includes a variety of distinct spectral units, enabling the identification of diverse surface compositions. Figure 13 presents four examples of VISNIR spectral diversity identified in LGA C4. The spectra on the top panel compare fresh materials from both mare and highland regions with those of more mature soils. All reflectance spectra exhibit a characteristic 1 µm absorption band associated with Fe2+ in pyroxene and/or olivine, along with a generally red spectral slope, which is more pronounced in mature terrains as expected (Taylor et al., 2001). The middle panel shows that the normalized highland mature spectrum is characterized by weaker or absent 1 µm absorption features and steeper red continuum slopes compared to the mature spectrum from Mare Tranquillitatis. This trend is observed throughout the entire scene (Zambon et al., 2026). The normalized spectrum extracted from a fresh mare crater (black curve) shows the deepest 1 µm mafic absorption. Although these features are visible in the raw reflectance spectra, residual calibration artifacts can introduce systematic errors, which are reduced through spectral ratioing. In this approach, the spectrum from a specific region of interest is divided by the scene-averaged spectrum, enhancing absorption features diagnostic of mineralogy and maturity (Fig. 13, bottom). The near-zero slope in spectra of mature areas reflects the dominance of these terrains within the scene. The slight blue slope observed in the spectrum of the fresh mare crater is interpreted as an indication of immaturity, consistent with the reduced reddening typically seen in less weathered materials. Notably, the red slope observed in the short-wavelength region (<1 µm) of the fresh mare material (green curve) is interpreted as a signature of TiO2 depletion; lower titanium content is known to increase the spectral reddening in this short wavelength range when mixed with pyroxene (Robertson et al., 2022). The 2 µm pyroxene band is barely discernible in the spectrum of selected fresh zones, especially in the black spectrum of the fresh Mare crater. A more in-depth analysis of this band is carried out in Zambon et al. (2026). Overall, the spectral impact of soil maturity, associated with the accumulation of submicroscopic iron in agglutinates and glassy coatings formed through micrometeorite bombardment and solar wind sputtering is clearly expressed through general darkening (especially in the highlands), attenuation of absorption features, and steeper positive spectral slopes.
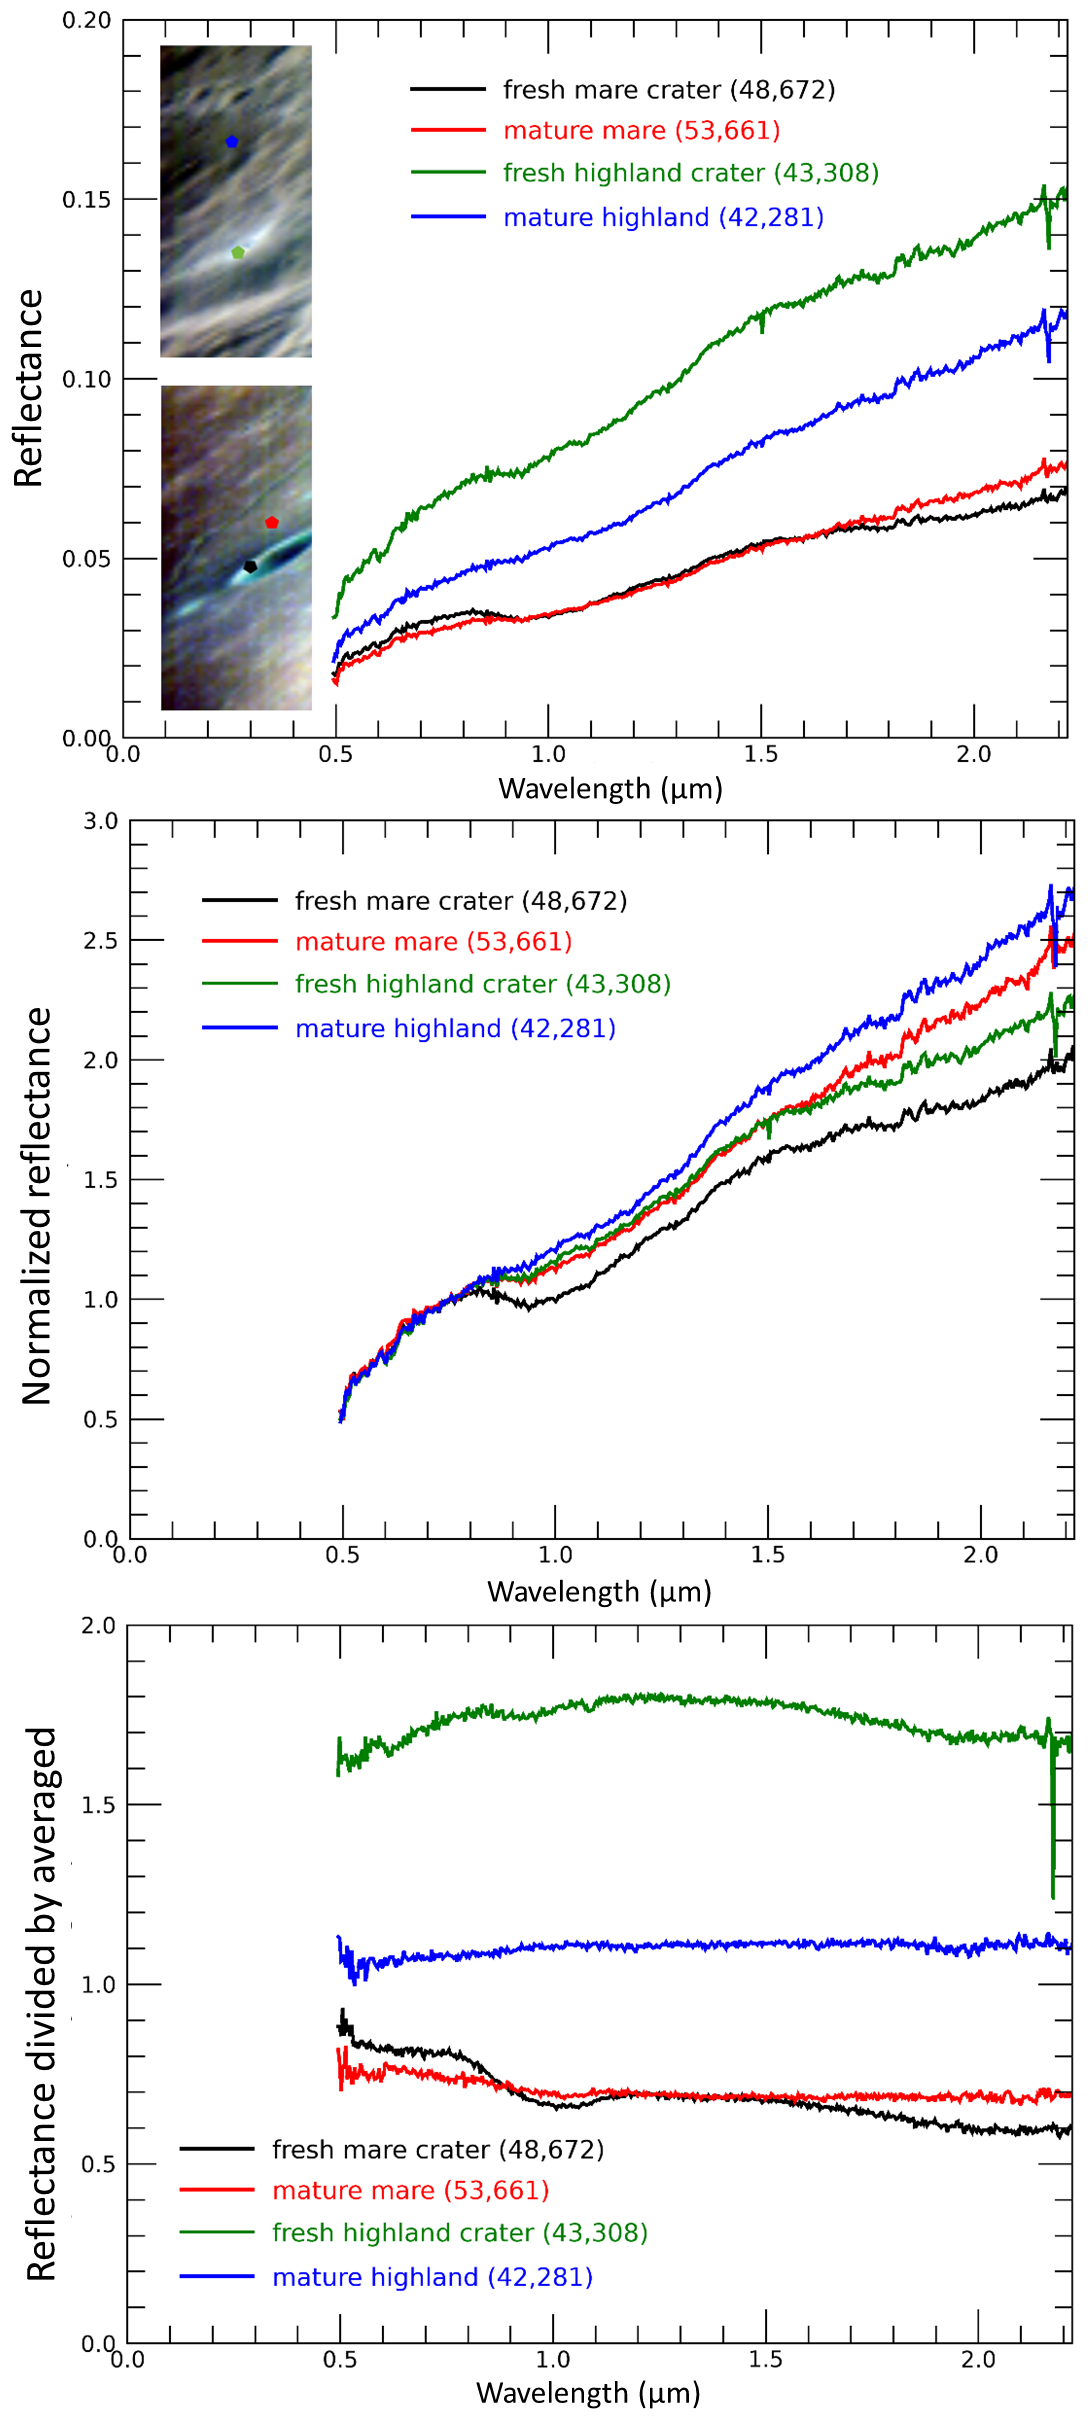
Figure 13Top: Spectra extracted from highland (green and blue spectra, upper insets) and Mare (black and red spectra, lower insets) areas. The insets correspond to an RGB composite of LGA C4 with R = 0.950 µm, G = 0.750 µm, B = 0.540 µm, displayed with a gaussian stretch. Spectra are binned by 3×3 to increase the ratio. Middle: Same spectra normalized at 0.75 µm. Bottom: Same spectra ratioed by the average spectrum of the cube.
Daytime surface temperatures were estimated from three temperature retrieval methods (Tosi et al., 2026). The first approach (referred to as Method 1) is based on Kirchhoff's law, in which the thermal emission component in the MAJIS spectra of the Moon is modeled using a Planck function to fit the measured radiance spectrum. Two free parameters (surface temperature and emissivity) are allowed to vary within predefined ranges and within the bounds of in-flight instrumental noise, until convergence is achieved using a Bayesian algorithm (Adriani et al., 2016; Tosi et al., 2014, 2026). A second empirical method of thermal correction (Method 2) is also examined, in which the fraction of incident solar flux F reflected by the surface (hereafter I/F) values at 1.55 µm were fitted using a correlation of reflectance at 1.55 and 2.54 µm observed in laboratory reflectance spectra of Apollo and Luna soil and glass-rich samples to predict I/F values at a wavelength of 2.54 µm (Li and Milliken, 2016). Observed I/F values exceeding this predicted value are attributed to thermal emission. This empirical method shows limitations at high incidence angles, where the laboratory-based correlation does not hold. A third approach builds upon the roughness-informed model introduced by Wohlfarth et al. (2023), originally developed to improve our understanding of the lunar diurnal water cycle based on M3 observations. Finally, the three retrieval methods are compared against simulations from a thermal model developed by Vasavada et al. (1999).
A few examples of best-fit results from two retrieval methods (1 and 2) are here shown in Fig. 14. Temperatures derived using Method 1 are consistently lower than those obtained with Method 2. A sensitivity analysis was conducted to assess the impact of uncertainties in the absolute radiometric calibration of the MAJIS radiance data. The propagation of this uncertainty into the temperature retrieval can lead to deviations of up to several K. A comprehensive analysis of the thermal analysis is presented in Tosi et al. (2026). A comparison with the Diviner Lunar Radiometer Experiment aboard NASA's Lunar Reconnaissance Orbiter (LRO) (Paige et al., 2010) was also successfully performed. Overall, the lunar surface temperatures observed by MAJIS, as derived from three independent model derivations, are found to be first order self-consistent and in agreement within ±10 K with temperatures measured by Diviner and the Vasavada thermal model as a function of solar incidence.
Temperatures derived from MAJIS wavelengths are expected to be more sensitive to the hotter surface components compared to those retrieved from longer wavelengths, due to surface roughness effects, particularly at high incidence angles (Bandfield et al., 2015). At sub-millimeter, millimeter, and longer wavelengths, absorption losses are reduced, allowing subsurface layers to contribute significantly to the observed thermal emission. Complementary temperature measurements were obtained by the SWI instrument, which operated at 250 and 500 µm during the lunar flyby. The SWI ground track intersected MAJIS C4 at three locations. As expected, SWI-derived temperatures are lower by a few tens of K, consistent with a stronger contribution from cooler subsurface layers (P. Hartogh et al., private communication, 2025).
Eventually, one major by-product of the MAJIS temperature retrieval is the emissivity. The analysis of this metrics, also presented in the companion paper of Tosi et al. (2026), reveals a clear dichotomy between basaltic maria and feldspathic highlands, with higher emissivity in the former and lower values in the latter.
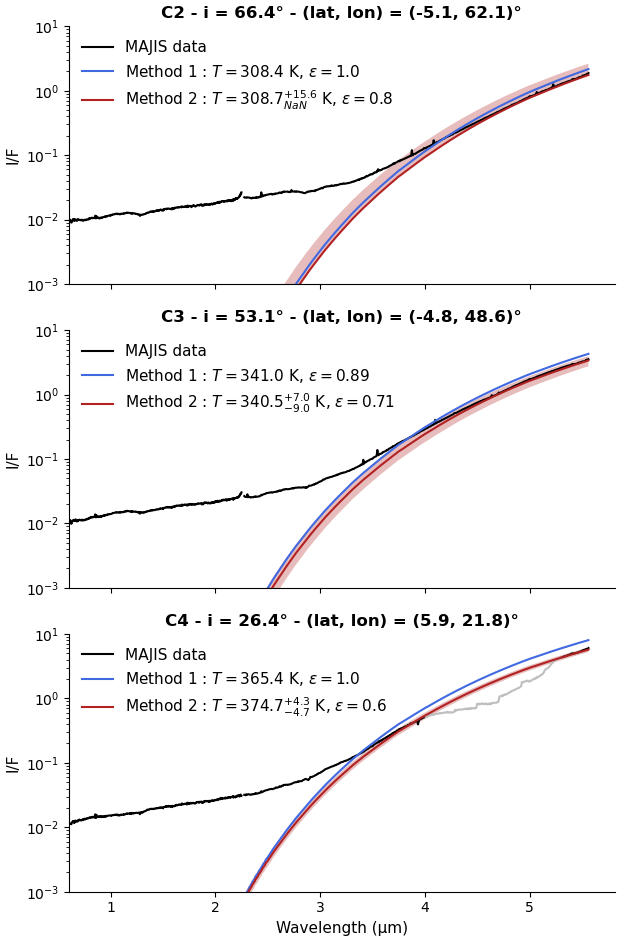
Figure 14Spectra (black curves) extracted from LGA C2 (top panel), C3 (middle) and C4 (bottom). The red and blue lines represent the best-fit Planck functions simulating the thermal contribution, derived from the two methods described in the text and in Tosi et al. (2026). The uncertainty in temperature retrieval due to the instrument's absolute radiometric calibration (assumed to be 10 %) is shown as a pink envelope around the red curve.
5.1 Main observables
Given the wealth of the Earth dataset and near-coincident measurements by Earth-observing satellites, additional results along with more detailed retrieval of the key parameters and their contextualization for Jupiter and satellite science are described in a series of papers (Table 4). In the following sections, we present a few examples illustrating how different components of the Earth's atmosphere are manifested in the MAJIS spectra, highlighting the capabilities of the instrument: gaseous absorption and thermal profiles in Sect. 5.2, cloud phase and cloud-top properties in Sect. 5.3, and the first space-based spectroscopic detection of terrestrial lightning in Sect. 5.4. Note that some science topics are discussed in greater detail than others because they are not covered in the associated companion papers, whereas results such as lightning observations are described more concisely here and expanded upon elsewhere
5.2 Atmospheric gas properties
5.2.1 Gaseous species and thermal structure
A representative MAJIS spectrum, highlighting various molecular absorption features, is shown in Fig. 15. The average visible albedo over the ocean basins varies between approximately 10 % and 20 %, markedly lower than that of cloud regions. This value is roughly consistent with near-simultaneous observations acquired by other instruments (Langevin et al., 2026). The ocean surface albedo is actually highly variable and is sensitive to several physical parameters: solar zenith angle, wind speed, transmission by atmospheric cloud/aerosol, and ocean chlorophyll concentration. (e.g., Jin et al., 2004; Wei et al., 2021). We therefore attribute the variation in albedo of the cloud-free ocean to the possible presence of aerosols (maritime or thin hazes) and/or the “glint spot” (with an extent depending on the wave patterns) that could enhance the apparent ocean reflectance.
Spectral analysis reveals the presence of several gaseous species, including H2O (at 0.720, 0.820, 0.950, 1.150, 1.400 and 2 µm in the VISNIR channel plus several H2O absorption bands in the IR channel), CO2 (1.570, 2.003, 2.055, 2.690, 2.770 and 4.300 µm), O2 (0.690, 0.760 and 1.270 µm), CH4 (3.320 µm), CO (4.610 and 4.720 µm branches), O3 (0.55–0.65 µm, 3.275 and 4.710 µm) and N2O (3.880, 3.940, and 4.519 µm) (Fig. 15). These molecules, with the exception of H2O, O3 and N2O, have an almost constant vertical mixing ratio abundance as shown in Efremenko and Kokhanovsky (2021). Ozone is produced mainly in the stratosphere while water vapor prevails in the troposphere dominated by the water cycle. Despite the uniform vertical distribution, these molecules may exhibit a strong dependence of their weighting functions versus wavelengths, peaking the remote sensing sensitivity to specific altitudes at fixed wavenumbers or wavelengths. This is, for example, true for CO2 in its ν3 fundamental band around 4.3 µm, as shown in Fig. 16. It is often convenient to use the brightness temperature instead of radiance, thanks to the relevant information that it provides about the atmospheric thermal structure. In most of the cases, this metric at each wavelength provides an equivalent temperature which can be directly compared with the atmospheric temperature profile, providing a simple method to determine the altitude probed at a given wavelength. This is shown in Fig. 17, where three MAJIS spectra (in the center panel) are extracted from three different regions in the image shown in the right panel. The red, blue, and green spectra are taken from an average of 32 pixels around the three circles of the figure, with corresponding colors. The emission within the wings of the CO2 band (highlighted in cyan color) is coming from regions in the troposphere where the temperature is higher and the atmosphere above is more transparent. This is visible on the left and right edges of the band close to 4.0 and 4.6 µm. Here the cloudless atmosphere is nearly transparent, and consequently, the spectra correspond to the blackbody emission close to the surface. However, when the clouds are thick, the probed altitude is limited by the cloud tops, and the brightness temperature follows their altitude profile resulting in a lower brightness temperature (red and blue spectra on Fig. 17).
The minima in brightness temperature within the CO2 band close to 4.2 and 4.3 µm probe near the tropopause, while in the center of the band where the opacity is strong, the probed region lies higher, spanning a wide altitude range in the stratosphere from about 15 to 30 km altitude. This is where the band appears to be in emission, a typical case for an absorbing gas in a thermal inversion region such as the stratosphere case, where the atmosphere is radiatively warmed due to absorption by ozone. For the same reason a similar emission is visible for the O3 band at about 4.7 µm (highlighted in violet color in Fig. 17). The complex structure visible on the right side of the spectral range from 4.9 to 5.5 µm (highlighted in yellow color in Fig. 17) is due to the many absorption lines of water vapor.
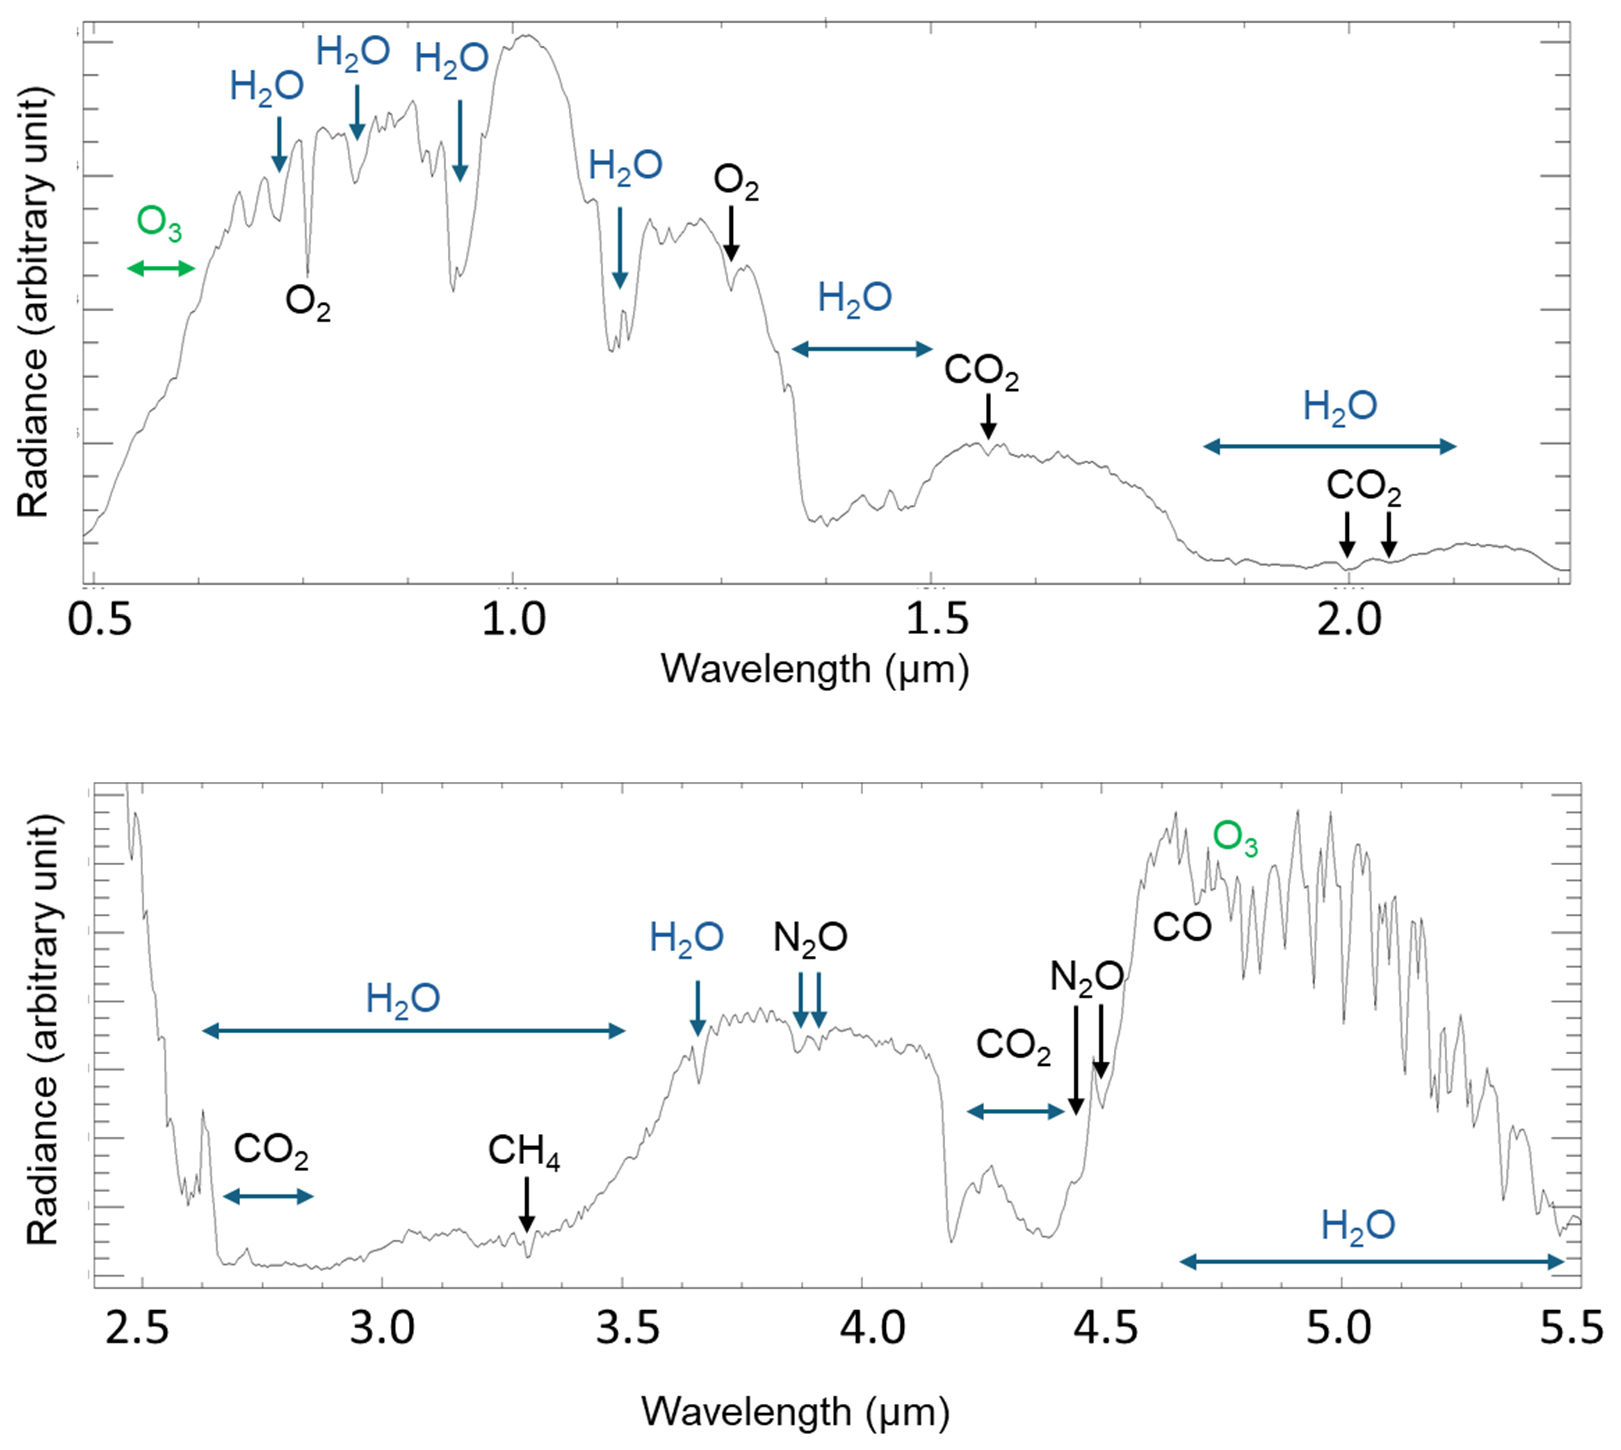
Figure 15Example of a typical terrestrial atmospheric spectrum acquired by MAJIS. Top: VISNIR channel spectrum, showing reflected solar radiation. Bottom: IR channel spectrum, dominated by thermal emission. Only the main molecular absorption features are indicated.
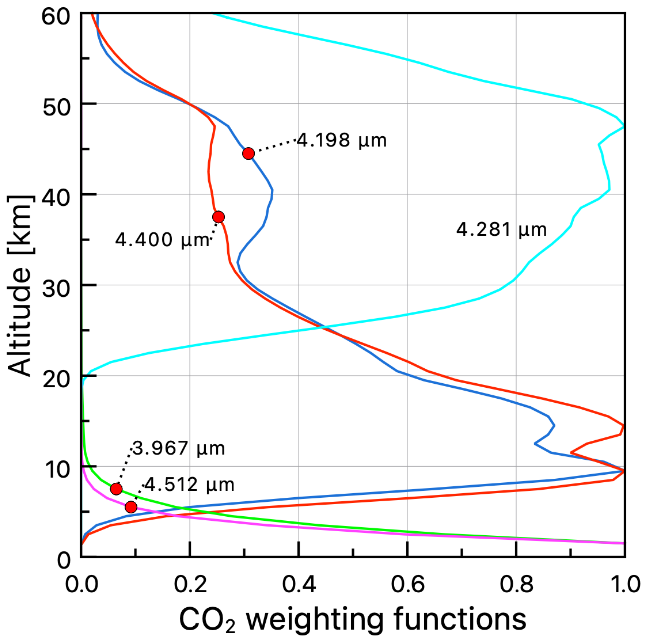
Figure 16CO2 weighting functions for the ν3 fundamental band around 4.3 µm, calculated using the thermal profile from Efremenko and Kokhanovsky (2021). The violet and green curves probe very low altitudes (below ∼5 km), close to the surface. The red and blue curves are mainly sensitive to intermediate altitudes in the middle and upper stratosphere (∼30–45 km), while the cyan curve probes higher altitudes in the upper stratosphere (∼50 km).
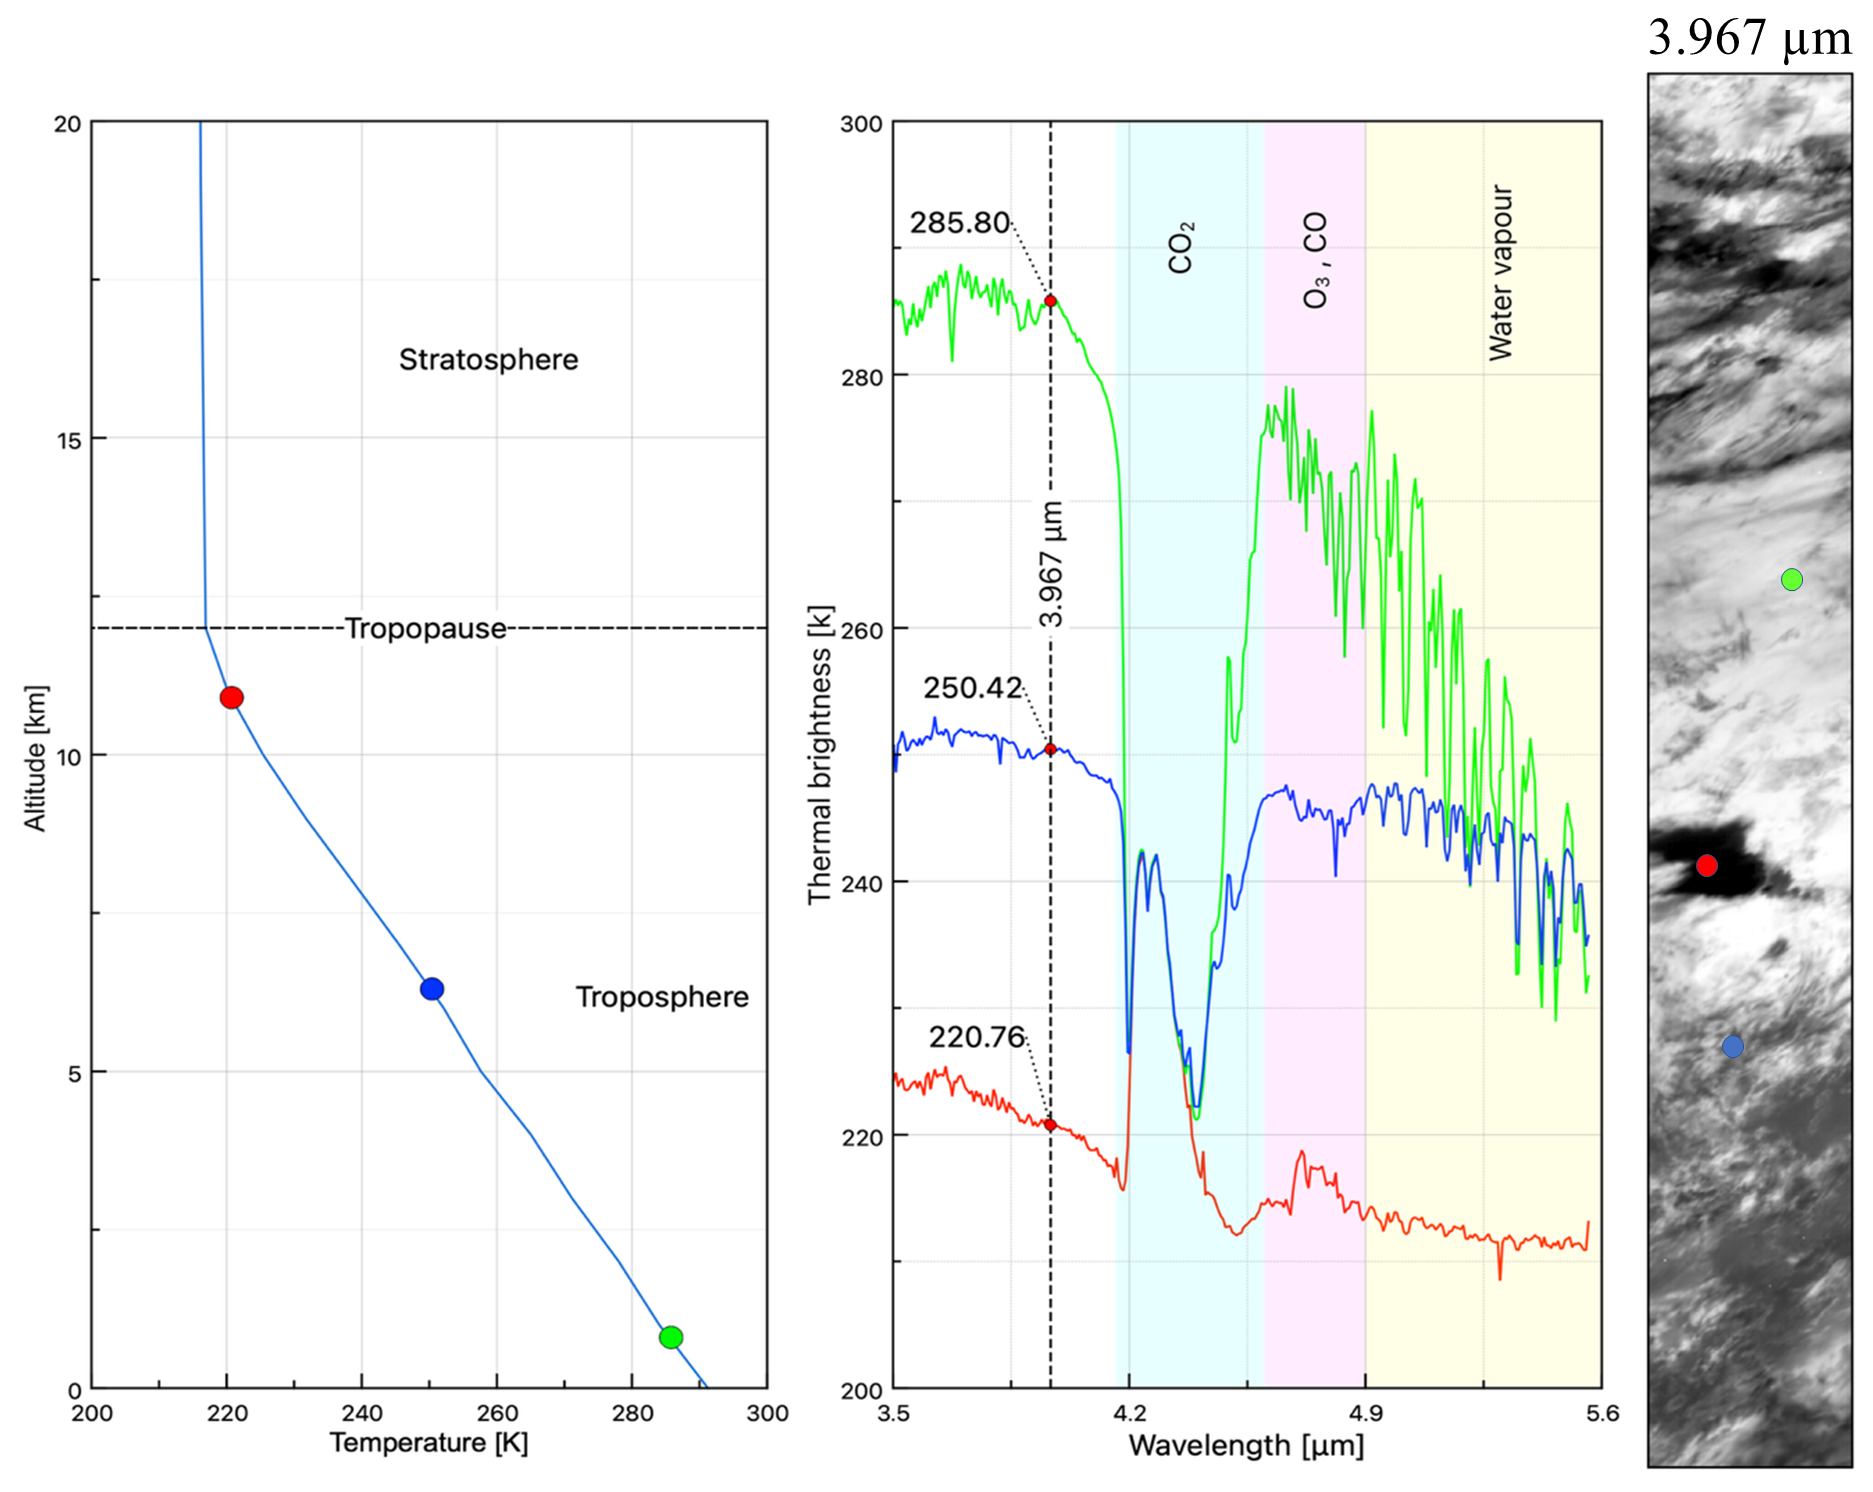
Figure 17Left panel: Temperature profile with three values of the thermal brightness extracted from spectra shown in the middle panel. Middle panel: MAJIS spectra provided as an example of probing different altitudes with different characteristics from the cube C1. The red, blue, and green spectra are extracted from an average of 32 pixels around the corresponding circles of the same color in the scene shown on the right panel. Regions where the main molecules absorb are shown in light colors. The vertical dashed line is the wavelength where a cloudless atmosphere is almost transparent, probing near the ground (Fig. 16). In this case the thermal brightness contains the cloud top temperature information, and it is correlated with the cloud top altitude. Right panel: The image of the scene at 3.967 µm is presented, with the locations of the three spectra indicated as colored dots.
If we pick up a wavelength where the cloudless atmosphere is almost transparent (Oliva et al., 2026), the corresponding thermal brightness (TB) provides an estimate of the cloud top temperature, corresponding to an altitude where the optical depth is close to unity. In this example, we considered a MAJIS wavelength of 3.967 µm for this scope, shown as a dashed vertical line in the center panel. The CO2 weighting function at this wavelength also probes very close to ground, as it is shown in Fig. 17 (green plot). It can be seen that the brightness temperature in this wavelength is very different for the three spectra, spanning from 220 to 286 K, which makes it possible to identify three regions of different cloud top altitudes in the troposphere. For all three points, there is a marked decrease in water vapor lines between the green spectrum (closest to the ground) and the red spectrum (highest in the troposphere). In particular, the red spectrum shows very limited amount of water vapor, a manifestation of the very dry conditions in the air column from the tropopause to the upper atmosphere of Earth.
This is best illustrated in Fig. 18, where a scatter plot of the relative abundance of water vapor estimated from the line at 5.054 µm is compared to the TB at 3.967 µm, representative of the cloud top altitude. The plot shows a good linear correlation between water vapor abundance and thermal brightness (altitude) in the troposphere, with a maximum near ground level, while it becomes constant and close to 0 above 240 K, which corresponds to an altitude of about 8 km (Fig. 17). From the typical values of ΔTB (∼20 K near the surface and ∼5 K at TB ∼260 K), the water vapor abundance is estimated to be roughly four times higher near the surface than at 8 km. This variability is qualitatively consistent with vertical mixing ratio of H2O (Efremenko and Kokhanovsky, 2021). However, the vertical humidity gradient can vary strongly with weather conditions, so that part of the retrieved trend and the inferred surface-to-altitude ratio may reflect atmospheric variability rather than a fixed vertical profile.
Another important absorption feature is centered at 0.76 µm and it is attributed to molecular oxygen. This transition is spin-forbidden, and the strength of the band suggests a significant abundance of O2 in the observed atmosphere. The terrestrial vertical abundance distribution of O2 is quite constant (Efremenko and Kokhanovsky, 2021), so that the depth of this band is also a good proxy of the cloud top altitude, where most of the reflected sunlight comes from. Results of the analysis of this band are presented in Oliva et al. (2026), which also show that the altitude derived from the O2 feature is quite consistent with the top altitude retrieved from other metrics.
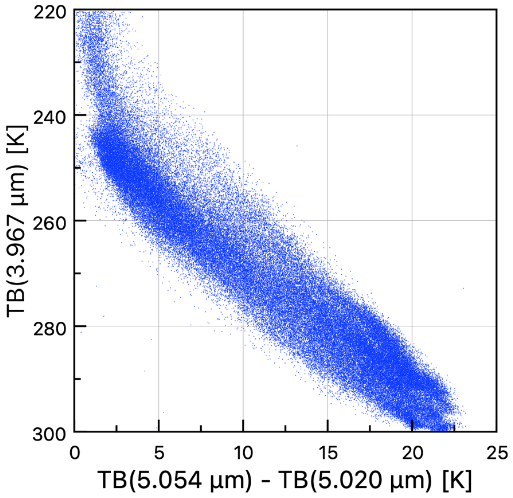
Figure 18Scatter plot showing the relation between ΔTB and TB at 3.967 µm, extracted where the atmosphere is cloudless and nearly transparent. ΔTB = TB(5.054 µm) − TB(5.020 µm) corresponds to the difference in thermal brightness between a water absorption line and a nearby continuum wavelength.
5.2.2 Spectral identification in the context of ESA/Ariel mission
The ultimate objective of exoplanet remote sensing is the detection of atmospheric biosignatures (Rugheimer et al., 2013). A necessary, though not sufficient, condition for the presence of life is a significant departure from thermodynamic equilibrium. Atmospheric biosignatures are chemical species found in an atmosphere that are out of chemical equilibrium and are produced as byproducts of biological activity. In this context, the MAJIS instrument provides spectral coverage between 0.5 and 5.5 µm well suited to detecting key molecular absorption features, thereby enabling the identification of potential atmospheric biosignatures. This spectral capability closely aligns with the objectives of the upcoming Ariel mission, which aims to perform large-scale transit spectroscopic surveys of exoplanetary atmospheres to characterize their chemical composition and potential habitability (Tinetti et al., 2018). Below, we thus focus on the identification of spectral features associated with chemical species indicative of habitability on exoplanets, illustrating how such observations could support the scientific goals of Ariel.
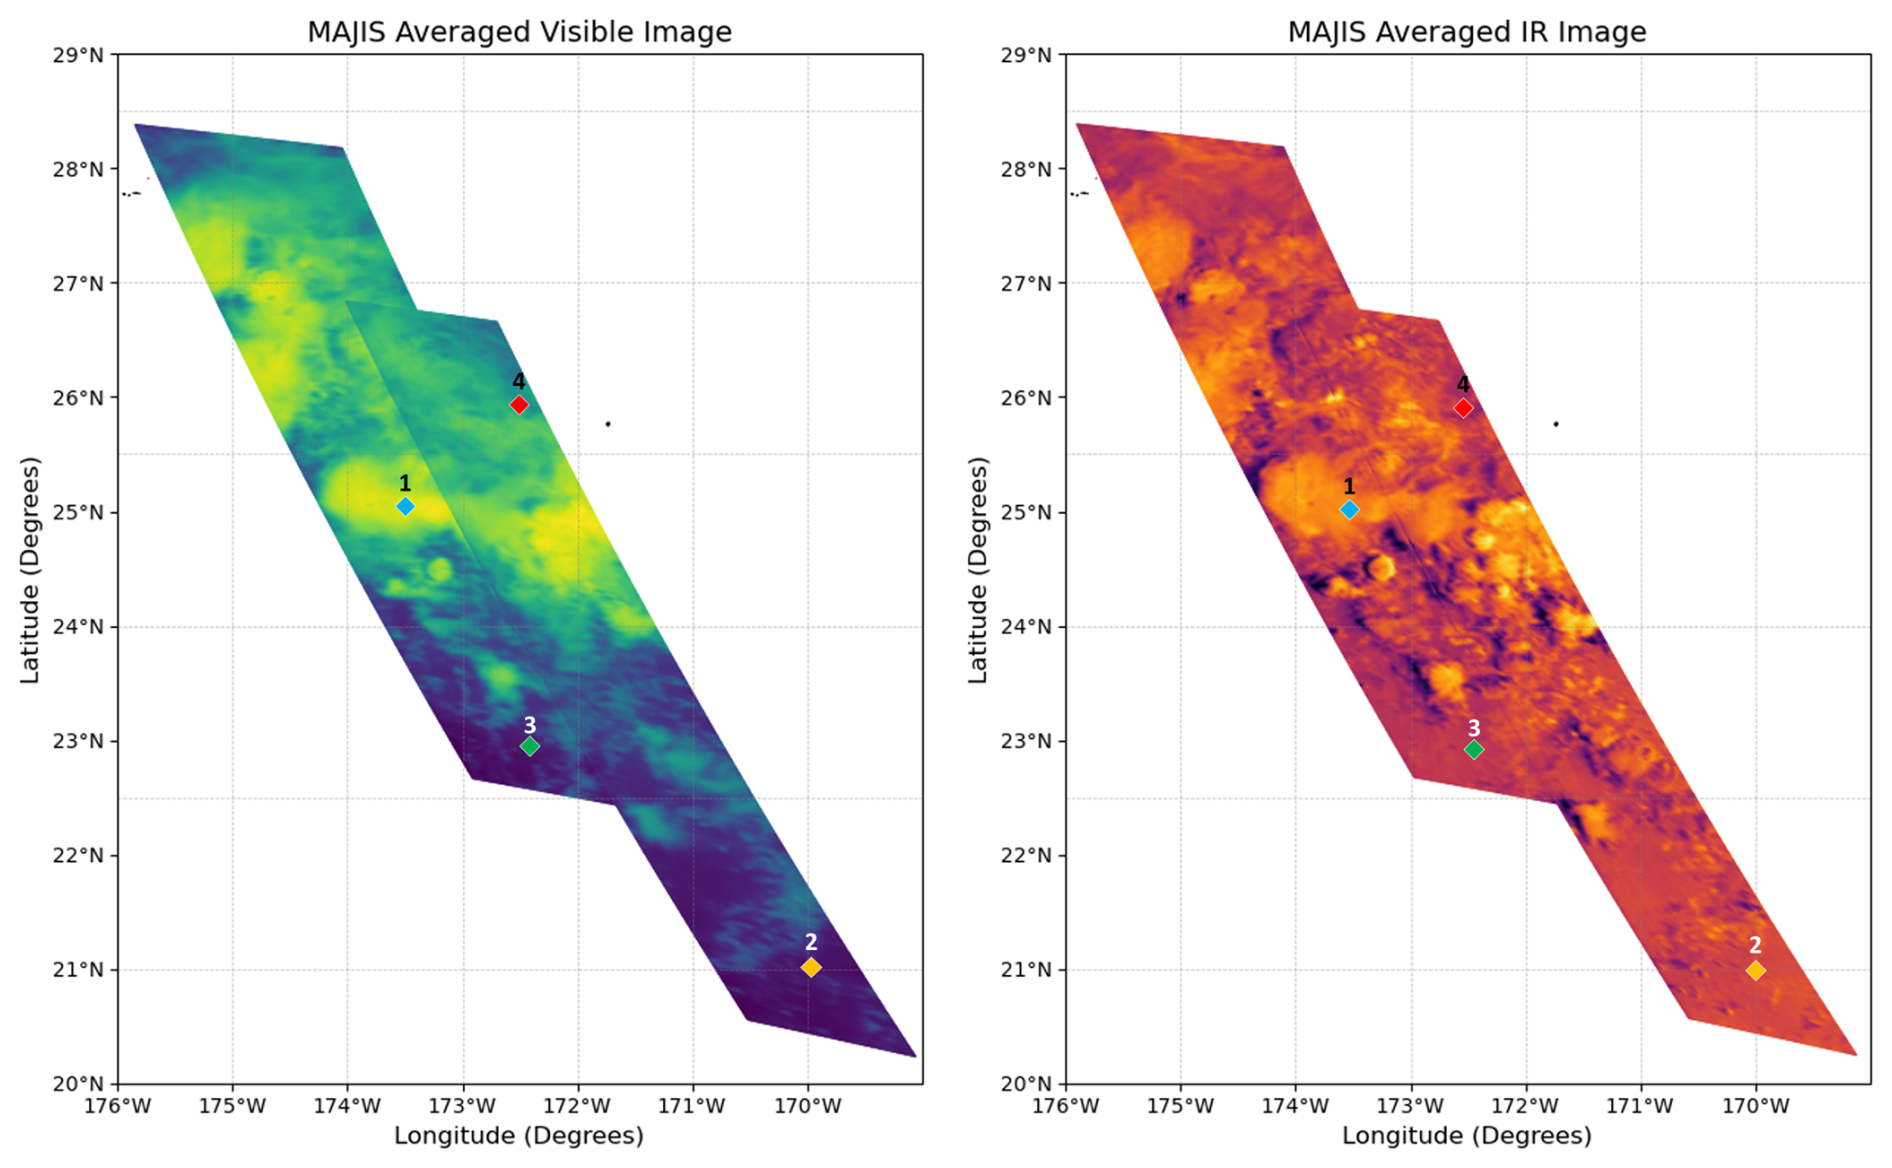
Figure 19Combined view of the pair of overlapping MAJIS cubes near 173° W, just west of the Hawaiian Islands over the Pacific Ocean. These reflectance maps have been created by averaging over all unsaturated wavelengths in the visible (left) and infrared (right) channels. Location of the four representative spectra shown on Fig. 21 are indicated.
As presented previously, distinct water vapor bands are detected, highlighting the presence of water vapor, an essential component for habitability and biospheric stability (Kaltenegger and Traub, 2009; Meadows, 2017). Strong CO2 bands are observed around 4.3 µm, typical of a carbon-bearing atmosphere (Traub and Jucks, 2002). A pronounced feature near 3.3 µm indicates the presence of CH4, while weaker structures between 4.6 and 4.8 µm are consistent with CO and O3 absorption. The simultaneous detection of CH4 and CO2 in significant amounts is particularly noteworthy, as these two species tend to react and cannot coexist for long under thermochemical equilibrium. Their co-occurrence therefore suggests an active replenishment mechanism, potentially of biological origin (Lovelock, 1965; Krissansen-Totton et al., 2018). Moreover, the combined presence of oxidized (O2, O3) and reduced (CH4, H2O) species is a classical indicator of chemical disequilibrium that is difficult to sustain abiotically (Sagan et al., 1993; Rugheimer et al., 2013). Such spectral associations are considered among the most robust diagnostic criteria for potential biosignatures in temperate exoplanet atmospheres (Meadows et al., 2018; Schwieterman et al., 2018). In summary, the detected absorptions between 0.5 and 5.5 µm indicate an atmosphere exhibiting marked thermodynamic disequilibrium, a necessary, though not sufficient, condition for the possible presence of biological activity, in line with established criteria for exoplanetary biosignature detection.
5.3 Clouds
MAJIS mapped cloud systems during these opportunistic Earth observations to reveal the complexity of their structures, whilst demonstrating MAJIS' spectral and imaging capabilities. In this section, we focus on two overlapping cubes obtained just west of the Hawaiian Islands, C16 and C17 taken at a local time around 10:00 a.m., with a resolution of ∼1.4 km per pixel. Average reflectance maps for the VISNIR and IR channels are displayed in Fig. 19. The two cubes showcase the ability of MAJIS to map a variety of cloud structures above the low-reflectivity ocean surface. This preliminary view indicates localized convective structures reminiscent of cumulus towers; diffuse high-altitude clouds; and thin cirroform cloud structures. Some of the clouds can be seen to cast shadows on the ocean surface.
The acquired spectroscopic measurements can be used to diagnose the variety of cloud properties and their vertical distribution. Below, we apply a series of spectral indices to perform an initial inspection of these two MAJIS spectral cubes, using the depths of gaseous absorption bands to show the capability of the instrument to characterize clouds. The key parameters to be considered include the thermodynamic phase of the clouds (mixtures of liquid droplets and ice crystals), the cloud-top altitude, temperatures, and cloud optical thickness (COT). These spectral indices are based on knowledge of sunlight scattering within gaseous and aerosol media, and provide preliminary assessments of the types of environments sampled by the MAJIS cubes before applying more advanced spectroscopic inversions as addressed in Oliva et al. (2026).
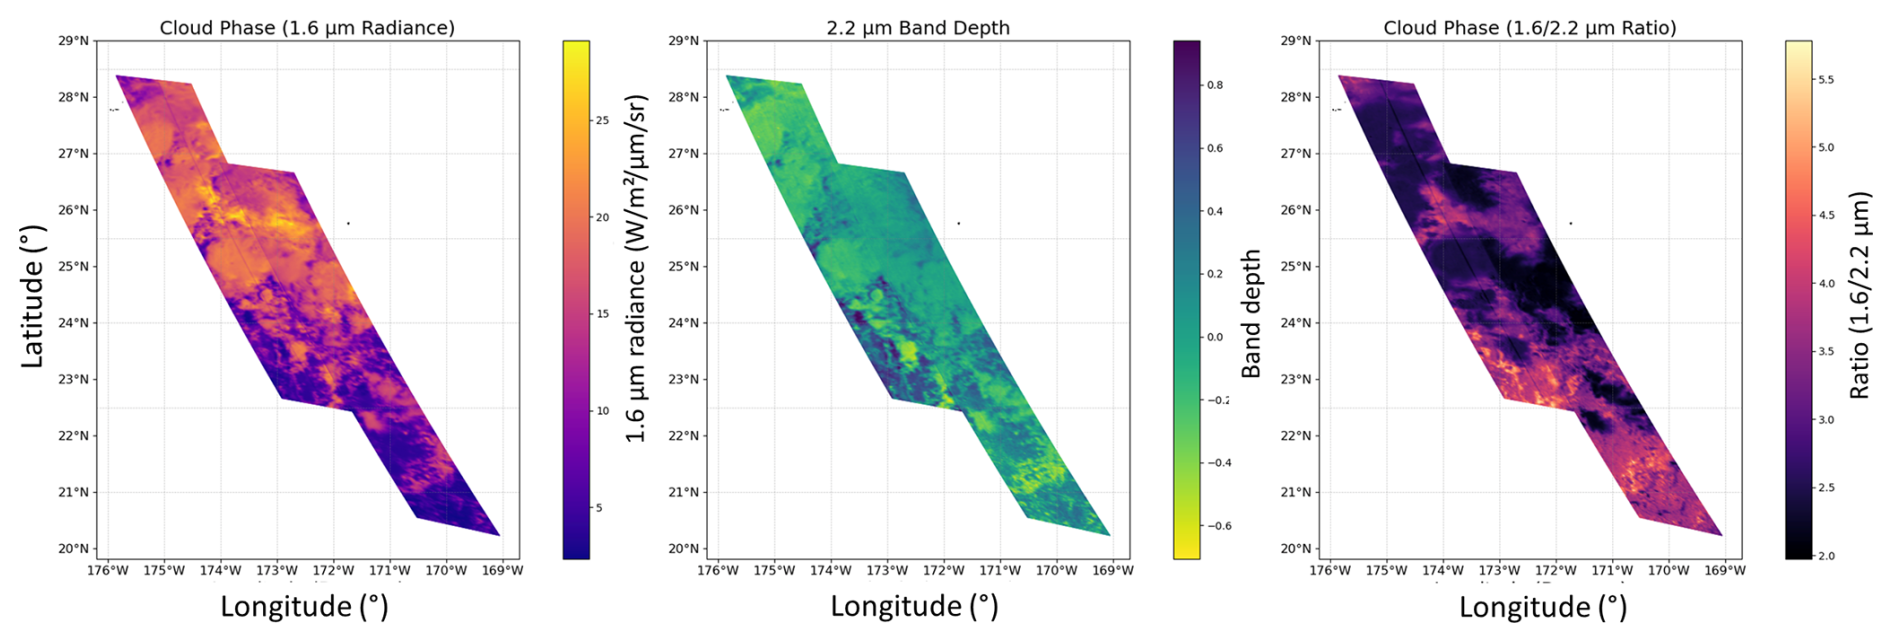
Figure 20Estimation of cloud phase from the reflectance at 1.6 µm, the band depth at 2.2 µm, and the ratio of the µm reflectance. Darker colors in the ratio are indicative of water ice clouds; brighter colors indicate liquid water clouds.
5.3.1 Cloud phase
Near-IR bands can be used to identify cloud phases. We begin here with the VISNIR channel spectral characteristics, as shown in Fig. 20. Beyond 1 µm, the reflectance of thick clouds is primarily controlled by cloud-top microphysics (phase and particle size), whereas below 1 µm it is mainly the result of optical depth. The weak CO2 absorption band at 1.6 µm is useful to understand the cloud phase, because liquid water droplets and ice crystals have distinct absorption properties in this spectral region (Li et al., 2021). Liquid water clouds exhibit only moderate absorption at 1.6 µm (i.e., higher reflectivity), and their reflectance decreases with increasing droplets size. In contrast, ice crystals absorb more strongly at this wavelength leading cirrus and other cirroform clouds to appear darker than liquid clouds with droplets of the same size (i.e., moderate reflectivity). Therefore, the liquid clouds would be brighter at 1.6 µm than the ice clouds. This behavior has motivated the designation of the 1.6 µm channel as the “snow/ice band” by the team using the Advanced Baseline Imager (ABI), a 16-channel radiometer on board the Geostationary Operational Environmental Satellite (GOES-16) (referred as to ABI band 5 by Schmit et al., 2017), providing an indicator for both cloud thermodynamic phase and particle size. However, the radiance also depends simultaneously on cloud thickness, complicating the interpretation of this channel when used in isolation. It is therefore most effective when combined with complementary spectral bands that constrain these additional parameters as seen below.
Further discrimination of cloud particle sizes can be quantified using the strength of the 2.2 µm absorption band, which is especially sensitive to phase and size distributions (ABI band 6 for cloud particle size in Schmit et al., 2017). For both liquid and ice, this band is stronger than the 1.6 µm band. As a result, the signal originates from shallower depths within the cloud, allowing properties closer to the cloud top to be assessed. Moreover, ice absorbs more strongly than liquid, so appears darker than water clouds of similar thickness. Larger particle radii also increase the absorption strength, so larger ice particles tend to be darker than smaller liquid droplets. In Fig. 20 (middle panel), some regions (shown in green) exhibit moderate band depth, suggesting the presence of ice clouds and/or liquid clouds with large droplets.
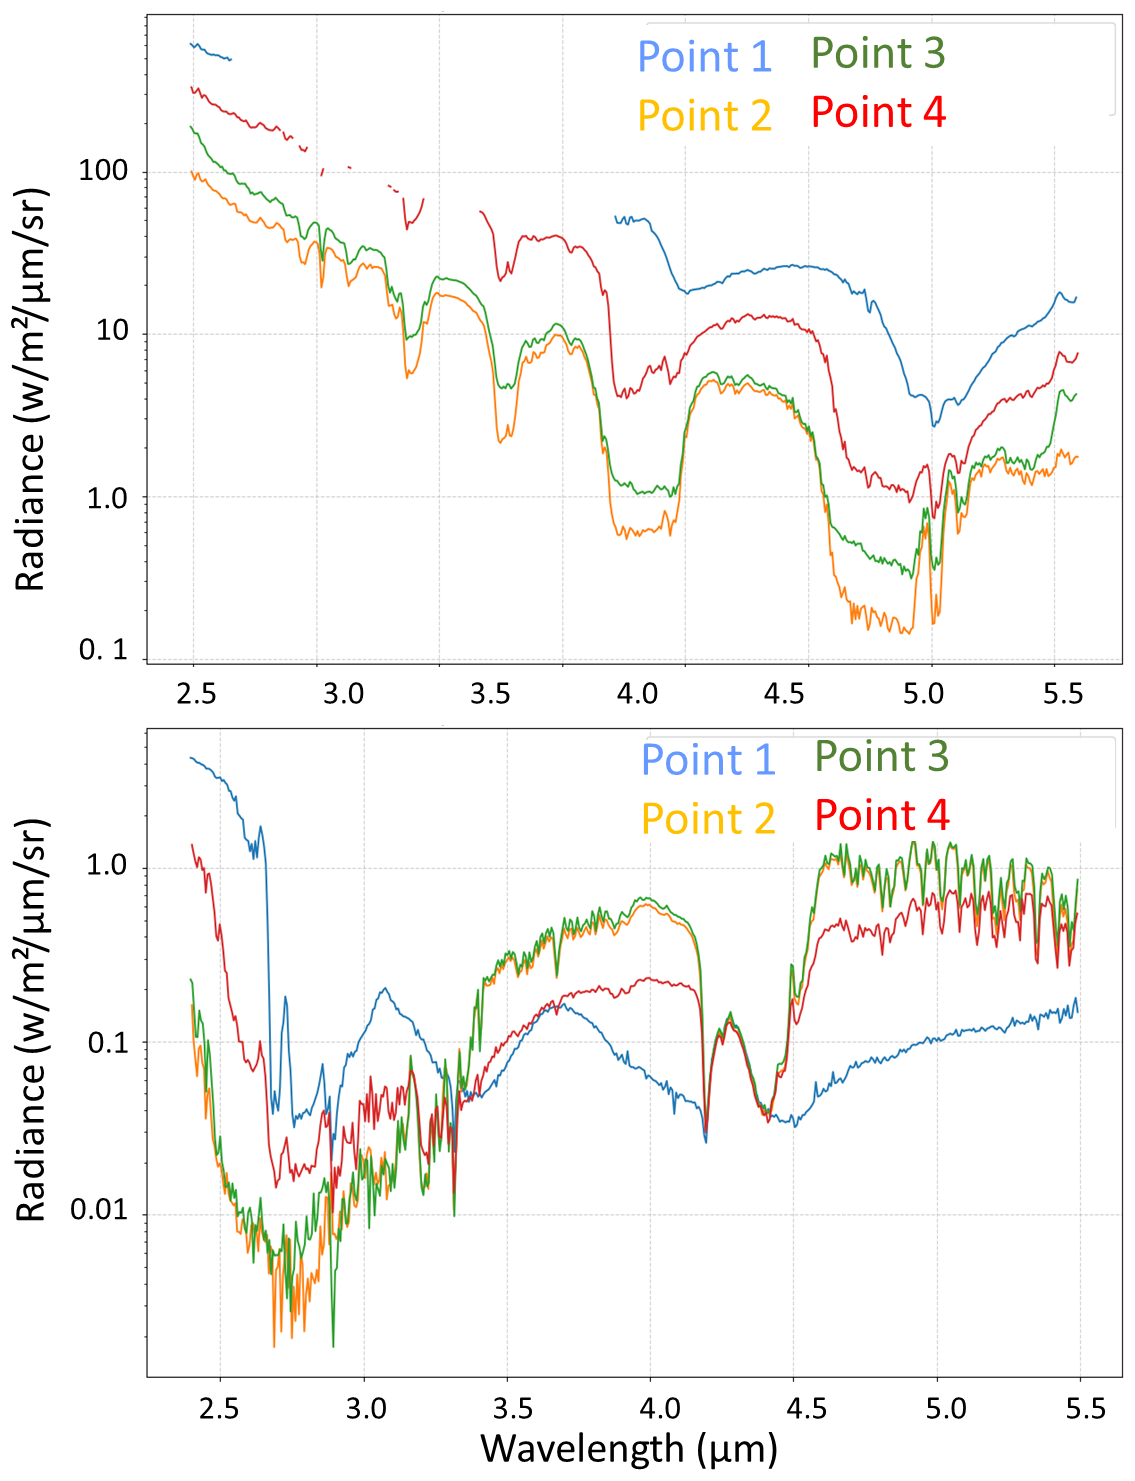
Figure 21Representative VISNIR (top) and IR (bottom) spectra from the MAJIS cloud observations (C16 and C17). Their location is shown on Fig. 19.
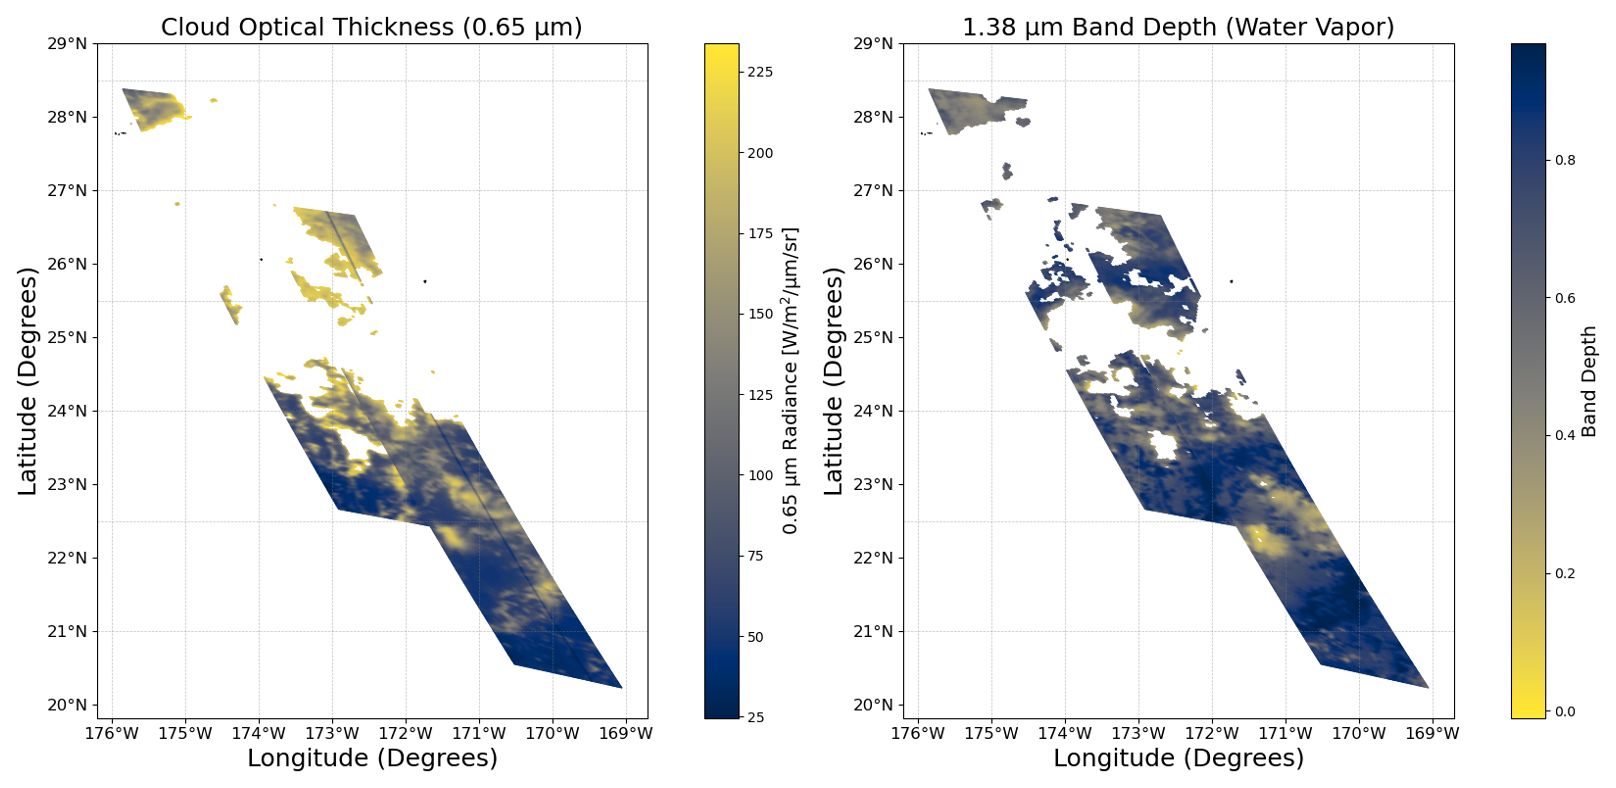
Figure 22Cloud optical thickness derived at 0.65 µm (left), and the band depth at 1.38 µm as a cirrus-cloud detector (right). Given the short wavelengths used in these indices, much of the data over the most reflective clouds is saturated (shown as white), as described in the main text.
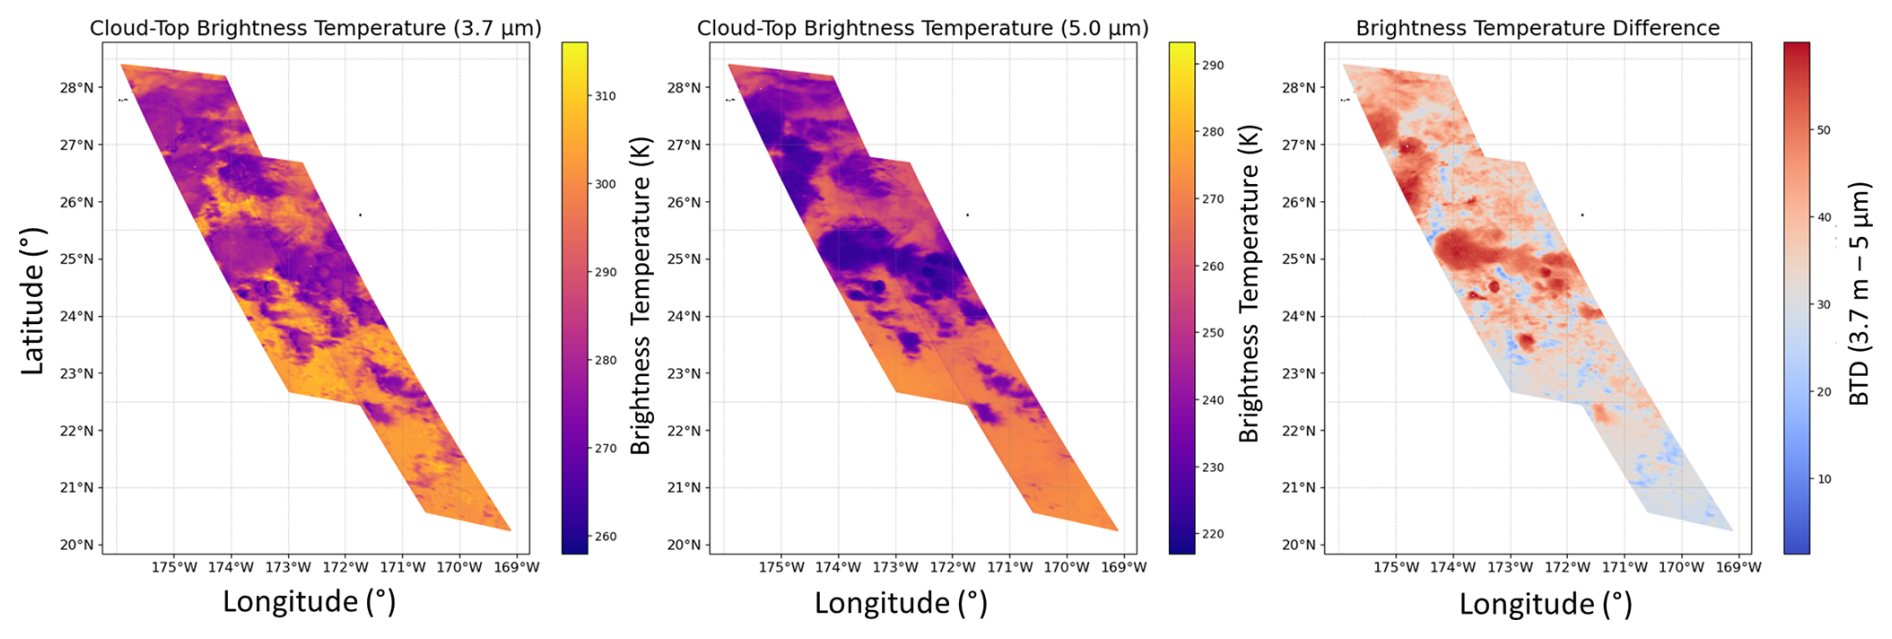
Figure 23Cloud-top brightness temperatures extracted at 3.7 and 5.0 µm (left, centre), and the difference between them (right).
Combining the two indices can significantly improve cloud-phase discrimination. By taking the ratio of reflectivity at 1.6 and 2.2 µm, we can exploit the distinct absorption behavior. Low ratios are suggestive of large cloud particles and thus ice clouds, where absorptions in the two wavelength bands come close to being equal (i.e., the ratio is closest to one). Conversely, higher ratios imply that the 1.6 µm reflectance is much larger than that at 2.2 µm, which is characteristic of liquid water clouds. As shown in Fig. 20 (right panel), many of the discrete structures exhibit low ratios (dark), consistent with the presence of ice clouds (moderate 1.6 µm reflectance, moderate 2.2 µm band depth). These low ratio areas appear to be well correlated with low cloud-top temperatures shown later in this work (Fig. 23), supporting the presence of glaciated clouds. High ratios (in orange) are only observed in some localized regions, potentially indicating liquid water clouds near 23° N, 173° W, and 21° N, 170.5° W. Overall, the scene is therefore dominated by water ice clouds, with only small patches of liquid water clouds identified.
Representative VISNIR spectra for four regions are shown in Fig. 21 (top panel), with saturated regions of the spectrum masked out. The blue spectrum (25° N, 173.5° W) displays the shape of water ice bands at 1.5 and 2.0 µm, confirming that this region (dark area in right panel of Fig. 20) is dominated by water ice clouds. This contrasts with the spectrum in orange and green which are from regions where the µm ratio is higher, indicative of liquid water clouds. The red spectrum (26° N, 172.5° W) is intermediate between the other cases.
5.3.2 Cloud optical thickness
At shorter wavelengths in the visible range, the reflectivity is controlled by the cloud optical thickness. In Fig. 22 (left panel), we attempt to use the reflectance at 0.65 µm (similar to GOES-16/ABI channel 2) as a proxy, where thicker clouds scatter more sunlight and appear to have a high albedo. By contrast, thin cirrus clouds would have low optical thickness. This visible-red band is usually an effective wavelength for cloud detection, particularly when contrasted against the dark ocean background. However, the thickest clouds with the highest albedo cause saturation at this wavelength, so that the white areas of Fig. 22 correspond to the brightest clouds in Fig. 19, which are water ice clouds poleward of 24° N. In contrast, thinner, wispy cirrus clouds with lower COT are observed south of 24° N. Two of the darkest spectra shown in Fig. 21 were extracted from these clouds.
5.3.3 Cirrus-cloud detector
Water vapor exhibits a strong absorption band at 1.38 µm (similar to GOES-16/ABI channel 4), which can be used to diagnose the height of the clouds (Gao and Li, 2017). H2O is concentrated in the lower troposphere, so little sunlight can reach the surface here. If the clouds are low down, or absent, the H2O band depth will be strong and the radiance correspondingly low. Conversely, if clouds lie above most of the H2O absorption (such as icy cirrus clouds), then the band depth will be rather shallow due to a higher reflectance. Although high 1.38 µm brightness leads to MAJIS saturation, and the ice-cloud spectra do not exhibit a deep water vapor band, the 1.38 µm band can still be used as an effective discriminator for high-altitude cirrus cloud detection, which are often too thin to be detected at other wavelengths. Very high clouds (in yellow on right panel of Fig. 22) can be seen to be embedded in water-cloud regions where the COT (as revealed at 0.65 µm) is large and often saturated, indicating convective overshoot and the formation of high-altitude cirrus. This is confirmed by modeling of some spectra that require the presence of two ice layers with distinct microphysical properties (Oliva et al., 2026). Equatorward of 24° N we see several examples of high COT coinciding with shallow H2O band depths, suggesting the presence of high-altitude cirrus clouds.
5.3.4 Correlation with cloud top temperatures
As introduced in Sect. 5.2.1, the cloud altitudes can be obtained from infrared brightness temperatures, which provide an indication of the effective temperature of the emitting or reflecting layer in the atmosphere. This is also provided an indicator of the cloud phase. In this section, we first use the 3.7 µm atmospheric window region, meaning that the atmosphere itself is relatively transparent at this wavelength and the signal largely comes from the ocean or from clouds. At this wavelength, liquid water clouds are however highly reflective during daylight hours, so they often appear colder than their true thermal temperature due to the reflection contribution. Ice clouds, on the other hand, are less reflective and more absorbing at 3.7 µm, so their emission more closely represents their actual thermal state. This difference in radiative behaviour provides sensitivity to cloud phase (liquid versus ice). Second, we use the 5.0 µm band. The radiation from the surface or from low-level clouds is largely absorbed, so that the brightness temperatures mainly represent emission from higher, cooler atmospheric layers (Sect. 5.2.1). This makes the 5.0 µm channel “upper-atmosphere sounding,” in contrast to the more surface-sensitive 3.7 µm channel.
By comparing the two, the brightness temperature difference (hereafter BTD = 3.7–5.0 µm) highlights vertical structure: large differences indicate very high-altitude cloud features, since 3.7 µm senses deeper, warmer levels while 5.0 µm senses higher, cooler levels. These high clouds are more easily detected in BTD imagery (red areas in right panel of Fig. 23). The location of these high-altitude clouds matches well with the shallowest (and sometimes saturated) absorptions in the 1.38 µm band, which is also selective for high-altitude clouds because deeper clouds have stronger band depths. We also note that the highest, coolest clouds in Fig. 23 are well correlated with the lowest ratios in Fig. 20, indicating ice clouds dominating the MAJIS coverage.
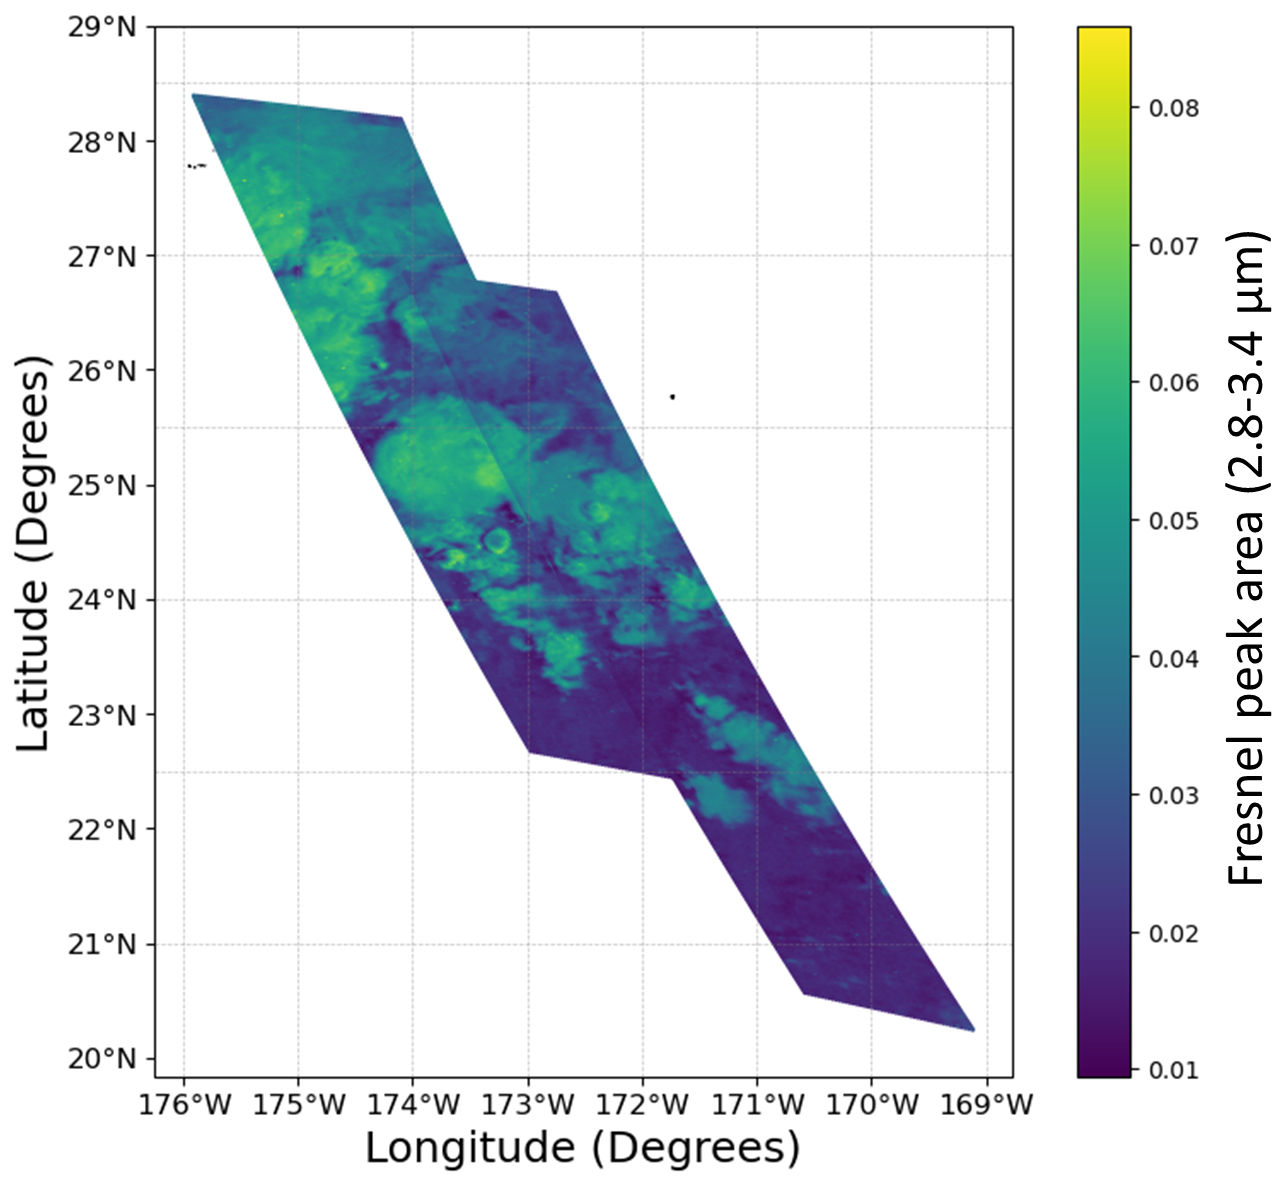
Figure 21 shows four representative IR spectra. Most interesting is the blue spectrum, previously identified to be in a region of water ice clouds, and now known to be one of the coldest regions. The distinctive 3.1 µm Fresnel peak of water ice is visible, as well as the peak near 3.6 µm, confirming the identification of glaciated clouds. This blue spectrum shows very few H2O gas features near 5 µm, in contrast to those spectra sampling warmer (and thus deeper) regions of the atmosphere (Sect. 5.2.1).
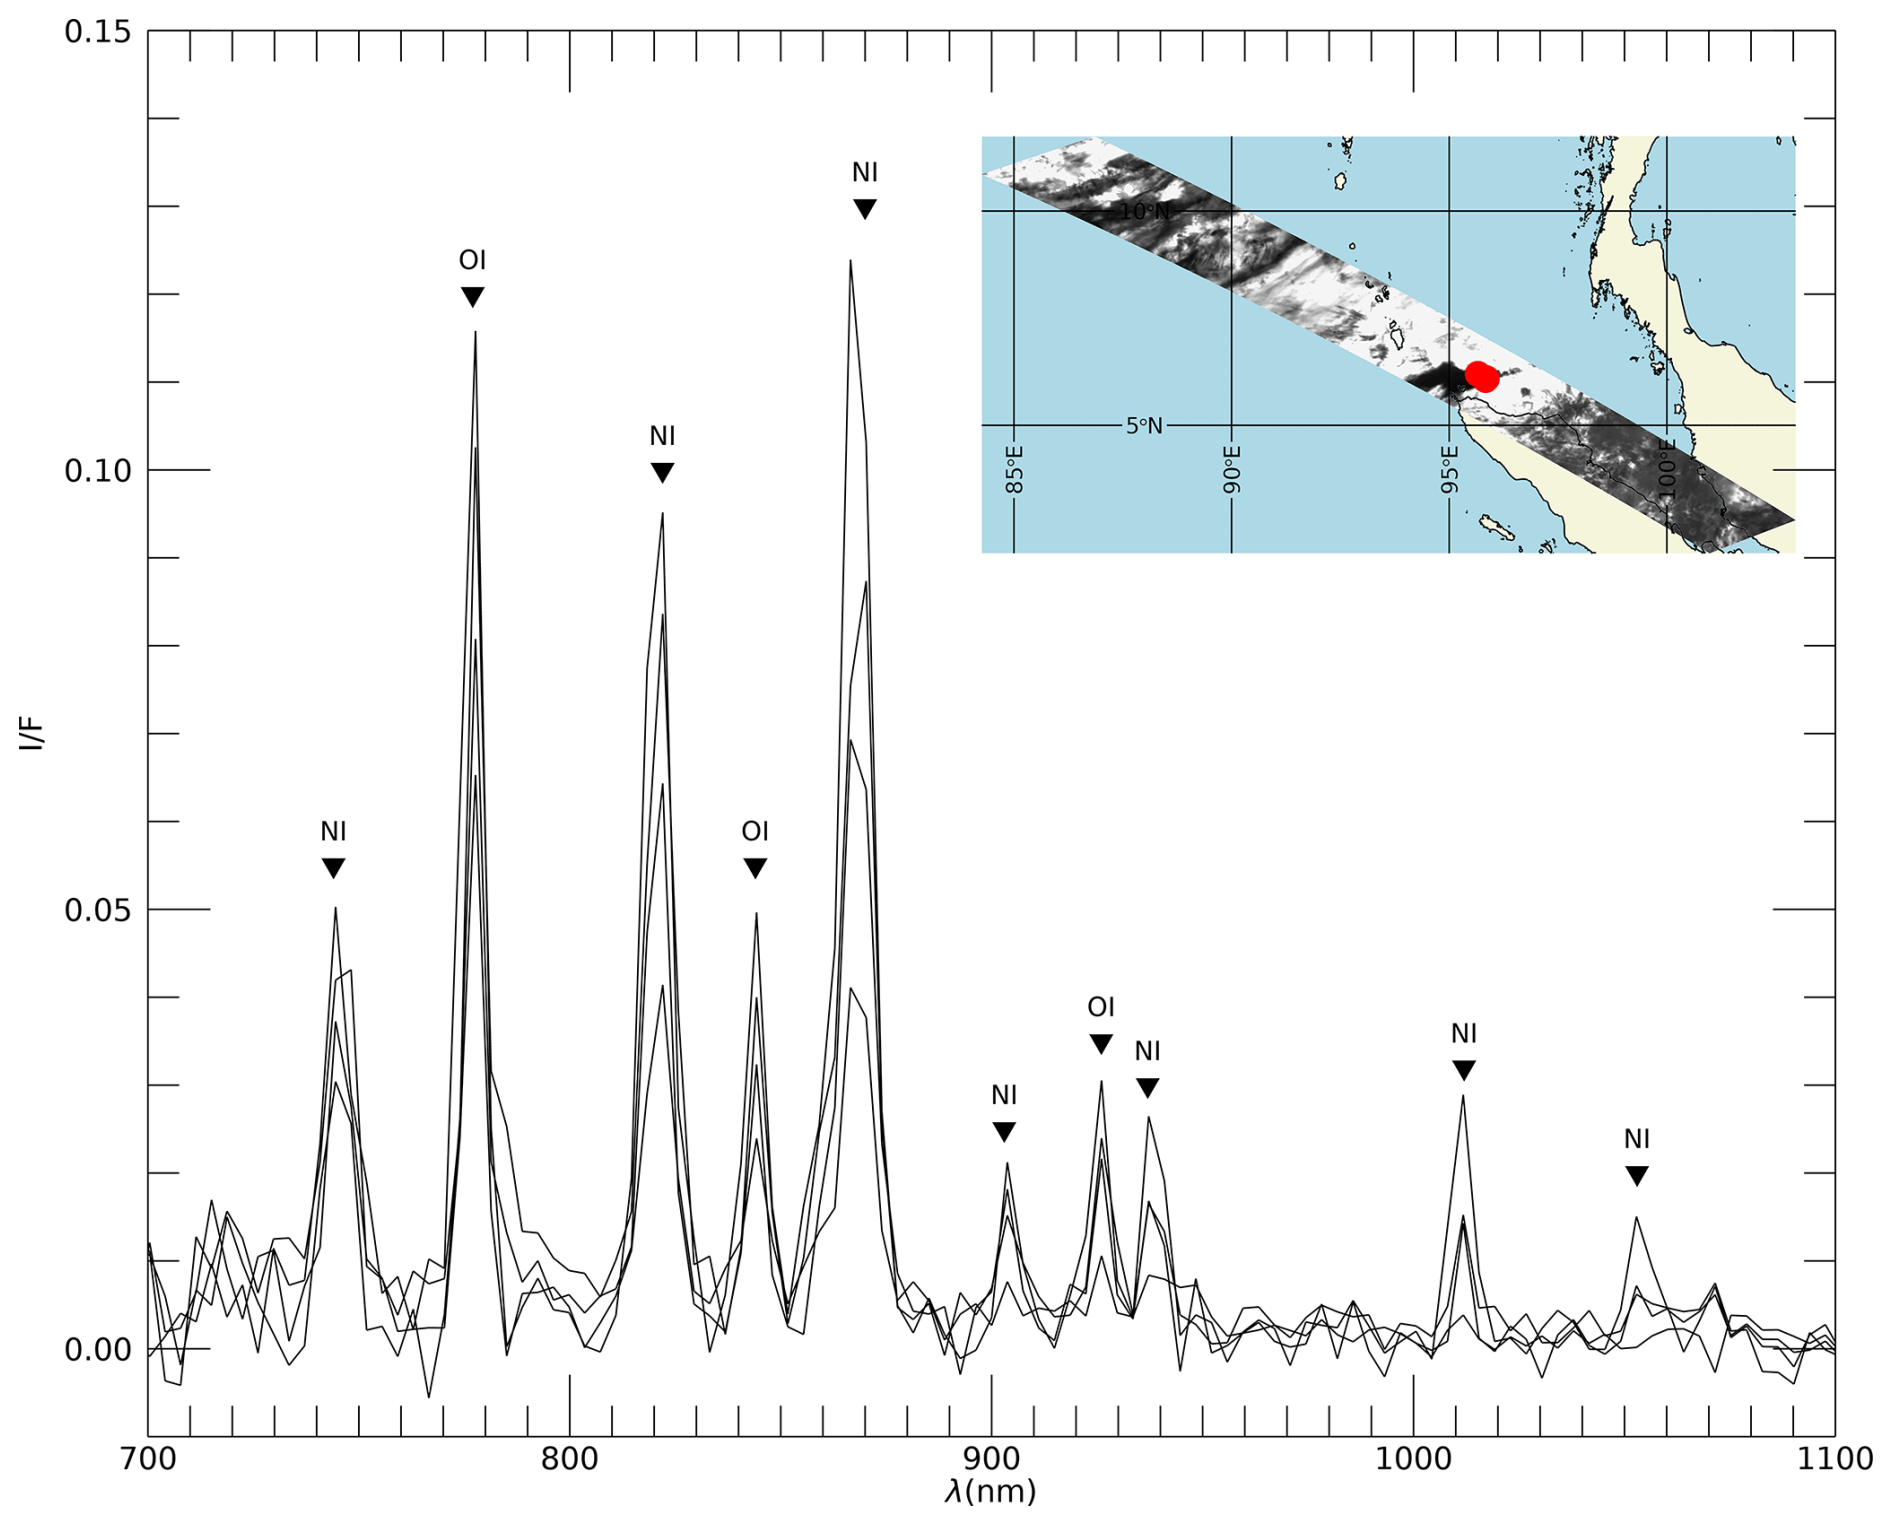
Figure 25Spectral signatures diagnostic of the presence of high-temperature oxygen and nitrogen atoms observed in the EGA nighttime C1. Red points indicate the location of these emissions over the Sumatra island.
Finally, we plot the area under the Fresnel peak (2.8–3.4 µm) in Fig. 24, confirming that water ice clouds dominate the studied scene, and these are anticorrelated with both the µm ratio (indicating cloud phase) and with the 5 µm brightness (indicating high clouds promoting glaciation). The optically thicker layers associated with these convective clouds are estimated to reach altitudes of 10–15 km, in agreement with independent cloud-top altitude retrieval using the O2 band depth (Oliva et al., 2026). The vertical extent of convective plumes can also be inferred from their projected shadows, yielding height estimates of up to 9 km above the surrounding cloud deck.
5.4 Terrestrial lightening
In the EGA C1 acquired over the storm-filled western Pacific, clear visible-wavelength emissions were detected at night off the coast of Sumatra (Fig. 25). This serendipitous signal constitutes the first unambiguous space-based spectroscopic detection of a terrestrial lightning flash (D'Aversa et al., 2026). Actually, up to four individual lightning flashes were identified in the VISNIR channel. Their interpretation relies on the simultaneous detection of atomic O and N emission features, indicative of plasma temperatures of several thousand kelvins. Complementary brightness-temperature maps from the IR channel locate the events at the edge of a deep convective system (Fig. 25). Although MAJIS is not optimized for lightning studies, D'Aversa et al. quantified biases related to spectral undersampling and integration times longer than the flash duration. After applying correction factors, the retrieved energies are consistent with average terrestrial lightning (0.7–1.3 MJ in the O I 777 nm line). Temperature estimates based on line ratios span 5000–20 000 K, reflecting uncertainties due to unresolved events.
These observations provide a valuable benchmark for future lightning searches on Jupiter, where H I emissions, faintly but possibly detected here near Hα, are expected to be key diagnostics. Extrapolating from the terrestrial case, we identify H I lines near 650 and 1870 nm as the most promising for Jovian lightning investigations.
The Earth-Moon double flyby of August 2024 enabled the collection of hyperspectral datasets, which made it possible to verify key MAJIS calibration parameters, including radiometric, spectral, and geometric metrics. These observations demonstrated MAJIS ability to operate under high signal flux, make use of browse products, and manage VISNIR straylight and short integration time (challenges that are expected to recur in the Jovian environment). While not exhaustive, these flybys also provided an initial stress test of MAJIS operations under various constraints, including spacecraft attitude limitations, thermal behaviors, and electromagnetic interference. The positive assessment of the in-flight performance of the instrument from these operations during the LEGA observations confirm the ability of MAJIS to deliver its scientific objectives in the Jovian system. Among the lessons learned from an operational point of view, we can list: (1) Observations of the Earth with windows extending beyond the edge of the FOV were acquired in order to reliably evaluate VISNIR straylight from the signal outside the FOV; this procedure shall be applied during the science phase. (2) The interference tests with RIME were well representative of the satellite flybys during the pushbroom phase (corresponding to a spacecraft altitude below ∼1000 km). An operational mitigation strategy between RIME and MAJIS should be implemented.
Beyond these technical and operational assessments, the LEGA dataset also enabled scientific investigations of limited but representative portions of the Moon and Earth. On the Moon, MAJIS revealed thermal characteristics as well as mineralogical and emissivity variations. On Earth, MAJIS captured a range of atmospheric features, from gaseous constituents and cloud properties (e.g., ice glaciation and cold cloud-tops in Pacific clouds), to lightning events and radiative signatures of habitability markers, demonstrating its radiometric sensibility and ability to resolve fine spectral signatures over the entire spectral range of the instrument. The straylight affecting wavelengths shorter than 1.2 µm, previously identified during on-ground calibration, has been confirmed under operational conditions. A level of stray-light contribution similar to that measured in the EGA cubes is expected for science observations in the Jupiter system. As discussed in detail by Langevin et al. (2026), spectral features at wavelengths shorter than 1.2 µm can still be reliably identified in LEGA MAJIS observations that cannot be corrected for straylight, although quantitative modeling will remain limited. Inter-comparisons with other JUICE instruments (JANUS, RIME, SWI) and several Earth-orbiting spectrometers (EnMAP, PRISMA, IASI, Tropomi) were introduced. While spatial and temporal co-registration was not always optimal, these coordinated efforts allowed for cross-validation of MAJIS data and methodologies.
The dedicated series of companion MAJIS-based papers in the special ANGEO issue about “The first-ever lunar-Earth flyby: a unique test environment for JUICE” presents more detailed and focused analyses of the LEGA dataset, including calibration refinements and selected science outcomes. We encourage readers to consult these contributions for a more complete picture of the performance and capabilities of MAJIS. Finally, the lessons learned lay important groundwork for the upcoming Earth flybys (EGA2 in 2026, EGA3 in 2029) and will help refine the approach to future scientific operations and data processing strategies in the Jovian system.
The MAJIS data acquired during the JUICE Moon–Earth flyby in August 2024 are currently under the mission's cruise-phase proprietary period. These data will be made available through the ESA Planetary Science Archive following the first Cruise Archive Delivery, which is currently scheduled for six months after Earth Gravity Assist #3 in 2029.
FP supervised the project and wrote the paper. GP co-supervised the project and contributed to the text. YL oversaw data calibration and data processing and contributed to the text. CD, VC, BS, MD, MM, CL contributed to operations and data processing. BS, FA, ED, MDS, LF, SG, SL, AM, FO, CR, SR, KS, FT, FZ contributed to the analyses, figures and text. All other authors reviewed and edited the manuscript.
At least one of the (co-)authors is a member of the editorial board of Annales Geophysicae. The peer-review process was guided by an independent editor, and the authors also have no other competing interests to declare.
Publisher's note: Copernicus Publications remains neutral with regard to jurisdictional claims made in the text, published maps, institutional affiliations, or any other geographical representation in this paper. The authors bear the ultimate responsibility for providing appropriate place names. Views expressed in the text are those of the authors and do not necessarily reflect the views of the publisher.
This article is part of the special issue “The first-ever lunar–Earth flyby: a unique test environment for Juice”. It is not associated with a conference.
This work was supported by CNES, focused on MAJIS. This work has been developed under the ASI-INAF agreement no. 2023-6-HH.0. The authors also wish to thank ESA teams from SOC, MOC and ESTEC, as well as Airbus Defence and Space for their technical and operational support to the MAJIS project. JUICE is a mission under ESA leadership with contributions from its Member States, NASA, JAXA and the Israel Space Agency. It is the first Large-class mission in ESA's Cosmic Vision programme. Correction tools have been applied to the text to check the English wording. LF was supported by STFC Grant reference UKRI1205. For the purpose of open access, the author has applied a Creative Commons Attribution (CC BY) licence to the Author Accepted Manuscript version arising from this submission.
This paper was edited by Stephanie C. Werner and reviewed by three anonymous referees.
Adriani, A., Filacchione, G., Di Iorio, T., Turrini, D., Noschese, R., Cicchetti, A., Grassi, D., Mura, A., Sindoni, G., Zambelli, M., Piccioni, G., Capria, M. T., Tosi, F., Orosei, R., Dinelli, B. M., Moriconi, M. L., Roncon, E., Lunine, J. I., Becker, H. N., Bini, A., Barbis, A., Calamai, L., Pasqui, C., Nencioni, S., Rossi, M., Lastri, M., Formaro, R., and Olivieri, A.: Juno's Earth flyby: the Jovian infrared Auroral Mapper preliminary results, Astrophys. Space Sci., 361, 272, https://doi.org/10.1007/s10509-016-2842-9, 2016.
Bandfield, J. L., Hayne, P. O., Williams, J.-P., Greenhagen, B. T., and Paige, D. A.: Lunar surface roughness derived from LRO Diviner Radiometer observations, Icarus, 248, 357–372, https://doi.org/10.1016/j.icarus.2015.07.015, 2015.
Bellucci, G., Brown, R. H., Formisano, V., Baines, K. H., Bibring, J.-P., Buratti, B. J., Capaccioni, F., Cerroni, P., Clark, R. N., Coradini, A., Cruikshank, D. P., Drossart, P., Jaumann, R., Langevin, Y., Matson, D. L., McCord, T. B., Mennella, V., Miller, E., Nelson, R. M., Nicholson, P. D., Sicardy, B., and Sotin, C.: Cassini/VIMS observations of the moon, Adv. Space Res., 30, 1889–1894, 2002.
Blumstein, D., Chalon, G., Carlier, T., Buil, C., Hebert, P., Maciaszek, T., Ponce, G., Phulpin, T., Tournier, B., Simeoni, D., Astruc, P., Clauss, A., Kayal, G., and Jegou, R.: IASI instrument: technical overview and measured performances, Proc. SPIE, 5543, 196–205, 2004.
Boutonnet, A., Langevin, Y., and Erd, C.: Designing the JUICE trajectory, Space Sci. Rev., 220, 67, https://doi.org/10.1007/s11214-024-01093-y, 2024.
Chabrillat, S., Foerster, S., Segl, K., Beamish, A., Brell, M., Asadzadeh, S., Milewski, R., Ward, K. J., Brosinsky, A., Koch, K., Scheffler, D., Guillaso, S., Kokhanovsky, A., Roessner, S., Guanter, L., Kaufmann, H., Pinnel, N., Carmona, E., Storch, T., Hank, T., Berger, K., Wocher, M., Hostert, P., van der Linden, S., Okujeni, A., Janz, A., Jakimow, B., Bracher, A., Soppa, M. A., Alvarado, L. M. A., Buddenbaum, H., Heim, B., Heiden, U., Moreno, J., Ong, C., Bohn, N., Green, R. O., Bachmann, M., Kokaly, R., Schodlok, M., Painter, T. H., Gascon, F., Buongiorno, F., Mottus, M., Brando, V. E., Feilhauer, H., Betz, M., Baur, S., Feckl, R., Schickling, A., Krieger, V., Bock, M., La Porta, L., and Fischer, S.: The EnMAP spaceborne imaging spectroscopy mission: Initial scientific results two years after launch, Remote Sens. Environ., 315, 114379, https://doi.org/10.1016/j.rse.2024.114379, 2024.
D'Aversa, E., Oliva, F., Piccioni, G., Poulet, F., Kolmašová, I., Migliorini, A., Filacchione, G., Fletcher, L., Mura, A., Langevin, Y., Seignovert, B., Grassi, D., Rodriguez, S., Tosi, F., Ligier, N., Sindoni, G., Giardino, M., and Plainaki, C.: Spectroscopic detection of terrestrial lightning from space by JUICE-MAJIS during Earth Gravity Assist, EGUsphere [preprint], https://doi.org/10.5194/egusphere-2025-6453, 2026.
Efremenko, D. S. and Kokhanovsky, A. A.: Foundations of Atmospheric Remote Sensing, Springer, https://doi.org/10.1007/978-3-030-66745-0, 2021.
Filacchione, G., Haffoud, P., Poulet, F., Piccioni, G., Langevin, Y., Tommasi, L., Barbis, A., Carter, J., Guerri, I., Dumesnil, C., De Angelis, S., Vincendon, M., Stefani, S., Pilorget, C., Tosi, F., and Rodriguez, S.: Calibration of MAJIS (Moons and Jupiter Imaging Spectrometer): II. Spatial calibration, Rev. Sci. Instrum., 95, 041301, https://doi.org/10.1063/5.0203872, 2024.
Galeazzi, C., Labate, D., and Loizzo, R.: The PRISMA payload optomechanical design, a high-performance instrument for a new hyperspectral mission, Acta Astronaut., 65, 1429–1437, https://doi.org/10.1016/j.actaastro.2009.05.022, 2009.
Gao, B.-C. and Li, R.-R.: Removal of thin cirrus scattering effects in Landsat 8 OLI images using the cirrus detecting channel, Remote Sens., 9, 834, https://doi.org/10.3390/rs9080834, 2017.
Guerlet, S., Armante, R., Lauzanne, N., Poulet, F., Langevin, Y., Rodriguez, S., Fletcher, L., Fouchet, T., Piccioni, G., and Migliorini, A.: MAJIS/JUICE performances in the infrared during Earth fly-by: comparisons with IASI measurements and sensitivity to trace species, Ann. Geophys., submitted, 2026.
Haffoud, P., Poulet, F., Vincendon, M., Filacchione, G., Barbis, A., Guiot, P., Lecomte, B., Langevin, Y., Piccioni, G., Dumesnil, C., Rodriguez, S., Carter, J., Stefani, S., Tommasi, L., Tosi, F., and Pilorget, C.: Calibration of MAJIS (Moons and Jupiter Imaging Spectrometer): III. Spectral calibration, Rev. Sci. Instrum., 95, 031301, https://doi.org/10.1063/5.0188944, 2024.
Hueso, R., Antuñano, A., Lara, L. M., Stephan, K., Zinzi, A., Coustenis, A., Yair, Y., Sato, M., Haruyama, J., Simon, A., Tubiana, C., Penasa, L., Agostini, L., Luchetti, A., Aboudan, A., Aye, M., Kersten, E., Matz, K.-D., Politti, R., Trauthan, F., Evill, R., Belgacem, I., Yukihiro, T., Castro-Marín, J. M., Della Corte, V., Hviid, S., Roatsch, T., Schmitz, N., Patel, M., Portyankina, G., and Palumbo, P.: JUICE-JANUS observations of Earth in preparation for the JANUS investigation of Jupiter’s atmosphere, EGUsphere [preprint], https://doi.org/10.5194/egusphere-2026-710, 2026.
Jin, Z., Charlock, T. P., Smith, W. L. Jr., and Rutledge, K.: A parameterization of ocean surface albedo, Geophys. Res. Lett., 31, L22301, https://doi.org/10.1029/2004GL021180, 2004.
Kaltenegger, L. and Traub, W. A.: Transits of Earth-like planets, Astrophys. J., 698, 519–527, 2009.
Krissansen-Totton, J., Olson, S. L., and Catling, D. C.: Disequilibrium biosignatures over Earth history and implications for detecting exoplanet life, Sci. Adv., 4, eaao5747, https://doi.org/10.1126/sciadv.aao5747, 2018.
Langevin, Y., Zambelli, M., and Guiot, P.: On-board de-spiking implemented by MAJIS, the VIS/NIR imaging spectrometer of JUICE, Proc. SPIE, 11443, 1144378, https://doi.org/10.1117/12.2562464, 2020.
Langevin, Y., Carlier, V., Hannou, C., Gonnod, L., Carter, J., Tosi, F., Filacchione, G., Dumesnil, C., Piccioni, G., and Poulet, F.: H1RG readout procedures for MAJIS, the VIS/NIR imaging spectrometer of JUICE: Impacts on the performances, Proc. SPIE, 12180, 1218037, https://doi.org/10.1117/12.2629310, 2022.
Langevin, Y., Poulet, F., Piccioni, G., Filacchione, G., Dumesnil, C., Tosi, F., Carter, J., Barbis, A., Haffoud, P., Tommasi, L., Vincendon, M., De Angelis, S., Guerri, I., Pilorget, C., Rodriguez, S., Stefani, S., Bolsée, D., Cisneros, M., Van Laeken, L., Pereira, N., and Carapelle, A.: Calibration of MAJIS (Moons and Jupiter Imaging Spectrometer): IV. Radiometric calibration, Rev. Sci. Instrum., 95, 111301, https://doi.org/10.1063/5.0202702, 2024.
Langevin, Y., Rodriguez, S., Guerlet, S., Poulet, F., Piccioni, G., Agostini, L., Armante, R., D'Aversa, E., Filacchione, G., Fletcher, L., Oliva, F., Royer, C., Seignovert, B., Stephan, K., Tosi, F., and Trent, T.: Post launch spectral and radiometric performances of MAJIS, the VIS-NIR imaging spectrometer of JUICE, EGUsphere [preprint], https://doi.org/10.5194/egusphere-2026-410, 2026.
Li, S. and Milliken, R. E.: An empirical thermal correction model for Moon Mineralogy Mapper data constrained by laboratory spectra and Diviner temperatures, J. Geophys. Res.-Planets, 121, 2081–2107, https://doi.org/10.1002/2016JE005035, 2016.
Li, Q., Sun, X., and Wang, X.: Cloud phase recognition based on oxygen A band and CO2 1.6 µm band, Remote Sens., 13, 1681, https://doi.org/10.3390/rs13091681, 2021.
Lovelock, J. E.: A physical basis for life detection experiments, Nature, 207, 568–570, 1965.
Meadows, V. S.: Reflections on O2 as a biosignature in exoplanetary atmospheres, Astrobiology, 17, 1022–1052, 2017.
Meadows, V. S., Reinhard, C. T., Arney, G. N., Parenteau, M. N., Schwieterman, E. W., Domagal-Goldman, S. D., Lincowski, A. P., Stapelfeldt, K. R., Rauer, H., DasSarma, S., Hegde, S., Narita, N., Deitrick, R., Lustig-Yaeger, J., Lyons, T. W., Siegler, N., and Grenfell, J. L.: Exoplanet biosignatures: Understanding oxygen as a biosignature in the context of its environment, Astrobiology, 18, 630–662, 2018.
Mustard, J. F., Pieters, C. M., Isaacson, P. J., Head, J. W., Besse, S., Clark, R. N., Klima, R. L., Petro, N. E., Staid, M. I., Sunshine, J. M., Runyon, C. J., and Tompkins, S.: Compositional diversity and geologic insights of the Aristarchus crater from Moon Mineralogy Mapper data, J. Geophys. Res.-Planets, 116, E00G12, https://doi.org/10.1029/2010JE003726, 2011.
Noble, S. K., Pieters, C. M., and Keller, L. P.: An experimental approach to understanding the optical effects of space weathering on lunar soils, Icarus, 192, 629–642, https://doi.org/10.1016/j.icarus.2007.07.008, 2007.
Oliva, F., D'Aversa, E., Migliorini, A., Piccioni, G., Poulet, F., Langevin, Y., Filacchione, G., Ciarniello, M., Rodriguez, S., Seignovert, B., Zinzi, A., Giardino, M., Lopinto, E., Sindoni, G., and Plainaki, C.: JUICE-MAJIS observations during Earth Gravity Assist: an overview and comparison with PRISMA data, Ann. Geophys., submitted, 2026.
Paige, D. A., Foote, M. C., Greenhagen, B. T., Schofield, J. T., Calcutt, S., Vasavada, A. R., Preston, D. J., Taylor, F. W., Allen, C. C., Snook, K. J., Jakosky, B. M., Murray, B. C., Soderblom, L. A., Jau, B., Loring, S., Bulharowski, J., Bowles, N. E., Thomas, I. R., Sullivan, M. T., Avis, C., De Jong, E. M., Hartford, W., and McCleese, D. J.: The Lunar Reconnaissance Orbiter Diviner Lunar Radiometer Experiment, Space Sci. Rev., 150, 125–160, https://doi.org/10.1007/s11214-009-9529-2, 2010.
Palumbo, P., Roatsch, T., Lara, L. M., Castro-Marin, J. M., Della Corte, V., Hviid, S., Jaumann, R., Michaelis, H., Patel, M. R., Portyankina, G., Schmitz, N., Amoroso, M., Mugnuolo, R., Aboudan, A., Agostini, L., Althaus, C., Álvarez, F., Bartolomei, M., Behnke, T., Bilotta, T., Colombatti, G., Colosimo, A., Coustenis, A., Cremonese, G., Crews, C., Dattolo, A., Debei, S., Denk, T., Fiethe, B., Herranz, M., Hoffmann, H., Hueso, R., Koncz, A., Jiménez-Ortega, J., Lichopoj, A., Livi, L., Llamas, X., Lopes, R., Lucchetti, A., Martinez-Navajas, I., Mazzotta Epifani, E., Mertens, V., Pajola, M., Sarti, F., Schroedter, R., Stephan, K., Tosi, F., Tubiana, C., Wendler, B., Wendler, D., Williams, D., Wolff, F., Zusi, M., Chiodini, S., Ficai Veltroni, I., Galeotti, A., García-Segura, A., Greggio, D., Holland, A. D., Kenkmann, T., Leese, M. R., Magrin, D., Michalik, H., Munari, M., Noci, G. E., Paolinetti, R., Schipani, P., Soman, M., Stefanov, K. D., Turella, A., Aharonson, O., Bell, J. F. III, Bertini, I., Coates, A. J., Di Achille, G., Grassi, D., Groussin, O., Gwinner, K., Haruyama, J., Hauber, E., Hiesinger, H., Langevin, Y., Lainey, V., Marchi, S., Marinangeli, L., Marzari, F., Massironi, M., Mitri, G., Mottola, S., Oberst, J., Postberg, F., Poulet, F., Preusker, F., Schmidt, J., Schneider, N. M., Simon, A., Takahashi, Y., Tirsch, D., Vincendon, M., Balme, M. R., Bettanini, C., Borin, P., Capria, M. T., Elgner, S., Esposito, F., Ferranti, L., Ferrari, S., Fornasier, S., Galluzzi, V., Giacomini, L., Guzzetta, L., Jones, G. H., Kersten, E., Ledeit, L., Martellato, E., Matz, K.-D., Mennella, V., Murray, C., Otto, K. A., Pelizzo, M. G., Penasa, L., Politi, R., Popa, C., Pozzobon, R., Prieto Ballesteros, O., Re, C., Rotundi, A., Sato, M., Schmedemann, N., Shoji, D., Simioni, E., Sindoni, G., Trauthan, F., and Yair, Y.: The JANUS (Jovis Amorum ac Natorum Undique Scrutator) VIS-NIR multi-band imager for the JUICE mission, Space Sci. Rev., 221, 32, https://doi.org/10.1007/s11214-025-01158-6, 2025.
Phulpin, T., Blumstein, D., Prel, F., Tournier, B., Prunet, P., and Schlüssel, P.: Applications of IASI on MetOp-A: first results and illustration of potential use for meteorology, climate monitoring, and atmospheric chemistry, in: Atmospheric and Environmental Remote Sensing Data Processing and Utilization III: Readiness for GEOSS, edited by: Goldberg, M. D., Bloom, H. J., Huang, A. H., and Ardanuy, P. E., Society of Photo-Optical Instrumentation Engineers (SPIE) Conference Series, 6684, 66840F, https://doi.org/10.1117/12.736816, 345 2007.
Pieters, C. M., Goswami, J. N., Clark, R. N., Annadurai, M., and Boardman, J.: Character and spatial distribution of OH/H2O on the surface of the Moon seen by M3 on Chandrayaan-1, Science, 326, 568–572, https://doi.org/10.1126/science.1178658, 2009.
Pieters, C., Mouroulis, P., Eastwood, M., Boardman, J., Green, R. O., Glavich, T., Isaacson, P., Chatterjee, A., Clark, R., Barr, D., Annadurai, M., Besse, S., Cate, D., Cheek, L., Combe, J., Dhingra, D., Essandoh, V., Geier, S., Goswami, J. N., Green, R., Haemmerle, V., Head, J., Hovland, L., Hyman, S., Klima, R., Koch, T., Kramer, G., Kumar, A. S. K., Lee, K., Lundeen, S., Malaret, E., McCord, T., McLaughlin, S., Mustard, J., Nettles, J., Petro, N., Plourde, K., Racho, C., Rodriguez, J., Runyon, C., Sellar, G., Smith, C., Sobel, H., Staid, M., Sunshine, J., Taylor, L., Thaisen, K., Tompkins, S., Tseng, H., Vane, G., Varanasi, P., White, M., and Wilson, D.: The Moon as a spectral standard for remote sensing: Mineralogical insights from lunar orbital data, Meteorit. Planet. Sci., 48, 2170–2190, https://doi.org/10.1111/maps.12207, 2013.
Poulet, F., Langevin, Y., and Piccioni, P.: Calibration of the Moons and Jupiter Imaging Spectrometer (MAJIS): Introduction to the special collection and summary of the performances, Rev. Sci. Instrum., 95, 071601, https://doi.org/10.1063/5.0209679, 2024a.
Poulet, F., Piccioni, G., Langevin, Y., Dumesnil, C., Tommasi, L., Carlier, V., Filacchione, G., Amoroso, M., Arondel, A., D'Aversa, E., Barbis, A., Bini, A., Bolsée, D., Bousquet, P., Caprini, C., Carter, J., Dubois, J.-P., Condamin, M., Couturier, S., Dassas, K., Dexet, M., Fletcher, L., Grassi, D., Guerri, I., Haffoud, P., Larigauderie, C., Le Du, M., Mugnuolo, R., Pilato, G., Rossi, M., Stefani, S., Tosi, F., Vincendon, M., Zambelli, M., Arnold, G., Bibring, J.-P., Biondi, D., Boccaccini, A., Brunetto, R., Carapelle, A., Cisneros González, M., Hannou, C., Karatekin, O., Le Cle'ch, J.-C., Leyrat, C., Migliorini, A., Nathues, A., Rodriguez, S., Saggin, B., Sanchez-Lavega, A., Schmitt, B., Seignovert, B., Sordini, R., Stephan, K., Tobie, G., Zambon, F., Adriani, A., Altieri, F., Bockelée, D., Capaccioni, F., De Angelis, S., De Sanctis, M.-C., Drossart, P., Fouchet, T., Gérard, J.-C., Grodent, D., Ignatiev, N., Irwin, P., Ligier, N., Manaud, N., Mangold, N., Mura, A., Pilorget, C., Quirico, E., Renotte, E., Strazzulla, G., Turrini, D., Vandaele, A.-C., Carli, C., Ciarniello, M., Guerlet, S., Lellouch, E., Mancarella, F., Morbidelli, A., Le Mouélic, S., Raponi, A., Sindoni, G., and Snels, M.: Moons and Jupiter Imaging Spectrometer (MAJIS) on Jupiter Icy Moons Explorer (JUICE), Space Sci. Rev., 220, 27, https://doi.org/10.1007/s11214-024-01057-2, 2024b.
Robertson, K., Milliken, R., Pieters, C., Tokle, L., Cheek, L., and Isaacson, P.: Textural and compositional effects of ilmenite on the spectra of high-titanium lunar basalts, Icarus, 375, 114836, https://doi.org/10.1016/j.icarus.2021.114836, 2022.
Royer, C., Haffoud, P., Langevin, Y., Poulet, F., Bockelée-Morvan, D., D'Aversa, E., Cisneros-González, M., Grassi, D., Ligier, N., Piccioni, G., Carter, J., Tosi, F., Vincendon, M., Zambon, F., Zakharov, V., Gilles, M., and Seignovert, B.: A simulator of the MAJIS instrument onboard the JUICE mission: Description and application to operational and scientific cases, Planet. Space Sci., 264, 106147, https://doi.org/10.1016/j.pss.2025.106147, 2025.
Rugheimer, S., Kaltenegger, L., Zsom, A., Segura, A., and Sasselov, D.: Spectral fingerprints of Earth-like planets around FGK stars, Astrobiology, 13, 251–269, 2013.
Sagan, C., Thompson, W. R., Carlson, R., Gurnett, D., and Hord, C.: A search for life on Earth from the Galileo spacecraft, Nature, 365, 715–721, 1993.
Sang, B., Schubert, J., Kaiser, S., Mogulsky, V., Neumann, C., Förster, K.-P., Hofer, S., Stuffler, T., Kaufmann, H., Müller, A., Eversberg, T., and Chlebek, C.: The EnMAP hyperspectral imaging spectrometer: Instrument concept, calibration and technologies, Proc. SPIE, 7086, 70860L, https://doi.org/10.1117/12.794870, 2019.
Schmit, T. J., Griffith, P., Gunshor, M. M., Daniels, J. M., Goodman, S. J., and Lebair, W. J.: NOAA's Advanced Baseline Imager on the GOES-R series: Operational and scientific applications, B. Am. Meteorol. Soc., 98, 681–698, https://doi.org/10.1175/BAMS-D-15-00230.1, 2017.
Schwieterman, E. W., Kiang, N. Y., Parenteau, M. N., Harman, C. E., DasSarma, S., Fisher, T. M., Arney, G. N., Hartnett, H. E., Reinhard, C. T., Olson, S. L., Meadows, V. S., Cockell, C. S., Walker, S. I., Grenfell, J. L., Hegde, S., Rugheimer, S., Hu, R., and Lyons, T. W.: Exoplanet biosignatures: A review of remotely detectable signs of life, Astrobiology, 18, 663–708, 2018.
Seignovert, B., Poulet, F., Langevin, Y., D'Aversa, E., Ligier, N., Mesbout, M., Leyrat, C., Le Mouélic, S., Stephan, K., Palumbo, P., Agostini, L., Pensa, L., Le Deit, L., Cornet, T., Belgacem, I., Costa, M., and Escalante Lopez, A.: MAJIS onboard geometric calibration during the early cruise phase, Ann. Geophys., in preparation, 2026.
Taylor, L. A., Pieters, C. M., Keller, L. P., Morris, R. V., McKay, D. S., and Wentworth, S. J.: Lunar mare and highland soils: A synthesis of compositional, mineralogical, and spectral properties, J. Geophys. Res.-Planets, 106, 27985–28000, https://doi.org/10.1029/2000JE001374, 2001.
Tinetti, G., Drossart, P., Eccleston, P., Hartogh, P., Heske, A., Leconte, J., Micela, G., Ollivier, M., Pilbratt, G., Puig, L., Turrini, D., Vandenbussche, B., Wolkenberg, P., Beaulieu, J.-P., Buchave, L. A., Ferus, M., Griffin, M., Guedel, M., Justtanont, K., Lagage, P.-O., Machado, P., Malaguti, G., Min, M., Nørgaard-Nielsen, H. U., Rataj, M., Ray, T., Ribas, I., Swain, M., Szabo, R., Werner, S., Barstow, J., Burleigh, M., Cho, J., Coudé du Foresto, V., Coustenis, A., Encrenaz, T., Galand, M., Gillon, M., Helled, R., Morales, J. C., García Muñoz, A., Moneti, A., Pagano, I., Pascale, E., Piccioni, G., Pinfield, D., Sarkar, S., Selsis, F., Tennyson, J., Triaud, A., Venot, O., Waldmann, I., Waltham, D., Wright, G., Amiaux, J., Auguères, J.-L., Berthé, M., Bezawada, N., Bishop, G., Bowles, N., Coffey, D., Colomé, J., Crook, M., Crouzet, P.-E., Da Peppo, V., Escudero Sanz, I., Focardi, M., Frericks, M., Hunt, T., Kohley, R., Middleton, K., Morgante, G., Ottensamer, R., Pace, E., Pearson, C., Stamper, R., Symonds, K., Rengel, M., Renotte, E., Ade, P., Affer, L., Alard, C., Allard, N., Altieri, F., André, Y., Arena, C., Argyriou, I., Aylward, A., Baccani, C., Bakos, G., Banaszkiewicz, M., Barlow, M., Batista, V., Bellucci, G., Benatti, S., Bernardi, P., Bézard, B., Blecka, M., Bolmont, E., Bonfond, B., Bonito, R., Bonomo, A. S., Brucato, J. R., Brun, A. S., Bryson, I., Bujwan, W., Casewell, S., Charnay, B., Cecchi Pestellini, C., Chen, G., Ciaravella, A., Claudi, R., Clédassou, R., Damasso, M., Damiano, M., Danielski, C., Deroo, P., Di Giorgio, A. M., Dominik, C., Doublier, V., Doyle, S., Doyon, R., Drummond, B., Duong, B., Eales, S., Edwards, B., Farina, M., Flaccomio, E., Fletcher, L., Forget, F., Fossey, S., Fränz, M., Fujii, Y., García-Piquer, Á., Gear, W., Geoffray, H., Gérard, J. C., Gesa, L., Gomez, H., Graczyk, R., Griffith, C., Grodent, D., Guarcello, M. G., Gustin, J., Hamano, K., Hargrave, P., Hello, Y., Heng, K., Herrero, E., Hornstrup, A., Hubert, B., Ida, S., Ikoma, M., Iro, N., Irwin, P., Jarchow, C., Jaubert, J., Jones, H., Julien, Q., Kameda, S., Kerschbaum, F., Kervella, P., Koskinen, T., Krijger, M., Krupp, N., Lafarga, M., Landini, F., Lellouch, E., Leto, G., Luntzer, A., Rank-Lüftinger, T., Maggio, A., Maldonado, J., Maillard, J.-P., Mall, U., Marquette, J.-B., Mathis, S., Maxted, P., Matsuo, T., Medvedev, A., Miguel, Y., Minier, V., Morello, G., Mura, A., Narita, N., Nascimbeni, V., Nguyen Tong, N., Noce, V., Oliva, F., Palle, E., Palmer, P., Pancrazzi, M., Papageorgiou, A., Parmentier, V., Perger, M., Petralia, A., Pezzuto, S., Pierrehumbert, R., Pillitteri, I., Piotto, G., Pisano, G., Prisinzano, L., Radioti, A., Réess, J.-M., Rezac, L., Rocchetto, M., Rosich, A., Sanna, N., Santerne, A., Savini, G., Scandariato, G., Sicardy, B., Sierra, C., Sindoni, G., Skup, K., Snellen, I., Sobiecki, M., Soret, L., Sozzetti, A., Stiepen, A., Strugarek, A., Taylor, J., Taylor, W., Terenzi, L., Tessenyi, M., Tsiaras, A., Tucker, C., Valencia, D., Vasisht, G., Vazan, A., Vilardell, F., Vinatier, S., Viti, S., Waters, R., Wawer, P., Wawrzaszek, A., Whitworth, A., Yung, Y. L., Yurchenko, S. N., Zapatero Osorio, M. R., Zellem, R., Zingales, T., and Zwart, F.: A chemical survey of exoplanets with ARIEL, Exp. Astron., 46, 135–209, https://doi.org/10.1007/s10686-018-9598-x, 2018.
Tompkins, S. and Pieters, C. M.: Spectral characteristics of lunar impact melts and inferred mineralogy, Meteorit. Planet. Sci., 45, 1152–1169, https://doi.org/10.1111/j.1945-5100.2010.01074.x, 2010.
Tosi, F., Capria, M. T., De Sanctis, M. C., Combe, J.-Ph., Zambon, F., Nathues, A., Schröder, S. E., Li, J.-Y., Palomba, E., Longobardo, A., Blewett, D. T., Denevi, B. W., Palmer, E., Capaccioni, F., Ammannito, E., Titus, T. M., Mittlefehldt, D. W., Sunshine, J. M., Russell, C. T., and Raymond, C. A.: Thermal measurements of dark and bright surface features on Vesta as derived from Dawn/VIR, Icarus, 240, 36–52, https://doi.org/10.1016/j.icarus.2014.03.017, 2014.
Tosi, F., Royer, C., Colaiuta, F., Poulet, F., Powell, T. M., Greenhagen, B. T., Langevin, Y., Mura, A., Piccioni, G., Pilorget, C., Carli, C., and Zambon, F.: The JUICE 2024 close flyby of the Moon: Thermal assessment from MAJIS, EGUsphere [preprint], https://doi.org/10.5194/egusphere-2025-6150, 2026.
Traub, W. A. and Jucks, K. W.: A possible aeronomy of exoplanets, in: Atmospheres of Early Earth and Planets, edited by: Mendillo, M., Nagy, A., and Waite, J. H., Springer, https://doi.org/10.1029/130GM25, 2002.
Vasavada, A. R., Paige, D. A., and Wood, S. E.: Near-surface temperatures on Mercury and the Moon and the stability of polar ice deposits, Icarus, 141, 179–193, 1999.
Veefkind, J. P., Aben, E. A. A., McMullan, K., Förster, H., de Vries, J., Otter, G., Claas, J., Eskes, H. J., de Haan, J. F., Kleipool, Q., van Weele, M., Hasekamp, O., Hoogeveen, R., Landgraf, J., Snel, R., Tol, P. J. J., Ingmann, P., Voors, R., Kruizinga, B., Vink, R., and Visser, H.: TROPOMI on the ESA Sentinel-5 Precursor: A GMES mission for global observations of the atmospheric composition for climate, air quality and ozone layer applications, Remote Sens. Environ., 120, 70–83, 2012.
Wei, J., Ren, T., Yang, P., DiMarco, S. F., and Mlawer, E.: An improved ocean surface albedo computational scheme: Structure and performance, J. Geophys. Res.-Oceans, 126, e2020JC016958, https://doi.org/10.1029/2020JC016958, 2021.
Wohlfarth, K., Wöhler, C., Hiesinger, H., and Helbert, J.: An advanced thermal roughness model for airless planetary bodies. Implications for global variations of lunar hydration and mineralogical mapping of Mercury with the MERTIS spectrometer, Astron. Astrophys., 674, A69, https://doi.org/10.1051/0004-6361/202245343, 2023.
Zambon, F., Altieri, F., De Sanctis, M. C., Le Mouélic, S., Piccioni, G., Poulet, F., Langevin, Y., Royer, C., Tosi, F., Karatekin, O., Mura, A., and Carli, C.: Spectral analysis of lunar regions observed by MAJIS during the JUICE Earth-Moon flyby, Ann. Geophys., submitted, 2026.
- Abstract
- Introduction
- Datasets description and processing
- Performance
- Lunar surface characteristics as revealed by MAJIS
- Insights into the Earth atmosphere
- Conclusion
- Data availability
- Author contributions
- Competing interests
- Disclaimer
- Special issue statement
- Acknowledgements
- Review statement
- References