
the Creative Commons Attribution 4.0 License.
the Creative Commons Attribution 4.0 License.
 | 20 Nov 2026
Mean Energy variation of Diffuse Aurora Observed with the ASIS Spectrograph
Gaël Cessateur

Keisuke Hosokawa
Hervé Lamy
Sota Nanjo
Mathieu Barthelemy
Magnar G. Johnsen
Romain Maggiolo
We analyze more than 20 000 spectra of diffuse aurora recorded by the ASIS spectrograph over two winters, focusing on events classified as diffuse by an AI-based system, with pulsating auroras forming an important but non-exclusive subgroup. Mean-energy proxies were derived from calibrated red/blue emission ratios using a lookup-table approach based on forward modeling. A Bayesian analysis shows that the precipitation systematically hardens toward the morning sector and confirms that this trend remains robust despite the large intrinsic variability of the dataset. A complementary hierarchical analysis performed at the night-by-night level further shows that the common MLT dependence remains present after accounting for systematic differences between observing nights. Although the strongest predictive support is obtained for a transition near 04:00 MLT, neighbouring transition times remain statistically plausible, indicating that the hardening does not occur at a uniquely defined MLT. Using the AE index as a proxy for geomagnetic activity, we further show that the statistical expression of the MLT-dependent hardening depends not only on the instantaneous activity level but also on geomagnetic conditions over the preceding hours. These results provide new spectroscopic constraints on the statistical evolution of diffuse-auroral precipitation hardness.
- Article
(3304 KB) - Full-text XML
- BibTeX
- EndNote


Diffuse auroras encompass a broad range of spatially extended auroral emissions, including several optical morphologies. Among them, pulsating auroras (PsAs) form an important subcategory and display quasi-periodic intensity modulations known as ON–OFF switching, with periods ranging from a few to several tens of seconds (Yamamoto, 1988; Royrvik and Davis, 1977). PsAs are typically observed in the post-midnight to morning sectors during the recovery phase of substorms and are typically associated with moderately disturbed geomagnetic conditions (Hosokawa and Ogawa, 2015; Partamies et al., 2017; Nishimura et al., 2010a). Early ground-based optical observations, combined with very-low-frequency (VLF) wave measurements, suggested that PsAs are produced by pitch-angle scattering of energetic electrons by whistler-mode chorus waves (e.g. Tsuruda et al., 1981; Ozaki et al., 2012). This interpretation has been firmly reinforced through numerous conjugate observations combining ground-based optical instruments and in-situ satellite measurements, establishing chorus-driven wave–particle interactions as a major mechanism producing PsAs (e.g. Nishimura et al., 2010b; Kasahara et al., 2018; Ozaki et al., 2019; Hosokawa et al., 2020).
Whistler-mode chorus waves are electromagnetic waves typically generated near the geomagnetic equator in the frequency range of 0.1 to 0.8 times the electron cyclotron frequency (), with a gap at 0.5 fce separating the lower and upper chorus bands. These waves propagate along magnetic field lines and can interact resonantly with energetic electrons through the cyclotron resonance condition:
where ω is the wave frequency, k∥ is the parallel wave number, v∥ is the electron velocity along the magnetic field, n is the resonance harmonic number (±1 for fundamental resonance), and is the Lorentz factor. Using a kinetic modeling approach based on bounce-averaged diffusion, Miyoshi et al. (2015) demonstrated that lower-band chorus waves preferentially resonate with higher-energy electrons, producing intermittent high-energy precipitation characteristic of PsAs, whereas upper-band chorus waves primarily generate more stable and softer diffuse precipitation. In addition to chorus waves, other plasma waves can also contribute to diffuse auroral precipitation. In particular, electrostatic electron cyclotron harmonic (ECH) waves have been shown to scatter electrons with energies of a few keV into the loss cone. In-situ observations by the Arase satellite revealed a statistically significant correlation between ECH wave activity near the magnetic equator and enhanced loss-cone electron fluxes at energies around several keV, sufficient to generate observable auroral emissions (Fukizawa et al., 2020). Although ECH waves are not considered the primary driver of PsAs, these results indicate that multiple wave modes may influence the energy distribution of electrons precipitating in diffuse auroral regions.
Extensive ground-based observations have provided important constraints on the spatial and temporal characteristics of PsAs and diffuse auroras. Incoherent-scatter radar measurements with the European Incoherent SCATter (EISCAT) radar have provided altitude-resolved electron density profiles during PsAs events, indicating multi-keV electron precipitation peaking near 100–110 km and significant ionospheric conductivity changes (Hosokawa and Ogawa, 2015). High-cadence optical observations using narrow-field photometers and high-speed cameras have resolved fine-scale temporal modulations and localized precipitation structures on spatial scales of a few to several tens of kilometers (Nishimura et al., 2010b; Nozawa et al., 2018). Wide-field all-sky imager (ASI) networks have documented the large-scale morphology, spatial structuring, and horizontal drift of diffuse and pulsating auroral forms over broad regions of the auroral oval, enabling statistical studies of their occurrence and evolution across MLT (Donovan et al., 2006; Nanjo et al., 2021; Hosokawa et al., 2023). These ASI observations primarily constrain auroral morphology and dynamics, without providing direct measurements of electron precipitation energy.
Satellite observations have also played a crucial role in establishing the magnetospheric origin of pulsating and diffuse auroral precipitation. Kasahara et al. (2018) provided direct in-situ evidence linking magnetospheric chorus-wave activity with electron precipitation causing PsAs, demonstrating a clear one-to-one correlation between lower-band chorus wave enhancements and corresponding electron flux modulations in the atmosphere. Specifically, Kasahara et al. (2018) observed a close temporal correlation between the spacecraft-measured magnetic wave power spectral density (PSD) of lower-band chorus waves and the flux of precipitating electrons in the loss cone. The observed correlation confirmed that lower-band chorus waves play a pivotal role in modulating both the flux and energy distribution of electrons precipitating into Earth's atmosphere, leading to the characteristic pulsating aurora emissions. Using high-speed ground-based optical cameras in conjunction with in-situ measurements from the Arase satellite, Hosokawa et al. (2020, 2023) demonstrated a clear temporal correspondence between fine-scale auroral luminosity modulations and magnetospheric wave-related electric-field fluctuations. Their results provide strong evidence for a causal link between magnetospheric wave–particle interactions and the modulation of auroral precipitation. Nanjo et al. (2023) also reported conjugate observations combining Arase measurements and all-sky imagers, revealing internal modulations within individual pulsating auroral patches and their close association with magnetospheric wave activity. These conjugate observations establish chorus-driven precipitation as a major mechanism for PsAs, although they do not imply that the broader diffuse-aurora population is associated with a single wave mode.
The characteristic energy of electron precipitation associated with PsAs typically spans the range from few hundred eV to several tens of keV, leading to enhanced emissions in the green oxygen line at 557.7 nm and the blue N band at 427.8 nm (Kawamura et al., 2020). Precipitating electrons with energies extending to several hundreds of keV have also been reported in association with PsAs, but their effects are primarily relevant to D-region ionization and chemistry rather than to the production of visible auroral emissions (Tesema et al., 2020). Several observational studies have suggested that both the peak emission altitude and the characteristic energy of precipitating electrons vary systematically with MLT, with a general trend toward harder precipitation and lower emission altitudes in the post-midnight and dawn sectors (Newell et al., 2009; Kawamura et al., 2020; Nanjo et al., 2021). From a magnetospheric perspective, changes in chorus wave properties with MLT provide one possible framework for interpreting this trend. In particular, Ito et al. (2024) showed that chorus waves observed in the dawn sector tend to occur in regions with lower local electron cyclotron frequencies and exhibit larger k∥ than those observed closer to midnight. These properties shift the resonance condition toward higher-energy electrons, helping to explain the increased mean precipitation energy. This effect arises not from the magnetic field strength B alone, but from the combined influence of wave parameters and plasma environment. In particular, a lower ratio of and a higher k∥ value tend to increase the resonant parallel velocity v∥ of the electron, i.e. selecting higher-energy electrons for interaction.
Despite the strong observational and theoretical evidence linking PsAs and diffuse auroral precipitation to wave–particle interactions, the systematic evolution of electron precipitation energy across MLT remains incompletely characterized. Most previous studies have relied on imaging or radar techniques that provide limited spectral information or indirect energy proxies. Continuous spectroscopic observations with sufficient temporal resolution remain comparatively scarce. In this study, we use high-cadence ground-based auroral spectroscopy to infer the mean energy of precipitating electrons using emission-line intensity ratios (Adachi et al., 2017), enabling a statistical investigation of energy variations as a function of magnetic local time for the broad diffuse-aurora population identified by the optical classifier, with pulsating auroras forming an important but non-exclusive subgroup.
2.1 Spectral Data
Auroral spectra were collected using the Auroral Spectrograph In Skibotn (ASIS), a high-cadence spectrograph located within the auroral zone at Skibotn Observatory (69.3° N, 20.4° E) of UiT-the Arctic University of Norway. Operational since October 2023, ASIS has a relatively wide field of view (FoV) of approximately 4°. Spectral intensity is integrated over the entire entrance slit, enhancing the signal, but limits spatial resolution. The instrument is fixed in an orientation aligned with the local geomagnetic field lines (elevation 77.2°, azimuth 182.8°) to optimize the detection of auroral emissions along the direction of electron precipitation. A 300 grooves mm−1 grating is used to record spectra throughout the 405–687 nm range, with a temporal resolution of 30 s, allowing detailed monitoring of auroral variability, taken only during the astronomical twilight (solar zenith angle > 102°). All spectra were calibrated in spectral radiance units (R nm−1). Emission intensities were then derived from the calibrated spectra: the blue N emission was obtained by integrating the spectrum over the 425–429 nm interval, after subtraction of a local continuum estimated as the mean signal in the adjacent 430–435 nm band. The red oxygen emission at 630 nm was calculated by integrating the continuum-subtracted spectrum over the 628–632 nm interval, where the local baseline was approximated by the mean of the intensities at the two edges of the integration window.
To ensure robust auroral spectra, only measurements with a blue-band intensity greater than 100 R were retained. This empirically defined threshold primarily suppresses background-dominated conditions and also removes very low-intensity auroral events, typically associated with weak and low-energy electron precipitation. The latter are not central to the present study, which focuses on relative variations of electron energy during well-developed auroral activity.
To identify spectra specifically corresponding to diffuse auroras, we employed the machine-learning-based classification method developed by Nanjo et al. (2022). This system uses color all-sky images captured every minute with an 8 s exposure by a Sony Alpha 6400 (ILCE-6400) camera equipped with a Meike MK-6.5mm F2.0 fisheye lens. The classifier distinguishes between several auroral categories: “Arc”, “Discrete”, “Diffuse”, “Noisy aurora”, and “No aurora”. The “No aurora” class includes cases in which no auroral emission is detected, under either clear-sky or cloudy conditions. The classifier is also designed to distinguish diffuse aurora from cloudy scenes and from weak background auroral structures. Figure 1 shows an example keogram for a typical night, from the 14 to the 15 December 2023, illustrating the temporal distribution of auroral emissions. Diffuse auroras are especially prominent in the dusk and dawn sectors.
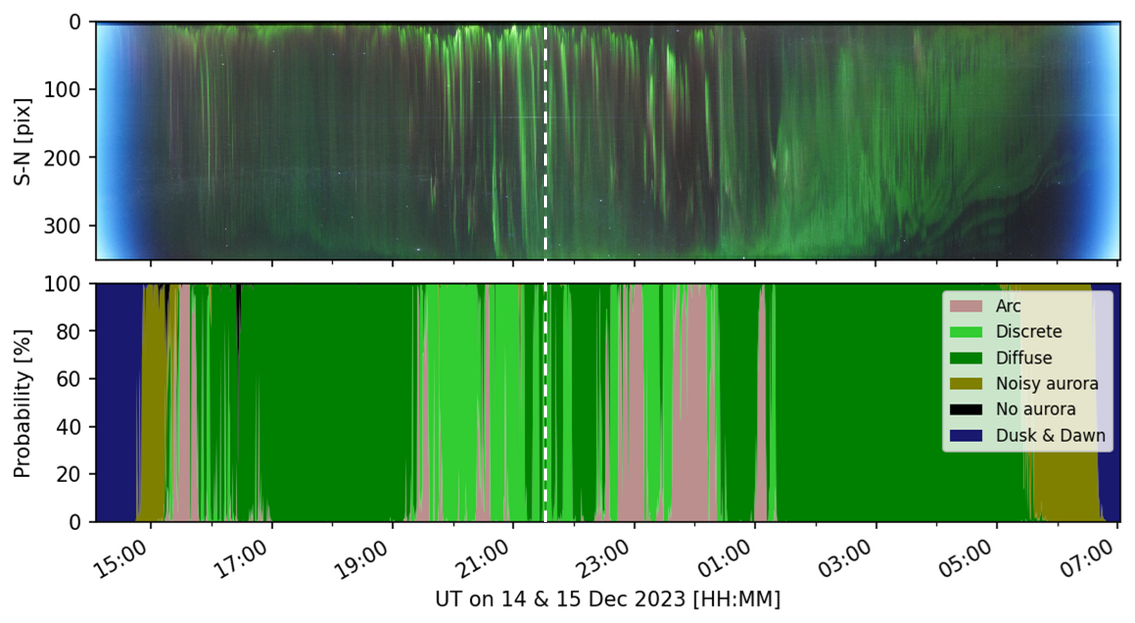
Figure 1Example keogram for 14–15 December 2023 showing the temporal evolution of auroral emissions (top panel) and the corresponding AI-based auroral-classification probabilities (bottom panel). Only intervals labeled as “Diffuse” with classification confidence greater than 75 % and lasting at least 5 min were retained for analysis. Vertical white dashed-line represents the magnetic midnight.
According to Nanjo et al. (2022), diffuse auroras are characterized by spatially extended, weakly structured emissions, distinct from discrete and highly structured auroral forms. Within this general class, several subtypes have been identified in previous studies (e.g. Nishimura et al., 2020; Grono and Donovan, 2018): (i) Pulsating auroras (PsAs), showing quasi-periodic luminosity modulations on timescales of a few to tens of seconds; (ii) Patchy diffuse auroras, consisting of stable or slowly varying emission patches often drifting with magnetospheric convection; (iii) Amorphous diffuse auroras, characterized by unstructured, irregular luminosity without obvious periodicity; and (iv) Diffuse veiling auroras, broad and faint luminosity layers forming a background to other types. In the present study, we consider all these types collectively as “diffuse aurora,” with pulsating auroras forming a major but not exclusive subgroup.
A total of more than 20 000 spectra were analyzed from October 2023 to March 2024, then October 2024 to March 2025. Only time intervals classified as “Diffuse” with a confidence level greater than 75 % and lasting at least 5 min were selected for further analysis, ensuring that the data set reflects stable and well-identified diffuse auroral activity. We do have more than 1000 events per month, except for February 2024 and March 2025 which were predominantly cloudy.
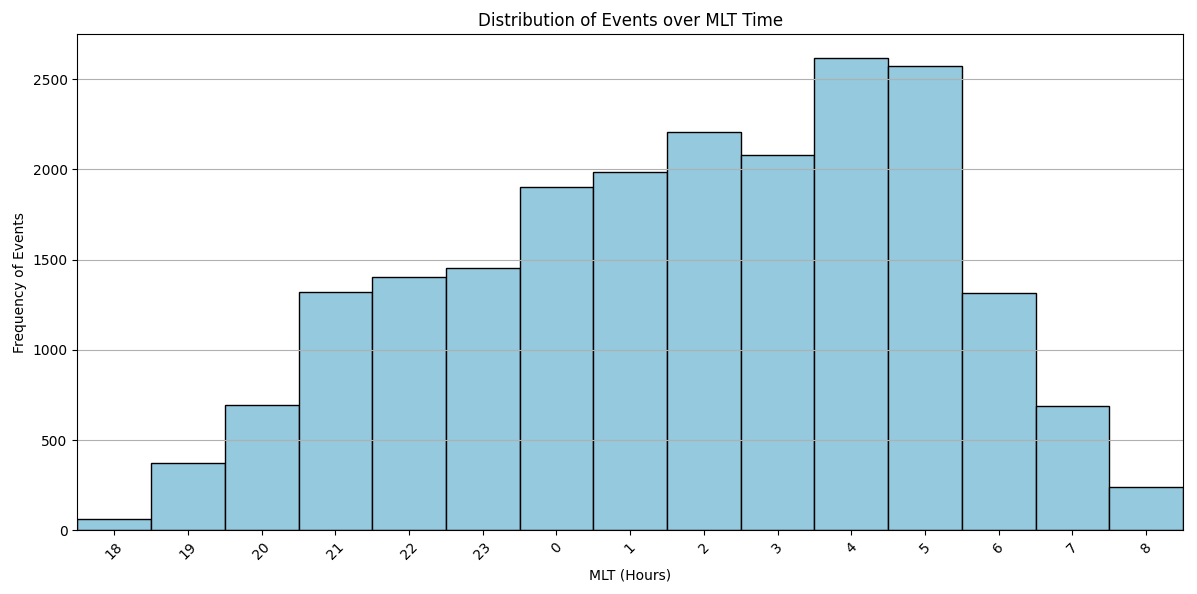
Figure 2 represents the number of individual spectra classified as diffuse auroras, distributed per hourly binned MLT, approximated here as UT+2.5 h for the Skibotn observatory location. Diffuse auroras occur throughout the entire night, with a slightly higher occurrence in the morning sector than in the evening sector. Nevertheless, the number of events remains significant across all MLT bins, exceeding 500 events per bin between 20:00 and 07:00 MLT.
2.2 Energy Inference via Line Ratio
The mean energy of precipitating electrons is estimated using the look-up tables provided by Adachi et al. (2017), which assume a Maxwellian electron energy distribution and are based on kinetic electron transport modeling with the “GLobal airglOW model” (GLOW) (Solomon, 2017). The intensity ratio between the red (630.0 nm) and blue (427.8 nm) auroral lines, as shown in Fig. 1 from Adachi et al. (2017), serves as a proxy for the mean electron energy, and higher ratios indicate softer precipitation within the framework of the lookup-table models. We also tried another kinetic electron transport model, Transsolo (Barthelemy et al., 2025) with a monoenergetic precipitating electron flux, using up to 32 streams, while GLOW uses only 2 streams. In these kinetic transport models, a “stream” denotes a discrete propagation direction used to represent the angular distribution of the electron flux. A two-stream approximation considers one upward and one downward flux, whereas a 32-stream treatment resolves 16 upward and 16 downward directions, with the angular redistribution of electrons described by the scattering phase function. These models are stationary and are therefore only valid where the quasi-steady-state hypothesis holds, such as in quiet steady arcs and diffuse auroras (Adachi et al., 2017). Throughout this study, the term “mean energy” refers to the energy parameter inferred from this red-to-blue ratio within the assumed incident electron distribution and transport-model framework. It should therefore be regarded as an effective proxy for precipitation hardness rather than as a direct measurement of the true mean energy of an arbitrary electron distribution.
Figure 3 shows two representative ASIS spectra acquired during the same night as Fig. 1. The first spectrum was recorded before midnight, at 18:10:11 UT on 14 December, while the second was obtained after midnight, at 02:54:16 UT on 15 December. These two spectra illustrate the marked spectral differences observed between the early evening and post-midnight periods. Using the red-to-blue intensity ratio and the lookup-table method, the characteristic electron energy is estimated to be approximately 2.5 keV before midnight, with red and blue emissions of about 1700 and 720 R, respectively. After midnight, the inferred characteristic energy increases to roughly 6.2 keV, corresponding to red and blue emissions of approximately 2430 and 3800 R. In the higher-energy case, the N First Negative (1N) system becomes more pronounced: the (0–1) band at 427.8 nm and the (0–2) band near 470.9 nm both intensify, together with the N2 Meinel band emissions between 650 and 680 nm. These features are characteristic signatures of increased electron energies in auroral precipitation.
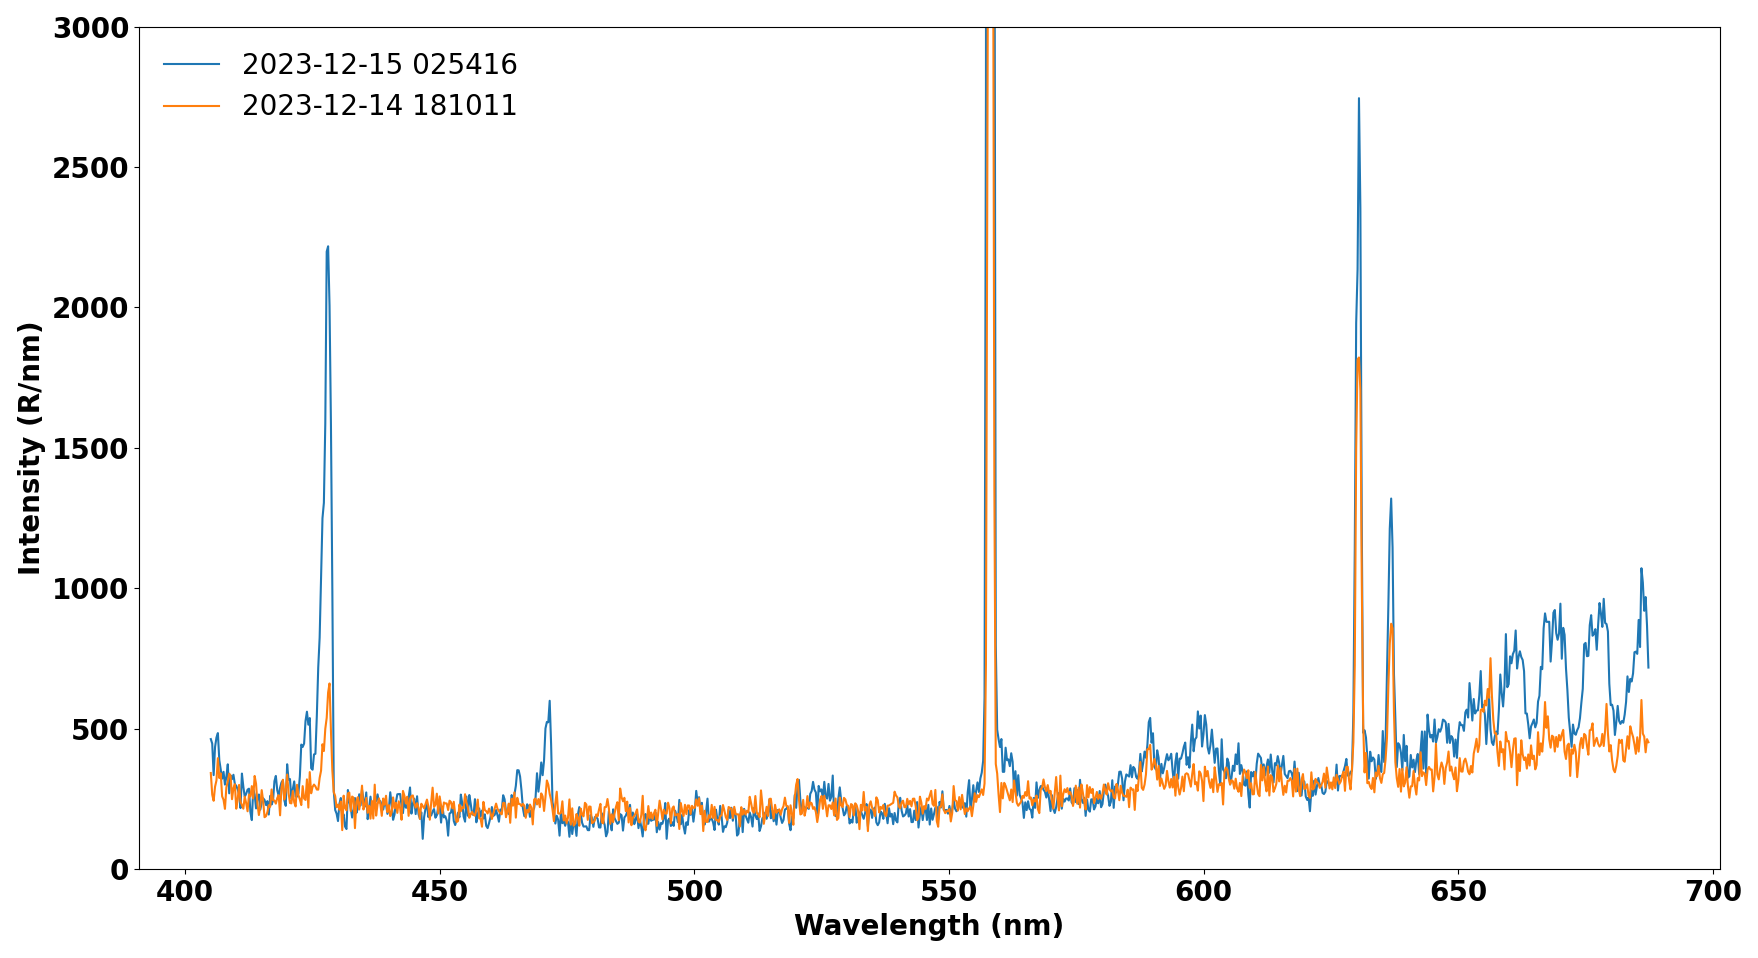
Figure 3Two example ASIS spectra from the same night, showing a pre-midnight (softer in orange) and post-midnight (harder in blue) precipitation event.
Figure 4 shows the estimated characteristic average energy for the same night, for both GLOW (in blue) and TRANSSOLO (in green) approaches. While the latter approach underestimates the average energy, both approaches share the same variability, highlighting the differences between the dusk and dawn sectors in this specific night case. While the absolute value might differ, the variability trend over the night should be consistent with both approaches. We then limit ourselves to the mean energy estimation using the look-up tables provided by Adachi et al. (2017). Figure 4, panel d, shows the external magnetic field variations at the nearby Tromsø Magnetic Observatory. The variations show that our observations are performed below the eastward electrojet prior to about 20:00 UT, where the change of sign indicates transition through the Harang discontinuity. Several small negative bays are seen indicating substorm or pseudo breakup activity, before the station sees clear westward electrojet conditions after 00:00 UT. The amplitudes of the magnetic activity (±100–150 nT) taken into account, this may be considered an “ordinary” or quiet time event within the statistical auroral oval.
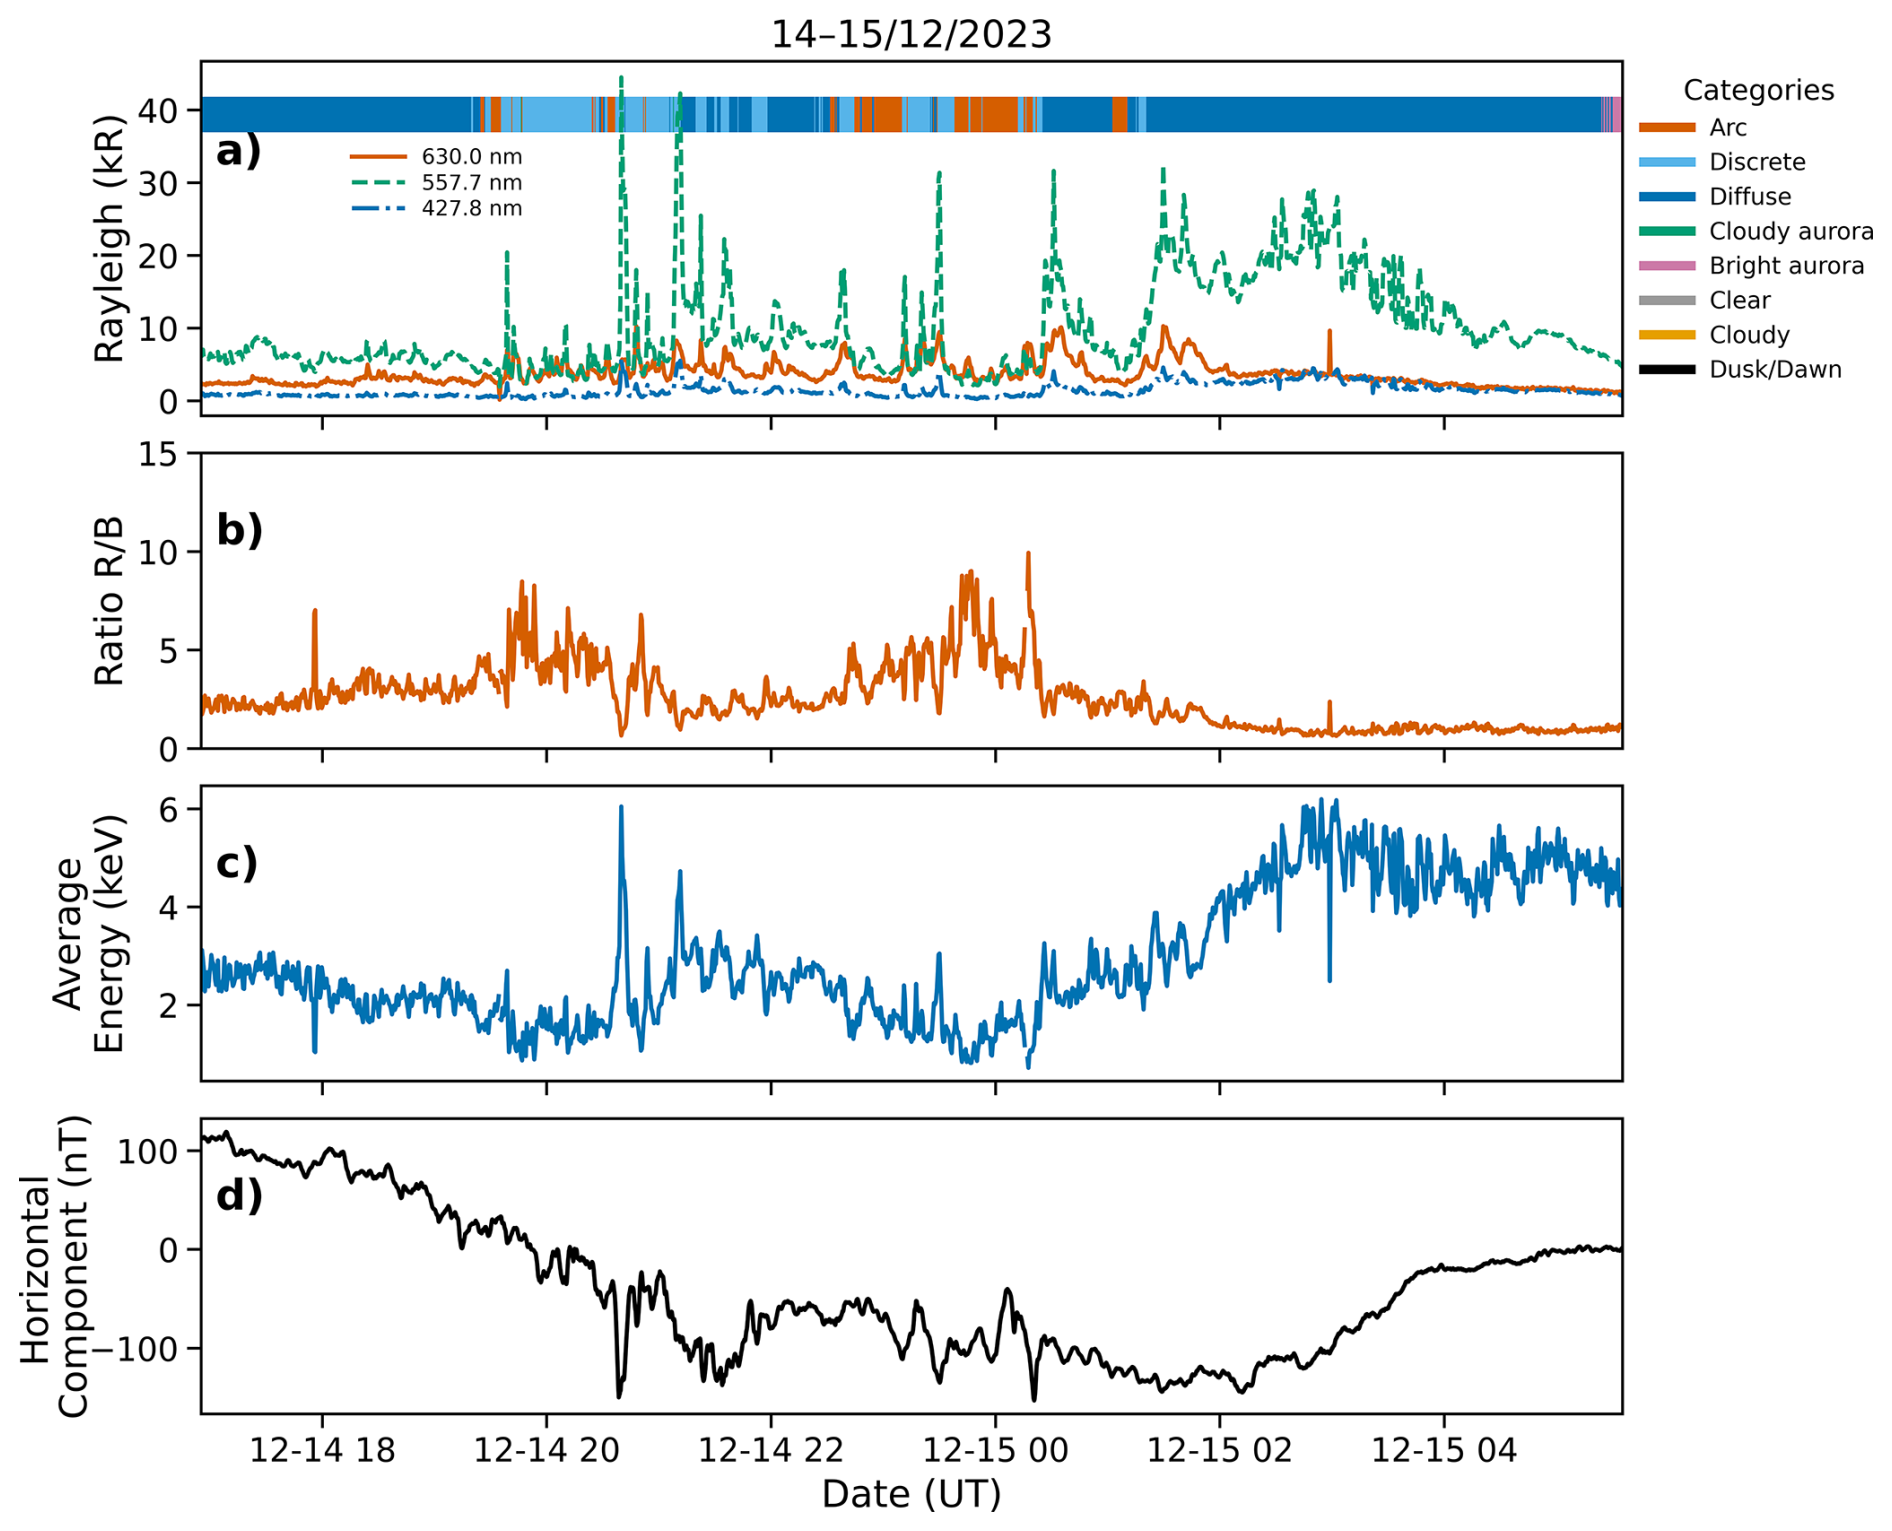
Figure 4Results from ASIS for 14–15 December 2023. Panel (a): green (557.7 nm), red-doublet (630/636 nm), and blue (427.8 nm) intensities, together with the AI-based morphology classification from Nanjo et al. (2022); Panel (b): ratio between the 630 nm line emission and the 427.8 nm. Panel (c): average energy using the look-up table from Adachi et al. (2017) in blue, and from Barthelemy et al. (2025) in green. Panel (d): magnetic disturbance horizontal component from Tromsø magnetic observatory.
Note also that diffuse auroras are classified only when bright external sources (e.g., Moon or twilight) are absent, so the selected diffuse events are naturally free from such contamination and the red/blue ratio remains unaffected. However, this selection implies that the sample includes a mixture of diffuse auroral subtypes rather than exclusively pulsating auroras, so the inferred mean energies should be interpreted as effective averages over this mixed population. In addition, the 30 s integration time of the spectrograph averages over on–off pulsation cycles, which further reduces the apparent amplitude of the high-energy phases. Both effects probably lead to an underestimate of the true characteristic energy of the pulsating components, while preserving the statistical variability.
3.1 Statistical Distribution of Median Energy with MLT
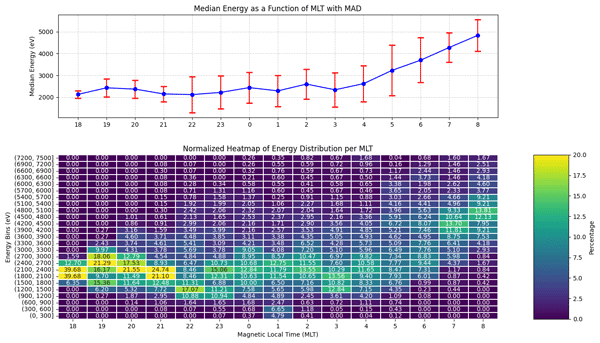
Figure 5 summarizes the statistical evolution of the median of the mean-energy as a function of magnetic local time (MLT). The lower panel shows the normalized distribution of median electron energy, binned in 300 eV intervals from 0.3 to 7.5 keV, while the upper panel displays the corresponding median energy and its variability, estimated using the median absolute deviation (MAD). The color scale in the heatmap represents the relative occurrence frequency of each energy bin within a given MLT hour. The use of the MAD instead of the standard deviation reflects the strongly non-Gaussian and asymmetric distribution of the inferred mean electron energies across the ensemble of spectra, resulting from the mixture of different diffuse auroral regimes (e.g. diffuse, pulsating, or patchy). The MAD thus provides a more robust measure of dispersion and limits the influence of occasional high-energy events.
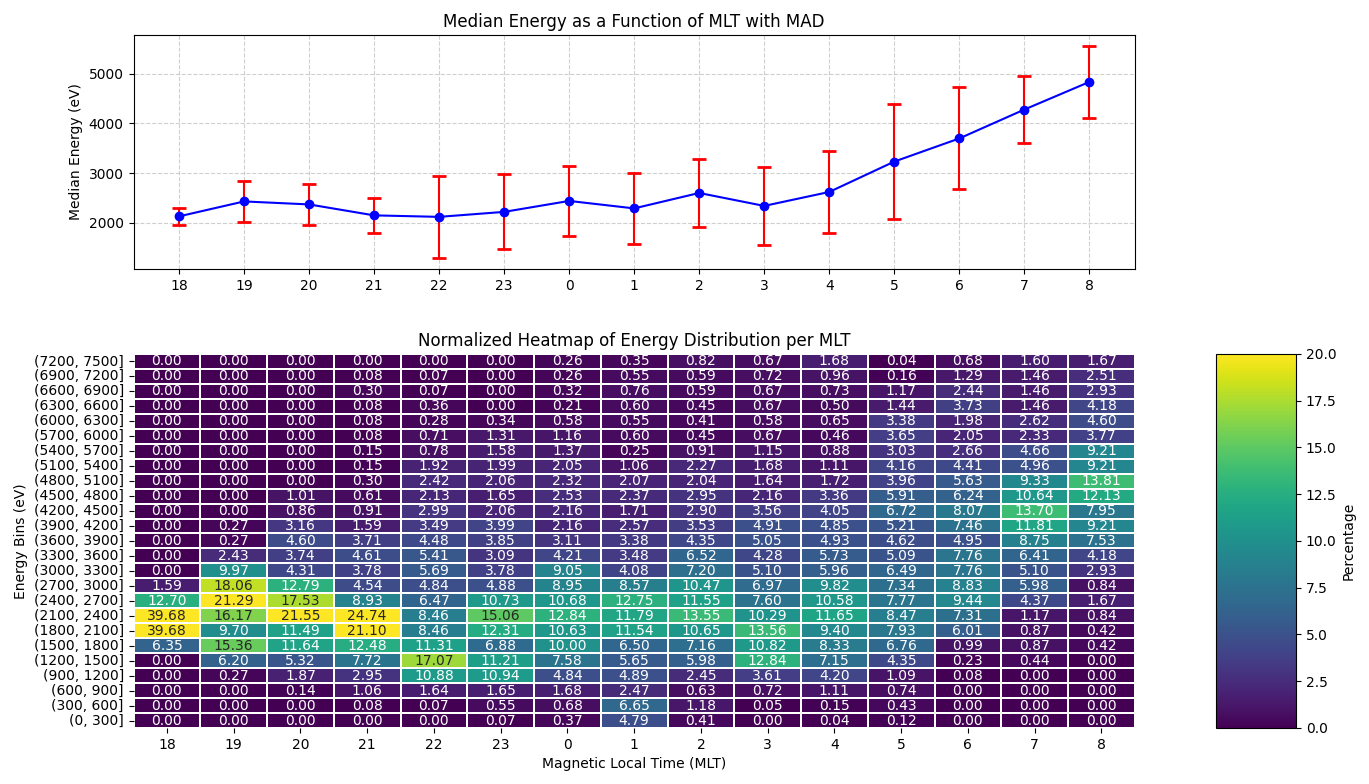
Figure 5Top: median of the mean energy versus MLT with robust dispersion (MAD-based). Bottom: normalized energy–MLT heat map showing the progressive post-midnight hardening.
Between 18:00 MLT and midnight, the emission is dominated by sub-3 keV electrons, with a strong occurrence peak near 2–2.5 keV. After midnight, the median energy progressively increases, with occurrence between 3 and 5 keV, peaking between 06:00 and 08:00 MLT. This trend indicates a systematic hardening of the electron population toward the dawn sector. The width of the distribution, represented by the MAD, remains fairly consistent throughout the night, indicating that the overall variability in precipitation energy does not change substantially with MLT. However, a slight enhancement in dispersion is visible near 05:00–06:00 MLT, possibly reflecting a more heterogeneous mix of auroral forms between patchy and non-patchy auroras (Ito et al., 2024).
3.2 Bayesian Assessment of the Energy Hardening
To quantitatively assess whether the observed increase in median energy represents a statistically significant trend, we applied a Bayesian piecewise linear regression model:
where xm is the MLT coordinate and xbp is the breakpoint defined here for 04:00 MLT. The Bayesian framework was chosen because it allows for a probabilistic characterization of trends without relying on Gaussian assumptions or symmetric error distributions. Unlike classical regressions that return a single best-fit slope, the Bayesian approach provides a full posterior distribution for each parameter, quantifying the confidence that the observed energy increase is genuine or not. The goal is therefore to estimate the posterior distribution of the regression coefficients and the dispersion term (σy), according to Bayes’ theorem:
Here, the likelihood
expresses the probability of observing the data given a particular set of parameters, including the term representing the observational scatter around the median. The energy distributions are markedly non-Gaussian, since we are mixing different auroral events, its value was not estimated as a standard deviation. Instead, a robust scale estimator was used, defined as 1.4826 MAD, which corresponds to the Gaussian-equivalent standard deviation (Rousseeuw and Croux, 1993). The prior term
encodes weak prior knowledge about the parameters, serving mainly to regularize the inference and constrain the model to physically reasonable ranges, according to Fig. 5. In this study, we used broad normal priors centered on plausible physical values
and
which allows the data to dominate the posterior.
Posterior estimation was performed using the No-U-Turn Sampler (NUTS), a gradient-based Markov Chain Monte Carlo (MCMC) algorithm implemented in PyMC. Each iteration proposes new values of the parameters conditional on the data: candidate sets that better reproduce the observed median energies under the normal likelihood are assigned a higher posterior probability. After 8000 iterations, the Markov chain converges toward the stationary posterior distribution, where the frequency of sampled parameter values reflects their relative plausibility.
Figure 6 illustrates the Bayesian analysis of the median electron energy as a function of magnetic local time (MLT). The left panel shows the observed median energies (black points, with robust dispersion σ=1.4826 × MAD as vertical bars) and the posterior median energy trend (blue line), together with its 95 % credible interval (blue shading). The right panel displays the posterior distribution of the slope β2, which quantifies the change in the energy–MLT slope after the 04:00 MLT break point.
The inferred posterior median slope increment is β2=455 ± 246 eV per MLT, with a 95 % highest-density interval (HDI) spanning from −14 to 944 eV per MLT. The posterior probability of a positive slope, indicates that an increase in the median energy after the breakpoint is strongly supported, although the 95 % HDI marginally includes zero. This indicates a strong likelihood that the median electron energy increases systematically after the 04:00 MLT. Indeed, this analysis therefore supports the interpretation that the dawnside hardening of the electron precipitation is not an artifact of statistical dispersion, but a genuine physical feature of the nightside-to-dawn transition. Quantitatively, the inferred trend corresponds to an approximate doubling of the median energy between midnight (≈2.5 keV) and 08:00 MLT (≈5 keV).
The 08:00 MLT bin should, however, be interpreted with caution, since the number of events is relatively low compared with the other bins. We performed a sensitivity test by excluding the 08:00 MLT bin from the analysis. The post-midnight hardening remains present, with , compared to 0.97 when including this bin. This demonstrates that the late-dawn observations strengthen the statistical constraint but do not artificially generate the trend.
We also performed an additional sensitivity test by retaining only spectra acquired under strict astronomical-night conditions, defined here as solar zenith angle larger than 108° (Sun more than 18° below the horizon) to avoid any potential contamination. This filtering reduces the number of late-dawn events, especially in the 08:00 MLT bin. The Bayesian fit applied to this restricted dataset gives , compared with 0.97 in the original full-dataset analysis. Any residual high-altitude contribution to the 630.0 nm red-line emission would increase the red-to-blue ratio. In the lookup-table framework used here, this would bias the inferred characteristic energy toward lower values. Such an effect would therefore not explain an artificial increase of the inferred energy toward late dawn.
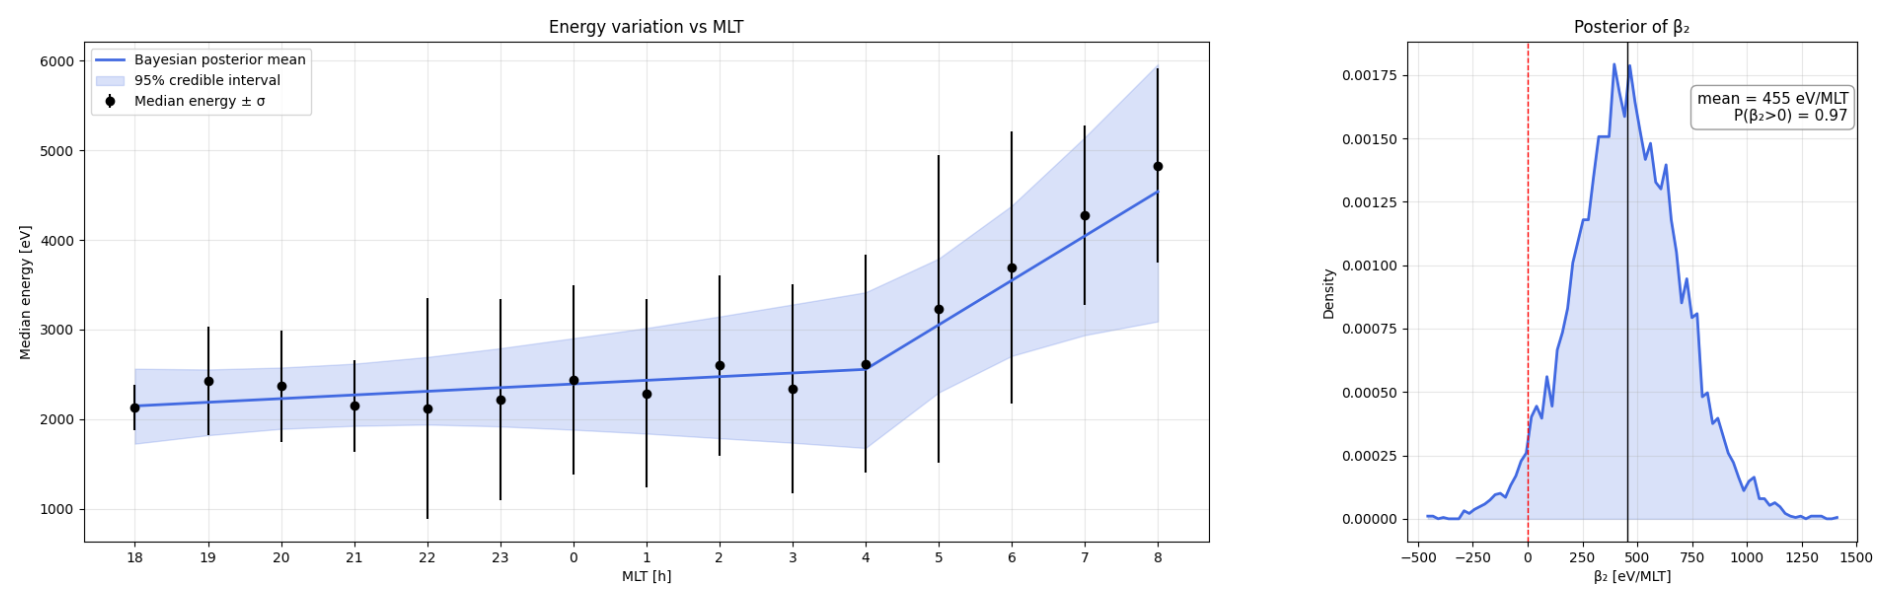
Figure 6Bayesian regression of the MLT-dependent energy trend. Left: posterior median and 95 % credible interval. Right: posterior distribution of the post-breakpoint slope parameter β2
3.3 Hierarchical assessment of night-to-night variability
The analysis presented in the previous Sect. 3.2 is based on one median energy and one MAD-based dispersion for each MLT bin. This provides a robust description of the overall population, but it removes the night-to-night structure of the observations. In particular, it does not distinguish between nights that are systematically harder or softer and variations occurring within individual nights. We therefore performed an additional hierarchical Bayesian analysis based on the median inferred energy calculated separately for each observing night and each MLT bin.
The dataset provides sufficient night-to-night coverage for this analysis: between 22:00 and 06:00 MLT, each hourly bin contains observations from more than 20 independent nights and typically more than 1000 individual spectra. The coverage is highest between 00:00 and 05:00 MLT, where 34–38 nights and approximately 1900–2600 spectra contribute to each MLT bin. Individual nights do not necessarily cover the complete MLT range, but there is substantial overlap between nights across the central MLT interval. This overlap is important because it allows a common MLT dependence to be separated from systematic differences between observing nights. The edge bins, especially before 21:00 MLT and after 07:00 MLT, have lower coverage and are therefore interpreted more cautiously.
For a given night n and MLT bin m, the expected mean energy is written as
where xm is the MLT coordinate and xbp is a fixed candidate breakpoint. Before the breakpoint, the slope is β1. After the breakpoint, the slope becomes β1+β2. The parameter an is a night-specific offset,
For nights represented by only a few MLT bins, an is more strongly constrained by this population distribution and is therefore pulled toward zero, which is the mean offset by construction. Conversely, when several MLT bins from the same night consistently lie above or below the common profile, the data can support a larger positive or negative value of an.
The observed night–MLT median energy is then described as
where σres describes the remaining dispersion after both the common MLT dependence and the night-specific offsets have been taken into account.
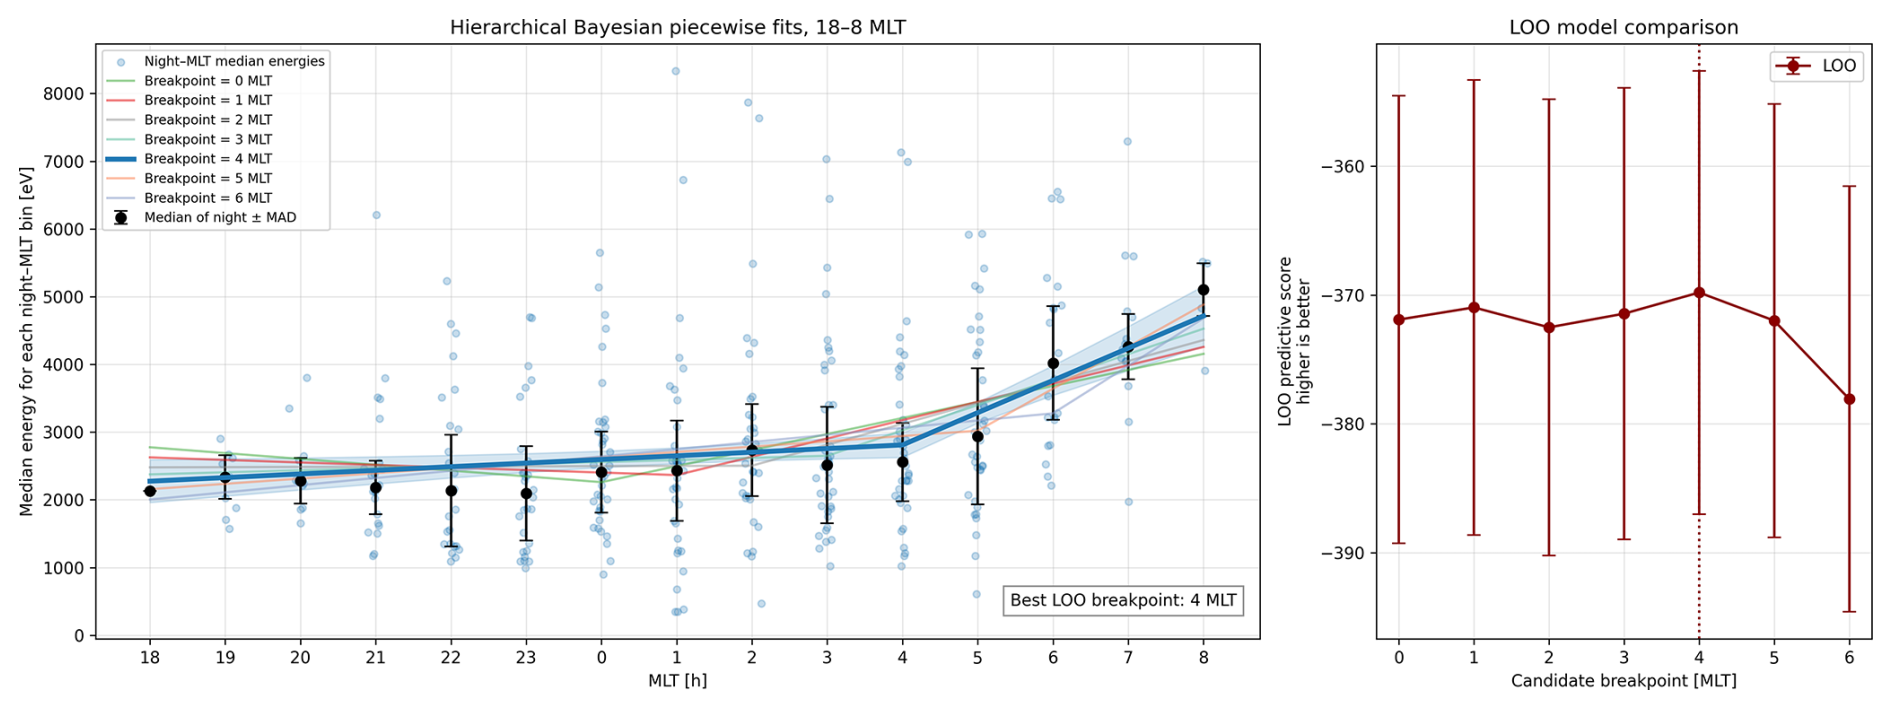
Figure 7Hierarchical Bayesian breakpoint analysis using night-MLT median energies. Left: piecewise fits for several candidate breakpoints. Right: model comparison using leave-one-out cross-validation (LOO), showing the strongest predictive support for a breakpoint near 04:00 MLT, although neighbouring values remain statistically plausible.
This formulation separates two levels of variability that are combined in the MAD values of the population-level analysis from Sect. 3.2. For all tested candidate breakpoints, the night-to-night dispersion is approximately σnight≃1.0 keV. Thus, some observing nights are systematically harder or softer than others. A substantial residual dispersion of approximately σres≃0.85 keV remains after these night-specific offsets and the common MLT dependence are removed. This residual should not be interpreted as measurement noise alone. It can also include differences in the detailed MLT evolution from one night to another, short-term changes in precipitation conditions, differences between diffuse auroral morphologies, and uncertainties associated with the mean energy. The important result is that the common morning-sector hardening remains visible despite these large sources of variability.
We also tested the sensitivity of the hierarchical model to the assumed transition time by fixing the breakpoint between 00:00 and 06:00 MLT (Fig. 7). The different breakpoint models adjust their slopes to reproduce the same overall increase toward the morning sector. The slope values alone therefore cannot be used to identify the transition time. We instead compared the models using leave-one-out cross-validation (LOO), which tests their ability to predict individual night–MLT median energies omitted from the fit. The highest predictive score is obtained for a breakpoint near 04:00 MLT. However, neighbouring breakpoints remain statistically plausible. We therefore use 04:00 MLT as a representative description of the observed curvature, rather than as a sharply defined physical onset.
The broad range of plausible transition times can have several origins. First, the diffuse-aurora population contains different optical subtypes, which may not follow exactly the same MLT evolution. Mixing these populations may therefore broaden the apparent transition. However, separating optical subtypes should not be interpreted as separating the underlying magnetospheric scattering mechanisms. The correspondence between auroral morphology and wave mode is not one-to-one, and both the occurrence of optical subtypes and the possible contribution of different wave modes can evolve with MLT. In particular, pulsating auroral emissions have been associated not only with chorus waves but also with ECH waves (Fukizawa et al., 2018). A subtype-resolved analysis would therefore provide a more homogeneous optical population, but not necessarily a uniquely defined precipitation mechanism.
Second, the timing of the hardening may differ from one night to another. The present model allows each night to have a different overall energy level through an, but it assumes the same MLT dependence and the same breakpoint for all nights. Differences in the timing or shape of the evolution therefore contribute to σres. Finally, the population-level evolution may itself be gradual, rather than characterized by a unique physical breakpoint. A smooth increase can be represented almost equally well by several piecewise-linear models with different transition times. These effects cannot be separated unambiguously with the present dataset and may occur together.
An exploratory check using the higher-cadence EMBLA observations (Whiter et al., 2024) was performed to test whether the observed morning-sector hardening could primarily result from mixing different diffuse-aurora subtypes. The temporal overlap is limited to about ten nights and does not allow a statistically representative PsA-only reanalysis of the complete dataset. Nevertheless, the manually selected intervals showing clear pulsating behaviour exhibit the same qualitative increase of inferred energy toward the morning sector as the full diffuse sample restricted to the same nights (Appendix A). This comparison therefore argues against subtype mixing being the primary origin of the observed dawnside hardening. Subtype mixing may contribute to the residual dispersion and may broaden the apparent transition region, but the available PsA-only observations indicate that the common MLT trend persists when a more homogeneous pulsating population is considered.
The present result is consistent with previous observations of pulsating aurora. In particular, Kawamura et al. (2020) reported a decrease in the emission altitude toward the morning sector, especially after approximately 06:00 MLT, using observations from 37 nights. Their analysis was based on the distribution, mean, and standard deviation of pulsating-aurora intervals in MLT bins. The main contribution of the present hierarchical analysis is therefore not the qualitative identification of a morning-sector hardening, which has been reported previously. Instead, it shows that this common MLT evolution remains detectable after systematic differences between observing nights are explicitly taken into account. It also quantifies, separately, the night-to-night variability and the residual variability around the common MLT evolution.
Finally, the absolute inferred energies must still be interpreted in view of the observational and modelling limitations discussed in Sect. 2.2. Spatial and temporal averaging caused by the small field of view and the 30 s exposure time can mix different diffuse structures and smooth short-timescale variations. In addition, the red-to-blue line ratio does not provide the true mean energy of an arbitrary precipitating electron distribution in a strict kinetic sense. The retrieved quantity is better regarded as an effective characteristic-energy proxy within the assumed incident distribution and transport-model framework. Tests with different incident distributions modify the absolute energy scale but preserve the qualitative MLT dependence. The results presented here should therefore primarily be interpreted as statistical constraints on the evolution of the hardness of the precipitation. Future work using full-spectrum modelling and altitude-dependent radiative transfer could provide more quantitative estimates of characteristic energy and energy flux, as performed by Barthelemy et al. (2025).
The Auroral Electrojet (AE) index is a standard geomagnetic indicator of substorm activity in the auroral zone (Akasofu, 1964; Davis and Sugiura, 1966). While AE is a global rather than local index, it remains a widely used proxy for magnetospheric activity in statistical analyses. In this study, AE values were obtained from the World Data Center for Geomagnetism, Kyoto (https://wdc.kugi.kyoto-u.ac.jp, last access: 16 November 2026), with a time resolution of 1 min. For each 30 s spectrograph measurement, the corresponding AE value was obtained using a nearest-neighbor approach, taking advantage of the smooth temporal variability of the 1 min AE index, which has an autocorrelation time of 285 min (Maggiolo et al., 2017).
Meredith et al. (2020) showed that the magnetic amplitude of whistler-mode chorus increases markedly with AE, showing a statistical association between geomagnetic activity and chorus wave intensity. This provides a motivation for examining whether the MLT-dependent hardening identified in the ASIS observations varies with geomagnetic activity. However, in the present study, AE is used only as a proxy for the broader geomagnetic context and not as a diagnostic of a particular wave mode or precipitation mechanism. The AE index (1 min cadence) was therefore used to categorize geomagnetic activity into three bins: a ”quiet” state for AE < 100 nT, an ”intermediate” or weakly disturbed state for 100–300 nT, and an “active” regime for AE > 300 nT, following the approach of Meredith et al. (2020).
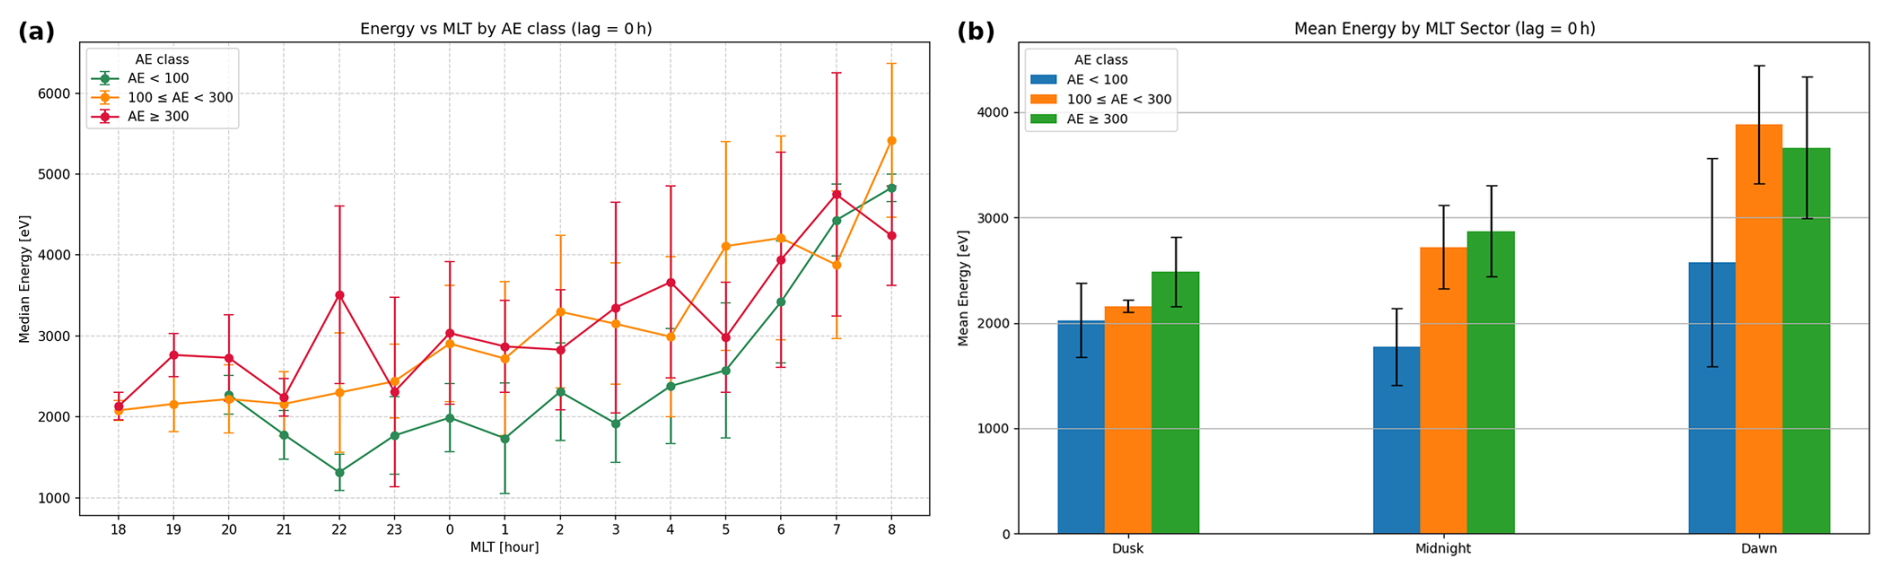
Figure 8MLT dependence of diffuse-aurora precipitation energy under three geomagnetic activity levels. Panel (a) shows hourly median energies; panel (b) shows the sector-averaged median energies.
4.1 Instantaneous AE
Figure 8 shows the median of the mean energy as a function of MLT for the three AE classes without temporal lag, with 8167, 8177, and 4613 spectra for AE<100, , and AE≥300 nT, respectively. To quantify the MLT dependence within each activity class, we use the Bayesian piecewise regression framework introduced in Sect. 3.2, applied separately to the median energy in each MLT bin. The night-by-night hierarchical model of Sect. 3.3 is not used here because separating the observations according to instantaneous AE fragments the MLT coverage of individual nights between different activity classes. Since the purpose here is to assess whether the population-level MLT dependence remains present under different geomagnetic conditions, the simpler median-based framework is sufficient.
For AE < 100 nT, the increase in the median toward the dawn sector is the clearest and most consistent. The Bayesian analysis yields a posterior probability (Table 1), indicating a robust post-breakpoint hardening.
One possible interpretation is that, under quieter geomagnetic conditions, the diffuse-aurora sample is less affected by precipitation associated with injections and other dynamically structured events near midnight, allowing the underlying MLT dependence to emerge more clearly.
For 100 ≤ AE < 300 nT, the trend remains visible but is noticeably less pronounced with . For AE ≥ 300 nT, the relation becomes more scattered, with . The increased dispersion at higher AE may partly reflect the broader range of precipitation conditions encountered during disturbed periods.
To further reduce the noise introduced by hour-by-hour variability, the observations were also grouped into three broad MLT sectors: dusk (18 ≤ MLT < 22), midnight (22 ≤ MLT < 3), and dawn (3 ≤ MLT ≤ 8). The corresponding sector-averaged median energies for each AE class are presented in Fig. 8. This sector-based view confirms that, for all AE classes, the highest median of the mean energies are consistently observed in the dawn sector, reflecting a persistent MLT-dependent hardening.
Table 1Bayesian inference of the post-breakpoint energy increase (slope parameter β2) for the three AE activity classes, using the median energy per MLT bin. The uncertainties correspond to the standard deviation of the posterior samples, and the last column reports the 95 % highest-density interval (HDI).

4.2 AE over preceding time intervals
To test whether the observed MLT-dependent hardening depends only on the instantaneous geomagnetic context, we also examined the AE index over preceding intervals of 2 and 6 h relative to each spectrograph measurement. This extends the type of analysis proposed by Hosokawa and Ogawa (2015) to a continuous spectroscopic dataset, while keeping AE as a proxy of geomagnetic context rather than as a diagnostic of the underlying scattering mechanism. The main result is that the post-midnight hardening remains visible even when the activity level is defined from AE over the preceding hours rather than from AE at the exact observation time.
For a 2 h preceding interval, the number of events classified as quiet (AE < 100 nT) drops from 8167 to 2596. This indicates that many spectra recorded under low instantaneous AE are in fact preceded within the previous two hours by enhanced geomagnetic activity. As a consequence, the Bayesian posterior probability for a positive slope in the AE < 100 nT class decreases from 0.996 for the instantaneous AE case to about 0.75, while the class 100 ≤ AE < 300 nT shows a strengthened slope with . This redistribution does not contradict the main trend; rather, it shows that many intervals with low instantaneous AE do not correspond to genuinely quiet conditions, but to a magnetospheric context still influenced by earlier activity. Intervals that remain in the AE < 100 nT class even with a 2 h preceding interval therefore represent weakly preconditioned conditions, for which the positive energy–MLT trend is less clearly expressed.
For a 6 h preceding interval, consistent with the timescale used by Hosokawa and Ogawa (2015) to characterize preceding substorm activity, the redistribution of events among AE classes becomes even more pronounced. In particular, the number of events classified as AE < 100 nT is strongly reduced, indicating that most intervals with low instantaneous AE are preceded by enhanced geomagnetic activity within the previous several hours. At this timescale, the AE-based classification becomes less discriminant, especially for the quiet class. Nevertheless, the post-midnight hardening remains visible. The trend is strongest for intermediate AE levels, with , and more dispersed for highly active periods ().
Overall, these results show that the MLT-dependent hardening is not captured by instantaneous AE alone, and that its statistical expression depends on the broader geomagnetic context over timescales of several hours. In this sense, the AE analysis is used here to test the robustness of the spectroscopic MLT trend under different activity conditions, rather than to distinguish between specific precipitation mechanisms.
This study provides a statistical characterization of the evolution of the characteristic electron precipitation energy as a function of magnetic local time (MLT) for diffuse auroras, including pulsating auroras as a major subcategory. Using two winter seasons of ground-based spectroscopic observations with the ASIS instrument, we confirm a systematic hardening of the precipitating electron population after midnight. The two-wavelength method reveals an increase of the median characteristic energy from approximately 2–2.5 keV near midnight to values approaching 5 keV toward the dawn sector. By combining this MLT analysis with a Bayesian statistical framework, we show that this trend is robust when evaluated on the median energy while accounting for the non-Gaussian dispersion of the energy distributions.
The Bayesian analyses show that this trend remains robust despite the large variability of the dataset. The hierarchical analysis further shows that part of this variability is organized at the night-to-night level, with a baseline dispersion of approximately σnight≃1.0 keV, while a residual dispersion of approximately σres≃0.85 keV remains around the common MLT evolution. We also tested fixed breakpoints between 00:00 and 06:00 MLT. The highest predictive support from the LOO comparison is obtained for a breakpoint near 04:00 MLT. However, neighbouring breakpoints remain statistically plausible. We therefore interpret 04:00 MLT as a representative description of the region where the morning-sector hardening becomes marked, rather than as a sharply defined physical onset. The broad range of plausible transition times may reflect differences in the timing and shape of the evolution between individual nights, the mixture of diffuse auroral subtypes, or an intrinsically gradual population-level transition. In addition, the MLT dependence remains visible when the observations are separated according to geomagnetic activity, while the differences obtained when AE is evaluated over the preceding 2 and 6 h intervals indicate that the magnetospheric history is also important, suggesting a possible role of magnetospheric preconditioning.
The post-midnight hardening of electron precipitation identified in this study is broadly consistent with earlier observational results based on optical imaging, radar measurements, and satellite observations. Several previous studies have reported a dawnward evolution toward harder precipitation, often inferred from changes in emission altitude or occurrence statistics. Using incoherent-scatter radar observations, Hosokawa and Ogawa (2015) reported a systematic decrease in the peak emission altitude of pulsating auroras after magnetic midnight, indicative of progressively harder electron precipitation in the post-midnight sector. Statistical studies based on all-sky imager observations by Partamies et al. (2017) similarly showed a decrease in the median peak emission altitude between approximately 02:00 and 06:00 MLT, consistent with progressively harder precipitation toward the morning sector.
More direct estimates of precipitation hardness show a similar dawnward evolution, although the reported timing is not identical between studies. Kawamura et al. (2020), using observations from 37 nights, found that the emission altitude of pulsating aurora decreases toward the morning sector, with the decrease becoming particularly clear after approximately 06:00 MLT. In contrast, the two events studied by Nanjo et al. (2021) showed increases in the blue-to-green emission ratio beginning at approximately 03:00 MLT, with the timing also depending on magnetic latitude. These differences are consistent with our hierarchical analysis, which supports a common morning-sector hardening but does not identify a unique transition time.
Several mechanisms have been proposed to explain this post-midnight hardening of electron precipitation. A widely discussed framework is provided by the kinetic modeling study of Miyoshi et al. (2015), who showed that lower-band chorus waves can preferentially scatter higher-energy electrons into the atmospheric loss cone. Although chorus waves are generated near the magnetic equator, their propagation to higher magnetic latitudes along magnetic field lines modifies the resonance conditions by reducing the local electron cyclotron frequency and altering the parallel wave number. These effects shift the cyclotron resonance toward higher-energy electrons, resulting in harder precipitation. Recent observational work by Ito et al. (2024) supports this interpretation by demonstrating that chorus waves observed in the dawn sector tend to occur in regions with lower local electron cyclotron frequencies and exhibit larger k∥ values than those observed closer to midnight. These wave properties naturally favor resonance with higher-energy electrons, providing a plausible explanation for the observed increase in characteristic precipitation energy toward dawn. The broad correspondence between the morning-sector hardening identified here and the MLT dependence of chorus-wave properties reported by Ito et al. (2024) is consistent with a role of changing wave–particle interaction conditions, although other mechanisms may also contribute.
Using two winter seasons of high-cadence ground-based spectroscopic observations, this study provides a robust statistical characterization of the magnetic local time dependence of diffuse auroral electron precipitation energy. The results confirm a systematic post-midnight hardening of the precipitating electron population, with characteristic energies increasing toward the dawn sector. The morning-sector hardening remains visible across geomagnetic activity levels, although its statistical strength varies with activity. Its transition time is not uniquely constrained and likely varies between nights depending on their individual evolution and precipitation characteristics.
Although several observational limitations tend to bias the retrieved energies toward lower values, the observed trends remain consistent and statistically significant. These results complement previous optical, radar, and satellite studies and provide new quantitative constraints on the timing and magnitude of electron precipitation hardening. Overall, the ASIS observations highlight the potential of ground-based auroral spectroscopy to investigate long-term statistical properties of wave-driven precipitation processes in the nightside magnetosphere.
We explored whether clearly pulsating intervals could be isolated using an independent high-cadence optical dataset with the observations from the EMBLA narrow-field camera (Whiter et al., 2024). EMBLA keograms provide a horizontal sampling of about 2 s per pixel, allowing positive identification of intervals with marked pulsating behaviour. We therefore developed a dedicated manual selection procedure from EMBLA keograms to identify intervals with clear pulsating signatures, as illustrated in Fig. A1.
This EMBLA-based analysis remains exploratory and cannot support a homogeneous subtype-resolved statistical reanalysis of the full ASIS dataset. EMBLA is only available from mid-January 2025 onward, whereas the ASIS dataset analyzed here spans October 2023 to March 2024 and October 2024 to March 2025. The overlap is therefore limited to only about ten nights. In addition, non-detection of pulsations cannot be interpreted as absence of pulsating aurora, especially for faint events. Finally, some of the few available cases in key MLT sectors, especially around 23:00 and 02:00 MLT, correspond to high-energy outliers as displayed by Fig. 5. Nevertheless, the EMBLA-selected PsA-only subset provides a useful consistency check. On the nights in common, it shows a qualitatively similar increase of inferred energy toward the morning sector as the corresponding all-diffuse subset, while the full diffuse dataset preserves the same global behaviour (Fig. A2). We do not interpret this limited sample as a statistically complete subtype-resolved analysis, but it suggests that the main dawnside hardening found in the diffuse dataset is not solely produced by subtype mixing within the diffuse class.
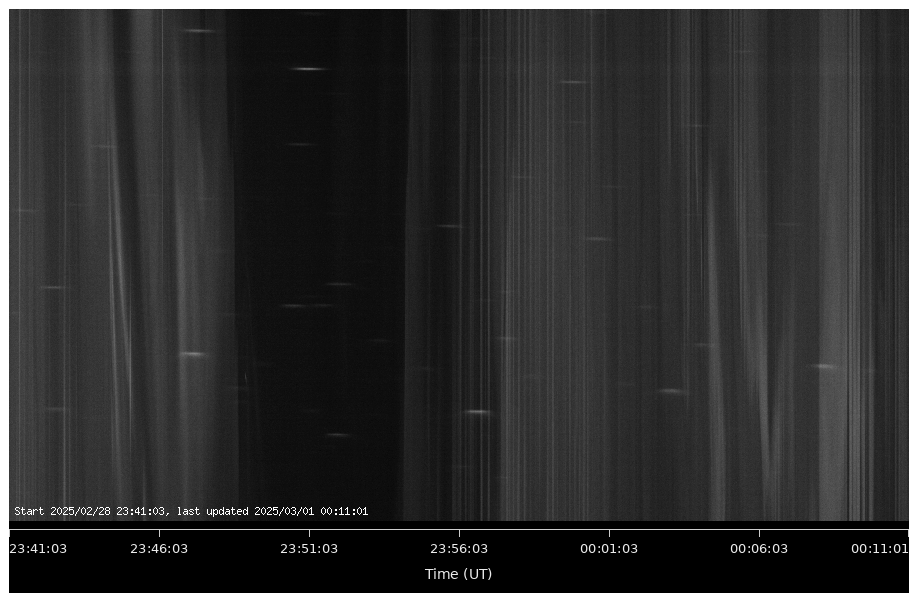
Figure A1Example EMBLA keogram for the night from 28 February 2025 to the 1 March 2025 showing a clear interval of pulsating aurora between 23:55 and 0:01 UT. The horizontal sampling is approximately 2 s per pixel. Courtesy of Daniel Whiter.
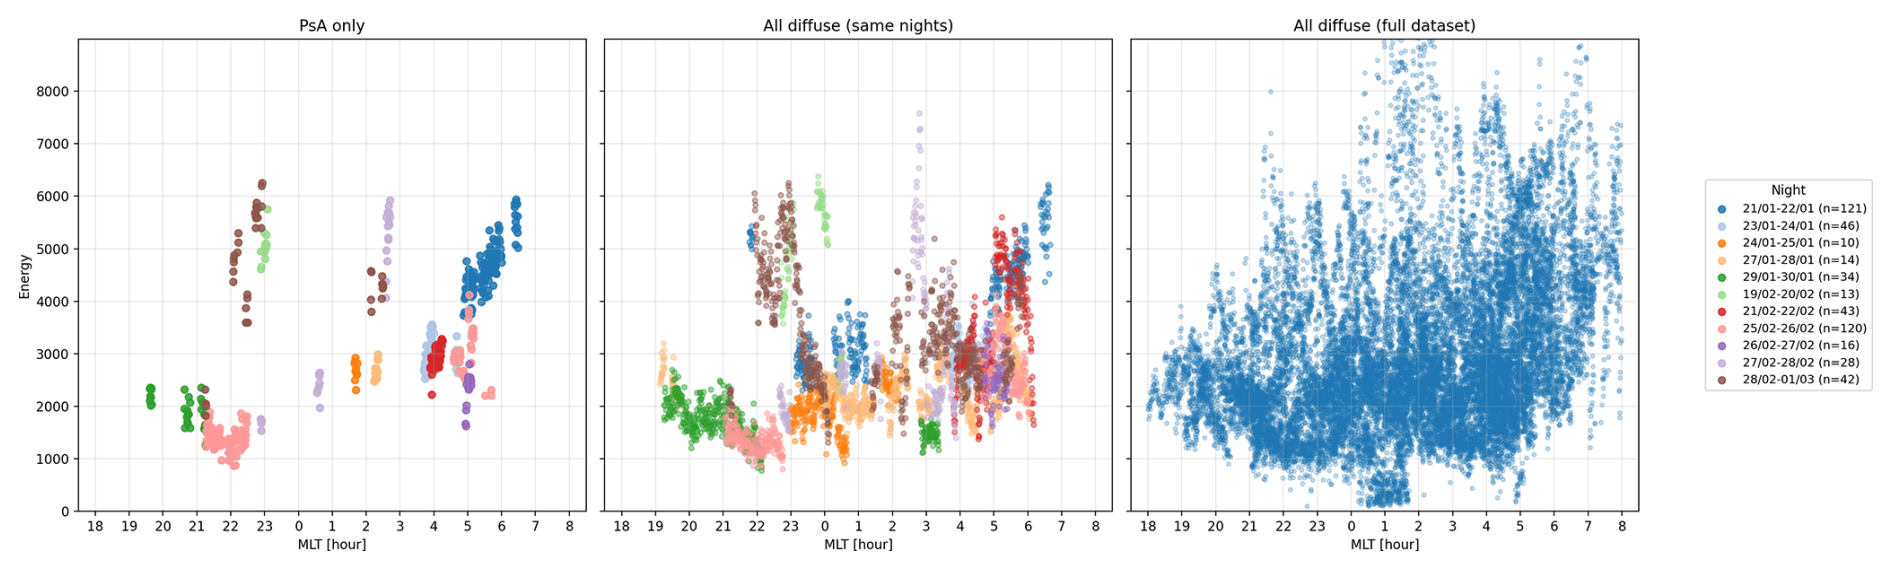
Figure A2Comparison of inferred energy as a function of MLT for the EMBLA-selected PsA-only subset (left), the full diffuse sample restricted to the same nights (middle), and the full diffuse dataset (right). The PsA-only subset remains limited and non-homogeneous, but shows a qualitatively similar dawnside hardening tendency.
All-sky color camera images are available at http://darndeb08.cei.uec.ac.jp/~nanjo/public/skibotn_imgs/ (last access: 16 November 2026). The inferred mean electron energies derived from the ASIS spectra for all diffuse auroral events analyzed in this study are publicly available at https://asis.aeronomie.be/papers (last access: 16 November 2026).
GC and KH conceived the study. GC developed the data-analysis code and led the manuscript writing. GC, HL, and MB performed the calibration of the ASIS data. SN provided the AI-based auroral classification. MGJ provided the magnetometer data and contributed to its interpretation. RM and GC analyzed the dependence on the AE index. All authors contributed to the scientific discussion and interpretation of the results and reviewed the manuscript.
At least one of the (co-)authors is a member of the editorial board of Annales Geophysicae. The peer-review process was guided by an independent editor, and the authors also have no other competing interests to declare.
Publisher's note: Copernicus Publications remains neutral with regard to jurisdictional claims made in the text, published maps, institutional affiliations, or any other geographical representation in this paper. The authors bear the ultimate responsibility for providing appropriate place names. Views expressed in the text are those of the authors and do not necessarily reflect the views of the publisher.
The authors thank Daniel Whiter for providing the EMBLA data used in this study, and the two referees for their constructive comments, which helped improve the manuscript. The authors disclose that generative AI was used for language editing and formatting assistance, and to develop the data-analysis code; all scientific content, analyses, and conclusions were produced and verified by the authors.
Gaël Cessateur was supported by the Solar-Terrestrial Centre of Excellence (STCE). Sota Nanjo was supported by the Japan Society for the Promotion of Science (JSPS) Overseas Research Fellowships. Keisuke Hosokawa was supported by JSPS KAKENHI (grant no. 22H00173) and by the STCE Visitors Program, which supported a research visit in March 2025.
This paper was edited by Minna Palmroth and reviewed by two anonymous referees.
Adachi, K., Nozawa, S., Ogawa, Y., Brekke, A., Hall, C., and Fujii, R.: Evaluation of a method to derive ionospheric conductivities using two auroral emissions (428 and 630 nm) measured with a photometer at Tromsø (69.6° N), Earth, Planets and Space, 69, 90, https://doi.org/10.1186/s40623-017-0677-4, 2017. a, b, c, d, e, f
Akasofu, S.-I.: The development of the auroral substorm, Planet. Space Sci., 12, 273–282, https://doi.org/10.1016/0032-0633(64)90151-5, 1964. a
Barthelemy, M., Robert, E., and Lamy, H.: Synthetic spectra of the aurora: N2, N, N, N+, O and O emissions, J. Space Weather Space Clim., 15, 19, https://doi.org/10.1051/swsc/2025013, 2025. a, b, c
Davis, T. N. and Sugiura, M.: Auroral electrojet activity index AE and its universal time variations, J. Geophys. Res., 71, 785–801, https://doi.org/10.1029/JZ071i003p00785, 1966. a
Donovan, E., Mende, S., Jackel, B., Frey, H., Syrjäsuo, M., Voronkov, I., Trondsen, T., Peticolas, L., Angelopoulos, V., Harris, S., Greffen, M., and Connors, M.: The THEMIS all-sky imaging array–system design and initial results from the prototype imager, J. Atmos. Sol.-Terr. Phy., 68, 1472–1487, https://doi.org/10.1016/j.jastp.2005.03.027, 2006. a
Fukizawa, M., Sakanoi, T., Miyoshi, Y., Hosokawa, K., Shiokawa, K., Katoh, Y., Kazama, Y., Kumamoto, A., Tsuchiya, F., Miyashita, Y., Tanaka, Y. M., Kasahara, Y., Ozaki, M., Matsuoka, A., Matsuda, S., Hikishima, M., Oyama, S., Ogawa, Y., Kurita, S., and Fujii, R.: Electrostatic Electron Cyclotron Harmonic Waves as a Candidate to Cause Pulsating Auroras, Geophys. Res. Lett., 45, 12,661–12,668, https://doi.org/10.1029/2018GL080145, 2018. a
Fukizawa, M., Sakanoi, T., Miyoshi, Y., Kazama, Y., Katoh, Y., Kasahara, Y., Matsuda, S., Matsuoka, A., Kurita, S., Shoji, M., Teramoto, M., Imajo, S., Sinohara, I., Wang, S.-Y., Tam, S. W.-Y., Chang, T.-F., Wang, B.-J., and Jun, C.-W.: Pitch-Angle Scattering of Inner Magnetospheric Electrons Caused by ECH Waves Obtained With the Arase Satellite, Geophys. Res. Lett., 47, e2020GL089 926, https://doi.org/10.1029/2020GL089926, e2020GL089926 2020GL089926, 2020. a
Grono, E. and Donovan, E.: Differentiating diffuse auroras based on phenomenology, Ann. Geophys., 36, 891–898, https://doi.org/10.5194/angeo-36-891-2018, 2018. a
Hosokawa, K. and Ogawa, Y.: Ionospheric variation during pulsating aurora, J. Geophys. Res.-Space, 120, 5943–5957, https://doi.org/10.1002/2015JA021401, 2015. a, b, c, d, e
Hosokawa, K., Miyoshi, Y., Ozaki, M., Oyama, S.-I., Ogawa, Y., Kurita, S., Kasahara, Y., Kasaba, Y., Yagitani, S., Matsuda, S., Tsuchiya, F., Kumamoto, A., Kataoka, R., Shiokawa, K., Raita, T., Turunen, E., Takashima, T., Shinohara, I., and Fujii, R.: Multiple time-scale beats in aurora: precise orchestration via magnetospheric chorus waves, Scientific Reports, 10, 3380, https://doi.org/10.1038/s41598-020-59642-8, 2020. a, b
Hosokawa, K., Oyama, S.-I., Ogawa, Y., Miyoshi, Y., Kurita, S., Teramoto, M., Nozawa, S., Kawabata, T., Kawamura, Y., Tanaka, Y.-M., Miyaoka, H., Kataoka, R., Shiokawa, K., Brändström, U., Turunen, E., Raita, T., Johnsen, M. G., Hall, C., Hampton, D., Ebihara, Y., Kasahara, Y., Matsuda, S., Shinohara, I., and Fujii, R.: A Ground-Based Instrument Suite for Integrated High-Time Resolution Measurements of Pulsating Aurora With Arase, J. Geophys. Res.-Space, 128, e2023JA031527, https://agupubs.onlinelibrary.wiley.com/doi/abs/10.1029/2023JA031527 (last access: 16 November 2026), 2023. a, b
Ito, Y., Hosokawa, K., Ogawa, Y., Miyoshi, Y., Tsuchiya, F., Fukizawa, M., Kasaba, Y., Kazama, Y., Oyama, S., Murase, K., Nakamura, S., Kasahara, Y., Matsuda, S., Kasahara, S., Hori, T., Yokota, S., Keika, K., Matsuoka, A., Teramoto, M., and Shinohara, I.: On the Factors Controlling the Relationship Between Type of Pulsating Aurora and Energy of Pulsating Auroral Electrons: Simultaneous Observations by Arase Satellite, Ground-Based All-Sky Imagers and EISCAT Radar, J. Geophys. Res.-Space, 129, e2024JA032617, https://doi.org/10.1029/2024JA032617, 2024. a, b, c, d
Kasahara, S., Yokota, S., Mitani, T., Asamura, K., Hirahara, M., Miyoshi, Y., Kazama, Y., Tsuchiya, F., Matsuda, S., Kasaba, Y., Saito, Y., Takashima, T., and Fujimoto, M.: Pulsating aurora from electron scattering by chorus waves, Nature, 554, 337–340, https://doi.org/10.1038/nature25505, 2018. a, b, c
Kawamura, Y., Hosokawa, K., Nozawa, S., Ogawa, Y., Kawabata, T., Oyama, S.-I., Miyoshi, Y., Kurita, S., and Fujii, R.: Estimation of the emission altitude of pulsating aurora using the five-wavelength photometer, Earth Planets Space, 72, 96, https://doi.org/10.1186/s40623-020-01229-8, 2020. a, b, c, d
Maggiolo, R., Hamrin, M., De Keyser, J., Pitkänen, T., Cessateur, G., Gunell, H., and Maes, L.: The Delayed Time Response of Geomagnetic Activity to the Solar Wind, J. Geophys. Res.-Space, 122, 11109–11127, https://doi.org/10.1002/2016JA023793, 2017. a
Meredith, N. P., Horne, R. B., Bortnik, J., Li, W., Shen, X., Vellante, M., Piersanti, M., Magnes, W., Nakamura, R., and Santolík, O.: Global Model of Whistler Mode Chorus in the Near‐Equatorial Region: Dependence on Geomagnetic Activity, Geophys. Res. Lett., 47, e2020GL087311, https://doi.org/10.1029/2020GL087311, 2020. a, b
Miyoshi, Y., Saito, S., Seki, K., Nishiyama, T., Kataoka, R., Asamura, K., Katoh, Y., Ebihara, Y., Sakanoi, T., Hirahara, M., Oyama, S., Kurita, S., and Santolik, O.: Relation between fine structure of energy spectra for pulsating aurora electrons and frequency spectra of whistler mode chorus waves, J. Geophys. Res.-Space, 120, 7728–7736, https://doi.org/10.1002/2015JA021562, 2015. a, b
Nanjo, S., Hozumi, Y., Hosokawa, K., Kataoka, R., Miyoshi, Y., Oyama, S.-i., Ozaki, M., Shiokawa, K., and Kurita, S.: Periodicities and Colors of Pulsating Auroras: DSLR Camera Observations From the International Space Station, J. Geophys. Res.-Space, 126, e2021JA029564, https://doi.org/10.1029/2021JA029564, 2021. a, b, c
Nanjo, S., Kataoka, R., Nishiyama, T., Yoneda, M., and Miyaoka, H.: Automatic classification of auroral morphology from all-sky images by using a convolutional neural network, Scientific Reports, 12, 7883, https://doi.org/10.1038/s41598-022-11686-8, 2022. a, b, c
Nanjo, S., Ebukuro, S., Nakamura, S., Miyoshi, Y., Kurita, S., Oyama, S.-I., Ogawa, Y., Keika, K., Kasahara, Y., Kasahara, S., Matsuoka, A., Hori, T., Yokota, S., Matsuda, S., Shinohara, I., Wang, S.-Y., Kazama, Y., Jun, C.-W., Kitahara, M., and Hosokawa, K.: An Implication of Detecting the Internal Modulation in a Pulsating Aurora: A Conjugate Observation by the Arase Satellite and All-Sky Imagers, J. Geophys. Res.-Space, 128, e2023JA031499, https://doi.org/10.1029/2023JA031499, 2023. a
Newell, P. T., Sotirelis, T., and Wing, S.: Diffuse, monoenergetic, and broadband aurora: The global precipitation budget, J. Geophys. Res.-Space, 114, https://doi.org/10.1029/2009JA014326, 2009. a
Nishimura, Y., Bortnik, J., Li, W., Thorne, R. M., Lyons, L. R., Angelopoulos, V., Mende, S. B., Bonnell, J. W., Contel, O. L., Cully, C., Ergun, R., and Auster, U.: Identifying the Driver of Pulsating Aurora, Science, 330, 81–84, https://doi.org/10.1126/science.1193186, 2010a. a
Nishimura, Y., Lyons, L. R., Angelopoulos, V., and Donovan, E. F.: Substorm triggering by new plasma intrusion: THEMIS all-sky imager observations, J. Geophys. Res.-Space, 115, A07222, https://doi.org/10.1029/2009JA015166, 2010b. a, b
Nishimura, Y., Lessard, M. R., Katoh, Y., Miyoshi, Y., Grono, E., Partamies, N., Sivadas, N., Hosokawa, K., Fukizawa, M., Samara, M., Michell, R. G., Kataoka, R., Sakanoi, T., Whiter, D. K., Oyama, S.-i., Ogawa, Y., and Kurita, S.: Diffuse and Pulsating Aurora, Space Science Reviews, 216, 4, https://doi.org/10.1007/s11214-019-0629-3, 2020. a
Nozawa, S., Kawabata, T., Hosokawa, K., Ogawa, Y., Tsuda, T., Mizuno, A., Fujii, R., and Hall, C.: A new five-wavelength photometer operated in Tromsø (69.6°N, 19.2°E), Earth, Planets and Space, 70, 193, https://doi.org/10.1186/s40623-018-0962-x, 2018. a
Ozaki, M., Yagitani, S., Ishizaka, K., Shiokawa, K., Miyoshi, Y., Kadokura, A., Yamagishi, H., Kataoka, R., Ieda, A., Ebihara, Y., Sato, N., and Nagano, I.: Observed correlation between pulsating aurora and chorus waves at Syowa Station in Antarctica: A case study, J. Geophys. Res.-Space, 117, https://doi.org/10.1029/2011JA017478, 2012. a
Ozaki, M., Miyoshi, Y., Shiokawa, K., Hosokawa, K., Oyama, S.-i., Kataoka, R., Ebihara, Y., Ogawa, Y., Kasahara, Y., Yagitani, S., Kasaba, Y., Kumamoto, A., Tsuchiya, F., Matsuda, S., Katoh, Y., Hikishima, M., Kurita, S., Otsuka, Y., Moore, R. C., Tanaka, Y., Nosé, M., Nagatsuma, T., Nishitani, N., Kadokura, A., Connors, M., Inoue, T., Matsuoka, A., and Shinohara, I.: Visualization of rapid electron precipitation via chorus element wave–particle interactions, Nat. Commun., 10, 257, https://doi.org/10.1038/s41467-018-07996-z, 2019. a
Partamies, N., Whiter, D., Kadokura, A., Kauristie, K., Nesse Tyssøy, H., Massetti, S., Stauning, P., and Raita, T.: Occurrence and average behavior of pulsating aurora, J. Geophys. Res.-Space, 122, 5606–5618, https://doi.org/10.1002/2017JA024039, 2017. a, b
Rousseeuw, P. J. and Croux, C.: Alternatives to the median absolute deviation, J. Am. Stat. Assoc., 88, 1273–1283, https://doi.org/10.1080/01621459.1993.10476408, 1993. a
Royrvik, O. and Davis, T. N.: Pulsating aurora: Local and global morphology, J. Geophys. Res., 82, 4720–4740, https://doi.org/10.1029/JA082i029p04720, 1977. a
Solomon, S. C.: Global modeling of thermospheric airglow in the far ultraviolet, J. Geophys. Res.-Space, 122, 7834–7848, https://doi.org/10.1002/2017JA024314, 2017. a
Tesema, F., Partamies, N., Kataoka, R., and Ogawa, Y.: Statistical study of diffuse aurora and its relation to substorm activity, J. Geophys. Res.-Space, 125, e2020JA028037, https://doi.org/10.1029/2020JA028037, 2020. a
Tsuruda, K., Machida, S., Oguti, T., Kokubun, S., Hayashi, K., Kitamura, T., Saka, O., and Watanabe, T.: Correlations between the very low frequency chorus and pulsating aurora observed by low-light-level television at, Can. J. Phys., 59, 1042–1048, https://doi.org/10.1139/p81-137, 1981. a
Whiter, D., Rae, J., Samaddar, S., Krcelic, P., Lanchester, B., Carlyle, I., Brindley, N., Thillaimaharajan, K., and Fear, R.: Embla: A new optical instrument to measure auroral precipitation, neutral temperature and electric fields at high resolution, EGU General Assembly 2024, Vienna, Austria, 14–19 Apr 2024, EGU24-19428, https://doi.org/10.5194/egusphere-egu24-19428, 2024. a, b
Yamamoto, T.: On the temporal fluctuations of pulsating auroral luminosity, J. Geophys. Res.-Space, 93, 897–911, https://doi.org/10.1029/JA093iA02p00897, 1988. a