
the Creative Commons Attribution 4.0 License.
the Creative Commons Attribution 4.0 License.
 | 16 Nov 2026
Morphological and spectrophotometric exploitation of JANUS LEGA dataset: Langrenus impact crater characterization and evolution of the highland “isthmus” between Mare Fecunditatis and Mare Tranquillitatis

Matteo Massironi
Klaus Gwinner
Thomas Kenkmann
Luca Penasa
Namitha R. Baby
Laura Rotzoll
Oguzcan Karagoz
Juan L. Rizos
Maurizio Pajola
Federico Tosi
Sonia Fornasier
Filippo Tusberti
Katrin Stephan
Riccardo Pozzobon
Javier E. Suarez-Valencia
Davide Cagnin
Francesca Zambon
Gianluca Chiarolanza
Athena Coustenis
Lorenza Giacomini
Ernst Hauber
Simone Marchi
Pietro Matteoni
Giuseppe Mitri
Costanza Rossi
Ricardo Hueso
Alessio Aboudan
Livio Agostini
Elke Kersten
Klaus D. Matz
Romolo Politi
Frank Trauthan
Cecilia Tubiana
Michael Aye
Angelo Zinzi
Ry Evill
Ines Belgacem
Jose M. Castro-Marin
Vincenzo Della Corte
Stubbe Hviid
Thomas Roatsch
Nicole Schmitz
Luisa M. Lara
Manish R. Patel
Ganna Portyankina
Pasquale Palumbo
The European Space Agency's (ESA) JUpiter ICy moons Explorer (JUICE) mission, launched in April 2023, performed a Lunar-Earth Gravity Assist (LEGA) maneuver in August 2024 as an instrument validation opportunity and science investigation. During this flyby, the Jovis, Amorum ac Natorum Undique Scrutator (JANUS) camera acquired a continuous multispectral imaging strip across the lunar surface, achieving spatial resolutions down to approximately 20 m per pixel. This paper presents a detailed morphological and spectrophotometric characterization of two regions of interest: Langrenus impact crater and the highland “isthmus” between Mare Fecunditatis and Mare Tranquillitatis.
Analysis of Langrenus reveals a structurally complex impact site located at the transition between mare and highland terrains. Compared with the adjacent highlands and ejecta-dominated terrains, the crater interior shows a stronger mare-related mafic contribution. Spectral unmixing indicates that the crater interior is dominated by mafic components, with minor but spatially coherent olivine-compatible signatures identified within the northern hummocky floor terrain and portions of the crater rim. Although the limited multispectral sampling and the optical maturity state of the regolith prevent definitive mineralogical discrimination, these mafic signatures may reflect excavation of heterogeneous target materials during impact or redistribution of mare-derived components through post-impact mass wasting and regolith mixing processes.
Investigations of the highland “isthmus” provide evidence for distinct generations of dome-like volcanic or subvolcanic constructs that differ in preservation state, optical maturity, and subtle mafic enrichment. Spectral analysis indicates a localized, structurally influenced, low-titanium magmatic system, distinct from large-scale mare volcanism and characterized by small-volume emplacements whose distribution is consistent with control by impact-generated and regional fractures.
These results not only provide new insights into lunar geological processes but also serve as a successful end-to-end validation of the JANUS camera's performance in an operational environment, confirming its readiness for the high-resolution characterization of the Galilean moons.
- Article
(33175 KB) - Full-text XML
- BibTeX
- EndNote


The European Space Agency's (ESA) JUpiter ICy moons Explorer (JUICE) mission (Grasset et al., 2013), launched in April 2023, is currently en route to the Jovian system. A key milestone during this interplanetary cruise was the Lunar-Earth Gravity Assist (LEGA) maneuver, executed on 19–20 August 2024. This gravity assist was primarily executed for trajectory optimization purposes; however, it also provided the first significant opportunity to operate JUICE's scientific payload in a dynamic flight scenario, effectively serving as a preview of the upcoming flybys of the Galilean moons. With a minimum altitude of approximately 754 km and a relative velocity of 4.2 km s−1, the lunar flyby closely replicated the expected observational conditions at Jupiter moons during the nominal science phase. Consequently, the maneuver was exploited for a dual purpose: to validate instrument operations, test performance capabilities, and refine data processing pipelines, while simultaneously acquiring unique, high-resolution scientific observations of the Moon.
Onboard JUICE, the Jovis, Amorum ac Natorum Undique Scrutator (JANUS) camera serves as the primary high-resolution visible imaging system (Palumbo et al., 2025). JANUS is a multispectral camera built around a modified Ritchey–Chrétien telescope with a 103.6 mm aperture and a 467 mm focal length. Its focal plane employs a Teledyne-e2v CIS115 back-illuminated CMOS detector (2000×1504 pixels), yielding an angular sampling of 15 μrad per pixel. This configuration enables JANUS to achieve spatial resolutions down to meter scale during close encounters with the Jovian satellites. The instrument's versatility is further enhanced by a 13-position filter wheel, spanning from near-ultraviolet to near-infrared (340–1080 nm) and offering both broadband and narrowband filters.
During the LEGA fly-by, JANUS successfully acquired a continuous imaging strip across the lunar surface, spanning from 17° S to 16° N latitude and 107° E to 7° W longitude. The observations exploited the JANUS multispectral coverage from the visible to near-infrared range: the studied Langrenus sequence includes the 450, 646, 910, and 1015 nm filters, whereas the isthmus region was covered by 6-, 7-, and 8-filter combinations extending from 380 to 1015 nm. Details about the JANUS operating parameters are reported in Tubiana et al. (2026).
This paper presents a detailed morphological and spectrophotometric analysis of two distinct regions captured in this dataset, which were observed under varying illumination conditions and filter sequences (Fig. 1). The first region is Langrenus crater, a 132 km-diameter complex impact crater situated at the critical geological boundary between the lunar highlands and Mare Fecunditatis, which was imaged at a high resolution of ∼20 m per pixel using four filters.
The second region targets the northwestern margin of Mare Fecunditatis, specifically the highlands “bridge” separating it from Mare Tranquillitatis. This area is of particular interest due to the presence of unusual volcanic domes that are distinct from classical mare features. The analysis of these two regions serves a dual purpose, aligning with the primary objectives of the LEGA campaign. First, it serves as a comprehensive demonstration of the JANUS camera's capabilities, validating its high-resolution imaging, multi-filter sequencing, and data quality in a relevant operational environment confirming the instrument's readiness to achieve its ambitious scientific goals in the Jovian system. Second, it provides new scientific insights into lunar geological processes, including the geological and compositional diversity of Langrenus crater and the integrated stratigraphic-spectral framework of the boundary between Mare Tranquillitatis and Mare Fecunditatis. This paper is structured as follows: Section 2 details the LEGA dataset used in the analysis. Section 3 presents an in-depth analysis of Langrenus crater, followed by the analysis of the highland “isthmus” between Mare Fecunditatis and Mare Tranquillitatis, presented in Sect. 4. Finally, Sect. 5 discusses the scientific implications of these findings and the validated performance of JANUS in preparation for its primary mission.
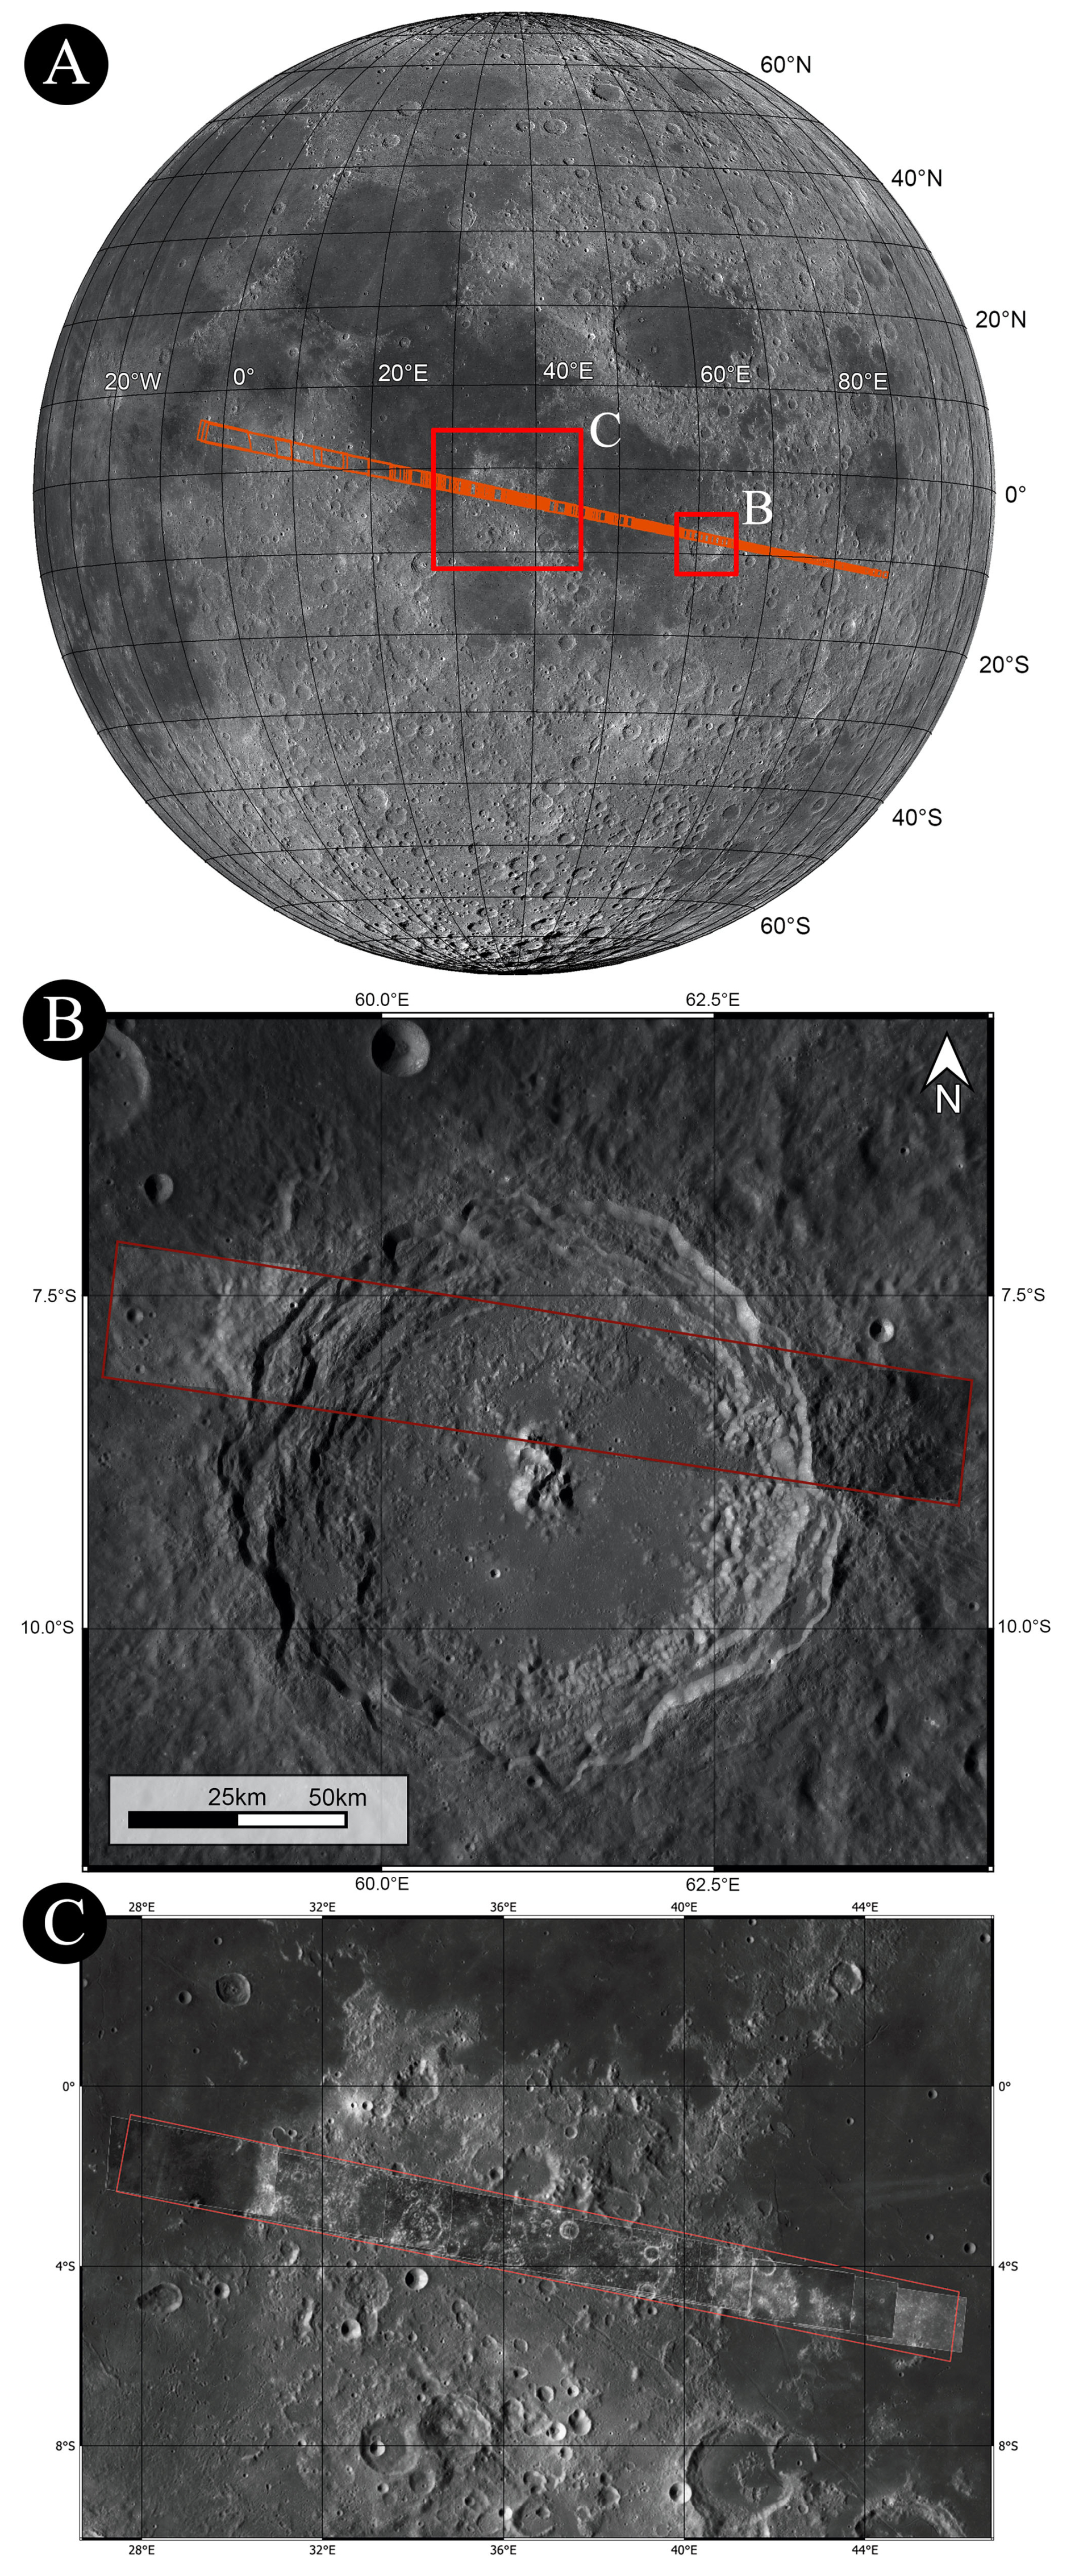
Figure 1(A) LROC WAC Global Morphology Mosaic 100 m basemap of the Moon (LROC Team/Arizona State University, 2013) with the footprints acquired by the JANUS instrument shown in red. The two regions of interest analyzed in this work are highlighted in (A). Panels (B) and (C) are retained only as regional context; the detailed JANUS coverage of Langrenus (B) and the highland isthmus (C) is shown in Figs. 2 and 3, respectively.
The dataset for this analysis consists of high-resolution images (ranging between 12 and 70 m per pixel) acquired by the JANUS camera with different filters (Table 1) during the JUICE mission's LEGA on 19–20 August 2024. The spacecraft approached along the flyby trajectory from the lunar nightside toward the dayside across dusk, with the solar phase angle remaining fixed at 90°. As a result, the incidence angle varied from 90 to 0°, while the emission angle varied from 0 to 90°. The observations cover a continuous strip across the lunar dayside, spanning latitudes from 17° S to 16° N and longitudes from 107° E to 7° W. This ground track included several prominent lunar features, from which we selected two primary regions for this study: the Langrenus crater and the highland “isthmus” between Mare Tranquillitatis and Mare Fecunditatis.
The JANUS images were processed through the standard pipeline (Agostini et al., 2026), resulting in Level 2 data products calibrated in units of radiance (W m−2 sr−1 nm−1). The derived data files (.tif) are map-projected onto a lunar ellipsoid using the SLDEM2015 digital terrain model (DTM; approximately 60 m resolution; Barker et al., 2016). To prepare the data for consistent morphological comparison and spectrophotometric analysis, a two-step correction was applied. First, the radiance images were converted to radiance factor (I/F) using the filter-dependent parameters derived from post-radiometric calibration analysis. This step normalizes the radiance for each filter by the incoming solar flux. Associated with both raw and derived data are geometric cubes (“geocubes”). These are 8-layer files providing per-pixel geometric information, including latitude, longitude, spacecraft-target distance, and the photometric angles (phase, incidence, and emiss ion), which are pivotal for the photometric correction. To remove illumination and viewing geometry effects and enable direct comparison of surface color properties, the I/F images were photometrically corrected. We applied the Hapke physically based model (Sato et al., 2014) to normalize the data to a standard viewing geometry of 30° phase angle, 0° emission angle, and 30° incidence angle. The DTM therefore affects the correction through the local incidence and emission angles assigned to each pixel, while the compositional analysis uses the resulting photometrically corrected I/F cubes. For all corrected products, pixels were masked if they were characterized by emission or incidence angles greater than 90° or an I/F value below a threshold (). This effectively removes areas in deep shadow, beyond the local horizon, or dominated by noise. The individual photometrically corrected filter images were then co-registered and stacked to create multi-filter data cubes for our investigated regions.
A full description of the JANUS calibration pipeline is reported in Agostini et al. (2026), while the detailed derivation of the Hapke photometric model is reported in Sato et al. (2014). This study utilizes the derived data files (.tiff) and the resulting photometrically corrected I/F data cubes for the morphological and spectrophotometric analysis, respectively.
Table 1Summary of JANUS filters in the order they are mounted on the filter wheel.
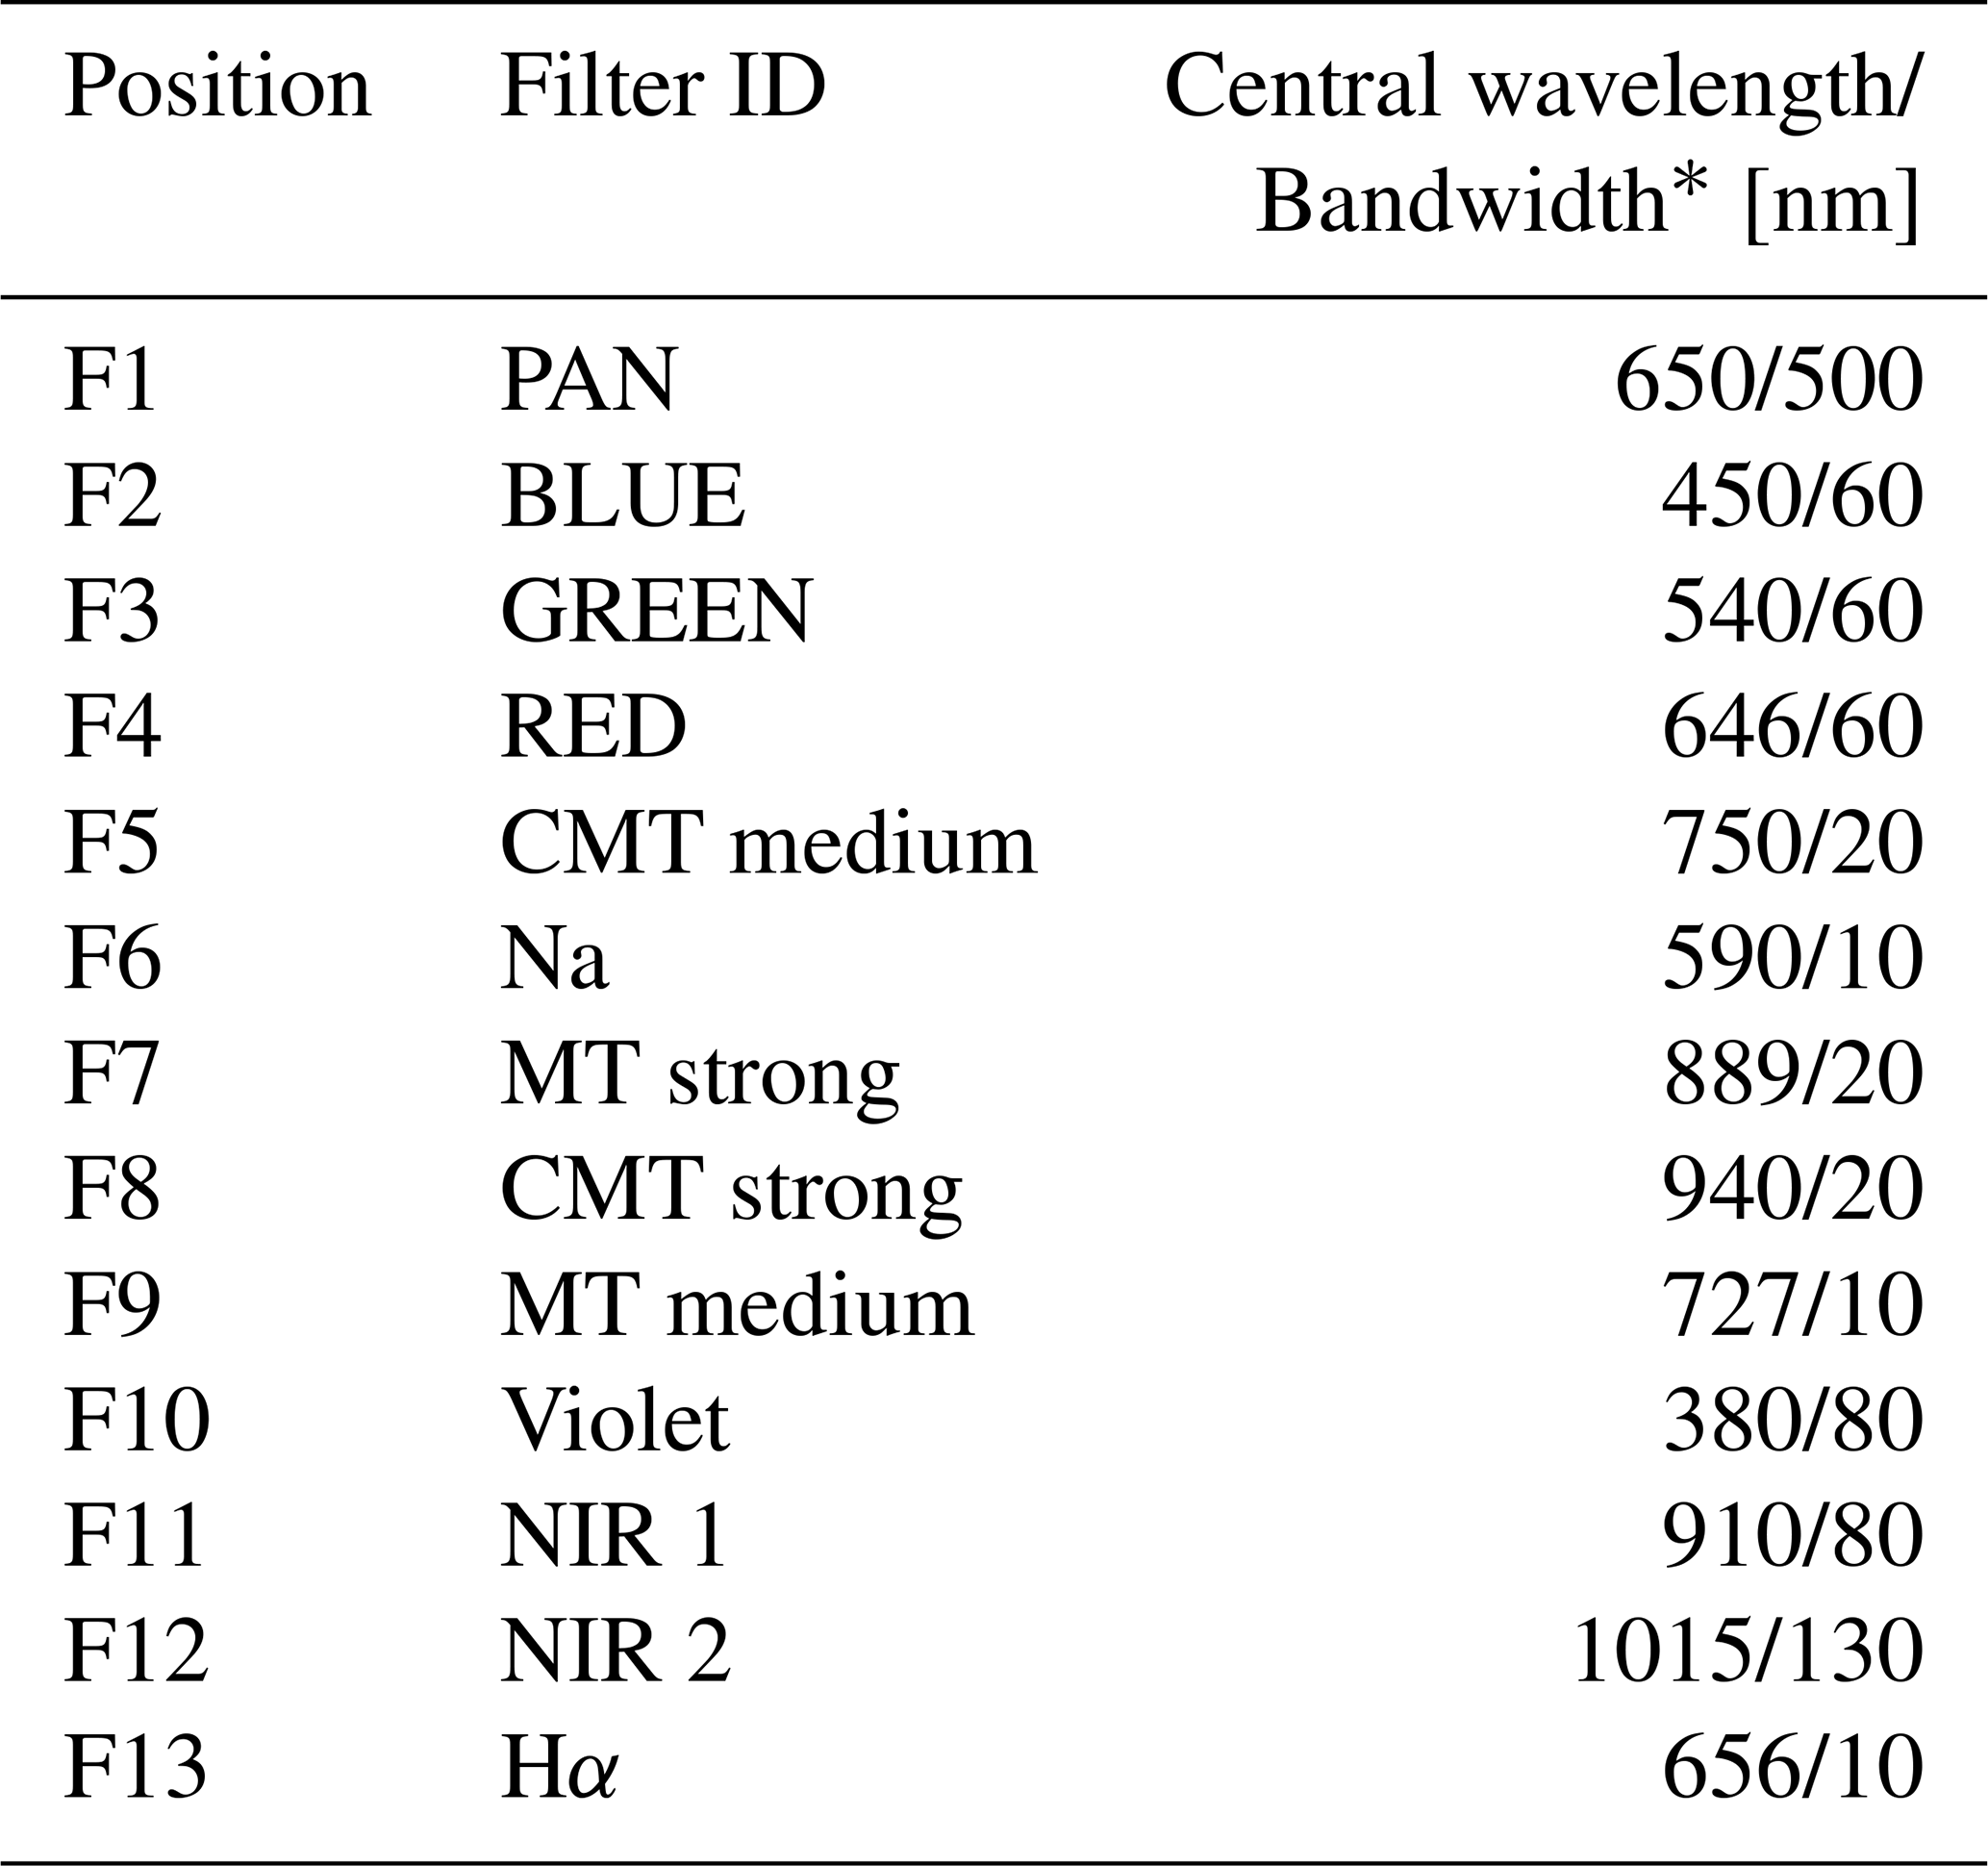
∗ Values are central wavelength and bandwidth, respectively.
The Langrenus impact crater was observed with a spatial resolution ranging from 19.7 to 22.4 m per pixel. The viewing geometry was characterized by emission angles of 22–27° and incidence angles of 68–63°. Critically for this study, the area was imaged in a multi-filter sequence that provides overlapping spatial coverage with four filters (Table 2). This 4-filter data cube is the basis of our high-resolution spectrophotometric analysis of the crater (Fig. 2).
The highland “isthmus” region between Mare Fecunditatis and Mare Tranquillitatis was imaged at a spatial resolution from 38 to 70 m per pixel. The observation geometry included emission angles of 45–61° and incidence angles of 45–29°. Both panchromatic images and 8-filter sequences were acquired over this region and, in addition, 6-filters and 7-filters sequences were employed on specific areas to enable a more detailed spectral study of the investigated area (Table 2). Such a dataset is ideal for studying compositional variations across the highland “isthmus” separating the two maria (Fig. 3).
In Table 2, we summarize the observational parameters describing the sequence of acquisition for the two different areas under investigation, while in the Table A1 the images IDs are listed.
Table 2Filter sequence, spatial resolution, phase and incidence angle characterizing the acquisition of the areas under investigation.
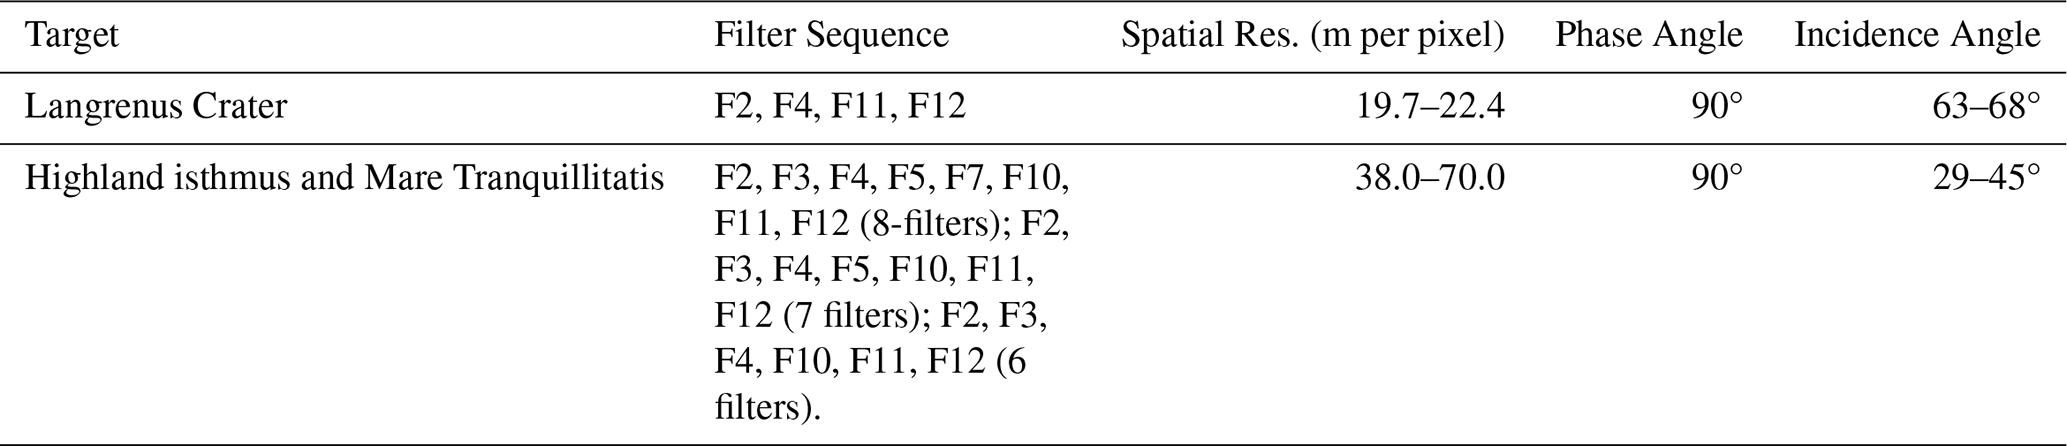
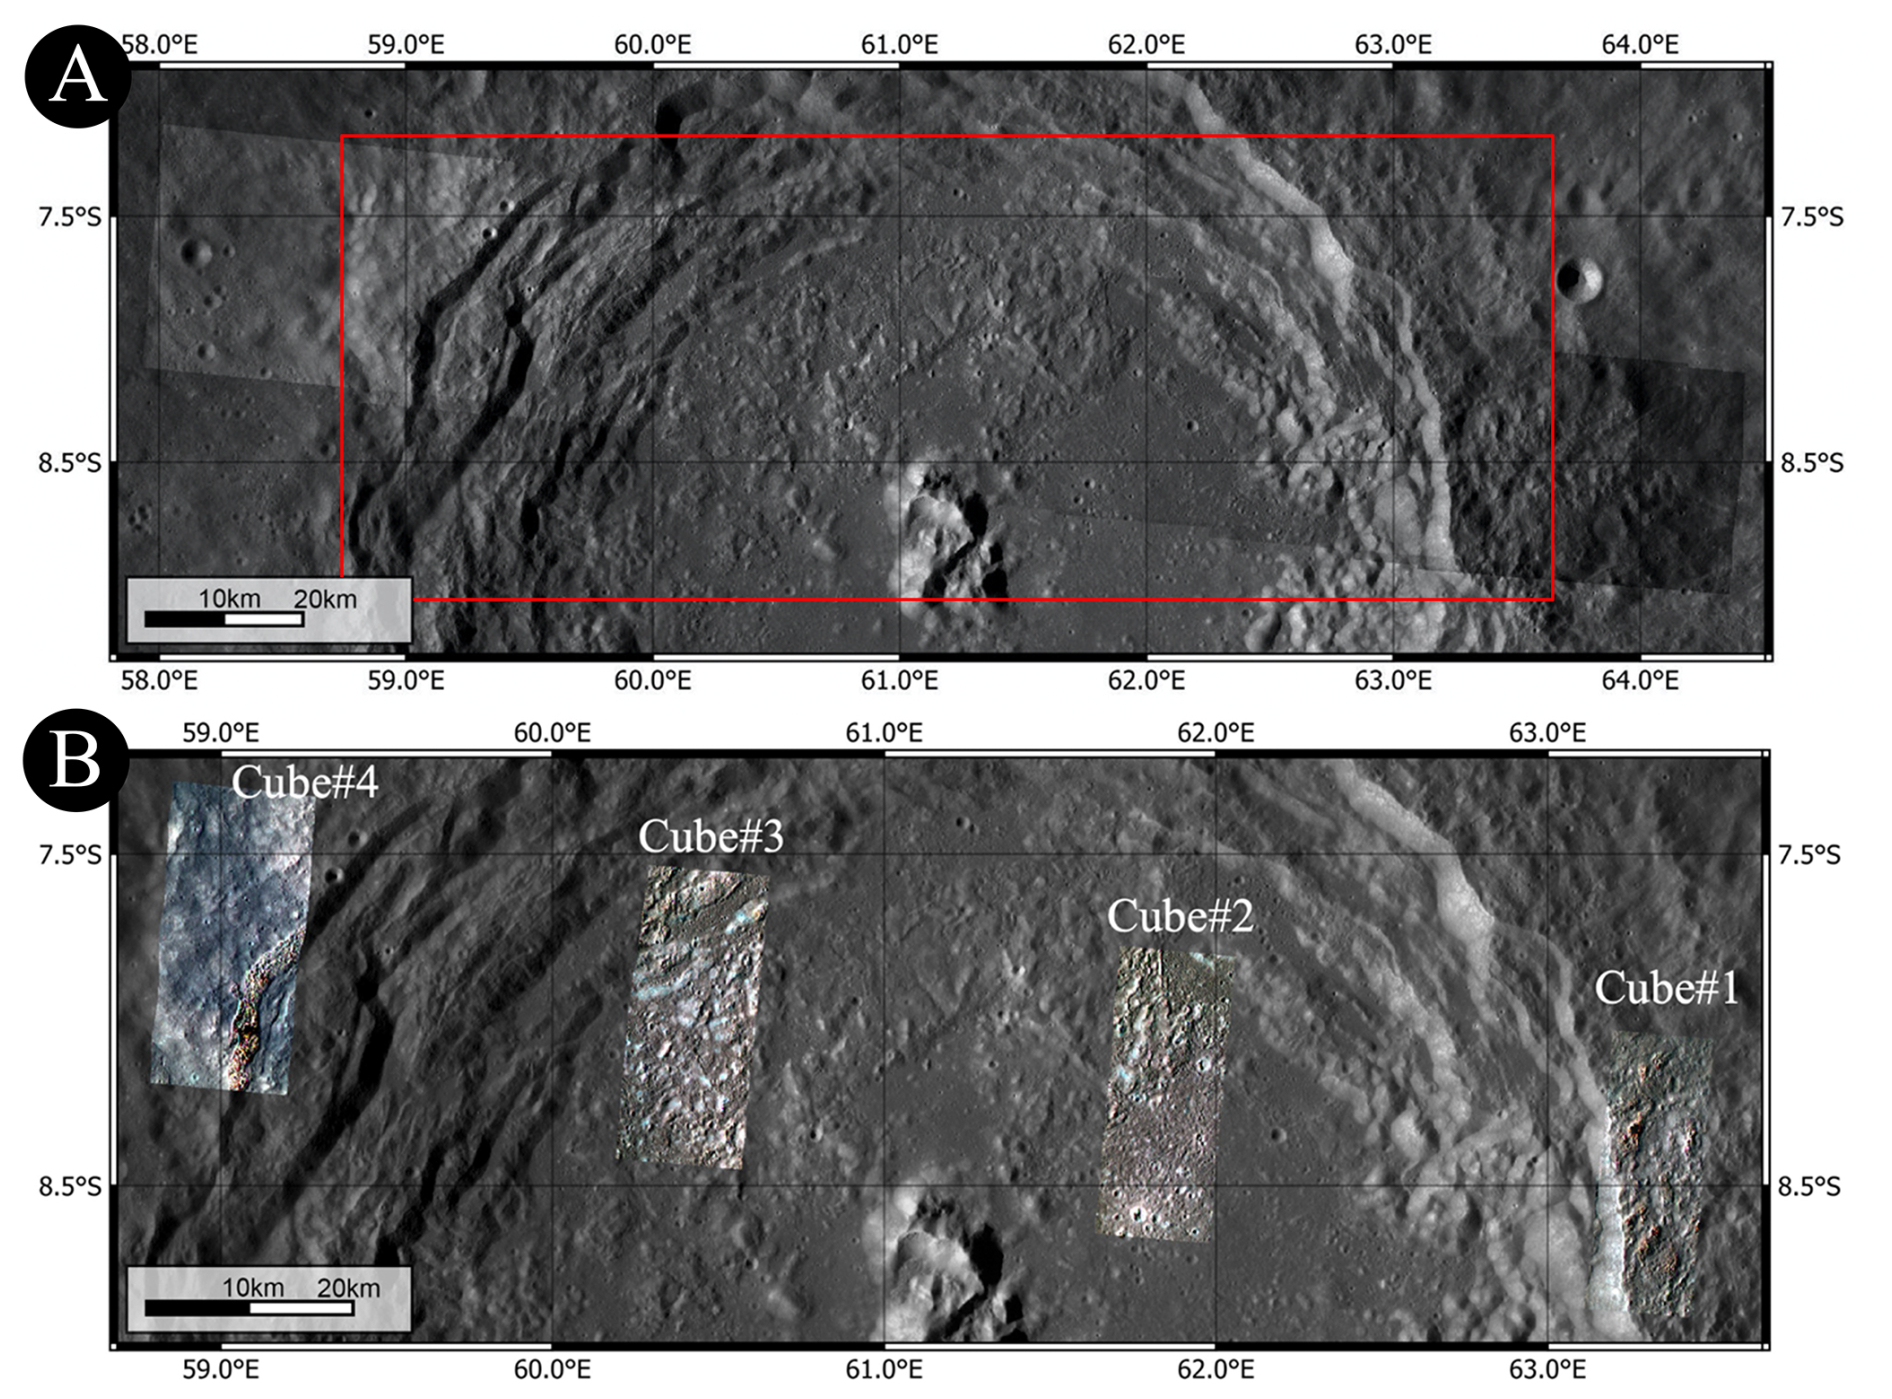
Figure 2(A) JANUS images acquired over Langrenus impact crater, (B) JANUS RGB composites of Langrenus crater derived from 4-filter data cubes generated from the overlapping areas of multifilter images. The cubes are numbered from #1 to #4, from east to west, following the JANUS image acquisition order.
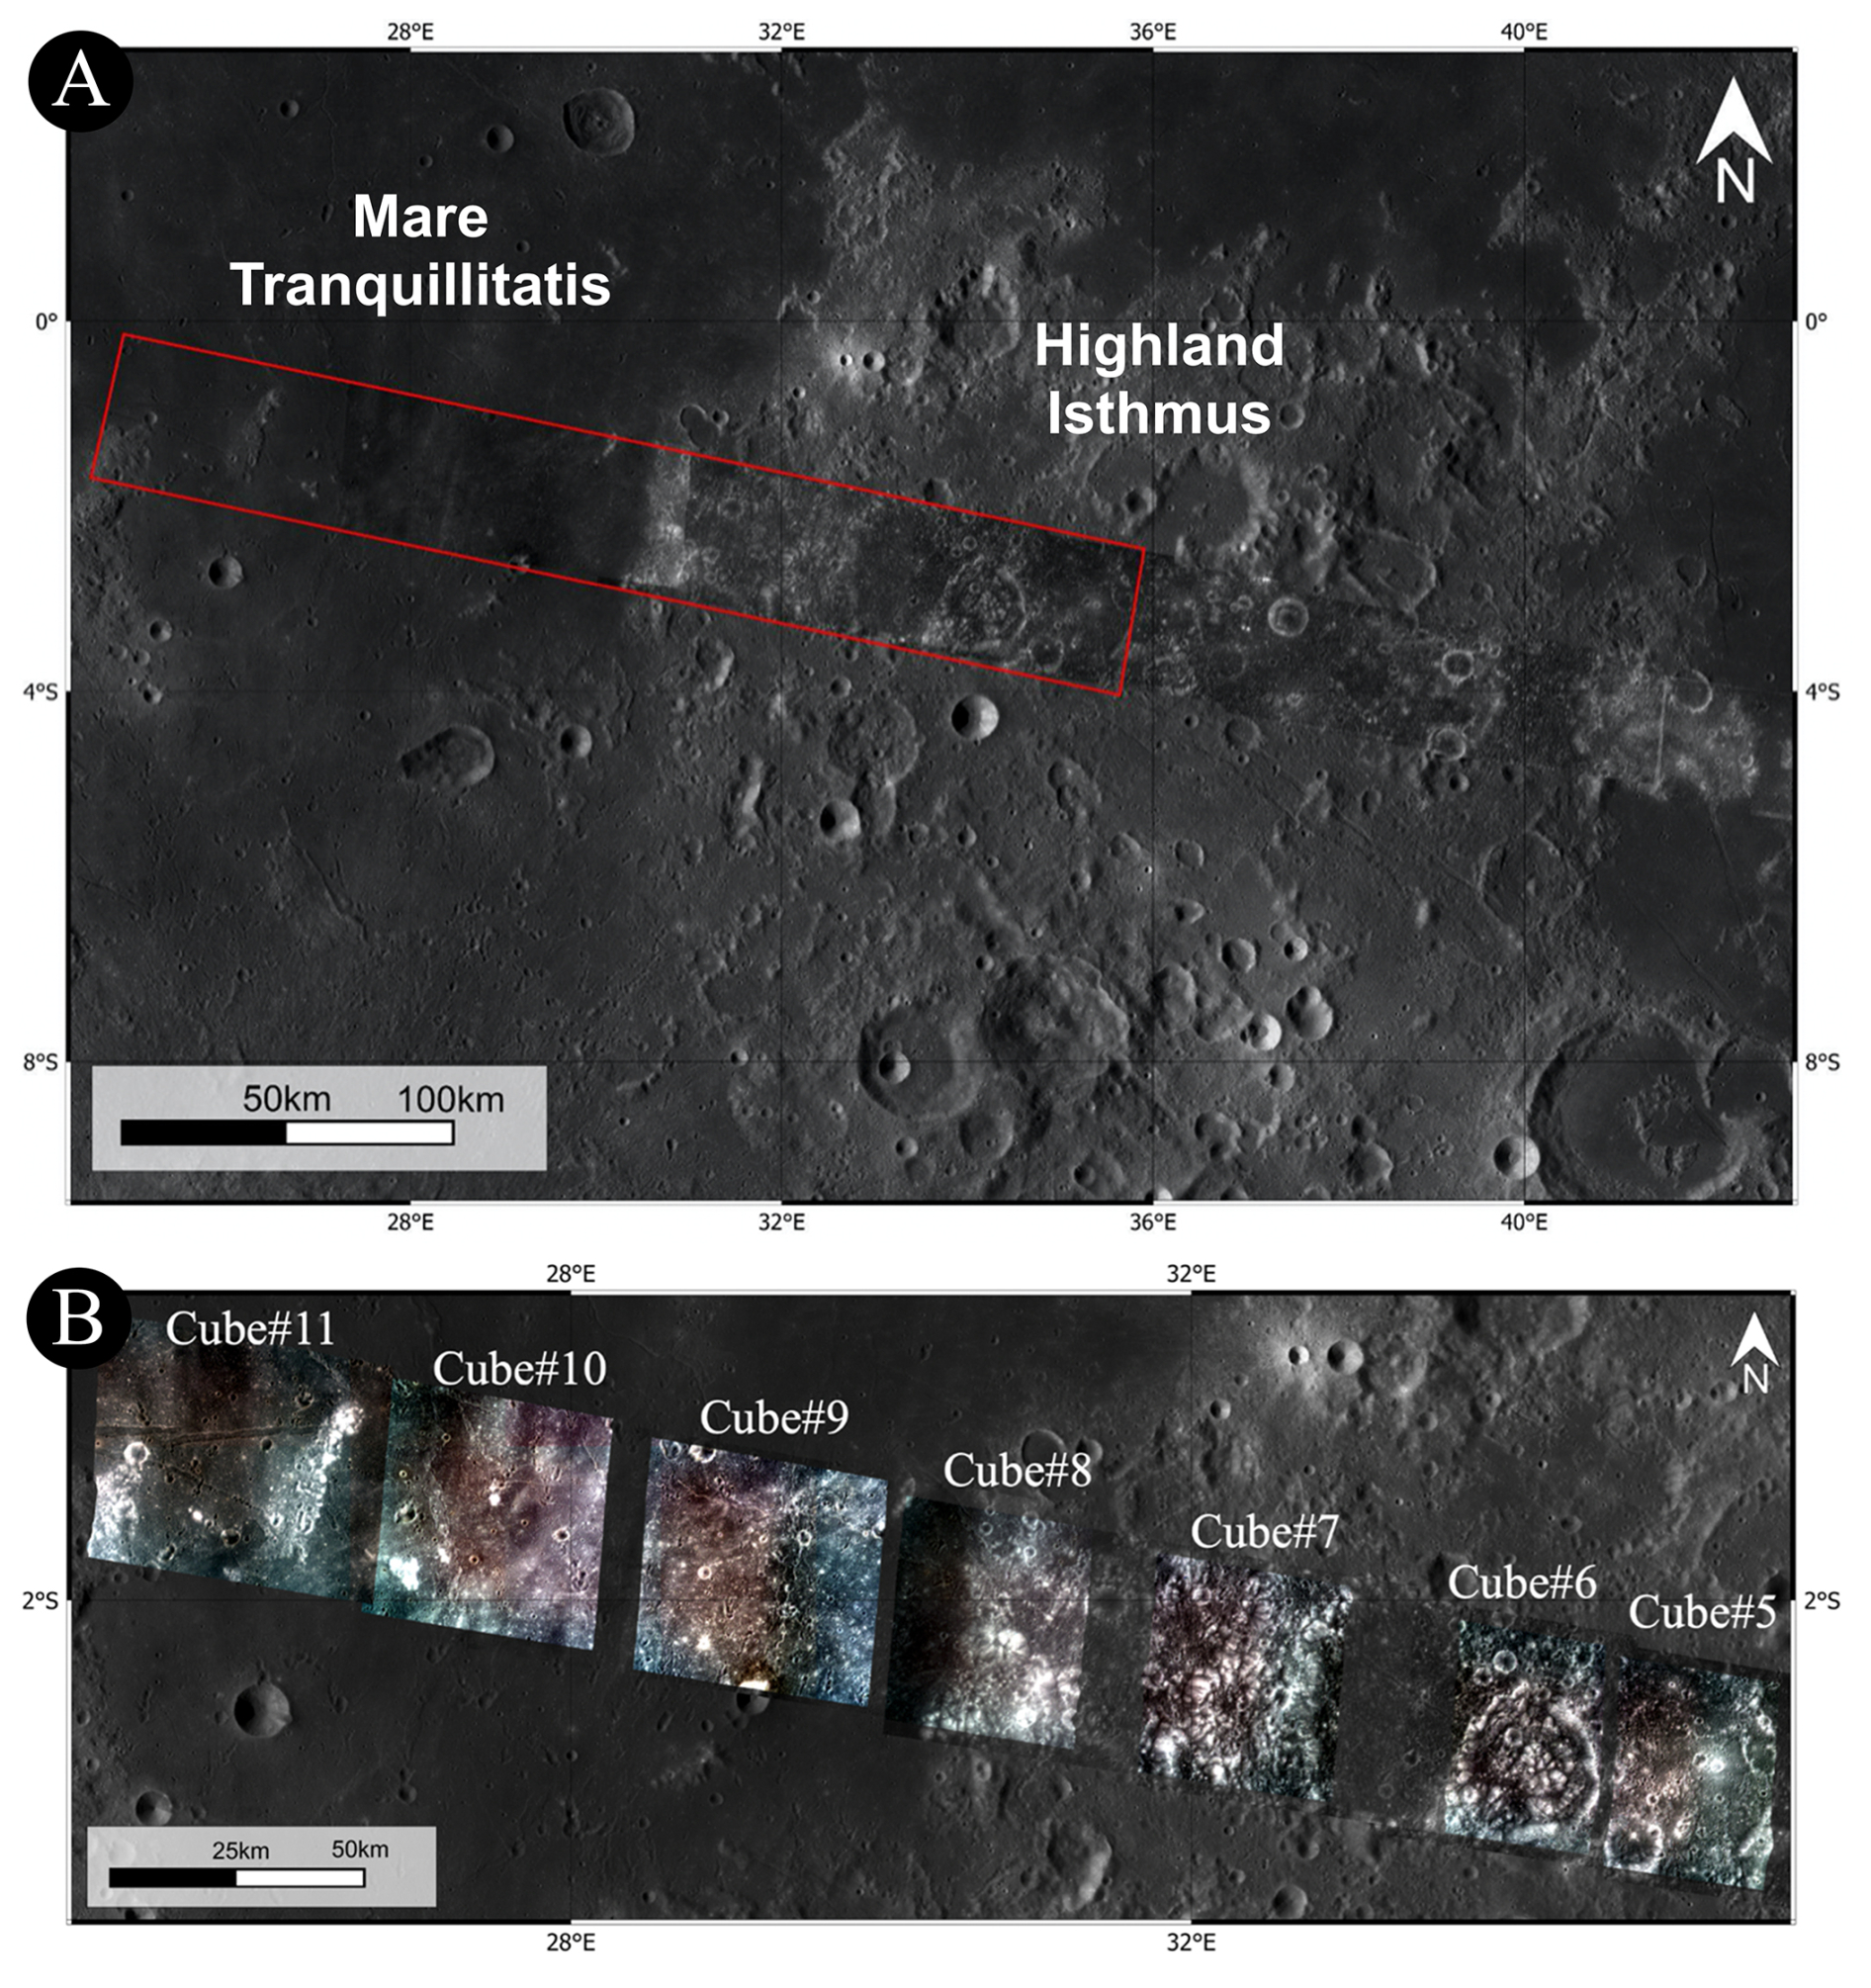
Figure 3(A) JANUS images of the highland “isthmus” region acquired during the flyby, where the red box highlights the area investigated through spectrophotometric analysis. (B) RGB composites derived from 8-filter, 7-filter, or 6-filter data cubes generated from the overlapping areas of multifilter images, located in the western part of the “isthmus” region. The cubes are numbered from #5 to #11, from east to west, following the JANUS image acquisition order. Cube #6 is a 6-filter sequence, cubes #8 and #10 are 7-filter sequences, while cubes #5, #7, #9, and #11 are 8-filter sequences (see Table 2).
This section combines regional geological context, geological mapping, crater size-frequency distribution (CSFD) measurements, block-size frequency distribution (BSFD) measurements, and multispectral observations to evaluate the formation and subsequent modification of Langrenus crater. Because Langrenus crater (8.86° S, 61.04° E) formed at the transition between Mare Fecunditatis and the surrounding highlands (Fig. 4a), the analysis aims to distinguish robust observations from alternative interpretations related to target heterogeneity, resurfacing, and surface composition.
Geological events preceding the formation of Langrenus crater include the formation of Mare Fecunditatis (centered at 7.8° S, 53.7° E) in the pre-Nectarian period (>4.17 Ga) (Orgel et al., 2018). Bouguer gravity data and inferred crustal thickness of the basin (Zuber et al., 2013) (Fig. 4b, c) indicate that it was most likely formed by a giant impact event. Topographic observation shows that 99 % of the Mare Fecunditatis varies from 0.3–2.7 km in height, and its interior is relatively flat (Ivanov et al., 2023, Yue et al., 2025). Crater size-frequency distribution (CSFD) measurements of impact craters within the mare domain of the Fecunditatis basin yield an absolute model age of ∼ 3.81 Ga (Ivanov et al., 2023), but there is evidence for extended periods of active volcanism as indicated by resurfacing ages, in agreement with radiometric ages obtained from Luna 16 samples (Hiesinger et al., 2006). Along with volcanic features, wrinkle ridges and graben structures further shape the morphology of the basin. The Luna 16 landing site is located within the Fecunditatis basin at a distance of 296 km from the center of Langrenus, where the radiometric ages of the basalt samples range from 3.3 to 3.5 Ga (e.g., Fernandes and Burgess, 2005).
The Langrenus crater (∼132 km in diameter) (Figs. 4a, 5) is the largest crater in Mare Fecunditatis. The ejecta of Langrenus superpose the mare volcanic rocks (Fig. 4a), exhibit a distinctive morphology, and are prominent in both the Clementine UV/VIS color-ratio map (Ivanov et al., 2023) and the Kaguya Lunar Multiband Imager–derived plagioclase weight-percent map (Lemelin et al., 2019). Spectral analysis of this area using Chandrayaan-1 Moon Mineralogy Mapper (M3, Pieters et al., 2009) data reveals significant mineralogical diversity, indicating that the central peak and surroundings are likely exposures of a subsurface mafic body excavated by the impact. Specifically, the central peak exhibits crystalline plagioclase-bearing anorthosite, while olivine and high-Ca pyroxenes are found along the terraced walls and crater floor (Pathak and Bhattacharya, 2017). Secondary craters overprinting the mare basalts occur in chains and clusters and show a distinctive herringbone pattern, defined by V-shaped ridges between adjacent secondary craters (Barlow, 2015), along with slightly brighter rays pointing to the parent crater Langrenus (Fig. 4a). Recent studies of Langrenus rays on the smooth mare surface show a linear trend of increasing iron oxide (FeO) content as the distance from the crater center increases, interpreted as a mixing of highland and mare materials. This trend indicates that directly outside the continuous ejecta zone (∼150 km), the material is a mix of ∼ 36 % highland and 64 % mare components (Krasilnikov and Ivanov, 2025). In global maps of the Moon (Fortezzo et al., 2020; Ji et al., 2022), Langrenus is mapped as Eratosthenian age (younger than 3.16 Ga). In contrast, Ivanov et al. (2023) measured the size-frequency distribution of craters in the southern flat part of the crater floor of Langrenus in an area of ∼2400 km2 obtaining an Imbrian age of 3.41 Ga for the impact event.
Yue et al. (2025) modelled the Langrenus impact event with the i-SALE shock physics code (e.g., Amsden et al., 1980; Wünnemann et al., 2006) and found that the crater may have been formed by a ∼11 km-diameter impactor hitting the lunar surface at a speed of ∼10 km s−1. Ejecta thickness estimates suggest a maximum thickness of ∼570 m at the crater rim and ∼5 m near the Luna 16 landing site, at 4.5 crater radii distance NW of Langrenus (Yue et al., 2025). As the ejecta is discontinuous at this distance, a fraction of Luna 16 samples may represent ejecta from the Langrenus crater (Ivanov et al., 2023; Yue et al., 2025). However, mixing models based on FeO content suggest that, at a distance of ∼300 km the increase in iron content flattens out, indicating an almost complete absence of Langrenus material and a dominance of local mare regolith. This interpretation is also consistent with classical ejecta-mixing models, in which the proportion of locally excavated and reworked substrate material increases with distance from the parent crater, complicating the identification of distal primary ejecta components (Oberbeck, 1975).
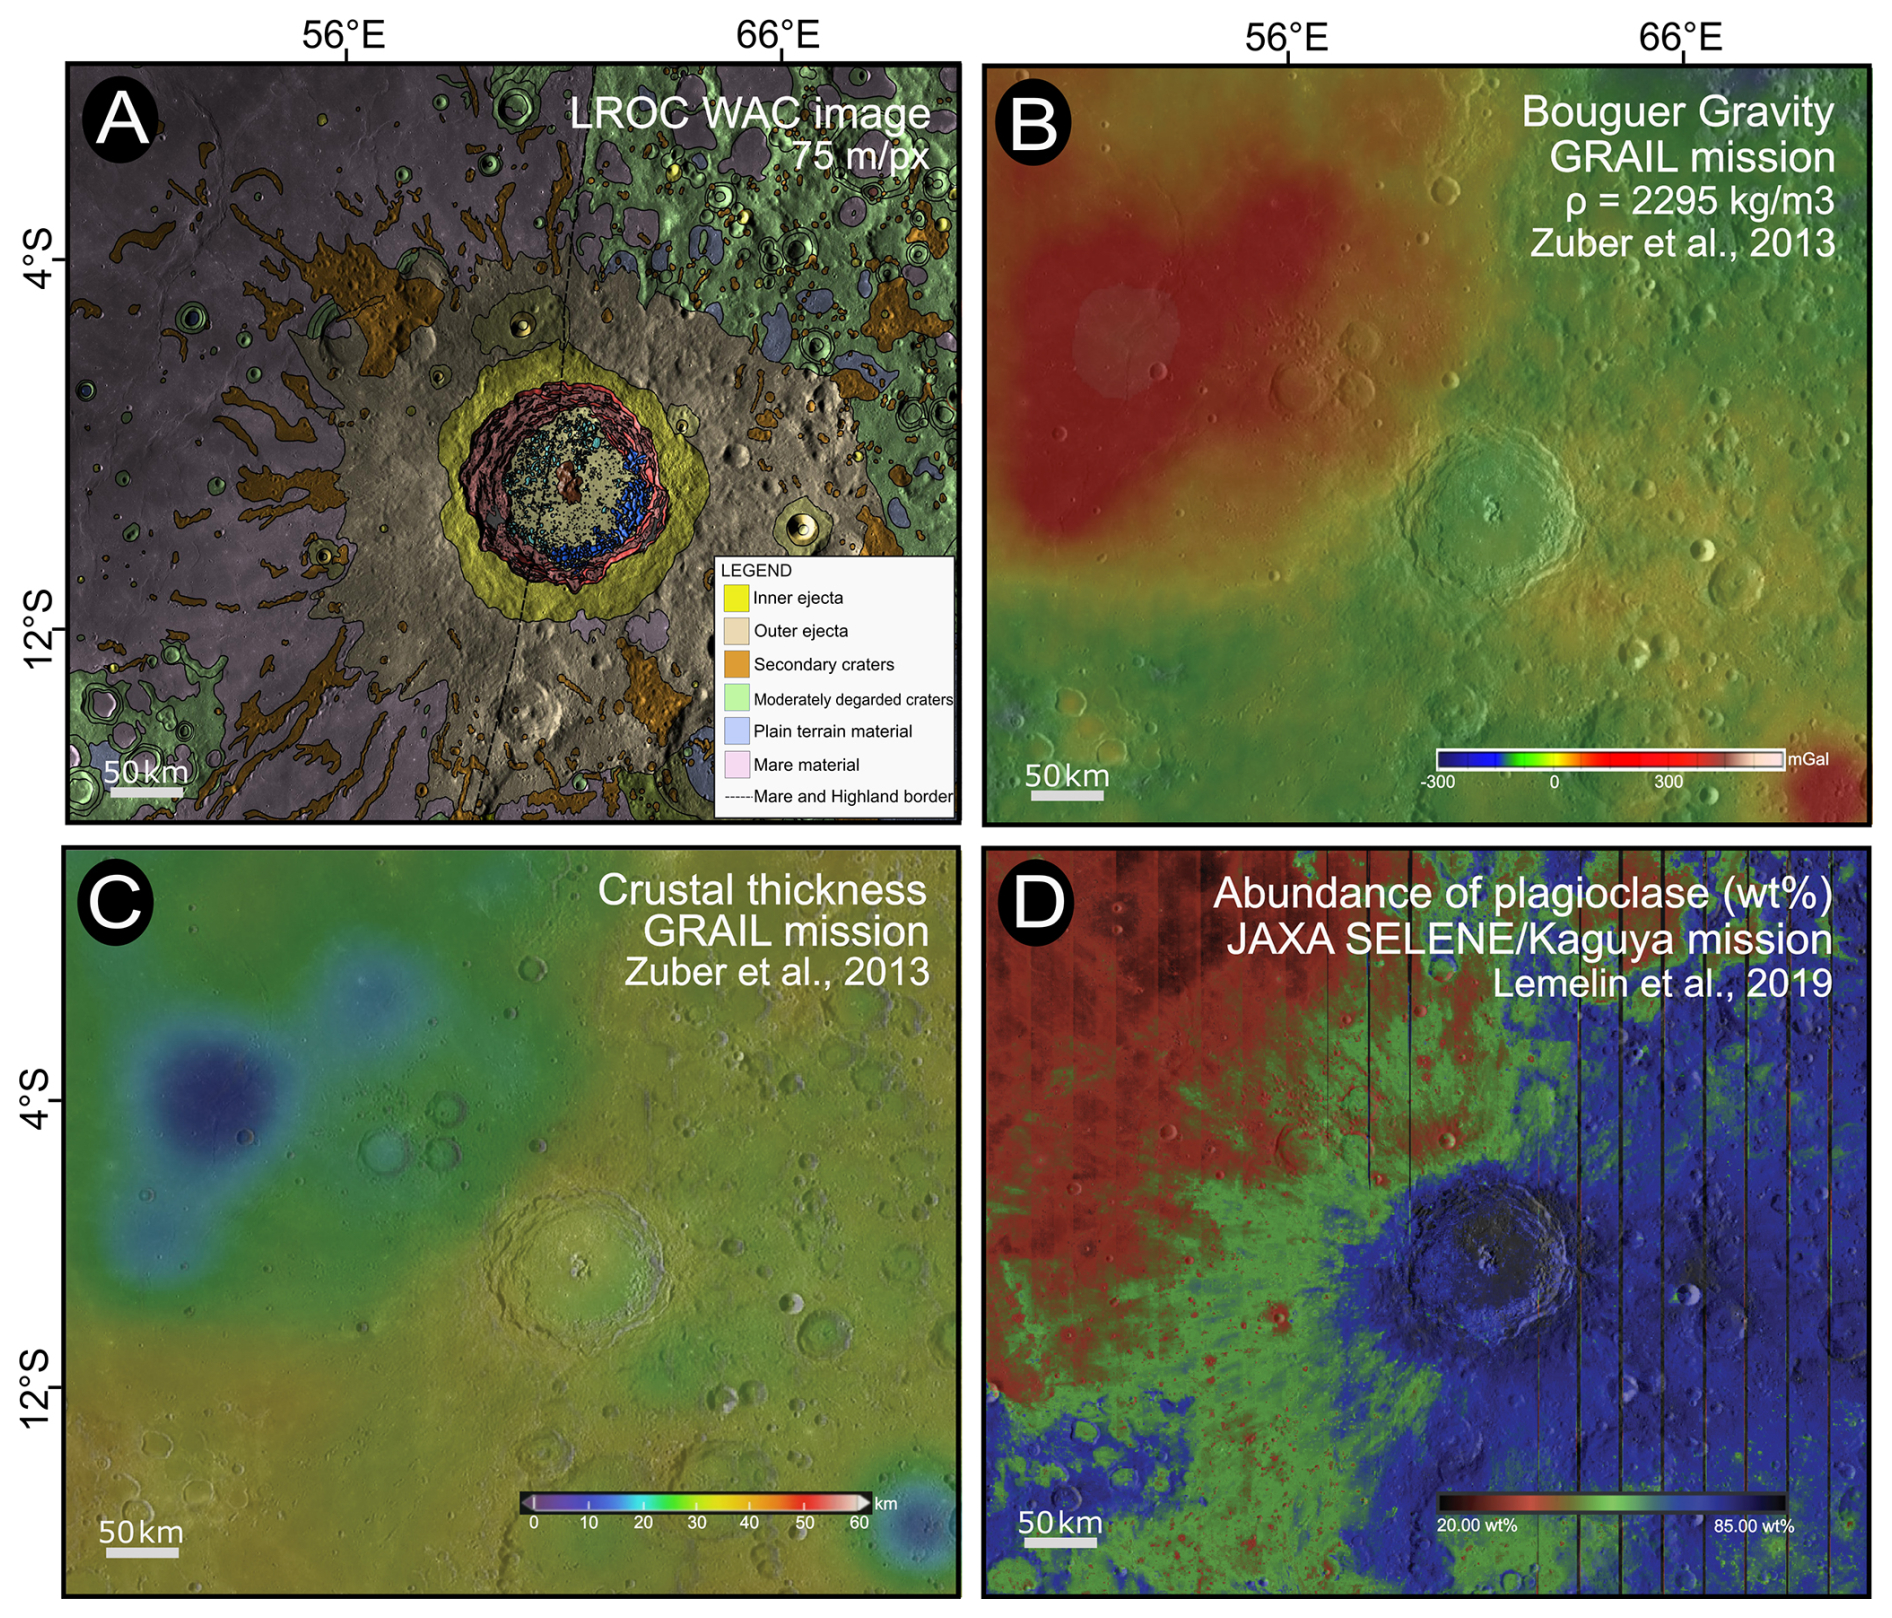
Figure 4(A) Geologic map of Langrenus crater at the eastern rim of Mare Fecunditatis. Note that the border between mare and highlands crosses the crater in north-south orientation. Legend of the crater units' interior is given in Fig. 5. (B) The Fecunditatis basin has a positive Bouguer gravity anomaly and, (C) a strongly reduced crustal thickness of less than 20 km. (D) Plagioclase abundance inferred from the JAXA Selene/Kaguya mission (Lemelin et al., 2019) shows that the mineralogical signature of the crater and eastern ejecta blanket of Langrenus is governed by the highland composition while the western ray-like ejecta shows a mixture of highland and mare signature.
3.1 Geologic Mapping of Langrenus crater
We mapped the Langrenus crater in detail inside its crater rim based on LROC-WAC imagery (Robinson et al., 2010) (Fig. 5a) and JANUS data (Fig. 5b). The mapped units within the JANUS frame include parts of the central uplift, crater floor, hummocky floor terrains, hummocky terrace terrains, scarps, and terraces. The same geological units were mapped in the LROC-WAC data for the full crater (Fig. 5).
Langrenus is a complex crater with a central uplift, a flat crater floor, a wide terrace zone, an elevated crater rim, and a preserved proximal and distal ejecta blanket. Geological mapping was performed in a GIS environment using the LROC-WAC mosaic and GLD100/WAC topographic products as regional basemaps and JANUS images for the high-resolution swath. The regional LROC-WAC-based map shown in Fig. 4 is displayed at an approximate scale of 1:1 500 000, whereas the detailed JANUS-based map shown in Fig. 5 is displayed at an approximate scale of 1:140 000. Units were defined from morphology, texture, albedo, topographic expression, crater density, and cross-cutting or embayment relationships. Interpretations such as impact melt, terrace collapse, or hummocky mass-wasting deposits were assigned only after the descriptive mapping of unit boundaries and stratigraphic relationships. Maximum elevation differences between rim crest and flat crater floor are ∼5 km. Note that elevation data were taken from NASA's Lunar Reconnaissance Orbiter (LRO) mission, available via NASA's QuickMap tool (GLD100 WAC Global DTM, 100 m resolution). The depth-to-diameter ratio of the crater is ∼0.028, taking the average elevation of the adjacent lunar highlands as a datum. The diameter of the central uplift (Cp) varies between 11 and 22 km at the level of the crater floor. The peaks of the central uplift tower over the crater plain by up to 1800 m. Only the northernmost section of the central uplift is covered by the JANUS camera strip. The central uplift in general appears branched and consists of three partly separated mountains.
The crater floor (Cf) is partly covered with blocks of various sizes that are mapped as two different hummocky terrains. The first (Hft) extending from the northern sector to the southwest of the crater plain is partially covered by the JANUS frames. It extends partially to the central mountain and consists of blocks up to several kilometers in diameter. The hummocky terrain forms two lobes on the flat crater floor and is at least partly bounded by straight lines. The eastern lobe is bordered by straight NS and NNW-SSE trending lineaments that are interpreted as tectonic faults (Fig. 5a, b). Further west is the hummocky terrain bordered by a straight NE–SW lineament. The northern terrace system is also partly covered by blocks, which cause the terraces to appear somewhat indistinct. The second field of blocks (Htt) is in the southeast, directly between the terrace zone and the flat crater floor (Fig. 5a). Here, the blocks are closer together and appear significantly larger. There is a clear separation of this hummocky terrain (Htt) to the northern one (Hft).
The width of the terrace zone (Tr) ranges between 19–31 km and is particularly broad in the western sector. It mostly consists of 2–5 fault-bounded terraces. The terraces often have lenticular shapes and are bordered by scarps (Sc). These scarps are normal faults of mostly concentric strike orientation. NW–SE striking faults partly control the shape of terraces in the eastern and western crater sectors (Fig. 5a). Some terraces form sloping relay ramps that connect adjacent terraces of different elevations. The vertical throws, here defined as the vertical displacement across normal fault scarps, were measured from the topographic offset between adjacent terrace surfaces using the GLD100 WAC Global DTM available through NASA QuickMap. They increase with increasing distance from the crater center in the frame of the JANUS strip and reach a maximum of 2.5 km (Fig. 6). The western and eastern terrace zones exhibit significant differences in both fault localization behavior and fault throw (Fig. 6). Locally, terraces are covered by plain terrain (PT) that is interpreted as impact melt rock.
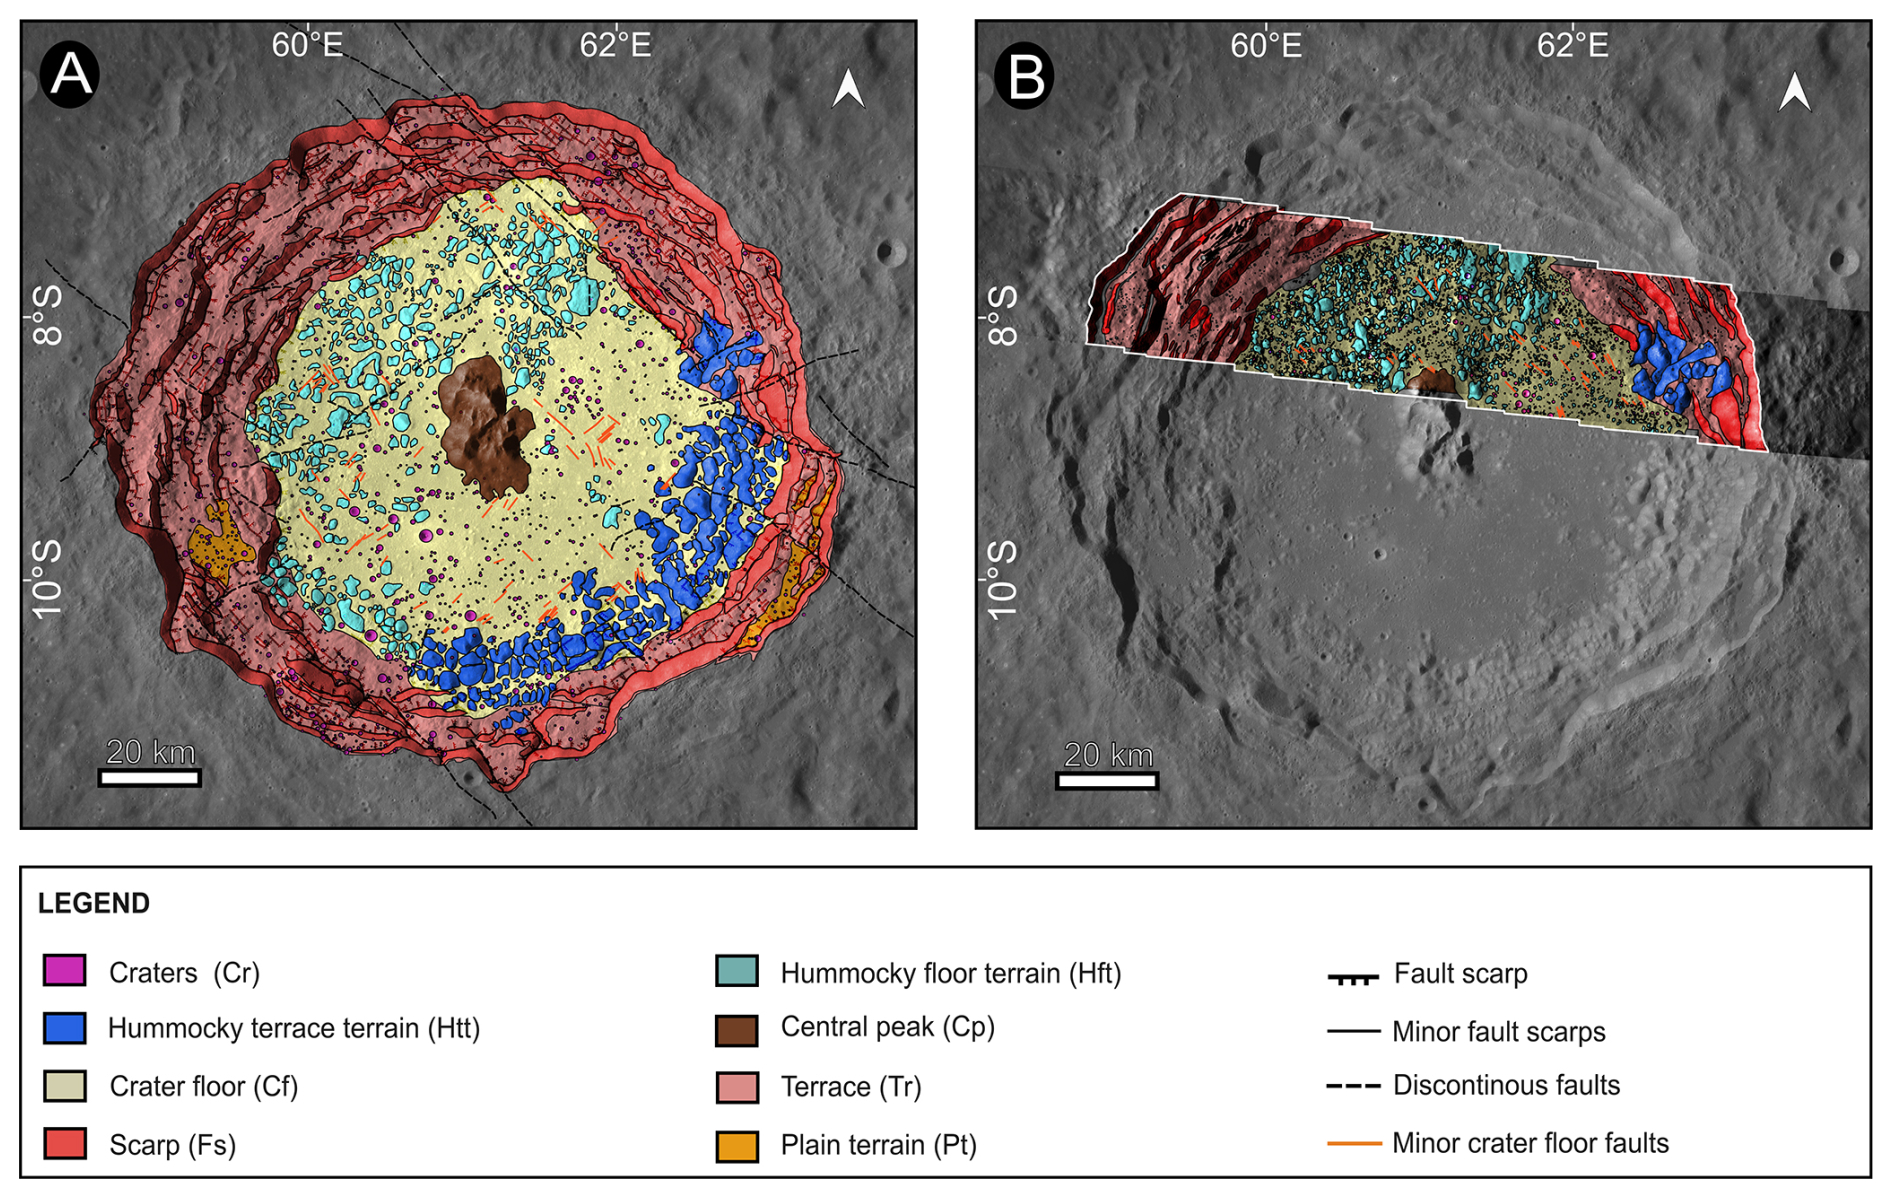
Figure 5Geological map of Langrenus crater within the crater rim. (A) Geological map, including tectonic faults, based on LROC-WAC data. Pre-impact faults dominantly strike NW–SE and are interpreted to radiate from the South Pole–Aitken basin, contributing to the partly polygonal outline of Langrenus crater. Faults mapped on the crater floor (Cf) and in the northern hummocky floor terrain (Hft) postdate crater formation. (B) Geological map, including tectonic faults, based on JANUS camera data. The higher spatial resolution of JANUS allows a more detailed mapping of the northern hummocky floor terrain, including a larger number of detected blocks than in the LROC-WAC-based map. The mapping/display scale is approximately 1:140 000.
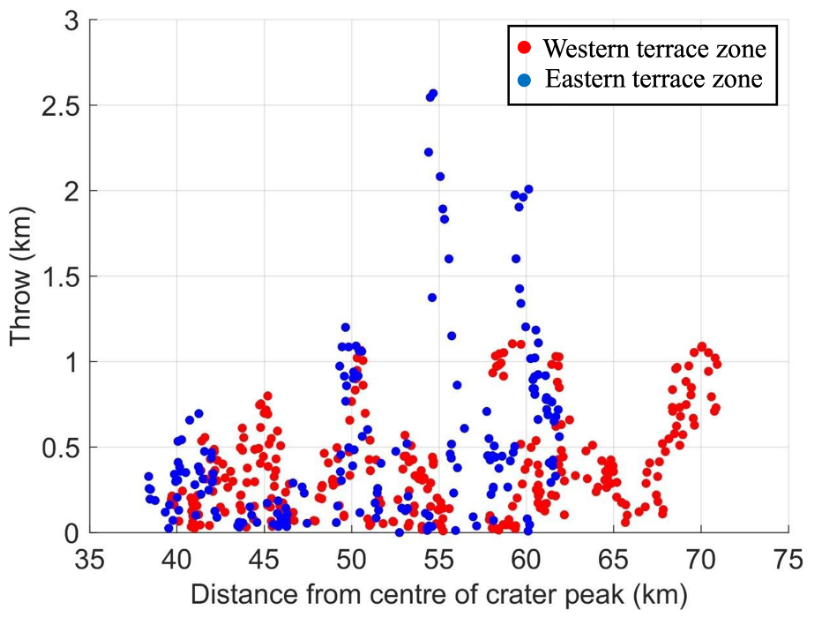
Figure 6Vertical throw (vertical displacement across normal fault scarps) of normal faults of the western (red) and eastern terrace zones (blue) as a function of distance to the crater center within the area covered by the JANUS data. Altimetric data were obtained from the LRO mission (GLD100 WAC Global DTM, 100 m resolution). The eastern terrace zone shows localized faults with large vertical throws concentrated at ∼40, 50, 55, and 60 km distance from the crater center, with maximum vertical displacement exceeding 2.5 km. The western terrace zone is broader, and deformation appears less localized but concentrated at throws of ∼45, 50, 60, and 70 km. The geological interpretation of these differences is discussed in Sect. 3.5.
3.2 Size-frequency distribution of impact craters
To investigate the formation and modification history of Langrenus crater, we measured the craters size-frequency distribution (CSFD) within the crater interior. Crater counts were performed on two interior units: the flat crater floor and the northern hummocky floor terrain. Count areas were selected to avoid obvious shadows, steep scarps, and boundaries between mapped units and were digitized as polygons shown in Fig. 7. CSFDs were measured and fitted using Craterstats (Craterstats 3.0 python version via https://github.com/ggmichael/craterstats, last access: 11 November 2026) and the lunar chronology function adopted for the main analysis (Michael and Neukum, 2010; Michael et al., 2016). Craters smaller than the estimated completeness diameter were excluded from the age fits. Because secondary and self-secondary craters can affect complex-crater interiors, the CSFDs were inspected for local slope changes, clustering, and excess crater densities. The observed excess at ∼1–1.5 km is therefore discussed as a possible secondary-crater contribution, rather than interpreted as a purely primary crater population. Based on LROC-WAC data, we confirm the 3.41 Ga model age obtained for the southern crater floor by Ivanov et al. (2023) . Using flat crater floor regions within the area covered by the JANUS camera, we determined consistent Imbrian ages of 3.36 and 3.49 Ga derived from JANUS (Fig. 7a–b) and LROC-WAC data (Fig. 7c–d), respectively, mapped at identical scales. Note that the size-frequency distributions of both datasets (Fig. 7b, d) show a higher-than-expected density of craters in the 1–1.5 km range, which may be caused by secondary craters.
Furthermore, we measured the crater SFD of the northern hummocky terrain using the JANUS dataset and compared it with crater counts based on LROC-WAC imagery (Fig. 7e–h). Interestingly, measurements from both datasets reveal significantly younger, Eratosthenian ages of 2.54 and 3.05 Ga for JANUS and LROC-WAC, respectively. This discrepancy suggests resurfacing of the region and possibly a later formation of the blocky region by mass wasting, or less influence by secondary craters. The variations between JANUS and WAC ages reflect the enhanced spatial resolution of JANUS (19–22 m per pixel) compared to LROC-WAC data (75 m per pixel), allowing for the detection of smaller features, and may additionally reflect the sensitivity of the fitted absolute ages to the adopted chronology model and fitting range.
To assess the robustness of the inferred chronology, we additionally fitted the four crater size-frequency distributions using the Model Production Function (MPF) approach of Marchi et al. (2009). The calculations adopted a hard-rock scaling law, a target strength of 2×10⁷ dyne cm−2, impactor and target densities of 2.6 and 3.0 g cm−3, respectively, and an impact-velocity distribution peaking at 18 km s−1. A near-Earth-object-like impactor size-frequency distribution was adopted, which is appropriate for the relatively young terrains considered here. The fits were restricted to craters with diameters D>0.4 km in order to limit the influence of observational incompleteness at smaller diameters.
The MPF-derived ages for the crater-floor unit are 3.4±0.1 Ga for the JANUS count and 3.5±0.1 Ga for the LROC-WAC count. These values closely reproduce the Imbrian ages derived above. For the northern hummocky terrain, the corresponding MPF ages are 2.4±0.2 Ga from JANUS and 2.2±0.3 Ga from LROC-WAC data. Although the absolute age of the hummocky terrain varies between chronology models, both approaches consistently indicate that it is substantially younger than the adjacent crater floor. Hence, the younger apparent age of the hummocky floor terrain should therefore not be interpreted solely as the emplacement age of the Langrenus-forming impact. It may also reflect poorer crater retention on rough, block-rich mass-wasting deposits, where small craters are more easily degraded or obscured, as discussed for other lunar blocky and hummocky terrains. The reported MPF uncertainties represent analytical fitting uncertainties, rounded to the nearest 0.1 Ga, and do not include possible systematic effects associated with alternative assumptions on target properties, impactor populations, or scaling parameters (Kirchoff et al., 2021; Kirchoff and Marchi, 2023). The individual MPF fits and the corresponding reduced-χ2 functions are reported in Appendix B (Figs. B1 and B2).
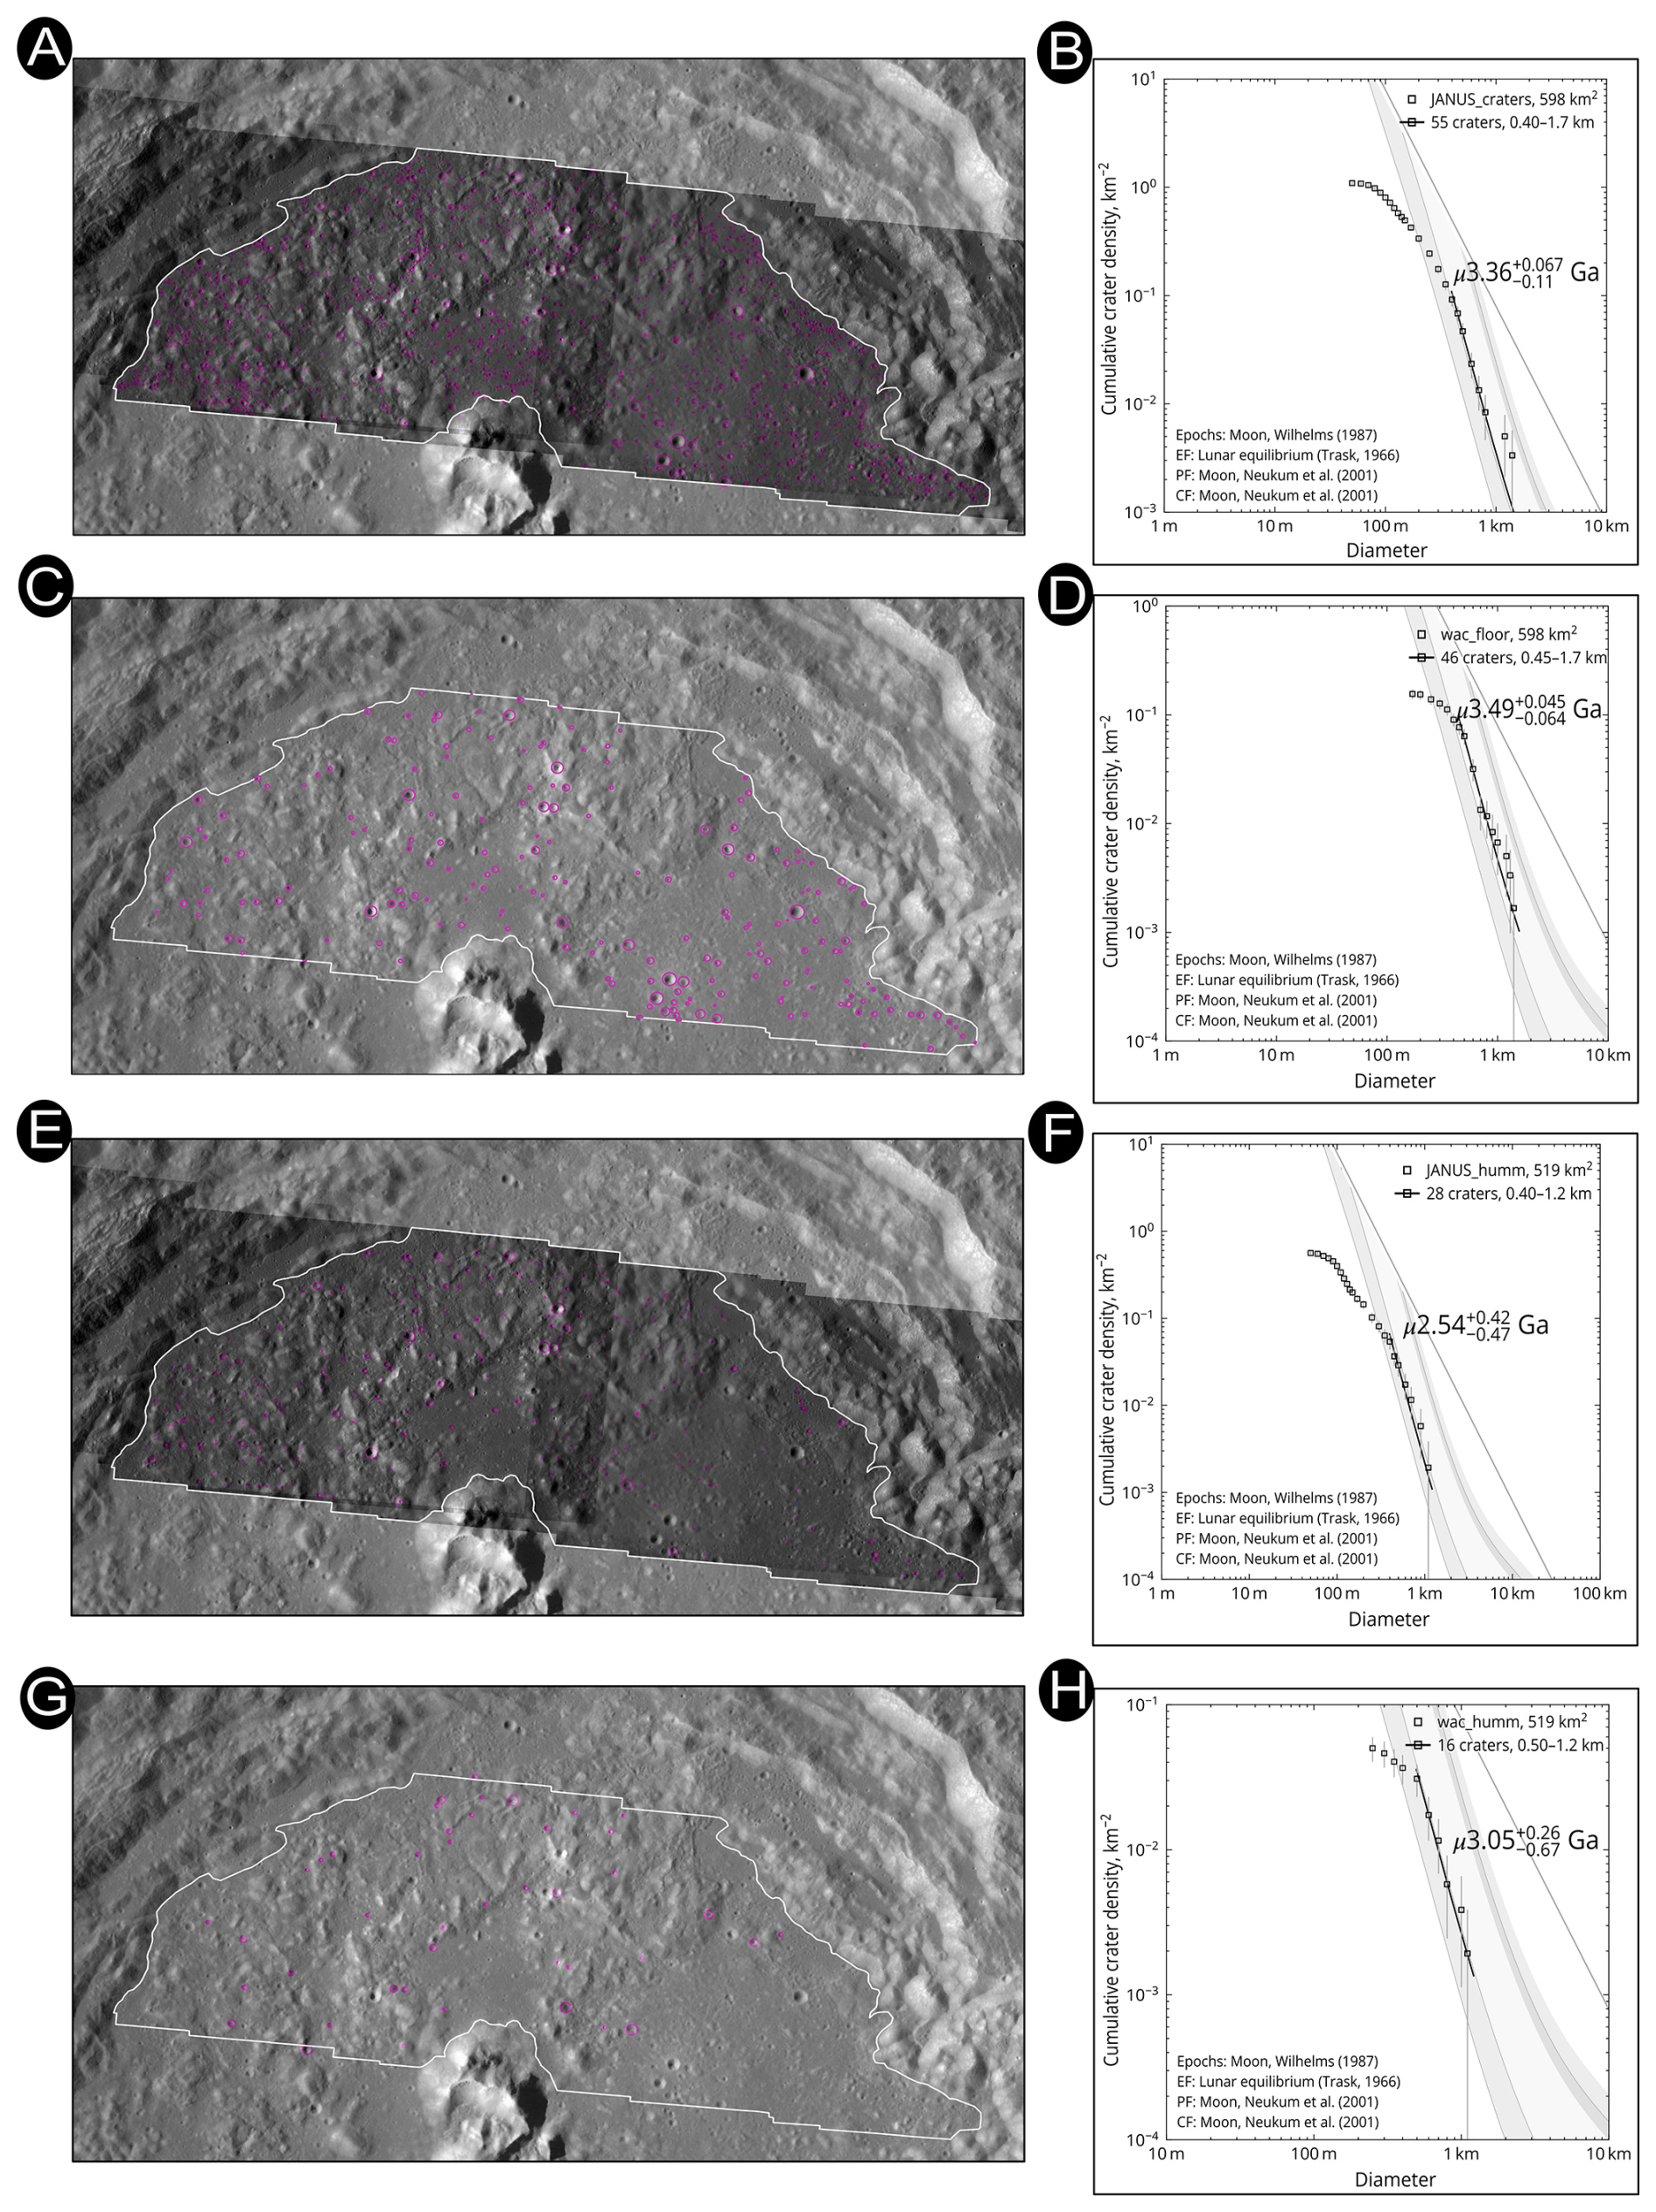
Figure 7Crater size-frequency distribution measurements for the Langrenus crater floor and northern hummocky floor terrain. White outlines indicate the count areas used for the CSFD measurements, including the crater-floor and northern hummocky floor terrain areas analysed in both the JANUS (A, B, E, F) and LROC-WAC (C, D, G, H) datasets. The marked craters are retained in the main figure to document the counting procedure. The excess of craters around ∼1–1.5 km is interpreted cautiously because it may include secondary or self-secondary craters. SFD of crater floor units give Imbrian ages of 3.36 and 3.49 Ga, respectively, using JANUS data (A–B) and LROC-WAC data (C–D). In contrast, SFD of the northern hummocky terrain give Eratosthenian ages of 2.54 and 3.05 Ga, respectively using JANUS data (E–F) and LROC-WAC data (G–H).
3.3 Block-size frequency distribution
To further characterize the hummocky terrain (Hft) of the northern flat crater floor and adjacent terraces, we analyzed the block-size frequency distribution (BSFD). Understanding the fragmentation of these blocks provides insights into the mass wasting or impact-related processes that emplaced this unit. We mapped identical areas of the hummocky terrain using datasets with varying spatial resolutions: LROC-NAC (0.5–2 m per pixel) (Fig. 8a), Kaguya (10 m per pixel) (Fig. 8b), JANUS (19–22 m per pixel) (Fig. 8c), and LROC-WAC (75 m per pixel) (Fig. 8d). Due to the extremely high spatial resolution of LROC-NAC, block size measurements for this dataset were restricted to smaller sub-areas. We determined BSFD at identical map scales (except for LROC-NAC) and plotted them versus the cumulative frequency in double logarithmic (Fig. 8e) and single logarithmic diagrams (Fig. 8f). The BSFD can be approximately described by a power-law distribution for blocks >1 km2, where it forms roughly a straight line. As expected, the total number of detected blocks, the minimum block size, and the critical cut-off block size (where a distinct departure from a power-law distribution occurs) decrease with increasing data resolution (Fig. 8e, f). The smallest detectable block sizes for the JANUS camera were 2– km2. Although the LEGA lunar dataset does not include additional higher-resolution JANUS imaging of this area, the comparison with LROC-NAC and Kaguya TC provides a useful benchmark for assessing how JANUS bridges regional WAC-scale mapping and very-high-resolution targeted observations. This is directly relevant for future JANUS observations of blocky terrains on the Galilean moons.
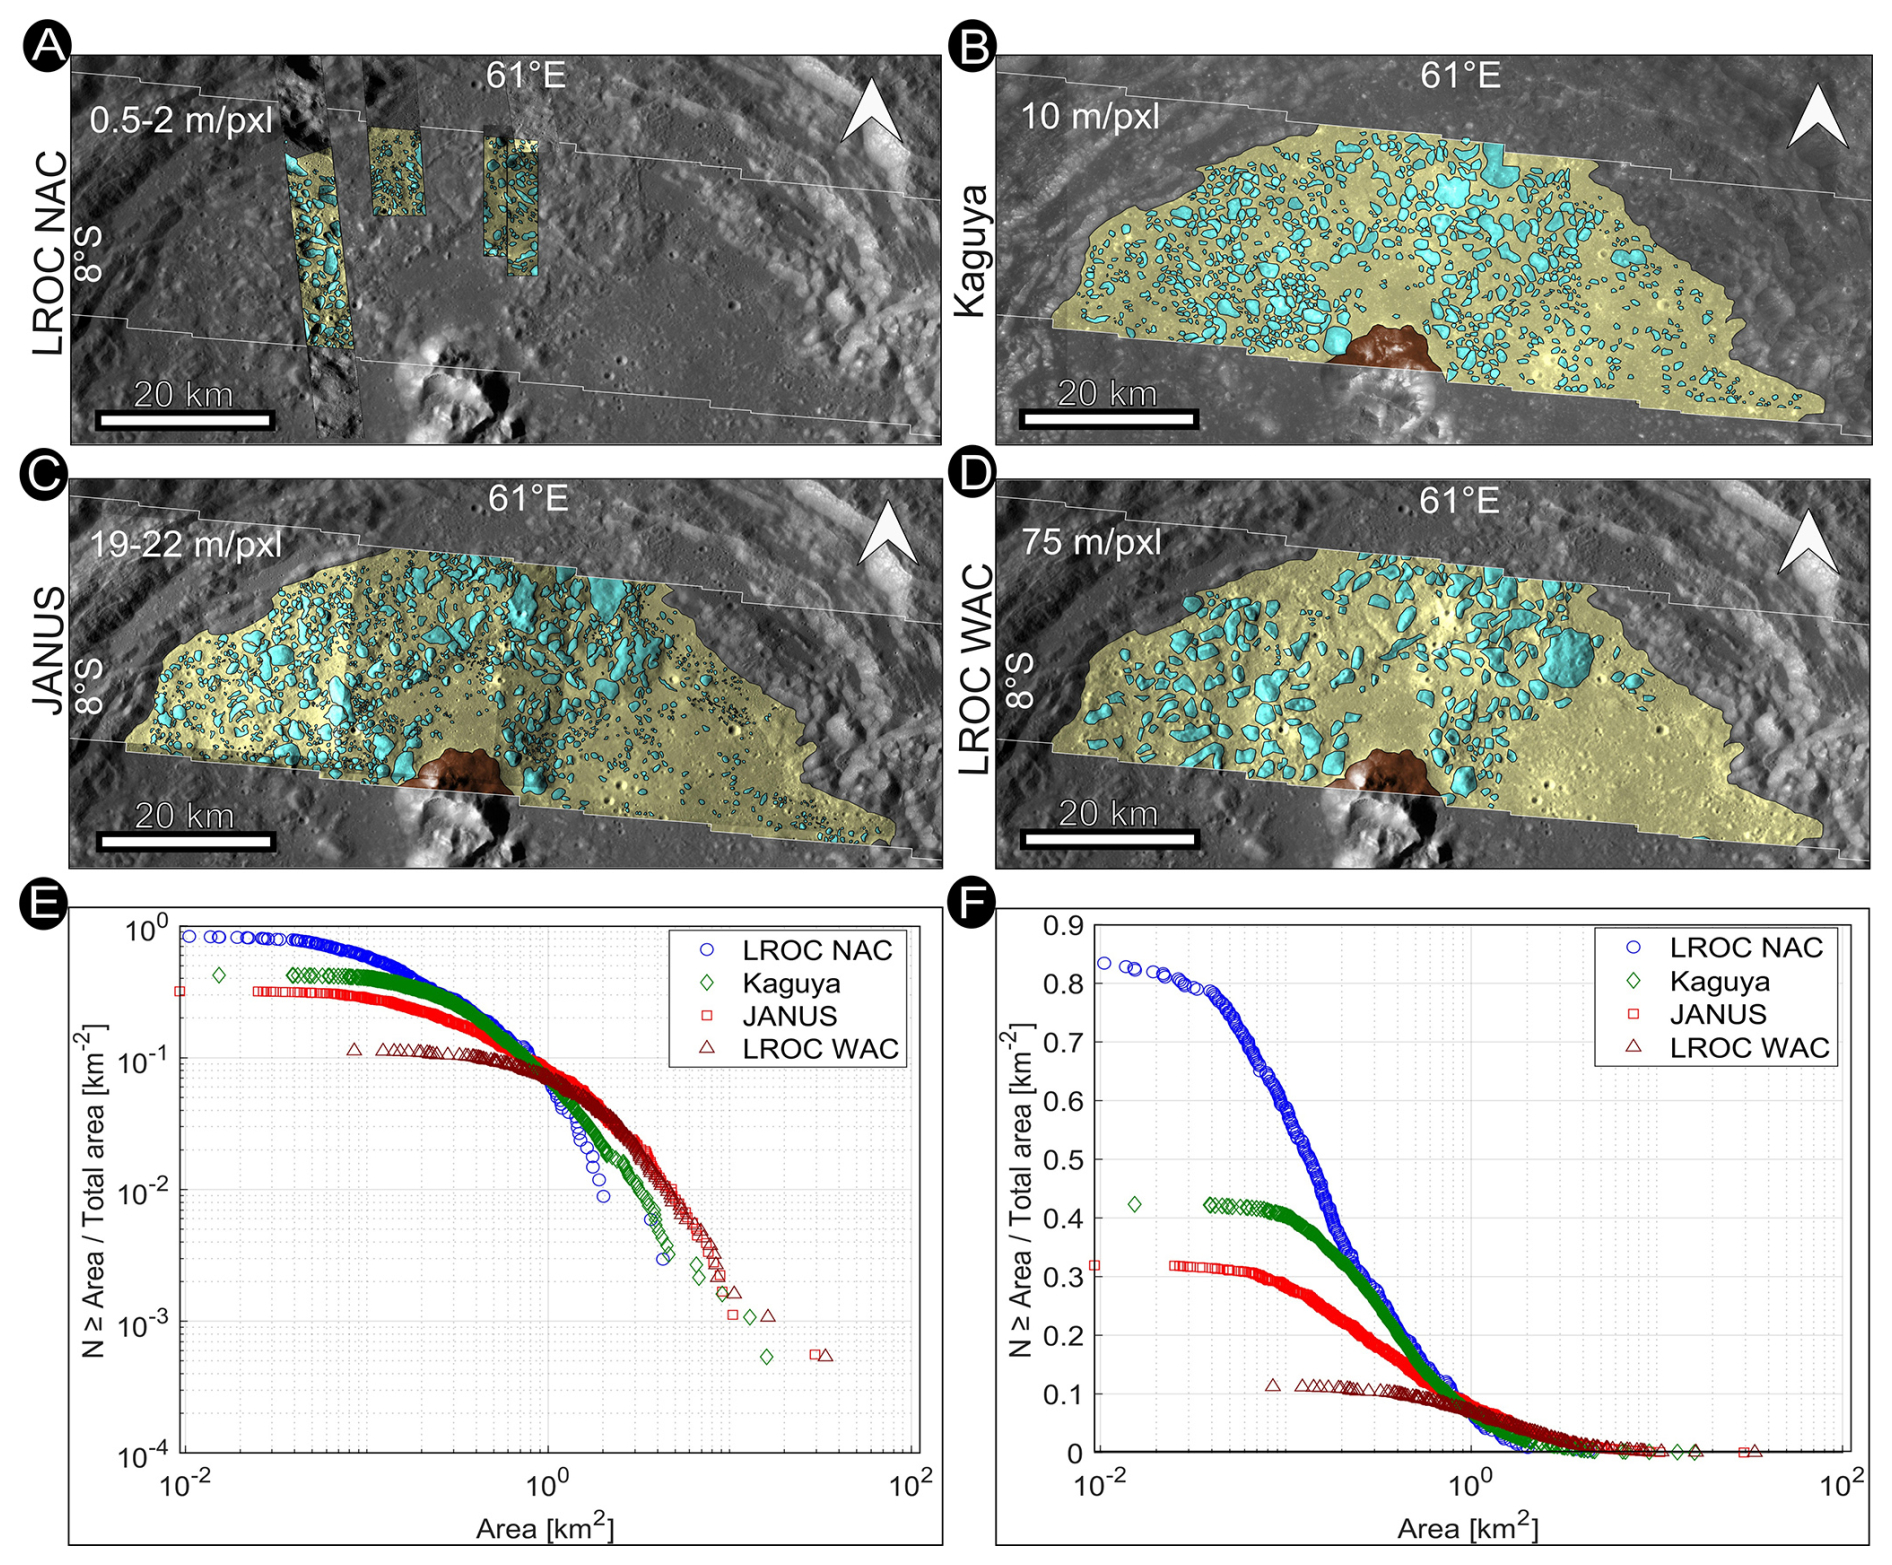
Figure 8Comparative mapping of the northern hummocky terrain using different remote sensing resources. (A) LROC-NAC, map-scale: 0.5–2 m per pixel, (B) Kaguya, map-scale: 10 m per pixel, (C) JANUS, map-scale: 19–22 m per pixel, (D) LROC-WAC, map-scale: 75 m per pixel. Except for LROC-NAC, blocks were mapped at the same mapping scale. (E) Double logarithmic cumulative block size frequency distribution of the four data sets. (F) Single logarithmic cumulative block size frequency distribution of the four data sets. The double-logarithmic plot is used to evaluate approximate power-law behavior at larger block sizes, whereas the semi-logarithmic representation emphasizes the resolution-dependent loss of small blocks and the different completeness limits of the datasets. The total number of mapped blocks increases with increasing spatial resolution.
3.4 Spectrophotometric analysis
To investigate the compositional characteristics of Langrenus crater, a detailed spectrophotometric analysis was performed on the four multi-filter data cubes generated from the JANUS observations (Fig. 2). The analysis integrates qualitative spectral inspection, statistical clustering, and quantitative spectral unmixing to assess surface mineralogical variability across the crater floor, walls, and rim. All analyses were conducted on co-registered multi-filter cubes radiometrically calibrated to radiance factor (I/F) and photometrically normalized to a standard viewing geometry (incidence 30°, emission 0°, phase 30°) using the Hapke model. This correction minimizes illumination-induced variability and ensures that spectral differences primarily reflect intrinsic surface properties rather than observational geometry effects. Although the Hapke correction uses per-pixel illumination and viewing geometry, residual topographic effects may persist in rugged terrain, especially along steep crater walls, blocky hummocky surfaces, and shadow boundaries. For this reason, we do not base compositional interpretations on single-pixel anomalies, but on spectral behaviours that are spatially coherent, repeated in multiple ROIs, and consistent with mapped geological units.
Given the limited four-band spectral sampling (450, 646, 910, and 1015 nm), the results presented here emphasize relative compositional trends and spectral coherence rather than precise mineralogical determinations.
3.4.1 RGB composite and absorption features
RGB composites were generated using the Blue (450 nm), Red (646 nm), and NIR1 (910 nm) filters to enhance subtle color variations across the crater interior and rim (Fig. 9). These composites reveal distinct spectral heterogeneities that correlate with mapped geological units, including the crater rim, flat floor, and northern hummocky floor terrain (Hft).
Regions of interest (ROIs) extracted from the four data cubes show variations in spectral slope and absorption behavior at longer wavelengths. Several ROIs, particularly within the northern hummocky terrain (Cube#2, Cube#3) and along portions of the crater rim (Cube#1), display a broad decrease in reflectance at 1015 nm relative to 910 nm (Fig. 9, right panels) which correspond to the blue colors in RGB composites (Fig. 9, left panels). This spectral behavior is consistent with the long-wavelength shoulder of mafic absorption features.
Indeed, the observed absorption pattern is also compatible with olivine-bearing assemblages, which typically exhibit a broad composite absorption band centered near ∼1050 nm. In contrast, pyroxenes generally display narrower absorptions centered between ∼900 and 1000 nm depending on Ca content. While JANUS spectral sampling does not allow precise band-center determination, the relative spectral curvature and long-wavelength behavior are more consistent with an olivine-bearing component than with purely pyroxene-dominated lithologies. Importantly, these spectral signatures are not restricted to a single localized exposure but occur in multiple cubes along the JANUS track, suggesting that mafic components are distributed across several geomorphological units rather than confined to isolated patches. Because of the limited number of spectral bands, these detections should be interpreted as indicative of mafic enrichment consistent with olivine-bearing materials, rather than definitive mineralogical identification.
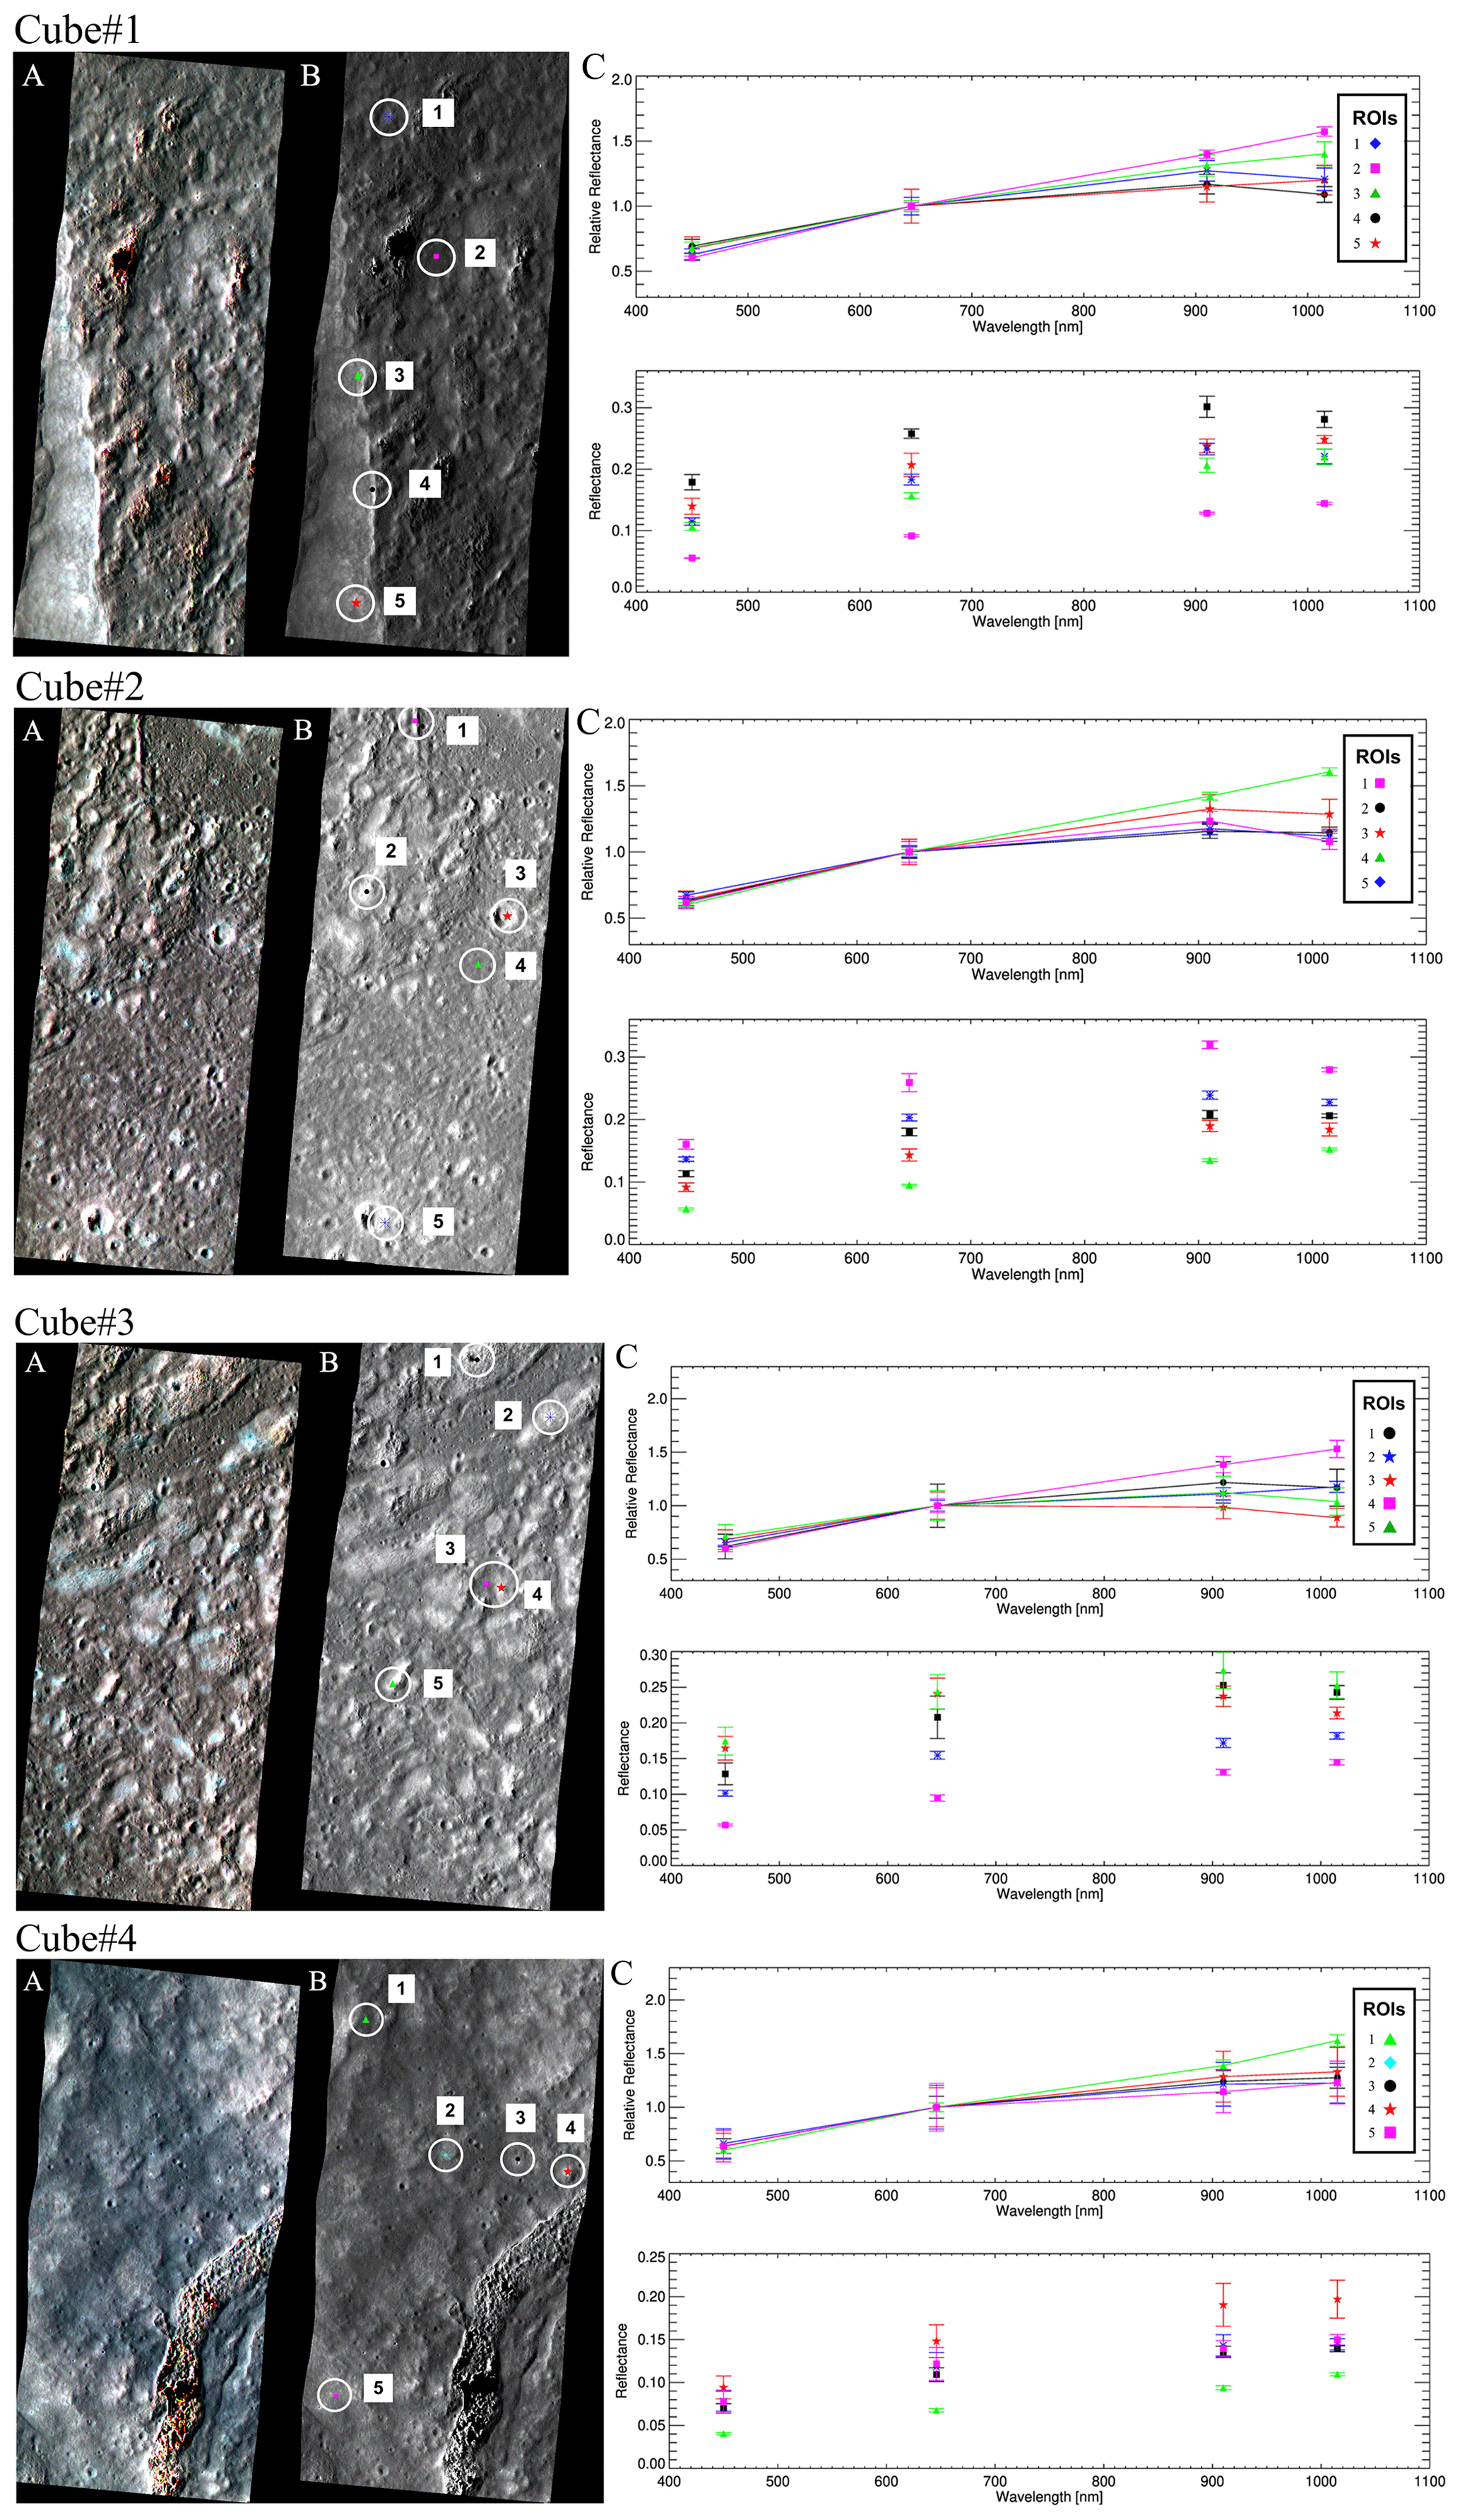
Figure 9Spectrophotometric identification of olivine-bearing materials within the Langrenus data cubes. For each cube (Cube #1; Cube #2; Cube #3; Cube #4), (A) panels show RGB composites generated using the Blue (450 nm), Red (646 nm), and NIR1 (910 nm) filters. The (B) panels display the locations of the analyzed ROIs overlaid on the corresponding composite images; ROIs are numbered in addition to being colour-coded to facilitate comparison with the spectra. The (C) panels report the corresponding relative and absolute reflectance spectra extracted from the identified ROIs. The analyzed ROIs were selected to sample distinct mapped geomorphological settings rather than isolated pixels: rim-related rough material, block-rich northern hummocky floor terrain, relatively smooth crater-floor deposits, and local crater-wall or slope exposures. At JANUS spectral resolution these sites cannot be uniquely assigned to megablocks, impact-melt breccias, or small fresh-crater ejecta, but their geological context is used to distinguish coherent unit-scale trends from isolated bright or shadowed exposures. Several ROIs exhibit subtle long-wavelength reflectance decreases toward 1015 nm relative to 910 nm, indicative of mafic absorption behavior consistent with olivine-bearing or pyroxene-rich lithologies. Spectra showing a broad long-wavelength absorption consistent with olivine are identified in the black ROI of Cube #1, the purple ROI in Cube #2, and both red and green ROIs in Cube #3. The spatial distribution of these features suggests that mafic components are not confined to isolated exposures but occur across multiple geological units within the crater interior.
3.4.2 Spectral Clustering
Considering the presence of possible olivine-related absorption features in several ROIs of the Langrenus cubes, we further explored the dataset by applying a spectral clustering technique to investigate compositional variations within different selected regions. Beyond the geological implications, this analysis also serves as a test of advanced spectral classification techniques on JANUS multispectral data, assessing their capability to extract meaningful compositional information from a limited number of spectral bands.
This unsupervised classification method allows for the identification of distinct spectral units based on their reflectance properties across the available wavelength bands, facilitating the correlation of spectral signatures with geological features. We applied a statistical clustering algorithm to the normalized photometrically corrected dataset based on the K-means method (Marzo et al., 2006). This technique partitions the multi-dimensional spectral data into several clusters, where each pixel is assigned to the cluster with the nearest mean spectral signature. The method, developed and evaluated by Marzo et al. (2006, 2008, 2009), utilizes the Calinski-Harabasz criterion (Calinski and Harabasz, 1974) to determine the optimal or intrinsic number of clusters, making the process effectively unsupervised. The number of clusters was determined automatically based on the variance within the dataset. Each resulting cluster is characterized by an average spectrum (centroid) and its associated variability (standard deviation). Importantly, the relative geographic information of each pixel is maintained, allowing the resulting spectral clusters to be mapped back onto the image plane. These spectral maps can then be directly correlated with the high-resolution geological maps to interpret the physical and compositional meaning of the identified units. This spectral clustering approach has been successfully applied to compositional interpretations of various solar system bodies, including Mars, Iapetus, Phobos, Mercury and Ganymede (Marzo et al., 2006, 2008, 2009; Mege et al., 2023; Pinilla-Alonso et al., 2011; Dalle Ore et al., 2012, 2015, 2018, 2019, 2021; Pajola et al., 2018, 2021; Lucchetti et al., 2018, 2021, 2023; Rizos et al., 2019, 2021). While the technique is agnostic to the specific physical meaning of the clusters, the resulting spectral unit maps provide a powerful tool for distinguishing between surface materials such as fresh impact ejecta, mature regolith, and distinct mare basalt flows.
Our analysis identified consistent spectral clusters across the dataset, including clusters associated with possible olivine absorption features in the JANUS cubes. As a representative example, we present here the analysis of two selected regions of interest (ROIs) within both Cube #1 and Cube #3 (Fig. 10). In Cube #1, two 50×50 pixel ROIs were defined: one located near the area previously identified as showing a potential olivine-related spectral signature (ROI1), and a second positioned just outside the crater rim for comparison (ROI2).
In the ROI1, clusters #2 and #8 are spatially associated with the crater rim and exhibit spectral characteristics consistent with a possible olivine-related absorption feature. In contrast, the ROI2, located outside the rim, does not display significant long-wavelength absorption behavior, and its clusters show comparatively featureless spectral slopes.
A similar approach was applied to Cube #3. Two ROIs were selected: one on the flat crater floor (ROI3) and another within the northern hummocky floor terrain (Hft) (ROI4). The ROI3 shows no distinct absorption features across its associated clusters. Conversely, in ROI4, cluster #7 and cluster #8 display centroid spectra characterized by a broad long-wavelength absorption, consistent with the presence of mafic components compatible with olivine-bearing material.
The identification of possible olivine within Langrenus is consistent with previous reports of olivine-bearing basalts in Mare Fecunditatis, particularly along its peripheral regions (e.g., Thapa et al., 2025). This observation supports the interpretation of a compositionally heterogeneous lunar crust and aligns with the geological setting of Langrenus, which formed near the boundary between mare and highland terrains and is influenced by mare-derived materials.
Furthermore, the detection of similar long-wavelength absorption behavior in the eastern cube suggests that a mare-related spectral contribution may extend across much of the crater interior, rather than being restricted to isolated exposures. Such a widespread mare-related spectral contribution is compatible with the expected formation of impact melt and breccia in a complex crater excavated at a mare-highland boundary. The JANUS spectra do not distinguish impact melt from brecciated target material, but the geological setting supports mixing and redistribution of mare-derived and highland-derived components during and after crater formation.
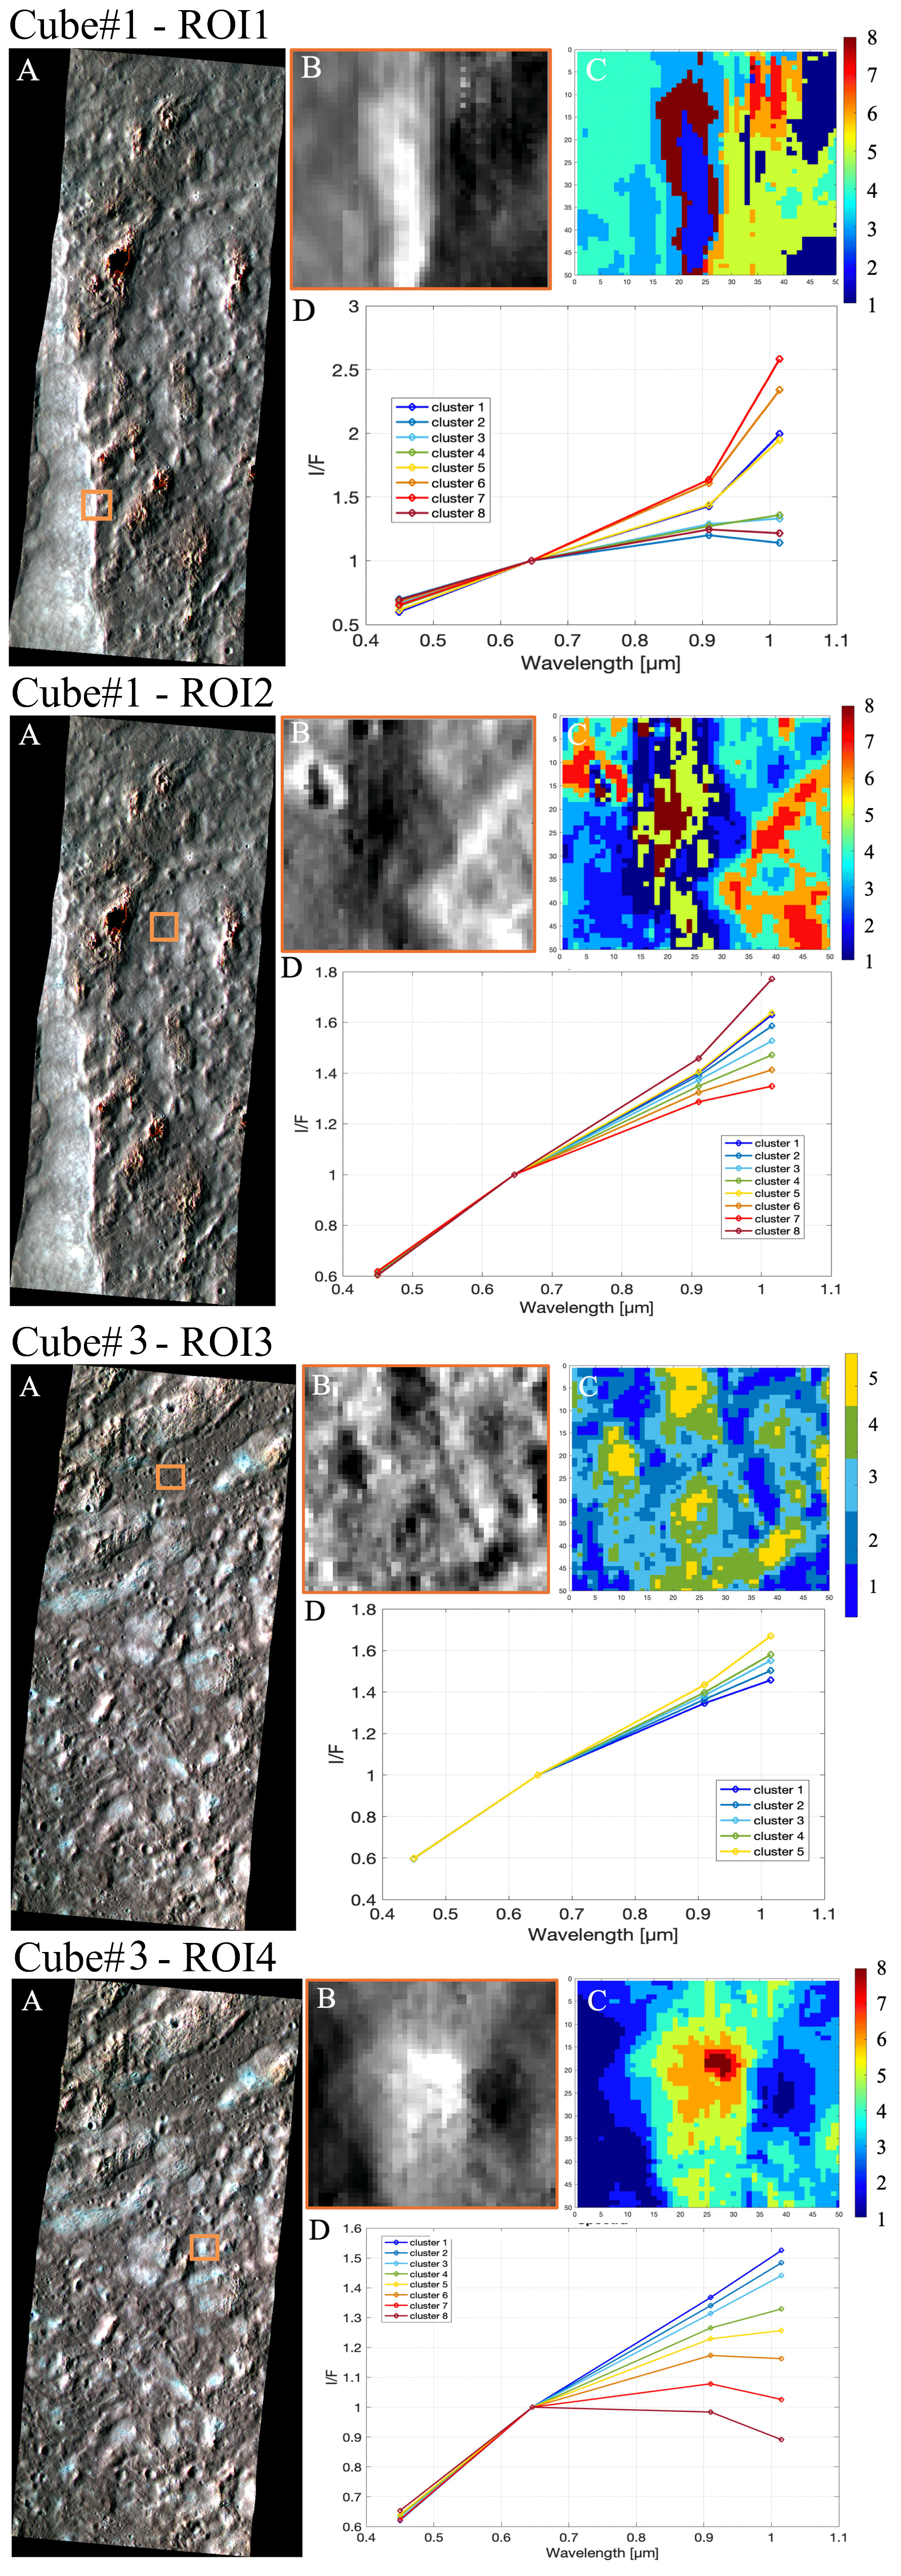
Figure 10Representative reflectance spectra extracted from selected ROIs (A) within the JANUS cubes covering Langrenus. Panel (B) shows the close-up of the identified ROIs and panel (C) shows the clustering results. Scale bars have been added to the left image stripes to provide spatial context. In panel (D), spectra are shown as photometrically corrected radiance factor (I/F) values at 450, 646, 910, and 1015 nm. Curves corresponding to ROIs located in portions of the crater rim (ROI1, clusters #2 and #8 of Cube #1) and in the northern hummocky floor terrain (ROI4, clusters #7 and #8 of Cube #3) display a broad long-wavelength absorption behavior characterized by reduced reflectance at 1015 nm relative to 910 nm. This spectral curvature is consistent with mafic mineral absorption features and is compatible with the presence of olivine-bearing components, although precise mineral identification is limited by the four-band spectral sampling and by the spectral resolution imposed by the available multicolour filters. ROIs extracted from the flat crater floor (ROI2 of Cube #1 and ROI3 of Cube #3) show comparatively neutral slopes and weaker long-wavelength absorption signatures that may reflect more mature, less recently refreshed regolith, where space weathering and regolith gardening reduce band contrast relative to fresher slopes, blocky terrains, or crater-rim exposures.
3.4.3 Spectral Unmixing
To further constrain surface spectral composition, linear spectral unmixing was applied to the four consecutive JANUS frames covering the Langrenus crater area. The Fully Constrained Least Squares (FCLS) method was used to model each pixel spectrum as a linear combination of laboratory endmembers from the RELAB database, resampled to the JANUS 4-filter configuration. The spectral library includes 14 representative lunar materials (anorthite, pyroxenes, olivine mixtures, ilmenite, glasses, etc.), complemented by two synthetic flat spectra (“black” and “white”) introduced to account for continuum offsets and global albedo variations. These synthetic components are not interpreted as mineral phases but serve to stabilize the inversion and absorb residual brightness effects.
The modeled compositions indicate that mafic-related spectral components (pyroxenes, olivine mixtures, lherzolite, ilmenite, glasses) account for approximately 61 %–63 % of the retrieved signal, while feldspathic components (anorthite and plagioclase varieties) contribute ∼ 19 %–21 %. Hydrous/OH-bearing spectra represent a minor fraction (∼ 6 %–7 %). These proportions are consistent across the four frames, with no significant variability, indicating stable retrieval behavior despite the limited spectral sampling.
The modest mafic contribution inferred from unmixing is consistent with mixing across a mare-highland compositional boundary, as observed in other lunar transition zones (e.g., Li and Mustard, 2003), rather than requiring exposure of extensive olivine-rich bedrock. Conversely, flatter or more mature surfaces may show reduced spectral contrast due to space weathering and regolith gardening.
However, given the limited number of spectral bands, the broad/narrow bandwidths of the available multicolour filters, and expected degeneracies between mafic endmembers, these results should be interpreted as indicative of dominant spectral trends rather than precise modal mineralogy.
Olivine abundance maps derived from the unmixing procedure show spatially coherent modeled contributions, reaching maximum values of ∼6 %. Given the restricted spectral sampling, these values reflect modeled VNIR spectral contributions rather than direct detection of highly olivine-rich lithologies.
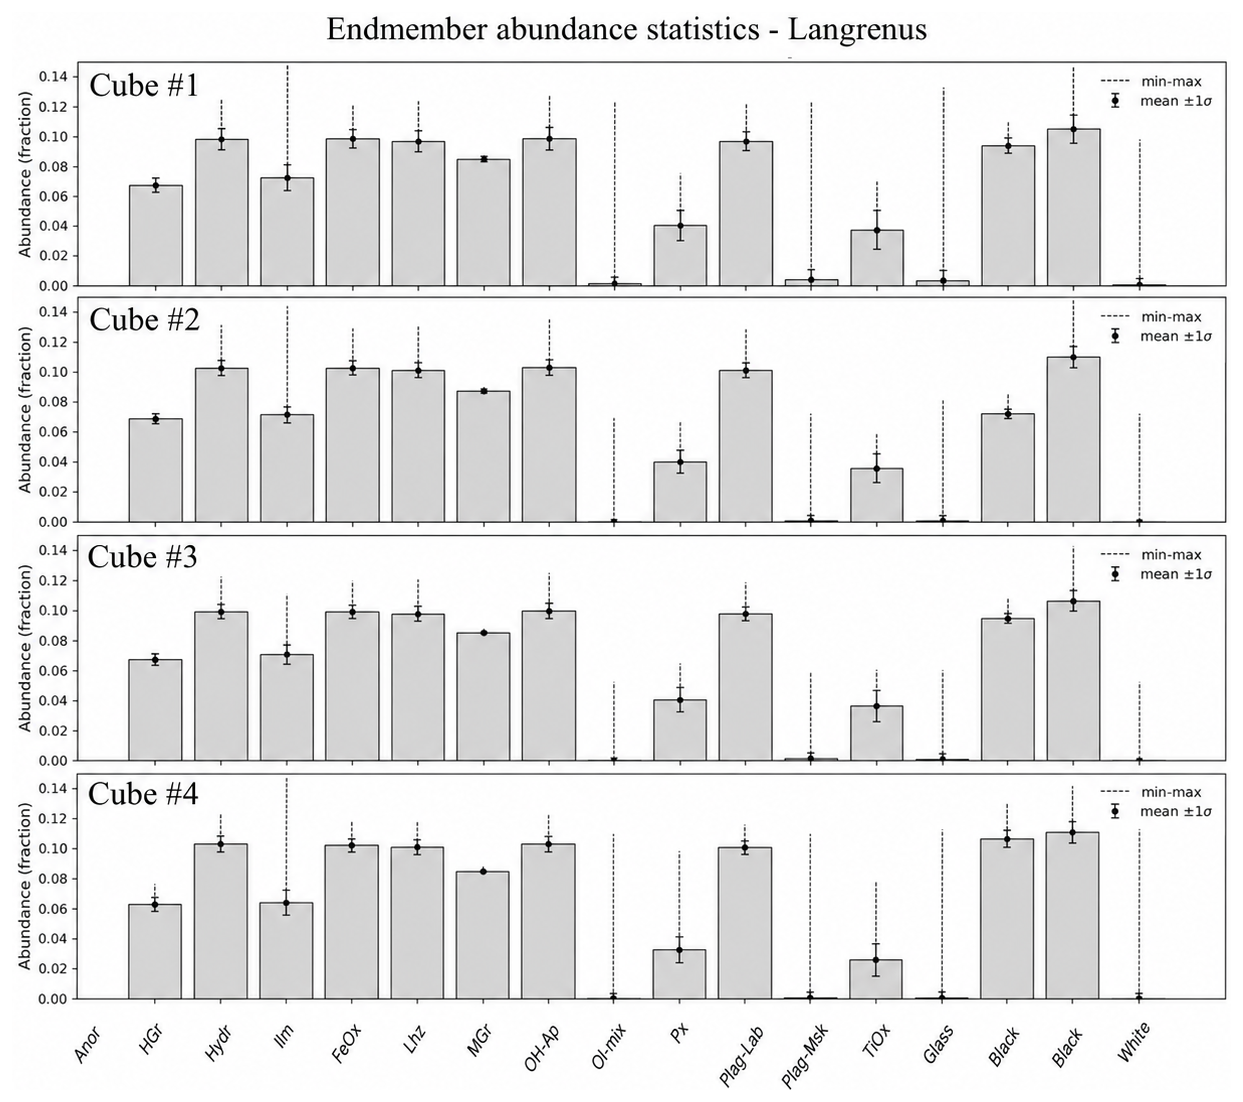
Figure 11Endmember abundance statistics derived from FCLS spectral unmixing for the four Langrenus JANUS cubes. Bar charts show the fractional contribution of the 14 laboratory endmembers used in the model. For readability, endmembers are labelled using abbreviated names: Anor: anorthosite; HGr: highland grain-size mixture; Hydr: hydroxyl-bearing endmember; Ilm: ilmenite; FeOx: iron oxide; Lhz: lherzolite; MGr: mare grain-size mixture; OH-Ap: OH-bearing apatite; Ol-mix: olivine mixture; Px: pyroxene; Plag-Lab: plagioclase/labradorite; Plag-Msk: plagioclase/maskelynite; TiOx: titanium oxide; Glass: glass-rich endmember; Black and White: synthetic continuum/albedo terms. Bars indicate mean fractional abundance, black points indicate mean ±1σ, and dashed vertical lines indicate the min–max range. All cubes display a surface composition dominated by mafic components (∼61 %–63 %), with subordinate feldspathic contributions and minor hydrous/OH-bearing phases, indicating compositional consistency along the JANUS observation track.
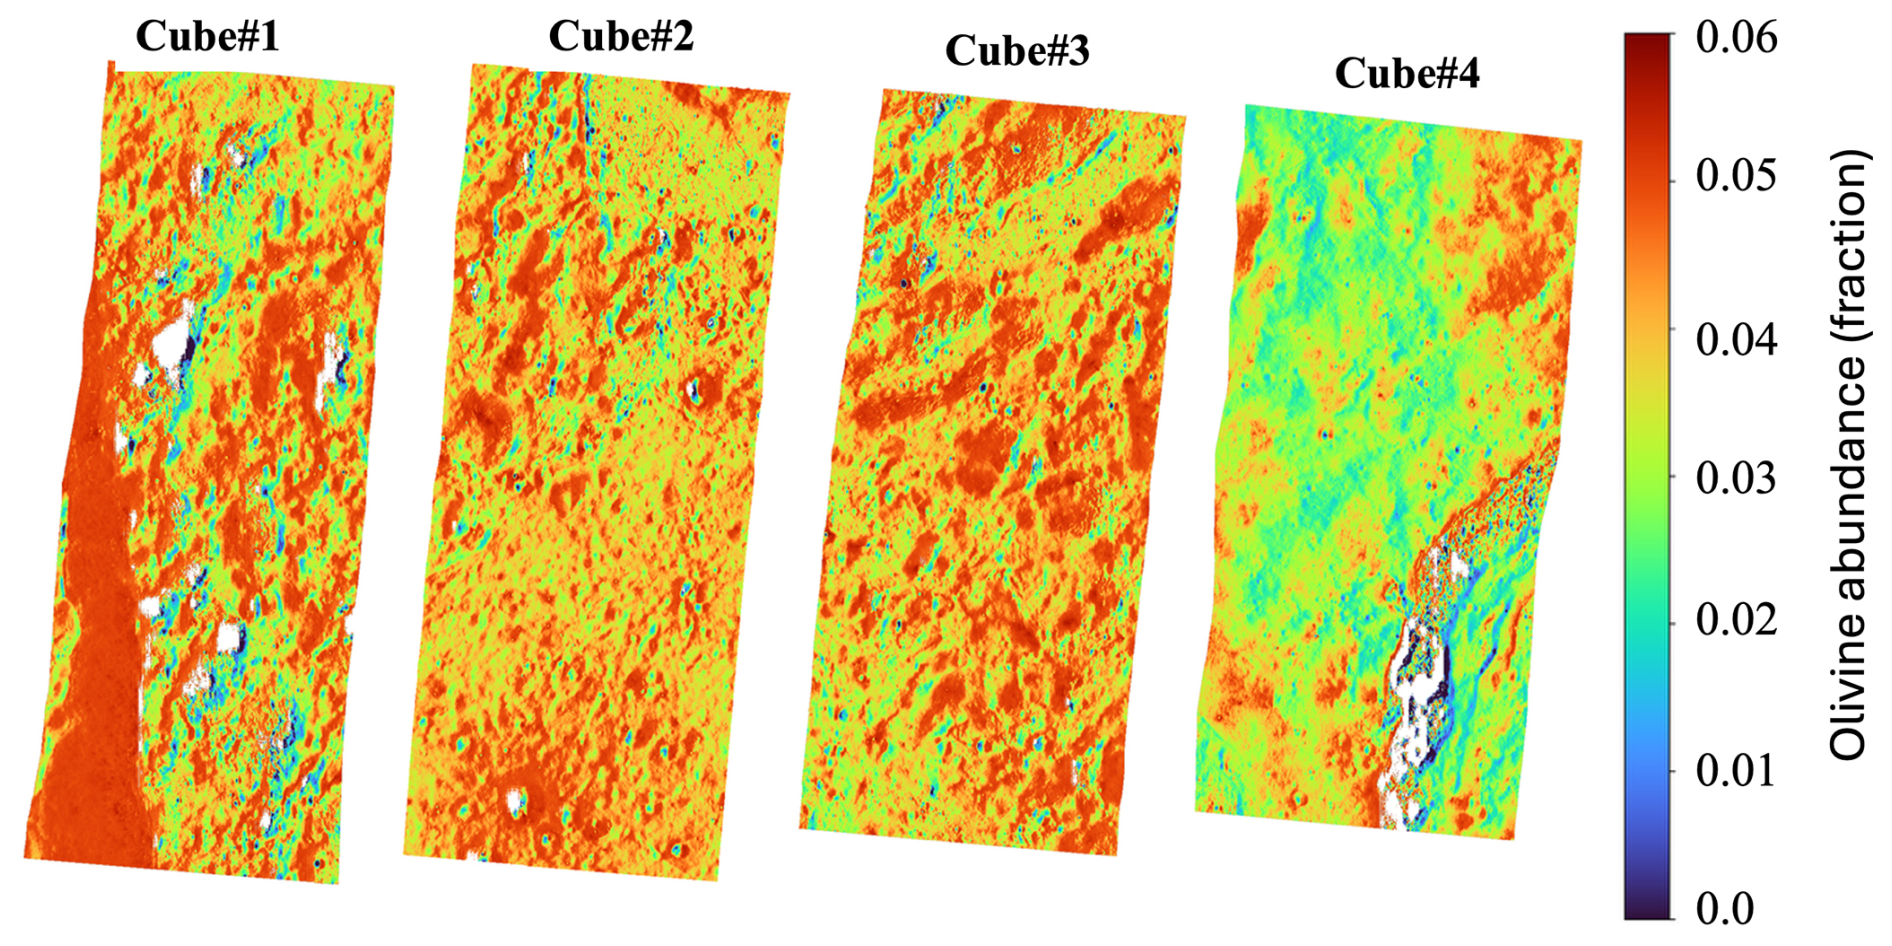
Figure 12Spatial abundance maps of olivine derived from the FCLS spectral unmixing applied to the four JANUS cubes covering Langrenus crater. The maps show a low but spatially coherent olivine-compatible contribution, with maximum modeled values of ∼6 %. The same rainbow colour scale is applied to all four cubes to allow direct comparison between panels. The colour contrast highlights relative variations in modeled VNIR spectral contribution and should not be interpreted as quantitative modal olivine abundance. The term homogeneous is used here in a relative sense: the four cubes show broadly similar endmember groups and no abrupt transition to a purely feldspathic spectral signature. Local differences nevertheless occur, and Cube #4 shows a lower modeled olivine contribution than the other cubes. These variations are small in absolute terms and should be interpreted as variations in modeled VNIR spectral contribution rather than as direct evidence for strong modal olivine variability.
3.5 Discussion
Crater densities and block-size area distribution measurements within Langrenus crater were primarily utilized to constrain the complex geological and formational history of the area. Comparing images acquired by the JANUS camera against higher- and lower-resolution lunar datasets demonstrates the instrument's excellent capability to bridge regional and local spatial scales, from LROC-WAC regional context mapping at ∼75–100 m per pixel to Kaguya (∼10 m per pixel), JANUS (∼19–22 m per pixel for Langrenus), and LROC-NAC targeted observations at ∼0.5–2 m per pixel, and to provide reliable data for geomorphological and crater-counting analyses.
Langrenus is a well-preserved complex crater that formed at the border between the lunar highlands and the Mare Fecunditatis plain. Terraced crater walls can form by large-scale mass wasting during the collapse of the transient crater even in relatively homogeneous targets; therefore, the presence of terraces alone is not taken here as evidence for target heterogeneity. Instead, the interpretation of a heterogeneous target is based on the combination of terrace-zone asymmetry, fault localization, mare-highland setting, and compositional contrasts. Morphological and structural differences between the western and eastern parts of the crater, including the particularly extensive terrace zone in the western crater sector, are consistent with an impact into a laterally heterogeneous target, where the western target portion already bears characteristics of the mare basin. The shape and geometry of the slump terraces, together with the orientation of normal fault scarps, suggest that the target rocks contained numerous faults and zones of weakness prior to the impact. The NW-SE striking faults are interpreted to represent radial faults emanating from the South Pole Aitken Basin. These faults were partially reactivated during crater collapse and exerted strong control on crater modification, particularly in the eastern sector, imparting a partly polygonal outline to Langrenus. The different fault-throw distributions shown in Fig. 6 may therefore reflect a combination of mechanical contrasts between mare-influenced and highland materials and the inherited structural fabric, rather than a single control by lithology alone.
In addition to the reactivation of pre-impact faults, post-impact tectonic activity is indicated by faults that displace the crater floor and cross the northern hummocky terrain. The origin of this hummocky terrain has not yet been conclusively resolved. Its significantly younger apparent age relative to the crater floor raises questions regarding the formation age of Langrenus, leading to two plausible scenarios:
We considered whether the ejecta blanket could provide an additional independent age constraint. However, in the JANUS coverage the ejecta deposits are discontinuous, affected by mixing with local mare and highland materials, and locally contaminated by secondary and self-secondary craters. For this reason, crater counts were restricted to the interior crater-floor and hummocky units, where counting areas are more continuous and the mapped stratigraphic context is better constrained.
-
An Eratosthenian age of Langrenus. Global geological maps of the Moon (Fortezzo et al., 2020; Ji et al., 2022) assign Langrenus an Erathosthenian age. Criteria for such a scenario are the good state of preservation of the crater and its ejecta, with the presence of secondary craters with a herringbone pattern. The ages we have determined on the hummocky terrain (2.54 and 3.05 Ga) correspond to this age. The independent MPF results for the same unit (2.4±0.2 Ga from JANUS and 2.2±0.3 Ga from LROC-WAC) likewise indicate that the hummocky terrain is substantially younger than the crater floor and are broadly compatible with an Eratosthenian resurfacing event. However, the younger crater-retention ages of the hummocky terrain may also reflect poorer crater preservation on rough, blocky, or mass-wasted surfaces, where small craters can be degraded, buried, or rendered difficult to recognize more rapidly than on smoother crater-floor materials (e.g., Krüger et al., 2016; Van der Bogert et al., 2017; Prieur et al., 2017). Thus, the hummocky-terrain ages are interpreted primarily as evidence for post-impact resurfacing and/or modification rather than as a direct age of the Langrenus-forming impact. If this terrain represents a later mass-wasting deposit, its crater-retention age cannot unambiguously date the primary Langrenus impact. In contrast, the older Imbrian ages of the crater floor area may be explained by the influence of secondary craters and self-secondary craters. The local increase in abundance of 1–2 km craters in the size frequency distributions likely reflects the influence of secondary cratering.
-
An Imbrian age of Langrenus. An alternative interpretation supports an Imbrian age for Langrenus, based on crater counts of the flat crater floor. The derived ages (3.36 and 3.49 Ga) are consistent with those reported by a previous study (Ivanov et al., 2023; 3.41 Ga) and with the ages of Luna 16 samples, which have a high probability of containing ejecta from Langrenus (Yue et al., 2025). Importantly, the independent MPF ages of 3.4±0.1 and 3.5±0.1 Ga for the JANUS and LROC-WAC crater-floor counts, respectively, closely reproduce these values and strengthen the interpretation of an Imbrian age for the crater-floor unit. Under this scenario, the north-western hummocky terrain is interpreted as the product of gravitational mass wasting that postdates crater formation and overlies the northern crater floor and parts of the northern terrace zone. Its younger MPF ages, as well as the younger ages derived with the original chronology, are consistent with post-impact resurfacing rather than with the emplacement age of the primary crater. Such mass movements may have been tectonically triggered, as faults in the northern crater area clearly postdate the impact event. Tectonic activity at the mare–highland transition may be linked to later volcanic activity within the Fecunditatis basin during the Eratosthenian period (Ivanov et al., 2023). Volcanic loading could have induced stress accumulation and relaxation at the basin margin, leading to reactivation of pre-existing faults. In some locations, tectonic deformation appears to postdate the emplacement of the hummocky terrain itself, as indicated by straight lineaments cutting across this unit.
Overall, the two chronology approaches provide a robust relative-age result: the northern hummocky terrain is younger than the crater floor. The close agreement between the two independent chronologies for the crater-floor unit reinforces the Imbrian interpretation for that surface, whereas the absolute age of the hummocky terrain remains more sensitive to the chronology model and to its possible resurfacing history.
The regional mare stratigraphy does not uniquely discriminate between these two age scenarios. Older mare materials in the Fecunditatis region could have provided mare-derived components available for excavation, redistribution, or regolith mixing in either an Imbrian or an Eratosthenian Langrenus-forming event. Therefore, the regional mare context is used here primarily to constrain possible source materials, target heterogeneity, and mixing processes, rather than as a standalone age diagnostic for the primary impact.
The spectrophotometric results derived from JANUS multifilter data provide an additional and independent line of evidence supporting a complex geological evolution for Langrenus. The detection of low but consistent olivine-related spectral signatures (modeled abundances ≤6 %) across multiple cubes, including the hummocky floor terrain and portions of the crater rim, indicates the presence of mafic components that are not typical of a pure highland crust. Although the four-filter configuration limits spectral resolution and prevents precise mineralogical discrimination, the convergence of three independent approaches, direct spectral inspection, unsupervised clustering, and fully constrained linear unmixing, supports the robustness of the detected compositional trends. The spatial coherence of the long-wavelength absorption behavior across separate frames further argues against illumination artifacts or statistical noise as primary drivers of the signal.
The geological implications of this mafic enrichment depend in part on the formation age of Langrenus. Under an Imbrian-age scenario, the detected olivine-compatible signatures could reflect excavation of heterogeneous target materials, potentially including deeper crustal or upper mantle components, during crater formation. Such an interpretation would be consistent with emplacement near the mare-highland boundary and with a structurally complex pre-impact crust.
Alternatively, if Langrenus is Eratosthenian in age, the observed mafic signal may instead represent mare-derived material redistributed during impact excavation and subsequently reworked through mass wasting and regolith mixing processes. In this scenario, the olivine-compatible spectral behavior would primarily record lateral mixing with basalts from Mare Fecunditatis rather than deep crustal excavation.
Importantly, the mafic contribution appears spatially pervasive yet remains quantitatively modest. The uniformity revealed by spectral unmixing along the JANUS swath suggests a widespread mare-related spectral influence rather than isolated exposures of highly olivine-rich lithologies. This pattern does not imply that the previously mapped mare-highland contact was incorrectly located at regional scale; rather, it indicates that the local spectral transition around Langrenus is diffuse and has likely been broadened by impact excavation, structural reactivation, and post-impact surface reworking.
Beyond its geological implications, the analysis demonstrates that JANUS can retrieve internally consistent compositional information even from limited multispectral sampling. These results provide new constraints on lunar crustal heterogeneity and surface mixing processes at the mare–highland transition and validate the scientific capability of the instrument for future planetary investigations.
The second region of interest is the northwestern margin of Mare Fecunditatis (MF), specifically the transition zone or “isthmus” connecting it to Mare Tranquillitatis (MT) (Fig. 1C). This interface represents a critical boundary between two pre-Nectarian basins that, despite their proximity, exhibit significantly distinct evolutionary, compositional, and tectonic histories (Fig. 13). MT is characterized by some of the oldest mare basalts on the Moon, with ages generally ranging from ∼3.8 to 3.6 Ga (Hiesinger et al., 2003; Bhatt et al., 2020). It is a non-mascon basin with an irregular topographic floor, typically known for hosting high-titanium basalts (Staid et al., 1996; Sato et al., 2017). Tectonically, MT is dominated by contractional features, specifically a widespread network of wrinkle ridges (Frueh et al., 2023; Tariq et al., 2024). In contrast, MF is a mascon basin characterized by a thinner crust and a positive gravity anomaly (Zuber et al., 2013). Its basaltic fill is multiphase and younger than the nearby MT, ranging from ∼3.71 to 3.31 Ga, with some localized events potentially as young as <3.0 Ga (Yue et al., 2025; Hiesinger et al., 2003). Unlike the uniformly high-Ti basalts of MT, MF displays significant heterogeneity. Indeed, while dominated by low-Ti/high-Al basalts, local concentrations of high-Ti basalts are observed, particularly in the northwestern region (Sato et al., 2017; Thapa et al., 2025; Zhao et al., 2022). Structurally, the margins of MF exhibit a complex tectonic regime characterized by extensional features such as grabens and normal faults, often associated with magmatic intrusions (Yue et al., 2025). Previous global and regional surveys have identified MT as hosting abundant mare domes, many clustered on a broad topographic rise in its eastern sector (Qiao et al., 2021). These features are generally interpreted as small shield volcanoes produced by low-volume, cooling-limited eruptions from shallow magma sources (Head and Wilson, 2017; Qiao et al., 2021).
Our observations in the new JANUS dataset revealed that the region bridging MT and MF is populated by several volcanic domes which are morphologically, structurally, and compositionally distinct from typical mare domes. This motivated a dedicated geological and spectral analysis, using high-resolution JANUS multispectral data.
4.1 Isthmus Geological Map
Geological mapping of the mare–highland transition zone between Mare Tranquillitatis (MT) and Mare Fecunditatis (MF) was conducted using JANUS images with spatial resolutions ranging from ∼40 to 70 m per pixel (Fig. 13). The isthmus area encompasses a heterogeneous assemblage of pre-Nectarian highlands, smooth and rough plains units, dome-like positive-relief features, crater-related materials, and tectonic structures, and it is bordered to the east and west by the smooth plains of the Fecunditatis and Tranquillitatis maria, respectively. Unit boundaries were defined based on surface morphology, texture, relative albedo, crater density, relative topography, and stratigraphic relationships (Figs. 14–15).
The mapping presented here is descriptive first and interpretive second. Units were initially separated using observable morphology, texture, albedo, crater density, relative topography, and cross-cutting or embayment relationships. Genetic interpretations, such as volcanic resurfacing, impact modification, mass wasting, or dome emplacement, are discussed after the unit descriptions and in Sect. 4.3.
The highland unit (HL) forms the stratigraphic basement of the region and is characterized by rugged topography, high crater density, relatively high albedo, and an anorthositic spectral character. These terrains are embayed and locally resurfaced by younger plains of non-mare units.
The plains units were distinguished based on surface roughness, degradation state, albedo, and crater density. They include smooth plains (SP), slightly smooth plains (SSP), moderately rough plains (MRP), and highly rough plains (HRP). The smoothest plains are characterized by relatively continuous surfaces and lower apparent roughness, whereas the rougher plains display more irregular textures, higher crater density, and more degraded surfaces. Such plains units occur as laterally continuous resurfacing deposits and are characterized by relatively moderate iron abundance compared to the adjacent iron-rich mare basalts (Fig. 16).
Craters over 10 km in diameter and crater-related features were mapped based on differences in degradation state and stratigraphic position, including relatively recent craters (RRC), old craters (OC), and related crater floors (CF and OCF, respectively). Relatively recent craters display sharper rims and better-preserved morphologies, whereas old and very old craters are more degraded, subdued, or partly embayed by plains materials. In addition, subdued very old craters (VOC) are widely covered by both HRP and MRP. Finally, crater chains have been distinguished by stippled patterns over the geological units.
Two generations of dome-like positive-relief features were identified and mapped as distinct units (D1 and D2–D3) based on their stratigraphic relationships and preservation state. These features are mapped separately from surrounding plains based on their positive relief, arcuate or elliptical outlines, distinctive morphology, presence of fractures or cracks and stratigraphic contacts visible in JANUS images and supporting LROC-WAC topographic context (Fig. 15).
The oldest dome-like unit (D1) consists of subdued, degraded domical features that are overlain or partly embayed by the roughest plains units (HRP and MRP), indicating that they predate at least part of the plains resurfacing. A second dome-like generation (D2–D3) comprises better-preserved positive-relief features that occur in association with plains units and a pre-existing crater floor, locally affecting or deforming old crater (OC) interiors. The D2–D3 features are spatially associated with older crater floors, but their positive relief and fracture patterns distinguish them from simple crater-fill deposits. Here, we describe these relationships only as mapped surface and stratigraphic associations; their possible genetic implications are discussed in Sect. 4.3.
Mare Tranquillitatis and Mare Fecunditatis basalts are mapped at the western and eastern ends of the swath, respectively, and are distinguished from the isthmus plains by their smoother texture, lower crater density, and sharp compositional and morphological contrasts. Some relatively recent craters (RRC) locally display smooth floor deposits or are superposed on smooth mare plains; these relationships are mapped to describe local resurfacing and superposition, and they are not intended to imply that basin-wide mare basalt emplacement postdates the recent craters.
Tectonic structures, primarily grabens and fractures, were mapped as linear features that locally offset plains units of the isthmus and some crater floors. These structures are treated as mapped surface features in Sect. 4.1; their possible role in controlling dome emplacement or later deformation is evaluated in Sect. 4.3.
Overall, the geological map documents a complex stratigraphic framework marked by repeated resurfacing, dome-like positive-relief features, impact modification, and tectonic deformation within the mare–highland transition zone. The interpretation of this framework is presented in the Discussion.
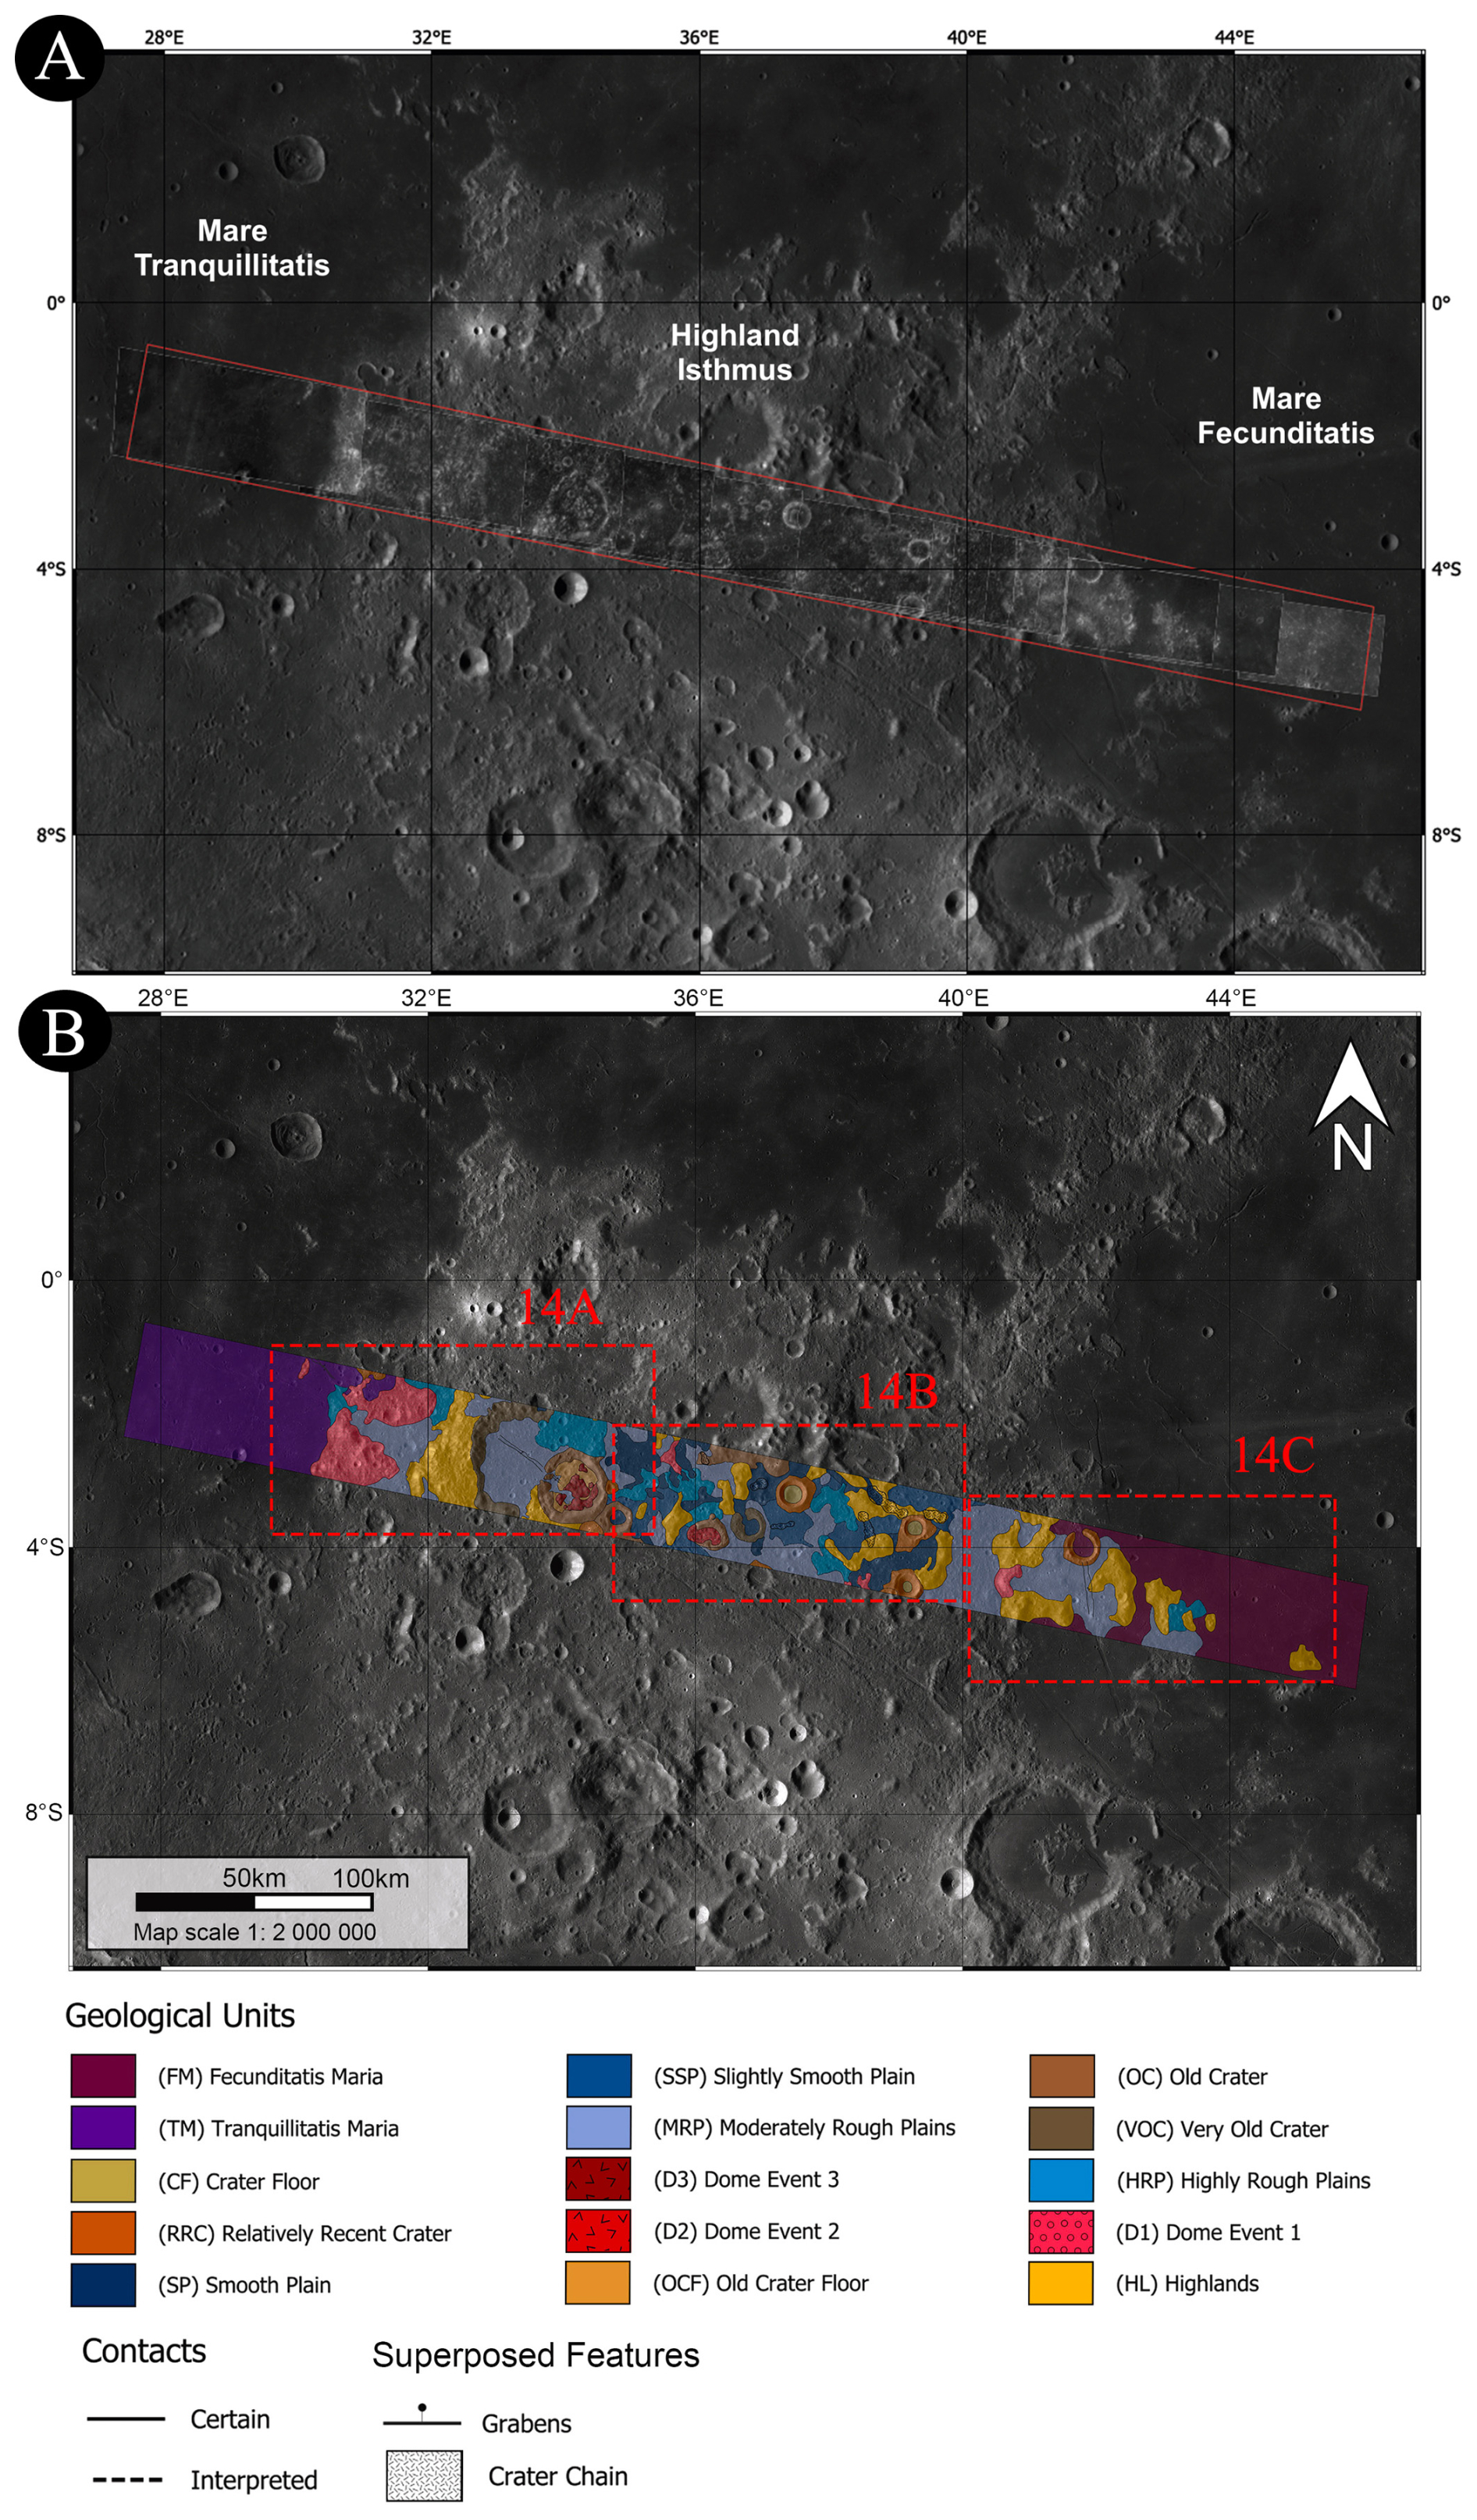
Figure 13Geological map of the highland “isthmus” between Mare Tranquillitatis and Mare Fecunditatis. (A) LROC WAC basemap showing the JANUS instrument's footprints across the lunar surface. The outlined region corresponds to the highland “isthmus” bridging the northwestern margin of Mare Fecunditatis and the eastern sector of Mare Tranquillitatis. (B) Geological map of the highland “isthmus” along with its legend. The highland “isthmus” corresponds to the central mapped belt between the Tranquillitatis and Fecunditatis mare plains. Close-ups of the geological map are reported in Fig. 14. The map was compiled at an approximate mapping scale between 1:200 000 and 1:500 000 and is displayed/exported at an output scale of 1:2 000 000.
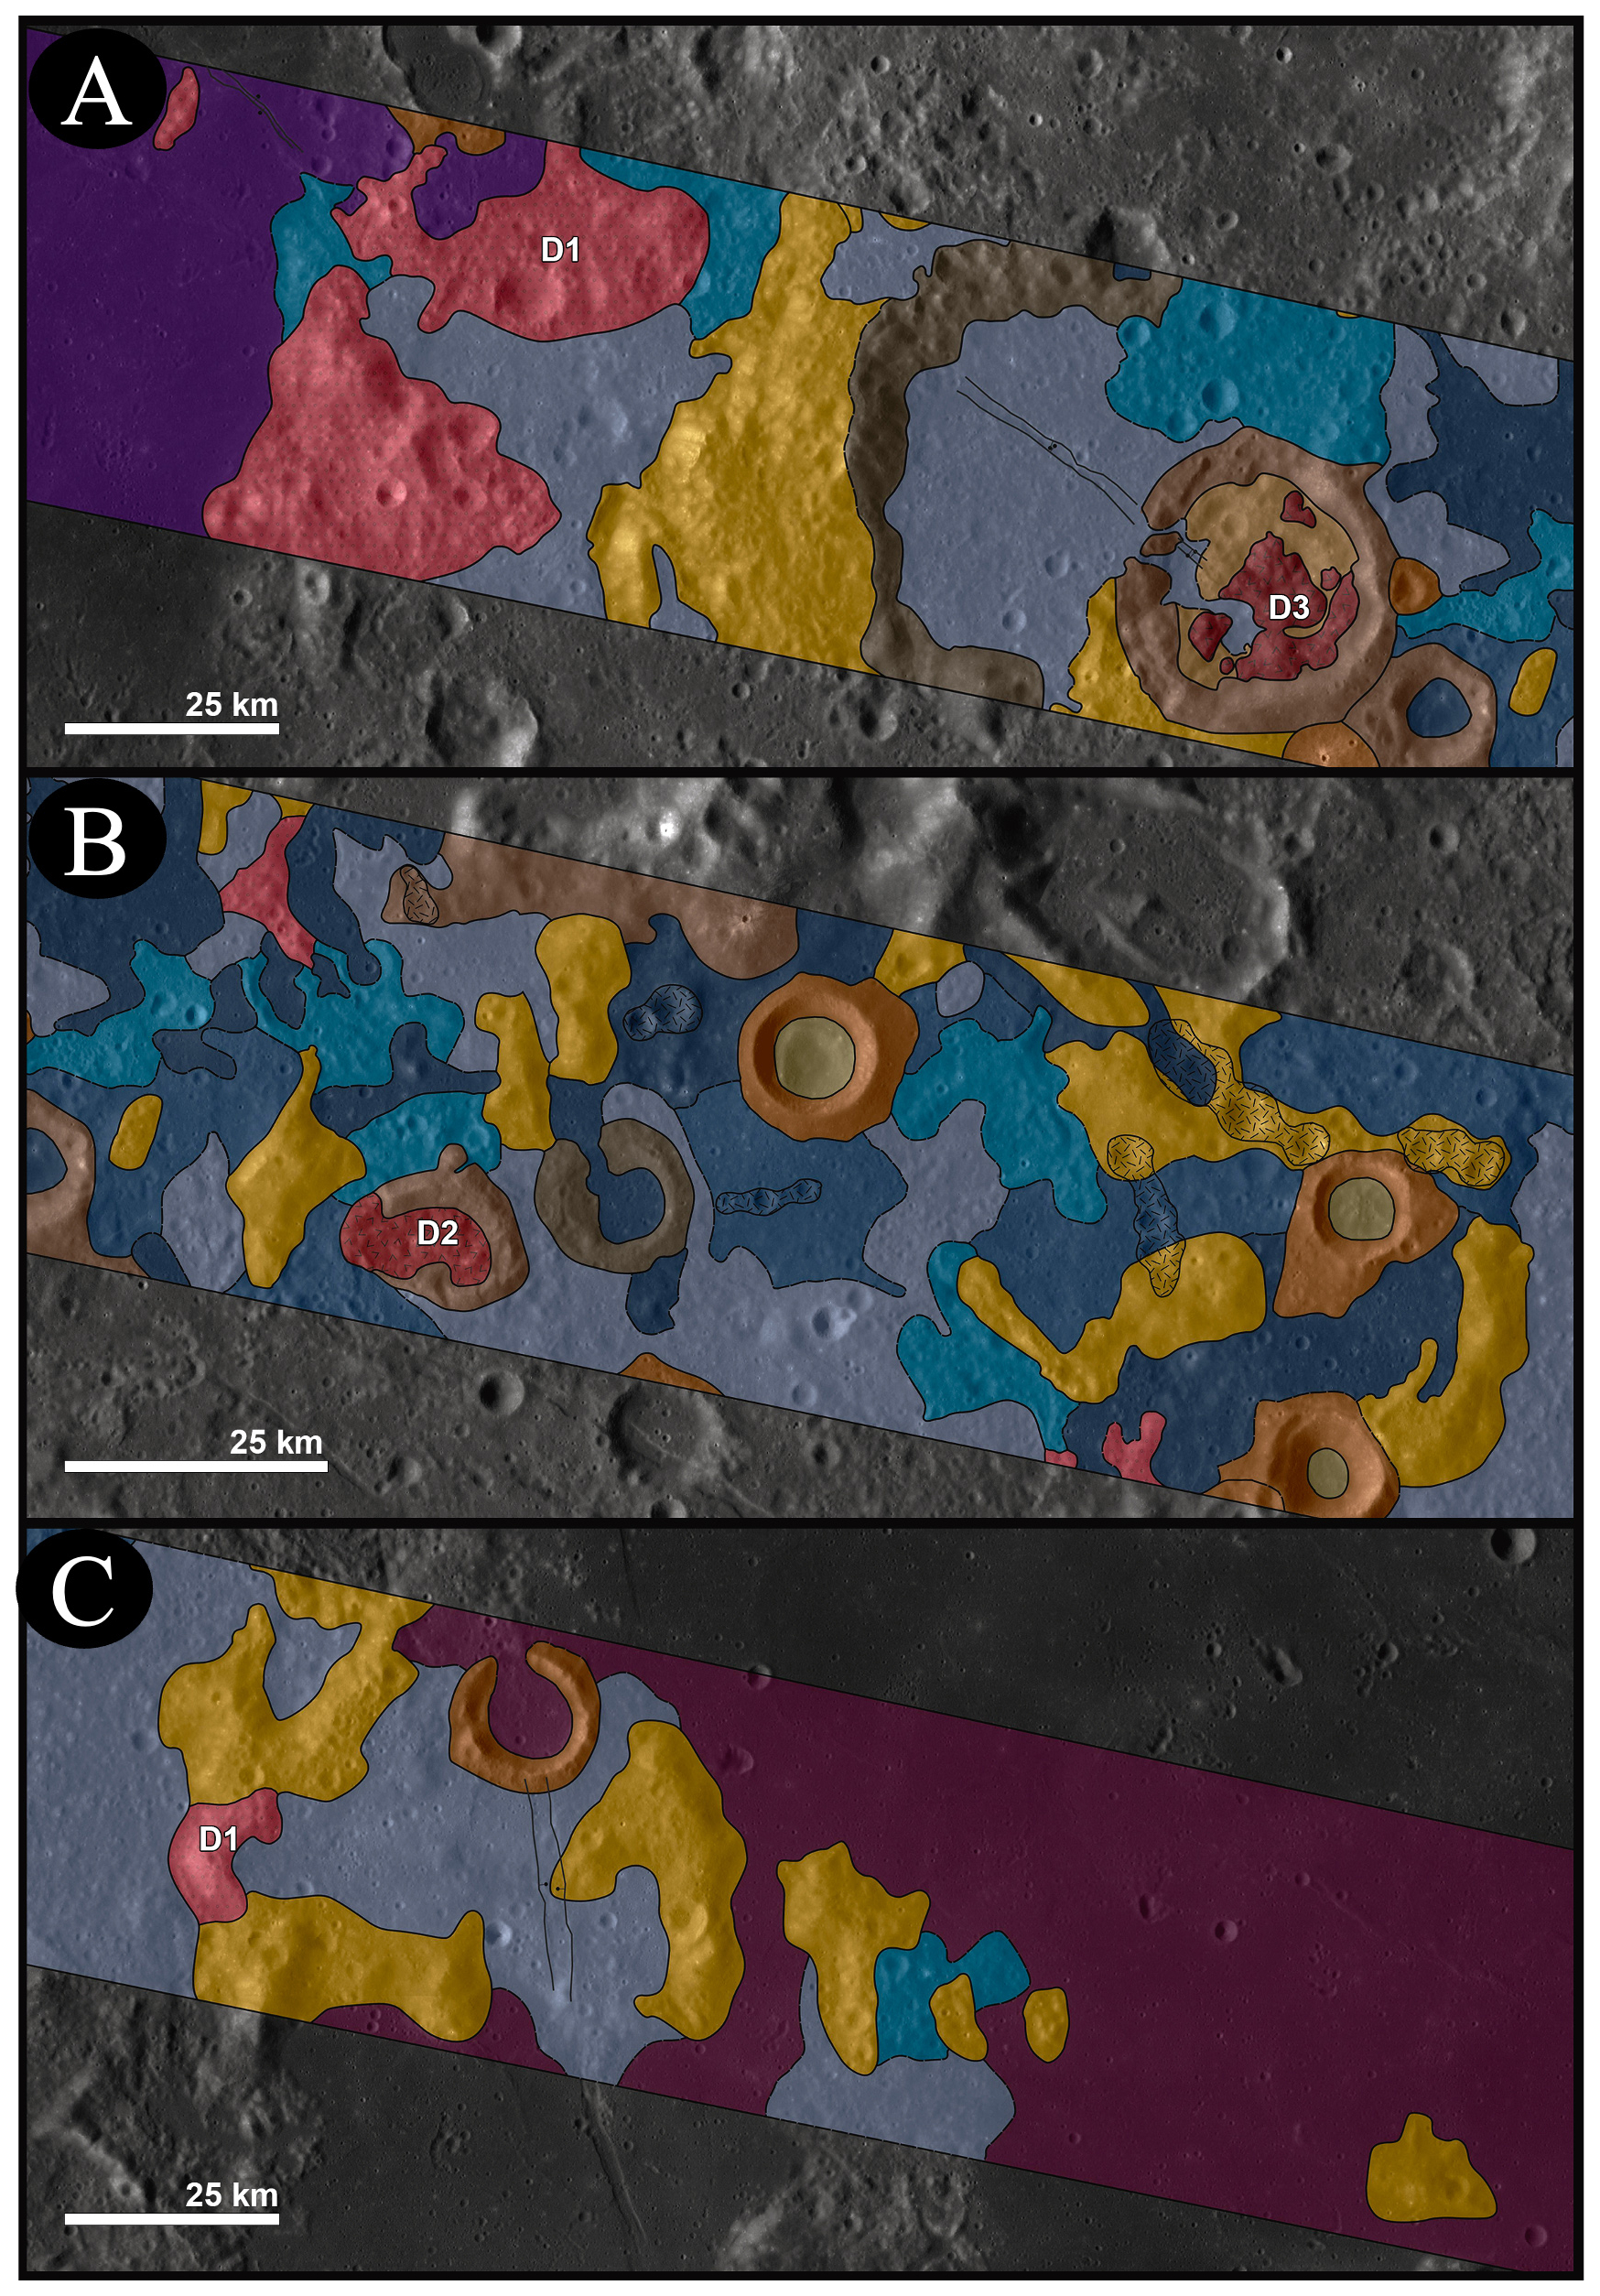
Figure 14Close-up views of the geological map of the highland “isthmus” derived from JANUS high-resolution imagery. The locations of the close-ups are shown in Fig. 13B. The panels highlight the mapped relationships among the anorthositic highland basement (HL), smooth and rough plains units (SP, SSP, MRP, HRP), crater-related units, mapped fractures/grabens, and dome-like positive-relief features (D1, D2–D3). The D2–D3 features occur on or adjacent to older crater floors and are associated with mapped fractures, but their positive relief and fracture patterns distinguish them from simple crater-fill deposits. Unit colours and abbreviations follow the Fig. 13 legend.
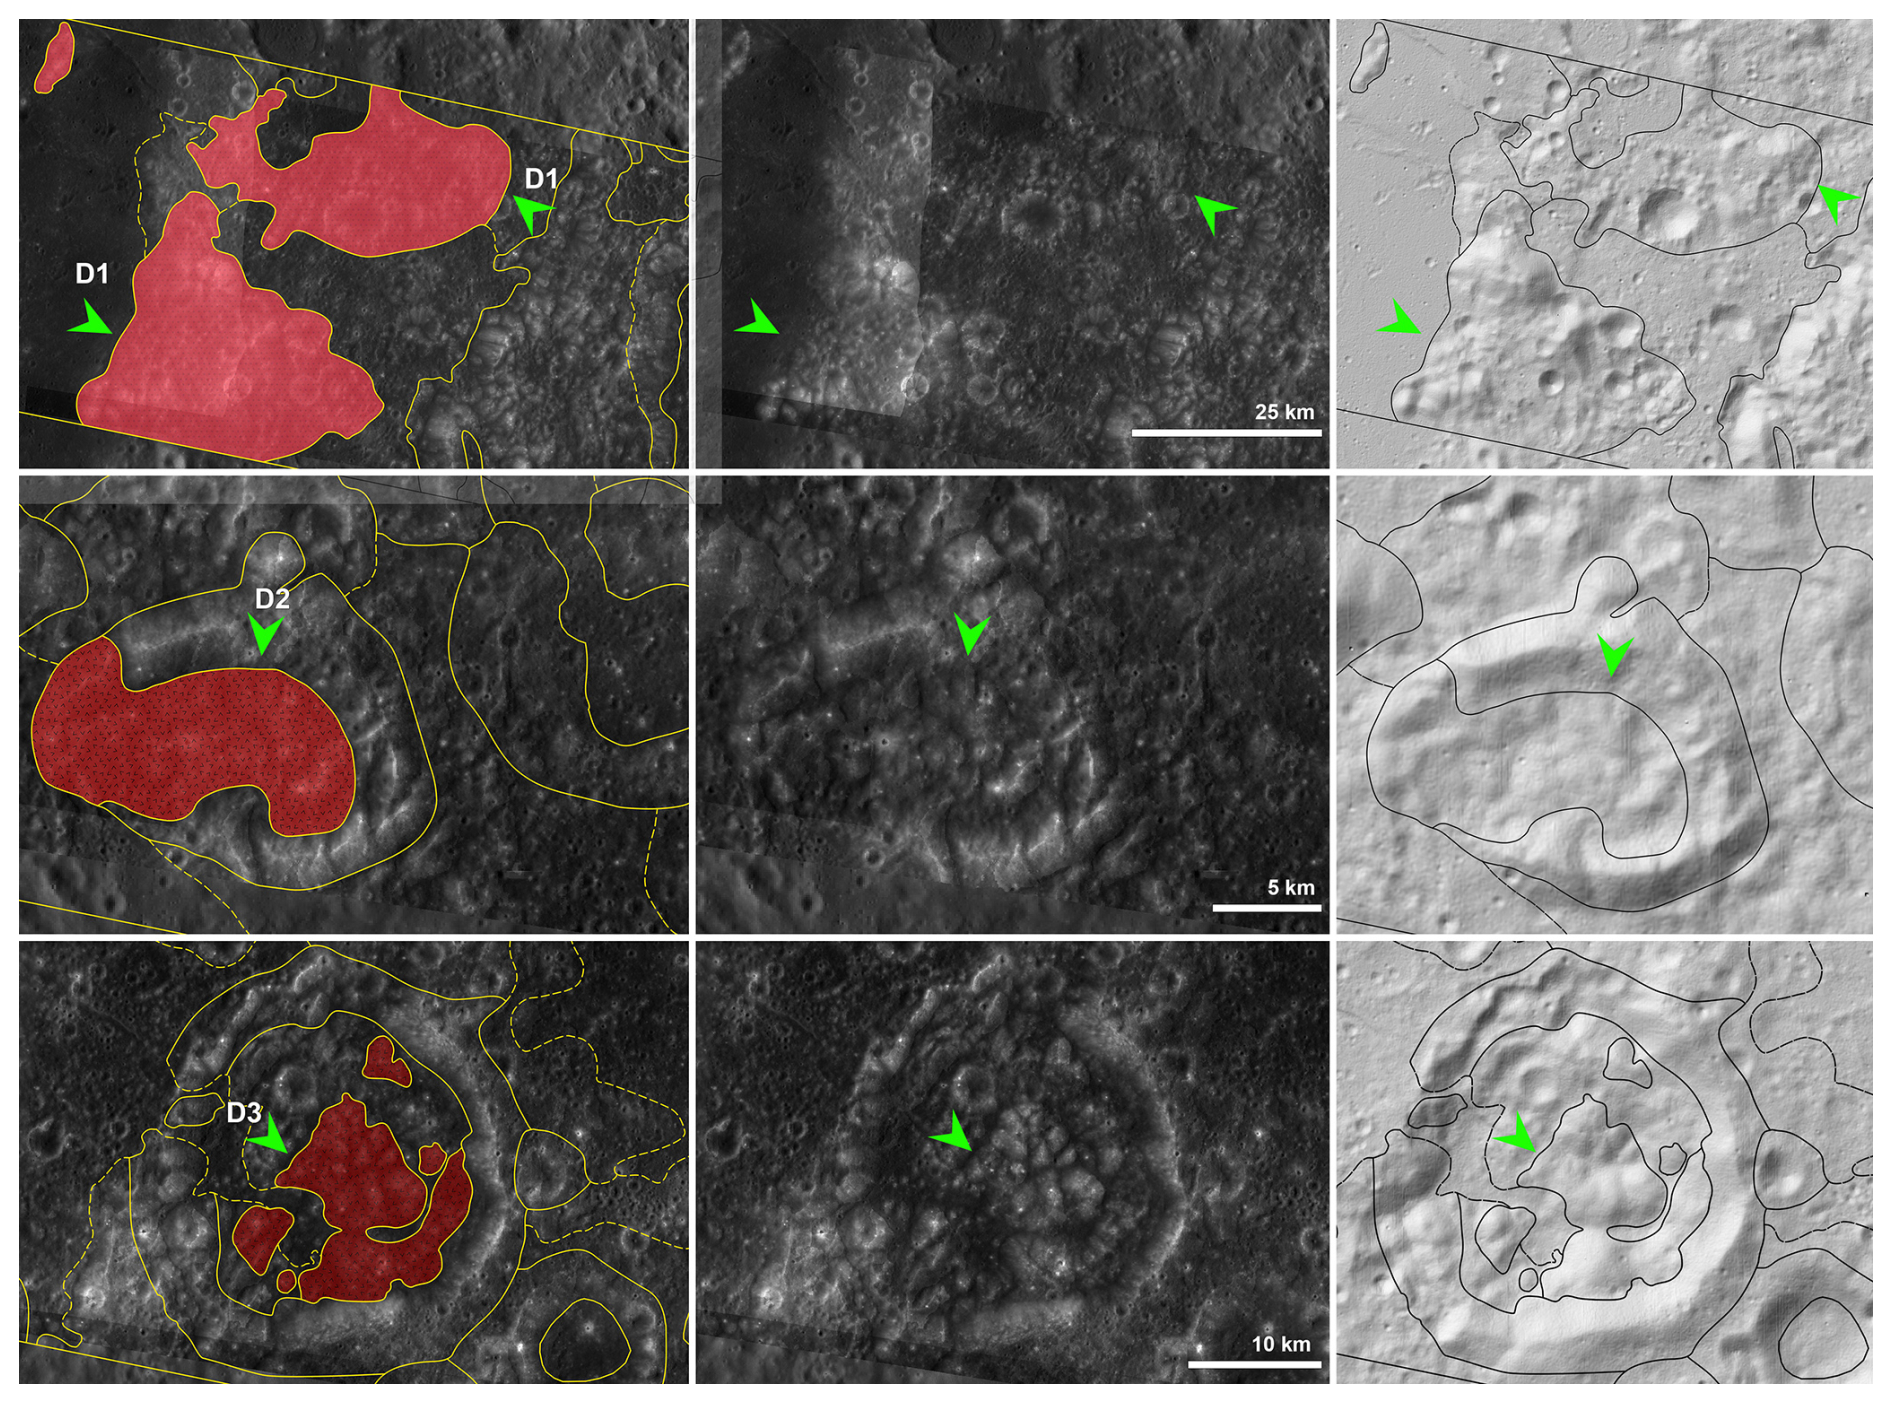
Figure 15The panels show representative examples of the D1 and D2–D3 dome-like features, together with the surrounding plains units, crater-related units, and mapped fractures/grabens. The added shaded-relief/hillshade view emphasizes the local topographic expression of the mapped features and helps distinguish positive-relief dome-like morphologies from simple crater-fill deposits or surrounding plains materials. Unit colours and abbreviations follow the Fig. 13 legend. The mapped contacts, relative topographic expression, and association with fractures are used to constrain the local stratigraphic relationships of the dome-like features.
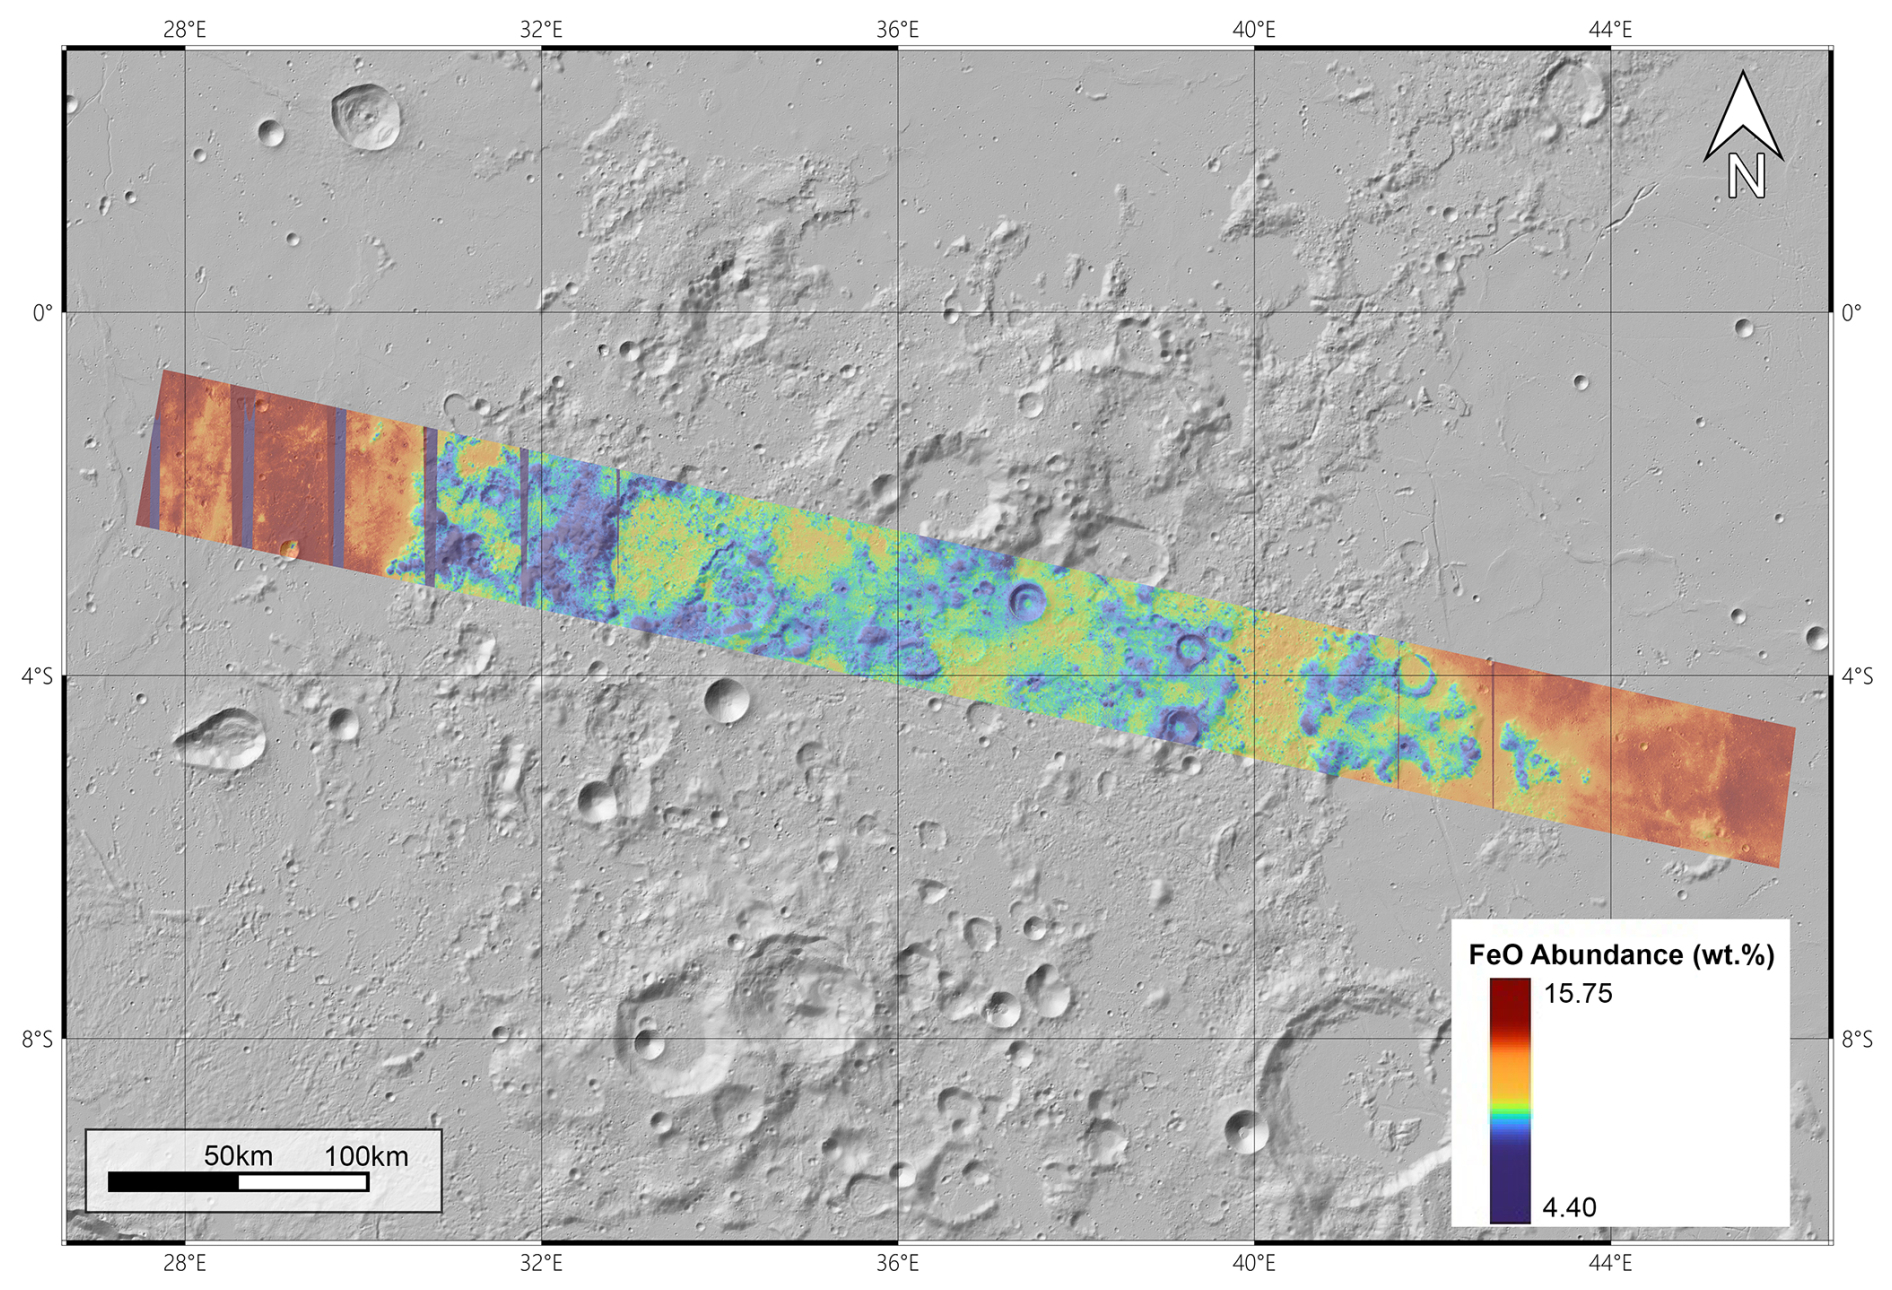
Figure 16Estimated FeO weight-percentage map across the highland “isthmus” between Mare Tranquillitatis and Mare Fecunditatis. The FeO layer is displayed over a subdued morphological/shaded-relief base to improve the readability of the compositional variations in relation to the local geological context. The map illustrates the sharp compositional boundary between the FeO-rich basaltic mare plains, reaching values of up to ∼ 15.75 wt %, and the FeO-poor feldspathic to anorthositic highland material, with values decreasing to ∼4.40 wt %. These values are used here as a relative compositional proxy and should be interpreted together with the geological mapping and optical-maturity information, rather than as a standalone mineralogical map.
4.2 Spectral Analysis
Spectral analyses from previous studies using different datasets have established a significant compositional contrast between the highland “isthmus” and the adjacent lunar maria (Lucey et al., 2000; Sato et al., 2017). To further refine the evolutionary framework of this region, a detailed investigation was conducted using the JANUS dataset.
4.2.1 RGB Clementine-like
We generated Clementine-like RGB composites (Lucey et al., 2000) to validate the JANUS spectral fidelity and to leverage its superior spatial resolution for retrieving high-fidelity compositional data.
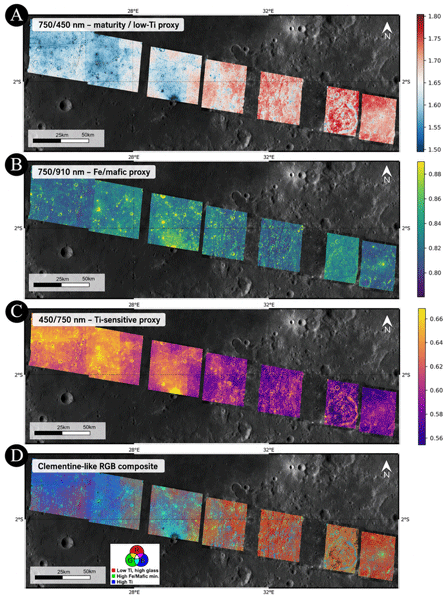
The resulting composite (Fig. 17d) provides an integrated visualization of the basin interface, where colour transitions from deep blues (mare basalts) to reddish tones (highland crust) reflect primary geochemical contrasts (Lucey et al., 2000; Sato et al., 2017).
The single-channel visualizations allow for a decoupling of maturity signatures from mineralogical content. The red channel ( nm ratio) (Fig. 17a), sensitive to regolith maturity and low-Ti content, shows that highlands and D1 domes appear brighter than surrounding maria, reflecting their mature, space-weathered surfaces. In the RGB composite, this maturity produces dominant reddish-pink hues, clearly distinguishing ancient highland materials from younger volcanic plains.
The green channel ( nm ratio) (Fig. 17b), indicative of ferrous iron abundance and mafic mineralogy, highlights the sharp gradient between iron-poor highland crust and iron-rich mare basalts. Within the dome populations, D1 features remain compositionally close to the highland crust, whereas D2–D3 domes exhibit slightly enhanced mafic signatures. This enrichment is consistent with plagioclase-rich Mg-suite lithologies (e.g., noritic or olivine-bearing anorthosites).
Complementing these findings, the blue channel ( nm ratio) (Fig. 17c) serves as the primary discriminator for titanium content. This product identifies Mare Tranquillitatis as a high-Ti spectral endmember and distinguishes it from the lower-Ti plains of the isthmus. The D1 and D2–D3 dome-like features show intermediate values in this channel, consistent with low-Ti, feldspathic to weakly mafic materials rather than typical high-Ti mare basalts. Spectral maturity differences further indicate that D2–D3 surfaces are locally optically fresher than D1, supporting a younger relative preservation state, although not an independently dated emplacement age.
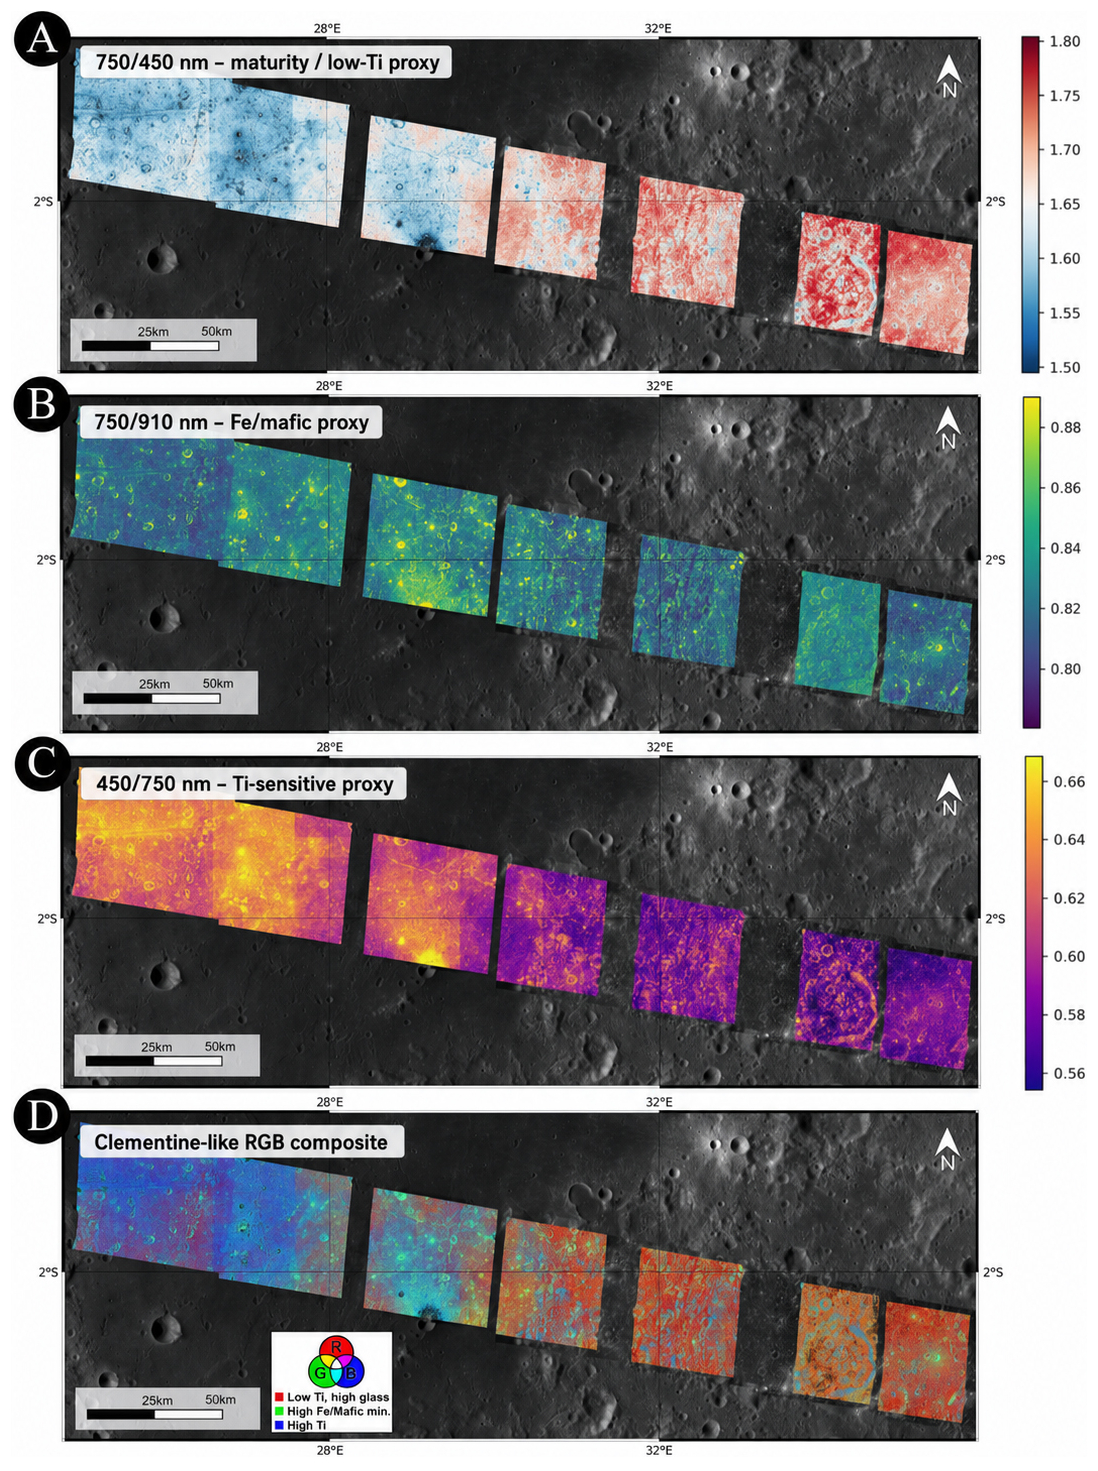
Figure 17(A) Red channel ( nm) visualization used as an indicator for regolith maturity and low titanium content. (B) Green channel ( nm) visualization illustrating the distribution of ferrous iron (Fe2+) and mafic mineralogy. (C) Blue channel ( nm) visualization acting as the primary discriminator for titanium content. (D) False-color Clementine-style RGB composite of the target region, where the red channel represents maturity ( nm), the green channel represents mafic content ( nm), and the blue channel represents titanium concentration ( nm). These products are used as relative spectral proxies rather than direct mineralogical maps. Panel (D) allows for the simultaneous assessment of composition and age: blue hues indicate high-Ti basalts, yellow-green areas represent iron-rich but mature maria, and reddish-pink tones delineate the weathered, iron-poor highland crust (Lucey et al., 2000). The red appearance of the smooth plains within the isthmus indicates spectral properties distinct from those of Mare Tranquillitatis, whereas the intermediate “bluish” appearance of the low-Ti D1 and D2–D3 dome-like features indicates low-Ti, feldspathic to weakly mafic materials that differ from typical high-Ti mare basalts. Their subtle mafic enrichment may be compatible with Mg-suite affinities, evolved volcanic or subvolcanic materials, or mixed highland–mare contributions, but the JANUS data do not allow a unique genetic or mineralogical interpretation.
4.2.2 Spectral Derivation of FeO and OMAT
The quantitative mapping of lunar surface composition requires decoupling the effects of primary mineralogy from the physical alterations caused by space weathering. Indeed, over millions of years, exposure to the solar wind and micrometeorite bombardment increases overall spectral slope, a process known as “reddening” (Pieters et al., 2000; Lucey et al., 2000). To isolate these variables, we analyzed JANUS datasets to derive both Iron abundance (FeO wt %) and the Optical MATurity index (OMAT). The methodology centers on the diagnostic absorption feature of Fe2+ ions in mafic minerals, typically centered near 1000 nm. We quantified this feature using the ratio between the absorption 910 nm and a continuum baseline at 750 nm. For JANUS 6-filter cubes lacking the 750 nm band, we reconstructed the missing information through linear interpolation between the 540 and 889 nm channels to ensure dataset consistency. Following the methodology of Lucey et al. (2000), each pixel from each data cube was plotted in a two-dimensional “Albedo-Color” state space, with 750 nm reflectance on the x axis and the nm ratio on the y axis (Fig. 18). In this projection, lunar regolith typically forms a characteristic “fan-shaped” distribution. The top-left vertex of this fan represents the most optically mature endmember (darkest and most red-sloped), where various maturation trends for different compositions converge toward a single Reference Origin (x0, y0).
Because different instruments and observation geometries can shift this distribution, relying on a static y0 (such as the 1.19 value used for Clementine) often introduces artifacts, including mathematically impossible negative FeO values. To mitigate this, we employed a Local Self-Calibration algorithm. The origin y0 was calculated by isolating the darkest 5 % of pixels at 750 nm, representing the most mature and weathered soil, calculating their median R910 R750 ratio, and adding an appropriate offset (typically +0.05). This dynamic shift compensates for instrument-specific biases and lighting conditions, ensuring the resulting maps are physically meaningful. The iron abundance was then derived using the Lucey et al. (2000) empirical regression model:
where the weight percentage is a linear function of the spectral angle θFe. The coefficients 17.42 and −1.98 were established by correlating orbital data with laboratory analyses of Apollo and Luna soil samples. A larger angle indicates a deeper absorption feature and, consequently, a higher concentration of iron. Concurrently, we derived the Optical Maturity (OMAT) as the Euclidean distance from the origin:
Pixels far from the origin exhibit high OMAT values, representing “optically fresh” materials (e.g., recent impact craters), while pixels near the origin represent “optically mature” regolith (low OMAT). This maturity information is important for spectral interpretation because optically mature soils are generally darker and redder and can attenuate diagnostic absorption features, whereas fresher, higher-OMAT surfaces tend to preserve stronger spectral contrast.
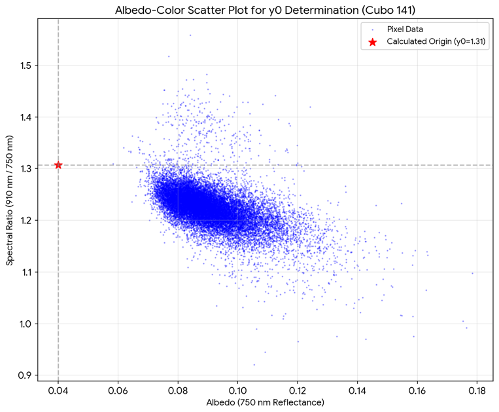
Figure 18Albedo-color scatter plot. Example of the derived scatter plot for an 8-filter JANUS cube. The “fan-shaped” distribution illustrates the interplay between chemical composition (iron content) and physical maturity (space weathering). The red star indicates the dynamically calculated reference origin (x0, y0). This self-calibration step is essential to account for JANUS-specific spectral responses and ensures consistent iron derivation across diverse lunar terrains.
As shown in Fig. 19, the FeO maps delineate sharp compositional contrast. While Mare Tranquillitatis exhibits high-iron signatures typical of basaltic plains, the highland-dominated isthmus remains a low-iron area. This indicates that the isthmus is a FeO-poor, feldspathic highland-dominated assemblage that has been modified by impact cratering, brecciation, plains resurfacing, and tectonic deformation. Yet a subtle shift in mafic content between the domes and highlands is detectable. In particular, the older D1 constructs are nearly as iron-poor as the highlands, while the younger D3 domes show a small increase in mafic minerals, again suggesting a potential higher content of mafic minerals within the anorthosites. The OMAT map further indicates that D2–D3 surfaces are locally optically fresher than the more degraded D1 domes, which increases confidence that their slightly stronger mafic signatures are not only a maturity artifact. This evidence potentially places these domes towards plagioclase-rich Mg-suite lithologies (i.e., noritic anorthosites or olivine anorthosites). This mafic shift may reflect subtle differences in source contribution, optical maturity, or local mixing, but the available data do not resolve a single connected subsurface plumbing system or a specific source depth.
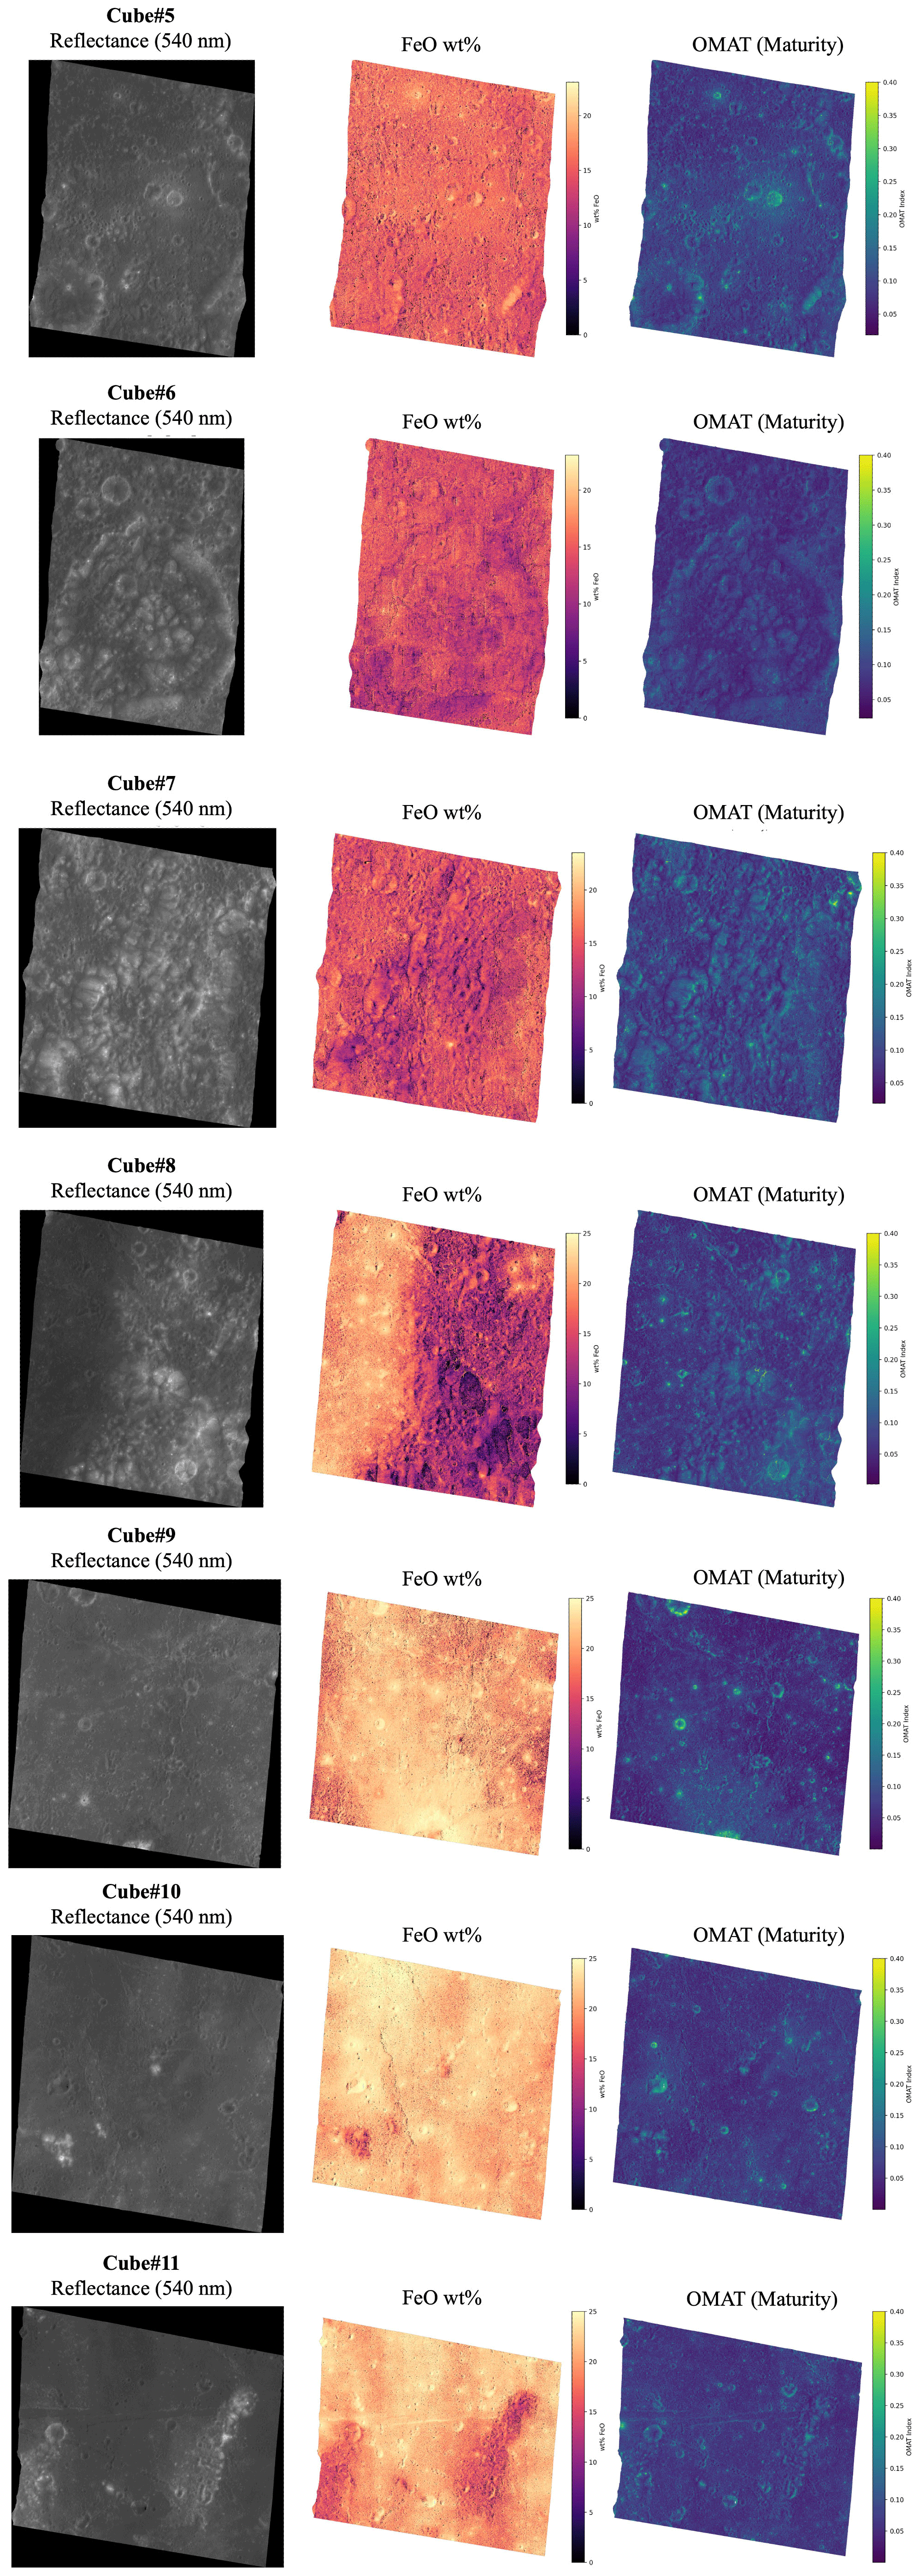
Figure 19Left: Contrast-enhanced 540 nm reflectance image showing surface morphology. Center: Map of iron oxide (FeO) weight percentage highlighting the sharp contrast between Mare units and the Crustal Isthmus. Right: Distribution of the OMAT index; brighter tones highlight “optically fresh” materials exposed by recent tectonic or impact events. The FeO and OMAT maps are interpreted together to distinguish compositional contrasts from maturity-related spectral effects. Brighter OMAT values indicate optically fresher surfaces, whereas lower OMAT values indicate more mature regolith.
4.3 Discussion
The integration of detailed geological mapping and multispectral analysis reveals a complex stratigraphic and compositional evolution of the highland “isthmus” region. Stratigraphic relationships documented in the geological map indicate multiple episodes of resurfacing, crater modification, dome-like feature formation, and tectonic deformation. Cross-cutting relationships, crater embayment patterns, superposition constraints, degradation state, and the spatial association between plains, crater floors, dome-like positive-relief features, and fractures provide relative-age constraints for these events.
The highland unit forms the oldest exposed component of the mapped region and represents the anorthositic basement of the isthmus. Its rugged morphology, high crater density, relatively low FeO content, and spectral contrast with the adjacent mare basalts indicate that the isthmus preserves a highland-dominated block between two compositionally distinct mare provinces. However, the term “preserved” is used here in a stratigraphic and compositional sense and does not imply that the surface is pristine: the highland block has been extensively modified by impact cratering, brecciation, plains resurfacing, and tectonic deformation.
The mapped plains units document resurfacing episodes that postdate part of the older crater population. Smooth, slightly smooth, moderately rough, and highly rough plains differ in surface texture, crater density, degradation state, and stratigraphic position. Their morphology and embayment relationships are consistent with resurfacing of older highland and cratered terrains. However, because the available JANUS data do not uniquely discriminate emplacement mechanisms, these plains are interpreted cautiously as non-mare plains or localized resurfacing deposits, rather than as direct equivalents of basin-wide mare basalt flows. Their low-Ti character and moderate FeO values indicate that they are compositionally distinct from the high-Ti basalts of Mare Tranquillitatis and from the more iron-rich mare basalts at the margins of the swath.
The D1 dome-like features are more degraded and subdued than the D2–D3 features, and are locally embayed or partly overprinted by rough plains units. These relationships indicate that D1 represents an older dome-forming episode, or possibly a group of older dome-like constructs, predating at least part of the plains resurfacing. Their low FeO content and spectral similarity to the surrounding highland materials suggest that they are not typical mafic mare domes. Instead, they may represent small-volume, highland-associated volcanic or subvolcanic constructs, although the available data do not allow a unique distinction between intrusive inflation, shallow subvolcanic uplift, or limited extrusive emplacement.
The D2–D3 dome-like features are better preserved and occur in association with pre-existing crater floors, plains units, and mapped fractures. Their positive relief, sharper morphology, local fracturing, and stratigraphic relationships suggest a younger dome-forming episode relative to D1. The spatial association with older craters and linear structures is consistent with the possibility that impact-generated fractures, crater-related weaknesses, and regional extensional structures acted as preferential pathways for magma ascent. This interpretation remains indirect, because JANUS images document surface morphology and spectral properties but do not directly image subsurface conduits.
The spectral products support this relative stratigraphic interpretation. D1 surfaces are spectrally closer to the highland basement, whereas D2–D3 surfaces show locally higher OMAT values and a modest mafic enrichment. This difference suggests that D2–D3 may expose fresher or slightly more mafic material than D1. However, the inferred mafic enrichment is subtle and should not be interpreted as evidence for silica-rich domes, a unique Mg-suite lithology, or large-volume basaltic volcanism. Rather, the dome-like features are best described as low-Ti, highland-associated volcanic or subvolcanic constructs with possible plagioclase-rich and minor mafic components.
Overall, the isthmus does not show the extensive basaltic flooding typical of Mare Tranquillitatis or Mare Fecunditatis. Instead, the mapped relationships suggest localized, small-volume magmatic activity controlled by inherited crustal structure, impact-related weaknesses, and regional tectonic deformation. In this sense, the volcanic evolution of the isthmus was structurally modulated: magma ascent and emplacement were likely influenced by pre-existing fractures and crater-related damage zones.
The term local structurally controlled magma-ascent pathways is used here to refer to inferred fractures, crater-related weaknesses, and mechanically weak zones within the isthmus that may have favoured small-volume magmatic or volcanotectonic emplacement. We do not imply that these pathways are directly imaged by JANUS, nor that they are connected to the large-scale mare basalt systems of Mare Tranquillitatis or Mare Fecunditatis. The highland isthmus therefore records a distinct, localized expression of lunar magmatism at the boundary between two mare basins, combining highland crustal materials, limited plains resurfacing, dome-like constructs, and later tectonic deformation.
The JANUS observations made during the LEGA maneuver have successfully validated the instrument's high-resolution visible imaging and multi-filter capabilities in a dynamic flight scenario. By integrating geological mapping with advanced spectrophotometric techniques, this work has provided a refined stratigraphic and compositional framework for two geologically complex lunar regions.
The results obtained for Langrenus crater indicate a heterogeneous target stratigraphy at the mare–highland transition, where impact excavation, structural reactivation, and regolith mixing have collectively blurred the typical compositional boundary between basin basalts and anorthositic crust. The detection of low concentration but consistent mafic, olivine-compatible spectral signatures within the northern hummocky floor terrain supports the presence of compositional heterogeneity within the crater interior. Depending on the adopted formation age, these signatures may record either excavation of deeper crustal materials or redistribution of mare-derived basalts during and after crater formation. The younger apparent age of the hummocky terrain further suggests that post-impact mass wasting and tectonic activity at the basin margin have contributed to resurfacing and compositional reworking of the crater floor.
As concerns the highland isthmus between Mare Fecunditatis and Mare Tranquillitatis, the identification of a multi-episodic volcanic system, structurally modulated by basin-scale impacts, demonstrates that lunar magmatism was more locally controlled and temporally extended than previously recognized by global surveys. The two dome generations are distinguished not only by stratigraphy and preservation state, but also by subtle FeO and OMAT differences, with younger D2–D3 domes showing locally fresher surfaces and modest mafic enrichment relative to the older D1 domes. This independent volcanic regime records a unique expression of lunar magmatism dominated by small-volume magmatic emplacements rather than basin-wide flows.
Critically, the results of these lunar analyses inform the upcoming nominal science phase at Jupiter. The performance tests conducted here, specifically the measurement of crater and block-size frequency distributions and the identification of subtle lithological variations through unsupervised clustering, spectral unmixing, and maturity-aware interpretation, are directly applicable to the upcoming investigations of the Galilean moons. In particular, the ability of JANUS to resolve meter- to decameter-scale features and distinguish coherent colour and spectral units will be essential for interpreting the geological features and processes of Jovian icy satellites, along with their color characteristics. This work confirms that JANUS is fully prepared to achieve its ambitious scientific objectives at Jupiter, providing the high-fidelity data necessary to investigate the evolution and habitability of the icy worlds orbiting Jupiter.
Table A1Table reporting the image ID used for the analysis along with its properties as UTC, pixel scale, incidence, emission and phase angles, distance and filter.
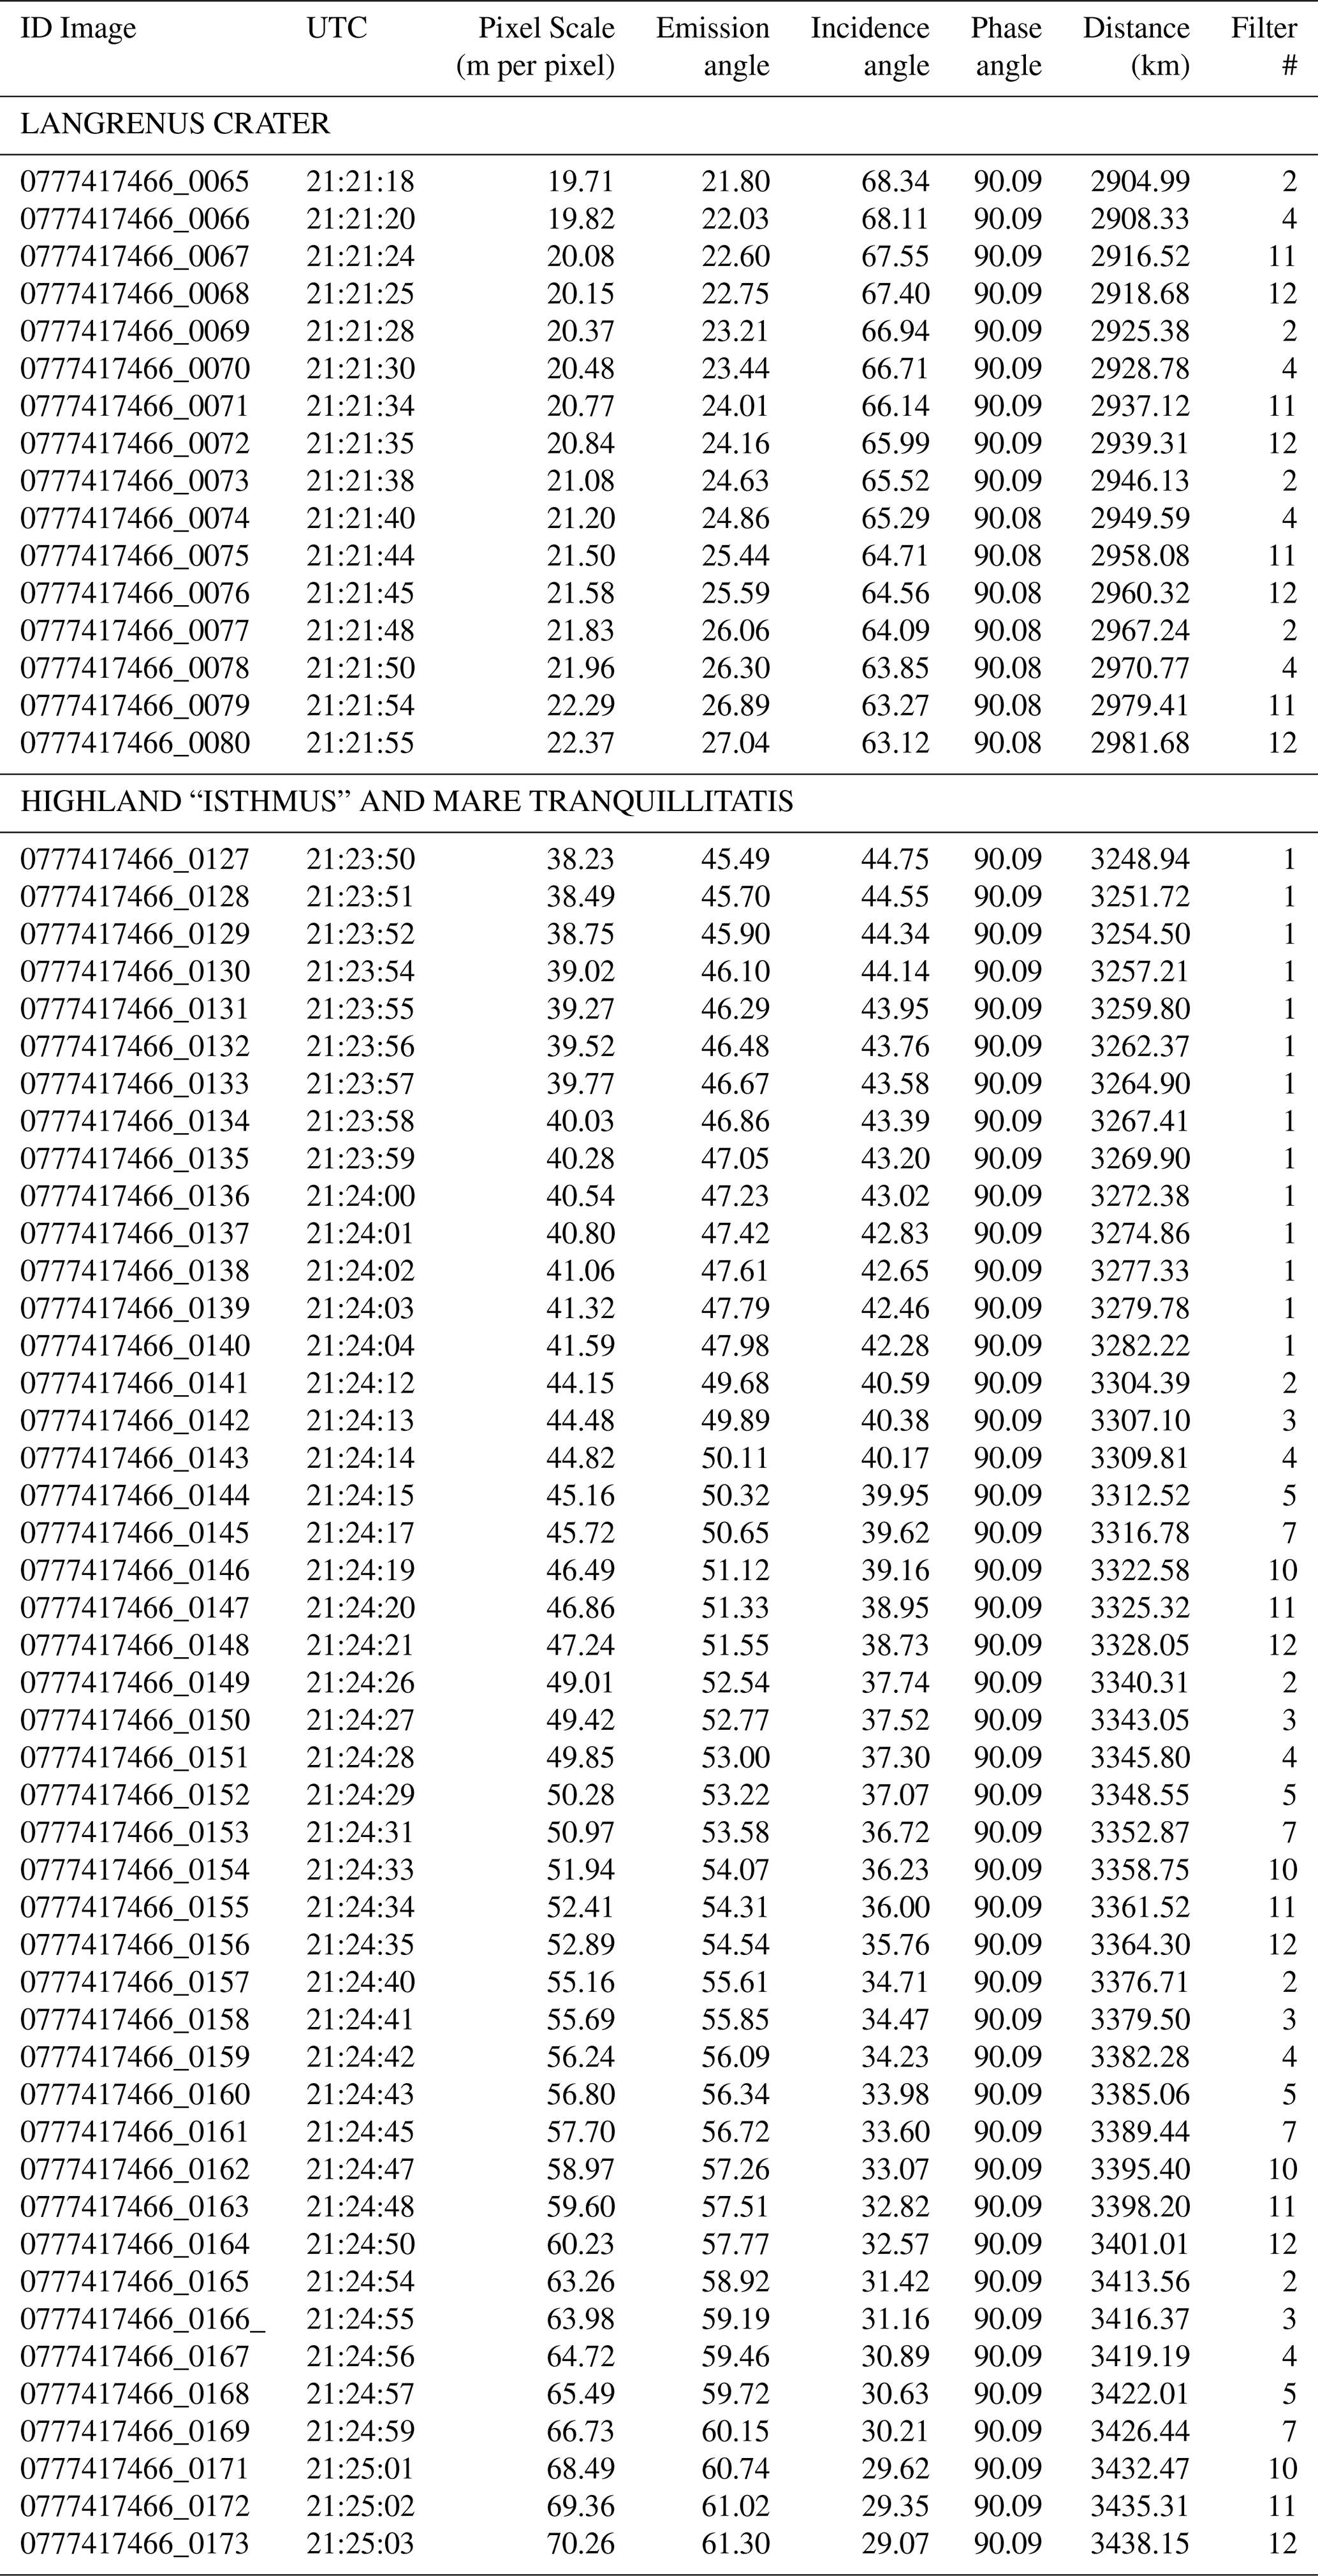
To evaluate the robustness of the Langrenus crater chronology, we additionally fitted the crater size-frequency distributions using the Model Production Function (MPF) approach of Marchi et al. (2009). The fits were performed for crater diameters (D>0.4) km, thereby minimizing the effects of observational incompleteness at smaller diameters. The calculations adopted a hard-rock scaling law, a target strength of 2×10⁷ dyne cm−2, impactor and target densities of 2.6 and 3.0 g cm−3, respectively, and an impact-velocity distribution peaking at 18 km s−1 and a near-Earth-object-like impactor size-frequency distribution.
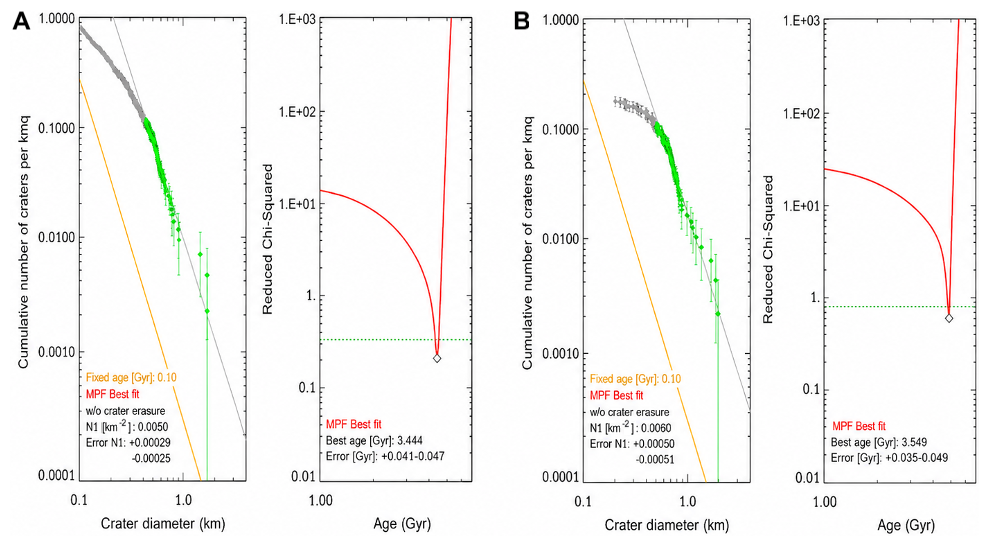
Figure B1Model Production Function chronology fits for the Langrenus crater-floor unit. (A) JANUS crater count; (B) LROC-WAC crater count. In each panel, the cumulative crater size-frequency distribution and its best-fit MPF isochron are shown on the left, whereas the reduced (χ2) function as a function of model age is shown on the right. Best-fit ages are 3.4±0.1 Ga for the JANUS count and 3.5±0.1 Ga for the LROC-WAC count.
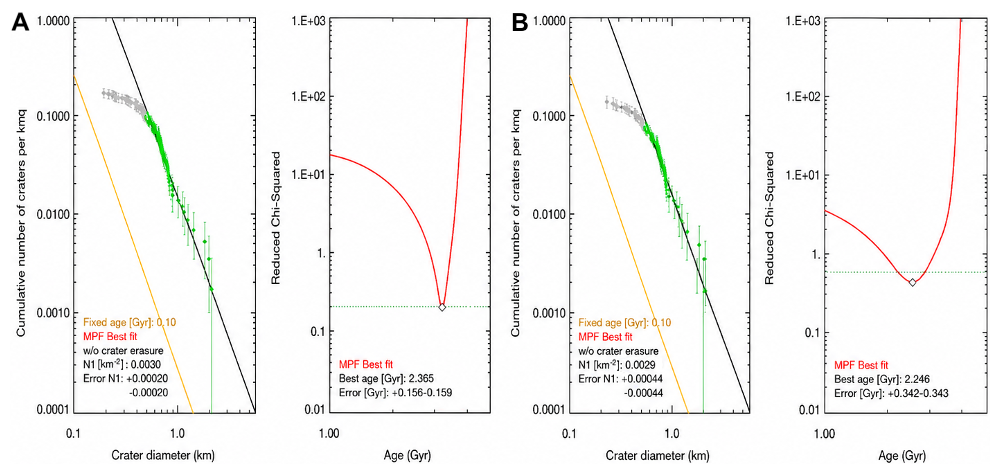
Figure B2Model Production Function chronology fits for the northern hummocky floor terrain of Langrenus. (A) JANUS crater count; (B) LROC-WAC crater count. In each panel, the cumulative crater size-frequency distribution and its best-fit MPF isochron are shown on the left, whereas the reduced (χ2) function as a function of model age is shown on the right. Best-fit ages are 2.4±0.2 Ga for the JANUS count and 2.2±0.3 Ga for the LROC-WAC count.
JANUS data are in the team proprietary period until the data release through ESA Planetary Science Archive (PSA). The first delivery of JUICE cruise data to PSA will occur in 2029.
Oded Aharonson (Department of Earth and Planetary Sciences, Weizmann Institute of Science, Rehovot, Israel), Fernando Álvarez (Instituto de Astrofísica de Andalucía (IAA-CSIC), Granada, Spain), Matthew Balme (School of Physical Sciences, The Open University, Milton Keynes, United Kingdom), James Bell (School of Earth and Space Exploration, Arizona State University, Tempe, USA), Ivano Bertini (Department of Science and Technology, University of Naples Parthenope, Naples, Italy), Carlo Bettanini (CISAS, University of Padua, Padua, Italy), Patrizia Borin (INAF – Osservatorio Astronomico di Padova, Padua, Italy), Maria Teresa Capria (INAF – IAPS, Rome, Italy), Andrew Coates (Mullard Space Science Laboratory, University College London, Dorking, United Kingdom), Giacomo Colombatti (CISAS, University of Padua, Padua, Italy), Gabriele Cremonese (INAF – Osservatorio Astronomico di Padova, Padua, Italy), Chiaki Crews (School of Physical Sciences, The Open University, Milton Keynes, United Kingdom), Stefano Debei (CISAS, University of Padua, Padua, Italy), Tilmann Denk (German Aerospace Center (DLR), Institute of Planetary Research, Berlin, Germany), Gaetano Di Achille (INAF – Osservatorio Astronomico d’Abruzzo, Teramo, Italy), Stefan Elgner (German Aerospace Center (DLR), Institute of Planetary Research, Berlin, Germany), Francesca Esposito (INAF – Osservatorio Astronomico di Capodimonte, Naples, Italy), Luigi Ferranti (DiSTAR, University of Naples Federico II, Naples, Italy; INAF – IAPS, Rome, Italy), Sabrina Ferrari (Department of Geosciences, University of Padua, Padua, Italy), Björn Fiethe (IDA, Technische Universität Braunschweig, Braunschweig, Germany), Valentina Galluzzi (INAF – IAPS, Rome, Italy), Antonio García-Segura (Instituto de Astrofísica de Andalucía (IAA-CSIC), Granada, Spain), Davide Grassi (INAF – IAPS, Rome, Italy), Davide Greggio (INAF – Osservatorio Astronomico di Padova, Padua, Italy), Olivier Groussin (Aix Marseille Université, CNRS, CNES, LAM, Marseille, France), Junichi Haruyama (Institute of Space and Astronautical Science (ISAS), JAXA, Sagamihara, Japan), Miguel Herranz (Instituto de Astrofísica de Andalucía (IAA-CSIC), Granada, Spain), Harald Hiesinger (Institut für Planetologie, Universität Münster, Münster, Germany), Andrew Holland (School of Physical Sciences, The Open University, Milton Keynes, United Kingdom), Ralf Jaumann (Institute for Geosciences, Freie Universität Berlin, Berlin, Germany), Geraint Jones (Mullard Space Science Laboratory, University College London, Dorking, United Kingdom), Alexander Koncz (German Aerospace Center (DLR), Institute of Planetary Research, Berlin, Germany), Valéry Lainey (IMCCE, Observatoire de Paris, Paris, France), Yves Langevin (Institut d’Astrophysique Spatiale, Université Paris-Saclay/CNRS, Orsay, France), Laetitia Le Deit (Laboratoire de Planétologie et Géosciences, Nantes Université/CNRS, Nantes, France), Mark Leese (School of Physical Sciences, The Open University, Milton Keynes, United Kingdom), Alexander Lichopoj (German Aerospace Center (DLR), Institute of Planetary Research, Berlin, Germany), Rosaly Lopes (Jet Propulsion Laboratory, California Institute of Technology, Pasadena, USA), Demetrio Magrin (INAF – Osservatorio Astronomico di Padova, Padua, Italy), Lucia Marinangeli (Department of Psychological Sciences, Humanities and Territory, University G. d’Annunzio, Chieti, Italy), Ignacio Martinez Navajas (Instituto de Astrofísica de Andalucía (IAA-CSIC), Granada, Spain), Francesco Marzari (Department of Physics and Astronomy, University of Padua, Padua, Italy), Elena Martellato (INAF – Osservatorio Astronomico di Padova, Padua, Italy), Elena Mazzotta Epifani (INAF – Osservatorio Astronomico di Roma, Monte Porzio Catone, Italy), Harald Michaelis (German Aerospace Center (DLR), Institute of Planetary Research, Berlin, Germany), Harald Michalik (IDA, Technische Universität Braunschweig, Braunschweig, Germany), Volker Mertens (German Aerospace Center (DLR), Institute of Planetary Research, Berlin, Germany), Stefano Mottola (German Aerospace Center (DLR), Institute of Planetary Research, Berlin, Germany), Matteo Munari (INAF – Osservatorio Astrofisico di Catania, Catania, Italy), Carl Murray (Astronomy Unit, Queen Mary University of London, London, United Kingdom), Jürgen Oberst (Institute of Geodesy, Technische Universität Berlin, Berlin, Germany), Katharina Otto (German Aerospace Center (DLR), Institute of Planetary Research, Berlin, Germany), Maria Pelizzo (Department of Information Engineering, University of Padua, Padua, Italy), Frank Postberg (Institute for Geosciences, Freie Universität Berlin, Berlin, Germany), Ciprian Popa (INAF – Osservatorio Astronomico di Capodimonte, Naples, Italy), François Poulet (Institut d’Astrophysique Spatiale, Université Paris-Saclay/CNRS, Orsay, France), Frank Preusker (German Aerospace Center (DLR), Institute of Planetary Research, Berlin, Germany), Olga Prieto-Ballesteros (Centro de Astrobiología (CSIC-INTA), Torrejón de Ardoz, Spain), Cristina Re (INAF – Osservatorio Astronomico di Padova, Padua, Italy), Alessandra Rotundi (Department of Science and Technology, University of Naples Parthenope, Naples, Italy), Mitsuo Sato (Faculty of Science, Hokkaido University, Sapporo, Japan), Pietro Schipani (INAF – Osservatorio Astronomico di Capodimonte, Naples, Italy), Nico Schmedemann (Institut für Planetologie, Universität Münster, Münster, Germany), Juergen Arno Schmidt (Institute for Geosciences, Freie Universität Berlin, Berlin, Germany), Nick Schneider (Laboratory for Atmospheric and Space Physics, University of Colorado, Boulder, USA), Daigo Shoji (Institute of Space and Astronautical Science (ISAS), JAXA, Sagamihara, Japan), Amy Simon (NASA Goddard Space Flight Center, Greenbelt, USA), Emanuele Simioni (INAF – Osservatorio Astronomico di Padova, Padua, Italy), Giuseppe Sindoni (Italian Space Agency (ASI), Rome, Italy), Matthew Soman (European Space Agency (ESA/ESTEC), Noordwijk, the Netherlands), Konstantin Stefanov (School of Physical Sciences, The Open University, Milton Keynes, United Kingdom), Yukihiro Takahashi (Hokkaido University, Sapporo, Japan), Daniela Tirsch (German Aerospace Center (DLR), Institute of Planetary Research, Berlin, Germany), Mathieu Vincendon (Institut d’Astrophysique Spatiale, Université Paris-Saclay/CNRS, Orsay, France), David Williams (School of Earth and Space Exploration, Arizona State University, Tempe, USA), Friederike Wolff (German Aerospace Center (DLR), Institute of Planetary Research, Berlin, Germany), Yoav Yair (School of Sustainability, Reichman University, Herzliya, Israel), Michele Zusi (INAF – IAPS, Rome, Italy).
AL: conceptualization, formal analysis, investigation, methodology, validation, visualization, writing (original draft preparation), writing (review and editing); MM, KG, TK, LP, NRB, LR, OK, JLR, MP, FT, SF, FT, KS, RP, JSV, DC: investigation, methodology, writing (original draft preparation); FZ, GC, AC, LG, EH, SM, PM, GM: writing (review and editing); LP, RH, AA, LA, EK, KDM, RP, FT, CT, MA, AZ, RE, IB, JMCM, VDC, SH, TR, NS, LML, MRP, GP, PP: contributed to operations and data processing; PP: PI of the JANUS instrument.
The contact author has declared that none of the authors has any competing interests.
Publisher's note: Copernicus Publications remains neutral with regard to jurisdictional claims made in the text, published maps, institutional affiliations, or any other geographical representation in this paper. The authors bear the ultimate responsibility for providing appropriate place names. Views expressed in the text are those of the authors and do not necessarily reflect the views of the publisher.
This article is part of the special issue “The first-ever lunar–Earth flyby: a unique test environment for Juice”. It is not associated with a conference.
The authors wish to dedicate this work to the memory of their Friend and colleague, Dr. Riccardo Pozzobon, who sadly left us ahead of time. JANUS has been funded by the respective Space Agencies: ASI (lead funding agency), DLR, Spanish Research Ministry and the UK Space Agency. Main hardware-provider Companies and Institutes are Leonardo SpA (Prime Industry), DLR-Berlin, CSIC-IAA and Sener.
This research has been supported by JUICE ASI-INAF (grant no. 2023-6-HH.0), Severo Ochoa (grant no. CEX2021-001131-S) funded by MCIN/AEI/10.13039/501100011033, PID2021-126365NB-C21, LUMIO ASI-INAF (grant no. 2024-6-HH.0).
This paper was edited by Stephanie C. Werner and reviewed by two anonymous referees.
Agostini, L., Matz, K.-D., Tubiana, C., Della Corte, V., Penasa, L., Bilotta, T., Sarti, F., Read, M., Hviid, S., Mottola, S., Aboudan, A., Trauthan, F., Politi, R., Aye, M., Hueso, R., Lucchetti, A., Kersten, E., Belgacem, I., Dietz, A., Evill, R., Bell III, J. F., Zinzi, A., Castro-Marin, J. M., Roatsch, T., Schmitz, N., Patel, M. R., Lara, L. M., Portyankina, G., and Palumbo, P.: Calibrating JANUS: an overview of the calibration pipeline and what we learned from the Moon-Earth flyby data, EGUsphere [preprint], https://doi.org/10.5194/egusphere-2026-2032, 2026.
Amsden, A., Ruppel, H., and Hirt, C.: SALE: A simplified ALE computer program for fluid flow at all speeds, Los Alamos National Laboratories Report, LA-8095:101p, LANL, Los Alamos, New Mexico, 1980.
Barker, M. K., Mazarico, E., Neumann, G. A., Zuber, M. T., Haruyama, J., and Smith, D. E.: A new lunar digital elevation model from the lunar orbiter laser altimeter and SELENE terrain camera, Icarus, 273, 346–355, https://doi.org/10.1016/j.icarus.2015.07.039, 2016.
Barlow, N. G.: Herringbone Pattern, in: Encyclopedia of Planetary Landforms, edited by: Hargitai, H. and Kereszturi, A., Springer, New York, NY, https://doi.org/10.1007/978-1-4614-3134-3_186, 2015.
Bhatt, H., Chauhan, P., and Solanki, P.: Compositional mapping and the evolutionary history of Mare Tranquillitatis, J. Earth Syst. Sci., 129, 45, https://doi.org/10.1007/s12040-019-1302-7, 2020.
Calinski, R. B. and Harabasz, J.: A dendrite method for cluster analysis, Commun. Stat., 3, 1–27, 1974.
Dalle Ore, C. M., Cruikshank, D. P., and Clark, R. N.: Infrared spectroscopic characterization of the low-albedo materials on Iapetus, Icarus, 221, 735–743, 2012.
Dalle Ore, C. M., Cruikshank, D. P., Mastrapa, R. M., Lewis, E., and White, O. L.: Impact craters: An ice study on Rhea, Icarus, 261, 80–90, 2015.
Dalle Ore, C. M., Protopapa, S., Cook, J. C., Grundy, W. M., Cruikshank, D. P., Verbiscer, A. J., Ennico, K., Olkin, C. B., Stern, S. A., Weaver, H. A., Young, L. A., and the New Horizon team: Ices on Charon: Distribution of H2O and NH3 from New Horizons LEISA observations, Icarus, 300, 21–32, 2018.
Dalle Ore, C. M., Cruikshank, D. P., Protopapa, S., Scipioni, F., McKinnon, W. B., Cook, J. C., Grundy, W. M., Schmitt, B., Stern, A. S., Moore, J. M., Verbiscer, A., Parker, A. H., Singer, K. N., Umhuran, O. M., Weaver, H. A., Olkin, C. B., Young, L. A., Ennico, K., and the New Horizon Team: Detection of ammonia on Pluto's surface in a region of geologically recent tectonism, Sci. Adv., 5, eaav5731, https://doi.org/10.1126/sciadv.aav5731, 2019.
Dalle Ore, C. M., Long, C. J., Nichols-Fleming, F., Scipioni, F., Valentín, E. G. R., Oquendo, A. J. L., and Cruikshank, D. P.: Dione's Wispy Terrain: A Cryovolcanic Story?, Planet. Sci. J., 2, 83, https://doi.org/10.3847/PSJ/abe7ec, 2021.
Fernandes, V. A. and Burgess, R.: Volcanism in Mare Fecunditatis and Mare Crisium: Ar-Ar age studies, Geochim. Cosmochim. Ac., 69, 4919–4934, 2005.
Fortezzo, C. M., Spudis, P. D., and Harrel, S. L.: Unified Geologic map of the Moon, Scale 1:10 000 000, US Geological Survey, https://hdl.handle.net/20.500.11753/1598, 2020.
Frueh, T., Hiesinger, H., Van der Bogert, C. H., Clark, J. D., Watters, T. R., and Schmedemann, N.: Timing and origin of compressional tectonism in mare tranquillitatis, J. Geophys. Res.-Planet., 128, e2022JE007533, 2023.
Grasset, O., Dougherty, M. K., Coustenis, A., Bunce, E. J., Erd, C., Titov, D., Blanc, M., Coates, A., Drossart, P., Fletcher, L. N., Hussmann, H., Jaumann, R., Krupp, N., Lebreton, J.-P., Prieto-Ballestreros, O., Tortora, P., Tosi, F., and Van Hoolst, T.: JUpiter ICy moons Explorer (JUICE): An ESA mission to orbit Ganymede and to characterise the Jupiter system, Planet. Space Sci., 78, 1–21, 2013.
Head, J. W. and Wilson, L.: Generation, ascent and eruption of magma on the Moon: New insights into source depths, magma supply, intrusions and effusive/explosive eruptions (Part 2: Predicted emplacement processes and observations), Icarus, 283, 176–223, 2017.
Hiesinger, H., Head III, J. W., Wolf, U., Jaumann, R., and Neukum, G.: Ages and stratigraphy of mare basalts in oceanus procellarum, mare nubium, mare cognitum, and mare insularum, J. Geophys. Res.-Planet., 108, 5065, https://doi.org/10.1029/2002JE001985, 2003.
Hiesinger, H., Head III, J. W., Wolf, U., Jaumann, R., and Neukum, G.: New ages for basalts in Mare Fecunditatis based on crater size-frequency measurements, in: Proceedings of the 37th Lunar and Planetary Science Conference, The Woodlands, Houston, TX, USA, 13–27 March 2006, 1151, LPSC XXXVII abstract #1151, LPI Contribution No. 1303, https://www.lpi.usra.edu/meetings/lpsc2006/pdf/1151.pdf (last access: 11 November 2026), 2006.
Ivanov, M. A., Head, J. W., and Hiesinger, H.: New insights into the regional and local geological context of the Luna 16 landing site, Icarus, 400, 115579, https://doi.org/10.1016/j.icarus.2023.115579, 2023.
Ji, J., Guo, D., Liu, J., Chen, S., Ling, Z., Ding, X., Han, K., Chen, J., Cheng, W., Zhu, K., Liu, J., Wang, J., Chen, J., and Ouyang, Z.: The 1:2 500 000-scale geologic map of the global Moon, Sci. Bull., 67, 1544–1548, https://doi.org/10.1016/j.scib.2022.05.021, 2022.
Kirchoff, M. R. and Marchi, S.: New insights into lunar terrain properties and their effect on derivation of absolute model ages using Apollo landing sites, Icarus, 391, 115336, https://doi.org/10.1016/j.icarus.2022.115336, 2023.
Kirchoff, M. R., Marchi, S., Bottke, W. F., Chapman, C. R., and Enke, B.: Suggestion that recent (≤3 Ga) flux of kilometer and larger impactors in the Earth-Moon system has not been constant, Icarus, 355, 114110, https://doi.org/10.1016/j.icarus.2020.114110, 2021.
Krasilnikov, A. S. and Ivanov, M. A.: Estimates of the Local/Foreign Material Mixing in Langrenus Crater Ejecta, Conference abstract LPSC 56, abstract 1483, https://www.hou.usra.edu/meetings/lpsc2025/pdf/1483.pdf (last access: 11 November 2026), 2025.
Krüger, T., Van der Bogert, C. H., and Hiesinger, H.: Geomorphologic mapping of the lunar crater Tycho and its impact melt deposits, Icarus, 273, 164–181, https://doi.org/10.1016/j.icarus.2016.02.018, 2016.
Lemelin, M., Lucey, P. G., Miljković, K., Gaddis, L. R., Hare, T., and Ohtake, M.: The compositions of the lunar crust and upper mantle: Spectral analysis of the inner rings of lunar impact basins, Planet. Space Sci., 165, 230–243, https://doi.org/10.1016/j.pss.2018.10.003, 2019.
Li, L. and Mustard, J. F.: Highland contamination in lunar mare soils: Improved mapping with multiple end-member spectral mixture analysis (MESMA), J. Geophys. Res.-Planets, 108, 5053, https://doi.org/10.1029/2002JE001917, 2003.
LROC Team/Arizona State University: Moon LRO LROC WAC Global Morphology Mosaic 100 m v3, USGS Astrogeology Science Center, Lunar_LRO_LROC-WAC_Mosaic_global_100m_June2013, https://astrogeology.usgs.gov/search/map/moon_lro_lroc_wac_global_morphology_mosaic_100m (last access: 11 November 2026), 2013.
Lucchetti, A., Pajola, M., Galluzzi, V., Giacomini, L., Carli, C., Cremonese, G., Marzo, G. A., Ferrari, S., Massironi, M., and Palumbo, P.: Mercury hollows as remnants of original bedrock materials and devolatilization processes: A spectral clustering and geomorphological analysis, J. Geophys. Res.-Planet., 123, 2365–2379, https://doi.org/10.1029/2018JE005722, 2018.
Lucchetti, A., Pajola, M., Poggiali, G., Semenzato, A., Munaretto, G., Cremonese, G., Brucato, J. R., and Massironi, M.: Volatiles on Mercury: The case of hollows and the pyroclastic vent of Tyagaraja crater, Icarus, 370, 114694, https://doi.org/10.1016/j.icarus.2021.114694, 2021.
Lucchetti, A., Dalle Ore, C., Pajola, M., Pozzobon, R., Rossi, C., Galluzzi, V., Penasa, L., Stephan, K., Munaretto, G., Cremonese, G., Massironi, M., and Palumbo, P.: Geological, compositional and crystallinity analysis of the Melkart impact crater, Ganymede, Icarus, 401, 115613, https://doi.org/10.1016/j.icarus.2023.115613, 2023.
Lucey, P. G., Blewett, D. T., Taylor, G. J., and Hawke, B. R.: Imaging of lunar surface maturity, J. Geophys. Res.-Planet., 105, 20377–20386, 2000.
Marchi, S., Mottola, S., Cremonese, G., Massironi, M., and Martellato, E.: A new chronology for the Moon and Mercury, Astronom. J., 137, 4936–4948, 2009.
Marzo, G. A., Roush, T. L., Blanco, A., Fonti, S., and Orofino, V.: Cluster analysis of planetary remote sensing spectral data, J. Geophys. Res., 111, E03002, https://doi.org/10.1029/2005JE002532, 2006.
Marzo, G. A., Roush, T. L., Blanco, A., Fonti, S., and Orofino, V.: Statistical exploration and volume reduction of planetary remote sensing spectral data, J. Geophys. Res., 113, E12009, https://doi.org/10.1029/2008JE003219, 2008.
Marzo, G. A., Roush, T. L., and Hogan, R. C.: Automated classification of visible and infrared spectra using cluster analysis, J. Geophys. Res., 114, E08001, https://doi.org/10.1029/2008JE003250, 2009.
Mege, D., Gurgurewicz, J., Massironi, M., Pozzobon, R., Tognon, G., Pajola, M., Tornabene, L. T., Lucchetti, A., Baschetti, B., Davis, J., M., Hauber, E., De Toffoli, B., Doutè, S., Keszthely, L., Marinangeli, L., Perry, J., Pommerol, A., Pompolio, L., Pio Rossi, A., Seelos, F., Sauro, F., Ziethe, R., Cremonese, G., and Thomas, N.: Hydrothermal alteration of ultramafic rocks in Ladon basin, Mars - Insights from CaSSIS, HiRISE, CRISM, and CTX, J. Geophys. Res.-Planet., 128, e2022JE007223, https://doi.org/10.1029/2022JE007223, 2023.
Michael, G. G. and Neukum, G.: Planetary surface dating from crater size-frequency distribution measurements: Partial resurfacing events and statistical age uncertainty, Earth Planet. Sc. Lett., 294, 223–229, 2010.
Michael, G. G., Kneissl, T., and Neesemann, A.: Planetary surface dating from crater size-frequency distribution measurements: Poisson timing analysis, Icarus, 277, 279–285, 2016.
Oberbeck, V. R.: The role of ballistic erosion and sedimentation in lunar stratigraphy, Rev. Geophys., 13, 337–362, 1975.
Orgel, S., Michael, G., Fassett, C. I., Van der Bogert, C. H., Riedel, C., Kneissl, T., and Hiesinger, H.: Ancient bombardment of the inner solar system: reinvestigation of the “fingerprints” of different impactor populations on the lunar surface, J. Geophys. Res., 123, https://doi.org/10.1002/2017JE005451, 2018.
Pajola, M., Roush, T., Dalle Ore, C., Marzo, G. A., and Simioni, E.: Phobos MRO/CRISM visible and near-infrared (0.5–2.5 µm) spectral modeling, Planet. Space Sci., 154, 63–71, 2018.
Pajola, M., Lucchetti, A., Semenzato, A., Poggiali, G., Munaretto, G., Galluzzi, V., Marzo, G.A., Cremonese, G., Brucato, J. R., Palumbo, P., and Massironi, M.: Lermontov crater on Mercury: Geology, morphology and spectral properties of the coexisting hollows and pyroclastic deposits, Planet. Space Sci., 195, 105136, https://doi.org/10.1016/j.pss.2020.105136, 2021.
Palumbo, P., Roatsch, T., Lara, L. M., Castro-Marin, J. M., Della Corte, V., Hviid, S., Jaumann, R., Michaelis, H., Patel, M. R., Portyankina, G., Schmitz, N., Amoroso, M., Mugnuolo, R., Aboudan, A., Agostini, L., Althaus, C., Álvarez, F., Bartolomei, M., Behnke, T., Bilotta, T., Colombatti, G., Colosimo, A., Coustenis, A., Cremonese, G., Crews, C., Dattolo, A., Debei, S., Denk, T., Fiethe, B., Herranz, M., Hoffmann, H., Hueso, R., Koncz, A., Jiménez-Ortega, J., Lichopoj, A., Livi, L., Llamas, X., Lopes, R., Lucchetti, A., Martinez-Navajas, I., Mazzotta Epifani, E., Mertens, V., Pajola, M., Sarti, F., Schroedter, R., Stephan, K., Tosi, F., Tubiana, C., Wendler, B., Wendler, D., Williams, D., Wolff, F., Zusi, M., Chiodini, S., Ficai Veltroni, I., Galeotti, A., García-Segura, A., Greggio, D., Holland, A. D., Kenkmann, T., Leese, M. R., Magrin, D., Michalik, H., Munari, M., Noci, G. E., Paolinetti, R., Schipani, P., Soman, M., Stefanov, K. D., Turella, A., Aharonson, O., Bell, J. F. III, Bertini, I., Coates, A. J., Di Achille, G., Grassi, D., Groussin, O., Gwinner, K., Haruyama, J., Hauber, E., Hiesinger, H., Langevin, Y., Lainey, V., Marchi, S., Marinangeli, L., Marzari, F., Massironi, M., Mitri, G., Mottola, S., Oberst, J., Postberg, F., Poulet, F., Preusker, F., Schmidt, J., Schneider, N. M., Simon, A., Takahashi, Y., Tirsch, D., Vincendon, M., Balme, M. R., Bettanini, C., Borin, P., Capria, M. T., Elgner, S., Esposito, F., Ferranti, L., Ferrari, S., Fornasier, S., Galluzzi, V., Giacomini, L., Guzzetta, L., Jones, G. H., Kersten, E., Ledeit, L., Martellato, E., Matz, K.-D., Mennella, V., Murray, C., Otto, K. A., Pelizzo, M. G., Penasa, L., Politi, R., Popa, C., Pozzobon, R., Prieto Ballesteros, O., Re, C., Rotundi, A., Sato, M., Schmedemann, N., Shoji, D., Simioni, E., Sindoni, G., Trauthan, F., and Yair, Y.: The JANUS (Jovis Amorum ac Natorum Undique Scrutator) VIS-NIR multi-band imager for the JUICE mission, Space Sci. Rev., 221, 32, https://doi.org/10.1007/s11214-025-01158-6, 2025.
Pathak, S. and Bhattacharya, S.: Study of Endogenic Water/Hydroxyl in Association with Nominally Anhydrous Mineral Olivine at Crater Langrenus, in: 48th Annual Lunar and Planetary Science Conference, 48th Lunar and Planetary Science Conference, abstract #1884, https://www.hou.usra.edu/meetings/lpsc2017/pdf/1884.pdf (last access: 11 November 2026), 2017.
Pieters, C. M., Taylor, L. A., Noble, S. K., Keller, L. P., Hapke, B., Morris, R. V., Allen, C. C., McKay, D. S., and Wentworth, S.: Space weathering on airless bodies: Resolving a mystery with lunar samples, Meteorit. Planet. Sci., 35, 1101–1107, 2000.
Pieters, C. M., Boardman, J., Buratti, B., Chatterjee, A., Clark, R., Glavich, T., Green, R., Head III, J., Isaacson, P., Malaret, E., and McCord, T.: The Moon Mineralogy Mapper (M3) on Chandrayaan-1, Curr. Sci., 96, 500–505, 2009.
Pinilla-Alonso, N., Roush, T. L., Marzo, G. A., Cruikshank, D. P., and Dalle Ore, C. M.: Iapetus surface variability revealed from statistical clustering of a VIMS mosaic: The distribution of CO2, Icarus, 215, 75–82, 2011.
Prieur, N. C., Rolf, T., Luther, R., Wünnemann, K., Xiao, Z., and Werner, S. C.: The effect of target properties on transient crater scaling for simple craters, J. Geophys. Res.-Planets, 122, 1704–1726, 2017.
Qiao, L., Head, J. W., Wilson, L., Chen, J., and Ling, Z.: Mare domes in Mare Tranquillitatis: Identification, characterization, and implications for their origin, J. Geophys. Res.-Planet., 126, e2021JE006888, https://doi.org/10.1029/2021JE006888, 2021.
Rizos, J. L., de León, J., Licandro, J., Campins, H., Popescu, M., Pinilla-Alonso, N., Golish, D., de Pra, M., and Lauretta, D. S.: Spectral clustering tools applied to Ceres in preparation for OSIRIS-REx color imaging of asteroid (101955) Bennu, Icarus, 328, 69–81, 2019.
Rizos, J. L., De León, J., Licandro, J., Golish, D., Campins, H., Tatsumi, E., Popescu, M., DellaGiustina, D. N., Pajola, M., Li, J.-Y., Becker, K. J., and Lauretta, D. S.: Bennu's global surface and two candidate sample sites characterized by spectral clustering of OSIRIS-REx multispectral images, Icarus, 364, 114467, https://doi.org/10.1016/j.icarus.2021.114467, 2021.
Robinson, M. S., Brylow, S. M., Tschimmel, M. E., Humm, D., Lawrence, S. J., Thomas, P. C., Denevi, B. W., Bowman-Cisneros, E., Zerr, J., Ravine, M. A., and Caplinger, M. A.: Lunar reconnaissance orbiter camera (LROC) instrument overview, Space Sci. Rev., 150, 81–124, 2010.
Sato, H., Robinson, M. S., Hapke, B., Denevi, B. W., and Boyd, A. K.: Resolved Hapke parameter maps of the Moon, J. Geophys. Res.-Planet., 119, 1775–1805, 2014.
Sato, H., Robinson, M. S., Lawrence, S. J., Denevi, B. W., Hapke, B., Joliff, B. L., and Hiesinger, H.: Lunar mare TiO2 abundances estimated from UV/Vis reflectance, Icarus, 296, 216–238, https://doi.org/10.1016/j.icarus.2017.06.013, 2017.
Staid, M. I., Pieters, C. M., and Head III, J. W.: Mare Tranquillitatis: Basalt emplacement history and relation to lunar samples, J. Geophys. Res.-Planet., 101, 23213–23228, 1996.
Tariq, A., Yan, J., Deng, Q., Barriot, J. P., and Abdelrahman, K.: Contractional strains and maximum displacement-length ratios of lunar wrinkle ridges in four Maria of basalt, Adv. Space Res., 74, 6231–6246, 2024.
Thapa, J., Sur, K., Chauhan, M., Ghosh, B., Kundu, A., Pundir, E., Verma, V., and Chauhan, P.: Deciphering mineralogical and compositional variations in lunar Basin, Mare Fecunditatis: An in-depth analysis using hyperspectral remote sensing techniques, Adv. Space Res., 75, 4080–4098, 2025.
Tubiana, C., Penasa, L., Agostini, L., Aboudan, A., Aye, M., Matz, K.-D., Read, M., Bilotta, T., Hueso, R., Lucchetti, A., Kersten, E., Politi, R., Portyankina, G., Seignovert, B., Trauthan, F., Zinzi, A., Evill, R., Dietz, A., Belgacem, I., Cornet, T., Castro-Marin, J. M., Della Corte, V., Hviid, S., Roatsch, T., Schmitz, N., Patel, M. R., Lara, L. M., and Palumbo, P.: Planning of the JUICE/JANUS camera observations during the first ever Lunar-Earth Gravity Assist, EGUsphere [preprint], https://doi.org/10.5194/egusphere-2026-2008, 2026.
Van der Bogert, C. H., Hiesinger, H., Dundas, C. M., Krüger, T., McEwen, A. S., Zanetti, M., and Robinson, M. S.: Origin of discrepancies between crater size-frequency distributions of coeval lunar geologic units via target property contrasts, Icarus, 298, 49–63, https://doi.org/10.1016/j.icarus.2016.11.040, 2017.
Wünnemann, K., Collins, G., and Melosh, H. J.: A strain-based porosity model for use in hydrocode simulations of impacts and implications for transient crater growth in porous targets, Icarus, 180, 514–527, https://doi.org/10.1016/j.icarus.2005.10.013, 2006.
Yue, Z., Sun, S., Du, J., Gou, S., Di, K., Wang, Y., Lin, J., Li, X., and Wu, F.: New insights into the geological evolution history of Mare Fecunditatis, Icarus, 425, 116348, https://doi.org/10.1016/j.icarus.2024.116348, 2025.
Zhao, S., Qian, Y., Xiao, L., Zhao, J., He, Q., Huang, J., Wang, J., Chen, H., and Xu, W.: Lunar Mare Fecunditatis: A Science-Rich Region and a Concept Mission for Long-Distance Exploration, Remote Sens., 14, 1062, https://doi.org/10.3390/rs14051062, 2022.
Zuber, M. T., Smith, D. E., Watkins, M. M., Asmar, S. W., Konopliv, A. S., Lemoine, F. G., Melosh, H. J., Neumann, G. A., Phillips, R. J., Solomon, S. C., Wieczorek, M. A., Williams, J. G., Goossens, S. J., Kruizinga, G., Mazarico, E., Park, R. S., and Yuan, D.-N.: Gravity field of the Moon from the Gravity Recovery and Interior Laboratory (GRAIL) mission, Science, 339, 668–671, https://doi.org/10.1126/science.1231507, 2013.
- Abstract
- Introduction
- Dataset
- Langrenus Crater
- Areas between Maria: The Highland “Isthmus”
- Conclusions
- Appendix A
- Appendix B: Model Production Function chronology fits
- Data availability
- Team list
- Author contributions
- Competing interests
- Disclaimer
- Special issue statement
- Acknowledgements
- Financial support
- Review statement
- References
- Abstract
- Introduction
- Dataset
- Langrenus Crater
- Areas between Maria: The Highland “Isthmus”
- Conclusions
- Appendix A
- Appendix B: Model Production Function chronology fits
- Data availability
- Team list
- Author contributions
- Competing interests
- Disclaimer
- Special issue statement
- Acknowledgements
- Financial support
- Review statement
- References