
the Creative Commons Attribution 4.0 License.
the Creative Commons Attribution 4.0 License.
 | 11 Nov 2026
The SuperDARN Meteor Wind Product: A 31-year archive with modeled altitude contributions and validation

Ryan Poffenbarger
Rafael Mesquita
Diego Janches
Jorge Chau
Toralf Renkwitz
Ralph Latteck
William Bristow
Radar echoes from meteor plasma trails constitute one of the main sources of observations of winds in the mesosphere-lower thermosphere. A new 31-year archive of meteor wind observations has been prepared from data taken at 38 Super Dual Auroral Radar Network (SuperDARN) sites, covering 1993–2024. These observations are not height-resolved, and so an empirical meteor model has been produced to estimate the altitude contribution function, in other words the meteor count distribution. The meteor count model RMSEs were estimated at 0.67 km for the peak height and 1.53 km for the full width at half maximum, based on a validation against independent meteor radar data. The SuperDARN wind observations have been compared against nearby dedicated meteor radar data, with the meteor profiles averaged using the observed count distribution, and against JAWARA reanalysis winds using the new meteor count model. Two case-study comparisons were performed: one for the Andenes meteor radar versus Hankasalmi SuperDARN radar in 2008, and one for the McMurdo meteor radar versus McMurdo SuperDARN radar in 2019. The three datasets were found to be in moderate to strong agreement, with correlations ranging from 0.73–0.90 for the comparison of SuperDARN against the meteor radars and 0.45–0.70 for the comparison of SuperDARN against JAWARA. A summertime equatorward mean flow of 5–15 m s−1 was identified in the northern hemisphere SuperDARN data, consistent with previous reports.
- Article
(6839 KB) - Full-text XML
- BibTeX
- EndNote


1.1 The dynamic and sparsely observed mesosphere-lower thermosphere
Spanning from ∼ 60–110 km altitude, the Mesosphere-Lower Thermosphere (MLT) is a dynamic region dominated by atmospheric waves of various scales (e.g. Vincent, 2015). The MLT is a major and largely unobserved driver of upper atmosphere/ionosphere phenomena that constitute space weather. In particular, MLT wind shears are known to generate “sporadic E” ionization with important effects on signal propagation, while density and wind variations originating in the MLT contribute to satellite drag at higher altitudes. Given the region's inaccessibility to air and orbital flight vehicles, observations of the MLT are obtained primarily through remote sensing. Sounding rocket chemical release experiments show dramatic windshears are commonplace in the MLT (Larsen, 2002), but these observations are necessarily limited in terms of spatial and temporal coverage. Tidal climatologies have been obtained from spacecraft EUV data (e.g. Oberheide et al., 2011; Forbes and Zhang, 2022) but these are also limited in local time coverage and duration. Meteor radars represent the principal ground-based instruments for observing winds in the MLT, with a comprehensive review given by Reid (2024). Briefly, radar signals reflected from meteor ionization trails can provide observations of winds in the MLT, as the observed signal Doppler shifts can be related to drift speeds. At these heights (∼ 70–110 km), collision frequencies are sufficiently high that the plasma can be assumed to drift with the neutral gas. Given the typical ionization levels associated with meteors, meteor radars tend to operate on frequencies of ∼ 50 MHz or below, with lower frequencies providing more scatter but also requiring larger installations and more complicated data interpretation due to propagation effects. The paucity of observations of the MLT, combined with its scientific and technological importance, means that all data sources should be evaluated.
1.2 The SuperDARN meteor wind product
While the Super Dual Auroral Radar Network (SuperDARN) primarily targets the F-region ionosphere (∼ 300 km), meteor echoes are frequently seen in the data and are of proven use in observing neutral winds in the MLT (Hall et al., 1997). SuperDARN observations have been used to study tidal and planetary waves (e.g. Bristow et al., 1999) and have been cross-validated with some success against independent meteor radars (e.g. Hibbins et al., 2011). However, the standard product does not classify individual echoes as underdense or overdense. It instead relies on statistical and geometric selection of near-range echoes rather than on an event-by-event physical classification of each trail. Nevertheless, the SuperDARN meteor wind product is potentially a major resource for studying the MLT, providing continuous observation across all local times, with records dating back to 1993 and ∼ 35 radars currently in operation across both hemispheres. The data continue to be used for tidal analysis (e.g. Hibbins et al., 2019; van Caspel et al., 2022; Mirzaamin et al., 2024). Despite widespread use of SuperDARN meteor winds in tidal and planetary wave studies, the accuracy of the product has not been systematically evaluated against independent observations. In particular, the lack of height resolution introduces uncertainty in the effective measurement altitude and potential biases in retrieved winds. The goals of this study are therefore to (1) estimate the altitude contribution function of SuperDARN meteor echoes, (2) evaluate the resulting winds against independent meteor radar measurements, and (3) quantify systematic differences between the two systems. An updated version of the fitting algorithm has been created and made publicly available, along with the full set of wind data from the network. Figure 1 shows an inventory of the publicly available data product.

The SuperDARN meteor wind archive covers a 31-year interval, with data available from 38 radar sites between 1993–2024. The major limitation of the SuperDARN meteor wind product is that it is not height-resolved. This limitation could potentially be overcome by signal processing improvements, but it must be accepted when analyzing data from the historic archive shown in Fig. 1. Occasional contamination from auroral processes and other sources is eliminated by taking monthly medians of the data, which is common practice in tidal model fitting.
1.3 The altitudinal distribution of meteor trails
In order to interpret the SuperDARN meteor wind data correctly, the altitudinal contribution function must be modeled accurately. The variation of meteor ablation heights is a subject of significant discussion in the literature (e.g. Fentzke and Janches, 2008) with both atmospheric and astronomical factors playing important roles. Ceplecha (1992) summarizes the six primary sources of sporadic meteoroids (north and south apex and toroidal, helion and antihelion) which have characteristic speeds associated with Halley-type comets and Jupiter-family comets (HTCs and JFCs) respectively. The meteor trail altitude is proportional to the elevation angle, with vertical-incidence meteoroids burning up fastest and therefore highest. Variations in the upper atmospheric scale height can also affect meteor ablation altitudes (e.g. Dawkins et al., 2024), with larger scale heights corresponding to higher meteor trails. The radar-observable range of heights is known to vary with operating frequency, with lower-frequency radars able to observe less dense plasma trails and therefore measure somewhat higher altitudes (Steel and Elford, 1991).
1.4 Height-resolved meteor wind product
The MLT typically contains significant wind shears within the range of meteor trail altitudes, such that observed winds cannot simply be assigned to a reference height. An example from the Andenes radar (AND) is shown in Fig. 2.

Figure 2AND zonal winds at 00:00 UT in January 2008. Color contours show wind speeds while grayscale contours show meteor counts.
As can be seen, the winds show significant variability across the observing interval, and so the non-height resolved SuperDARN data should not simply be assigned to a reference altitude at the meteor count peak (e.g. 90 km is often assumed). Rather, the contribution function must be modeled accurately and considered when interpreting the data.
1.5 Data coverage
With the goal of creating a meteor trail model to aid the interpretation of the SuperDARN data, we analyze count data from several meteor radars, listed in Table 1.
Table 1Locations of the meteor radars used in generating the meteor count model. * 2008 JUL data were omitted from the training set in order to be used for validation.

Both sets of radars are shown in Fig. 3.

Figure 3Locations of the meteor radars (green) and SuperDARN radars (red) used in this study.
While there are a number of other meteor radars in existence, their data files (as available on the Madrigal server) do not contain meteor count data.
1.6 The JAGUAR-DAS Whole Neutral Atmosphere Reanalysis
For this study, we use the JAGUAR-DAS Whole neutral Atmosphere Reanalysis (JAWARA; Koshin et al., 2025) for comparison with the radar winds. JAWARA is an observation-constrained atmospheric reanalysis produced with the Japanese Atmospheric General circulation model for Upper Atmosphere Research Data Assimilation System (JAGUAR-DAS). JAWARA spans the whole neutral atmosphere from the surface to the lower thermosphere and currently covers September 2004 to December 2023, with later production ongoing. JAWARA is used here as an independent, observation-constrained reference rather than a ground truth.
The JAGUAR forecast model extends to about 150 km altitude, uses T42 horizontal resolution (2.8125°) and 124 vertical levels, and includes physical parameterizations appropriate for the mesosphere and lower thermosphere, including non-local thermal equilibrium and O2 O3 heating, ion drag, chemical heating, dissipation heating, and molecular diffusion. The assimilation system uses a four-dimensional local ensemble transform Kalman filter with 50 ensemble members and incremental analysis update, and incorporates conventional meteorological observations together with Aura MLS, TIMED SABER, and DMSP SSMIS data. The archived JAWARA products include hourly snapshot fields of three-dimensional wind and geopotential height on longitude, latitude, pressure, and time coordinates; in this study we use the hourly assimilation winds for 2008 and 2019.
A new SuperDARN meteor wind algorithm was developed based on that of Bristow et al. (1999). In order to estimate the altitude contribution function of the SuperDARN measurements, a support vector machine regression model (SVM; Vapnik, 1995) was trained on monthly median meteor count data from the stations listed in Table 1, with supporting information from the meteoroid engineering model (MEM v3; Moorhead et al., 2020), the Mass Spectrometer Incoherent Scatter (MSIS; Picone et al., 2002) atmospheric model, and the sporadic meteor radiant distributions described by Jones and Brown (1993). SVM was chosen for its ability to capture nonlinear relationships with limited training data; preliminary tests with linear models showed reduced skill (not shown). Gaussian fitting was applied to parameterize the meteor count profiles in terms of peak height and full width at half maximum (FWHM), with Gaussians found to provide a good description of the count profiles in the dataset. In order to compare measurements taken at different frequencies, a simple frequency-altitude relation based on Steel and Elford (1991) was used to map radar peak heights to a reference frequency (30 MHz). The SVM regression model was validated against unused data, and was used in comparing the SuperDARN meteor wind observations against tidal climatologies.
2.1 New SuperDARN meteor wind algorithm
The new SuperDARN meteor wind algorithm uses fitACF-level data stored in netCDF format to estimate hourly horizontal winds from backscatter observed within 405 km of a radar. Echoes flagged as ground scatter are excluded, and only echoes with absolute line-of-sight velocity less than 100 m s−1, velocity error less than 50 m s−1, and signal-to-noise ratio pl ≥ 3 are retained. Following the fitACF-v3 definition, the ground-scatter parameter is defined as
with uncertainty
where V is the line-of-sight Doppler velocity, W is the spectral width, and Verr and Werr are the corresponding fit uncertainties. Echoes are flagged as ground scatter when
Therefore the classification depends on both Doppler velocity and spectral width. For each 1 h UT interval, line-of-sight velocities are averaged by beam, and a horizontal wind vector is solved only when at least five beams contain at least two accepted echoes. The beam-mean line-of-sight velocities are projected to the horizontal using a geometric factor corresponding to a representative meteor height of 95 km, and zonal and meridional winds are then obtained from a weighted least-squares fit as a function of beam azimuth. The fit uses inverse beam-variance weighting derived from the scatter of accepted echoes within each beam, and the reported wind uncertainties are taken from the covariance matrix of the weighted fit. The output winds are weighted averages over the meteor altitude distribution, rather than being true point measurements.
2.2 Support vector machine model of meteor counts
The parameters that were used in generating the SVM meteor count model are listed in Table 2. Note that the calculated percentage importances are not entirely deterministic as they depend slightly on the order in which features are analyzed.
Table 2Parameters used in SVM model for prediction of meteor count profiles.

n/a: not applicable.
The predictor parameters were chosen based on the assumption that the meteor count distribution should vary as a function of atmospheric and astronomical factors, in particular the apparent variation of sporadic meteoroids for a given station. Sine functions of day of year and local time were added to indicate to the SVM algorithm that these parameters are cyclical. Given that there is considerable uncertainty in characterizing sporadic meteoroids, this was approached in two different ways. First, an ad-hoc empirical model of the major populations was constructed, leading to a single average “speed” parameter (this is described in the next section). Second, the low and high density meteoroid speeds and fluxes were calculated from the MEM model. The relative importance of each feature was estimated based on its effect on the test data, with rankings listed in Table 2. A total of 8 years of meteor radar data were used in training, and a further 1 year of data used for independent validation.
2.3 Ad-hoc meteoroid model
The effective speed of meteoroids from each meteoroid source was calculated for a given station based on the values in Table 3. Transformation to local coordinates was achieved using the Spacecraft, Planet, Instrument, C-matrix, Events (SPICE) toolkit (Acton, 1996). The weighted means and standard deviations were calculated from these six speeds, with below-zero elevations given zero weight.

The relative abundance of each source was parameterized based on the work of Campbell-Brown and Jones (2006), who used Canadian Meteor Orbit Radar data. The parameterization is shown in Fig. 4.

Figure 4Relative abundances of sporadic meteors, modeled based on Canadian Meteor Orbit Radar (CMOR) observations from London, Ontario, Canada, at 29 MHz, reported by Campbell-Brown and Jones (2006). The South Toroidal source was not observed by them – it is set to 0.1 here, approximately matching the North Toroidal source. The South Apex source was only partially observed, and is interpolated here.
The speed was calculated as follows. For each source, the effective speed, veff, was calculated as the geocentric speed vGEO multiplied by the sine of the elevation angle, φ, as shown in Eq. (4):
Each source was assigned a weight, based on its relative abundance, Φ, from the parameterization shown in Fig. 4, which varied with day of year. This weight was scaled by a factor τ, proportional to the local time such that each flux is maximum at its local time peak (e.g. 06:00 LT for the Apex sources, ∼ 00:00 and ∼ 12:00 LT for the helion/antihelion sources).
The weighted mean speed, , was then calculated for each station at each local time.
2.4 MEM
MEM was run for a grid of locations, with 10° latitude spacing and 30° longitude spacing, for all 24 h on the 15th day of each month of 2008. The model was called at 120 km altitude, to avoid any atmospheric ablation effects. MEM was called for the full range of meteoroid densities, with the speed and flux evaluated in the earthward direction. The MEM output was stored and interpolated to the times and locations of the meteor radar sites.
2.5 Frequency-altitude relation
The frequency-altitude relation that was used to calculate changes in peak height, Δh, from the reference frequency, fref, and the observing frequency, fobs, is shown in Eq. (6).
This was calculated from a log-linear fit to the data shown in Steel and Elford (1991). This relation was used to relate meteor trail distributions of radars using different operating frequencies.
3.1 Meteor count model
The case study for the count model focuses on the Juliusruh (JUL) radar in 2008, which was deliberately omitted from the SVM model training and retained for validation. Figure 5 shows the peak height and FWHM of Gaussian fits to monthly medians of the meteor count data.

Figure 5Gaussian fit parameters of monthly median JUL meteor trail data in 2008. Above: peak height, below: full width at half maximum.
The model was queried for peak and FWHM values for JUL in 2008. A scatter plot comparison is shown in Fig. 6.

Figure 6Scatter plots of observed and modeled meteor count profile parameters for JUL in 2008.
A statistical comparison is shown in Table 4.
Table 4Statistical results of the model validation against JUL data in 2008.

The SVM model provided reasonable estimates of the observed peaks and FWHMs. Performance was better for the peak than for the FWHM, with root-mean-square error of 0.67 vs. 1.53 km, mean error of −0.15 vs. −1.23 km and a correlation of 0.85 vs. 0.63.
In order to determine whether the meteor count model was sufficiently accurate to estimate the height-averaged winds accurately, the average winds were calculated using observed and modeled counts for JUL in 2008. Figure 7 shows height-averaged monthly median JUL zonal winds, weighted using the observed and modeled meteor counts.

Figure 7Height-averaged monthly median zonal winds for JUL meteor radar in 2008, calculated using (above) observed meteor counts and (below) modeled meteor counts.
The observed and modeled counts resulted in similar zonal wind distributions. The root-mean-square error of the model-weighted wind field was 4.0 m s−1.
3.2 Site-by-site wind comparisons
The meteor count model was applied in comparing SuperDARN meteor wind observations against those observed by meteor radars and the JAWARA reanalysis. For the meteor-radar comparison, the hourly altitude profiles were averaged using the observed meteor counts in each bin. The JAWARA-modeled wind was weighted according to the altitude contribution function for the relevant SuperDARN radar at the relevant times.

Figure 8Comparison of AND meteor radar and HAN SuperDARN count-weighted, height-averaged, monthly median wind observations and JAWARA model in the zonal and meridional directions in 2008.
Table 5 shows statistical comparisons calculated for AND and JAWARA against HAN.
Table 5Slopes and Y-intercepts of linear lines of best fit and correlations for the winds shown in Fig. 8.

The comparison showed good qualitative agreement between the two radars (correlations of 0.81 and 0.73, slopes of 1.63 and 0.76). This may be considered reasonable given the ∼ 800 km separation between the two radar sites. In this case, JAWARA showed closer agreement with the AND meteor radar than with the HAN SuperDARN radar.
A similar comparison was performed in the southern hemisphere, with MCM meteor radar data compared against MCM SuperDARN and the JAWARA reanalysis, as shown in Fig. 9.

Figure 9Comparison of MCM meteor radar, MCM SuperDARN and JAWARA count-weighted, height-averaged, monthly median wind observations in the zonal and meridional directions in 2019.
Table 6 shows the slopes and Y-intercepts of linear lines of best fit and Pearson correlations calculated for MCM meteor radar and JAWARA against MCM SuperDARN.
Table 6Slopes and Y-intercepts of linear lines of best fit and correlations for the winds shown in Fig. 9.

The MCM meteor wind radar versus MCM SuperDARN comparison provided a direct comparison at almost the same location. In this case, the SuperDARN zonal winds were clearly larger in magnitude than those of the meteor wind radar (slope of 1.51). Unlike the previous case, the JAWARA reanalysis was closer in magnitude to the SuperDARN winds at McMurdo (in fact JAWARA showed the largest dynamic range of the three). The correlation scores for the two radars were better than in the AND-HAN comparison at 0.90 and 0.77, likely due to the smaller separation between them.
3.3 Global analysis of SuperDARN winds
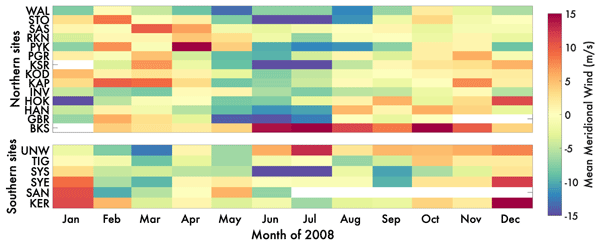
Climatological tidal models frequently assume that the mean wind is zero (e.g. Forbes and Zhang, 2022). To test this assumption, SuperDARN mean winds were calculated for each site by taking 24 h means of the monthly median values. These results are shown in Fig. 10.

Northern hemisphere sites showed predominantly negative values between May and September, with predominantly positive values outside of that. No consistent pattern was discernible from the southern radars, most of which are located on the Antarctic continent. The results from the northern hemisphere indicate that there was a consistent equatorward flow in summer.
The back catalogue of SuperDARN data was processed to derive a meteor wind product, which has been published in the Zenodo archive. Due to SuperDARN's limited range resolution in standard mode (45 km), the meteor echo heights could not be calculated. A model was developed to estimate the meteor echo heights, with a SVM trained on height-resolved meteor radar data supported by atmospheric and astronomical parameters. The meteor model was used to compare SuperDARN winds against height-resolved winds from meteor wind radars and from the JAWARA reanalysis.
The newly developed meteor model proved reasonably accurate in predicting observations from JUL in 2008 that were not used in the training, with RMSEs of 0.67 km for the peak height and 1.53 km for the FWHM. The relative underperformance of the model in predicting FWHM suggests that there is a missing factor controlling it, whereas the peak height is reasonably well constrained by the combination of climatological atmospheric and astronomical factors presented to the model. To give an idea of the sensitivity of the wind product to errors in the two parameters (peak height and FWHM), we calculated (again using the JUL 2008 wind profiles) that a ±1 km error in the height would cause a RMS wind error of ∼ 2 m s−1, while a ±1 km error in the FWHM would cause a RMS wind error of ∼ 1 m s−1. In practice, the model performance was sufficient to recover the height-resolved wind field observed JUL in 2008 reasonably well, yielding a 4.0 m s−1 RMS error. However, the model could be improved by the addition of more height-resolved meteor data at different frequencies. To this end, a new mode should be developed for SuperDARN radars to operate at high resolution mode over the first ∼ 500 km of range, such that meteor heights could be determined accurately. This could be combined with existing multi-frequency sounding modes to identify frequency-dependent variations in radar meteor profiles.
The site-by-site comparisons indicated strong agreement between meteor radar and SuperDARN radar winds in the northern AND-HAN case (69.3 and 62.3° N, separated by ∼ 800 km) and good agreement in the southern MCM-MCM case (77.8 and 77.9° S), with correlations of 0.81 (zonal) and 0.73 (meridional) in the AND-HAN case, and 0.90 and 0.77 in the MCM-MCM case where the two radars were almost co-located. In general the agreement was better in the meridional direction, with SuperDARN showing larger-magnitude winds in the zonal direction. SuperDARN winds should be more accurate in the radar boresight direction as it is resolved directly, whereas only components are observed in the perpendicular direction. While most radars have boresights closer to the meridional than the zonal direction, the MCM SuperDARN boresight is oriented almost exactly westward (263.4° East of North). The JAWARA reanalysis data were found to be in somewhat better agreement with the meteor radar data than with the SuperDARN data (correlations of 0.56–0.85 versus 0.45–0.70).
Substantial (5–15 m s−1) mean winds were identified, with an equatorward flow in summer months evident in the data from northern hemisphere stations. This is consistent with the circulation expected in the mesosphere, below ∼ 100 km (e.g. Wang et al., 2022). The observed magnitude is quite similar to that reported by Mitchell et al. (2002), who found a maximum of ∼ 13 m s−1 at Esrange, Sweden.
A 31-year archive of meteor wind data has been created and published for the SuperDARN network, with 38 radar sites contributing data between 1993–2024. The data are height-averaged over the meteor trail region (∼ 80–100 km), weighted according to the number of meteor counts at each altitude. An empirical model has been developed to estimate the altitude contribution function of the data, using height-resolved meteor data in combination with atmospheric and astronomical parameters to predict peak height and FWHM globally. The model RMSEs were estimated at 0.67 km for the peak height and 1.53 km for the FWHM, while the mean errors were −0.15 and −1.23 km respectively in a validation against independent data from JUL in 2008. Comparisons were performed for the Andenes meteor radar versus Hankasalmi SuperDARN radar and the McMurdo meteor radar versus McMurdo SuperDARN radar. The three datasets were found to be in reasonable agreement, with correlations ranging from 0.73–0.90 for the comparison of SuperDARN against the meteor and 0.45–0.70 for the comparison of SuperDARN against JAWARA. A summertime equatorward mean flow of 5–15 m s−1 was identified in the northern hemisphere SuperDARN data, consistent with Mitchell et al. (2002).
A statistical analysis of the SuperDARN-MWR comparisons was performed for the two case studies shown. MWR uncertainties were not available via Madrigal, so the error analysis is limited to the uncertainties given in the SuperDARN data. This comparison used the hourly values, with the MWR profiles count-weighted across altitude, whereas the comparison shown in the paper used monthly medians of those. A breakdown is shown in Table A1.
Figures A1 and A2 show scatter plots of the data used in generating Tables 5 and 6.
Table A1Statistics of the SuperDARN vs. MWR wind comparisons shown in the manuscript.


Data quality issues were identified in the FIR dataset, but were not resolved. In the first 300 d of 2019, the zonal wind magnitudes were very small. The transition coincided with a switch from single-mode operation to dual-mode operation (.a and .b modes), as shown in Fig. B1. However, in 2020, the zonal wind magnitudes appeared reversed from those expected based on the climatological CTMT model and the nearby meteor radar (SIMONe), as shown in Fig. B2. The two years of FIR data were removed from the public release on this basis.

Figure B1Comparison of RIO meteor radar and FIR SuperDARN height-averaged, monthly median wind observations and JAWARA reanalysis in the zonal and meridional directions in 2019.

Figure B2Comparison of SIMONe meteor radar and FIR SuperDARN height-averaged, monthly median wind observations and JAWARA reanalysis in the zonal and meridional directions in 2020.
All software produced for this effort is available via https://github.com/alexchartier/superdarn, last access: 11 June 2026. The version used for publication is available from Chartier (2026).
The SuperDARN observations (fitACF input and meteor wind output) are available from Chartier and Wiker (2026). Meteor radar data are available from https://cedar.openmadrigal.org, last access: 11 June 2026 (CONDOR, MCM) and on request from Ralph Latteck (latteck@iap-kborn.de, AND) and Toralf Renkwitz (renkwitz@iap-kborn.de, JUL) and Diego Janches (diego.janches@nasa.gov, RIO). JAWARA reanalysis data are available from https://jawara.nipr.ac.jp/, last access: 11 June 2026.
ATC conceived the study, developed the software, processed the data, carried out the analysis, prepared the figures, and drafted the manuscript. RP and RM contributed to software development, data processing, and manuscript editing. DJ, JC, TR, RL, and WB contributed data, scientific input, and manuscript editing. All authors reviewed and approved the final manuscript.
The contact author has declared that none of the authors has any competing interests.
Publisher's note: Copernicus Publications remains neutral with regard to jurisdictional claims made in the text, published maps, institutional affiliations, or any other geographical representation in this paper. The authors bear the ultimate responsibility for providing appropriate place names. Views expressed in the text are those of the authors and do not necessarily reflect the views of the publisher.
The authors thank the SuperDARN and meteor-radar teams and the JAWARA data providers for making this study possible. The CODEX artificial intelligence tool was used in code management and reorganization.
This research has been supported by the National Aeronautics and Space Administration (grant no. 80NSSC23K0094) and the National Science Foundation (grant nos. 1934973 and 2426201).
This paper was edited by Keisuke Hosokawa and reviewed by three anonymous referees.
Acton, C. H.: Ancillary data services of NASA's Navigation and Ancillary Information Facility, Planet. Space Sci., 44, 65–70, https://doi.org/10.1016/0032-0633(95)00107-7, 1996.
Bristow, W. A., Yee, J. H., Zhu, X., and Greenwald, R. A.: Simultaneous observations of the July 1996 2-day wave event using the Super Dual Auroral Radar Network and the High Resolution Doppler Imager, J. Geophys. Res.-Space, 104, 12715–12721, https://doi.org/10.1029/1999JA900030, 1999.
Campbell-Brown, M. D. and Jones, J.: Annual variation of sporadic radar meteor rates, Mon. Not. R. Astron. Soc., 367, 709–716, https://doi.org/10.1111/j.1365-2966.2005.09974.x, 2006.
Ceplecha, Z.: Influx of interplanetary bodies onto Earth, Astron. Astrophys., 263, 361–366, 1992.
Chartier, A. T.: Code for meteor winds paper, Zenodo [code], https://doi.org/10.5281/zenodo.18317765, 2026.
Chartier, A. T. and Wiker, J. R.: SuperDARN meteor winds product (1993–2024), Zenodo [data set], https://doi.org/10.5281/zenodo.20767153 , 2026.
Dawkins, E. C. M., Janches, D., Stober, G., Carrillo-Sánchez, J. D., Lieberman, R. S., and Jacobi, C.: Seasonal and local time variation in the observed peak of the meteor altitude distributions by meteor radars, J. Geophys. Res.-Atmos., 129, e2024JD040978, https://doi.org/10.1029/2024JD040978, 2024.
Fentzke, J. T. and Janches, D.: A semi-empirical model of the contribution from sporadic meteoroid sources on the meteor input function in the MLT observed at Arecibo, J. Geophys. Res.-Space, 113, 2007JA012531, https://doi.org/10.1029/2007JA012531, 2008.
Forbes, J. M. and Zhang, X.: Hough Mode Extensions (HMEs) and solar tide behavior in the dissipative thermosphere, J. Geophys. Res.-Space, 127, e2022JA030962, https://doi.org/10.1029/2022JA030962, 2022.
Hall, G. E., MacDougall, J. W., Moorcroft, D. R., St.-Maurice, J. P., Manson, A. H., and Meek, C. E.: Super dual auroral radar network observations of meteor echoes, J. Geophys. Res.-Space, 102, 14603–14614, https://doi.org/10.1029/97JA00517, 1997.
Hibbins, R. E., Freeman, M. P., Milan, S. E., and Ruohoniemi, J. M.: Winds and tides in the mid-latitude Southern Hemisphere upper mesosphere recorded with the Falkland Islands SuperDARN radar, Ann. Geophys., 29, 1985–1996, https://doi.org/10.5194/angeo-29-1985-2011, 2011.
Hibbins, R. E., Espy, P. J., Orsolini, Y. J., Limpasuvan, V., and Barnes, R. J.: SuperDARN observations of semidiurnal tidal variability in the MLT and the response to sudden stratospheric warming events, J. Geophys. Res.-Atmos., 124, 4862–4872, https://doi.org/10.1029/2018JD030157, 2019.
Jones, J. and Brown, P.: Sporadic meteor radiant distributions: orbital survey results, Mon. Not. R. Astron. Soc., 265, 524–532, https://doi.org/10.1093/mnras/265.3.524, 1993.
Koshin, D., Sato, K., Watanabe, S., and Miyazaki, K.: The JAGUAR-DAS whole neutral atmosphere reanalysis: JAWARA, Prog. Earth Planet. Sci., 12, 1, https://doi.org/10.1186/s40645-024-00674-3, 2025.
Larsen, M. F.: Winds and shears in the mesosphere and lower thermosphere: results from four decades of chemical release wind measurements, J. Geophys. Res.-Space, 107, https://doi.org/10.1029/2001JA000218, 2002.
Mirzaamin, T., Orsolini, Y. J., Espy, P. J., and Rhodes, C. T.: SuperDARN radar wind observations of eastward-propagating planetary waves, Atmosphere, 15, 1333, https://doi.org/10.3390/atmos15111333, 2024.
Mitchell, N. J., Pancheva, D., Middleton, H. R., and Hagan, M.: Mean winds and tides in the Arctic mesosphere and lower thermosphere, J. Geophys. Res.-Space, 107, https://doi.org/10.1029/2001JA900127, 2002.
Moorhead, A. V., Kingery, A., and Ehlert, S.: NASA's meteoroid engineering model 3 and its ability to replicate spacecraft impact rates, J. Spacecr. Rockets, 57, 160–176, https://doi.org/10.2514/1.A34561, 2020.
Oberheide, J., Forbes, J. M., Zhang, X., and Bruinsma, S.: Climatology of upward propagating diurnal and semidiurnal tides in the thermosphere, J. Geophys. Res.-Space, 116, https://doi.org/10.1029/2011JA016784, 2011.
Picone, J. M., Hedin, A. E., Drob, D. P., and Aikin, A. C.: NRLMSISE-00 empirical model of the atmosphere: statistical comparisons and scientific issues, J. Geophys. Res.-Space, 107, SIA-15, https://doi.org/10.1029/2002JA009430, 2002.
Reid, I. M.: Meteor radar for investigation of the MLT region: a review, Atmosphere, 15, 505, https://doi.org/10.3390/atmos15040505, 2024.
Steel, D. I. and Elford, W. G.: The height distribution of radio meteors: comparison of observations at different frequencies on the basis of standard echo theory, J. Atmos. Terr. Phys., 53, 409–417, https://doi.org/10.1016/0021-9169(91)90035-6, 1991.
van Caspel, W. E., Espy, P. J., Ortland, D. A., and Hibbins, R. E.: The mid- to high-latitude migrating semidiurnal tide: results from a mechanistic tide model and SuperDARN observations, J. Geophys. Res.-Atmos., 127, e2021JD036007, https://doi.org/10.1029/2021JD036007, 2022.
Vapnik, V.: The nature of statistical learning theory, Springer, New York, https://doi.org/10.1007/978-1-4757-2440-0, 1995.
Vincent, R. A.: The dynamics of the mesosphere and lower thermosphere: a brief review, Prog. Earth Planet. Sci., 2, 4, https://doi.org/10.1186/s40645-015-0035-8, 2015.
Wang, J. C., Yue, J., Wang, W., Qian, L., Wu, Q., and Wang, N.: The lower thermospheric winter-to-summer meridional circulation: 1. Driving mechanism, J. Geophys. Res.-Space, 127, e2022JA030948, https://doi.org/10.1029/2022JA030948, 2022.
- Abstract
- Introduction
- Methods
- Results
- Discussion
- Conclusions
- Appendix A: Statistical comparison of SuperDARN and MWR winds
- Appendix B: Data quality issues found in FIR 2019/2020 output
- Code availability
- Data availability
- Author contributions
- Competing interests
- Disclaimer
- Acknowledgements
- Financial support
- Review statement
- References
- Abstract
- Introduction
- Methods
- Results
- Discussion
- Conclusions
- Appendix A: Statistical comparison of SuperDARN and MWR winds
- Appendix B: Data quality issues found in FIR 2019/2020 output
- Code availability
- Data availability
- Author contributions
- Competing interests
- Disclaimer
- Acknowledgements
- Financial support
- Review statement
- References