
the Creative Commons Attribution 4.0 License.
the Creative Commons Attribution 4.0 License.
 | 23 Oct 2026
Spectral analysis of lunar regions observed by MAJIS during the JUICE Moon-Earth flyby
Francesca Zambon

Francesca Altieri
Maria Cristina De Sanctis
Stéphane Le Mouélic
Giuseppe Piccioni
François Poulet
Yves Langevin
Clément Royer
Federico Tosi
Ozgur Karatekin
Alessandro Mura
Cristian Carli

The Moons and Jupiter Imaging Spectrometer (MAJIS) instrument onboard the ESA Jupiter Icy Moons Explorer (JUICE) mission acquired the first hyperspectral data of the lunar surface since Chandrayaan-1/Moon Mineralogy Mapper (M3), Cassini/VIMS, and the more recent Chandrayaan-2/Imaging Infrared Spectrometer (IIRS). In this study, we present a mineralogical and spectral analysis of a portion of the lunar nearside, including Mare Tranquillitatis, Mare Fecunditatis, and adjacent highland terrains, as observed by MAJIS. Due to high-phase and high-incidence illumination conditions, our analysis primarily focuses on two specific MAJIS observations. MAJIS spectra reveal prominent absorption features near 1 and 2 µm, indicative of both low- and high-calcium pyroxenes, confirming the dominance of mafic minerals – particularly in mare regions and fresh impact craters along with associated ejecta, such as those from Maskelyne G and Messier/Messier A. These areas are characterised by deeper absorption bands compared to surrounding terrains. Variations in spectral slopes are also observed and are associated with both surface maturity and compositional differences, consistent with the spectral characteristics of the observed regions retrieved by previous instruments. We apply thermal emission correction to investigate potential features above 2.6 µm, to discriminate possible absorption bands in the MAJIS infrared spectral range. Nevertheless, further work is required to fully explore this spectral range. Finally, comparison with datasets from previous missions demonstrates strong consistency in derived spectral parameters, validating the performance of MAJIS for lunar mineralogical studies. These findings highlight MAJIS' capability to characterise both composition and maturity of the lunar surface, while also emphasising its potential for future investigations in the Jovian system.
- Article
(23115 KB) - Full-text XML
- BibTeX
- EndNote


The mineralogical characterisation of the lunar surface has been a central objective of planetary science since the earliest stages of lunar exploration. Understanding the composition, spatial distribution, and geological context of lunar minerals is fundamental not only for reconstructing the Moon's thermal and magmatic evolution, but also for providing insight into broader planetary differentiation processes and the crustal evolution of terrestrial bodies in the early Solar System (Pieters and Englert, 1993; Shearer, 2006).
Over the past two decades, advances in orbital remote sensing have revolutionised our ability to investigate the Moon's surface composition. The advent of high-resolution multi- and hyperspectral imaging has enabled detailed detection, mapping, and quantification of key mineralogical species with unprecedented spatial and spectral resolution. These developments have greatly enhanced our understanding of lunar surface processes, magmatic diversity, and regional lithological heterogeneity.
Significant progress has been made thanks to the suite of instruments flown aboard a series of landmark lunar missions. Among these are Chandrayaan-1 with the Moon Mineralogy Mapper (M3) (Pieters et al., 2009; Green et al., 2011), Kaguya (SELENE) with its Multiband Imager (MI) (Ohtake et al., 2008), the Lunar Reconnaissance Orbiter (LRO) equipped with Diviner (Greenhagen et al., 2010), and earlier missions such as Clementine (Lucey et al., 1995).
Operating in the visible/near-infrared (VNIR) and thermal infrared (TIR) spectral domains, these instruments have enabled global and regional-scale mapping of primary lunar minerals – most notably pyroxene, olivine, plagioclase, ilmenite, as well as the identification of compositionally distinctive lithologies, including exposures of Mg-suite, alkali-suite, and pure anorthosite (PAN) rocks (Yamamoto et al., 2012).
The VNIR range is particularly diagnostic for lunar mineralogy, as it encompasses key electronic absorption features of ferrous iron (Fe2+) in mafic minerals (Clark, 1999). The prominent 1 and 2 µm absorption bands, associated primarily with pyroxene, provide critical constraints on mineral type, abundance, and composition (Burns, 1993; Klima et al., 2007, 2011). In contrast, feldspathic highland regions, dominated by Fe-poor plagioclase, exhibit high reflectance, weak or absent mafic absorptions, and a spectral continuum that clearly distinguishes them from the low-albedo, mafic-rich maria (Ohtake et al., 2008; Yamamoto et al., 2012; Stadermann et al., 2023; Du and Yang, 2024; Yen et al., 2025).
The lunar maria, which collectively cover approximately 17 % of the Moon's surface (Taylor and McLennan, 2008), display marked stratigraphic and compositional variability. This diversity is evident in the shifting positions and depths of absorption bands, variations in spectral slopes, and spatial differences in titanium and iron content (Zhang et al., 2012). Among the most geologically and spectrally diverse regions are Mare Tranquillitatis and Mare Fecunditatis, both situated on the Moon's nearside and now observed by the JUICE mission's Moons and Jupiter Imaging Spectrometer (MAJIS) during its cruise phase (Poulet et al., 2024, 2026, this issue). These maria are of particular interest due to their complex volcanic histories and distinct spectral signatures (Bhatt et al., 2020).
Previous analyses using Clementine, M3 and LRO data have shown that Mare Tranquillitatis is largely composed of Fe- and Ti-rich basaltic units, while Mare Fecunditatis exhibits considerable compositional heterogeneity, including lower-Ti basalts and mixtures with highland materials (Lucey et al., 2000a; Gillis et al., 2003; Sato et al., 2017; Ohtake et al., 2009). These differences point to distinct magmatic sources and eruptive chronologies, reflecting the Moon's complex volcanic evolution.
Superimposed on this intrinsic compositional diversity are the effects of space weathering – a suite of surface-altering processes driven by micrometeorite impacts, solar wind sputtering, and radiation. These processes progressively darken the lunar regolith, reduce spectral contrast, redden spectral slopes, and attenuate diagnostic absorption features, primarily through the accumulation of nanophase metallic iron (npFe0) within regolith grains (Pieters et al., 2000; Hapke, 2001; Pieters and Noble, 2016).
Building upon this legacy of remote sensing, the MAJIS instrument – though primarily designed for studying the icy moons of Jupiter – has acquired valuable lunar observations during its cruise phase to the Jovian system. These spectral data offer a new opportunity to examine the Moon's surface with a modern imaging spectrometer at high spatial resolution, adding to the growing archive of high-quality hyperspectral datasets.
In this study, we present a detailed mineralogical and spectral analysis of a region encompassing Mare Tranquillitatis, Mare Fecunditatis, and the intervening highland terrains, using newly acquired MAJIS lunar observations (see Sects. 4.2, 5, and 7). The study area includes diverse geological units, such as Upper Imbrian basalt flows and Nectarian to Imbrian-aged highland crust. This region provides a representative cross-section of nearside lunar lithologies and is well suited for examining mineralogical heterogeneity and surface alteration processes.
We analyse MAJIS-derived spectral parameters – including band depth, band centre position, ratioed spectra, and spectral slopes – alongside comparative datasets from M3, LRO, Kaguya-SP, and Clementine, which facilitate the description of the geological and mineralogical context (sections 3, 4, 4.2). Particular attention is given to the mineralogical analysis of MAJIS data, mainly focused on the shape and position of the 1 and 2 µm absorption bands, which provide robust indicators of mafic mineralogy and regolith maturity (see sections 5, 6). Furthermore, we give a brief overview of the infrared spectral range (2.6–5.4 µm) after thermal removal, to identify potential additional absorption bands and integrate the mineralogical analysis (Sect. 7). Finally, we compare our maps with those publicly available from M3 data to verify the consistency of the MAJIS results (Sect. 8). By employing both calibrated radiance factor (I/F) and normalised (ratioed) spectra, we mitigate the effects of photometric distortions and instrumental artefacts, improving the accuracy and reliability of mineral detection.
Table 1Summary of the main characteristics of the lunar MAJIS data. As highlighted in the table, cube C1 exhibits illumination conditions that are unsuitable for mineralogical analyses.

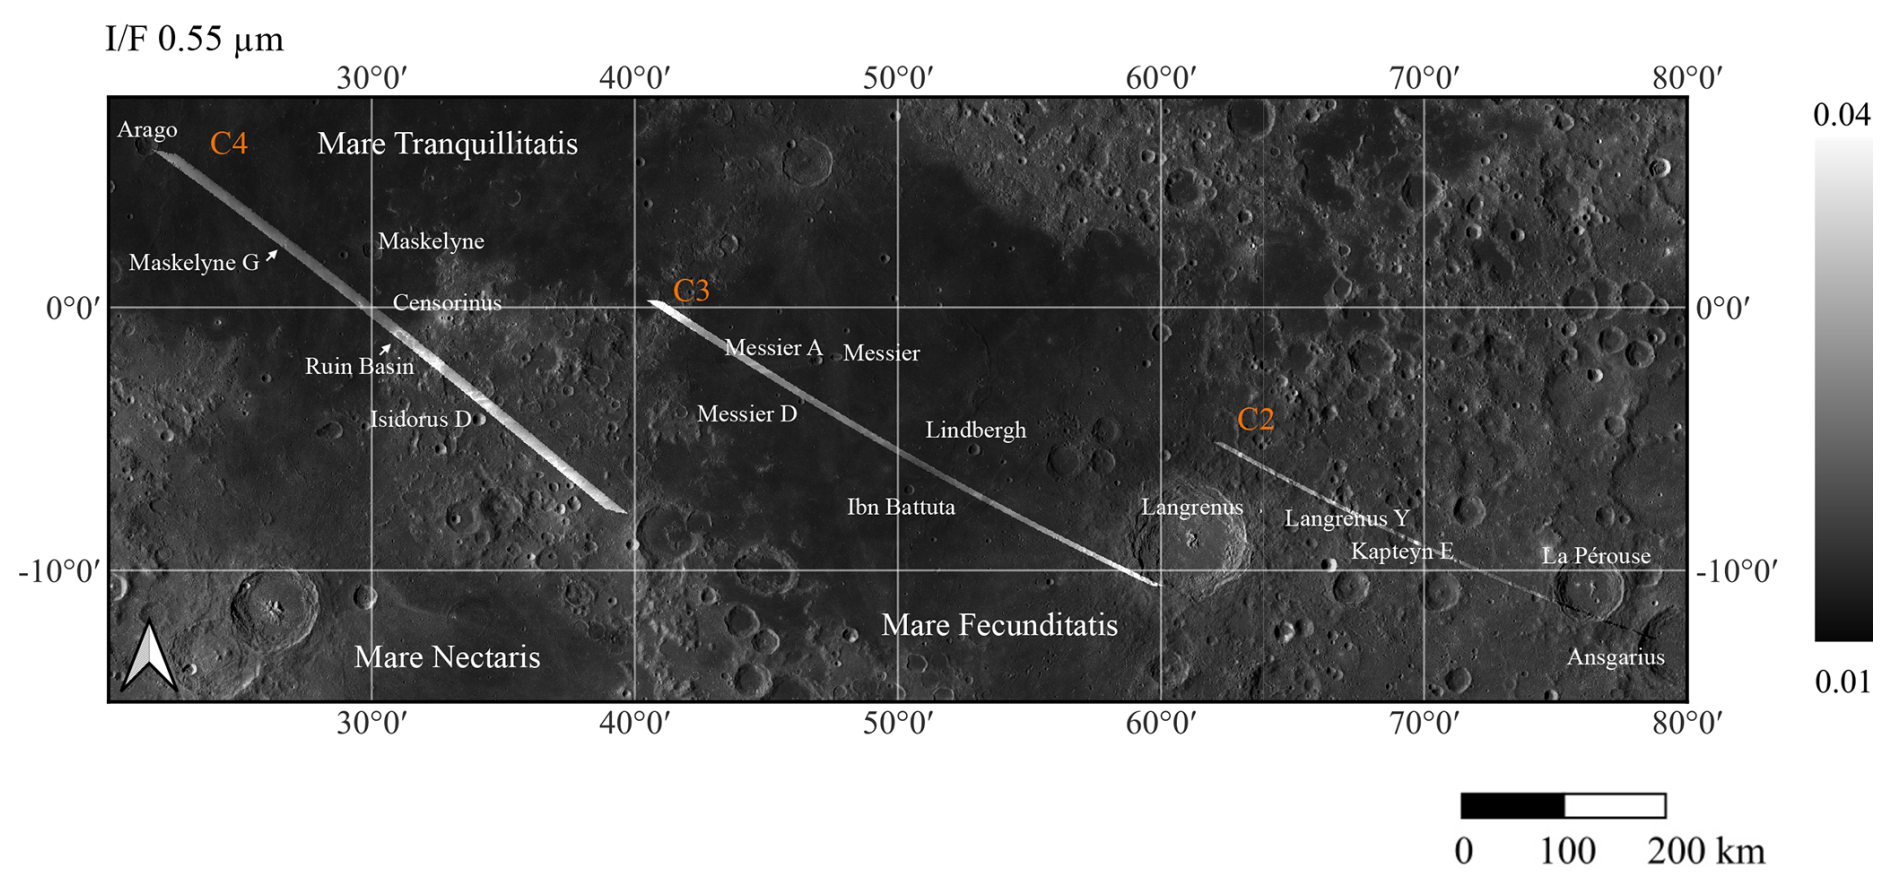
Figure 1MAJIS lunar data coverage for the three cubes analysed in this study. The image shows the I/F at 0.55 µm for cubes C2, C3, and C4. The background layer is the LRO basemap, obtained from NAC ROI mosaics and NAC images acquired at high incidence angles (55–80°), overlaid on the WAC mosaic. The dataset includes high-resolution LROC NAC imagery (0.5 m per pixel) displayed on the WAC global morphologic basemap (100 m per pixel).
On 19 August 2024, during its journey towards the Jovian system, the JUICE spacecraft performed a Moon-Earth flyby, where the MAJIS instrument acquired hyperspectral data of both bodies (Poulet et al., 2026, this issue). This opportunity served not only to test the instrument's performance under real observational conditions but also to enable preliminary scientific investigations. In this study, we focus exclusively on the lunar dataset, while the analysis of the Earth observations obtained during the same flyby is discussed in detail in Oliva et al. (2026), and D'Aversa et al. (2026), this issue.
During the lunar flyby, MAJIS acquired four hyperspectral images (“cubes”), covering an equatorial region that spans Mare Tranquillitatis, Mare Fecunditatis, and adjacent highland terrain (see Fig. 1). However, due to orbital constraints of the flyby, only three of the four cubes are suitable for scientific analysis of the solar flux reflected by the lunar surface. Table 1 provides a summary of the key observational parameters of the lunar dataset. For clarity, we refer to the four MAJIS cubes as C1, C2, C3, and C4, corresponding to their chronological order of acquisition. All four observations were obtained at a phase angle of approximately 90°, with the incidence angle decreasing progressively from C1 to C4. Here, we focus on cubes C3 and C4, which were acquired under the best observing conditions (incidence angles < 60°). For completeness, we also considered cube C2, which entirely covers a highland region but is affected by poor solar illumination conditions and significant photometric distortions (Fig. 1). Furthermore, we excluded C1 from our analysis due to the suboptimal illumination conditions.
A dedicated photometric correction was not applied in this work. The currently available MAJIS observations were acquired at phase angles around ∼ 90°, preventing the derivation of a reliable empirical phase function. Preliminary tests using a Lommel–Seeliger correction, similar to approaches adopted for M3 and lunar datasets (Hicks et al., 2011; Besse et al., 2013), did not yield satisfactory results because of the limited phase-angle coverage and the unfavourable observing geometry of the dataset. A rigorous photometric analysis would require observations acquired under a broader range of illumination conditions and a dedicated investigation, which is beyond the scope of the present study. Therefore, only I/F data are considered here, and the analysis focuses primarily on the spectral behavior and relative compositional variations within the observed regions.
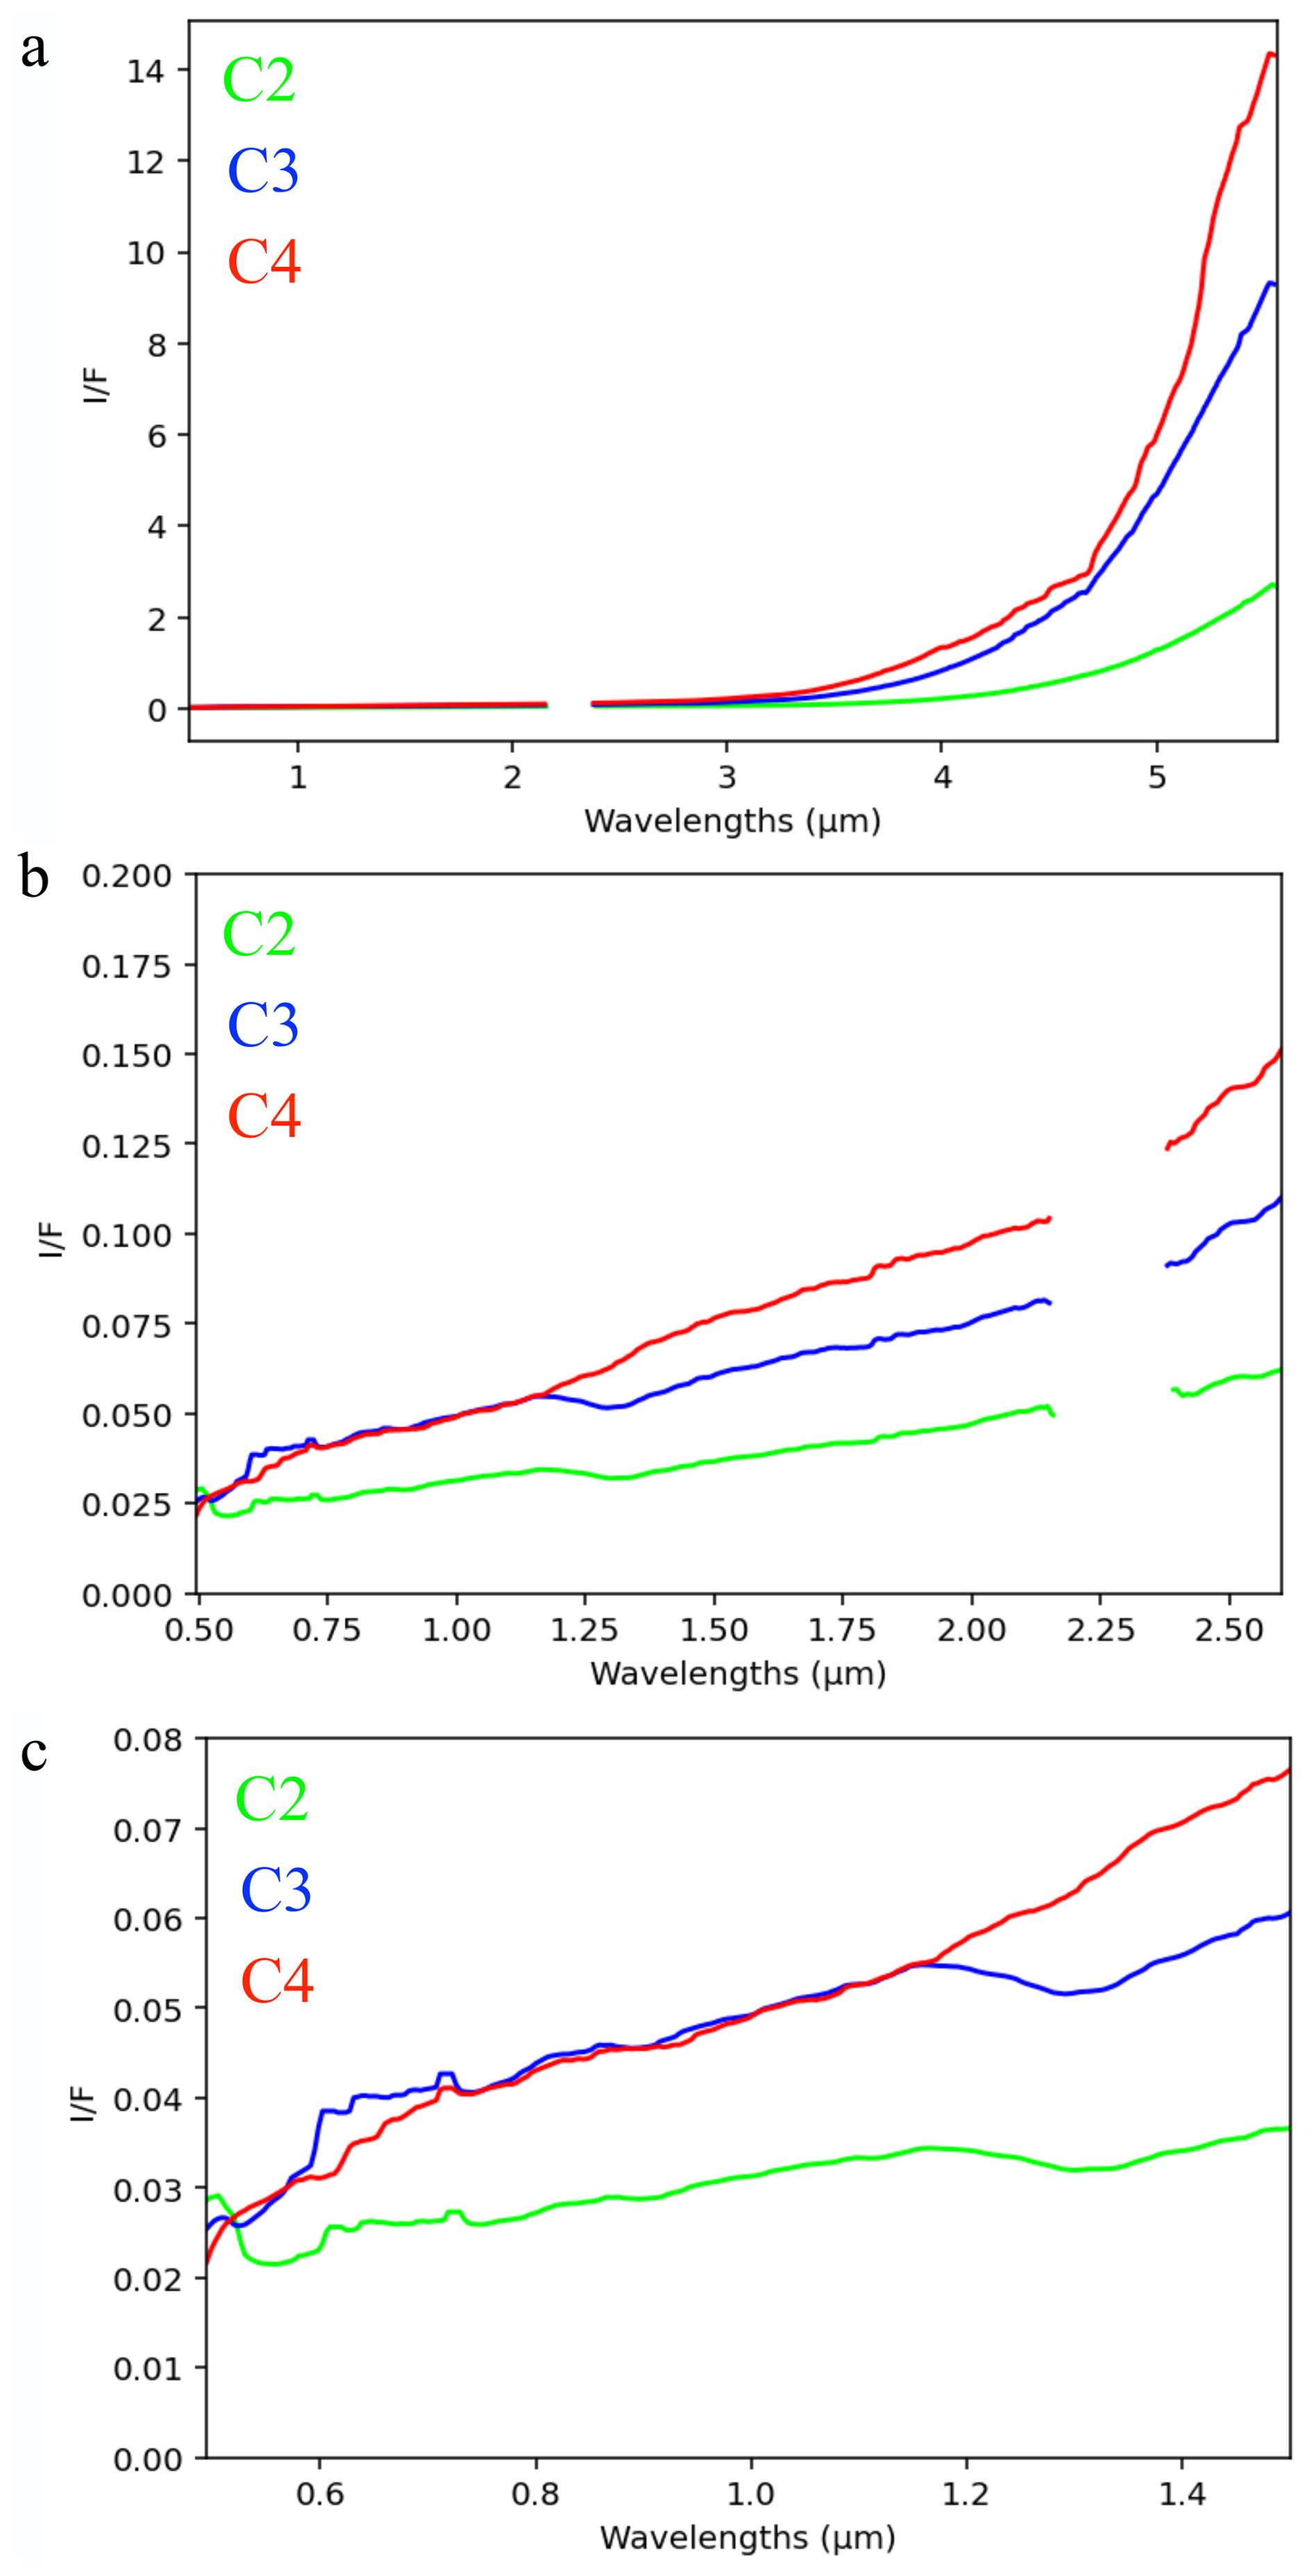
Figure 2Average spectra from MAJIS data cubes: C2 (green), C3 (blue), and C4 (red). The spectral gap between ∼ 2.22 and 2.35 µm corresponds to the bridging region between the VIS–NIR and IR channels. Panel (a): Full-range average I/F spectra for each cube across both VIS–NIR and IR channels. Panel (b): The same spectra as in panel (a), shown up to 2.8 µm to exclude the thermal emission region. Panel (c): Average I/F spectra between 0.55 and 1.50 µm, highlighting differences in the 1 µm absorption band. Spectra from cubes C2 and C3, which were not corrected for stray light, exhibit noticeably different trends compared with the stray light-corrected cube C4 (see Langevin et al., 2026, this issue).
Additional considerations must be made regarding instrumental artefacts present in the dataset. In particular, stray light contamination affects the spectral region below 1.3 µm, with the Moon representing a worst-case scenario for this stray light contribution (Langevin et al., 2024, 2026, this issue). Among the four cubes, only C4 could be reliably corrected for this artefact thanks to a specific detector windowing (Poulet et al., 2026, this issue). The observation was deliberately planned to read a portion of the detector outside the Field of View (FOV) (namely 17 of the 64 pixels of C4 along the slit) in order to quantify the stray light (see Langevin et al., 2026, this issue). For further details on stray light in the VIS–NIR range, see Langevin et al. (2024, 2026), this issue. It should also be noted that the spectral gap between 2.22 and 2.35 µm corresponds to the transition zone between the VIS–NIR and IR channels of the MAJIS instrument. Figure 2 shows the average spectra of C2, C3, and C4, with stray-light correction applied only to C4.
In this work, we analysed MAJIS radiance data cubes after filtering out saturated data. Thermal emission was removed, the data were converted to radiance factor (I/F), and a smoothing algorithm, with a kernel equal to 7 spectral channels, was applied. A detailed description of the MAJIS data processing workflow is provided in Appendix A.
The region investigated in this study, as observed by the MAJIS instrument onboard JUICE through data cubes C2, C3, and C4 (Fig. 1), encompasses geologically and compositionally diverse areas of the lunar nearside. The area includes extensive portions of two major basaltic plains – Mare Tranquillitatis and Mare Fecunditatis – as well as intervening and peripheral highland terrains, providing a representative sampling of both mare and non-mare lithologies. Geographically, the coverage extends approximately from −11 to +6° in latitude and from 21 to 61° E in longitude.
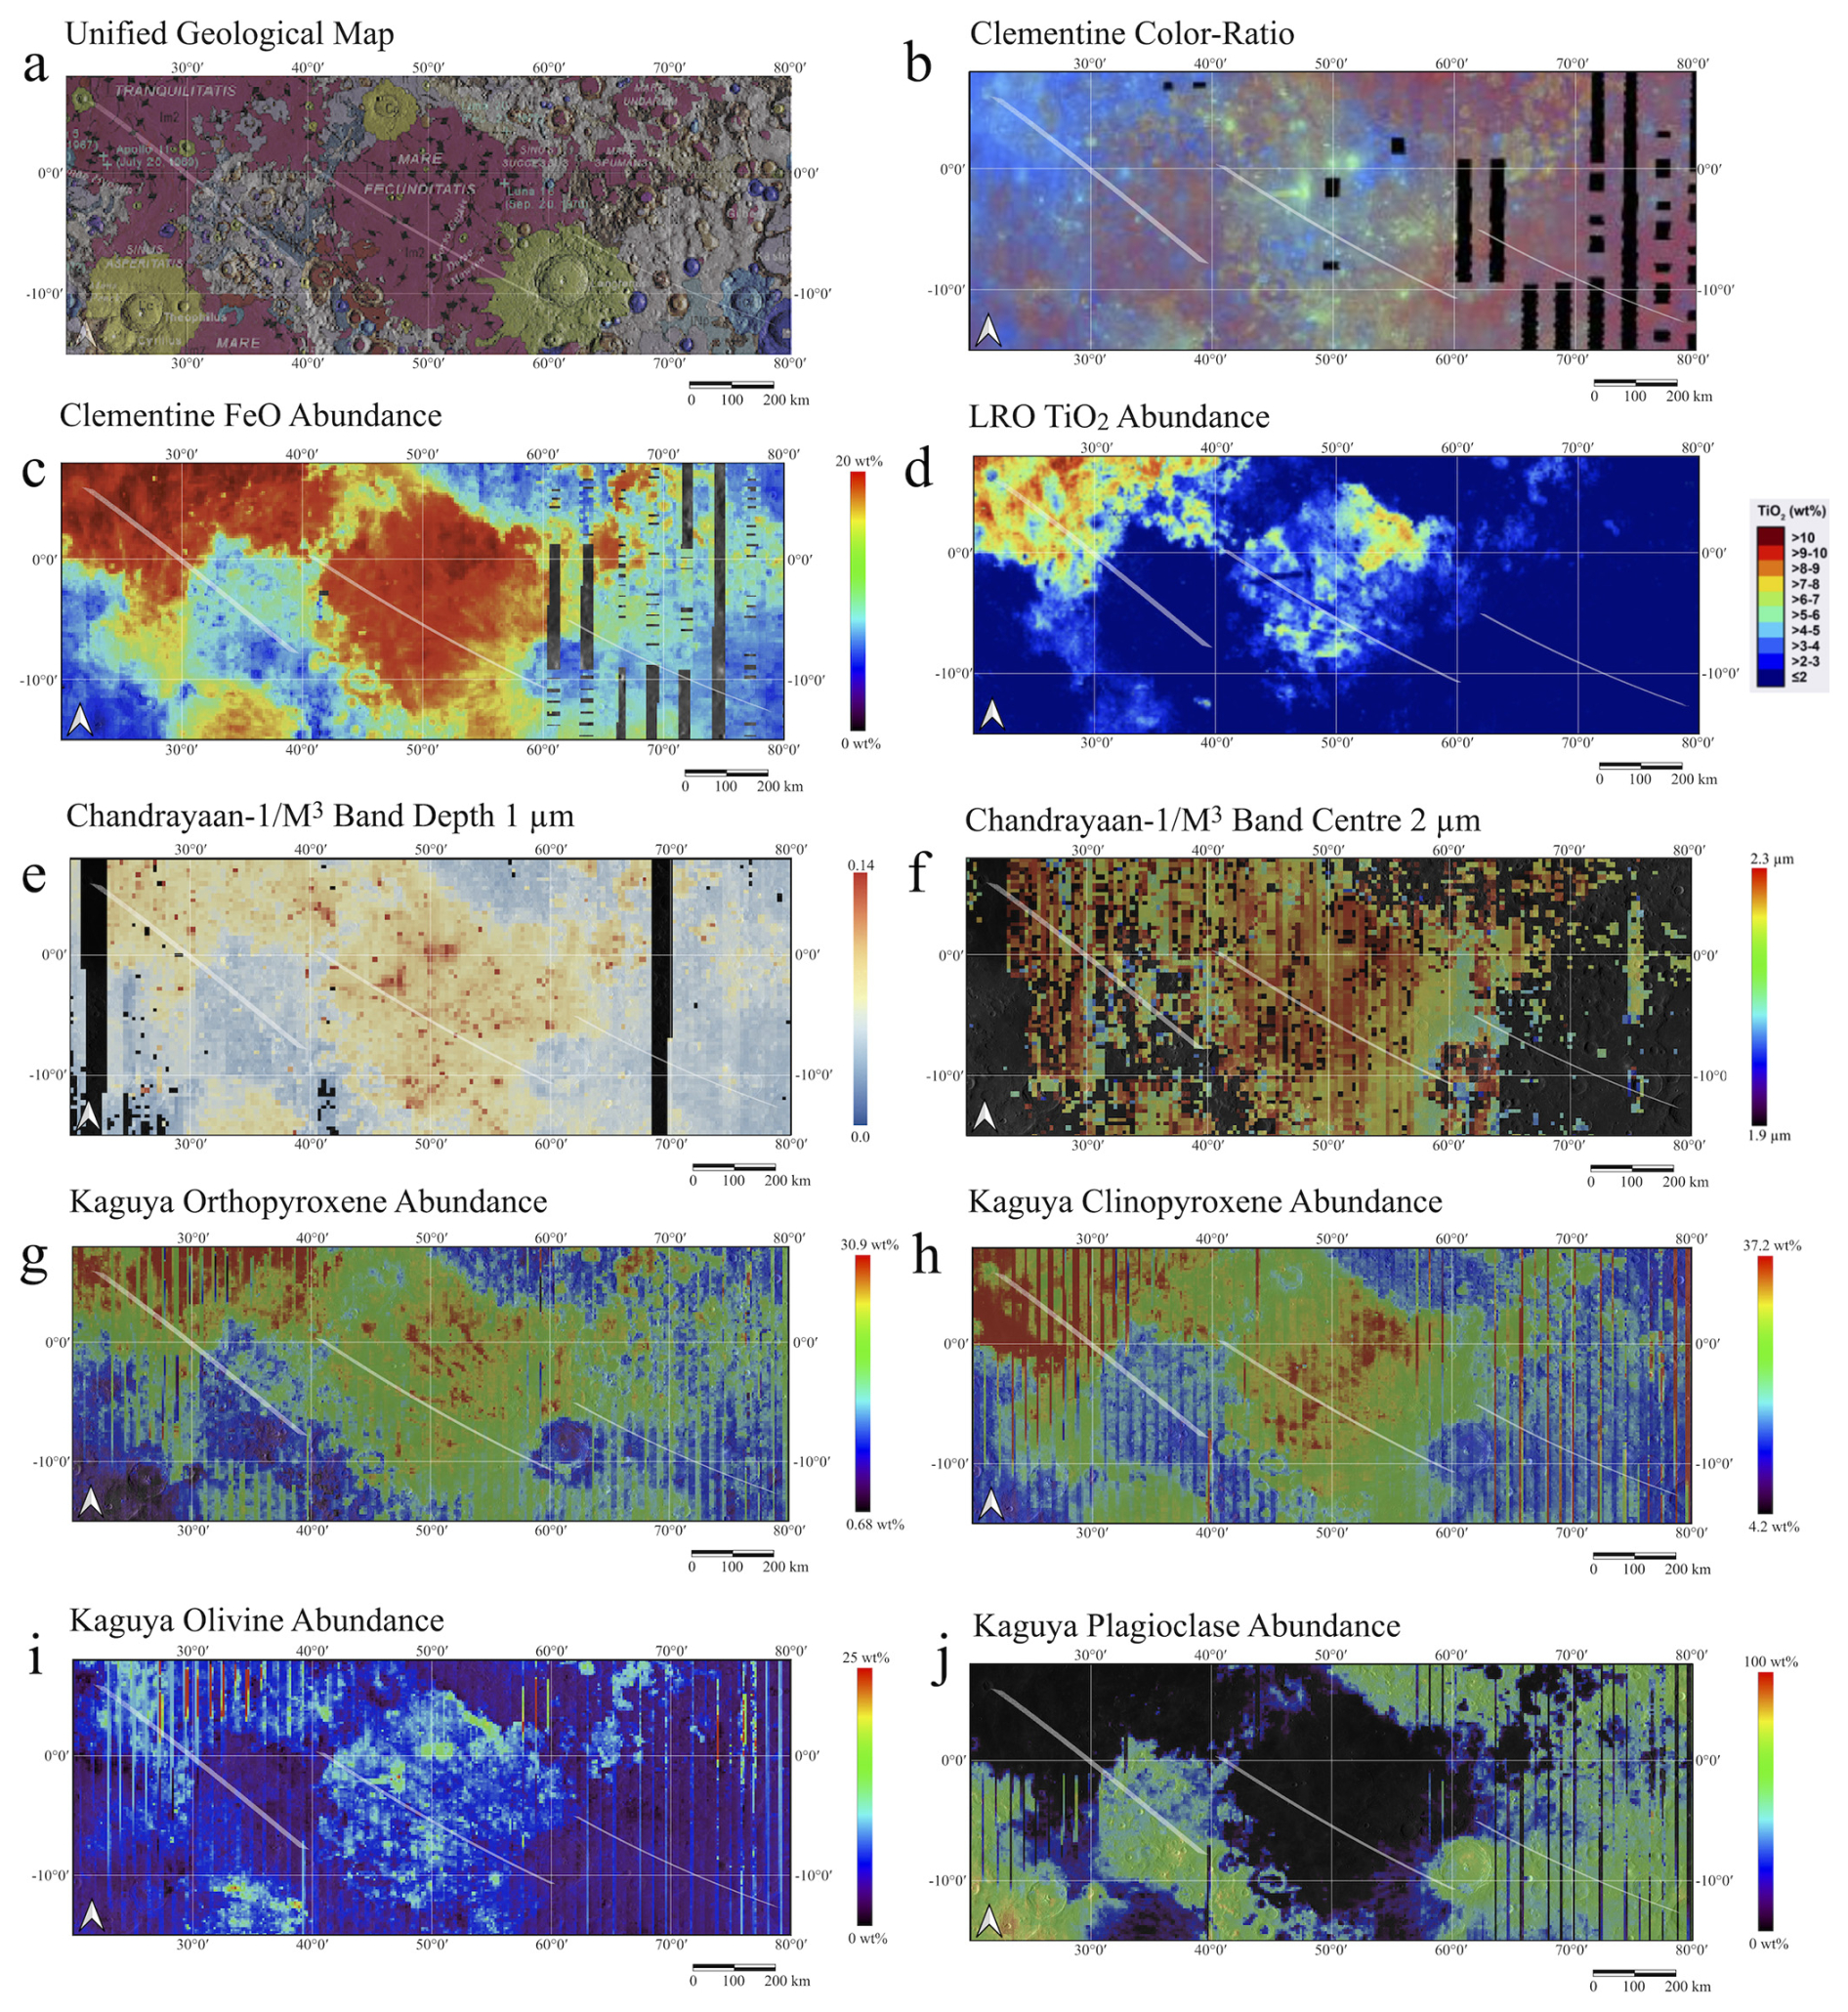
Figure 3Panel (a): USGS unified geological map for the regions observed by MAJIS. Geological unit legend is reported in Fortezzo et al. (2020). Panel (b): Clementine colour composite mosaic for C2, C3, and C4 regions. Red represents the 750/415 nm reflectance ratio, highlighting areas with low titanium or high glass content; green corresponds to the ratio, indicating mafic mineral presence; blue shows the ratio, associated with high titanium regions. Panel (c): FeO distribution map derived from Clementine data. Panel (d): TiO2 distribution map from LRO data. Panels (e) and (f): Distribution of 1 µm band depth and 2 µm band centre derived from M3 spectra. Panels (g)–(j): Abundance maps from Kaguya data showing orthopyroxene, clinopyroxene, olivine, and plagioclase for the MAJIS-covered regions. The maps are overlaid on cylindrical composite LRO NAC ROI mosaics and NAC images acquired at high incidence angles (55–80°), displayed over the WAC global morphologic basemap (100 m per pixel). MAJIS cube footprints are displayed in each panel.
From a geological standpoint, the dominant surface unit across much of the region is classified as Upper Imbrian Mare (Im2), characterised by flat, smooth lava plains emplaced during large-scale basaltic flooding events in the Late Imbrian epoch. These deposits form the primary surface expression of both mare basins and are interpreted as relatively young, low-viscosity basaltic flows that infilled pre-existing impact basins (Hiesinger et al., 2000; Fortezzo et al., 2020). These empirical observations of regional mare units strongly correlate with the established physical models of lunar mare volcanism, where the morphological expression of Mare Tranquillitatis and Mare Fecunditatis can be directly tied to high-flux low-viscosity effusive regimes (Head et al., 2023). By connecting the MAJIS spatial coverage to these specific volcanic dynamics – such as dike propagation, high-volume lava emplacement, and localised pyroclastic venting – the mapped units cease to be isolated features and instead provide critical constraints on the regional thermal history and volatile-driven eruption mechanisms that sustained lunar magmatism during the Moon's peak evolution. In addition to this widespread mare unit, several highland-associated geological formations are exposed, particularly within intermare regions and along mare basin margins (Fig. 3a). These include Imbrian Terra (It), comprising low-relief, moderately smooth surfaces with moderate to high albedo and relatively low crater densities, likely representing mixtures of local erosional debris and ejecta from nearby impact basins; Nectarian Terra (Nt), characterised by rugged topography and complex crater superposition relationships, composed largely of impact-generated megaregolith and representing some of the oldest exposed surfaces on the Moon; and undivided Imbrian basin materials (Ib), expressed as gently rolling to hilly terrains with subdued crater morphologies, plausibly associated with outer ring structures and ejecta deposits of large multi-ring impact basins. Additional minor units, including localised ejecta blankets and crater-related deposits, are scattered throughout the study area. Chronologically, the Imbrian units are dated to approximately 3.85–3.2 Ga, whereas the older Nectarian terrains likely formed between ∼ 3.92 and 3.85 Ga (Hawke et al., 2004), attesting to a complex stratigraphic history shaped by the interplay of impact cratering and volcanic resurfacing.
Topographic information derived from the Lunar Orbiter Laser Altimeter (LOLA) onboard LRO (Smith et al., 2010a, b), together with Digital Terrain Models generated from LROC Wide Angle Camera (WAC) data (Scholten et al., 2012), provides essential context for interpreting these geological units. The surfaces of Mare Tranquillitatis and Mare Fecunditatis are generally low-lying, with elevations ranging from approximately −2.6 to −1.0 km relative to the lunar reference ellipsoid, consistent with deeply excavated impact basins subsequently infilled by dense, mafic-rich basaltic lavas. In contrast, the surrounding highlands commonly exceed +1.5 km in elevation, with some ridges and upland areas rising above +2 km. These elevation differences, locally exceeding 4 km, sharply delineate the structural boundaries of the mare basins and underscore the vertical extent of basin excavation followed by volcanic infill. Transitions between mare and highland terrains are marked by steep topographic gradients and morphologically complex surfaces, reflecting the combined effects of impact excavation, tectonic deformation, and volcanic emplacement.
From a compositional perspective, the region exhibits pronounced heterogeneity, as revealed by multispectral and hyperspectral observations acquired by multiple lunar missions (e.g., McEwen et al., 1994; Lucey et al., 1995; Boardman et al., 2011; Moriarty and Pieters, 2016; Lemelin et al., 2019). Clementine UVVIS colour-ratio composites highlight key spectral trends, notably the presence of high-titanium basalts, mapped as dark blue tones, particularly within Mare Tranquillitatis and covering a substantial fraction of the MAJIS C4 cube (Fig. 3b). These Ti-rich units are consistent with volcanic flows derived from Fe- and Ti-enriched magmatic sources (Fig. 3c and d). In contrast, mature, glass-rich highland soils in the southeastern portion of C4 display enhanced spectral reddening and subdued absorption features, indicative of extensive space weathering and high agglutinate abundance (Pieters et al., 2000; Noble and Pieters, 2003). However, it should be noted that the spectral effects of lunar space weathering are generally expected to approach saturation on timescales of the order of ∼ 1 Gyr. Consequently, variations in spectral maturity observed across the study area should not necessarily be interpreted as directly proportional to absolute surface age beyond this timescale, but rather as indicators of relative exposure conditions, regolith evolution, and the degree of recent surface refreshing processes (Lucey et al., 2000b).
Cube C3 primarily encompasses Mare Fecunditatis (Fig. 1), which reveals greater compositional diversity relative to Mare Tranquillitatis, with generally lower TiO2 contents suggesting more evolved basaltic compositions (Fig. 3d) (Sato et al., 2017). The higher density of fresh impact craters in this region excavates less-weathered subsurface materials, thereby enhancing spectral heterogeneity and locally exposing mafic mineral assemblages (Fig. 3e–j).
These interpretations are strongly supported by elemental abundance maps derived from the CLASS X-ray spectrometer onboard Chandrayaan-2 (Narendranath et al., 2024), which indicate elevated Fe and Mg abundances across both mare regions, consistent with the dominance of mafic silicates such as pyroxene and olivine, and a corresponding depletion in Al relative to feldspathic highlands. High-resolution mineralogical maps obtained from the Kaguya/SELENE Multiband Imager further corroborate these trends, revealing widespread clinopyroxene and subordinate orthopyroxene associated with basaltic lava flows, together with low plagioclase abundances, particularly in Mare Tranquillitatis and Mare Fecunditatis, consistent with a mafic-rich, feldspar-poor composition (Ohtake et al., 2009; Figs. 3g–j).
Additional mineralogical constraints are provided by the Moon Mineralogy Mapper (M3), whose spectral parameters indicate that 2 µm absorption band centres in both mare regions fall within the expected range for Ca- and Fe-rich clinopyroxenes, confirming the mafic nature of these basalts, while the spatial distribution of 1 µm band depths highlights enhanced pyroxene abundances within the maria and minimal absorption in the surrounding highlands, where plagioclase-dominated assemblages prevail (Fig. 3e and f). Taken together, these multi-mission datasets – encompassing imaging spectroscopy (MAJIS, M3, Kaguya MI), multispectral imaging (Clementine), elemental mapping (Chandrayaan-2/CLASS), and topographic measurements (LOLA, LROC-WAC) – provide a coherent and internally consistent framework for interpreting the geological, mineralogical, and geochemical variability of the Mare Tranquillitatis–Mare Fecunditatis region. The convergence of spectral, elemental, and morphological evidence underscores the fundamental roles of volcanic emplacement, impact gardening, and space weathering in shaping the present-day lunar surface and highlights the value of integrated, multi-instrument analyses for reconstructing the Moon's geological evolution.
In this section, we describe the spectral indices and ratioing technique applied to study the MAJIS cubes C2, C3, and C4.
4.1 Reflectance at 0.55 µm
The radiance factor (I/F) at 0.55 µm was selected as a primary indicator of surface albedo, as it effectively highlights major morphological features and facilitates discrimination among different terrain types. Spatial variations in reflectance enable identification of distinct geological units, including heavily cratered highlands, smooth basaltic plains, impact basins, and localised bright or dark features associated with fresh materials or compositional heterogeneities. The wavelength 0.55 µm is particularly suitable for this purpose as it lies within the visible spectral range and is generally free of strong absorption features, providing a robust reference for surface reflectance (Kieffer and Stone, 2005). As such, it serves as a baseline sensitive to both compositional effects – such as the abundance of opaque phases – and the degree of space weathering, which progressively darkens and reddens the lunar surface over time (Clark, 1983; Cloutis et al., 1986). Specifically, the optical darkening is primarily driven by the progressive accumulation of submicroscopic (nanophase and microphase) metallic iron (npFe0) within agglutinates and rim structures on regolith grains, which scatters and absorbs incident light across visible wavelengths (e.g., Hapke, 2001; Noble et al., 2001; Pieters and Noble, 2016). Higher I/F values are expected in bright, feldspathic highlands, lower values in iron-rich mare basalts, and locally enhanced values over fresh crater-excavated materials.
Figure 1 presents the 0.55 µm I/F maps for cubes C2, C3, and C4, all displaying measurable spatial variability. Within cube C4, the portion corresponding to Mare Tranquillitatis appears relatively homogeneous and spectrally dark, consistent with the typical low-albedo character of basaltic mare surfaces, whereas adjacent highland terrains exhibit higher I/F values as expected, with local deviations partly controlled by topographic effects. The region of Mare Fecunditatis sampled by cube C3 is more heterogeneous, showing brighter areas associated with ejecta from impact craters such as Messier and Messier A, as well as other localised ejecta deposits.
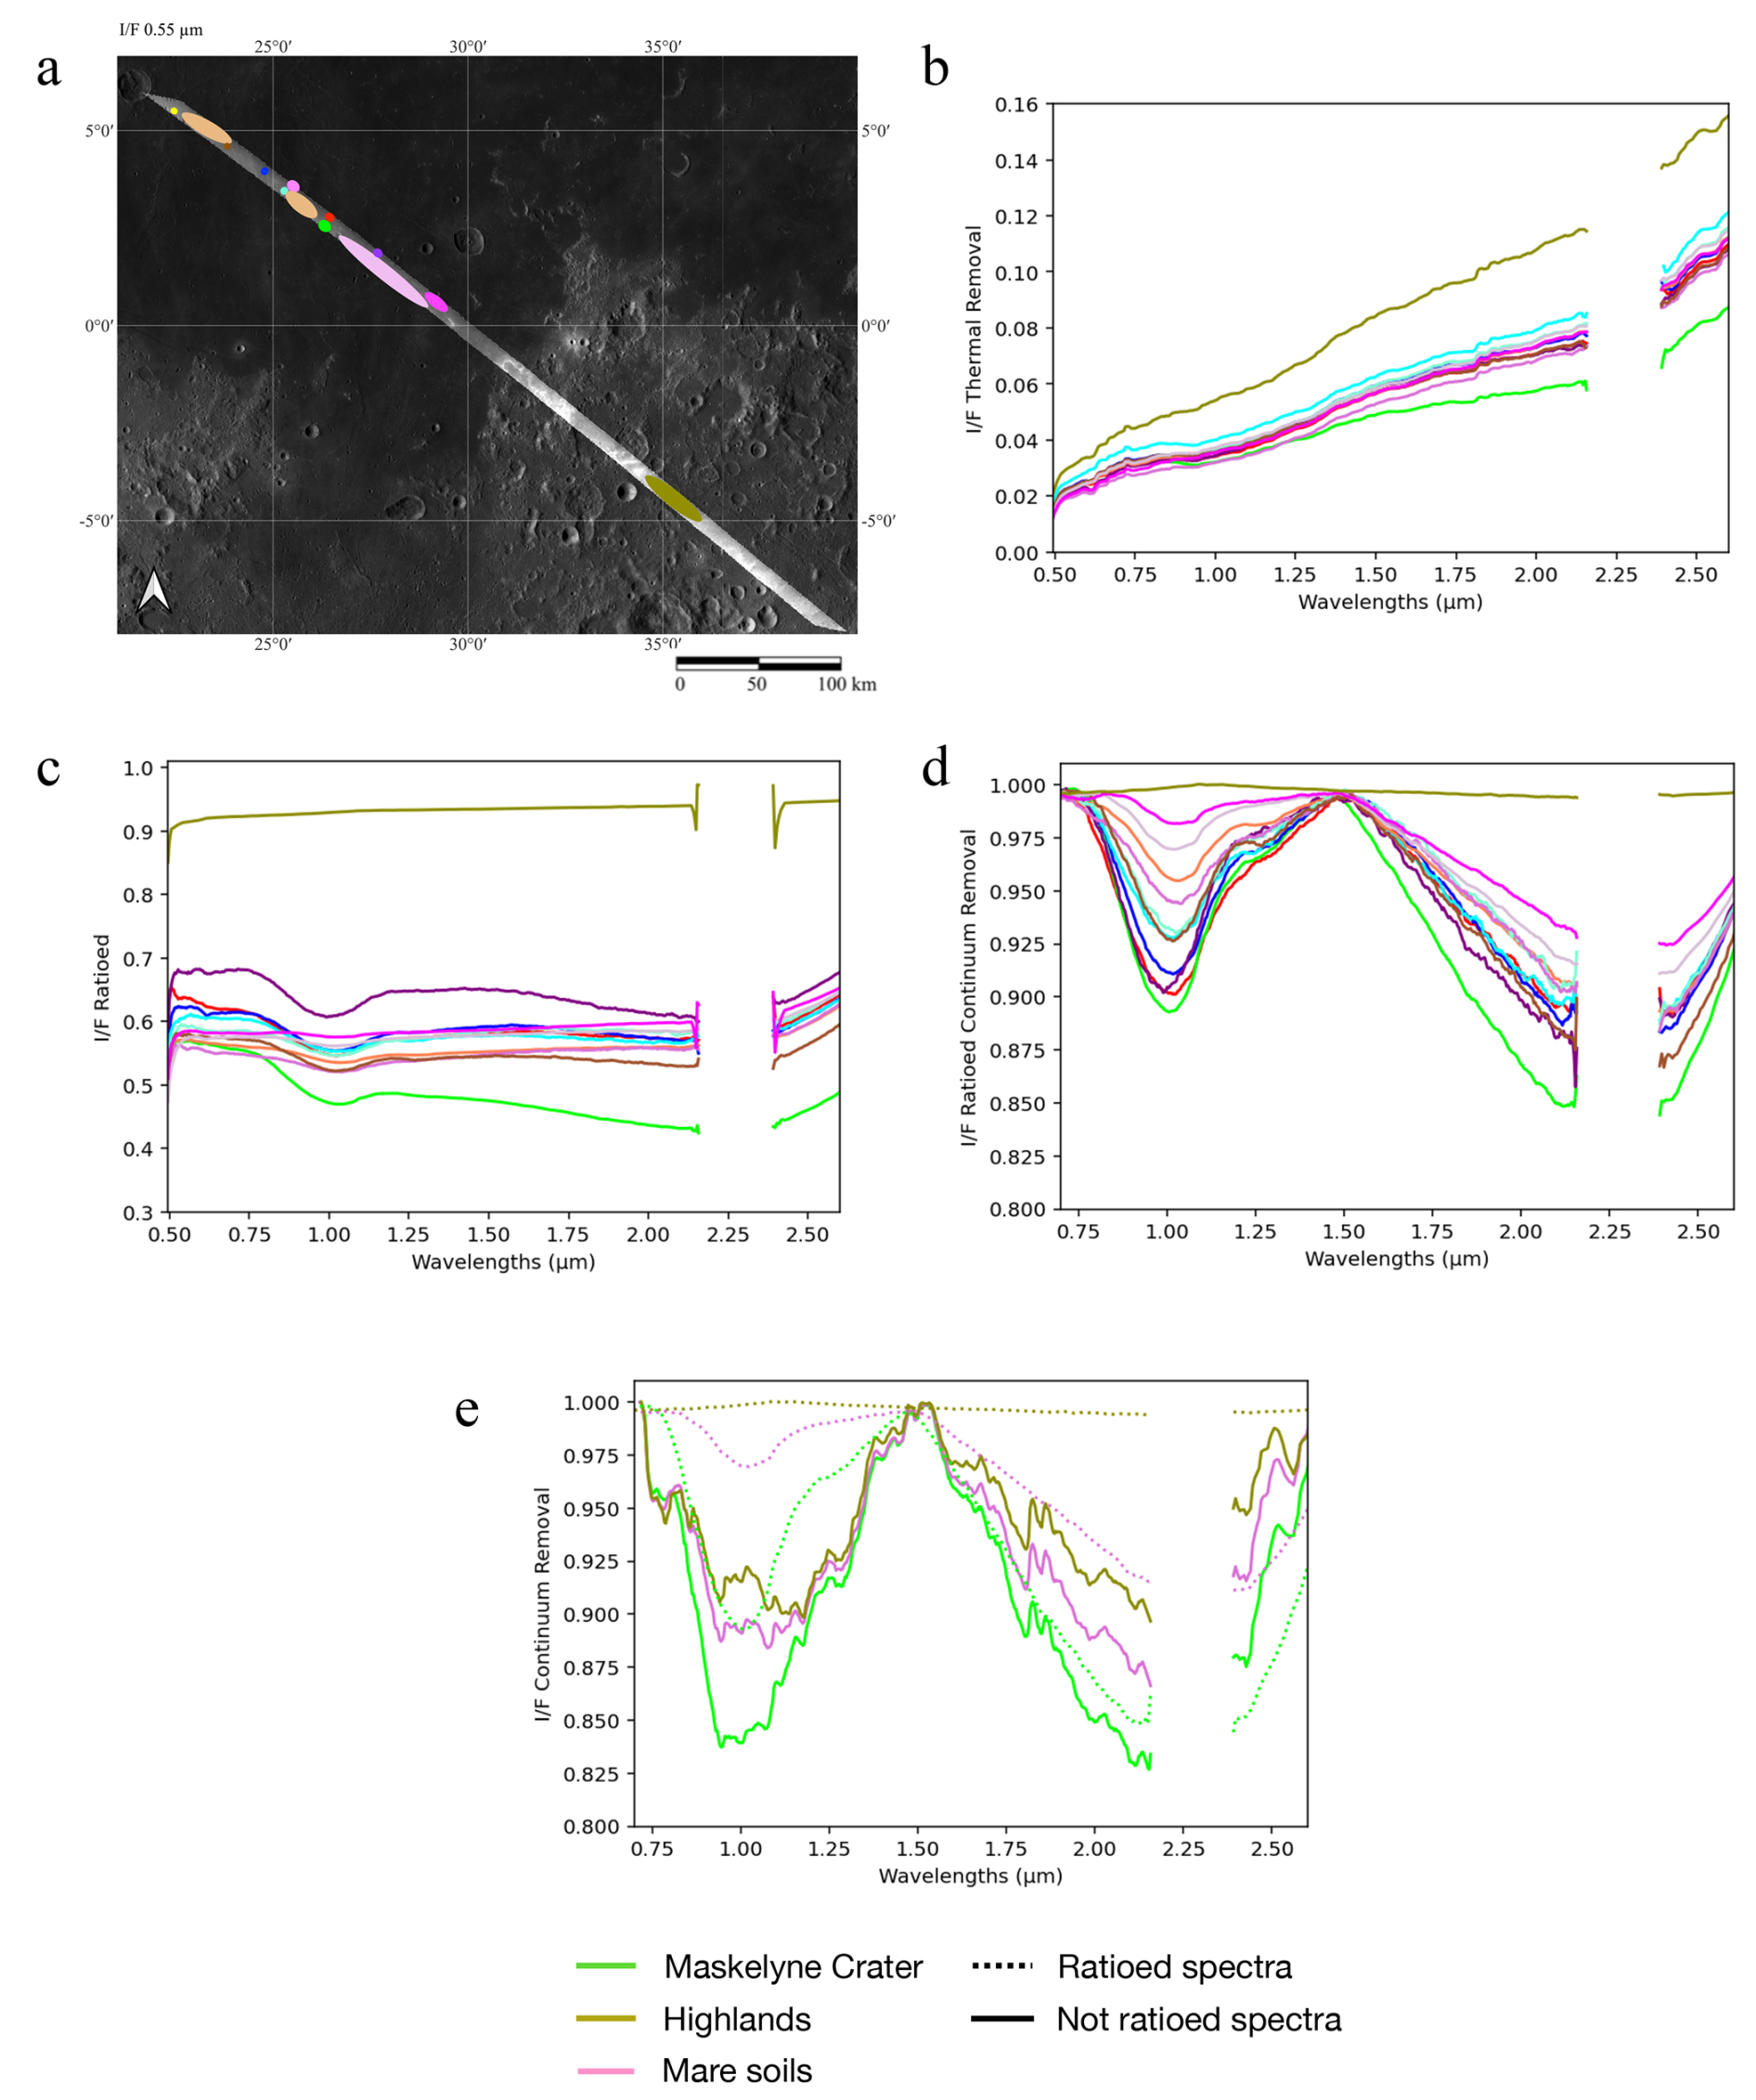
Figure 4Application of the ratioing process. Panel (a): Region of interest selected for C4. Panel (b): Average spectra extracted from the coloured area in panel (a). Panel (c): Same spectra after the ratioing process (STEP 2, see Appendix B). Panel (d): Ratioed spectra of the regions of interest after continuum removal. Panel (e): Comparison of C4 continuum-removed spectra, both ratioed (dashed lines) and non-ratioed (solid lines). Green corresponds to fresh crater ejecta within Mare Tranquillitatis. Pink represents mare soil, while brown refers to a highland region. Ratioed spectra show a clear improvement compared with non-ratioed spectra.
Additionally, the southern and northern extremities of C3, including the rim of Langrenus crater to the south and highland terrains to the north, display higher I/F values relative to the central mare region. Cube C2, covering highland terrains east of Mare Fecunditatis, exhibits I/F variations largely correlated with local topography. Portions corresponding to La Pérouse and Ansgarius craters are further affected by less favourable illumination conditions, contributing to observed reflectance variability.
4.2 Ratioed spectra
To enhance the visibility of absorption features in the spectral data, a ratioing technique was applied (Appendix B, Fig. 4). This approach is widely used in the analysis of imaging spectrometer data from Mars, such as OMEGA/MEX and CRISM/MRO (e.g., Poulet et al., 2005; Mustard et al., 2008), and has also been successfully employed for M3 data to better identify spectral features associated with feldspathic crust, olivine, and glass (Mustard et al., 2011). The 1.3 µm artifact exhibits a highly specific spectral shape. In contrast, the absorption band associated with feldspar-rich surfaces or glassy materials is significantly broader; therefore, the correction method applied here does not compromise the detection of these mineral phases. A similar approach was successfully adopted by Mustard et al. (2011).
The main advantage of spectral ratioing lies in its ability to suppress multiplicative instrumental artefacts and residual calibration effects common across all spectra within the dataset, such as vertical stripes. However, a limitation is that spectral features shared between the numerator and denominator spectra are also diminished or cancelled. Furthermore, the continuum slopes in the resulting ratioed spectra are relative to those present in the reference spectrum used as the denominator. Consequently, the choice of reference spectrum is critical, as it significantly influences the final spectral outcome.
For C4, ratioed cubes were generated using a two-step procedure (see Appendix B), focusing on the spectral range below the VIS–NIR and IR channel bridging near 2.22 µm (see Fig. 4). The ratioing was applied to the radiance data, following a first-order photometric correction that only divides by the cosine of the solar incidence angle.
4.3 Band centre and Band Depth
4.3.1 Spectral diagnostics of lunar mineralogy
The position and depth of absorption bands are fundamental diagnostic parameters for constraining the mineralogical composition of planetary surfaces. On the Moon, reflectance spectra of most terrains – including mare basalts and freshly excavated crater materials – are typically characterised by two prominent absorption features centred near 1 and 2 µm. These bands are primarily attributed to electronic transitions of Fe2+, Ca2+, and Mg2+ ions in the M1 and M2 crystallographic sites of mafic silicates, notably pyroxenes and olivines, as well as in impact-generated glassy materials (Burns, 1993). Additional Fe2+-bearing phases may contribute to absorptions in these spectral regions; for example, spinels such as chromite can introduce features near 1–2 µm (Cloutis et al., 2004), while feldspars, particularly plagioclase, may subtly influence band position, shape, and intensity under specific compositional or textural conditions (Donaldson Hanna et al., 2014). Band position is sensitive to mineral chemistry, whereas band depth provides qualitative information on the relative abundance of absorbing phases, modulated by grain size, surface maturity, and the presence of opaque compounds, which can attenuate or enhance absorption features (Adams, 1974; Clark, 1999; Serventi et al., 2013).
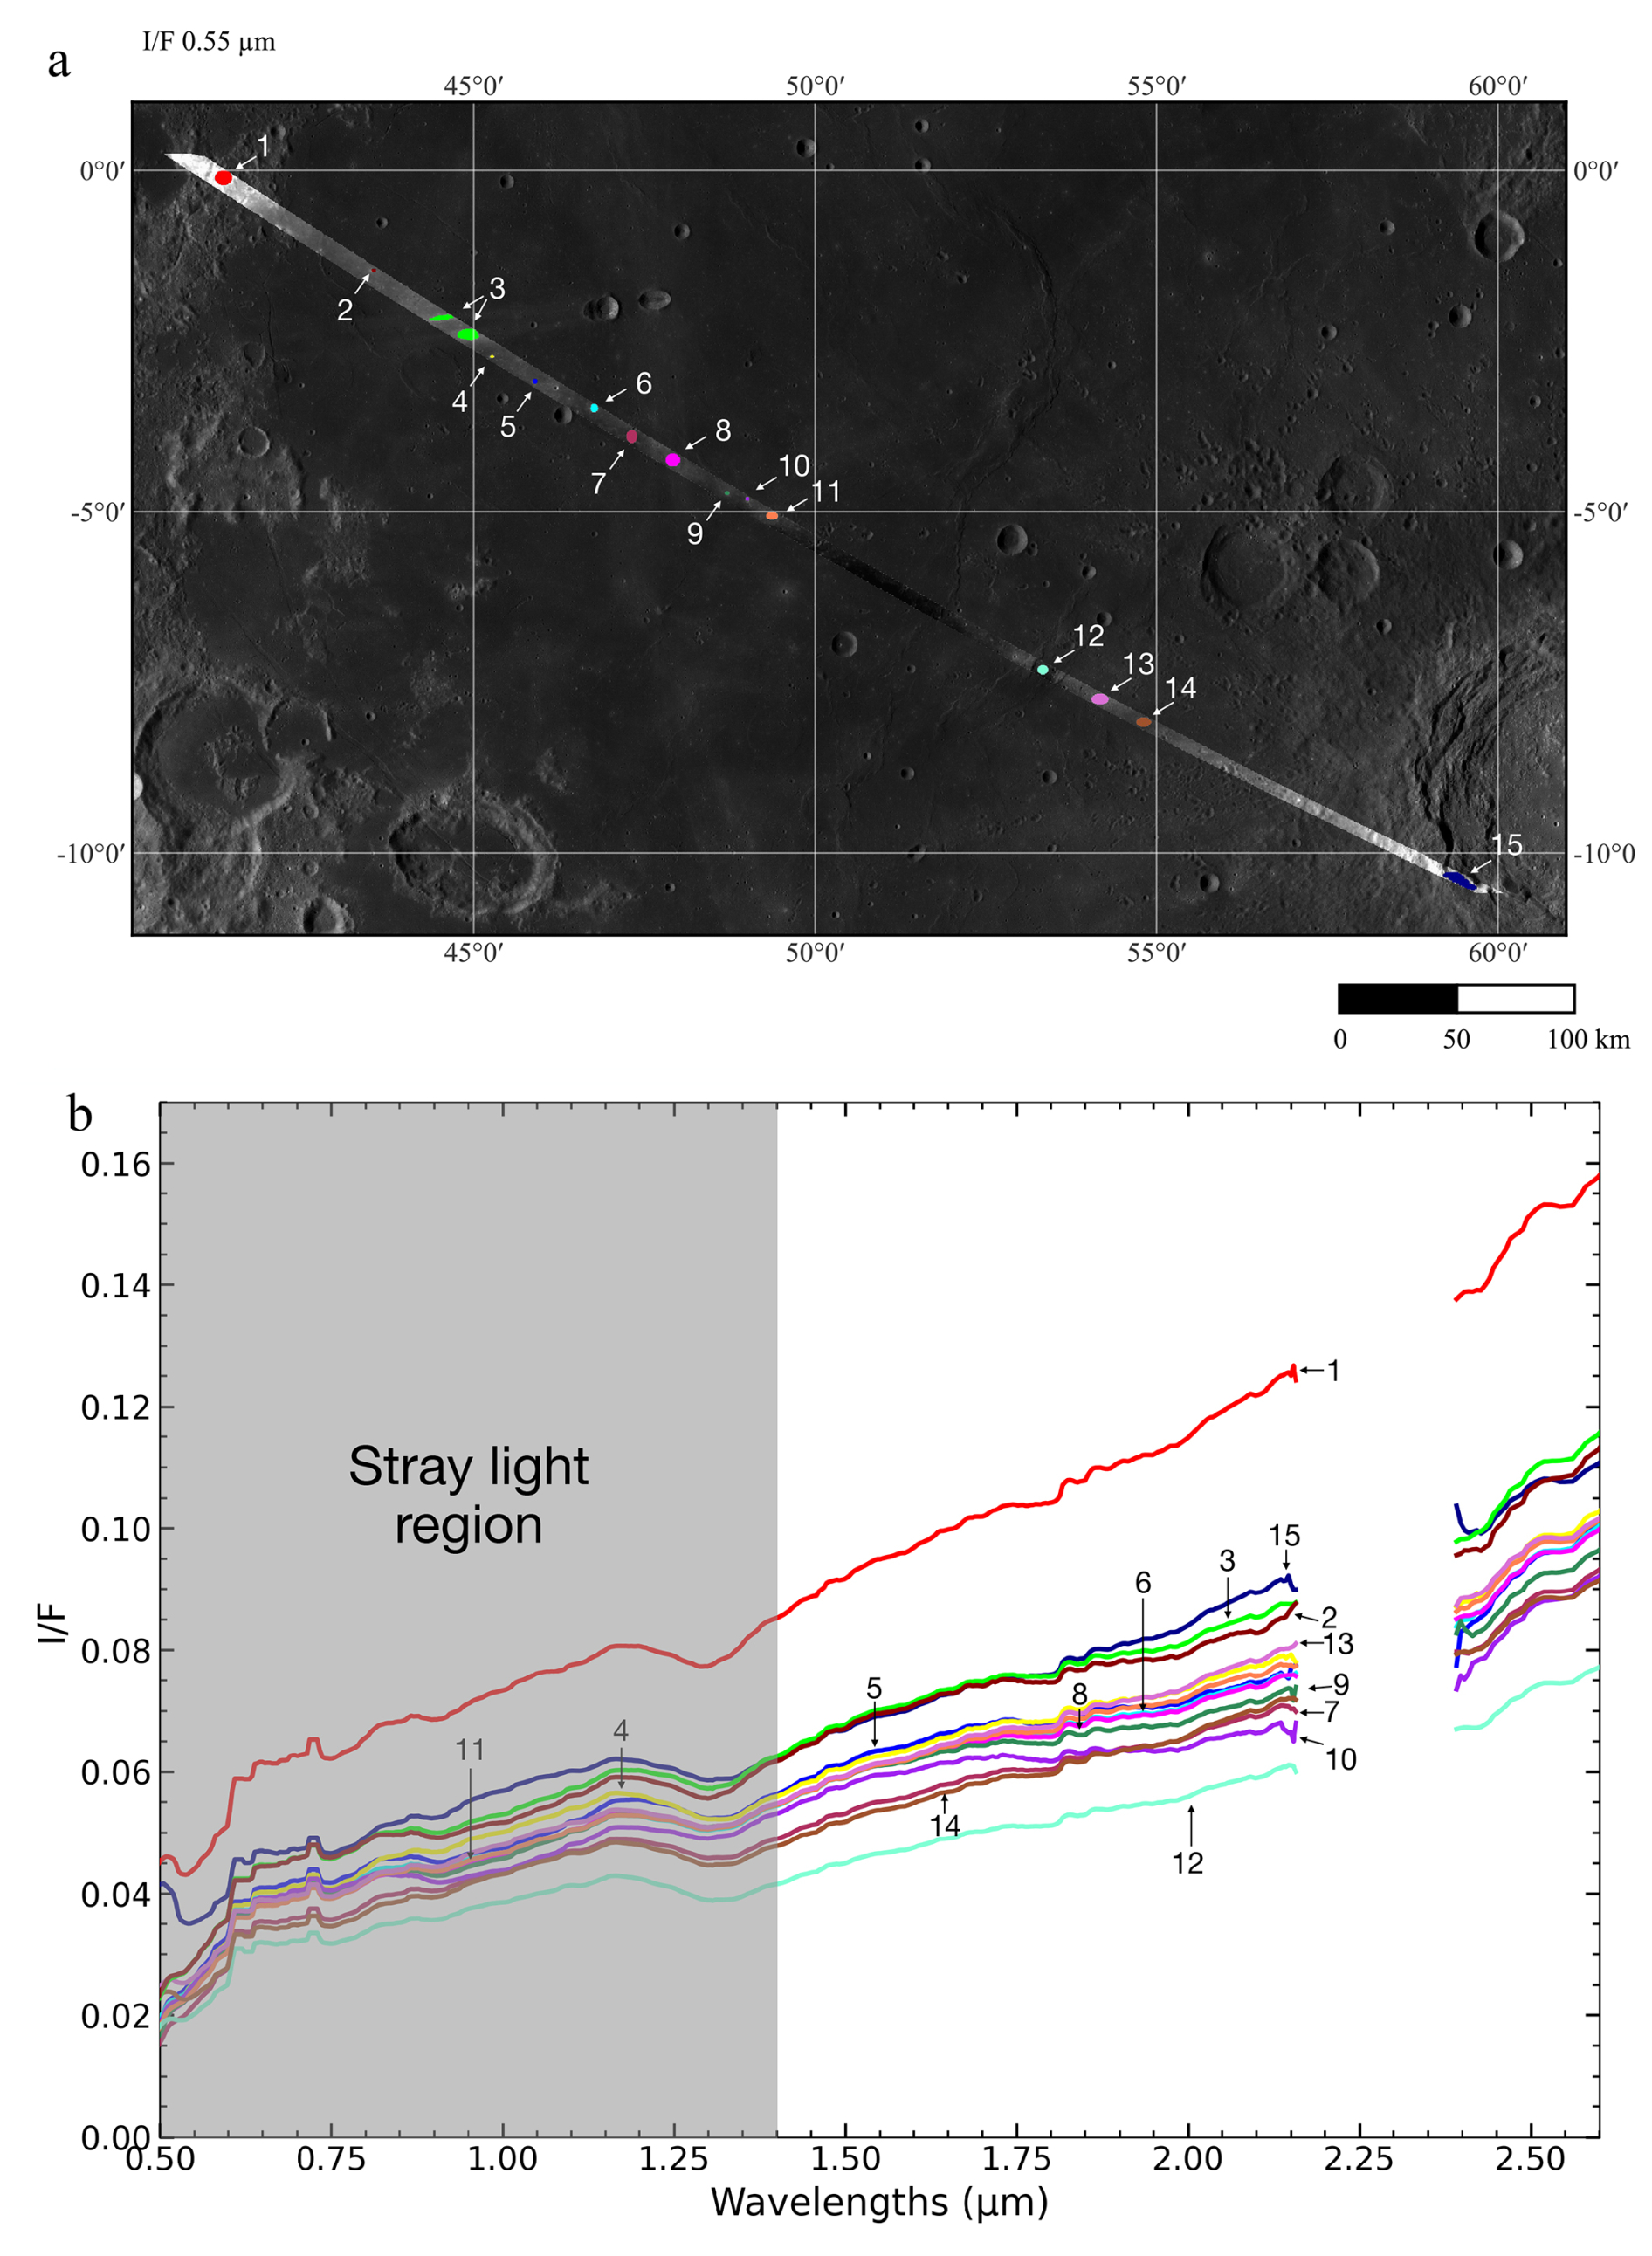
Figure 5Average spectra extracted from selected regions of interest within cube C3, panel (a). Panel (b) shows the average spectra from the coloured area in panel (a). The gray box indicates the spectral region affected by stray light.
4.3.2 Impact of stray light and selected spectral parameter retrieval
Average spectra extracted from selected regions of interest within cube C3 (Fig. 5) indicate that stray light strongly contaminates the spectral range up to approximately 1.3 µm, producing a feature near this wavelength that is consistently observed across different terrains and is therefore interpreted as an instrumental artefact. This contamination hinders a reliable characterisation of the 1 µm absorption band in C3. In contrast, spectra from cube C4 (Fig. 4), shown both before (Fig. 4b) and after application of the ratioing procedure described in Sect. 4.2 and Appendix B (Fig. 4c–e), demonstrate that ratioing substantially improves the definition of the 1 µm band. This improvement allows for a more robust identification of spectral features associated with lunar pyroxenes and is evident in both I/F and continuum-removed spectra.
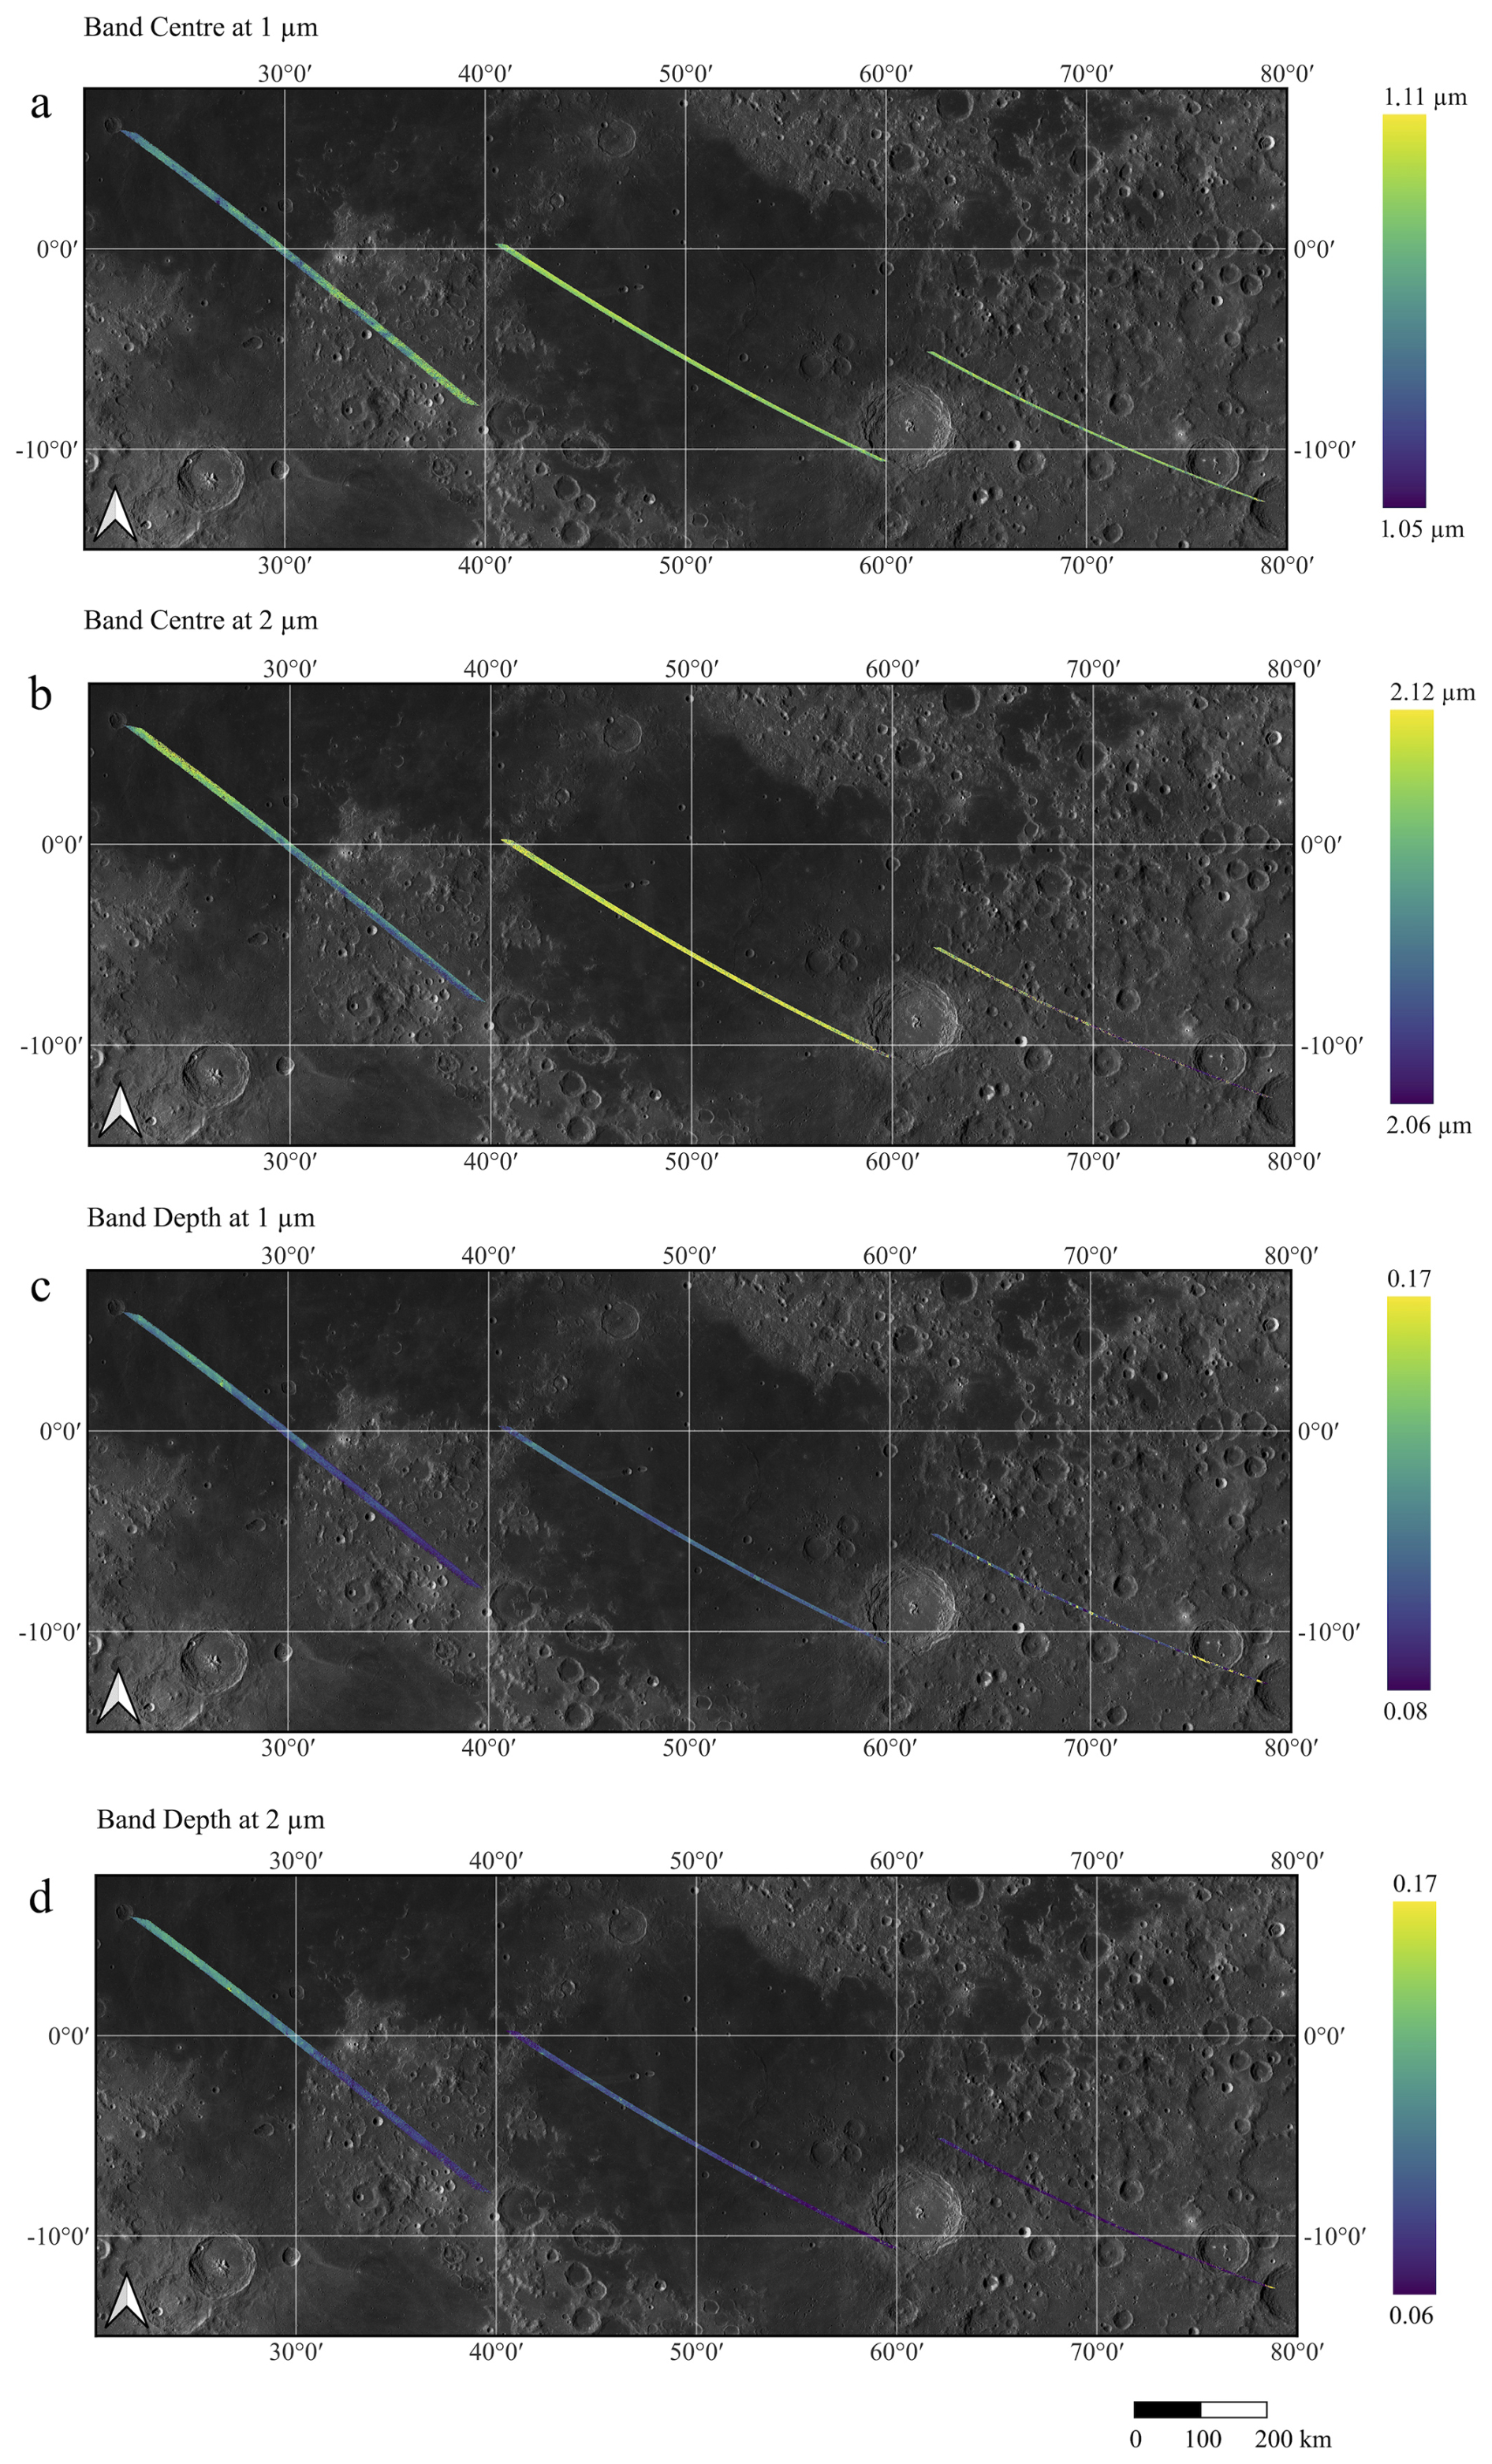
Figure 6Spectral parameters calculated on non-ratioed spectra. Panel (a): Distribution of band centres at 1 µm. Panel (b): same, at 2 µm. Panel (c): band depths at 1 µm. Panel (d): same, at 2 µm. The 1 µm absorption band appears relatively noisy, particularly in the highlands region, where residual stray light is evident (see Fig. 4e). This introduces an unexpected trend in the calculation of the 1 µm band centre (panel a), where band centre values in the highlands are higher relative to the mare region. This effect is partially mitigated after the ratioing procedure (Fig. 7a).
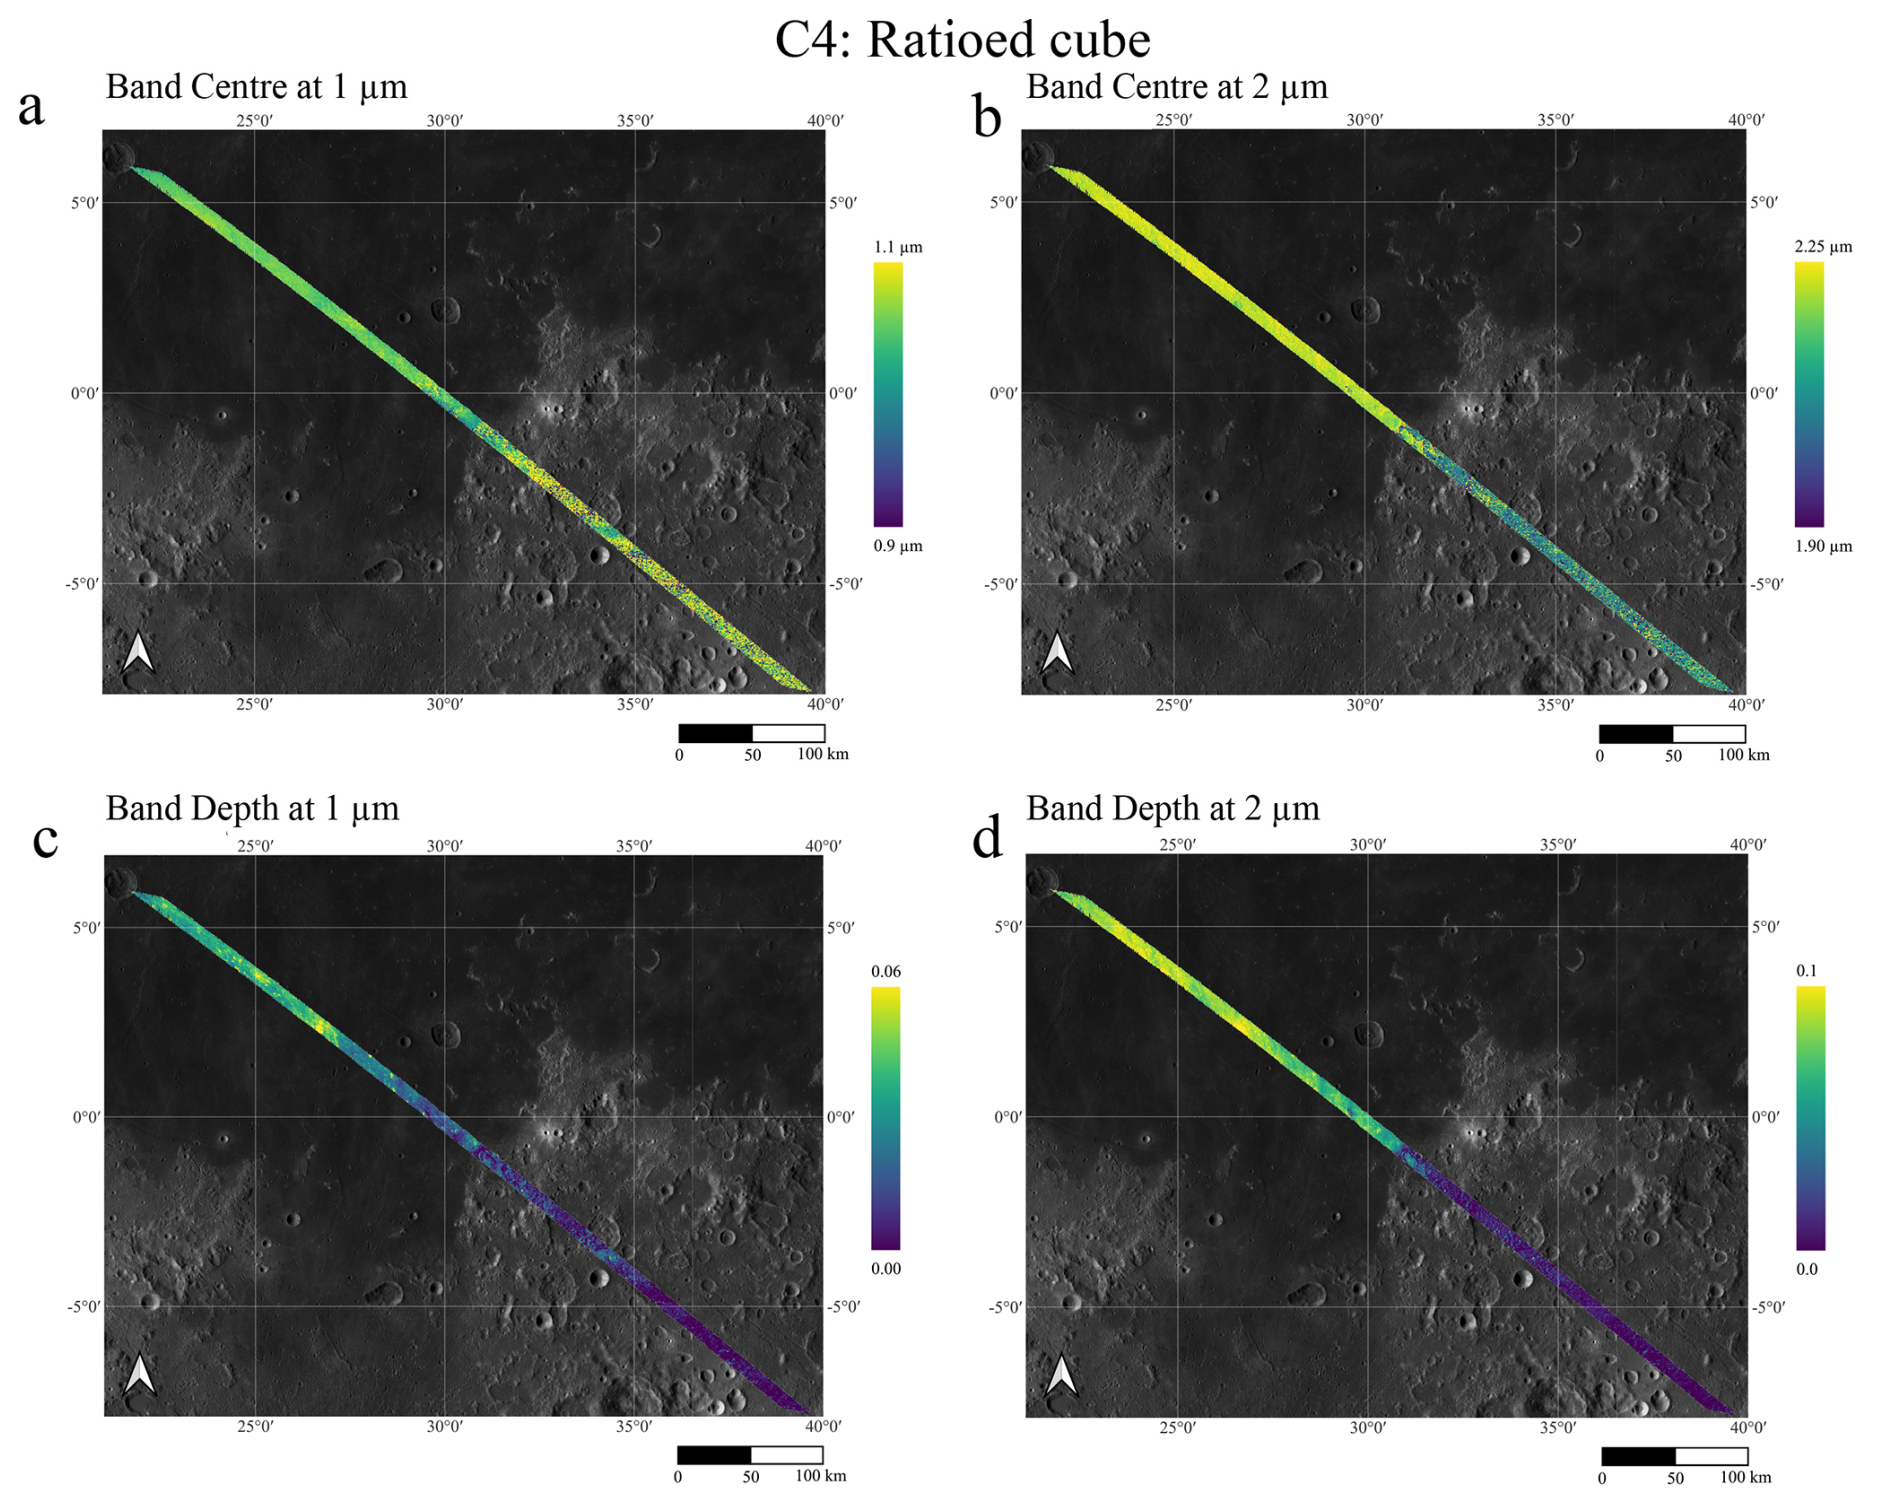
Figure 7Analysis of the C4 ratioed cube. Panel (a): maps of the band centres at 1 µm. Panel (b): same at 2 µm. Panel (c): band depths at 1 µm. Panel (d): same at 2 µm. The calculation of the 1 µm band centre in the mare regions is improved relative to the non-ratioed cube; however, in the highlands the derived values still deviate from the expected trend. The higher 1 µm band centre values observed in the highlands relative to the mare regions may result from a combination of residual stray light and suppression of the 1 µm absorption band after ratioing. This effect is evident in Fig. 4e and is further supported by the band depth values, which do not exceed 0.02 in the highlands area.
Representative spectra extracted from mare, highland, and fresh crater terrains within the corrected C4 cube (Fig. 4e) show that, although the 1 µm absorption band is detectable in all cases, residual noise persists, particularly near the band minimum. These residual effects are more pronounced in the highlands, where intrinsic absorption features are weaker, and they introduce uncertainties in the polynomial fitting procedures used to determine band centres. Even minor variations in the fitted band position can result in significant differences in mineralogical interpretation. To mitigate this issue, the ratioed C4 cube was therefore used exclusively for the calculation of band centres. For comparison, the spatial distributions of band centre and band depth derived from the non-ratioed data are shown in Fig. 6, while the same parameters calculated from the ratioed C4 cube are presented in Fig. 7.
The use of the ratioed C4 cube for band centre determination (Fig. 7a and b) effectively suppresses residual stray light and enhances the definition of spectral features in the critical 1 µm region. Nevertheless, in highland terrains the ratioing procedure substantially reduces, and in some cases suppresses, the absorption bands, which does not always permit a reliable determination of the band centre. Moreover, the minimum of the 2 µm band coincides with the spectral gap between the VIS–NIR and IR channels. To address this limitation, the 2 µm band centre was derived by fitting the entire absorption feature rather than only the region surrounding the band minimum (see Appendix C).
Conversely, parameters such as band depth (Fig. 6c and d) and spectral slopes are less sensitive to stray light contamination. Their derived values and spatial distributions are consistent with those reported in previous lunar remote-sensing studies and therefore do not strictly require ratioing.
In cube C3, which spans Mare Fecunditatis, the 2 µm band centre (Fig. 6) is relatively homogeneous, whereas the 1 µm band centre cannot be reliably determined because of stray-light contamination. This behaviour likely reflects the limited mineralogical variability of the mare basalts, as well as the combined influence of residual stray light and photometric effects. In contrast, band depth maps exhibit greater spatial variability, primarily associated with ejecta deposits showing enhanced absorption strengths, consistent with less weathered materials, such as those surrounding the Messier and Messier A craters. Finally, cube C2, which exclusively covers highland terrains and was acquired under less favourable illumination conditions, displays variability that is more strongly controlled by photometric effects and local topography than by intrinsic compositional differences (Fig. 6).
4.4 Spectral Slopes
Spectral slopes are sensitive indicators of regolith maturity, grain-size variations, and compositional differences (Clark, 1999; Noble and Pieters, 2003). Lunar reflectance spectra typically exhibit steep, or “red”, slopes, characterised by increasing reflectance with increasing wavelength. This spectral reddening is primarily driven by space weathering processes, which progressively modify the lunar surface through regolith maturation, comminution of grains, and the formation of submicroscopic and nanophase metallic iron (npFe0) particles that dominate the observed spectral changes (Le Mouélic et al., 2000; Noble and Pieters, 2003; Pieters and Noble, 2016).
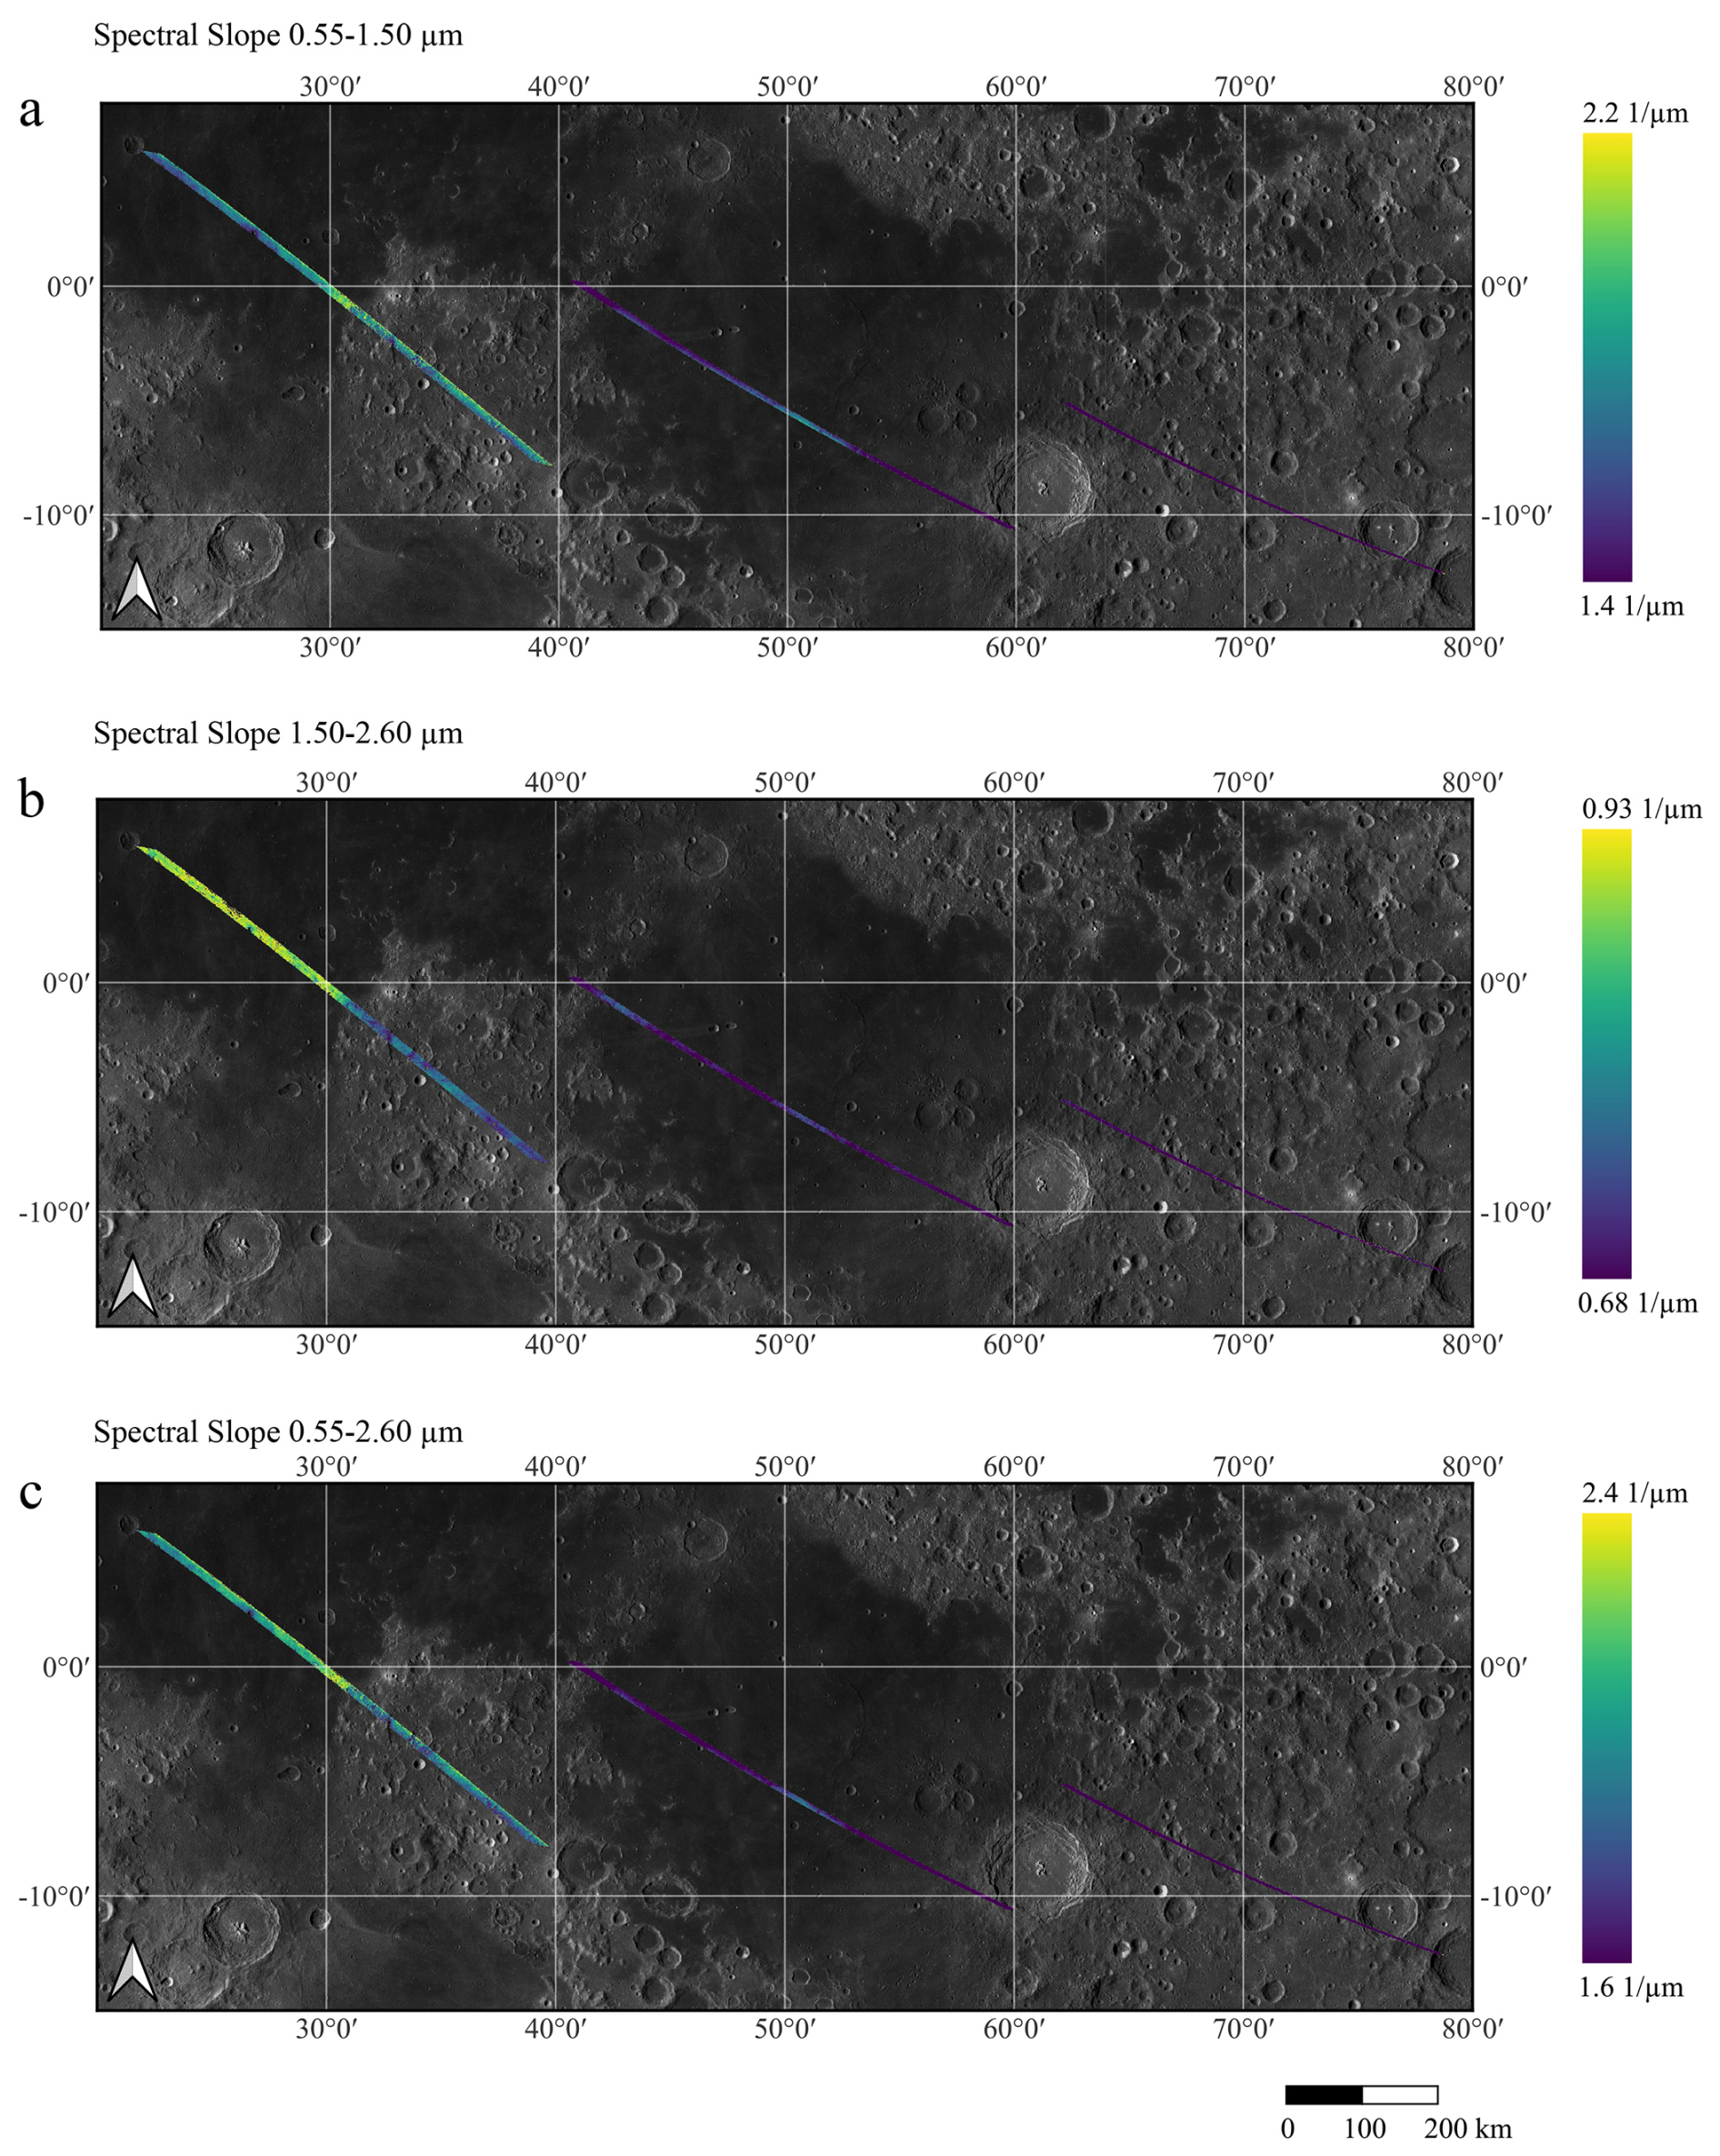
Figure 8Spectral slope distributions for C2, C3, and C4. Panel (a): Spectral slope between 0.55 and 1.50 µm (SI). Panel (b): Spectral slope between 1.50 and 2.60 µm (SII). Panel (c): Spectral slope between 0.55 and 2.60 µm (GS). These parameters were calculated using the non-ratioed data.
In this study, spectral slopes were computed after thermal emission removal, following the definitions of Cuzzi et al. (2009) and Filacchione et al. (2012). Specifically, we calculated the slope between 0.55 and 1.50 µm (SI), the slope between 1.50 and 2.60 µm (SII), each referenced to the 1 and 2 µm absorption bands, respectively, and a global slope (GS) spanning 0.55 to 2.60 µm (Fig. 8).
The SI primarily reflects variations in the visible to near-infrared continuum and is particularly sensitive to composition and space-weathering effects, such as the presence of nanophase metallic iron and glass content, which induce spectral reddening and darkening. Consequently, higher SI values are generally associated with more mature regolith, whereas lower slopes indicate fresher or less weathered materials, such as those exposed by recent impacts (Noble et al., 2007).
The SII slope is influenced both by space-weathering processes and by the relative abundance and composition of mafic minerals. Variations in pyroxene and olivine composition, as well as mineralogical differences, can affect the continuum shape in this wavelength interval (Burns, 1993; Moroz et al., 2000). As a result, SII can capture subtler compositional variations within mare basalts and between mare and highland terrains.
The global slope (GS) integrates the spectral behaviour across the full 0.55–2.60 µm range and therefore represents a combined indicator of regolith maturity, composition, and photometric effects. While GS is less diagnostic of specific mineral phases, it provides a useful first-order metric for comparing terrains and identifying large-scale trends related to space weathering and surface evolution (Lucey, 2006; Pieters and Noble, 2016).
Together, these slope parameters provide a robust framework for disentangling compositional variability from maturity-related effects and for contextualising absorption-band analyses within the broader spectral continuum.
It is worth noting that the global spectral slope (GS) is generally linked with the two spectral slopes SI and SII; consequently, the three parameters should not be regarded as independent. Overall, SI exhibits a trend closely comparable to that of GS. Within cube C4, the fresh Maskelyne G crater, located in Mare Tranquillitatis, stands out as the region with the lowest SI and GS values, consistent with relatively unweathered material. Nonetheless, C4 displays appreciable variability within Mare Tranquillitatis, with less reddened slopes in the western portion compared to areas nearer the highlands. Specifically, the portion of C4 within the mare bordering the highlands near Ruin Basin exhibits high SI and GS values (see Fig. 8a and c). This trend correlates with a lower titanium content compared to the typical high-titanium basalts of Mare Tranquillitatis. This indicates that, in this specific region, the steeper spectral slopes are primarily controlled by compositional variations – specifically, the decrease in titanium-bearing phases (such as ilmenite) which would otherwise reduce the spectral slope (e.g., Lucey et al., 1998). In contrast to the variable mare units, the highland terrains exhibit a highly homogeneous spectral signature. This is particularly evident in the longer-wavelength slope (SII), where the highlands display uniformly low values, highlighting a stark and sharp transition at the mare–highland boundary. No significant localised variations or anomalies associated with small, fresh impact craters are observed within the highland portion of the track, pointing to a spectrally mature and uniform regolith cover.
Cube C3, largely confined to Mare Fecunditatis, also exhibits noticeable variability, with higher spectral slope values concentrated in its central part. For this cube, the three slope parameters (SI, SII, and GS) display broadly similar spatial trends, despite localised differences. The most pronounced discrepancies are observed between SII and the other two slopes in cube C4, where mare regions systematically show higher SII values than the adjacent highlands, revealing a clear mare–highland dichotomy in the longer-wavelength spectral slope. In contrast, cube C2 does not exhibit significant or systematic trends in spectral slope parameters and appears relatively homogeneous, likely owing to the less favourable illumination conditions and data quality limitations discussed previously.
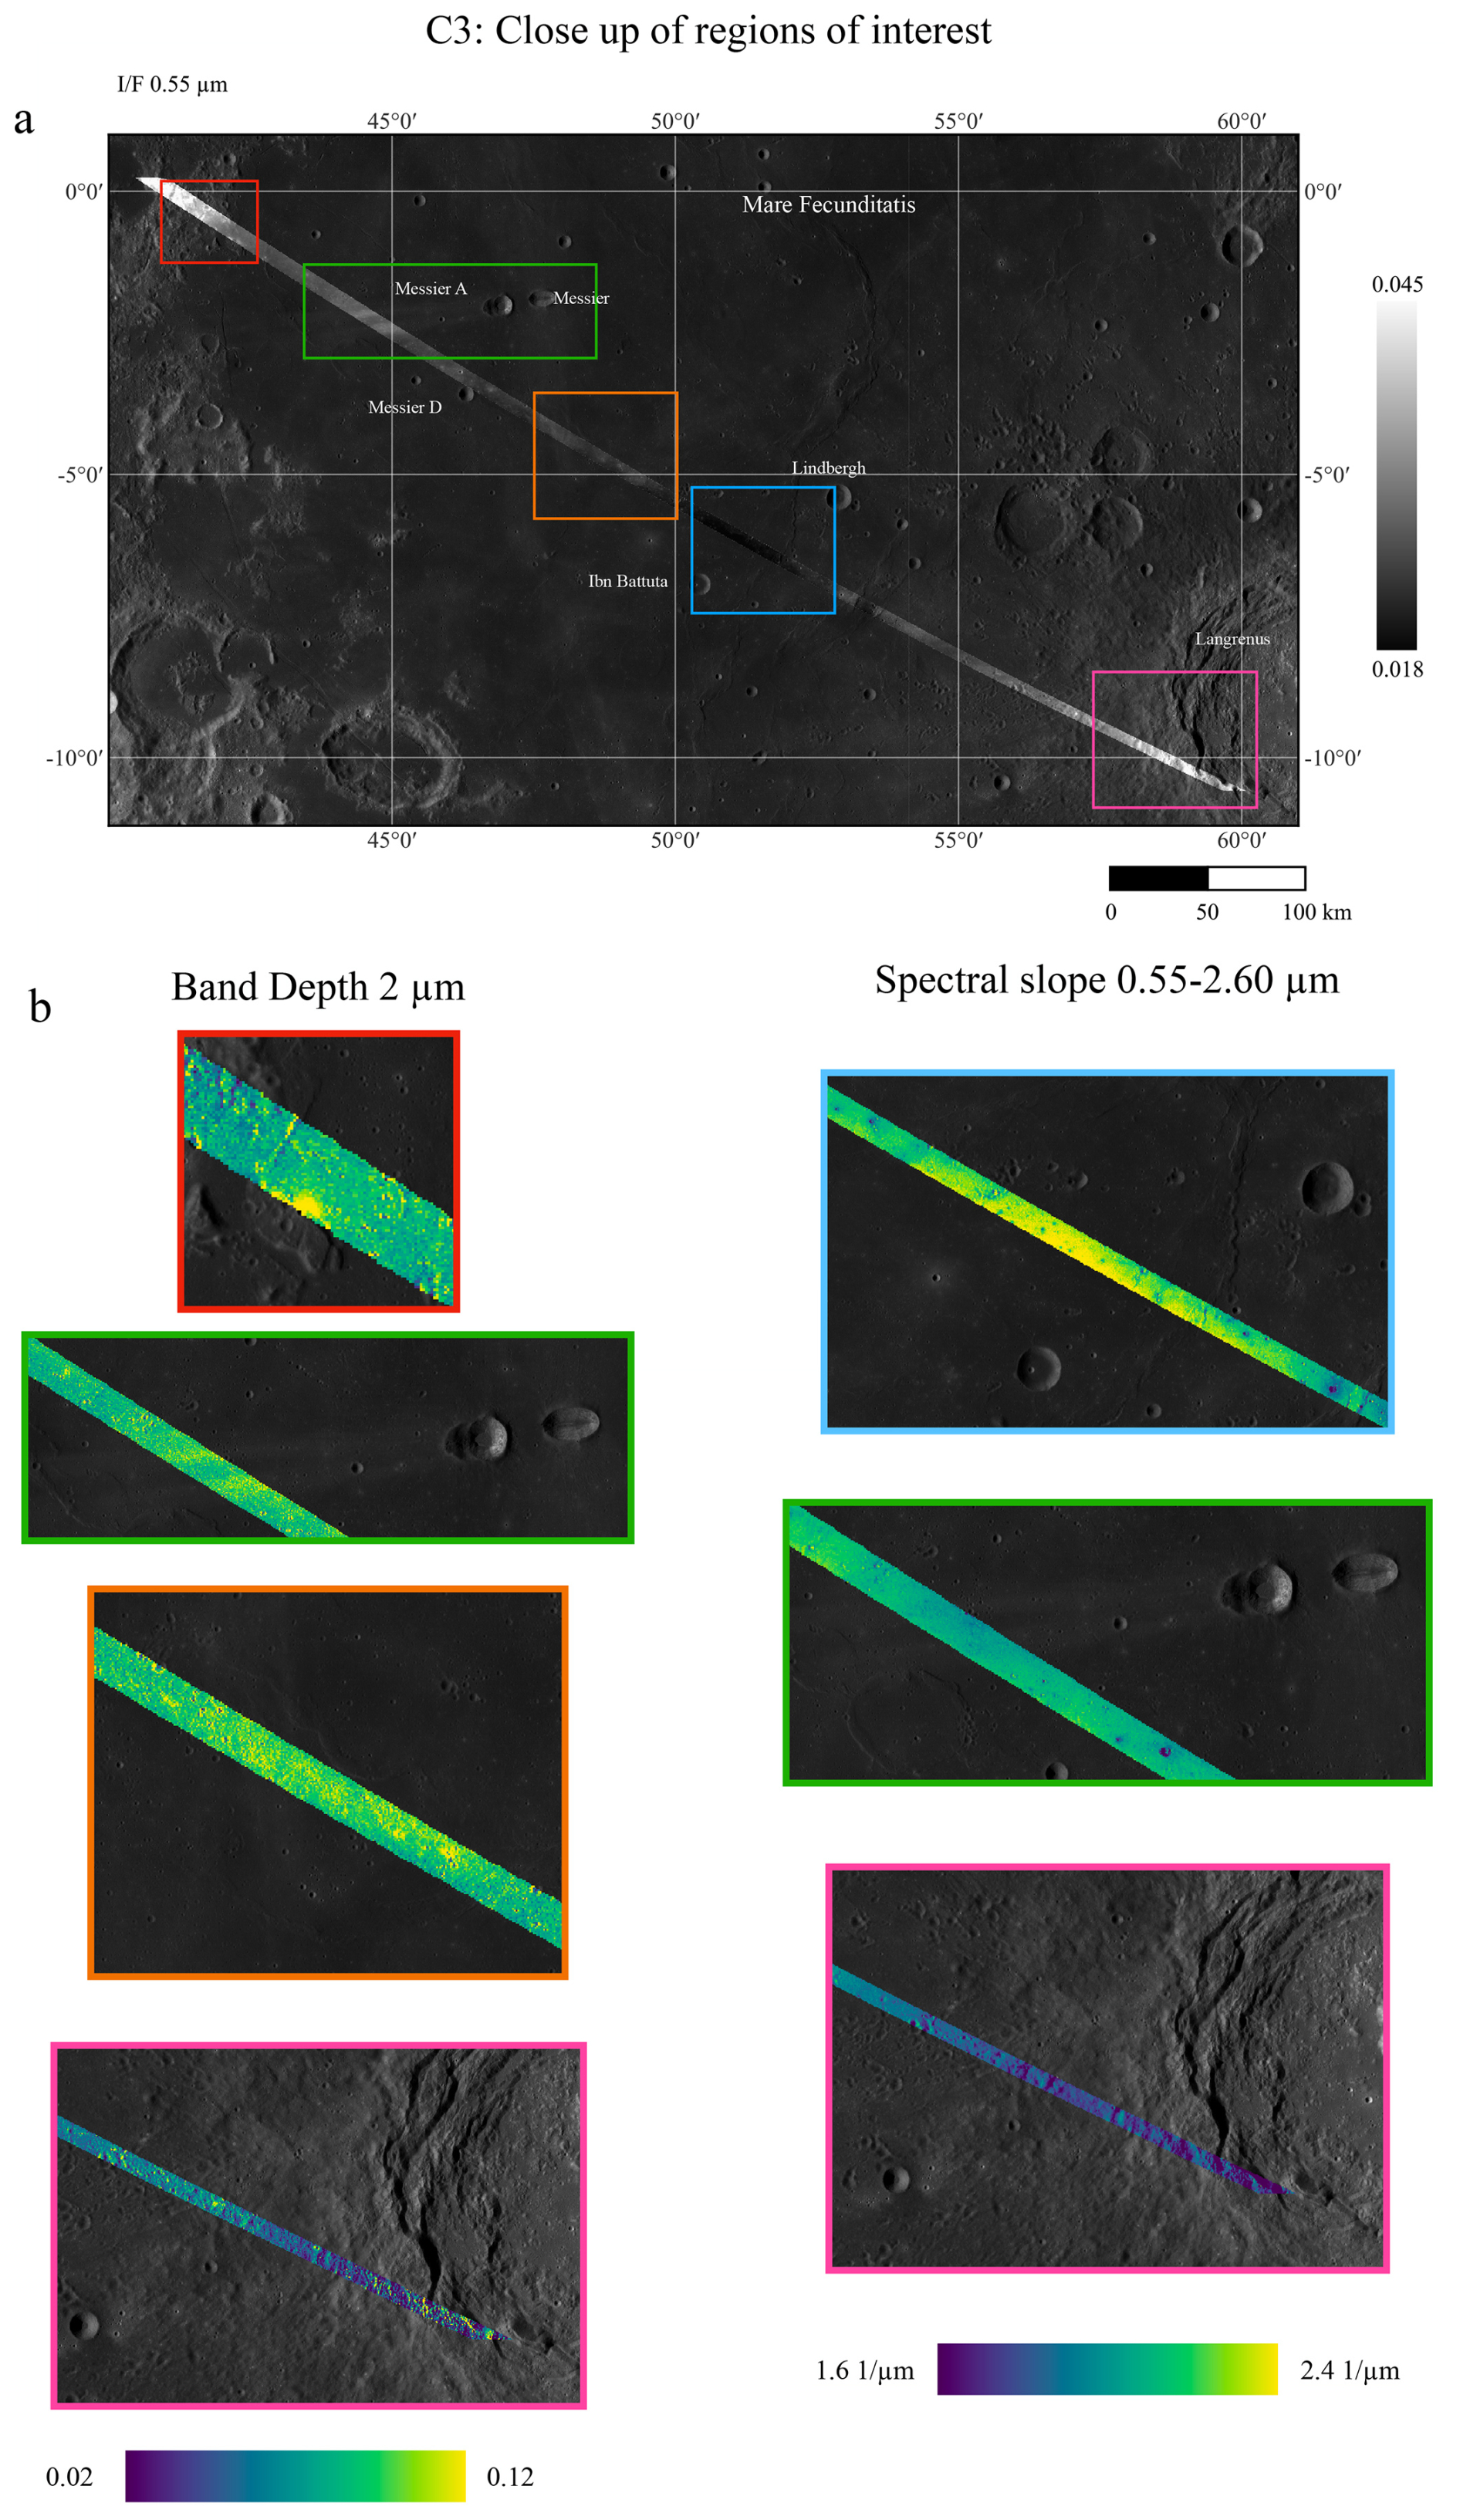
Figure 9Panel (a): Coloured boxes indicate regions within C3 exhibiting significant spectral variability. Panel (b): Close-up of the 2 µm band depth and the spectral slope between 0.55 and 2.60 µm (GS). The red box encompasses a mare–highlands transition region in the north-western part of C3. The green box highlights the ejecta of Messier and Messier A craters. The orange and blue boxes correspond to the central region of Mare Fecunditatis, while the magenta box marks the rim of Langrenus crater.
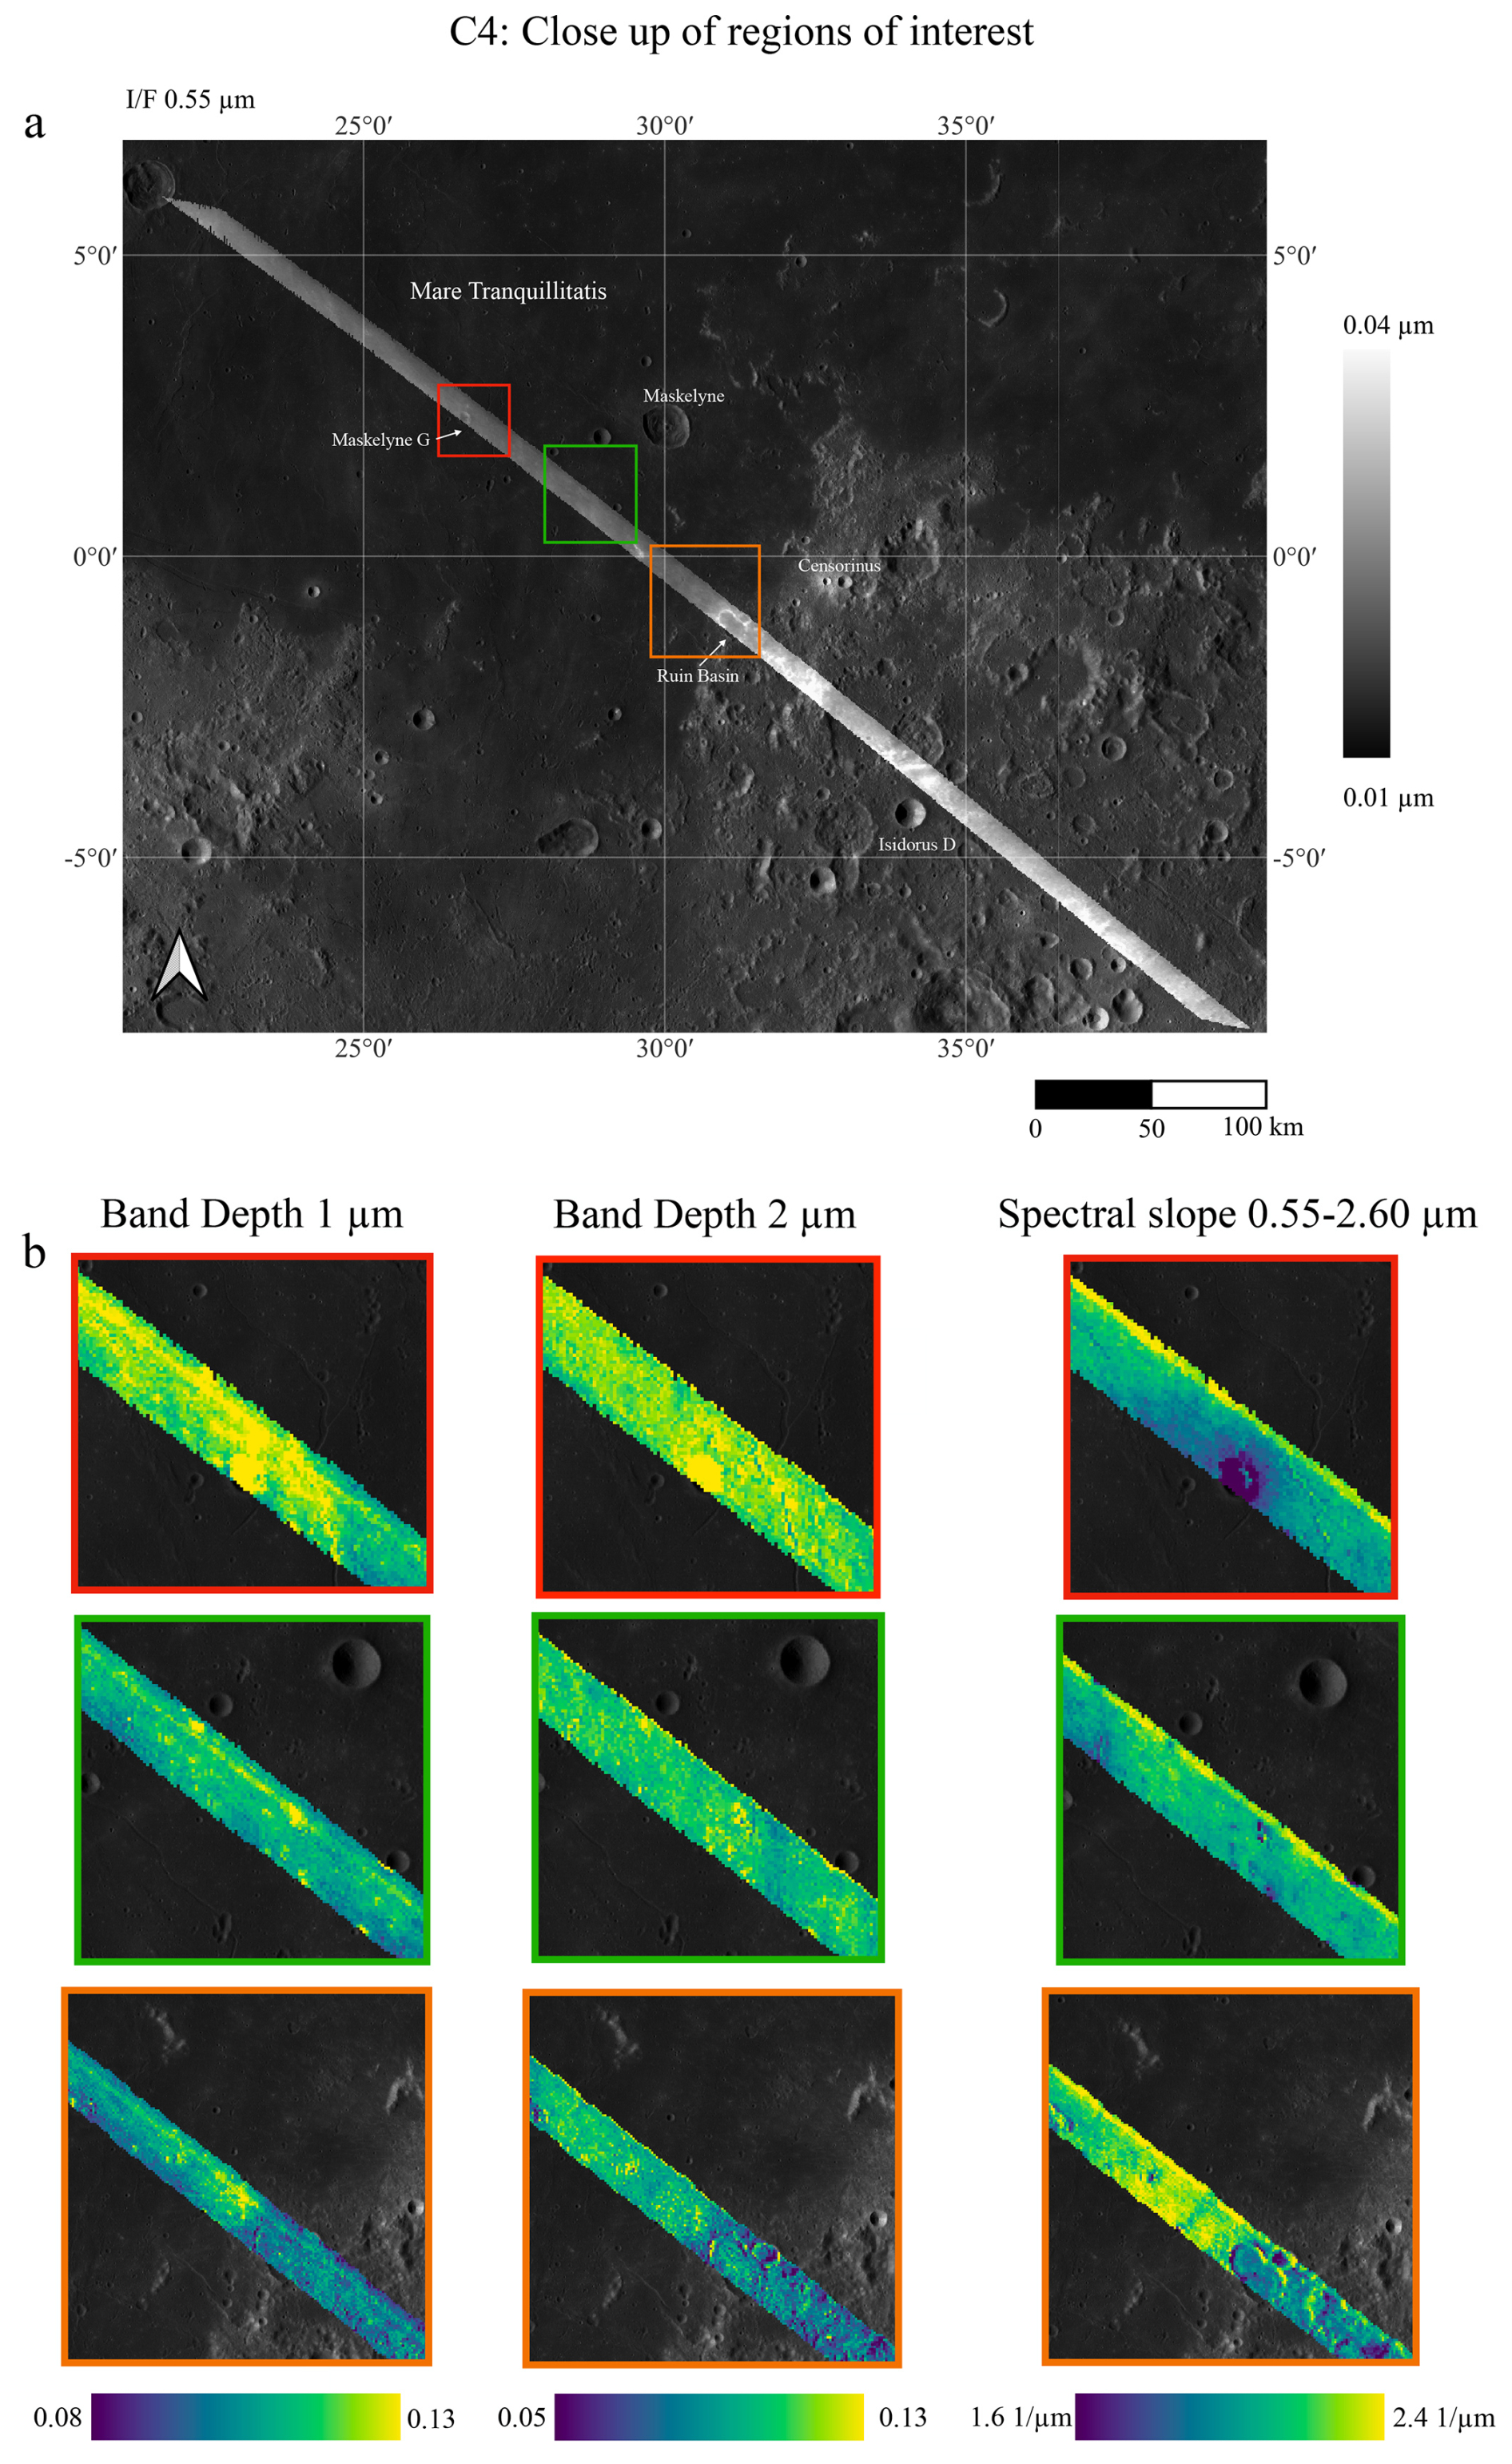
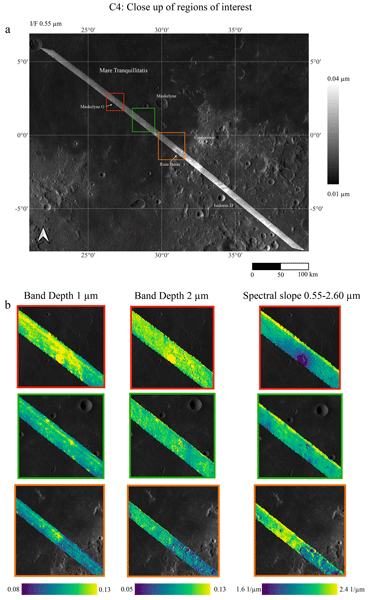
Figure 10Panel (a): Regions exhibiting notable spectral variability within C4. Panel (b): Close-up of the 2 µm band depth and the spectral slope between 0.55 and 2.60 µm (GS). The red box indicates the Maskelyne G crater region, the green box shows a mare unit within Mare Tranquillitatis, and the orange box marks a mare–highlands transition region.
In this section, we focus primarily on cubes C3 and C4, which predominantly cover basaltic mare terrains, with a minor portion of highlands included in C4. Both C3 and C4 are dominated by dark basaltic surfaces but exhibit considerable spectral variability. This variability is largely driven by the presence of small, fresh impact craters, such as Maskelyne G in C4 and the ejecta blankets of Messier and Messier A in C3 (Figs. 9 and 10). Highland areas, where present, appear spectrally brighter, as shown in the I/F maps at 0.55 µm (Fig. 1).
Cube C3 also displays spectral variability – albeit less pronounced – within Mare Fecunditatis, where these prominent ejecta blankets exhibit especially strong absorption bands. On the other hand, a darker region between Ibn Battuta and Lindbergh craters shows higher spectral slopes, suggesting possible compositional heterogeneity within the same mare unit. Cube C2, which covers the highlands east of Mare Fecunditatis, does not show any particular trend.
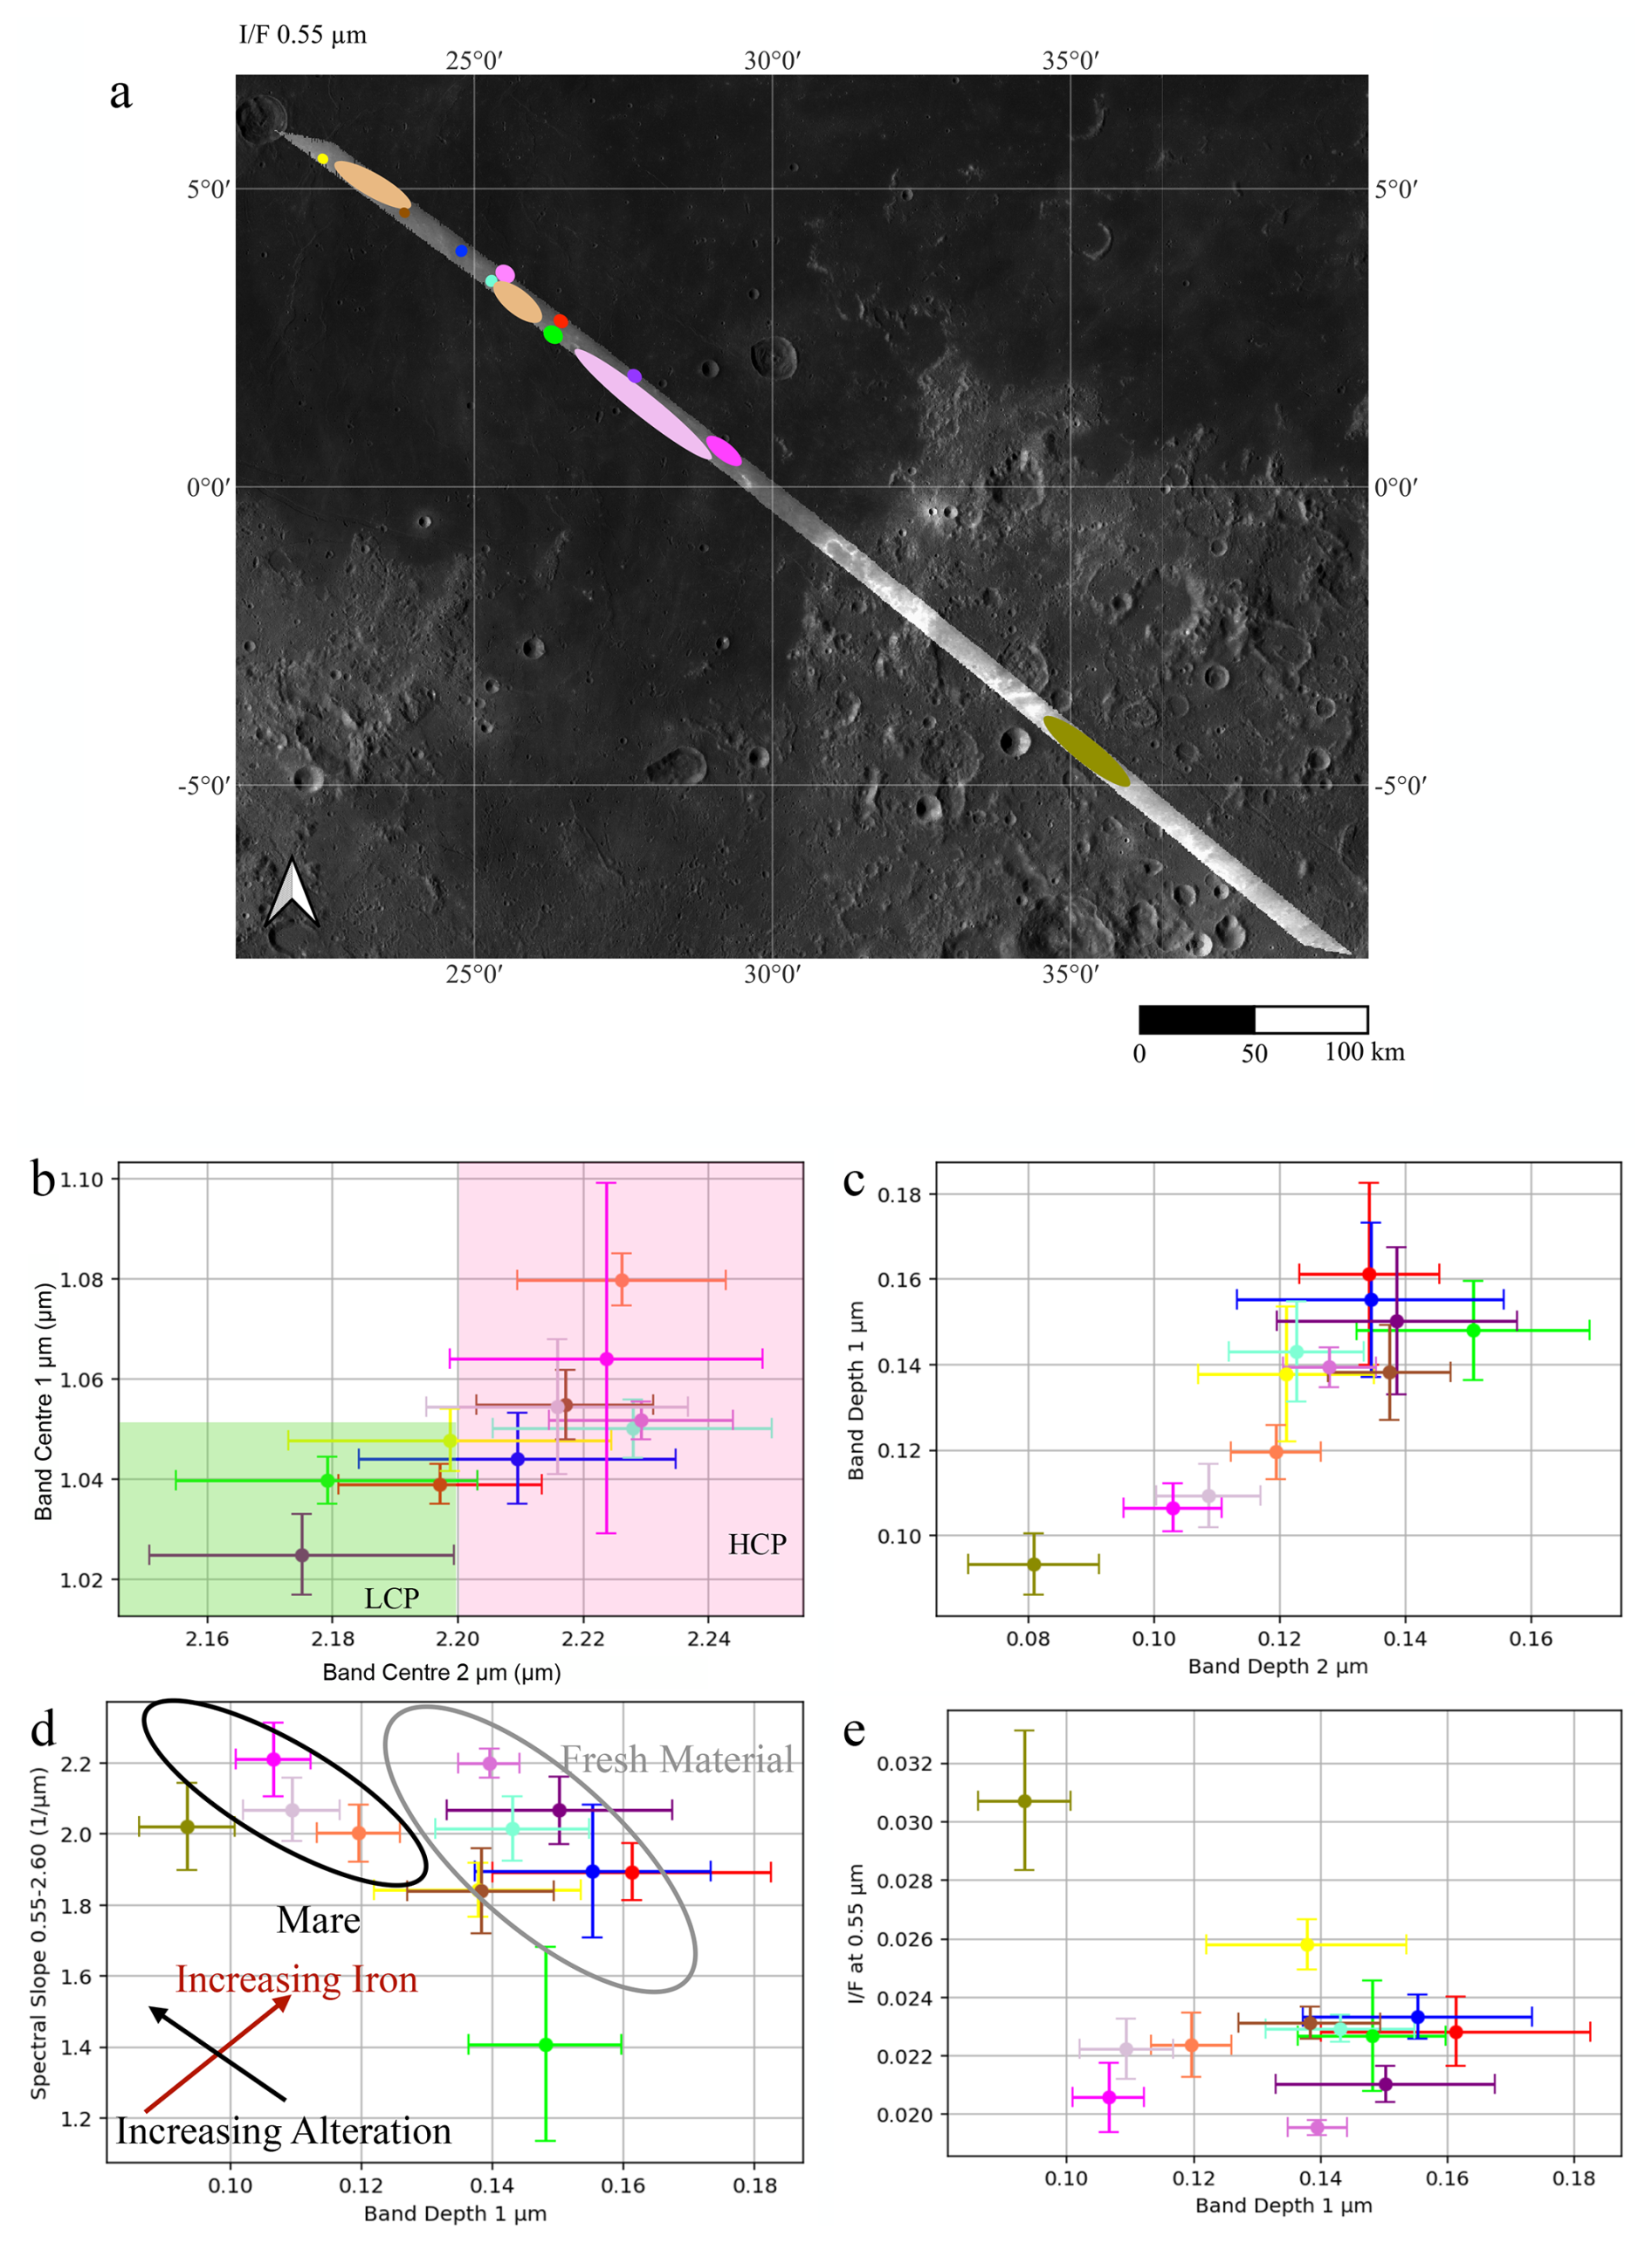
Figure 11Panel (a): Regions of interest considered for C4. ROI colours correspond with those in panels (b)–(e). Panel (b): Band centre at 1 µm versus band centre at 2 µm, with green and pink boxes indicating regions corresponding to low-calcium (LCP) and high-calcium pyroxenes (HCP), respectively. Band centres were calculated from the ratioed cube. The highland spectrum is not included due to issues described in Sect. 4. Panel (c): Band depth at 1 µm versus band depth at 2 µm. Panel (d): Spectral slope between 0.55 and 2.60 µm plotted against 1 µm band depth. Grey circles indicate fresh material, black circles indicate mare soils. Red and black arrows represent increasing iron content and weathering, respectively. Panel (e): I/F at 0.55 µm versus 1 µm band depth. The green dot represents Maskelyne G crater, the brown dot represents highland regions. LCP and HCP thresholds are from Klima et al. (2007, 2011).
The distribution of 1 and 2 µm absorption band centres in cube C4 reveals a systematic shift towards longer wavelengths in the central mare region, consistent with increasing Fe2+ and Ca2+ contents in pyroxenes (Figs. 7 and 10). However, the Maskelyne G crater exhibits band centres shifted towards shorter wavelengths, potentially indicating a different pyroxene composition (Fig. 11a, green dot). Conversely, band centre estimations in highland regions remain challenging due to weaker absorption features and increased spectral noise (Fig. 4e). In cube C3, reliable estimates of the 1 µm band centre are not achieved, and no significant variation is observed in the 2 µm band centre. Nevertheless, the band depths at 1 and 2 µm in C4 are clearly correlated (Fig. 11c), with the deepest bands occurring in fresh crater materials and the central mare, confirming the presence of mafic silicates.
Figures 9 and 10 highlight regions within cubes C3 and C4 that exhibit notable mineralogical and spectral diversity. In particular, the ejecta of Messier and Messier A (green box in Fig. 9) display deep 2 µm absorption bands and low spectral slopes, characteristic of fresh material. By contrast, the darker region (blue box in Fig. 9) shows more moderate absorption features combined with steeper slopes, indicative of a more mature regolith. Average spectra from selected regions in cubes C3 and C4 are presented in Figs. 4 and 5. These regions encompass a range of terrain types and spectral characteristics. The spectrum from Maskelyne G crater (green line in Fig. 4) is particularly distinct. After continuum removal (Fig. 4d), it displays markedly deeper 1- and 2 µm absorption bands, consistent with fresher, pyroxene-rich material.
Figure 11b illustrates the typical trend of band centres for pyroxene-bearing surfaces, with each coloured dot corresponding to the regions of interest selected in Fig. 11a. The data indicate the presence of both low-Ca and high-Ca clinopyroxenes. Maskelyne G crater, along with two nearby fresh craters (purple and red ROIs), appears richer in low-Ca pyroxene, whereas other regions are dominated by high-Ca pyroxenes. Mare Tranquillitatis is also known to have the highest titanium concentrations on the Moon, associated with ilmenite and Fe-rich basalts, and a correspondingly lower abundance of plagioclase feldspar (Fig. 3b and d).
Figure 11d shows spectral slope plotted against 1 µm band depth, following the approach of Le Mouélic et al. (2000) (who originally used the 0.57–1.50 µm continuum), revealing four distinct spectral populations:
- 1.
fresh materials with high band depths and low spectral slopes,
- 2.
mature mare soils with low band depths and high spectral slopes,
- 3.
Maskelyne G crater, which deviates from the general trend with the lowest spectral slope values, consistent with very fresh, minimally weathered material, and
- 4.
highlands with low 1 µm band depth and high spectral slopes.
Finally, Fig. 11e demonstrates a correlation between reflectance at 0.55 µm (I/F) and 1 µm band depth: higher reflectance values generally correspond to deeper absorption bands, except in the highlands, further supporting compositional and maturity differences across the studied regions.
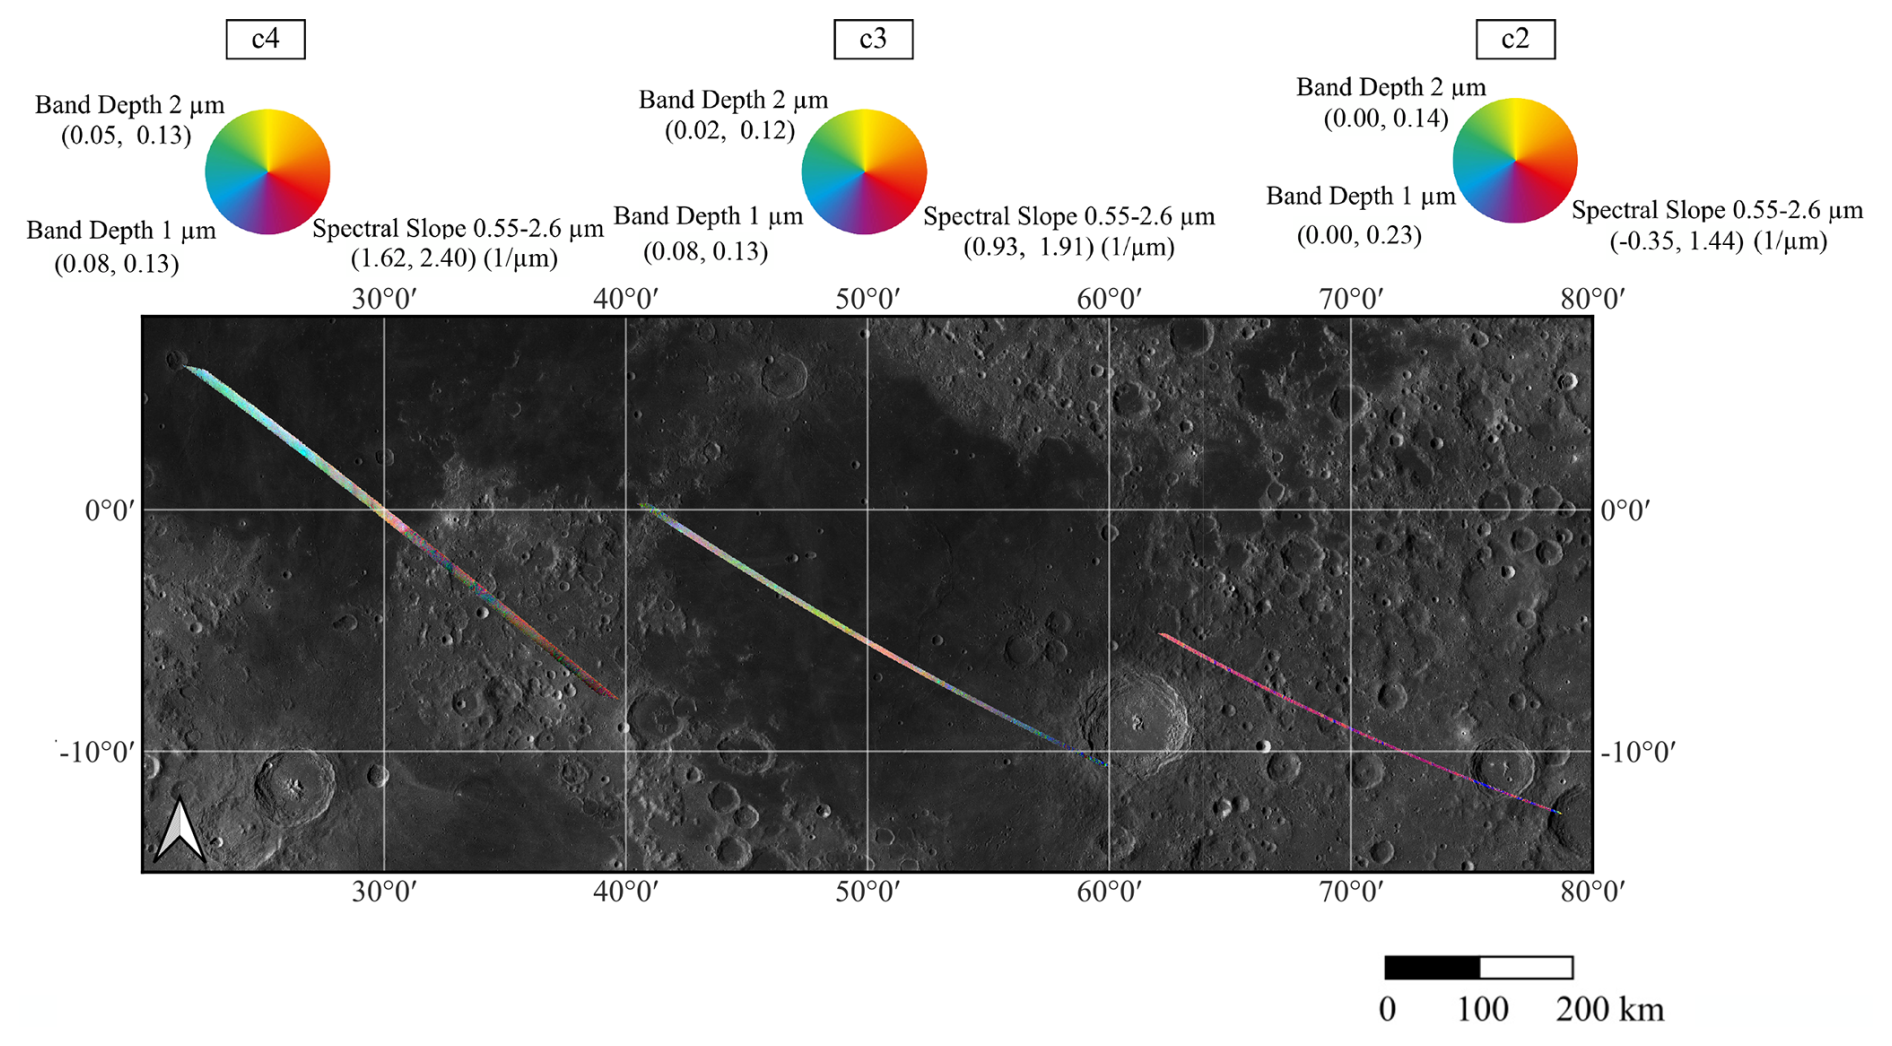
Figure 12RGB map combining data from C2, C3, and C4 cubes. The red channel represents the spectral slope between 0.55 and 2.60 µm, the green channel shows the 2 µm band depth, and the blue channel displays the 1 µm band depth.
RGB colour composite maps offer an intuitive means of visualising spectral heterogeneity. Figure 12 presents an RGB composite of cubes C2, C3, and C4, where the red channel represents the spectral slope between 0.55 and 2.60 µm (a proxy for surface maturity), the green channel indicates 2 µm band depth, and the blue channel shows 1 µm band depth, indicative of mafic mineral presence. Cube C4 exhibits the greatest spectral variability, with a sharp contrast between highland and mare regions. Even within Mare Tranquillitatis, subtle colour variations are evident. In particular, the central portion of Mare Tranquillitatis and the area surrounding Maskelyne G crater display a cyan hue, indicating a higher abundance of pyroxene-bearing material (Fig. 12).
The mineralogical diversity described here is also supported by thermophysical analyses of the same MAJIS observations (Tosi et al., 2026, this issue), which reveal systematic terrain-dependent differences in surface temperature and emissivity in the 3–5.56 µm range, consistent with compositional and surface-texture contrasts between mare and highland terrains. In contrast, plagioclase-rich highlands, characterised by weak mafic bands and steep, reddened slopes, display lower emissivity and cooler temperatures. Fresh crater materials, such as those at Maskelyne G, show both enhanced pyroxene signatures and localised thermal anomalies, reflecting reduced maturity and blocky textures. This close agreement between VNIR and IR observations highlights the tight coupling between composition, maturity, and thermophysical behaviour along the MAJIS track (Tosi et al., 2026, this issue).
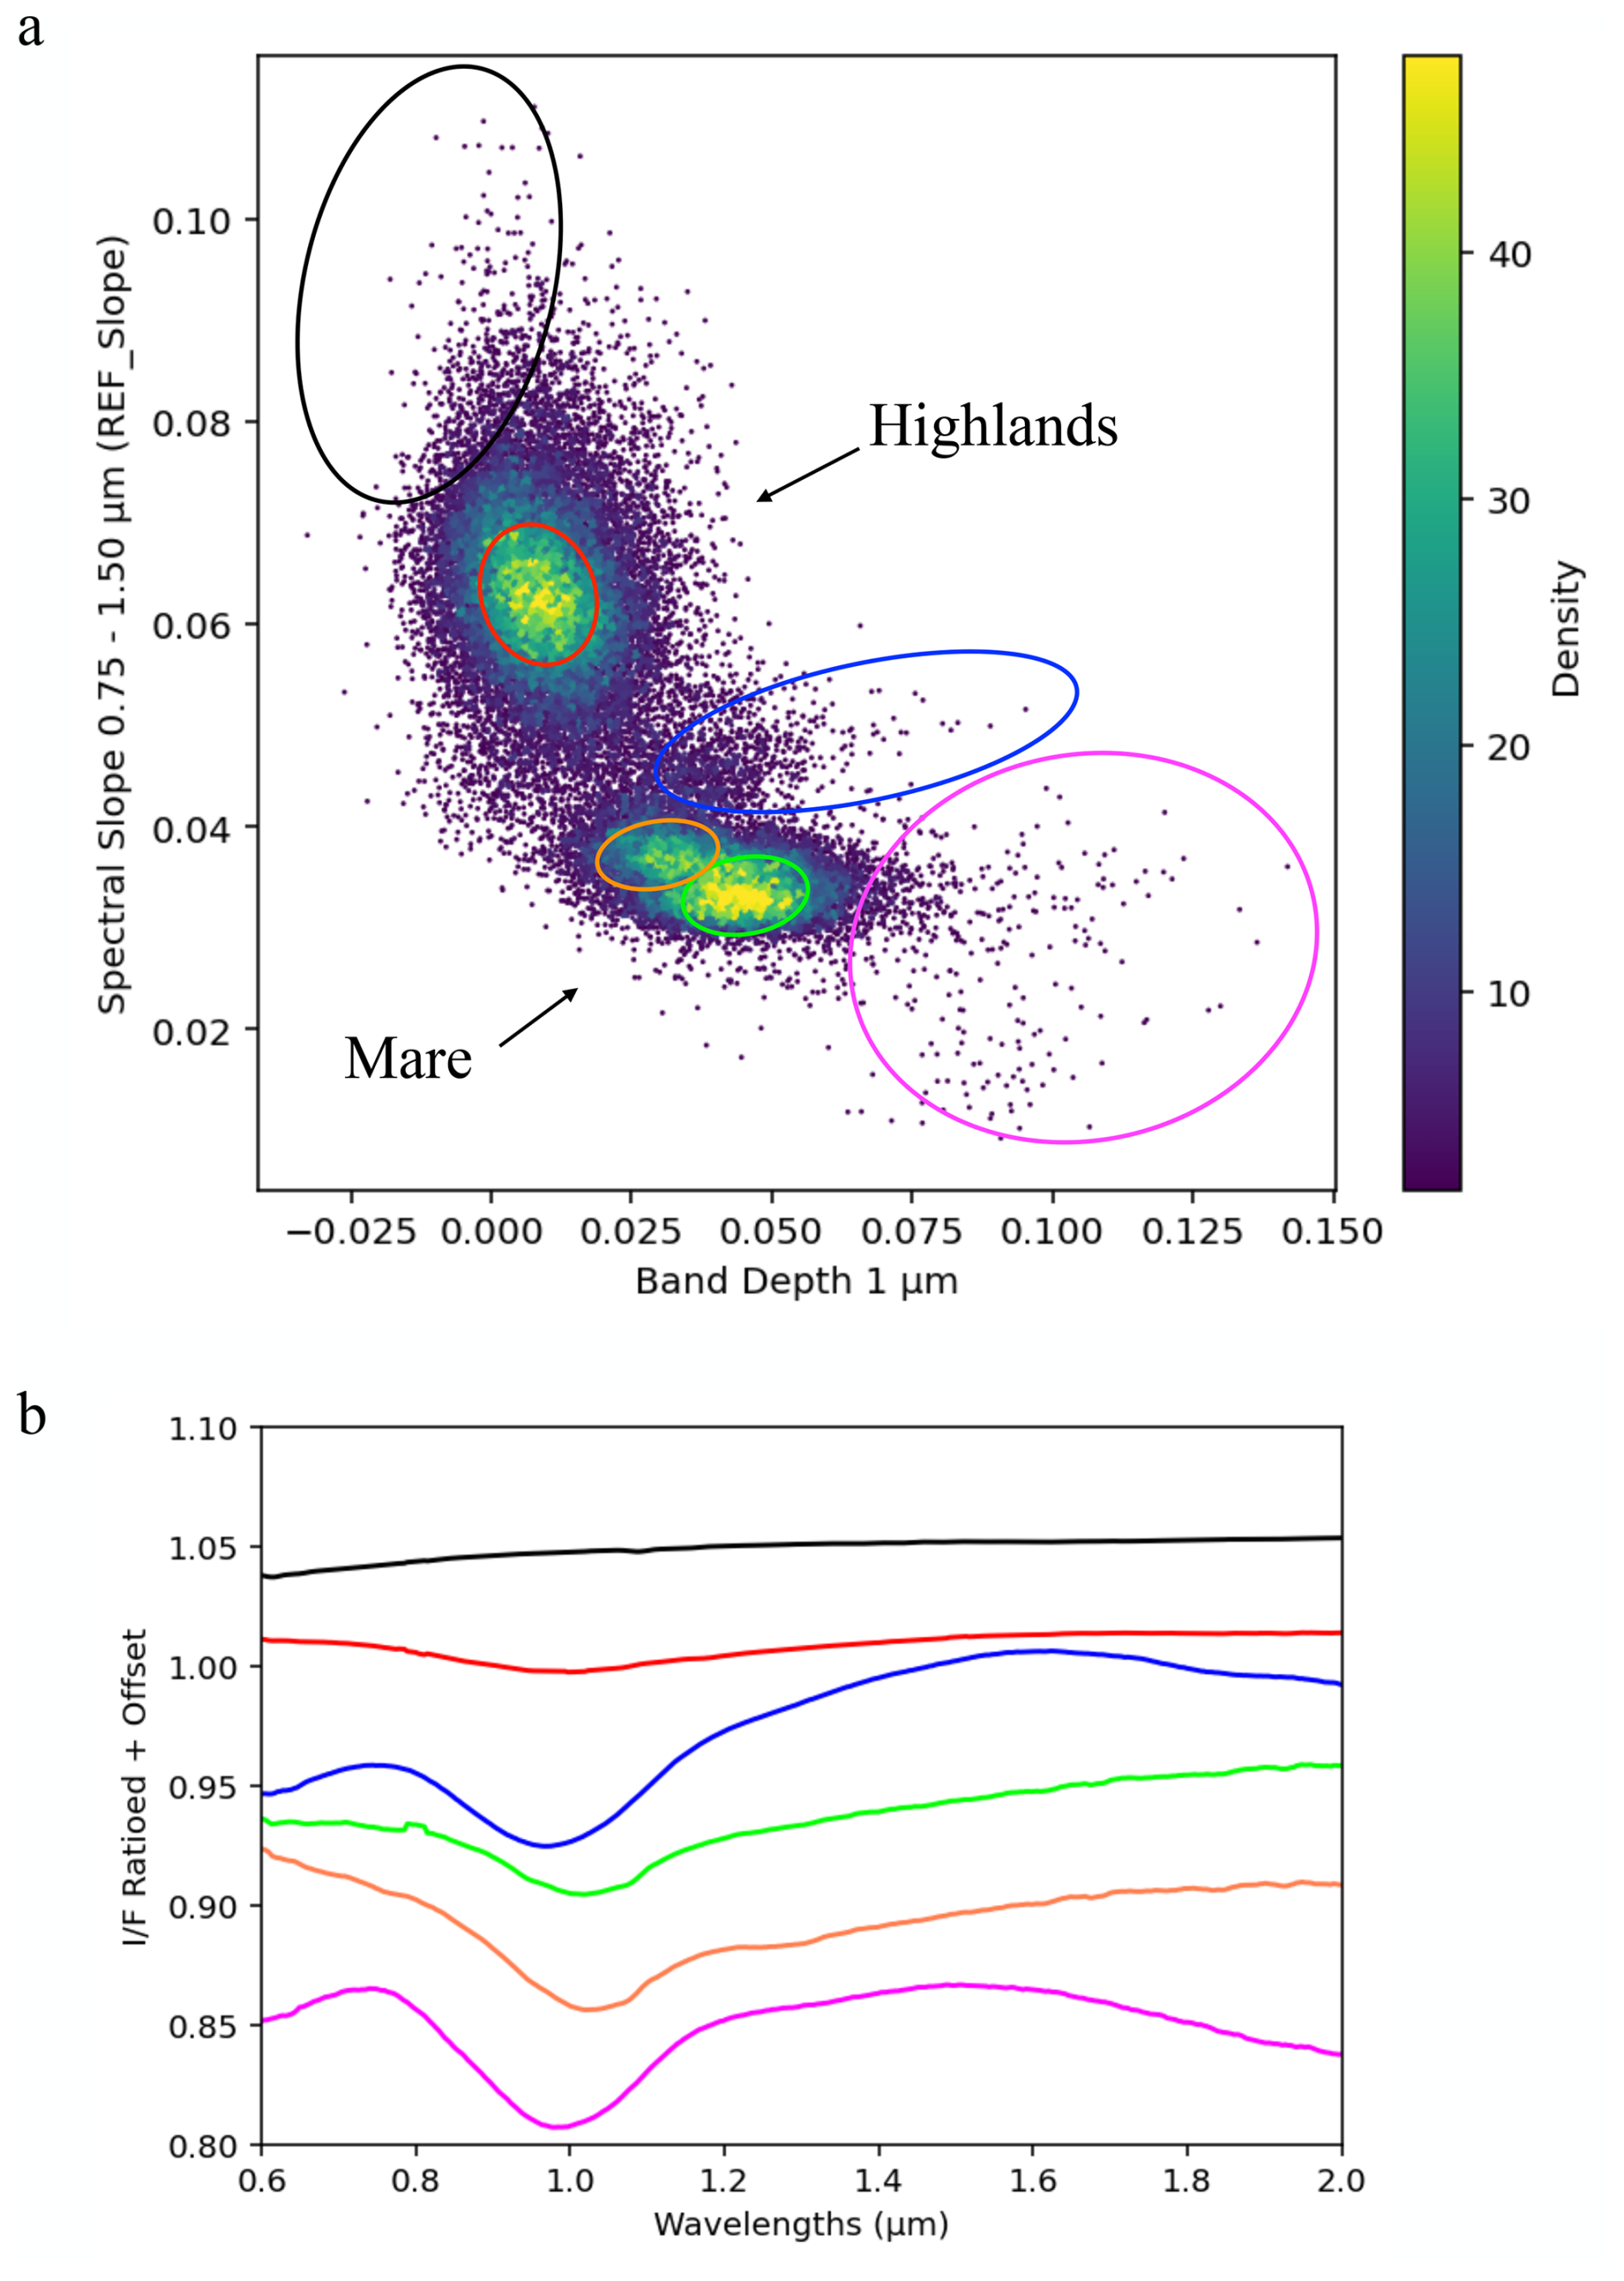
Figure 13Panel (a): Density scatter plot of spectral slope between 0.75 and 1.50 µm (REFSlope) versus 1 µm band depth (STEP 2; see Appendix B) for cube C4. Two clusters corresponding to the highlands and Mare Tranquillitatis are clearly distinguishable. Black and red circles represent highland regions with 1 µm band depth > 0 and < 0, respectively. Orange and green ovals identify the two population observed within the Mare Tranquillitatis. Points within the blue oval belong to the transition region between the highlands and Mare Tranquillitatis, just beyond the Ruin Basin. The magenta oval indicates data with the strongest mafic signatures. Panel (b): Mean spectra of the regions highlighted in Fig. 13a.
Here we discuss the spectral behaviour and the mineralogical variation highlighted after spectral ratioing described in Sect. 4.2. The scatter plot of the spectral slope between 0.75 and 1.50 µm (REFSlope) versus 1 µm band depth (Fig. 13a) reveals two distinct spectral populations corresponding to the lunar highlands and Mare Tranquillitatis. Highland points occupy the upper-left quadrant, characterised by relatively shallow 1 µm absorption bands and steep spectral slopes in the 0.75–1.50 µm range. These features are indicative of feldspathic compositions dominated by plagioclase with minimal mafic absorption and are consistent with mature, weathered surfaces exhibiting high spectral reddening.
By contrast, Mare Tranquillitatis points cluster in the lower-right quadrant, displaying deeper 1 µm absorption bands and lower continuum slopes. These spectra reflect higher mafic mineral content, particularly pyroxenes, and spectral properties influenced by the different compositional response of Fe-rich basaltic materials to space weathering processes. In particular, the higher iron abundance in mare basalts enhances optical maturation effects, producing spectral characteristics distinct from those observed in feldspathic highland terrains. REFSlope variability among the mare spectra is reduced relative to the highlands (see also Fig. B1 in Appendix B, right panel), indicating more homogeneous surface properties in terms of maturity.
Within the mare population, two distinct clusters are apparent. The first (orange circle in Fig. 13a, REFSlope between 0.35 and 0.40) corresponds to spectra closer to the highland boundary, while the second (green circle, REFSlope < 0.37) represents spectra from more central mare regions. This spatial distinction may reflect minor differences in regolith maturity or local mixing with highland material.
A subtle trend within the highland population shows increasing spectral slope with decreasing 1 µm band depth, consistent with high maturity, as previously documented (Le Mouélic et al., 2002). Between the highland and mare populations, an intermediate group (blue oval in Fig. 13a) corresponds to a transitional region situated between the highlands and Mare Tranquillitatis near the margins of the Ruin Basin. This scatter plot captures a spectral gradient reflecting the transition from feldspathic highlands to basaltic mare surfaces.
Representative mean spectra for each group are shown in Fig. 13b. In the highlands, some spectra (black spectrum) exhibit band depths similar to the reference spectrum used for ratioing but with a redder visible slope, typically located in the brightest highland areas. Most highland spectra (red spectrum) display weak 1 µm bands centred slightly shortward of 1 µm. Both highland mean spectra lack the 2 µm absorption feature, as expected for mature highland soils.
In Mare Tranquillitatis, most spectra (green spectrum) show deeper 1 µm bands (centred slightly longward of 1 µm), although the 2 µm band in the ratioed mean spectrum is not prominent. The mean spectrum from the Ruin Basin margin (blue curve) exhibits deeper 1 µm bands than highland spectra, centred around 0.95 µm, with a deeper 2 µm band, indicating a higher content of low-Ca pyroxenes. The magenta curve represents spectra from mare regions with the deepest 1 µm bands; for these, small craters in Mare Tranquillitatis also show the 2 µm band, reflecting enrichment in pyroxenes. Spectra with the lowest REFSlope, corresponding to the least weathered and most mafic-rich surfaces, are associated with the interior of Maskelyne G crater and other small craters in the mare, where fresh basaltic exposures are present.
Although MAJIS acquired only four spectral cubes over the lunar surface, these data provide reflectance spectra extending up to 5 µm. This extended wavelength range opens new possibilities for detecting and analysing spectral features previously inaccessible to imaging spectrometers such as M3. After removing the thermal emission component (see Appendix A, Fig. A1b and c), the resulting reflectance spectra still exhibit a generally red slope, consistent with space-weathered materials.
Several broad and recurring absorption features are evident, most notably near 2.8 µm and around 4.8 µm (see Fig. A1 in Appendix A). An absorption feature between 2.8 and 3.0 µm has previously been attributed to the presence of hydroxylated or hydrated compounds based on M3 observations (Pieters et al., 2009). This feature is commonly associated with -bearing phases and is observed across the lunar surface, with generally stronger signatures at higher latitudes and variations related to local time and surface temperature, possibly linked to solar-wind implantation or endogenic processes. In the MAJIS dataset, however, the spectral interval between 2.85 and 2.95 µm is affected by an instrumental artefact corresponding to a spectral gap at the interface between two segments of the Linear Variable Filter (LVF) (Poulet et al., 2024). This gap was intentionally selected due to the absence of relevant spectral features for the Jovian targets but significantly complicates the reliable interpretation of potential absorptions in this crucial range. Nevertheless, Langevin et al. (2026), this issue, discuss this specific feature and its possible interpretation. These instrumental limitations highlight the need for caution when interpreting preliminary MAJIS data.
A broader and more pronounced absorption feature is observed at approximately 4.8 µm (see Fig. A1 in Appendix A). This spectral region remains largely unexplored in lunar remote sensing, particularly regarding silicate mineralogy. Laboratory measurements of HED meteorites (howardites, eucrites, and diogenites) and olivine reported by Cloutis et al. (2013) and Kremer et al. (2020) show absorptions in the 4.74–5.10 µm range, associated with pyroxene and olivine components. The presence of a similar absorption in the MAJIS lunar spectra suggests a possible mineralogical origin; however, its spatial characterisation remains challenging due to uncertainties associated with thermal emission removal.
Specifically, lunar surface radiance measurements are affected by a combination of reflected solar radiation and intrinsic thermal emission from the regolith. Correcting for the thermal contribution is inherently degenerate because the emitted component depends on surface emissivity, which is itself related to reflectance through Kirchhoff's law. Consequently, variations in the assumed reflectance modify the emissivity and the modelled thermal emission, allowing different combinations of reflectance, emissivity, and surface temperature to reproduce the same observed signal. Therefore, thermal removal in this wavelength range cannot yield a unique reflectance solution and could account for the systematic signature near 4.8 µm.
Given these complexities related to instrumentation and data interpretation at wavelengths longer than 2.6 µm, a comprehensive analysis of these absorption features requires further dedicated investigation. As this topic lies beyond the scope of the present study, a detailed discussion is deferred to future work.
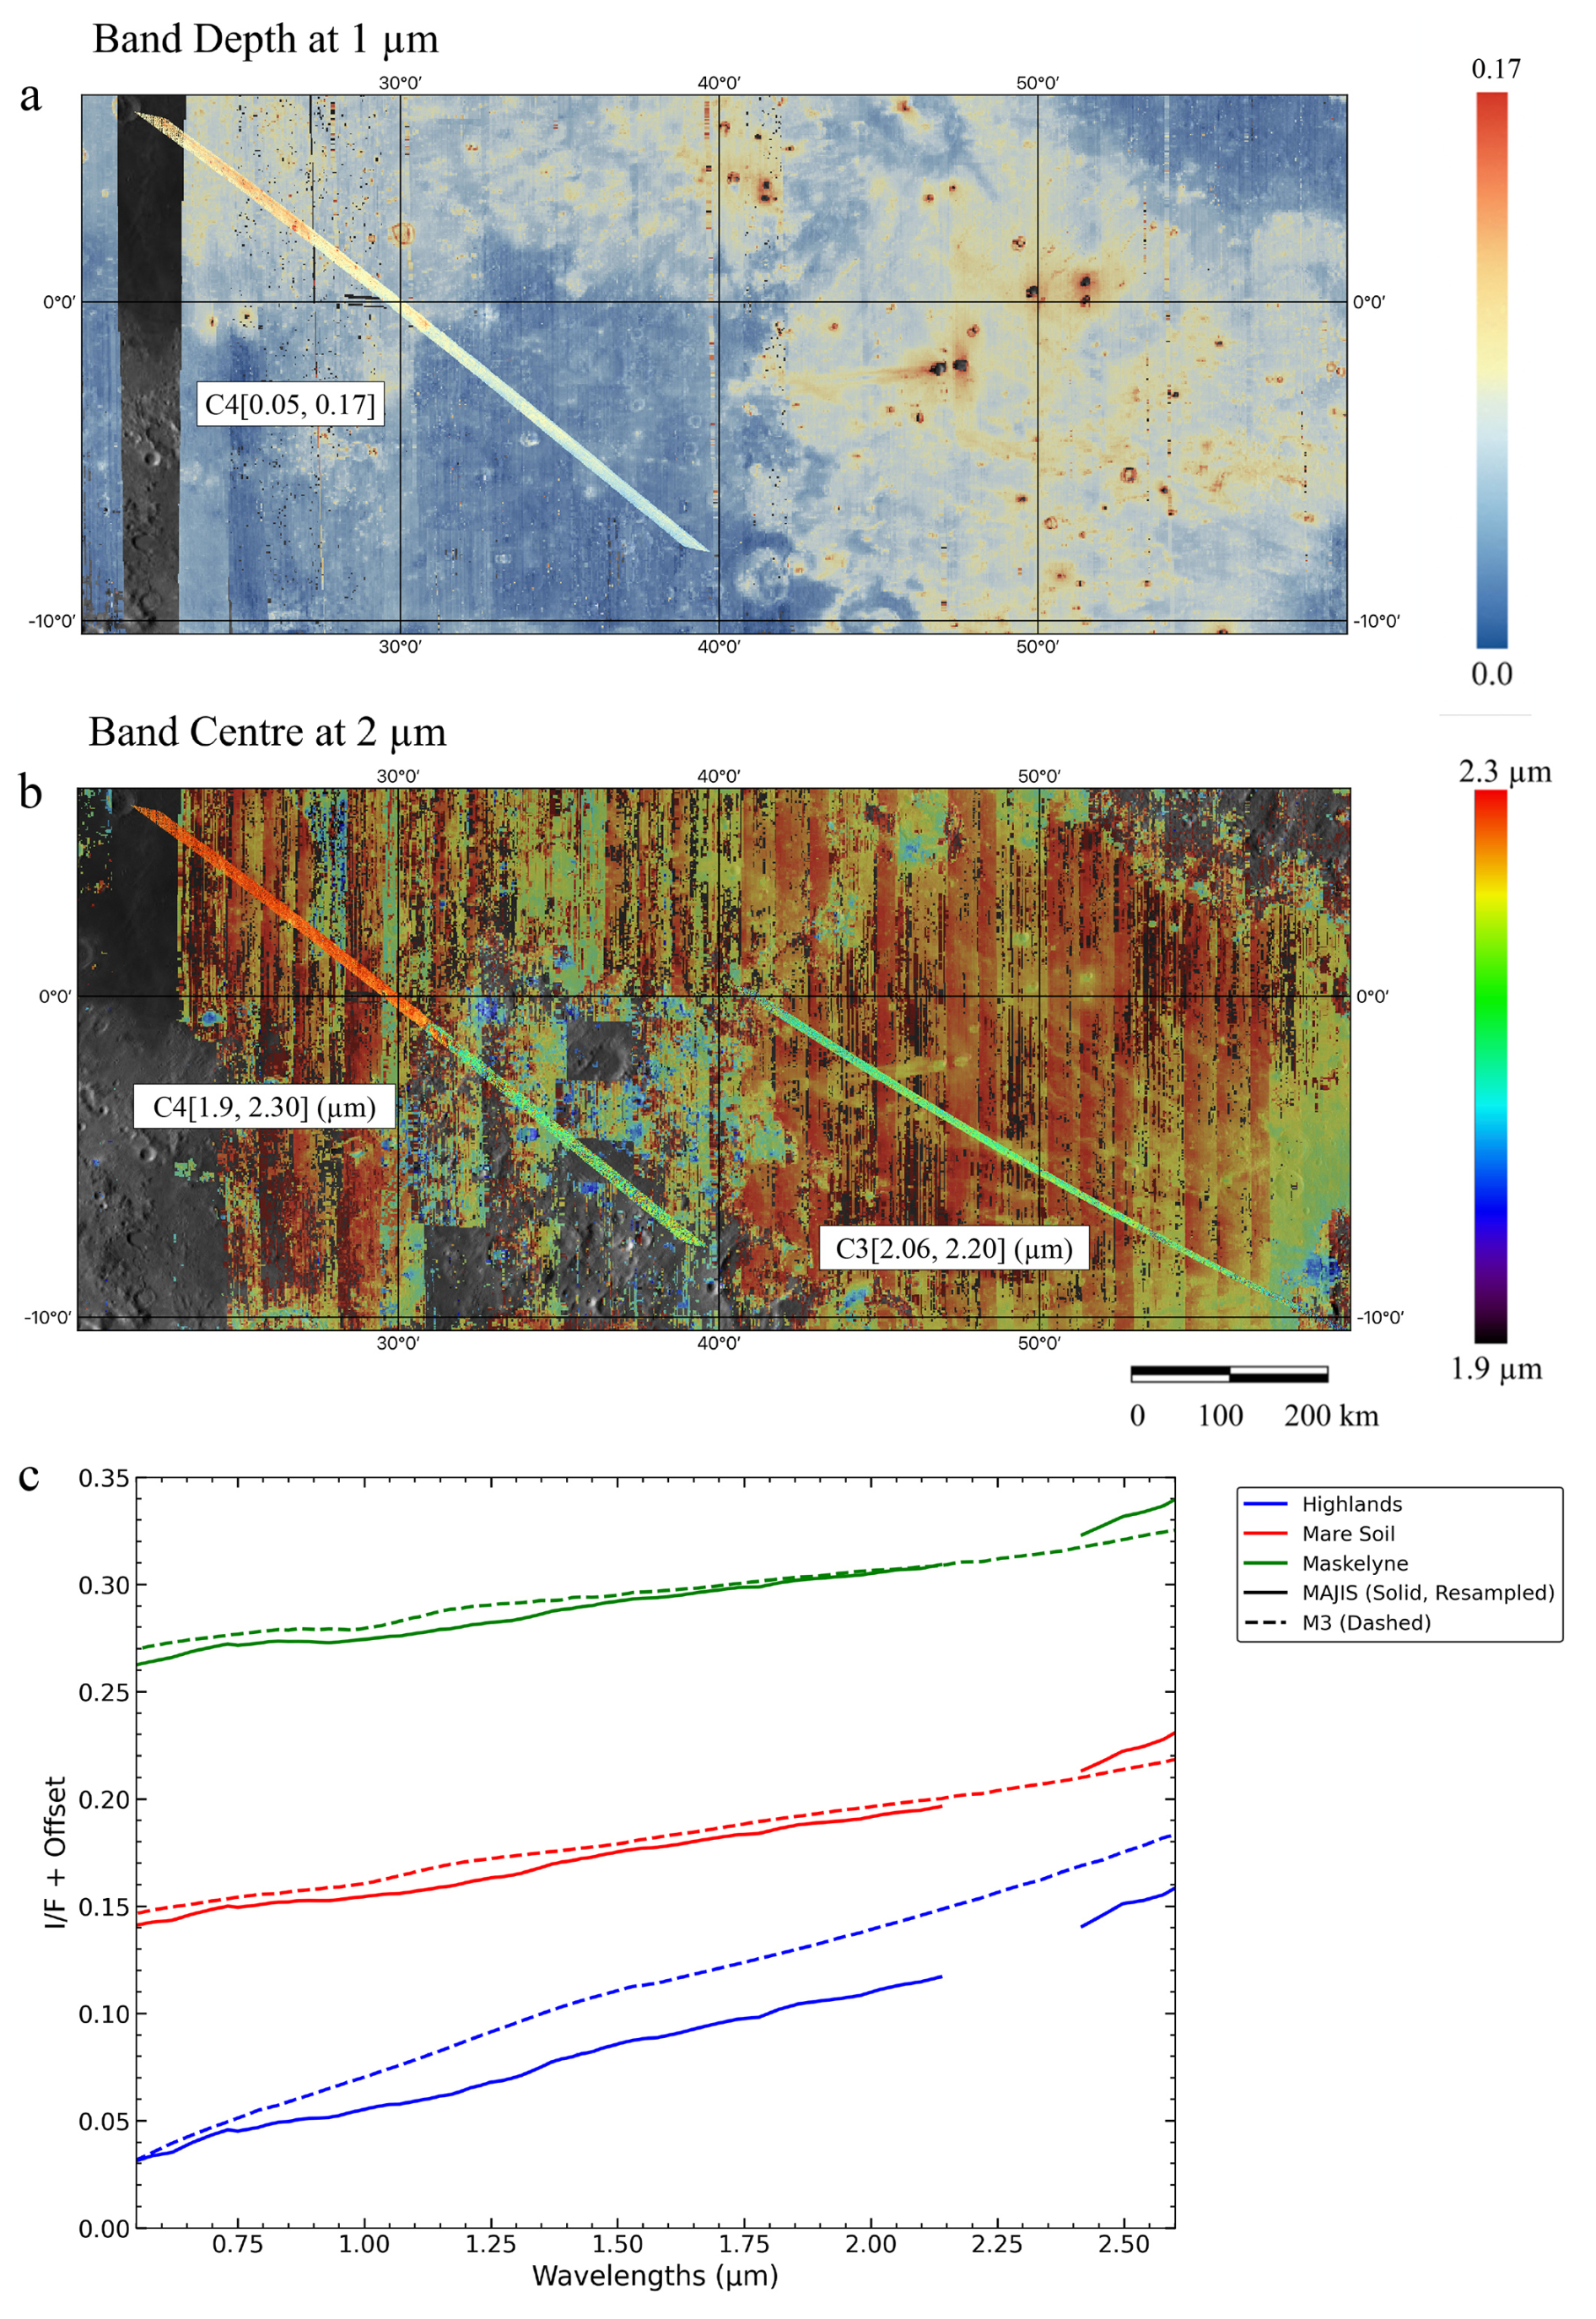
Figure 14Comparison between M3 and MAJIS spectral index maps. Panel (a) shows the C4 1 µm band depth map overlaid on the M3 basemap. Stray light affecting the 1 µm band region prevents reliable parameter retrieval for C3; therefore, only C4 is considered in the MAJIS–M3 comparison. Panel (b) presents the 2 µm band centre distributions for C3 and C4 displayed on the M3 layer. The MAJIS spectral index ranges are indicated on the maps, while the scale bars on the right correspond to the M3 basemaps. The spatial resolution of the M3 spectral parameter maps (1.4 km per pixel) is significantly coarser than that of the original M3 Global Mode data (140 m per pixel). Panel (c) displays the average spectra of three selected terrain types: the fresh crater Maskelyne (green), Mare Soil (red), and the Highlands (blue). A remarkably good agreement is observed between MAJIS (solid lines) and M3 (dashed lines) spectra for both the Mare Soil and Maskelyne regions. Conversely, a more pronounced spectral mismatch is observed for the Highlands, which is attributed to variable local illumination geometries driven by macroscopic surface roughness, combined with the lack of photometric correction for the MAJIS data.
A comparison between spectral index maps derived from publicly available datasets (e.g., M3) and those produced in this study using MAJIS observations reveals a strong degree of consistency, both in terms of spatial distribution and absolute values (see Fig. 14). This agreement is noteworthy given that M3 spectral index maps have a spatial resolution approximately ten times coarser than the M3 Global Mode images (∼ 140 m per pixel), and therefore significantly lower than that of MAJIS (see Table 1).
This consistency supports the reliability of the MAJIS products and highlights their potential to complement existing lunar spectral datasets. In particular, the 1 µm band depth map – available only for cube C4, corrected for stray light – shows higher values over mare regions and lower values over the highlands, in agreement with expectations based on lunar mineralogy (see Fig. 14). Mafic-rich basalts in the maria typically exhibit deeper absorption features due to their higher pyroxene content, whereas the highlands, dominated by anorthositic compositions, display shallower bands. To further investigate this consistency, a direct comparison of the average spectra of three different terrains was conducted (see Fig. 14c). While the average spectra of mare soil and Maskelyne exhibit a remarkably good agreement between the two sensors, the highlands spectra display a more noticeable divergence in terms of overall slope and band depth. This discrepancy is highly compatible with the high topographic and macroscopic surface roughness characteristic of the lunar highlands. When observed under MAJIS's high phase angle (∼ 90°), rugged and sloped terrains significantly enhance local shadowing and photometric variations, leading to a more pronounced spectral mismatch compared to the flatter and smoother mare surfaces.
A similar trend is observed in the spatial distribution of the 2 µm band centre. In cube C4, the highest band centre values are concentrated within the Mare Tranquillitatis region. These longer-wavelength band centre positions indicate a predominance of Fe- and Ca-rich clinopyroxenes, consistent with previous findings from M3 data, which also reported a shift towards longer wavelengths in the 2 µm band centre (Fig. 14a and b).
For cube C3, which lies almost entirely within Mare Fecunditatis, the 1 µm band depth values are more spatially homogeneous, reflecting the geochemical uniformity of this mare region.
When comparing these spectral parameters, several physical, geometric, and instrumental factors must be carefully considered. First, a direct comparison of absolute reflectance levels is intrinsically complex: MAJIS observations are expressed as I/F and were acquired at a high, fixed phase angle of ∼ 90° without photometric correction, whereas M3 data represent photometrically corrected reflectance (Besse et al., 2013). This major difference in viewing geometry not only shifts the overall albedo levels but also directly affects the absorption band parameters (such as depth and shape), which are highly sensitive to photometric variations. Second, while thermal emission removal was applied to both datasets to ensure spectral integrity at longer wavelengths, this correction was performed using different thermal models and algorithms. Finally, different spatial resolutions lead to distinct sub-pixel mixing effects within the footprints of each sensor, and both instruments are subject to their minor, inherent calibration limits. Nevertheless, despite these different observational conditions and the early-stage calibration of MAJIS, the outstanding performance of the instrument is confirmed by the highly consistent geological trends and parameter ranges resolved by both sensors.
Overall, both the spatial distribution patterns and the numerical ranges of spectral parameters derived from MAJIS appear broadly consistent with those obtained from M3. This further validates the spectral integrity of MAJIS observations, even at this early stage of data analysis, and demonstrates the instrument's potential for future mineralogical mapping of the Galilean moons of Jupiter.
The MAJIS instrument onboard the JUICE mission represents a major advance in lunar hyperspectral imaging, providing high-resolution reflectance spectra. Although only a limited number of spectral cubes (C2, C3, and C4) were acquired during the lunar flyby, these data provide a valuable opportunity to investigate the spectral, mineralogical, and maturity-related properties of the lunar surface at high spatial resolution. Spectral parameters extracted from MAJIS not only reproduce well-established mineralogical trends identified by previous missions such as Chandrayaan-1/M3 and SELENE/Kaguya, but also extend the analysis into previously unexplored spectral domains.
Analyses of cubes C3 and C4 reveal significant mineralogical diversity within the mare-dominated regions of Mare Tranquillitatis and Mare Fecunditatis. Pronounced 1- and 2 µm absorption bands – particularly in C4 – indicate the dominance of pyroxene-rich basalts, consistent with previous classifications of these maria as mafic and Fe-rich. Spectral trends in C4 show a systematic shift of the 2 µm band centre towards longer wavelengths within Mare Tranquillitatis, indicative of high-Ca clinopyroxenes. However, localised craters such as Maskelyne G exhibit the opposite trend, suggesting a pigeonite-rich composition. This mineralogical variability, observed even within the same mare unit, is especially evident in fresh craters and their ejecta, which expose less weathered and compositionally distinct subsurface material.
Cube C3, covering Mare Fecunditatis, exhibits more spatially homogeneous 2 µm band centre values, consistent with a relatively uniform basaltic composition. Nevertheless, localised features such as the Messier and Messier A craters display deeper absorption bands and spectral characteristics typical of fresher material.
Analysis of spectral slope and band depth across the region demonstrates MAJIS's capability to capture variations in soil maturity. The RGB colour composite map (Fig. 12), combining slope and band depth parameters, clearly distinguishes mature highland terrains from less weathered mare regions. Fresh ejecta, such as those associated with Messier and Maskelyne G, exhibit low spectral slopes and strong absorption bands, characteristic of immature soils. However, the spectral effects of lunar space weathering are generally expected to progressively saturate on timescales of the order of ∼ 1 Gyr. Consequently, the maturity variations discussed here should primarily be interpreted in relative terms, reflecting differences in regolith evolution, exposure conditions, and resurfacing processes rather than direct absolute age differences beyond this timescale (Lucey et al., 2000b).
Scatter plots (e.g., Fig. 13a) illustrate the complex relationship between spectral slope and 1 µm band depth. Highland terrains show a strong anticorrelation between these parameters, indicating the dominant influence of space weathering. Nevertheless, because weathering-related spectral reddening and attenuation of mafic absorption bands tend to approach saturation over geological timescales, the observed correlations are unlikely to represent a simple linear progression with surface age (Lucey et al., 2000b; Noble et al., 2007). In contrast, the maria display two distinct clusters characterised by nearly constant spectral slope values (0.035 and 0.030) and increasing 1 µm band depth, reflecting variations in pyroxene abundance and/or maturity. Spectra exhibiting anomalous or negative band depth values (Fig. 13a, magenta oval) are spatially associated with highland terrains, particularly in shadowed areas, supporting the interpretation that unresolved topography and illumination geometry significantly influence apparent spectral characteristics.
Whereas previous lunar hyperspectral observations provided limited coverage and/or usability in the 2.6–5.4 µm range, MAJIS enables the investigation of potential absorption features within this spectral domain. The 2.8–3.0 µm feature is discussed in Langevin et al. (2026), this issue, and may be related to -bearing phases. A preliminary thermal correction reveals a broad feature near 4.8 µm that could be attributed to pyroxene and/or olivine, although thermal removal remains uncertain owing to degeneracy between thermal emission and reflected solar components. Despite challenges related to signal saturation and increased noise beyond 4 µm, this wavelength range holds considerable promise for future mineralogical investigations.
Comparison of MAJIS-derived spectral maps with those from M3 demonstrates excellent agreement in both spatial distribution and spectral parameter ranges. MAJIS reproduces the expected deeper band depths in mare regions and shallower features in feldspathic highlands. Similarly, 2 µm band centres derived from MAJIS follow trends consistent with Ca- and Fe-rich clinopyroxene distributions mapped by M3. This validation is particularly robust for cube C4, which was corrected for stray light and currently represents the most reliable MAJIS lunar dataset. The strong agreement with legacy datasets confirms the quality of MAJIS calibration, providing reliable spectral parameters and establishing a solid foundation for future observations of the Jovian moons.
Analysis of spectral parameters derived from MAJIS data highlights the instrument's strong potential for lunar mineralogical studies. Despite the limited spatial coverage, this dataset represents an important milestone, an in-flight assessment of MAJIS performance and the first remotely acquired hyperspectral lunar observations since Chandrayaan-1/M3 (Pieters et al., 2009), Cassini/VIMS (Bellucci et al., 2002), and the more recent Imaging Infrared Spectrometer (IIRS) onboard Chandrayaan-2 (e.g. Ojha et al., 2024).
Although preliminary, MAJIS lunar observations demonstrate the instrument's suitability for high-resolution mineralogical mapping of planetary surfaces.
The principal results of this study may be summarised as follows:
-
Validation of spectral parameters: MAJIS successfully reproduces well-established spectral trends identified by previous missions (M3, Kaguya, Clementine), including deeper 1 and 2 µm absorption bands in mafic-rich mare regions and weaker features in feldspathic highlands.
-
Mineralogical heterogeneity: Within Imbrian mare units, local variations in pyroxene composition – ranging from high-Ca clinopyroxene to pigeonite – are detected, particularly in fresh craters such as Maskelyne G.
-
Soil maturity discrimination: Variations in spectral slope and band depth effectively distinguish fresh from mature terrains, revealing clustering patterns consistent with impact gardening, space weathering processes and compositional variations.
-
Extended spectral coverage beyond 2.6 μm: MAJIS provides lunar I/F spectra up to 5 µm, revealing potential absorption bands possibly associated with mafic mineral phases, thereby opening new perspectives for future spectral investigations. Further work is required to minimise the risk of false detections arising from thermal correction uncertainties.
-
Cross-mission consistency: Comparisons with M3-derived spectral maps confirm the accuracy and complementarity of MAJIS observations, supporting its applicability to mineralogical investigations of icy moons and other planetary bodies.
Overall, the MAJIS lunar dataset constitutes a critical test of hyperspectral imaging performance and demonstrates the instrument's capability to resolve both compositional and maturity-related variations at regional scales. Its successful application to the Mare Tranquillitatis–Mare Fecunditatis region not only validates instrument performance but also provides an essential baseline ahead of MAJIS observations of the Jovian system.
Beyond delivering new spectral observations, this study highlights the broader scientific value of MAJIS for planetary surface characterisation and underscores the importance of cross-mission spectral analyses in advancing our understanding of lunar lithological diversity, magmatic evolution, and surface modification processes.
In this section, we detail the preprocessing steps applied to the MAJIS dataset:
- 1.
Saturation Filtering. We began with the calibrated MAJIS radiance cubes (Langevin et al., 2026, this issue). To avoid potential saturation artefacts, we excluded all pixels with digital number (DN) values exceeding 20 000 and ∼ 11 000 for the VIS and IR channels, respectively, in the raw VIS-NIR data after addition of the dark current.
- 2.
Thermal Emission Removal. Lunar reflectance spectra beyond ∼ 2.6 µm are significantly affected by thermal emission. We corrected this component using a simplified empirical model adapted from Lagerros (1997):
where:
-
is the observed radiance,
-
R0 is the reflected solar component,
-
ϵ is the surface emissivity,
-
ξ is the roughness parameter (ranging from 0 to 1),
-
B0(T) is the blackbody radiance given by the Planck function at temperature T (in K).
The thermal removal radiance (RTR) is obtained by subtracting the thermal emission from (Fig. A1).
-
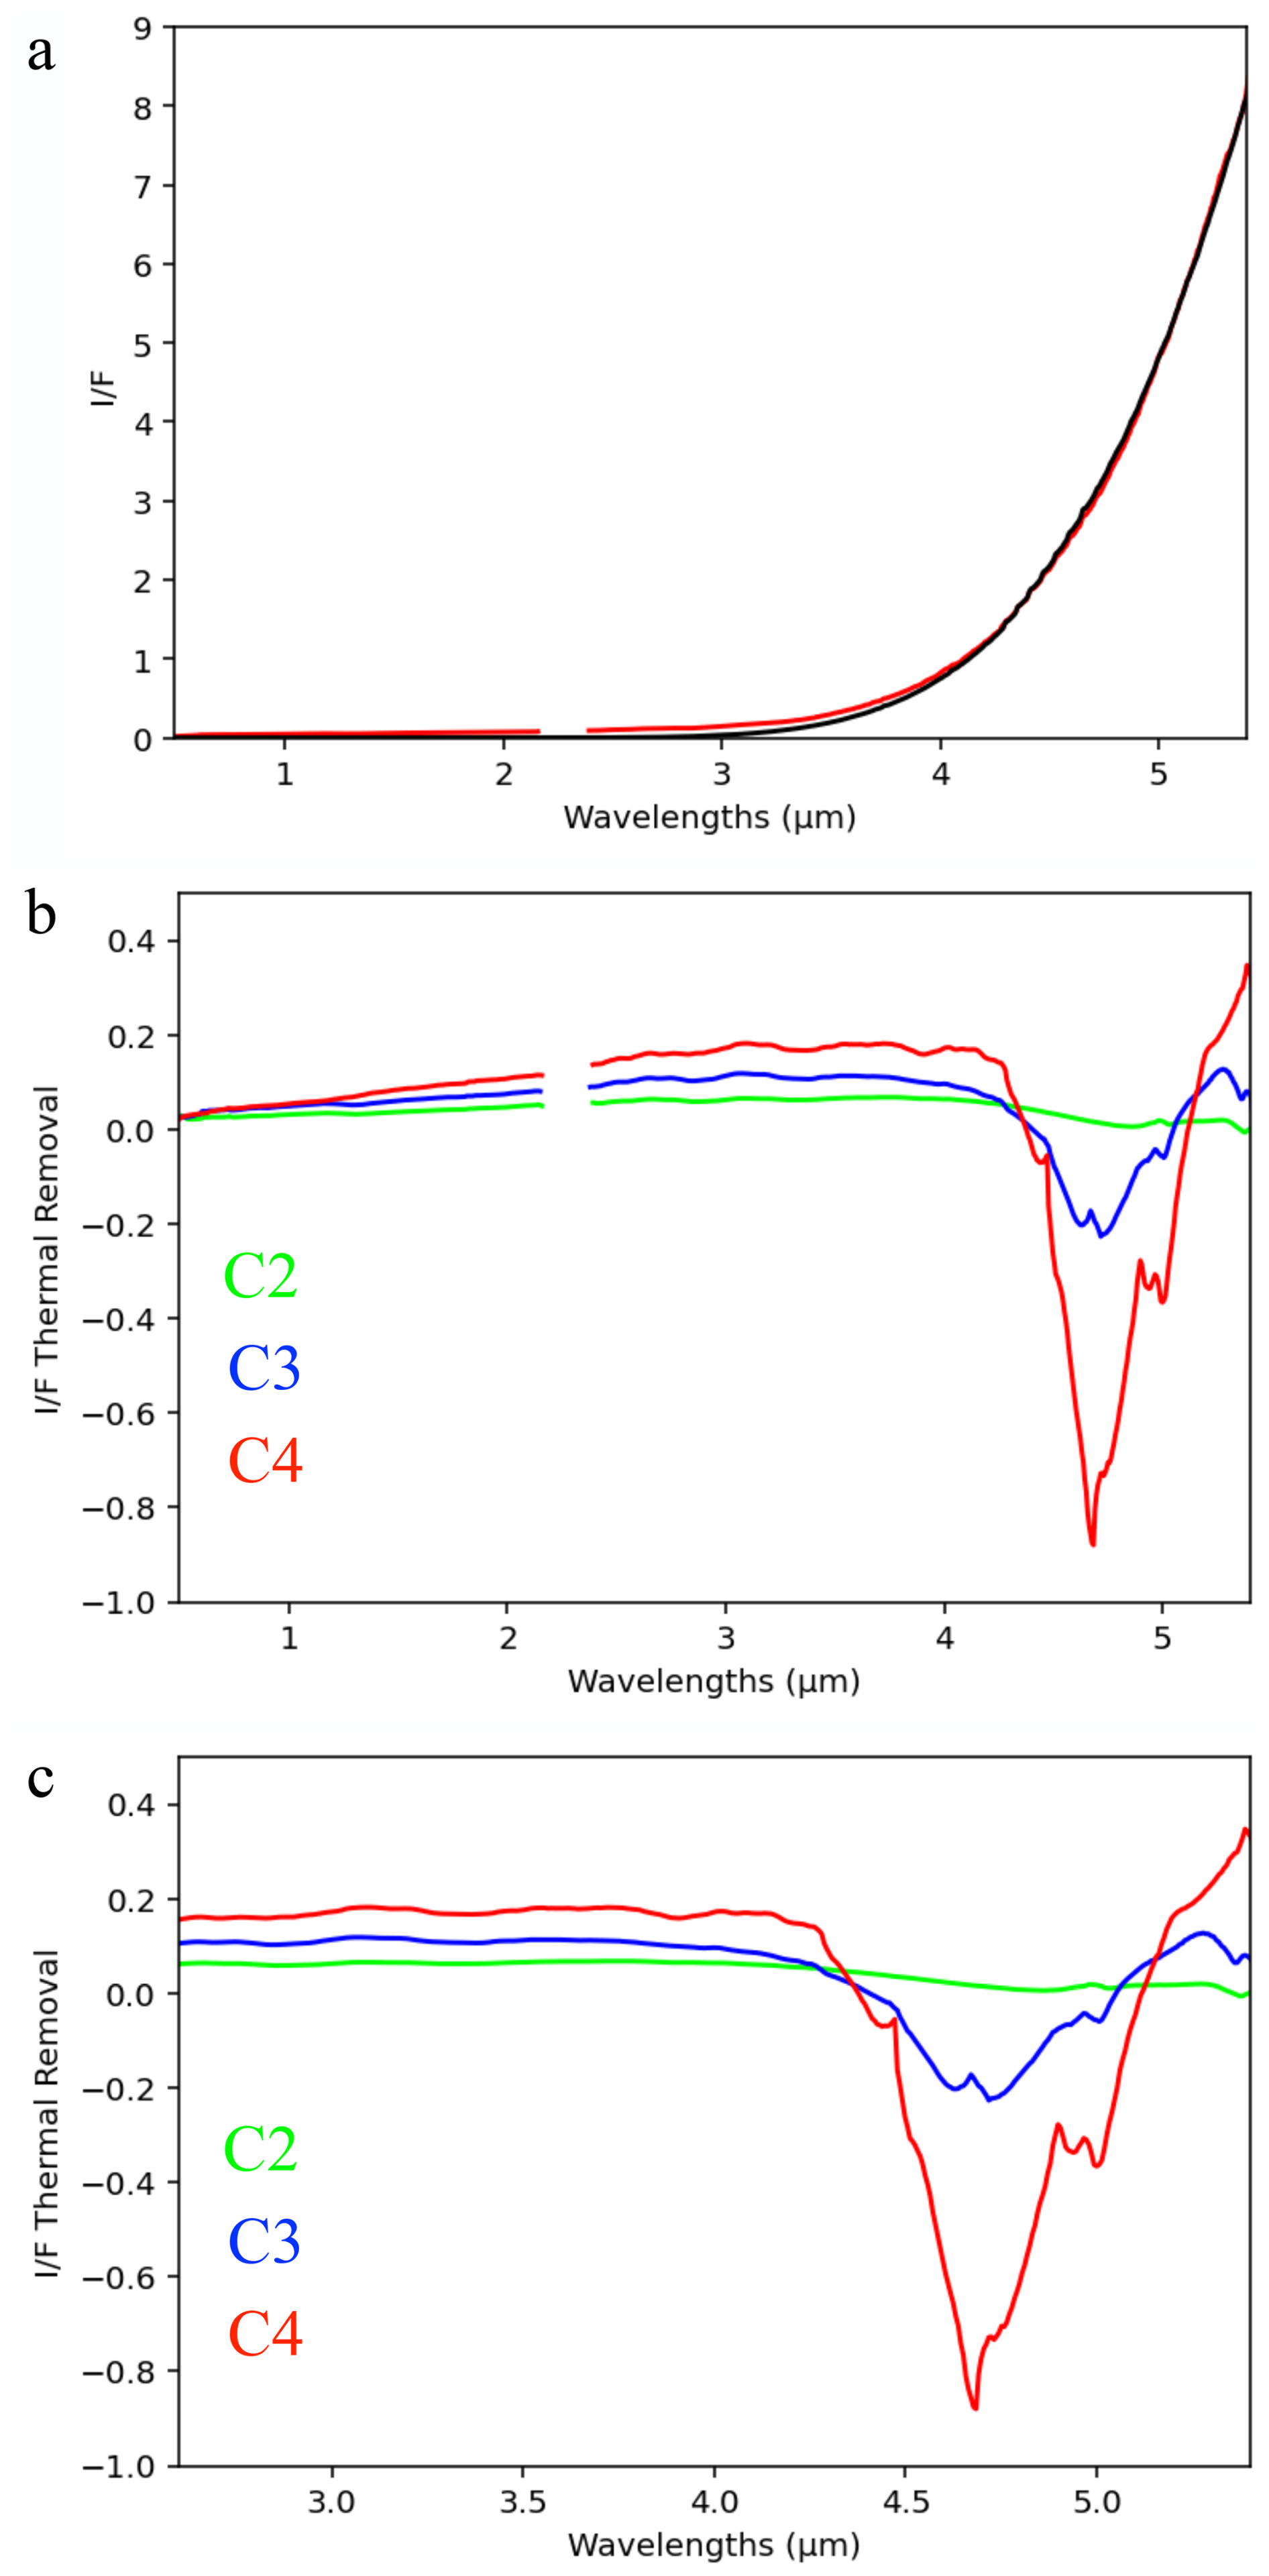
Figure A1Example of MAJIS spectra before (a) and after thermal removal (b, c). Panel (a) shows an I/F MAJIS spectrum (red) with the best-fit model (black). Panel (b) displays the MAJIS spectra after thermal removal over the entire VIS-NIR and IR range. Panel (c) provides a close-up on the IR spectral range shown in panel (b).
- 3.
Conversion to I/F. Radiance data were converted to units of calibrated radiance factor (I/F) using the MODTRAN solar irradiance spectrum (FSun, in ), resampled to the MAJIS wavelengths. The conversion was performed using the standard formula:
where:
-
I/F is the radiance factor,
-
RTR is the radiance after thermal removal,
-
FSun is the solar flux per unit wavelength at 1 AU.
We adopted initial temperature estimates (T0) from Tosi et al. (2026), this issue and explored a range of ± 15 K (ΔT = [] K) in 1 K increments. The Bayesian retrieval provides an effective radiometric temperature for each MAJIS pixel, assuming a single-temperature surface with spectrally constrained emissivity. This temperature is physically meaningful but does not explicitly account for sub-pixel anisothermality due to mutual heating between unresolved surface facets. In the formulation of Lagerros (1997), this effect is parameterised through a self-heating parameter, which redistributes thermal emission without altering the underlying radiative equilibrium. When removing thermal emission from reflectance-calibrated spectra, allowing the temperature to vary within ± 15 K around the Bayesian value compensates for self-heating effects not explicitly represented in the Bayesian inversion, rather than correcting an inaccurate temperature estimate. Emissivity (ϵ) was varied from 0.5 to 0.9, and the roughness parameter (ξ) from 0.0 to 1.0, both in steps of 0.1. For each pixel, we selected the combination of T, ϵ, and ξ that minimised the Root Mean Square (RMS) difference between the modelled and observed spectra in the thermal region. An example of thermal removal applied to a MAJIS spectrum is provided in Fig. A1. For further methodological details concerning the retrieval of surface temperature and emissivity from MAJIS data, we refer to Tosi et al. (2026), this issue.
-
- 4.
Spectral Smoothing. To reduce high-frequency noise, we applied a median filter using the medfilt function from the Python scipy.signal library with a kernel size of 7 channels (see Fig. A2). This smoothing preserves spectral features while minimising random fluctuations.
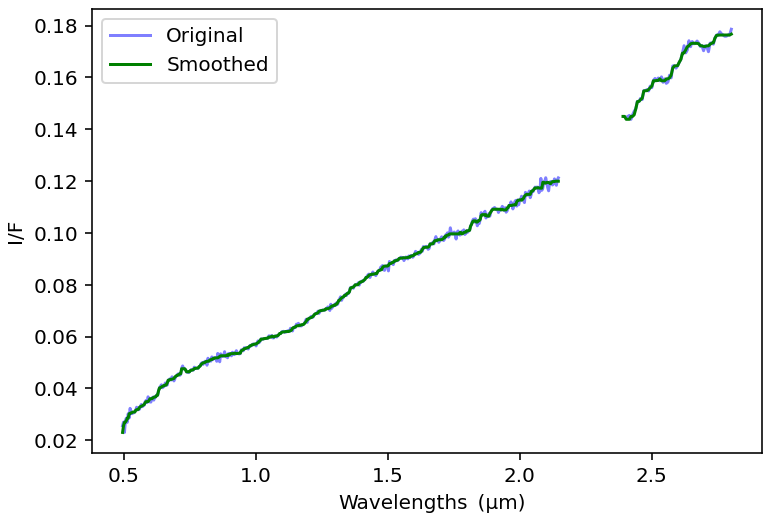
Figure A2Example of MAJIS spectra before (purple) and after (green) application of a smoothing algorithm.
Below we describe the steps undertaken to obtain the ratioed cubes:
Step 1 – Initial Ratioing and Band Depth Estimation
In the first step, the ratioed spectrum (Rats) at pixel position (x,y) was computed by dividing the reflectance spectrum at that pixel by the mean spectrum (Means), obtained by averaging all spectra at the same “sample” (x position along-slit) across the entire cube. This approach minimises flat-field artefacts and corrects for detector-related effects fixed along the slit. The ratioed data are computed as:
From this first ratioed cube (hereafter referred to as the STEP 1 cube), we computed the band depth at 1 µm (BD@1 µm) using the standard formula:
The histogram of the 1 µm band depth values from the STEP 1 cube is shown in Fig. B1 (left panel, red). The right panel shows the histogram of the REFSlope parameter, computed as the slope of the continuum between 0.75 and 1.50 µm in the unratioed reflectance cube. The two histograms exhibit a bimodal, anticorrelated distribution, distinguishing spectra from highlands and Mare Tranquillitatis terrains. Highland spectra are characterised by weak or absent 1 µm absorption features and steep red continuum slopes (> 0.055), while spectra from Mare Tranquillitatis show deeper absorption bands and flatter slopes (REFSlope < 0.05). The 1 µm band depth and 0.75–1.50 µm continuum slope are known to provide a means of discriminating between fresh or mature highland and mare materials (Le Mouélic et al., 2000, 2002). Notably, spectra with BD@1 µm < 0 – primarily from the highlands – indicate that the reference spectra used in STEP 1 (Means) themselves contain weaker absorption features than the pixel spectra, producing a negative band depth. This highlights the importance of the denominator choice in spectral ratioing.
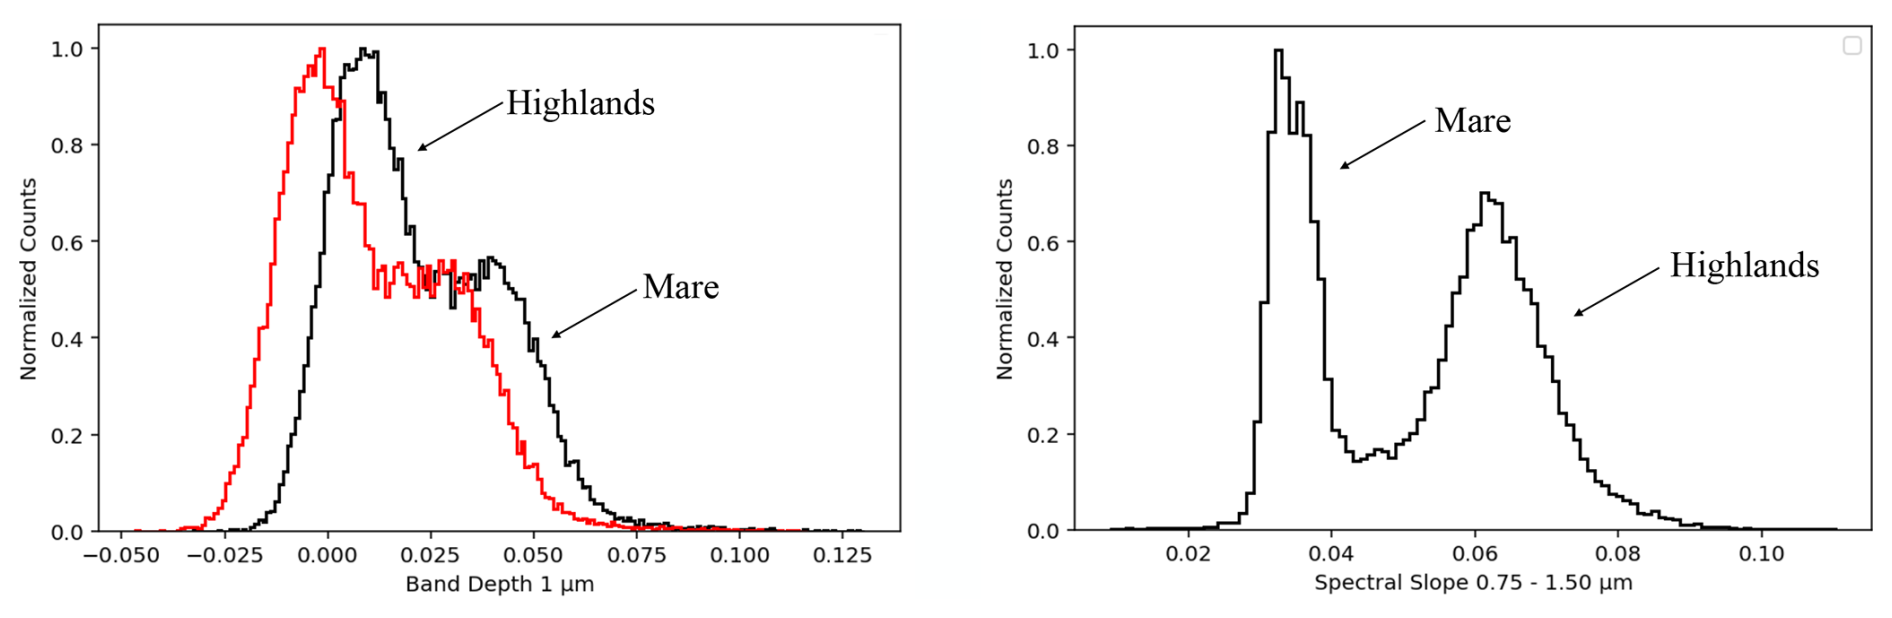
Figure B1Left Panel: Histogram of STEP 1 band depth at 1 µm in red and STEP 2 band depth at 1 µm in black. Right Panel: Histogram of REFSlope.
Step 2 – Improved Ratioing with Highland Reference
To mitigate the influence of reference spectrum selection, a second ratioing step was performed. In STEP 2, we constructed a new reference spectrum (Meanh) by averaging only those highland spectra that:
-
had negative band depth at 1 µm values from STEP 1,
-
showed REFSlope values between 0.055 and 0.07.
These spectra exhibit minimal spectral features around 1 µm and closely approximate a featureless continuum, making them suitable as a refined denominator.
The new ratioed spectrum (Rath) was computed as:
The updated band depth at 1 µm values derived from STEP 2 are shown in black in the left panel of Fig. B1. The overall distribution of band depth at 1 µm values in the STEP 2 cube is similar to that from STEP 1, but values are systematically higher, indicating a more accurate preservation of absorption band strength. Spectra that still exhibit negative BD@1 µm values in STEP 2 are discussed in Sect. 6; these arise from spectral shapes that, when ratioed against the featureless Meanh spectrum, yield a local convexity at 1 µm, producing a formal negative band depth in Eq. (B2). An averaged spectrum from this group is shown in Fig. 13b (black spectrum).
C1 Band centres and Depths
To derive band centres, we first removed the spectral continuum by dividing the reflectance spectrum by a straight line connecting the reflectance maxima (or “shoulders”) on either side of the absorption feature. The 1 µm band shoulders were defined within the ranges 0.66–0.75 µm (left shoulder) and 1.45–1.55 µm (right shoulder). For the 2 µm band, we used the same left shoulder interval (1.45–1.55 µm), while the right shoulder was defined in the 2.6–2.7 µm region, with thermal removal applied to minimise the influence of thermal emission beyond 2.5 µm and avoiding the absorption at 2.8 µm.
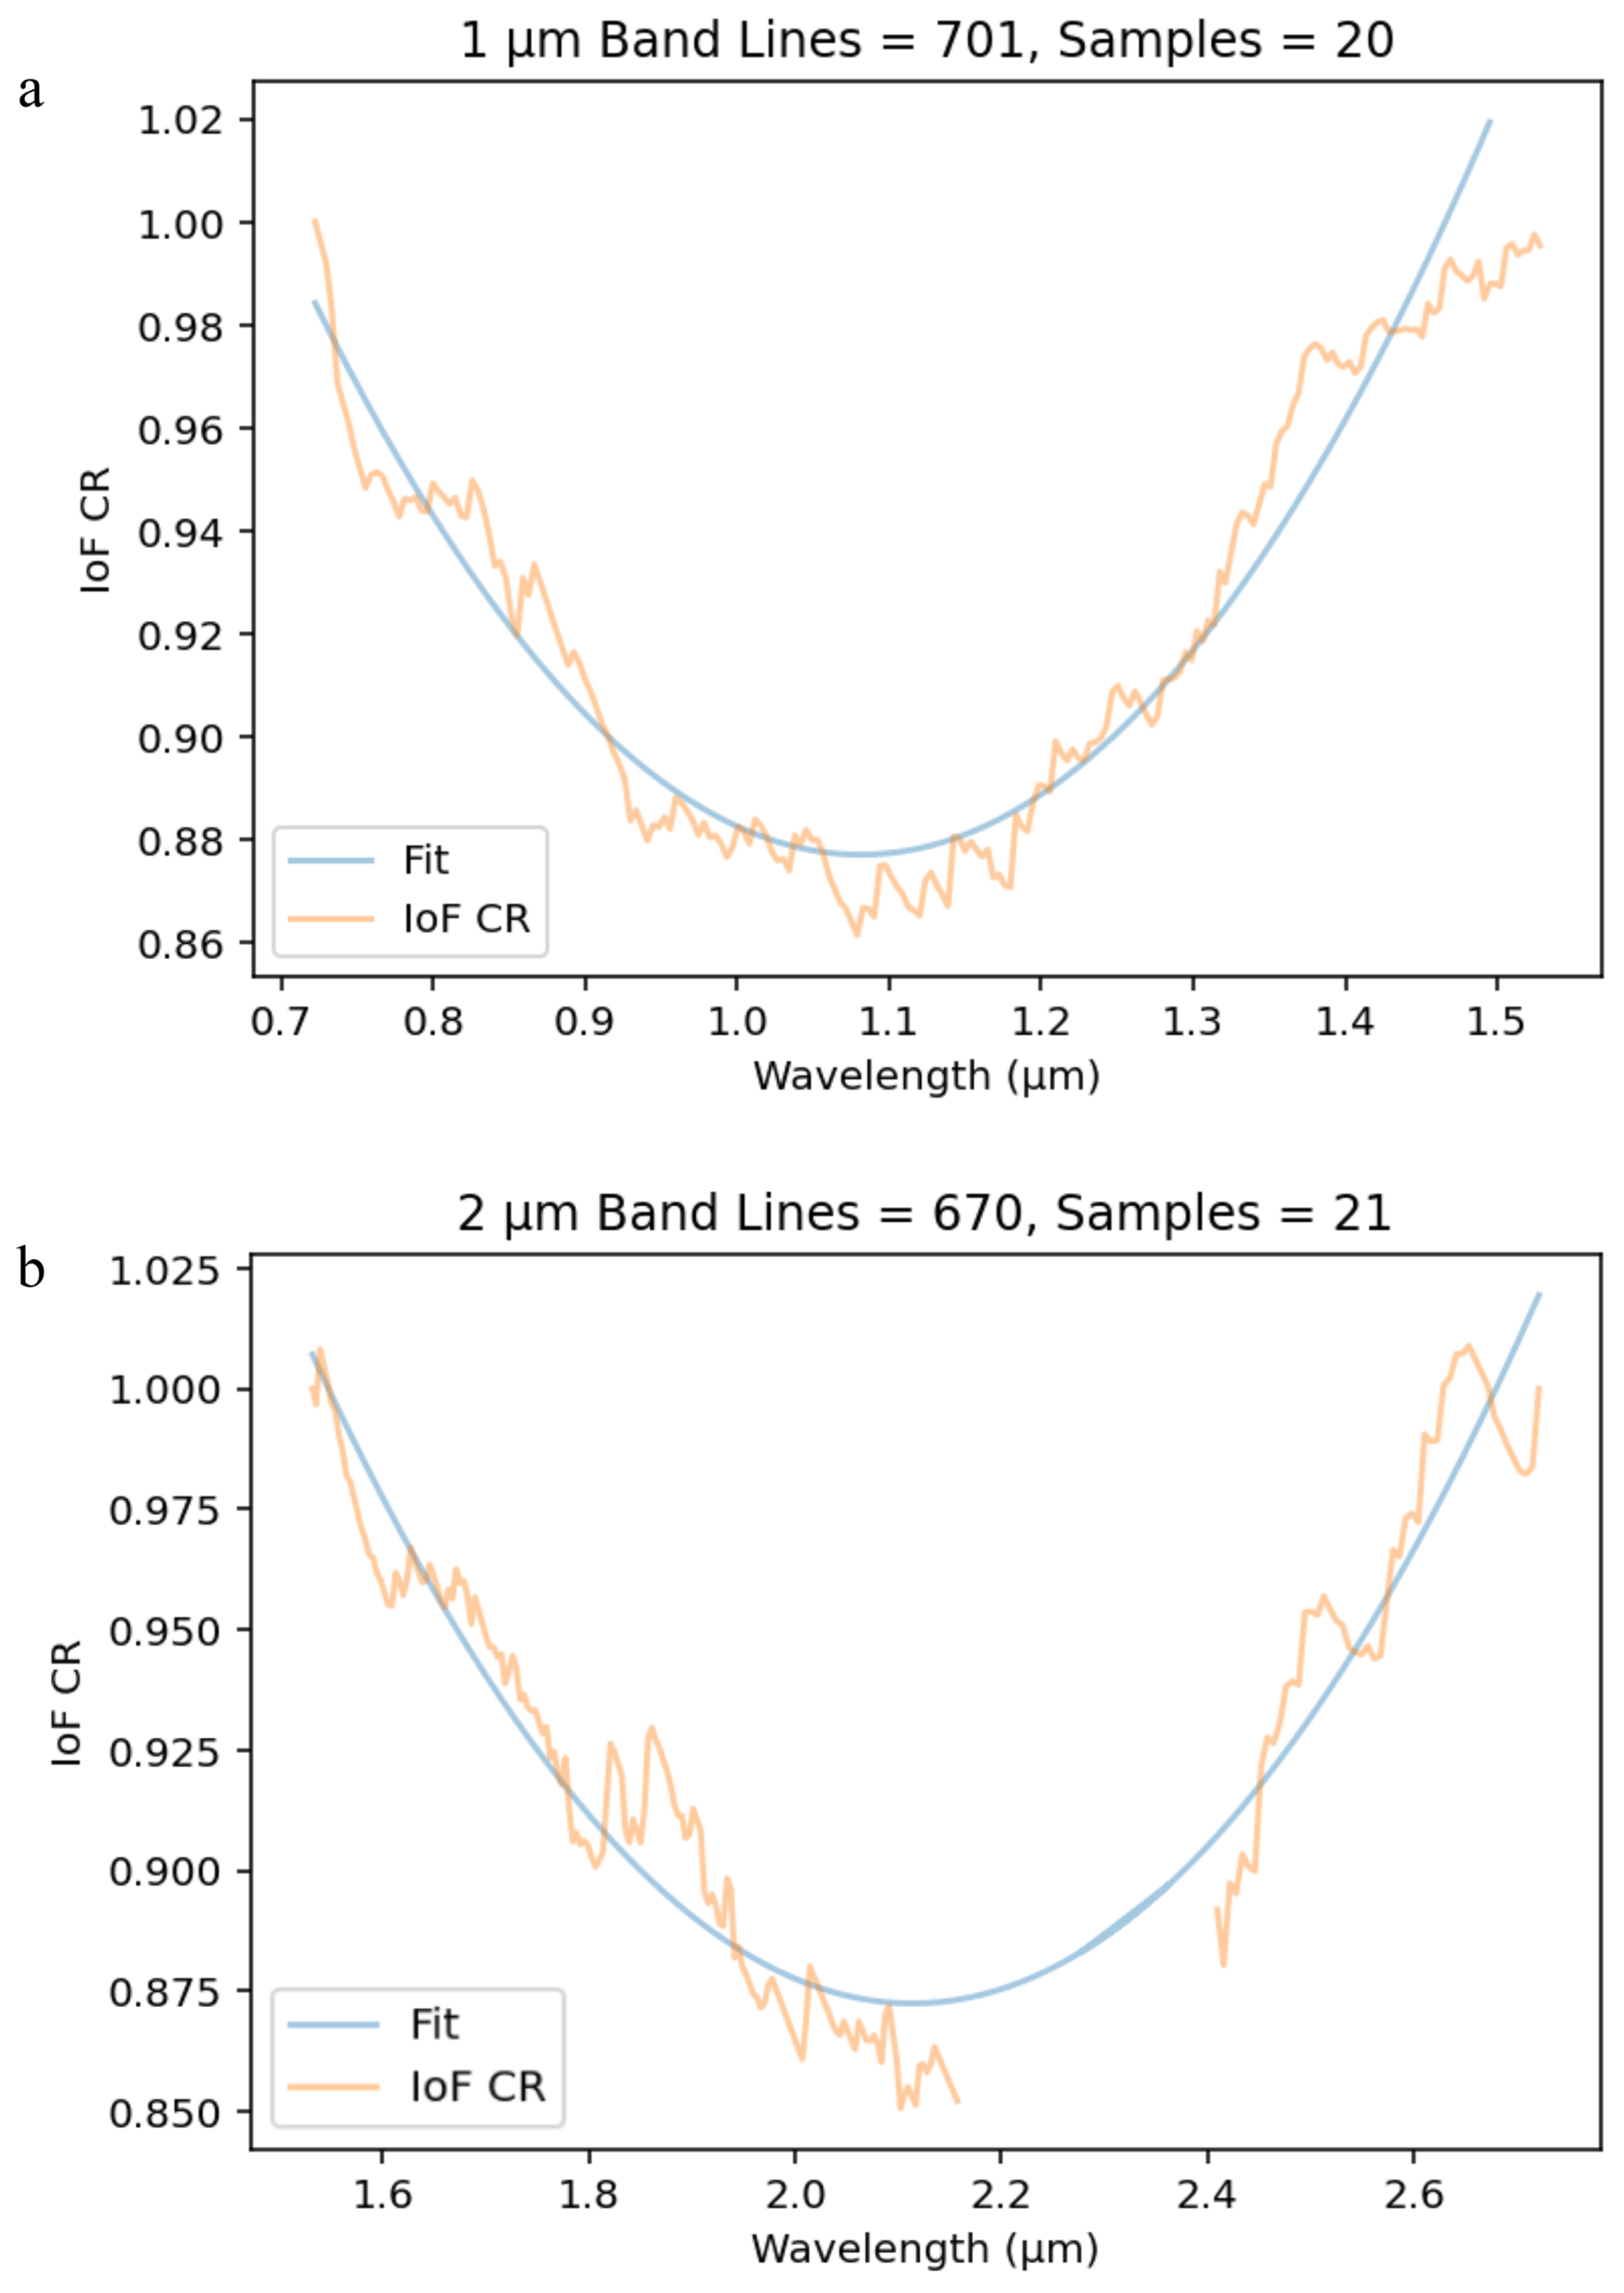
Figure C1Example of the C4 1 µm (panel a) and 2 µm (panel b) bands after continuum removal for a specific sample and line. The MAJIS spectrum is shown in orange, while the blue curve represents the second-order polynomial fit modelling the two bands.
Due to residual noise in the spectra – even after smoothing – and a data gap coinciding with the 2 µm band region, a robust modelling of both bands was required. After extensive testing, we adopted a second-order polynomial fit to model the continuum-removed absorption bands (Fig. C1). The band centre was then defined as the wavelength corresponding to the minimum of this fitted polynomial, following established approaches (Cloutis et al., 1986; Clark, 1999). Band depth was calculated following Clark and Roush (1984), using continuum-removed reflectance spectra.
The Python and IDL codes used to retrieve thermal removal and spectral parameters are direct implementations of published methods. These scripts were developed independently by specific authors (FZ and FA) for internal research purposes, are not publicly released, and may be shared on a case-by-case basis upon justified request.
MAJIS calibrated data acquired during the JUICE Moon–Earth flyby in August 2024 are available through the following Guest Storage Facility: European Space Agency, 2026, ESA-JUICE_LEGA-Special-Issue_v1.0, https://doi.org/10.57780/esa-2bb387d (Noschese, 2026).
FZ and FA carried out data analysis. FZ prepared the manuscript with major contributions from FA, FP, FT, GP, MCDS, SLM. YL, CR and OK contributed to the discussion of results. AM and CC revised the manuscript. FP and GP are, respectively the PI and Co-PI of the MAJIS instrument. All authors have read and approved the manuscript.
The contact author has declared that none of the authors has any competing interests.
Publisher's note: Copernicus Publications remains neutral with regard to jurisdictional claims made in the text, published maps, institutional affiliations, or any other geographical representation in this paper. The authors bear the ultimate responsibility for providing appropriate place names. Views expressed in the text are those of the authors and do not necessarily reflect the views of the publisher.
This article is part of the special issue “The first-ever lunar–Earth flyby: a unique test environment for Juice”. It is not associated with a conference.
The authors wish to thank ESA teams from SOC, MOC and ESTEC, as well as Airbus Defence and Space for their technical and operational support to the MAJIS project. JUICE is a mission under ESA leadership with contributions from its Member States, NASA, JAXA and the Israel Space Agency. It is the first Large-class mission in ESA's Cosmic Vision programme.
FZ, GP, FA, FT, MCDS, AM and CC acknowledge support from the Italian Space Agency (ASI), implementation agreement ASI–INAF n. 2023-6-HH.0. CR, FP and YL acknowledge support from the Centre National d'Études Spatiales (CNES), contract CNES–CNRS no. 180 117, France (ROR: https://ror.org/04h1h0y33, last access: 18 June 2026), within the framework of the JUICE space mission.
This paper was edited by Stephanie C. Werner and reviewed by Benjamin Bultel and one anonymous referee.
Adams, J. B.: Visible and near-infrared diffuse reflectance spectra of pyroxenes as applied to remote sensing of solid objects in the solar system, J. Geophys. Res., 79, 4829–4836, https://doi.org/10.1029/JB079i032p04829, 1974. a
Bellucci, G., Brown, R. H., Formisano, V., Baines, K. H., Bibring, J.-P., Buratti, B. J., Capaccioni, F., Cerroni, P., Clark, R. N., Coradini, A., Cruikshank, D. P., Drossart, P., Jaumann, R., Langevin, Y., Matson, D. L., McCord, T. B., Mennella, V., Miller, E., Nelson, R. M., Nicholson, P. D., Sicardy, B., and Sotin, C.: Cassini/VIMS observations of the Moon, Adv. Space Res., 30, 1889–1894, https://doi.org/10.1016/S0273-1177(02)00484-2, 2002. a
Besse, S., Sunshine, J., Staid, M., Boardman, J., Pieters, C., Guasqui, P., Malaret, E., McLaughlin, S., Yokota, Y., and Li, J.-Y.: A visible and near-infrared photometric correction for Moon Mineralogy Mapper (M3), Icarus, 222, 229–242, https://doi.org/10.1016/j.icarus.2012.10.036, 2013. a, b
Bhatt, H., Chauhan, P., and Solanki, P.: Compositional mapping and the evolutionary history of Mare Tranquillitatis, J. Earth Syst. Sci., 129, 45, https://doi.org/10.1007/s12040-019-1302-7, 2020. a
Boardman, J. W., Pieters, C. M., Green, R. O., Lundeen, S. R., Varanasi, P., Nettles, J., Petro, N., Isaacson, P., Besse, S., and Taylor, L. A.: Measuring moonlight: An overview of the spatial properties, lunar coverage, selenolocation, and related Level 1B products of the Moon Mineralogy Mapper, J. Geophys. Res.-Planet., 116, E00G14, https://doi.org/10.1029/2010JE003730, 2011. a
Burns, R.: Mineralogical Applications of Crystal Field Theory, Second Edition, Cambridge University Press, https://doi.org/10.1017/CBO9780511524899, 1993. a, b, c
Clark, R. N.: Spectral properties of mixtures of montmorillonite and dark grains - Implications for remote sensing minerals containing chemically and physically adsorbed water, J. Geophys. Res., 88, 10635–10644, https://doi.org/10.1029/JB088iB12p10635, 1983. a
Clark, R. N.: Spectroscopy of Rocks and Minerals, and Principles of Spectroscopy, in: Manual of Remote Sensing, Vol. 3, Remote Sensing for the Earth Sciences, edited by Rencz, A. N., John Wiley & Sons, New York, 3–58, ISBN 978-0-471-29405-4, 1999. a, b, c, d
Clark, R. N. and Roush, T. L.: Reflectance spectroscopy: Quantitative analysis techniques for remote sensing applications, J. Geophys. Res., 89, 6329–6340, https://doi.org/10.1029/JB089iB07p06329, 1984. a
Cloutis, E. A., Gaffey, M. J., Jackowski, T. L., and Reed, K. L.: Calibrations of phase abundance, composition, and particle size distribution for olivine-orthopyroxene mixtures from reflectance spectra, J. Geophys. Res., 91, 641–653, https://doi.org/10.1029/JB091iB11p11641, 1986. a, b
Cloutis, E. A., Sunshine, J. M., and Morris, R. V.: Spectral reflectance-compositional properties of spinels and chromites: Implications for planetary remote sensing and geothermometry, Meteorit. Planet. Sci., 39, 545–565, https://doi.org/10.1111/j.1945-5100.2004.tb00918.x, 2004. a
Cloutis, E. A., Izawa, M. R. M., Pompilio, L., Reddy, V., Hiesinger, H., Nathues, A., Mann, P. J., Le Corre, L., Palomba, E., and Bell, J. F.: Spectral reflectance properties of HED meteorites + CM2 carbonaceous chondrites: Comparison to HED grain size and compositional variations and implications for the nature of low-albedo features on Asteroid 4 Vesta, Icarus, 223, 850–877, https://doi.org/10.1016/j.icarus.2013.02.003, 2013. a
Cuzzi, J., Clark, R., Filacchione, G., French, R., Johnson, R., Marouf, E., and Spilker, L.: Ring Particle Composition and Size Distribution, in: Saturn from Cassini-Huygens, edited by Dougherty, M. K., Esposito, L. W., and Krimigis, S. M., Springer, Dordrecht, pp. 459–529, https://doi.org/10.1007/978-1-4020-9217-6_15, 2009. a
D'Aversa, E., Oliva, F., Piccioni, G., Poulet, F., Kolmašová, I., Seignovert, B., Migliorini, A., Filacchione, G., Fletcher, L., Mura, A., Langevin, Y., Grassi, D., Rodriguez, S., Tosi, F., Ligier, N., Sindoni, G., Giardino, M., and Plainaki, C.: Spectroscopic detection of terrestrial lightning from space by JUICE-MAJIS during Earth Gravity Assist, Ann. Geophys., 44, 435–460, https://doi.org/10.5194/angeo-44-435-2026, 2026. a
Donaldson Hanna, K. L., Cheek, L. C., Pieters, C. M., Mustard, J. F., Greenhagen, B. T., Thomas, I. R., and Bowles, N. E.: Global assessment of pure crystalline plagioclase across the Moon and implications for the evolution of the primary crust, J. Geophys. Res.-Planet., 119, 1516–1545, https://doi.org/10.1002/2013JE004476, 2014. a
Du, W. and Yang, J.: The Moon's Early Magmatic Activities: From the Perspective of Lunar Alkali-Suite and Mg-Suite Samples, Space: Science and Technology, 4, 0118, https://doi.org/10.34133/space.0118, 2024. a
Filacchione, G., Capaccioni, F., Ciarniello, M., Clark, R. N., Cuzzi, J. N., Nicholson, P. D., Cruikshank, D. P., Hedman, M. M., Buratti, B. J., Lunine, J. I., Soderblom, L. A., Tosi, F., Cerroni, P., Brown, R. H., McCord, T. B., Jaumann, R., Stephan, K., Baines, K. H., and Flamini, E.: Saturn's icy satellites and rings investigated by Cassini–VIMS: III – Radial compositional variability, Icarus, 320, 1064–1096, https://doi.org/10.1016/j.icarus.2012.06.040, 2012. a
Fortezzo, C. M., Spudis, P. D., and Harrel, S. L.: Release of the Digital Unified Global Geologic Map of the Moon at -Scale, in: 51st Annual Lunar and Planetary Science Conference, Lunar and Planetary Science Conference, p. 2760, https://www.hou.usra.edu/meetings/lpsc2020/pdf/2760.pdf (last access: 27 September 2026), 2020. a, b
Gillis, J. J., Jolliff, B. L., and Elphic, R. C.: A revised algorithm for calculating TiO2 from Clementine UVVIS data: A synthesis of rock, soil, and remotely sensed TiO2 concentrations, J. Geophys. Res.-Planet., 108, 5009, https://doi.org/10.1029/2001JE001515, 2003. a
Green, R. O., Pieters, C., Mouroulis, P., Eastwood, M., Boardman, J., Glavich, T., Isaacson, P., Annadurai, M., Besse, S., Barr, D., Buratti, B., Cate, D., Chatterjee, A., Clark, R., Cheek, L., Combe, J., Dhingra, D., Essandoh, V., Geier, S., Goswami, J. N., Green, R., Haemmerle, V., Head, J., Hovland, L., Hyman, S., Klima, R., Koch, T., Kramer, G., Kumar, A. S. K., Lee, K., Lundeen, S., Malaret, E., McCord, T., McLaughlin, S., Mustard, J., Nettles, J., Petro, N., Plourde, K., Racho, C., Rodriquez, J., Runyon, C., Sellar, G., Smith, C., Sobel, H., Staid, M., Sunshine, J., Taylor, L., Thaisen, K., Tompkins, S., Tseng, H., Vane, G., Varanasi, P., White, M., and Wilson, D.: The Moon Mineralogy Mapper (M3) imaging spectrometer for lunar science: Instrument description, calibration, on-orbit measurements, science data calibration and on-orbit validation, J. Geophys. Res.-Planet., 116, E00G19, https://doi.org/10.1029/2011JE003797, 2011. a
Greenhagen, B. T., Lucey, P. G., Wyatt, M. B., Glotch, T. D., Allen, C. C., Arnold, J. A., Bandfield, J. L., Bowles, N. E., Hanna, K. L. D., Hayne, P. O., Song, E., Thomas, I. R., and Paige, D. A.: Global Silicate Mineralogy of the Moon from the Diviner Lunar Radiometer, Science, 329, 1507, https://doi.org/10.1126/science.1192196, 2010. a
Hapke, B.: Space weathering from Mercury to the asteroid belt, J. Geophys. Res., 106, 10039–10074, https://doi.org/10.1029/2000JE001338, 2001. a, b
Hawke, B. R., Blewett, D. T., Lucey, P. G., Smith, G. A., Bell, J. F., Campbell, B. A., and Robinson, M. S.: The origin of lunar crater rays, Icarus, 170, 1–16, https://doi.org/10.1016/j.icarus.2004.02.013, 2004. a
Head, J. W., Wilson, L., Hiesinger, H., van der Bogert, C., Chen, Y., Dickson, J. L., Gaddis, L. R., Haruyama, J., Jawin, E. R., Jozwiak, L. M., Li, C., Liu, J., Morota, T., Needham, D. H., Ostrach, L. R., Pieters, C. M., Prissel, T. C., Qian, Y., Qiao, L., Rutherford, M. R., Scott, D. R., Whitten, J. L., Xiao, L., Zhang, F., and Ouyang, Z.: Lunar Mare Basaltic Volcanism: Volcanic Features and Emplacement Processes, Rev. Mineral. Geochem., 89, 453–507, https://doi.org/10.1515/9781501519895-014, 2023. a
Hicks, M. D., Buratti, B. J., Nettles, J., Staid, M., Sunshine, J., Pieters, C. M., Besse, S., and Boardman, J.: A photometric function for analysis of lunar images in the visual and infrared based on Moon Mineralogy Mapper observations, J. Geophys. Res.-Planet., 116, E00G15, https://doi.org/10.1029/2010JE003733, 2011. a
Hiesinger, H., Jaumann, R., Neukam, G., and Head, J. W.: Ages of mare basalts on the lunar nearside, J. Geophys. Res., 105, 29239–29276, https://doi.org/10.1029/2000JE001244, 2000. a
Kieffer, H. H. and Stone, T. C.: The Spectral Irradiance of the Moon, Astron. J., 129, 2887, https://doi.org/10.1086/430185, 2005. a
Klima, R. L., Pieters, C. M., and Dyar, M. D.: Spectroscopy of synthetic Mg-Fe pyroxenes I: Spin-allowed and spin-forbidden crystal field bands in the visible and near-infrared, Meteorit. Planet. Sci., 42, 235–253, https://doi.org/10.1111/j.1945-5100.2007.tb00230.x, 2007. a, b
Klima, R. L., Dyar, M. D., and Pieters, C. M.: Near-infrared spectra of clinopyroxenes: Effects of calcium content and crystal structure, Meteorit. Planet. Sci., 46, 379–395, https://doi.org/10.1111/j.1945-5100.2010.01158.x, 2011. a, b
Kremer, C. H., Mustard, J. F., and Pieters, C. M.: Cross-Over Infrared Spectroscopy: A New Tool for the Remote Determination of Olivine Composition, Geophys. Res. Lett., 47, e89151, https://doi.org/10.1029/2020GL089151, 2020. a
Lagerros, J. S. V.: Thermal physics of asteroids. III. Irregular shapes and albedo variegations, Astron. Astrophys., 325, 1226–1236, 1997. a, b
Langevin, Y., Poulet, F., Piccioni, G., Filacchione, G., Dumesnil, C., Tosi, F., Carter, J., Barbis, A., Haffoud, P., Tommasi, L., Vincendon, M., De Angelis, S., Guerri, I., Pilorget, C., Rodriguez, S., Stefani, S., Bolsée, D., Cisneros, M., Van Laeken, L., Pereira, N., and Carapelle, A.: Calibration of MAJIS (Moons and Jupiter Imaging Spectrometer). IV. Radiometric calibration (invited), Rev. Sci. Instrum., 95, 111301, https://doi.org/10.1063/5.0202702, 2024. a, b
Langevin, Y., Rodriguez, S., Guerlet, S., Poulet, F., Piccioni, G., Agostini, L., Armante, R., D'Aversa, E., Filacchione, G., Fletcher, L., Oliva, F., Royer, C., Seignovert, B., Stephan, K., Tosi, F., and Trent, T.: Post launch spectral and radiometric performances of MAJIS, the VIS-NIR imaging spectrometer of JUICE, Ann. Geophys., 44, 825–853, https://doi.org/10.5194/angeo-44-825-2026, 2026. a, b, c, d, e, f, g
Le Mouélic, S., Langevin, Y., Erard, S., Pinet, P., Chevrel, S., and Daydou, Y.: Discrimination between maturity and composition of lunar soils from integrated Clementine UV-visible/near-infrared data: Application to the Aristarchus Plateau, J. Geophys. Res., 105, 9445–9456, https://doi.org/10.1029/1999JE001196, 2000. a, b, c
Le Mouélic, S., Lucey, P. G., Langevin, Y., and Hawke, B. R.: Calculating iron contents of lunar highland materials surrounding Tycho crater from integrated Clementine UV-visible and near-infrared data, J. Geophys. Res.-Planet., 107, 5074, https://doi.org/10.1029/2000JE001484, 2002. a, b
Lemelin, M., Lucey, P. G., Miljković, K., Gaddis, L. R., Hare, T., and Ohtake, M.: The compositions of the lunar crust and upper mantle: Spectral analysis of the inner rings of lunar impact basins, Planet. Space Sci., 165, 230–243, https://doi.org/10.1016/j.pss.2018.10.003, 2019. a
Lucey, P.: Understanding the Lunar Surface and Space-Moon Interactions, Rev. Mineral. Geochem., 60, 83–219, https://doi.org/10.2138/rmg.2006.60.2, 2006. a
Lucey, P. G., Taylor, G. J., and Malaret, E.: Abundance and Distribution of Iron on the Moon, Science, 268, 1150–1153, https://doi.org/10.1126/science.268.5214.1150, 1995. a, b
Lucey, P. G., Blewett, D. T., and Hawke, B. R.: Mapping the FeO and TiO2 content of the lunar surface with multispectral imagery, J. Geophys. Res., 103, 3679, https://doi.org/10.1029/97JE03019, 1998. a
Lucey, P. G., Blewett, D. T., and Jolliff, B. L.: Lunar iron and titanium abundance algorithms based on final processing of Clementine ultraviolet-visible images, J. Geophys. Res., 105, 20297–20306, https://doi.org/10.1029/1999JE001117, 2000a. a
Lucey, P. G., Blewett, D. T., Taylor, G. J., and Hawke, B. R.: Imaging of lunar surface maturity, J. Geophys. Res., 105, 20377–20386, https://doi.org/10.1029/1999JE001110, 2000b. a, b, c
McEwen, A. S., Robinson, M. S., Eliason, E. M., Lucey, P. G., Duxbury, T. C., and Spudis, P. D.: Clementine Observations of the Aristarchus Region of the Moon, Science, 266, 1858–1862, https://doi.org/10.1126/science.266.5192.1858, 1994. a
Moriarty, D. P. and Pieters, C. M.: Complexities in pyroxene compositions derived from absorption band centers: Examples from Apollo samples, HED meteorites, synthetic pure pyroxenes, and remote sensing data, Meteorit. Planet. Sci., 51, 207–234, https://doi.org/10.1111/maps.12588, 2016. a
Moroz, L., Schade, U., and Wasch, R.: Reflectance spectra of olivine-orthopyroxene-bearing assemblages at decreased temperatures: Implications for remote sensing of asteroids, Icarus, 147, 79–93, https://doi.org/10.1006/icar.2000.6430, 2000. a
Mustard, J. F., Murchie, S. L., Pelkey, S. M., Ehlmann, B. L., Milliken, R. E., Grant, J. A., Bibring, J.-P., Poulet, F., Bishop, J., Dobrea, E. N., Roach, L., Seelos, F., Arvidson, R. E., Wiseman, S., Green, R., Hash, C., Humm, D., Malaret, E., McGovern, J. A., Seelos, K., Clancy, T., Clark, R., Marais, D. D., Izenberg, N., Knudson, A., Langevin, Y., Martin, T., McGuire, P., Morris, R., Robinson, M., Roush, T., Smith, M., Swayze, G., Taylor, H., Titus, T., and Wolff, M.: Hydrated silicate minerals on Mars observed by the Mars Reconnaissance Orbiter CRISM instrument, Nature, 454, 305–309, https://doi.org/10.1038/nature07097, 2008. a
Mustard, J. F., Pieters, C. M., Isaacson, P. J., Head, J. W., Besse, S., Clark, R. N., Klima, R. L., Petro, N. E., Staid, M. I., Sunshine, J. M., Runyon, C. J., and Tompkins, S.: Compositional diversity and geologic insights of the Aristarchus crater from Moon Mineralogy Mapper data, J. Geophys. Res.-Planet., 116, E00G12, https://doi.org/10.1029/2010JE003726, 2011. a, b
Narendranath, S., Pillai, N. S., Bhatt, M., Vadodariya, K., Vatedka, R., Tadepalli, S. P., Sarwade, A., Tyagi, A., and Sharan, V.: Lunar elemental abundances as derived from Chandrayaan-2, Icarus, 410, 115898, https://doi.org/10.1016/j.icarus.2023.115898, 2024. a
Noble, S. K. and Pieters, C. M.: Space Weathering on Mercury: Implications for Remote Sensing, Solar Syst. Res.+, 37, 31–35, https://doi.org/10.1023/A:1022395605024, 2003. a, b, c
Noble, S. K., Pieters, C. M., Taylor, L. A., Morris, R. V., Allen, C. C., McKay, D. S., and Keller, L. P.: The optical properties of the finest fraction of lunar soil: Implications for space weathering, Meteorit. Planet. Sci., 36, 31–42, https://doi.org/10.1111/j.1945-5100.2001.tb01808.x, 2001. a
Noble, S. K., Pieters, C. M., and Keller, L. P.: An experimental approach to understanding the optical effects of space weathering, Icarus, 192, 629–642, https://doi.org/10.1016/j.icarus.2007.07.021, 2007. a, b
Noschese, R.: JUICE Moon–Earth flyby Guest Storage Facility, ESA-JUICE_LEGA-Special-Issue_v1.0, European Space Agency [data set], https://doi.org/10.57780/esa-2bb387d, 2026. a
Ohtake, M., Haruyama, J., Matsunaga, T., Yokota, Y., Morota, T., Honda, C., and LISM team: Performance and scientific objectives of the SELENE (KAGUYA) Multiband Imager, Earth Planets Space, 60, 257–264, https://doi.org/10.1186/BF03352789, 2008. a, b
Ohtake, M., Matsunaga, T., Haruyama, J., Yokota, Y., Morota, T., Honda, C., Ogawa, Y., Torii, M., Miyamoto, H., Arai, T., Hirata, N., Iwasaki, A., Nakamura, R., Hiroi, T., Sugihara, T., Takeda, H., Otake, H., Pieters, C. M., Saiki, K., Kitazato, K., Abe, M., Asada, N., Demura, H., Yamaguchi, Y., Sasaki, S., Kodama, S., Terazono, J., Shirao, M., Yamaji, A., Minami, S., Akiyama, H., and Josset, J.-L.: The global distribution of pure anorthosite on the Moon, Nature, 461, 236–240, https://doi.org/10.1038/nature08317, 2009. a, b
Ojha, S. P., Dagar, A. K., Vikram, K. V. N. G., Bhattacharya, S., Bhattacharya, B. K., and Kumar, A. S. K.: Simultaneous physical retrieval of daytime lunar surface temperature and spectral emissivity in the 3–5 µm range from Chandrayaan-2 IIRS observations, Curr. Sci. India, 126, https://doi.org/10.18520/cs/v126/i7/781-790, 2024. a
Oliva, F., D'Aversa, E., Migliorini, A., Piccioni, G., Poulet, F., Langevin, Y., Filacchione, G., Ciarniello, M., Rodriguez, S., Seignovert, B., Mura, A., Fletcher, L. N., Guerlet, S., Zinzi, A., Giardino, M., Lopinto, E., Sindoni, G., and Plainaki, C.: JUICE-MAJIS Earth observations during the 2024 gravity assist: first analysis and comparison with PRISMA data, Ann. Geophys., 44, 511–545, https://doi.org/10.5194/angeo-44-511-2026, 2026. a
Pieters, C. M. and Englert, P. A. J. (Eds.): Remote Geochemical Analysis: Elemental and Mineralogical Composition, Cambridge University Press, Cambridge, ISBN 0-521-40281-6, 1993. a
Pieters, C. M. and Noble, S. K.: Space weathering on airless bodies, J. Geophys. Res.-Planet., 121, 1865–1884, https://doi.org/10.1002/2016JE005128, 2016. a, b, c, d
Pieters, C. M., Taylor, L. A., Noble, S. K., Keller, L. P., Hapke, B., Morris, R. V., Allen, C. C., McKay, D. S., and Wentworth, S.: Space weathering on airless bodies: Resolving a mystery with lunar samples, Meteorit. Planet. Sci., 35, 1101–1107, https://doi.org/10.1111/j.1945-5100.2000.tb01496.x, 2000. a, b
Pieters, C. M., Boardman, J., Buratti, B., Chatterjee, A., Clark, R., Glavich, T., Green, R., Head, J., Isaacson, P., Malaret, E., McCord, T., Mustard, J., Petro, N., Runyon, C., Staid, M., Sunshine, J., Taylor, L., Tompkins, S., Varanasi, P., and White, M.: The Moon Mineralogy Mapper (M3) on Chandrayaan-1, Curr. Sci. India, 96, 500–505, 2009. a, b, c
Poulet, F., Bibring, J.-P., Mustard, J. F., Gendrin, A., Mangold, N., Langevin, Y., Arvidson, R. E., Gondet, B., and Gomez, C.: Phyllosilicates on Mars and implications for early martian climate, Nature, 438, 623–627, https://doi.org/10.1038/nature04274, 2005. a
Poulet, F., Piccioni, G., Langevin, Y., Dumesnil, C., Tommasi, L., Carlier, V., Filacchione, G., Amoroso, M., Arondel, A., D'Aversa, E., Barbis, A., Bini, A., Bolsée, D., Bousquet, P., Caprini, C., Carter, J., Dubois, J.-P., Condamin, M., Couturier, S., Dassas, K., Dexet, M., Fletcher, L., Grassi, D., Guerri, I., Haffoud, P., Larigauderie, C., Le Du, M., Mugnuolo, R., Pilato, G., Rossi, M., Stefani, S., Tosi, F., Vincendon, M., Zambelli, M., Arnold, G., Bibring, J.-P., Biondi, D., Boccaccini, A., Brunetto, R., Carapelle, A., Cisneros González, M., Hannou, C., Karatekin, O., Le Cle'ch, J.-C., Leyrat, C., Migliorini, A., Nathues, A., Rodriguez, S., Saggin, B., Sanchez-Lavega, A., Schmitt, B., Seignovert, B., Sordini, R., Stephan, K., Tobie, G., Zambon, F., Adriani, A., Altieri, F., Bockelée, D., Capaccioni, F., De Angelis, S., De Sanctis, M.-C., Drossart, P., Fouchet, T., Gérard, J.-C., Grodent, D., Ignatiev, N., Irwin, P., Ligier, N., Manaud, N., Mangold, N., Mura, A., Pilorget, C., Quirico, E., Renotte, E., Strazzulla, G., Turrini, D., Vandaele, A.-C., Carli, C., Ciarniello, M., Guerlet, S., Lellouch, E., Mancarella, F., Morbidelli, A., Le Mouélic, S., Raponi, A., Sindoni, G., and Snels, M.: Moons and Jupiter Imaging Spectrometer (MAJIS) on Jupiter Icy Moons Explorer (JUICE), Space Sci. Rev., 220, 27, https://doi.org/10.1007/s11214-024-01057-2, 2024. a, b
Poulet, F., Piccioni, G., Langevin, Y., Dumesnil, C., Carlier, V., Seignovert, B., Dexet, M., Fletcher, L. N., Leyrat, C., Altieri, F., Carter, J., D'Aversa, E., De Sanctis, M., Grassi, D., Guerlet, S., Le Mouélic, S., Migliorini, A., Oliva, F., Royer, C., Rodriguez, S., Stephan, K., Tosi, F., Zambon, F., Adriani, A., Arnold, G., Bibring, J.-P., Bockelée, D., Brunetto, R., Capaccioni, F., Carli, C., Cavalié, T., Cisneros González, M., Ciarnello, M., De Angelis, S., Drossart, P., Filacchione, G., Fouchet, T., Gérard, J.-C., Grodent, D., Irwin, P., Jacquinod, S., Karatekin, O., Lellouch, E., Ligier, N., Mangold, N., Mebsout, M., Merlin, F., Morbidelli, A., Mura, A., Nathues, A., Palumbo, M. E., Pilorget, C., Poch, O., Quirico, E., Raponi, A., Robert, S., Roussos, E., Sanchez-Lavega, A., Schmitt, B., Sindoni, G., Snels, M., Sordini, R., Stefani, S., Strazzulla, G., Trent, T., Tobie, G., Turrini, D., Vandaele, A.-C., Vincendon, M., Witasse, O., Vallat, C., and Moraino, A.: ESA/JUICE encounters Earth/Moon in 2024: overview of the Moons And Jupiter Imaging Spectrometer (MAJIS) observations, Ann. Geophys., 44, 163–193, https://doi.org/10.5194/angeo-44-163-2026, 2026. a, b, c
Sato, H., Robinson, M. S., Lawrence, S. J., Denevi, B. W., Hapke, B., Jolliff, B. L., and Hiesinger, H.: Lunar mare TiO2 abundances estimated from UV/Vis reflectance, Icarus, 296, 216–238, https://doi.org/10.1016/j.icarus.2017.06.013, 2017. a, b
Scholten, F., Oberst, J., Matz, K.-D., Roatsch, T., Wählisch, M., Speyerer, E. J., and Robinson, M. S.: GLD100: The near-global lunar 100 m raster DTM from LROC WAC stereo image data, J. Geophys. Res.-Planet., 117, E00H17, https://doi.org/10.1029/2011JE003926, 2012. a
Serventi, G., Carli, C., Sgavetti, M., Ciarniello, M., Capaccioni, F., and Pedrazzi, G.: Spectral variability of plagioclase–mafic mixtures (1): Effects of chemistry and modal abundance in reflectance spectra of rocks and mineral mixtures, Icarus, 226, 282–298, https://doi.org/dx.doi.org/10.1016/j.icarus.2013.05.041, 2013. a
Shearer, C. K.: Thermal and Magmatic Evolution of the Moon, Rev. Mineral. Geochem., 60, 365–518, https://doi.org/10.2138/rmg.2006.60.4, 2006. a
Smith, D. E., Zuber, M. T., Jackson, G. B., Cavanaugh, J. F., Neumann, G. A., Riris, H., Sun, X., Zellar, R. S., Coltharp, C., Connelly, J., Katz, R. B., Kleyner, I., Liiva, P., Matuszeski, A., Mazarico, E. M., McGarry, J. F., Novo-Gradac, A.-M., Ott, M. N., Peters, C., Ramos-Izquierdo, L. A., Ramsey, L., Rowlands, D. D., Schmidt, S., Scott, V. S., Shaw, G. B., Smith, J. C., Swinski, J.-P., Torrence, M. H., Unger, G., Yu, A. W., and Zagwodzki, T. W.: The Lunar Orbiter Laser Altimeter Investigation on the Lunar Reconnaissance Orbiter Mission, Space Sci. Rev., 150, 209–241, https://doi.org/10.1007/s11214-009-9512-y, 2010a. a
Smith, D. E., Zuber, M. T., Neumann, G. A., Lemoine, F. G., Mazarico, E., Torrence, M. H., McGarry, J. F., Rowlands, D. D., Head, J. W., Duxbury, T. H., Aharonson, O., Lucey, P. G., Robinson, M. S., Barnouin, O. S., Cavanaugh, J. F., Sun, X., Liiva, P., Mao, D.-d., Smith, J. C., and Bartels, A. E.: Initial observations from the Lunar Orbiter Laser Altimeter (LOLA), Geophys. Res. Lett., 37, L18204, https://doi.org/10.1029/2010GL043751, 2010b. a
Stadermann, A. C., Barnes, J. J., Erickson, T. M., Prissel, T. C., and Michels, Z. D.: Evidence for Extrusive Mg-Suite Magmatism on the Moon? Fine-Grained Magnesian Clasts in an Apollo 16 Impact Melt Breccia, J. Geophys. Res.-Planet., 128, e2022JE007728, https://doi.org/10.1029/2022JE007728, 2023. a
Taylor, S. R. and McLennan, S.: Planetary Crusts: Their Composition, Origin and Evolution, Cambridge University Press, Cambridge, UK, ISBN 978-0-521-84186-3, 2008. a
Tosi, F., Royer, C., Colaiuta, F., Poulet, F., Powell, T. M., Greenhagen, B. T., Langevin, Y., Mura, A., Piccioni, G., Pilorget, C., Carli, C., and Zambon, F.: The JUICE 2024 close flyby of the Moon: thermal assessment from MAJIS, Ann. Geophys., 44, 547–576, https://doi.org/10.5194/angeo-44-547-2026, 2026. a, b, c, d
Yamamoto, S., Nakamura, R., Matsunaga, T., Ogawa, Y., Ishihara, Y., Morota, T., Hirata, N., Ohtake, M., Hiroi, T., Yokota, Y., and Haruyama, J.: Massive layer of pure anorthosite on the Moon, Geophys. Res. Lett., 39, L13201, https://doi.org/10.1029/2012GL052098, 2012. a, b
Yen, C., Deligny, C., Jolliff, B., Nemchin, A., Carpenter, P., Whitehouse, M., Merle, R., Ogliore, R., Kent, J., Zeigler, R., Gross, J., Eckley, S., Simon, S., and Shearer, C.: Magnesian-suite volcanism and ancient crust building on the Moon 4.25 billion years ago, Earth Planet. Sc. Lett., 662, 119395, https://doi.org/10.1016/j.epsl.2025.119395, 2025. a
Zhang, J., Dauphas, N., Davis, A. M., Leya, I., and Fedkin, A.: The proto-Earth as a significant source of lunar material, Nat. Geosci., 5, 251–255, https://doi.org/10.1038/ngeo1429, 2012. a
- Abstract
- Introduction
- Dataset and methods
- Geological and mineralogical context of the regions covered by MAJIS
- Spectral indices and ratios
- Mineralogical Analysis of Lunar Regions Using the MAJIS Dataset
- Discussion of Ratioed Spectra: Mean Behaviour and Mineralogical/Maturity Trends
- MAJIS Observations Beyond 2.6 µm
- Comparison Between MAJIS-Derived and M3 Public Spectral Parameter Maps
- Discussion
- Conclusions
- Appendix A: Data Processing
- Appendix B: Spectral Ratioing Methodology and Application
- Appendix C: Spectral Parameter Retrieval
- Code availability
- Data availability
- Author contributions
- Competing interests
- Disclaimer
- Special issue statement
- Acknowledgements
- Financial support
- Review statement
- References