
the Creative Commons Attribution 4.0 License.
the Creative Commons Attribution 4.0 License.
 | 15 Oct 2026
Ultraviolet observations of the Earth and Moon during the JUICE Lunar-Earth flyby

Michael W. Davis
Rohini S. Giles
Thomas K. Greathouse
Kurt D. Retherford
Maarten H. Versteeg
Sue A. Ferrell
Tracy M. Becker
G. Randall Gladstone
Bradley J. Trantham
Joshua A. Kammer
Matthew A. Freeman
Steven C. Persyn
During the JUICE Lunar-Earth Gravity Assist (LEGA) period in August 2024, the JUICE ultraviolet imaging spectrograph (JUICE-UVS) performed a series of observations of the Earth and Moon, detecting reflected sunlight at the Moon and emissions of atmospheric species including hydrogen, oxygen, and nitrogen at the Earth. These observations provided the first opportunity for in-flight calibration of the instrument response to extended planetary targets. They were used to refine the wavelength calibration across the full instrument bandpass, confirm accurate knowledge of the pointing of the UVS field-of-view relative to the spacecraft, and validate previous measurements of the UV effective area determined from observations of UV-bright stars. The observations performed also demonstrate the range of scientific analyses to be performed during the science phase of the mission and are useful for the development and testing of relevant mapping tools and procedures. The JUICE-UVS LEGA data confirm that the instrument is in good health and well suited to its goals of characterizing the surfaces and atmospheres of Jupiter's icy moons, mapping and monitoring Jupiter's aurora and upper atmosphere, and studying the Jupiter-Io connection.
- Article
(15763 KB) - Full-text XML
- BibTeX
- EndNote


In August 2024, the European Space Agency's JUICE mission successfully executed the first of four gravity assist maneuvers to be performed in its 8-year journey to the Jupiter system. During this combined Lunar-Earth flyby – the first performed by any spacecraft –, JUICE first encountered the Moon at a closest approach altitude of 752 km (19 August 2024, 21:14:55 UTC), performing an Earth flyby the following day with a closest approach altitude of 6839 km (20 August 2024, 21:56:14 UTC). The Lunar-Earth Gravity Assist (LEGA), in addition to providing necessary trajectory adjustments, was the first opportunity for the JUICE instruments to observe extended planetary targets and test operational and data analysis techniques that will be used extensively during the mission's science phase.
Among the 10 science instruments that comprise the JUICE payload is the JUICE Ultraviolet Spectrograph (JUICE-UVS) (Retherford et al., 2026), an imaging spectrograph sensitive to light at extreme- to far-ultraviolet (EUV to FUV) wavelengths in the range 50–204 nm (Davis et al., 2020). JUICE-UVS has broad measurement goals that include characterization and monitoring of Jupiter's upper atmosphere and aurora (Fletcher et al., 2023), identification and mapping of ice and non-ice surface materials on Jupiter's icy moons (Tosi et al., 2024), mapping and monitoring of satellite aurora and tori/neutral clouds (Denk et al., 2026; Tosi et al., 2024), and searches for H2O plumes and related surface deposits on Europa (Tosi et al., 2024; Van Hoolst et al., 2024). The basic instrument performance was verified via observations of UV-bright stars and interplanetary hydrogen and helium emissions during the Near-Earth Commissioning Phase (NECP) shortly after JUICE's April 2023 launch, and later in scheduled payload checkout windows (Davis et al., 2024, 2025). However, to fully characterize the instrument response at all wavelengths and all positions within the UVS field-of-view, observations of extended sources with discrete spectral features at multiple wavelengths spanning the full UVS bandpass are required. JUICE-UVS therefore performed a comprehensive series of observations of both the Moon and the Earth during the LEGA period.
This paper provides a summary of the JUICE-UVS LEGA activities, beginning with an overview of the UVS instrument design and observing modes (Sect. 2). We then present the results of observations performed during the Lunar flyby (Sect. 3), and the Earth flyby (Sect. 4), describing how they are used for calibration and validation of the UVS performance. Finally, in Sect. 5, we discuss similarities between the observations performed during the LEGA period and those that will ultimately contribute to JUICE's exploration of Jupiter and its moons.
JUICE-UVS is the fifth in a series of six UV spectrographs built by the Southwest Research Institute (SwRI) for planetary missions (Stern et al., 2007, 2008; Gladstone et al., 2010, 2017; Retherford et al., 2024). While each instrument is optimized for its specific mission and science target, all use the same basic optical design. Light enters the JUICE-UVS telescope section via one of three apertures: a 40×40 mm square airglow port (AP, the main aperture), a 10×10 mm square high resolution (HP) port – located in a deployable door behind the AP entrance –, or a 0.25 mm diameter pinhole in the solar port (SP), which is offset from the AP/HP aperture by 60°. Light that enters the SP is then reflected off a small pickoff mirror. In all three cases, the entering light is then collected and focused by an off-axis paraboloidal (OAP) primary mirror (120 mm focal length) onto the spectrograph entrance slit. Light passing through the slit is then dispersed by a toroidal diffraction grating, which focuses the UV bandpass onto a microchannel plate (MCP) detector with a solar-blind, UV-sensitive cesium iodide (CsI) photocathode read out by cross-delay line (XDL) electronics. The OAP and grating – which, like the housing are made of aluminum 6061, making the system athermal – are coated with aluminum plus a magnesium fluoride overcoat () to maximize reflection at wavelengths >115 nm. The SP pickoff mirror is coated with gold, which is approximately 35 % reflective in the far-UV, reducing the throughput to enable solar observations at 5 AU. The entrance slit, shown in Fig. 1, has a FOV of 0.1° in the dispersion direction and 7.3° in the spatial direction (i.e. perpendicular to the dispersion direction). The slit contains an additional 0.2° × 0.2° box at one end to collect light from the SP and accommodate the ∼0.1° solar disk as measured at the Jovian system. The completed flight JUICE-UVS is also shown in Fig. 1.
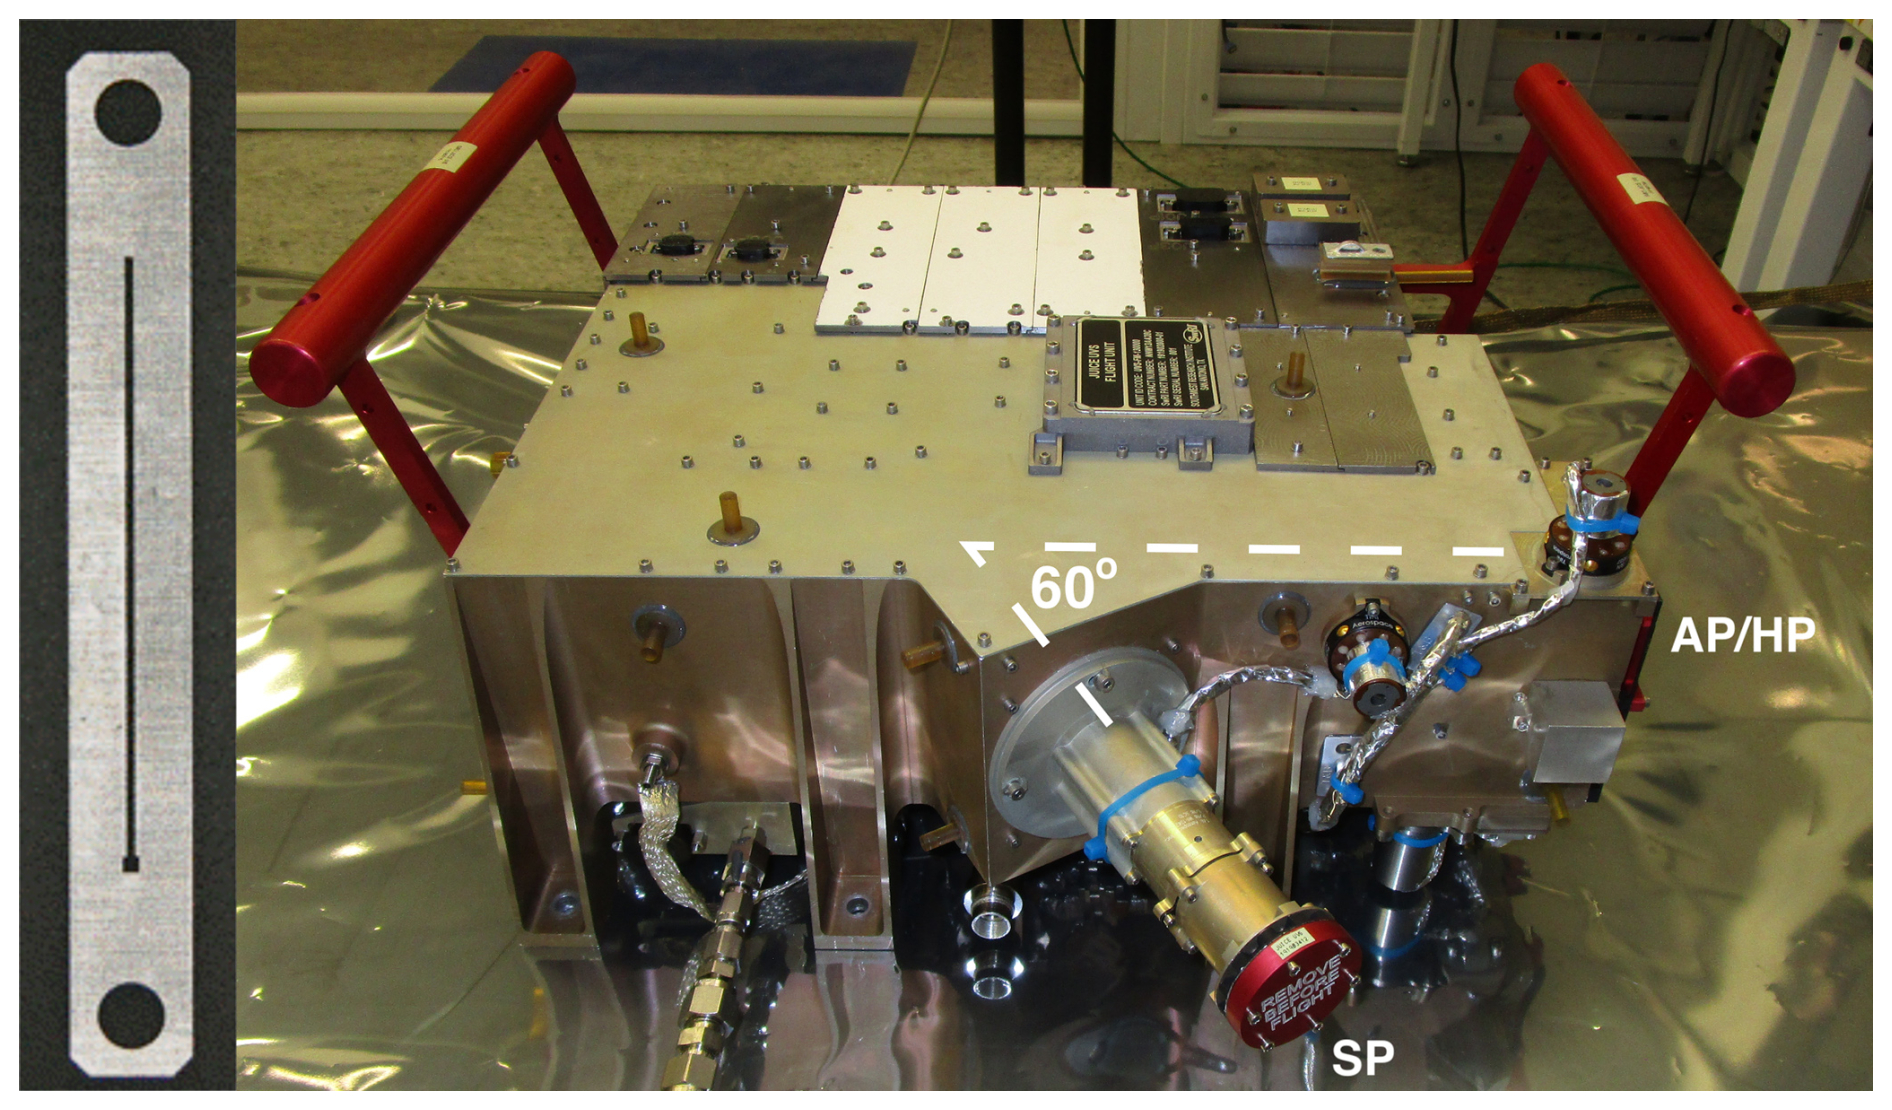
Figure 1Left: The UVS FOV is defined by the shape of the slit, consisting of a 7.3° × 0.1° section with a 0.2° × 0.2° box at one end to accommodate the Sun's ∼ 0.11° angular diameter when viewed from 5 AU. Right: A photo of the completed JUICE-UVS shortly before delivery to ESA with the apertures labelled (see text). Adapted from Davis et al. (2020).
JUICE-UVS science data can be collected in one of two modes: histogram and pixel list. In pixel list mode, the instrument returns the x (spectral) and y (spatial) positions of each event at the detector, as well as its pulse height (the total charge generated when a photon/particle hits the detector, which can be used to monitor performance and discriminate between photons and charged particles). Regular “time hacks” are included in the list of events at a specified frequency to provide temporal information. In histogram mode, all detector events within a specified exposure time are histogrammed into a 2D array of pre-defined spectral and spatial bins, and a 1D histogram of the associated pulse heights is also returned. Histogram definitions are highly flexible, and the spectral and spatial resolution may be varied across the spectral image, for example by defining smaller spectral bins (and thus obtaining higher spectral resolution) in a wavelength range where key emission lines are expected and larger bins outside of this spectral region. Histogram mode typically results in a lower data volume than pixel list mode for a given exposure duration.
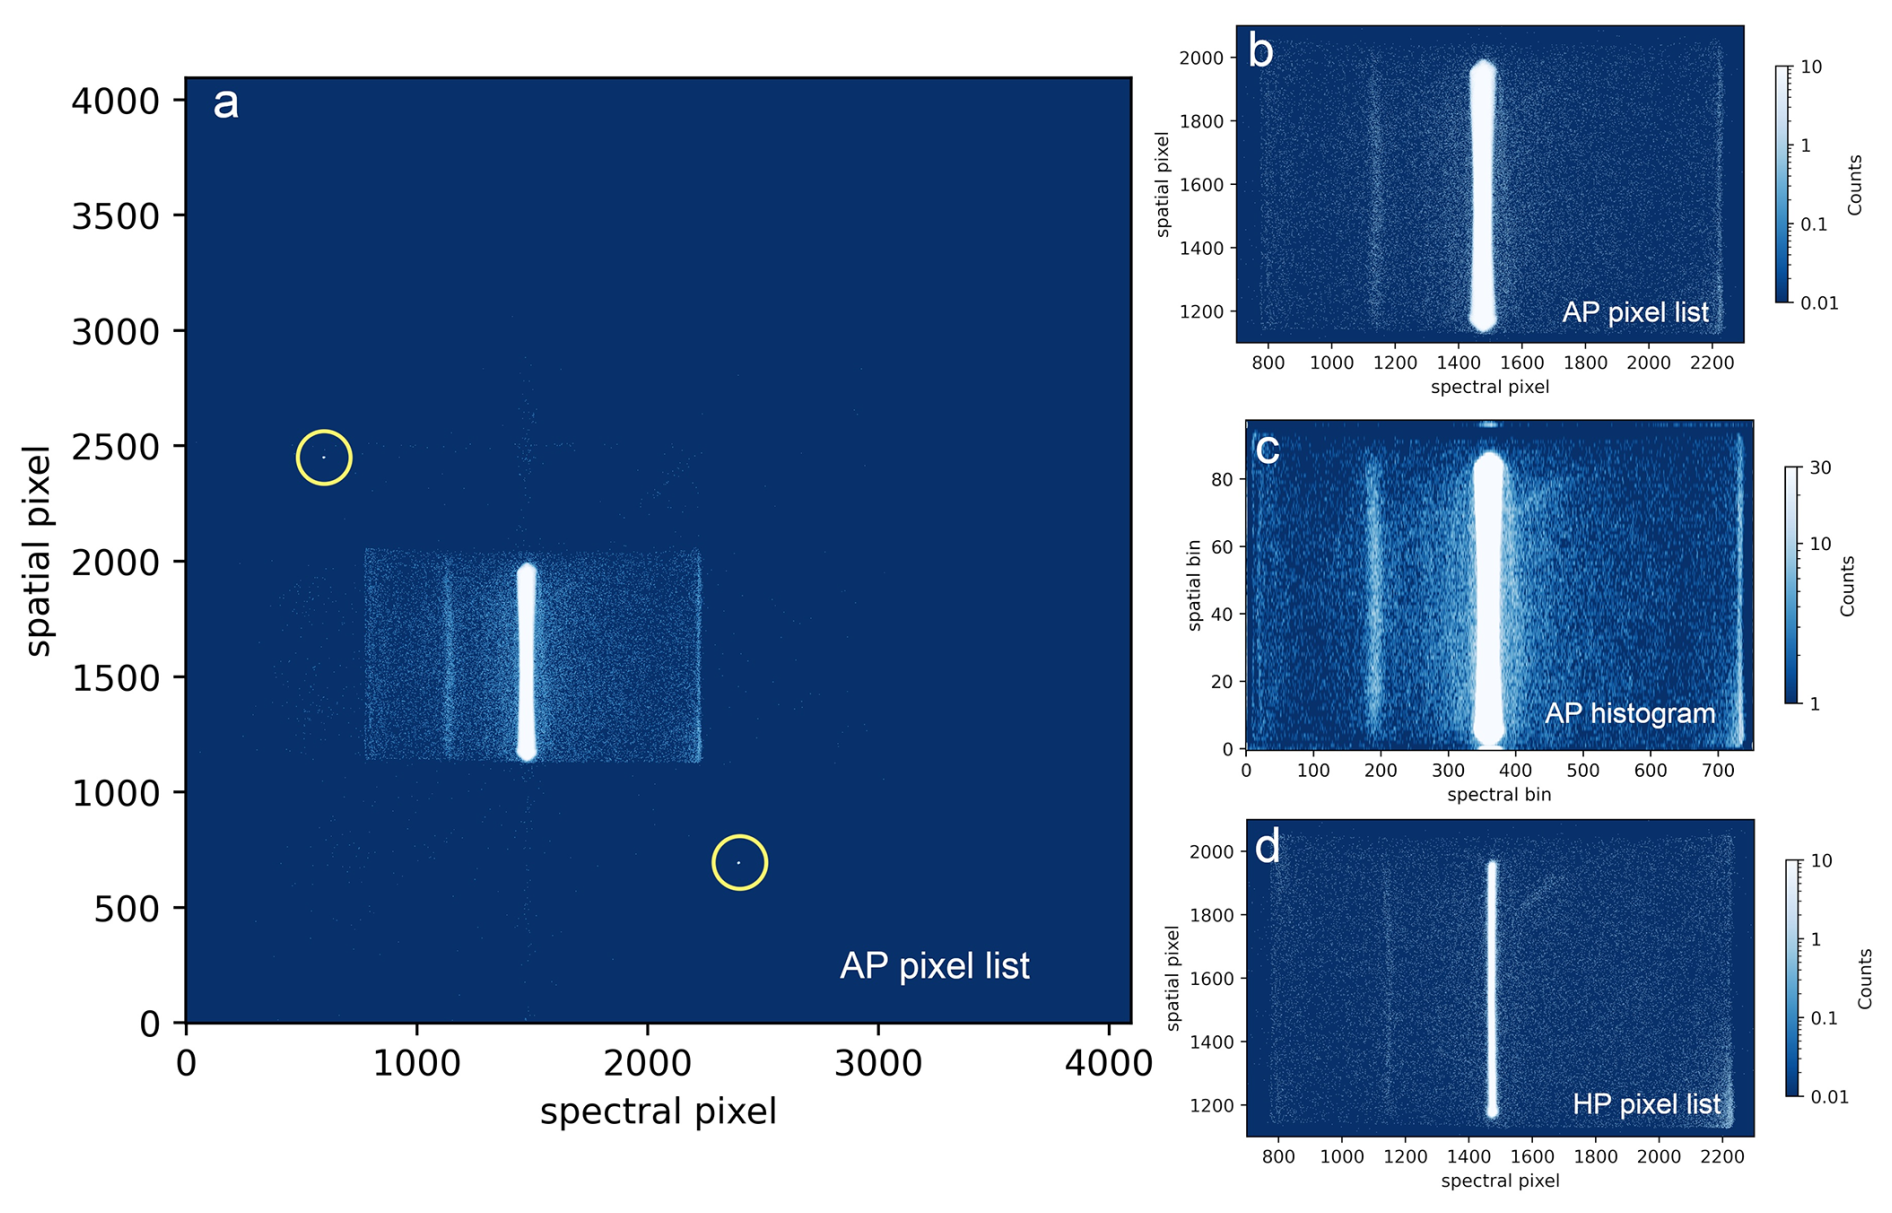
Figure 2Example spectral-spatial sky stare images from JUICE-UVS commissioning, demonstrating the main observational modes: (a) a 2 min AP pixel list image in full 4096×4096 format including the active area and stim pixels (circled); (b) the same image cropped to show the active area only; (c) a 6 min AP histogram of the same region of sky (uncropped, with binning as programmed during the acquisition); (d) an 8 min HP pixel list observation (cropped to the active area). The brightening at the edges of the active area – most apparent in panel (c) – is a pileup effect typical of MCP detectors and caused by field interactions with the MCP mounting clamps (e.g., Davis et al., 2011; Siegmund et al., 2013).
Figure 2 shows example pixel list and histogram exposures acquired during UVS commissioning activities (NECP; see Sect. 1) in June 2023. Panel (a) shows an AP pixel list observation recording the full 4096×4096 detector pixel space. The active area of the detector takes up only a small fraction of the available space, shown in Fig. 2b. This is because an MCP detector does not have physical pixels; instead, the x and y positions of each photon incident on the detector are deduced from the time at which the associated charge pulse reaches the ends of the two cross-delay lines comprising the readout anode. JUICE-UVS uses 12 bit encoding for both x and y positions, producing an 4096×4096 image, but the size of the active area is limited by the physical size of the detector and the time resolution of the electronics to a smaller region within this space. The additional pixels outside of the active area are useful for monitoring instrument performance. For example, on the full image in Fig. 2a, two small dots can be seen to the upper left and lower right of the active area (circled in the figure for clarity). These are the “stim” pixels: internal signals created by the detector electronics that are used to monitor any changes in the position of the active area with temperature. In the histogram image (Fig. 2c) all pixels outside of the active area, including the stim pixels, are mapped to a single bin at each edge of the image, so Fig. 2c shows the full 2D image returned rather than being cropped to the active area like Fig. 2b. Finally, Fig. 2d shows a cropped HP pixel list observation, demonstrating the sharper resolution achieved using this mode, at the expense of lower throughput.
In each of the Fig. 2 exposures, the instrument was observing an empty region of sky, where the only expected source of UV light is the interplanetary medium (IPM). This produces a single image of the UVS slit centered at detector spectral (x) pixel ∼1475, which corresponds to the wavelength of the H I Lyman-α emission at 121.6 nm. Subsequent longer sky stares also detected a much fainter emission of IPM helium at 58.4 nm (spectral pixel 871). The faint vertical line seen near spectral pixel 1140 is an artifact known as the Lyman-α ghost, which is caused by the reflectance of Lyman-α light by the front surface of the detector back to the grating, where it undergoes another reflection to a different position on the detector. This ghost image was also seen in all previous iterations of UVS (e.g., Slater et al., 2005). The Lunar Earth Gravity Assist was the first time UVS was able to obtain observations of extended sources with multiple known spectral features spanning the full bandpass, providing an opportunity to test and refine various aspects of the instrument calibration, as described in the following sections.
3.1 Summary of observations performed
JUICE-UVS observed the sunlit surface of the Moon in a series of exposures beginning at 19 August 2024, 21:20:38, approximately 2 min after the UVS FOV crossed the terminator from the nightside onto the sunlit hemisphere. At the time of the first observation, the reflected UV solar flux was considered low enough to allow a 30 s observation using the AP aperture. After this time, the light levels were too high to observe without overwhelming detector count rates in this mode, and the remaining observations were performed through the HP aperture. Three HP observations of the surface were acquired in histogram mode, followed by an HP pixel list acquisition as the FOV moved off the Moon's limb. The timings and durations of the five observations are listed in Table 1. Histogram acquisitions are commanded with a total time duration and an exposure time which can be shorter or equal to the total duration. These times are shown in the second and third columns in Table 1 (“Duration” and “Time sampling”). For example, the first lunar HP histogram acquisition consisted of 201 individual histograms with 0.6 s exposure times.
Table 1Summary of JUICE-UVS observations of the Moon performed during the LEGA period.

3.2 Mapping the lunar surface
The orientation of the JUICE spacecraft during the Lunar flyby meant that the direction of travel of the UVS FOV over the lunar surface was mostly in the along-slit direction. Across-slit (“push-broom”) motion is preferred for mapping since this orientation naturally covers a 7.5°-wide region, while an along-slit map only extends to the 0.1° slit width. However, even a narrow map can be useful for checking the instrument pointing if the region covered includes craters or other significant surface features, the observed locations of which can be compared to their known positions.
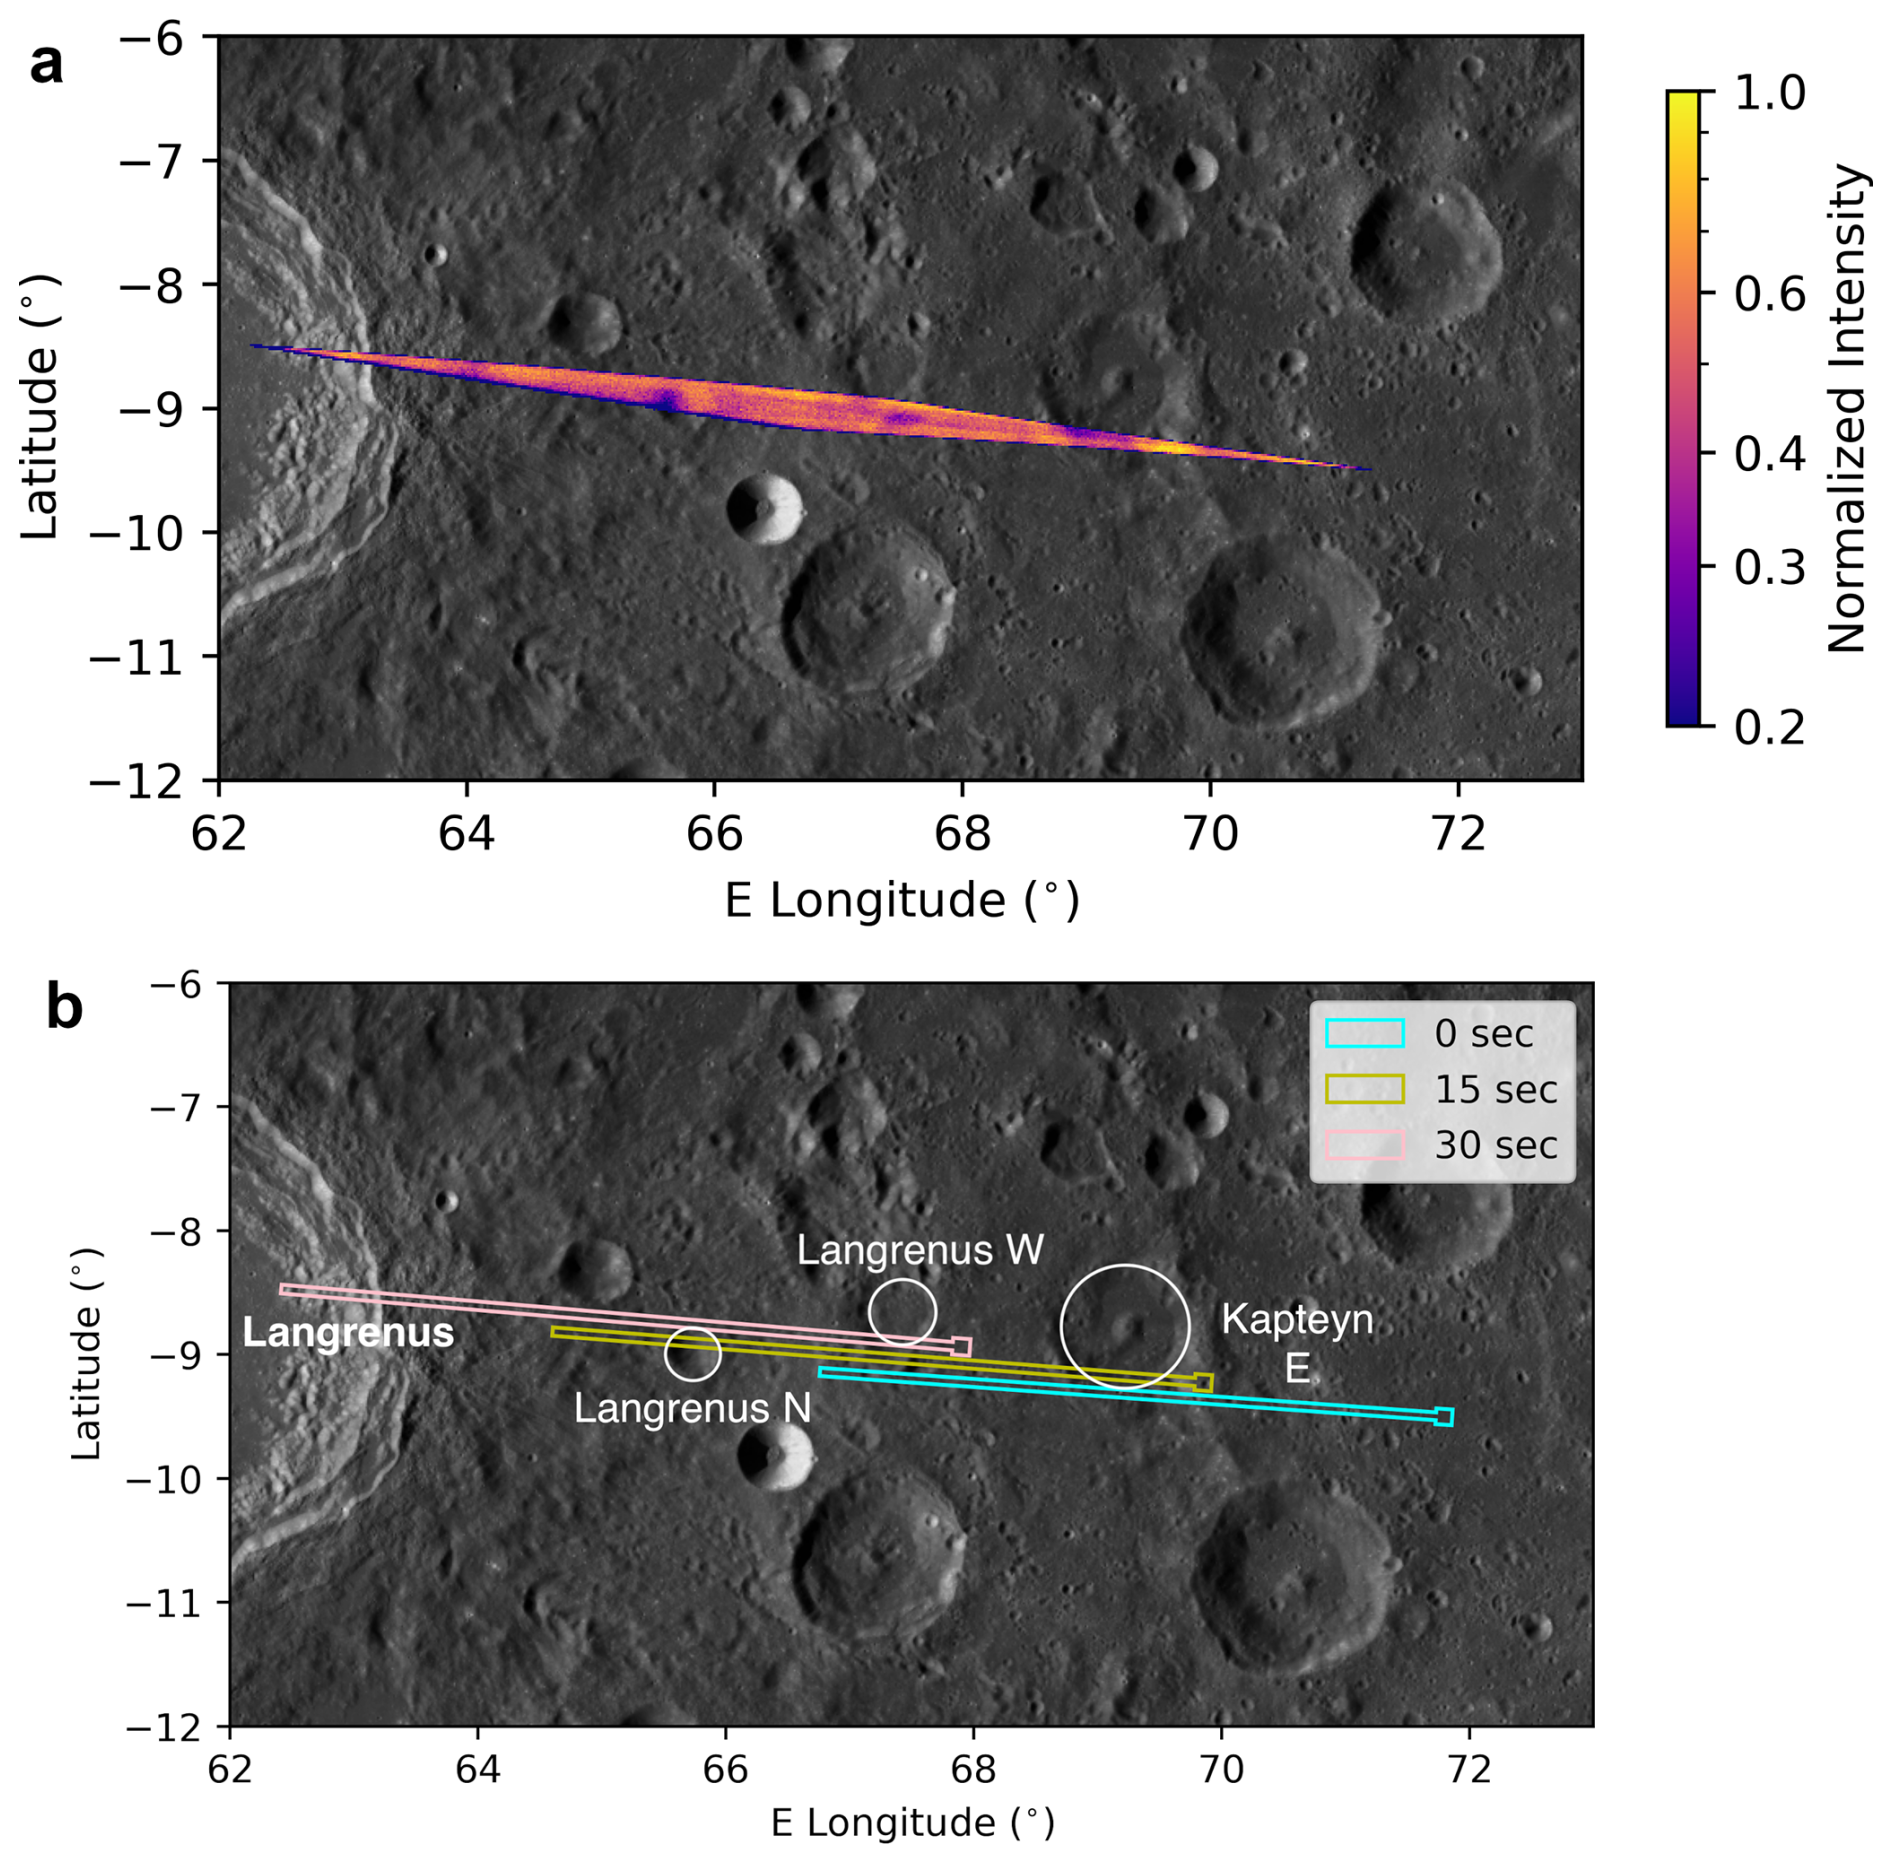
Figure 3(a) Normalized map of sunlight reflected by the moon's surface during the 30 s AP pixel list, summed over the 155–197 nm spectral region; (b) the projected position of the UVS FOV at the start, midpoint, and end of the observation. The background image is the LRO Wide Angle Camera (WAC) global mosaic at 100 m per pixel (https://astrogeology.usgs.gov/search/map/moon_lro_lroc_wac_global_morphology_mosaic_100m, last access: 8 October 2026). LRO LROC-WAC global mosaic courtesy of USGS Astrogeology Science Center/NASA.
We used the AP pixel list data to produce a map of a small region of the lunar surface, shown in Fig. 3. The intensity values were obtained by summing counts observed in the wavelength range 155–197 nm, and we have excluded the 0.2° × 0.2° portion of the slit where the spatial resolution is reduced. The chosen wavelength range avoids an extended region around Lyman-α (121.6 nm) and a reflected solar oxygen emission line at 130.4 nm where the flux was too high for the detector to correctly process every photon, leading to a localized but recoverable gain degradation effect. Since the solar flux increases exponentially through the FUV region where the instrument responsivity is also higher, the use of these longer wavelengths additionally provides improved signal-to-noise relative to maps using the EUV end of the bandpass. Figure 3b illustrates the UVS footprint at the start, mid-point, and end of the observation, and identifies the larger craters within the observed region. UVS observed large contrasts between sunlit and shadowed regions in and around the Kapteyn E, Langrenus W and Langrenus N craters that are consistent with previous images under similar illumination conditions, demonstrating that the pointing definition in the current UVS instrument kernel used by the JUICE mission is accurate.
3.3 UV reflectance spectroscopy
In addition to mapping the Lunar data to confirm the instrument pointing, we can compare reflectance spectra extracted from the UVS observations to published FUV spectra to check that the instrument effective area as a function of wavelength is well characterized. To demonstrate this, we produced two reflectance spectra from the first histogram exposure: one using the first 18 s of the observation, which covered an area near Langrenus crater, and a second using a 30 s period starting 72 s into the observation, when the UVS FOV was within Mare Fecunditatis, as shown in Fig. 4.

Figure 4UVS footprint at the start and end of two periods within the first HP histogram observation: 0–18 s, when the instrument observed the region around Langrenus crater, and 72–102 s, when the FOV was within Mare Fecunditatis. The background image is the LRO Wide Angle Camera (WAC) global mosaic at 100 m per pixel (https://astrogeology.usgs.gov/search/map/moon_lro_lroc_wac_global_morphology_mosaic_100m, last access: 8 October 2026). LRO LROC-WAC global mosaic courtesy of USGS Astrogeology Science Center/NASA.
To convert each UVS spectral-spatial image into a reflectance spectrum, we first sum over all y pixels to obtain a 1D list of instrument counts for each x value (wavelength). We divide by the exposure time to convert to counts s−1, and by the solid angle of the UVS slit to get counts s−1 sr−1. We then divide by the average instrument effective area in cm2 as a function of x location – initially determined from ground calibration (Davis et al., 2020) and later refined in flight using observations of stars (Davis et al., 2024, 2025) – to obtain a spectrum in units of photons cm−2 s−1 sr−1. This is converted to a reflectance spectrum by dividing a UV solar spectrum obtained on the same day by the TIMED/SEE instrument (Woods et al., 2005). We also apply a simple photometric correction for the viewing geometry by dividing by the Lommel-Seeliger function (, where i and e are the incidence and emission angles, respectively).
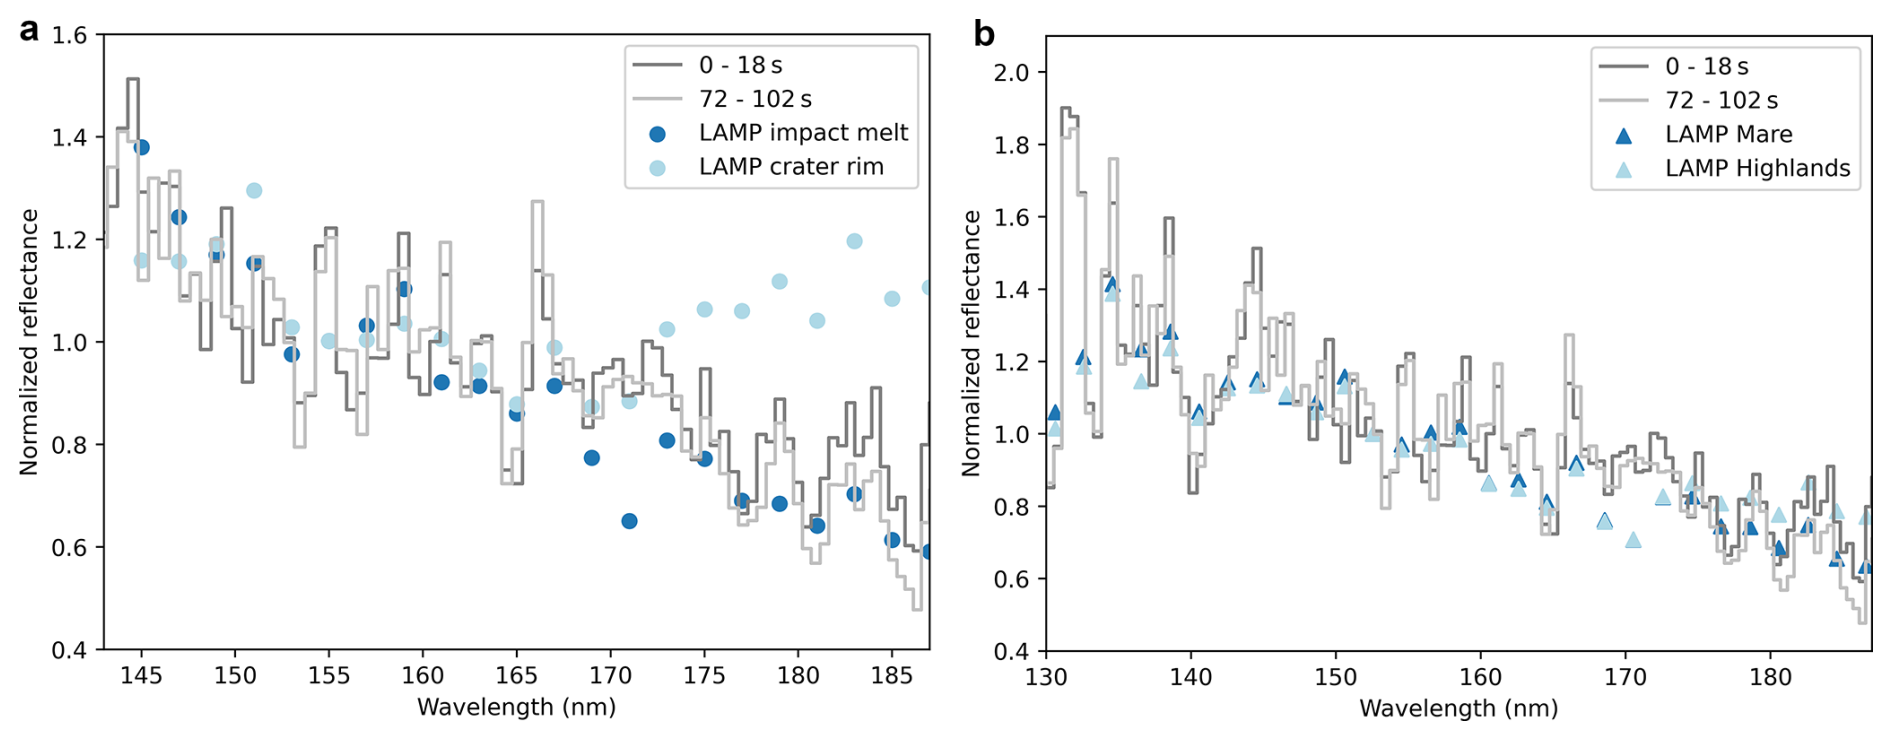
Figure 5Normalized lunar reflectance spectra obtained by JUICE-UVS for the two surface regions shown in Fig. 4, compared with LAMP spectra from Czajka et al. (2023) in panel (a), and from Byron et al. (2020) in panel (b).
Figure 5 shows normalized UV Lunar reflectance spectra measured by JUICE-UVS for the two surface regions identified in Fig. 4. Also shown are Lunar spectra obtained by the Lyman Alpha Mapping Project (LAMP; Gladstone et al., 2010), another instrument in the SwRI UVS series of UV spectrographs flying on the Lunar Reconnaissance Orbiter (LRO). The JUICE-UVS results are compared with LAMP observations of regions near Aristarchus crater (Czajka et al., 2023) in Fig. 5a, and regions near Tycho crater (Byron et al., 2020) in Fig. 5b. For both comparisons we have adopted the normalization wavelength of 155 nm used by Czajka et al. (2023) and we have cropped the JUICE-UVS data to match the spectral range shown in the LAMP papers. The spectral shape of all datasets is similar at wavelengths <165 nm, with different terrains showing more variation at longer wavelengths. The two JUICE-UVS spectra are very similar to the Byron et al. (2020) Mare and Highlands spectra at all wavelengths except around 167–173 nm, where all LAMP spectra other than the Aristarchus crater rim spectrum appear to show an absorption feature not observed by JUICE. Since none of the published LAMP reflectance spectra cover the exact region observed by JUICE-UVS, further work is required to determine if the spectral differences near 170 nm are due to varying lunar surface photometric properties or if they may result from inaccuracies in the effective area calibration of either instrument, or the relatively large uncertainties associated with the TIMED/SEE solar spectrum, which average ∼16 % between 167 and 173 nm. The good agreement with LAMP spectra outside of this small part of the spectrum suggests that the JUICE-UVS effective area is generally well characterized in the FUV.
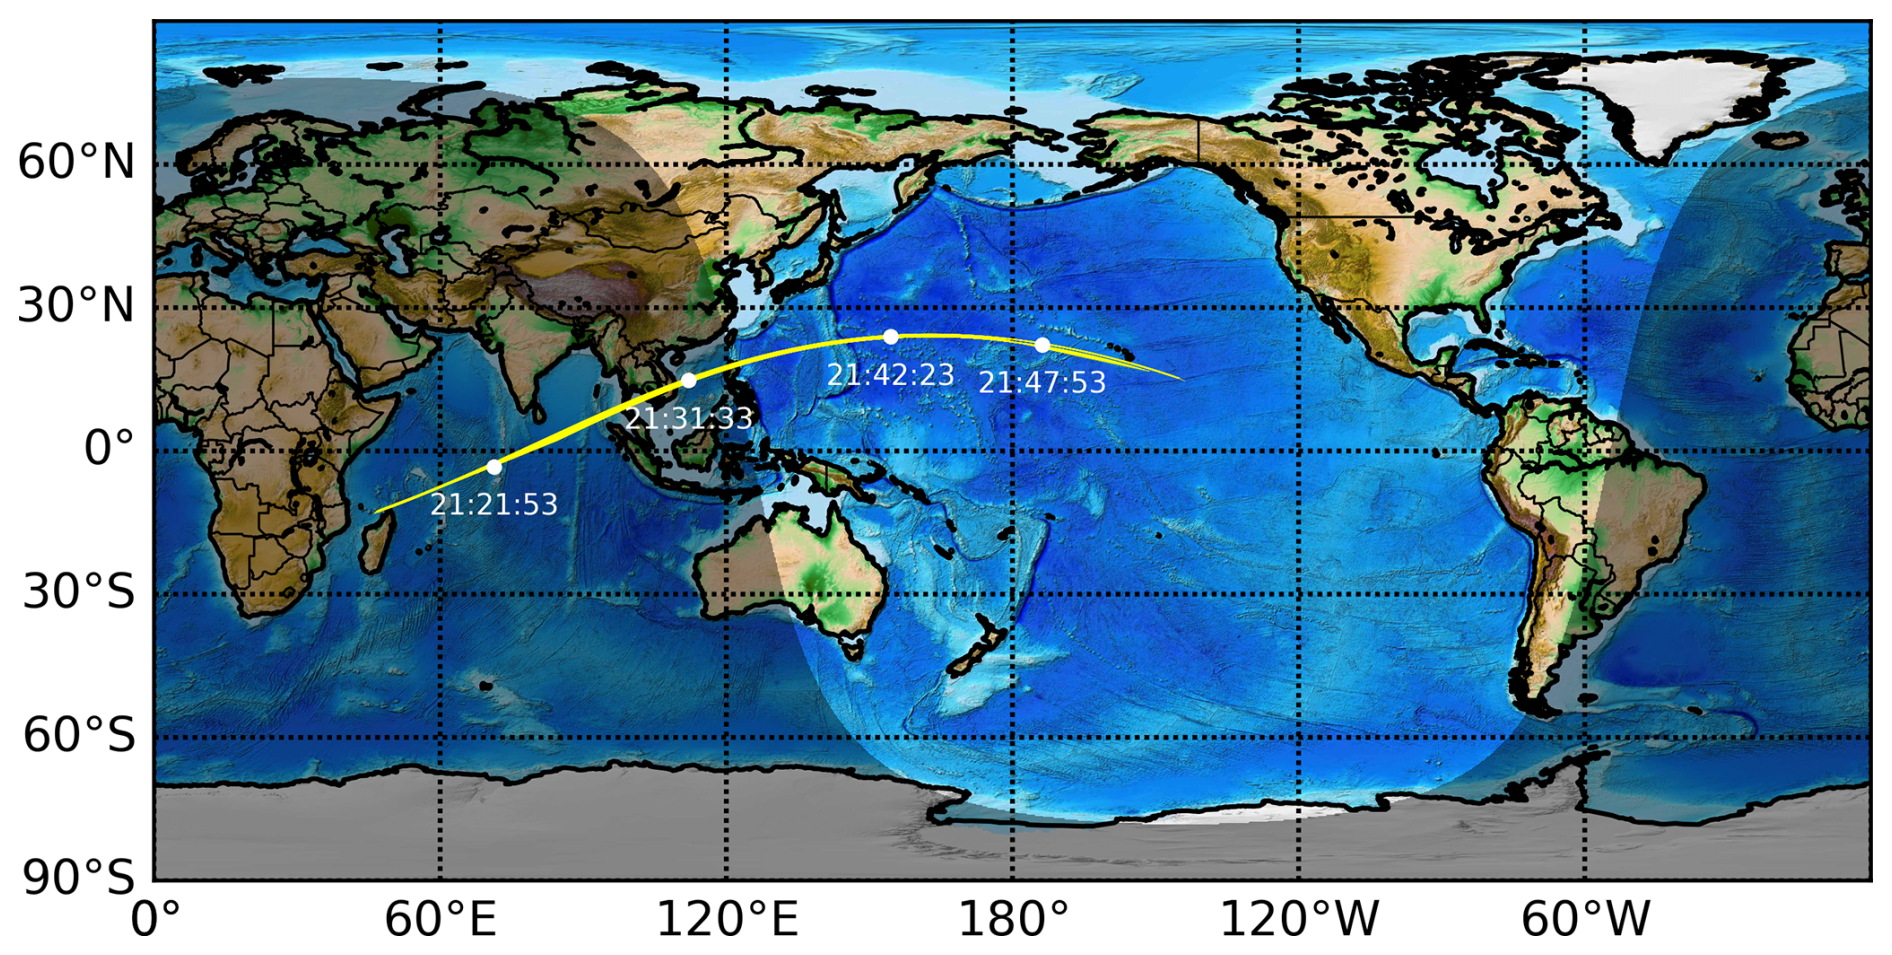
Figure 6Map showing the path of the JUICE-UVS footprint during the Earth flyby observations. The position of the boresight at the start of each histogram observation and HP pixel list 2 are also shown (the boresight was off the Earth above the nightside limb during the two earlier pixel list observations).
4.1 Summary of observations performed
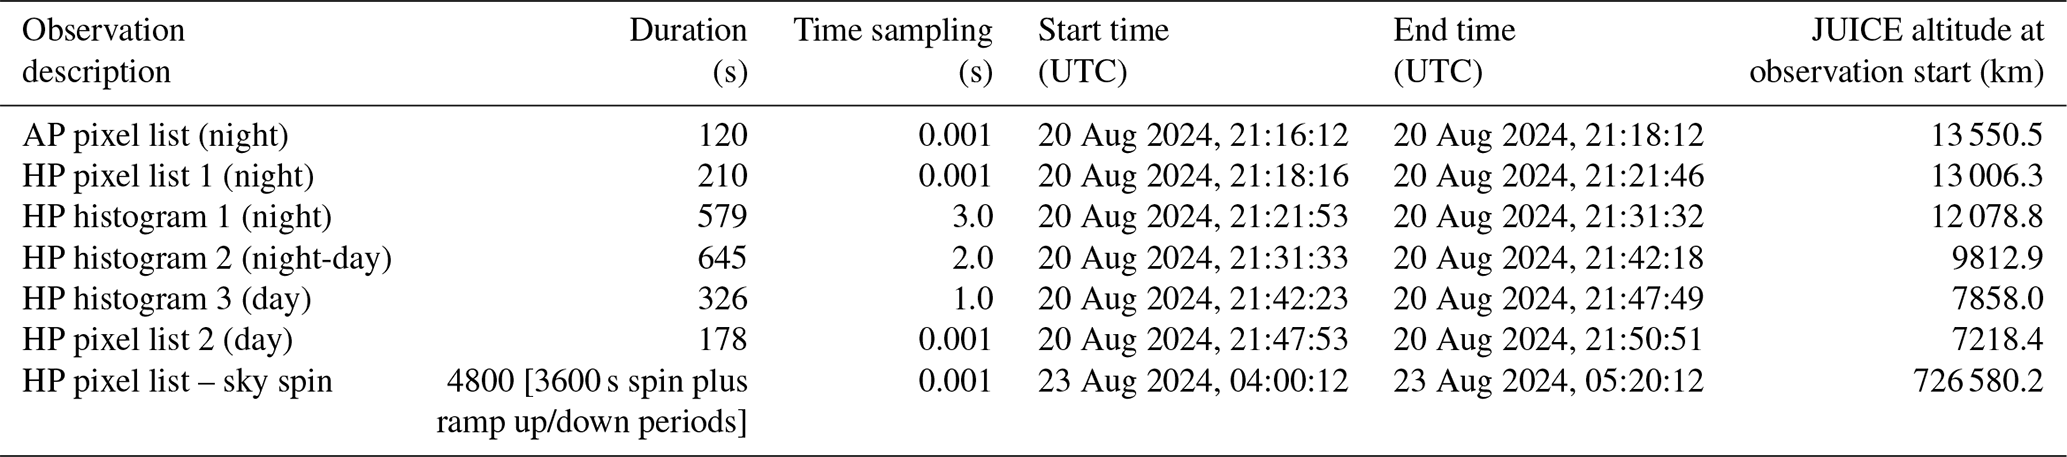
During the Earth flyby, JUICE-UVS was able to observe for almost 35 min, beginning on the nightside at an altitude of ∼13 550 km and continuing onto the dayside, with the final observation covering the sunlit limb. The path of the UVS footprint during the observation period is shown in Fig. 6, and details of the observation sequence are given in Table 2. A final observation of the near-Earth environment was performed 3 d after the flyby, when the spacecraft performed a 360° spin that brought the UVS FOV within a few degrees of the Earth.
Table 2Summary of JUICE-UVS observations of the Earth performed during the LEGA period.
4.2 Measuring Earth's UV airglow emissions
4.2.1 Wavelength calibration
The Earth's UV spectrum contains many airglow emissions, including hydrogen, helium, oxygen and nitrogen species. Since these occur at known wavelengths, they are useful for wavelength calibration, allowing us to convert each x position on the detector to an equivalent value in wavelength units (nm or Å). This relationship changes as a function of y position on the detector, making the final solution for a two-dimensional coordinate transform necessary and difficult to produce without extended source data of this type covering a wide range of the instrument's spectral bandpass.

Figure 7Dayglow emissions observed during the last JUICE-UVS pixel list exposure during the Earth flyby. The top panel is a spectral-spatial image, cropped to the active area of the detector. The bottom panel is a spectrum produced by summing over all y pixels in the image. Known spectral features are marked with red vertical lines.
The only UV emissions present at detectable levels in the UVS nightside Earth observations are Lyman-α and two faint neutral oxygen emissions at 130.4 and 135.6 nm. In contrast, the dayside observations contain many bright spectral features, which are produced primarily by resonant scattering of sunlight by atmospheric species including oxygen and nitrogen and are distributed throughout the UVS bandpass. We therefore use the dayside HP pixel list 2 observation for wavelength calibration. Figure 7 shows a spectral-spatial image of dayglow observed during this exposure. Below the image is a summed spectrum of instrument counts per second as a function of x pixel, with key spectral features labeled and red vertical lines indicating the positions of all identified emission lines. The apparent structure seen in the image at the location of the bright Lyman-α line is not a real spatial variation but evidence of temporary localized gain degradation where the detector is unable to keep up with the large local UV flux. This appears to affect the lower half of the slit more than the upper half, which is likely related to the along-slit motion of the FOV during the flyby. During this particular exposure, the Earth's limb started to move through the slit from the top down, while the bottom of the slit remained on the Earth's disk throughout and therefore accumulated the most flux from the dayside emissions.
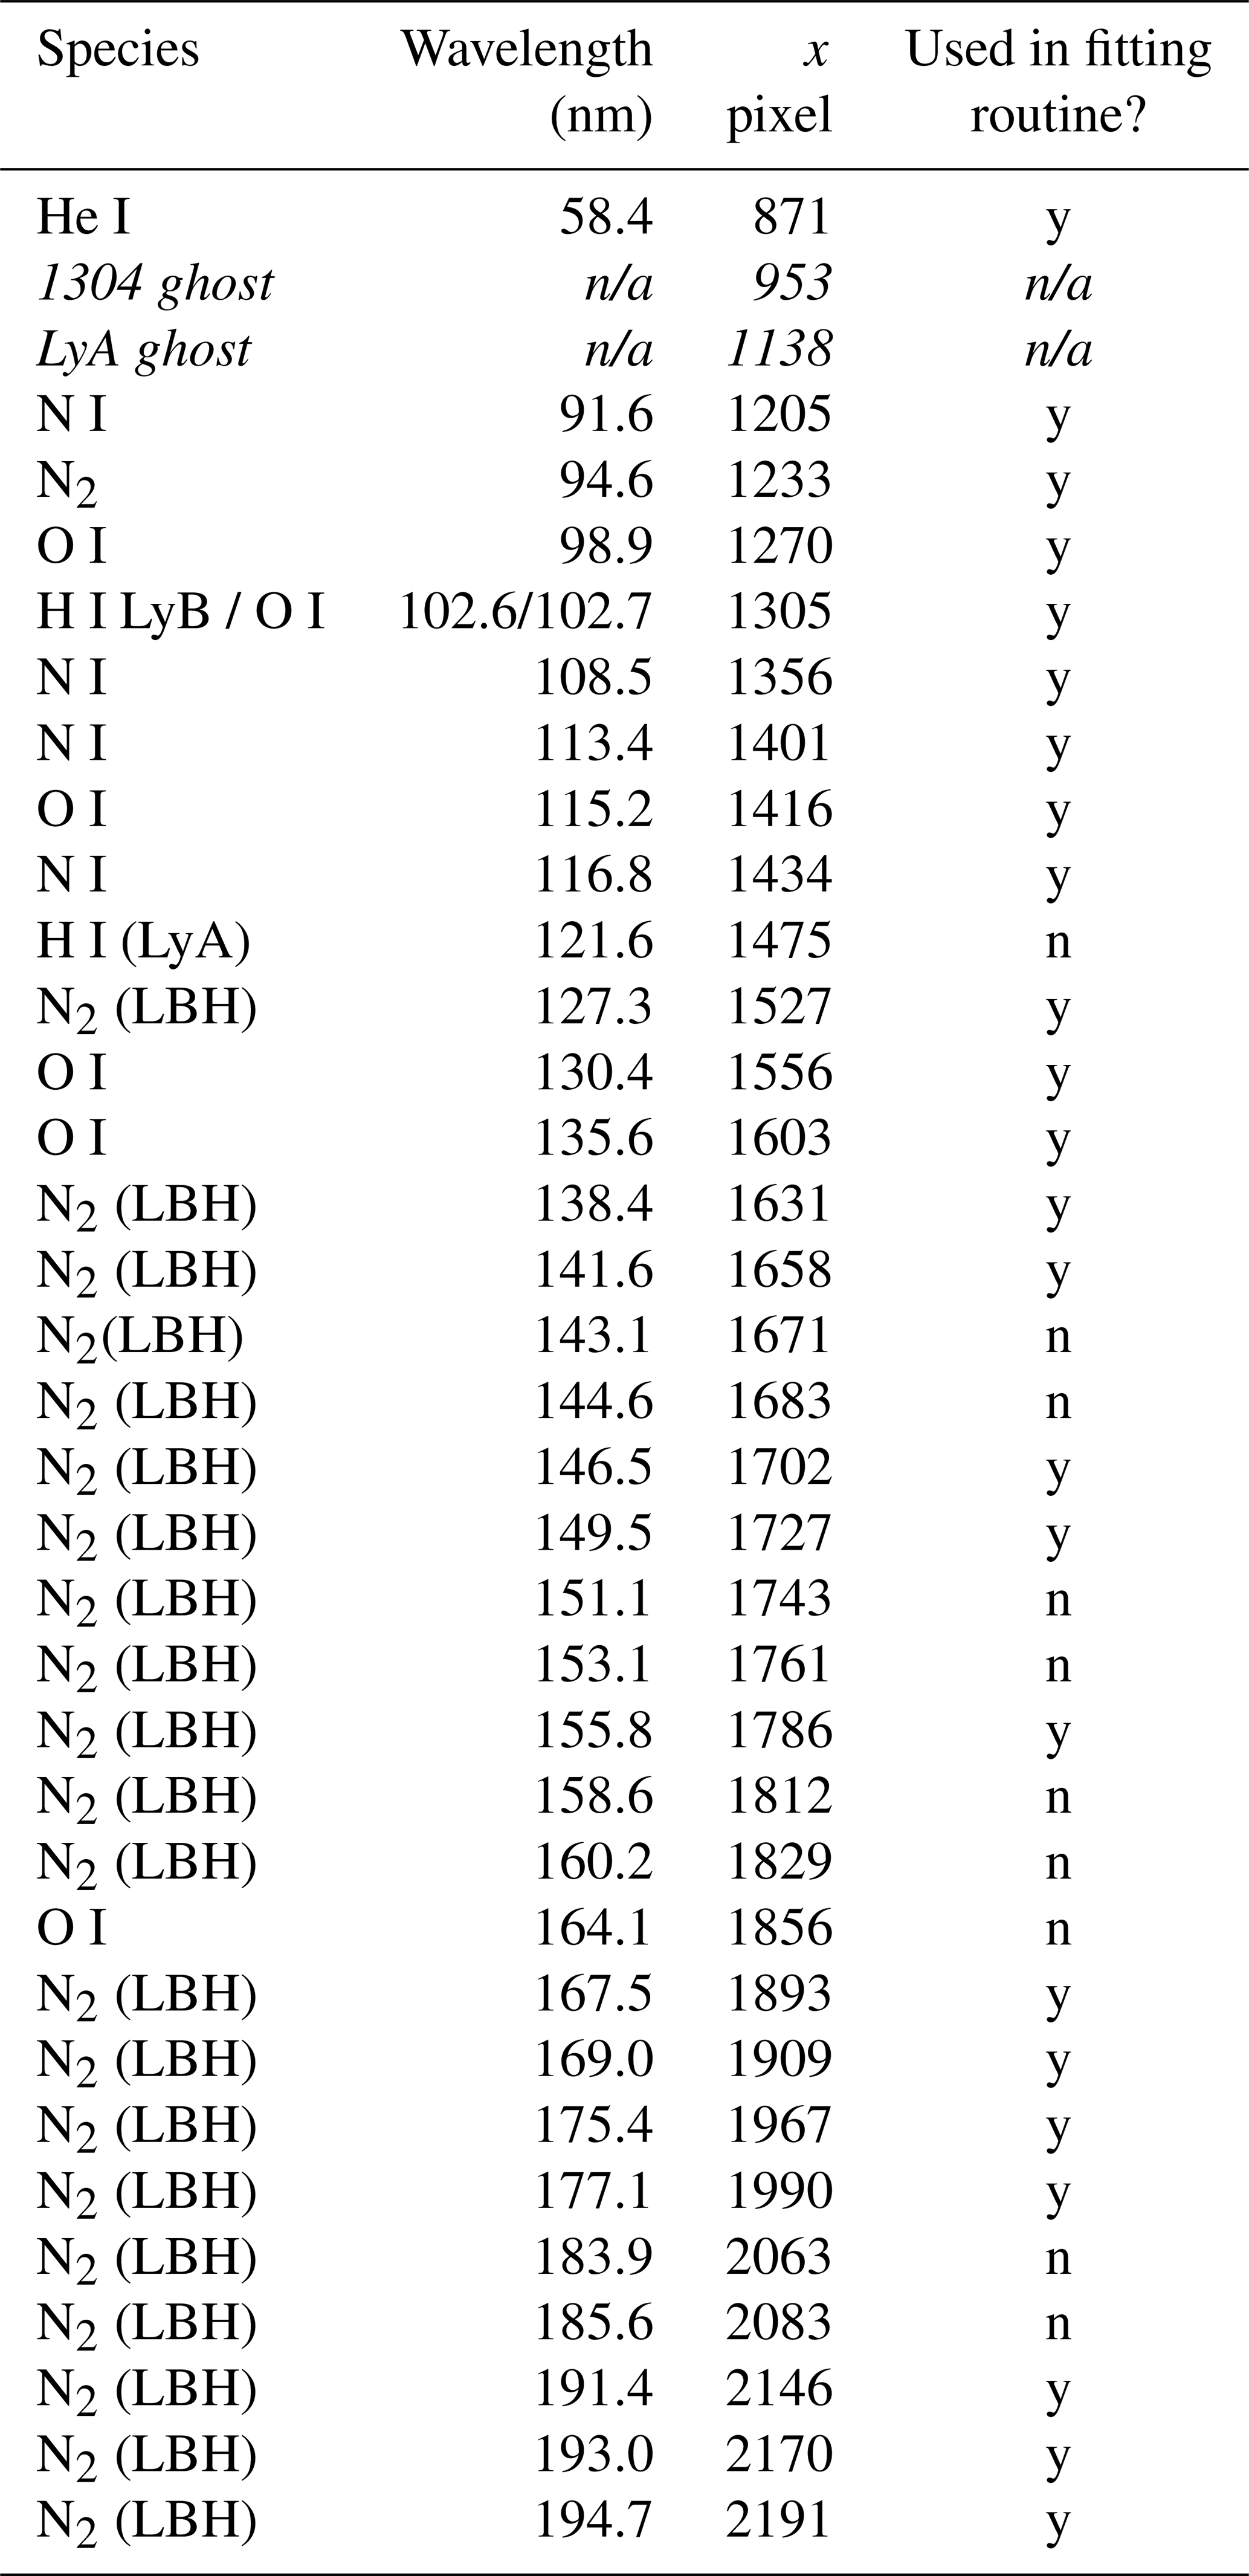
Table 3List of identified spectral features detected in the Earth dayside pixel list observation (HP pixel list 2). Italics indicate instrumental artifacts rather than true spectral features.
y: yes, n: no, n/a: not applicable
Table 3 lists the known wavelength of each identified emission line along with the x position at which the line falls in the summed image shown in Fig. 7b. In order to obtain a two-dimensional wavelength solution, the spectral-spatial image in Fig. 7a is used to create a series of summed spectra from different y positions along the slit (co-adding 100 pixels with a sampling of 50 pixels). For each of these spectra, the x positions of a subset of the emission lines were fitted using a Gaussian fitting routine. The selected lines are identified in the 4th column of Table 3, and were chosen based on the strength of the emission, while avoiding blended features where several close lines overlapped. Another curve fitting procedure was then used to fit the x position vs. known wavelength, to obtain a full wavelength solution for a given y position. This was then interpolated to a 2D map to obtain the wavelength at every position within the detector active area. The best solution was a fifth-order polynomial, shown in Fig. 8. The pixel size in nm therefore varies slightly across the detector, with values of ∼0.11 nm per pixel near the center of the active area and ∼0.07 nm per pixel at the edges of the bandpass, as shown in Fig. 9. These values are consistent with the pre-delivery calibration (Davis et al., 2020) as well as the detector behavior characterized during its standalone testing (Davis et al., 2019).

Figure 8The JUICE-UVS wavelength solution measured using LEGA airglow lines is a fifth-order polynomial.
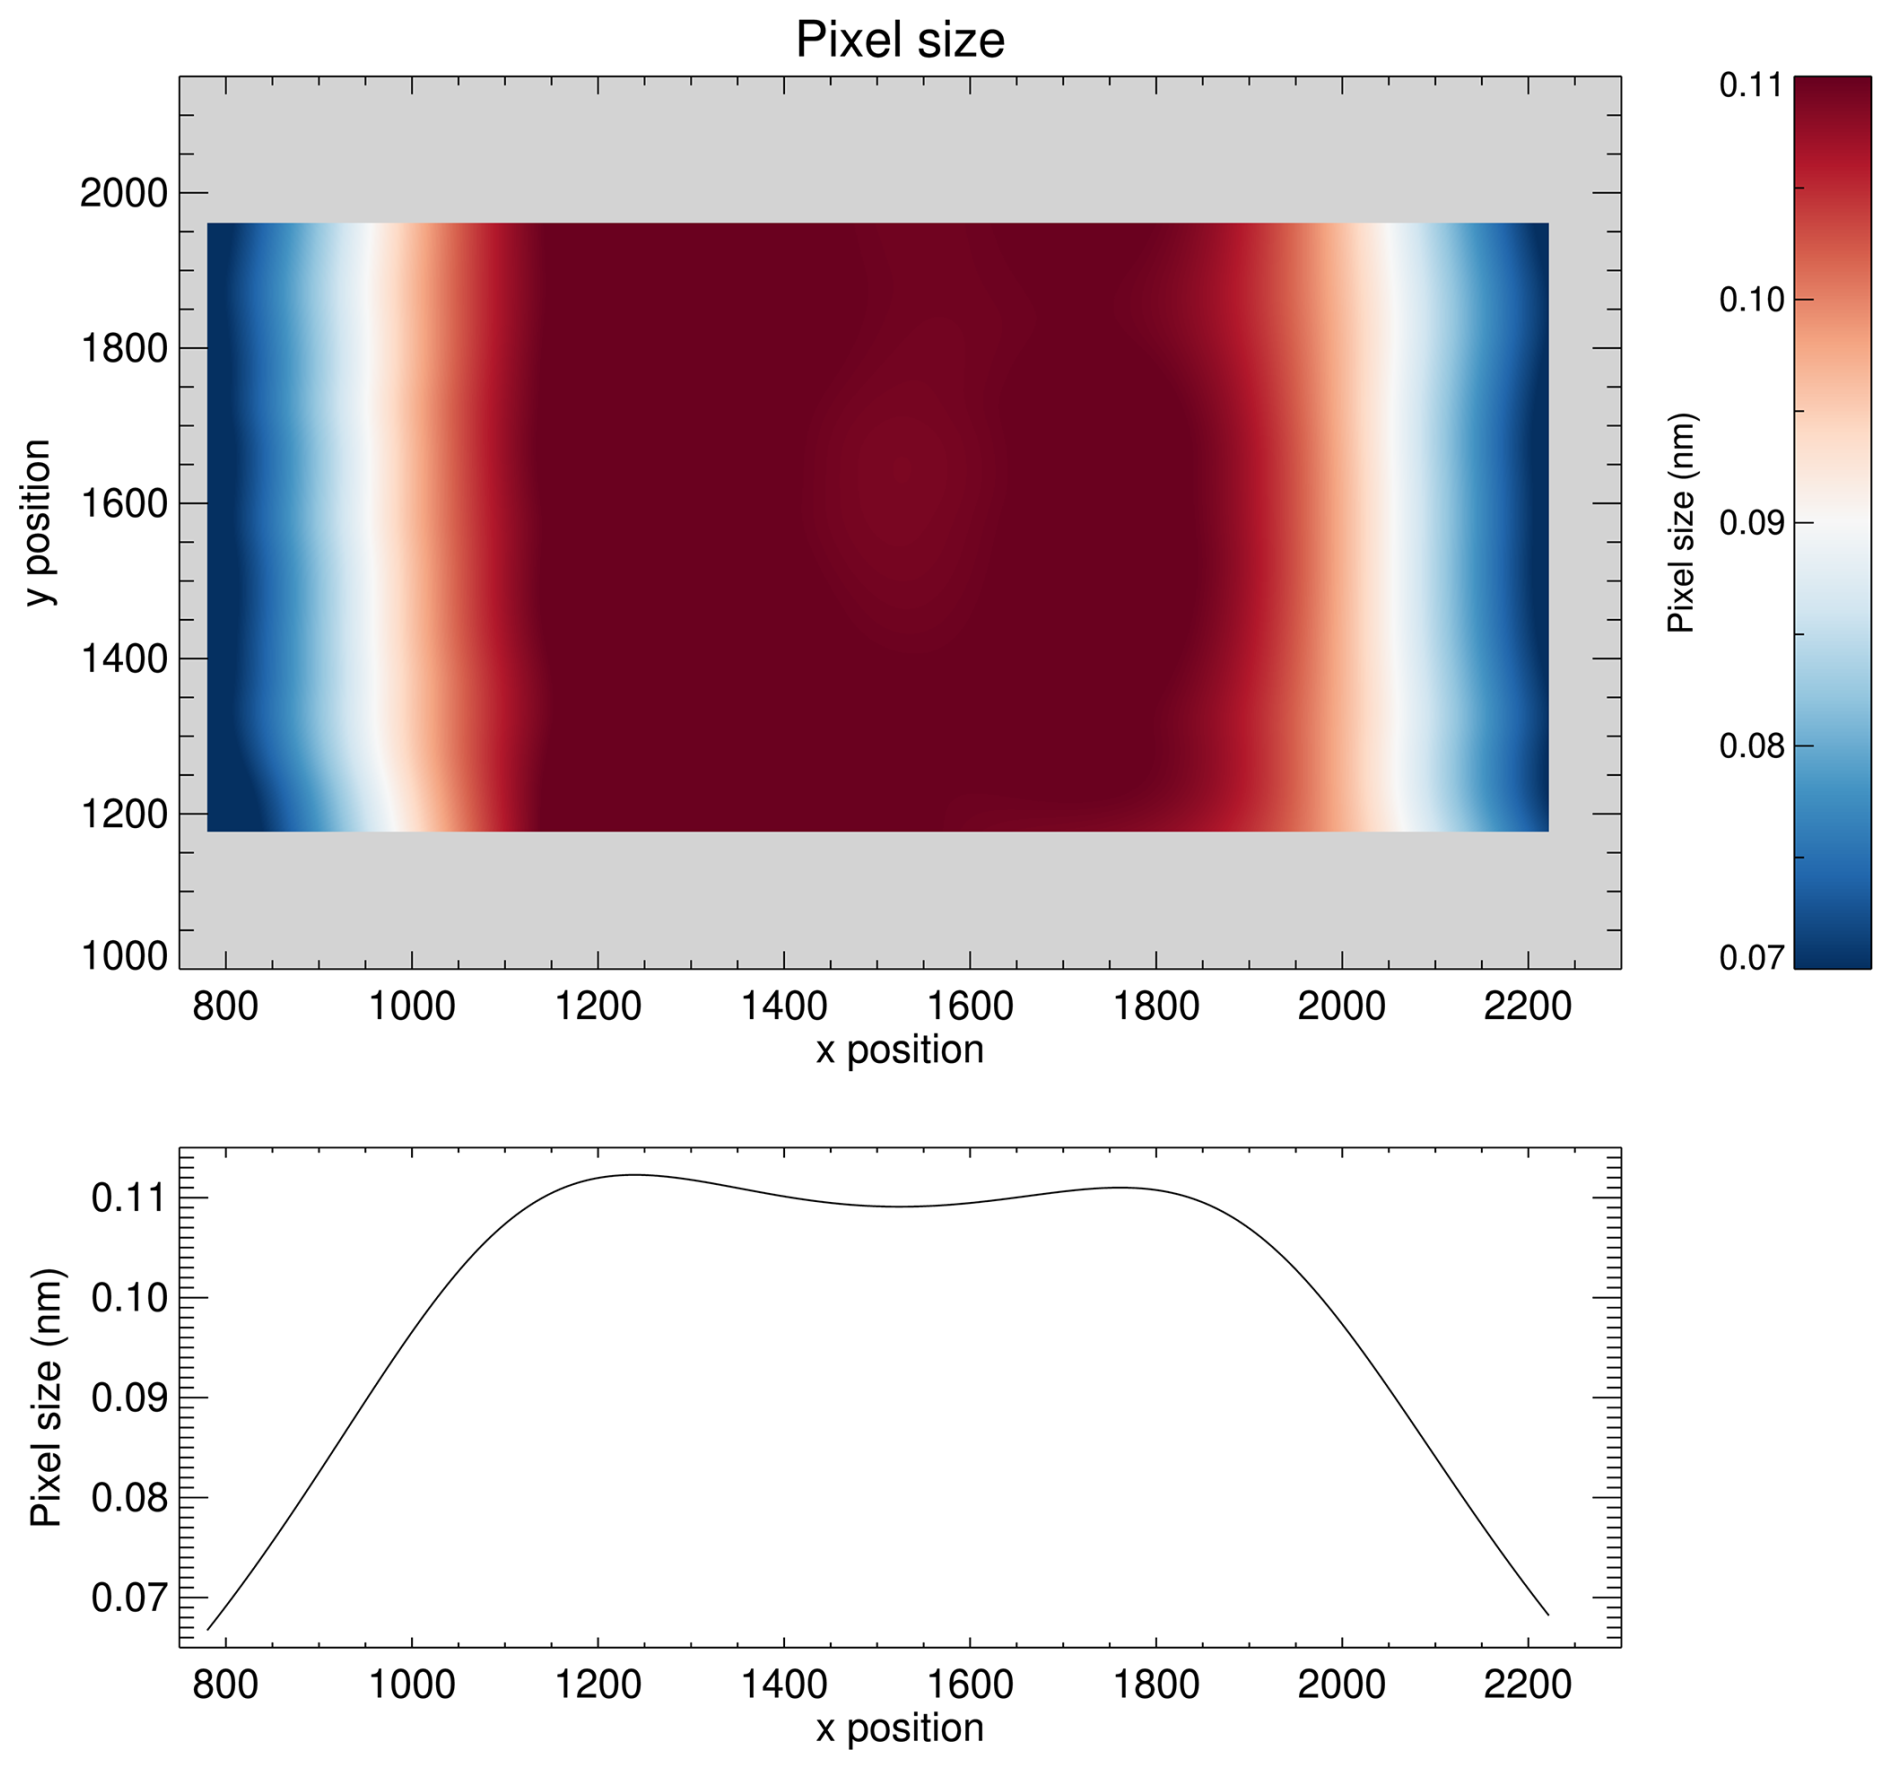
Figure 9The measured JUICE-UVS pixel size varies from ∼0.07 nm at the edges of the detector to ∼0.11 nm near the center.
4.2.2 Airglow time series
The wavelength calibration described above required only the position of each airglow emission line, but we can also compare their intensities to published brightnesses as an additional check of the instrument effective area calibration. We used the three HP histogram observations to produce time series plots showing the how the brightness of Lyman-α and the two neutral oxygen emissions at 130.4 and 135.6 nm varied as the UVS FOV moved from the nightside, across the dawn terminator, and onto the dayside. Each histogram observation consists of multiple frames obtained at the sampling intervals shown in Table 2. We extracted a spectrum from each frame, divided by the sampling time to convert to counts s−1 and then by the solid angle of the slit and the UVS effective area as a function of wavelength to get photons s−1 cm−2 sr−1. We then multiplied the spectrum by a factor of and integrated the signal over the widths of the individual emission lines to get intensity values in Rayleighs at the three wavelengths of interest.
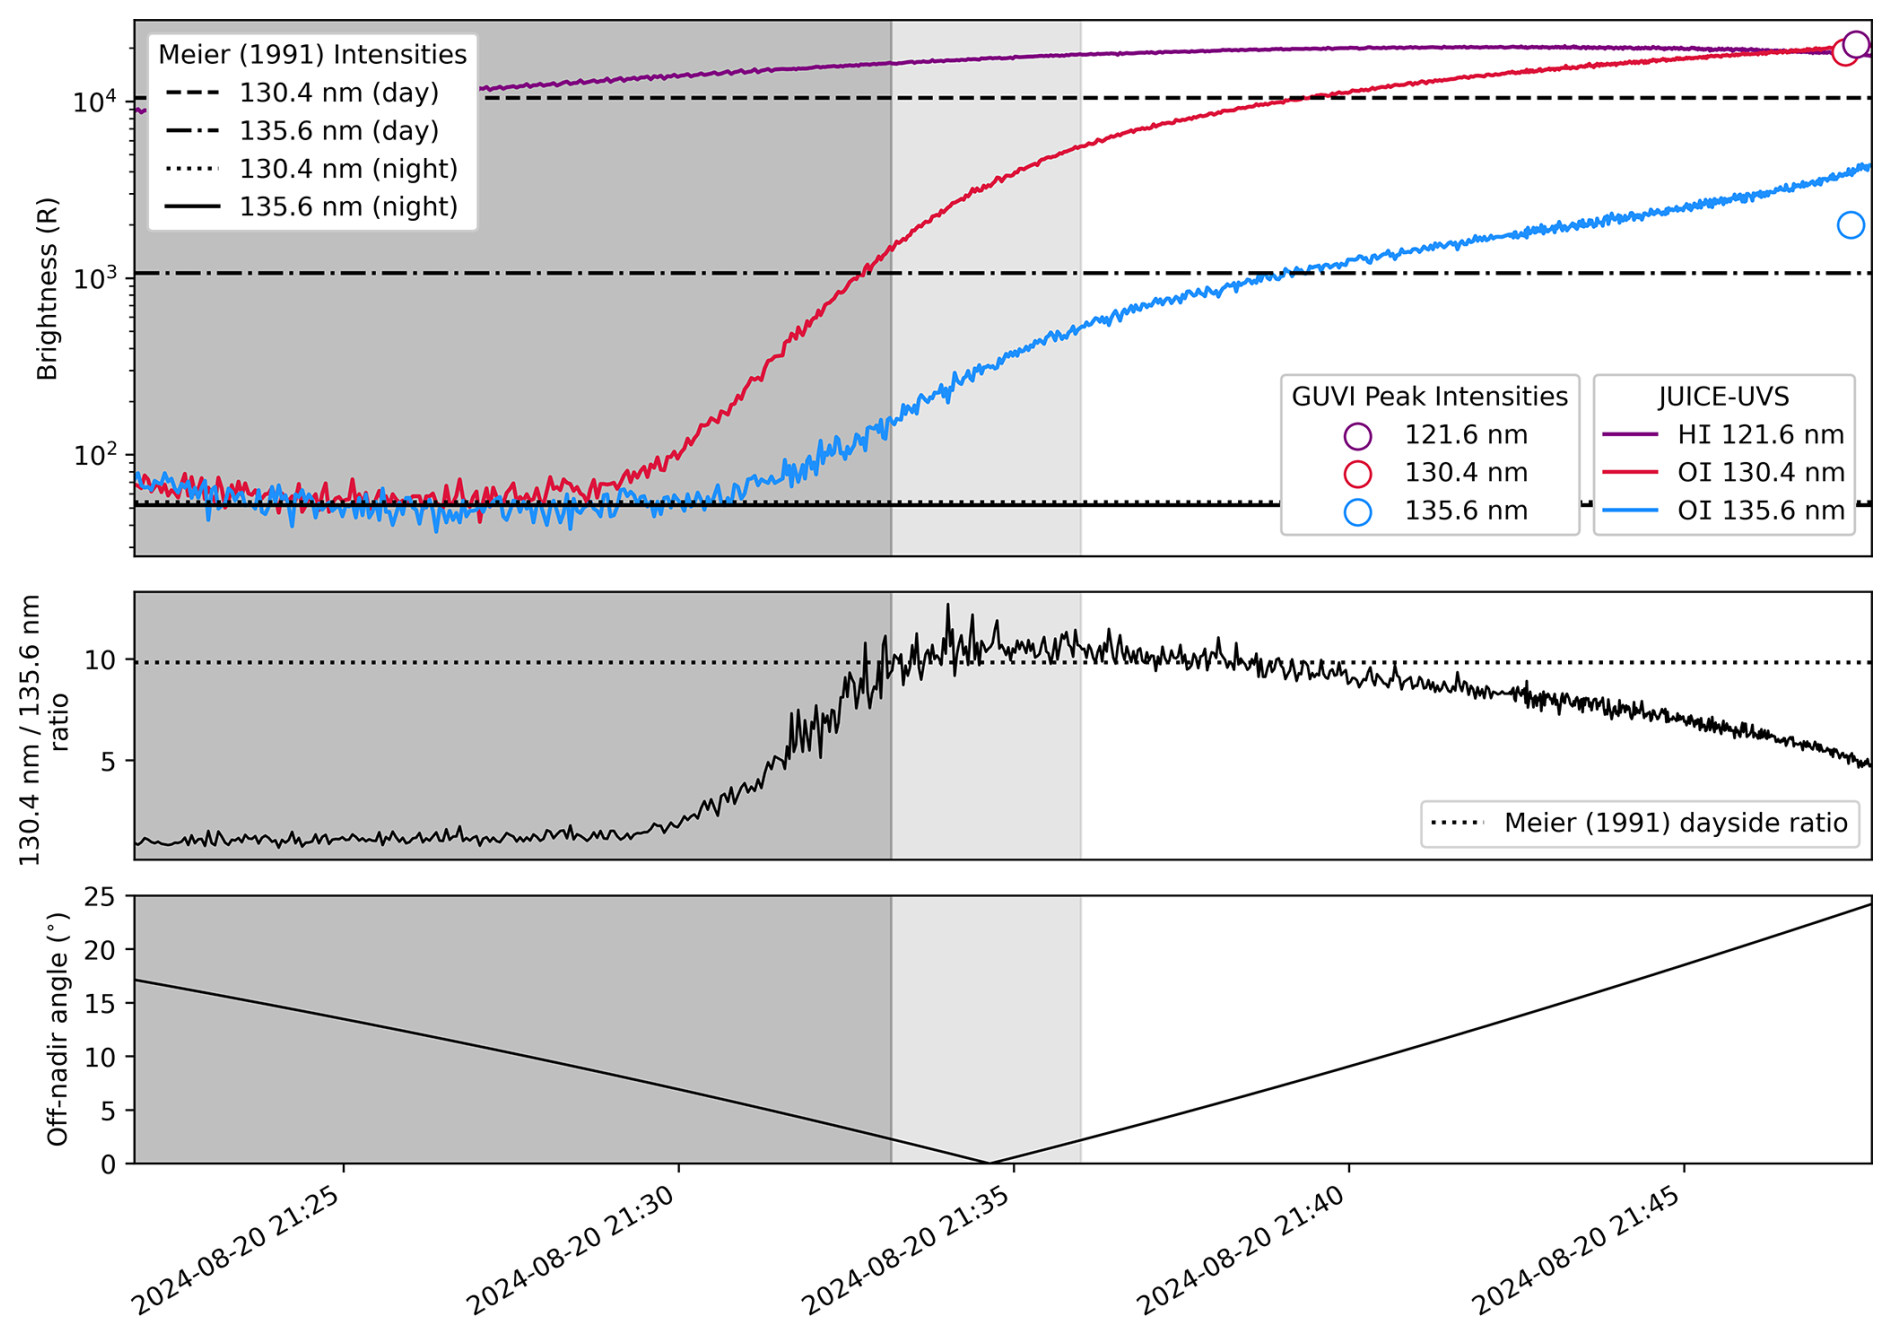
Figure 10Time series of H I Lyman-α, O I 130.4 nm, and O I 135.6 nm airglow emissions over the sequence of three HP histogram observations (top panel). Also shown is the nm intensity ratio (middle panel) and the angle between the UVS boresight and nadir (bottom panel). The dark shaded region in each panel indicates observations on the nightside, and the light grey area shows the time period around the terminator crossing where the UVS footprint extended into both the dayside and nightside. Peak emission intensities measured by TIMED/GUVI on the same day are shown near the end of the time series when JUICE was closest to local noon. The GUVI values are estimated from the Level B Spectrograph summary plots at https://guvitimed.jhuapl.edu/guvi-galleryl1bspec_V013 (last access: 8 October 2026) (Year: 2024; Day of Year: 233; Orbit: 123163).
Figure 10 (top panel) shows how the intensity of the three brightest airglow emissions varied over the sequence of three histograms. The dark grey shading indicates nightside measurements, while the light grey shows times around the terminator crossing when the slit was partially on both the dayside and nightside. Also plotted are horizontal lines showing expected column emission rates for the two oxygen emissions from Meier (1991), which are representative of moderately active solar conditions. While the Earth's UV oxygen emissions have been observed more recently, for example by the Global Ultraviolet Imager (GUVI) on NASA's Thermosphere Ionosphere Mesosphere Energy and Dynamics (TIMED) mission (Paxton et al., 1999), recent studies specifically measuring dayglow are sparse, and the Meier paper remains the most useful compilation of UV dayside and nightside emission intensities. In any case, both dayglow and nightglow emissions are known to be both spatially and temporally variable, so we would not necessarily expect a perfect agreement between the JUICE-UVS measurements and any previously published intensities.
JUICE-UVS measurements of both the individual 130.4 and 135.6 nm emissions (Fig. 10, top) and the ratio of the two (Fig. 10, middle) are very similar to the Meier (1991) values on the nightside. On the dayside, both oxygen emissions increase in intensity with time, reaching peak values of 21 kR (130.4 nm) and 4.4 kR (135.6 nm); considerably brighter than the Meier (1991) values of 10.5 kR (130.4 nm) and 1.1 kR (135.6 nm). The intensity of the UV dayglow emissions is dependent on multiple factors, including solar zenith angle, geomagnetic conditions, ionizing solar flux, and viewing angle. A detailed analysis accounting for each of these factors is beyond the scope of this initial overview paper, but GUVI summary plots for the same day are available online (https://guvitimed.jhuapl.edu/guvi-galleryl1bspec_V013, last access: 8 October 2026) and show similar peak intensities at 130.4 nm and Lyman-α (both ∼20 kR) and a lower peak value of ∼2 kR at 135.6 nm. The discrepancy between the GUVI and JUICE-UVS 135.6 nm measurement is a good demonstration of the effect of viewing angle, as described below.
The ratio between the two oxygen emissions (Fig. 10, middle) varied through the dayside measurements, falling from a ratio of ∼10 at the start of the dayside observations to <5 by the end of the third histogram. This observed trend can be explained by considering the changing angle between the nadir direction and the UVS boresight, plotted in the bottom panel of Fig. 10. As the UVS boresight moved away from nadir, the instrument observed a larger atmospheric column and the intensity increased relative to a measurement pointing at nadir. The intensity of the optically thin 135.6 nm emissions continued to increase as the off-nadir angle increased, while the optical thickness of the 130.4 nm emissions led to a plateau in the observed intensity at that wavelength, so that the observed nm intensity ratio dropped below the Meier (1991) ratio of 9.8 for nadir-pointed dayside observations. This effect has previously been demonstrated: for example, Gladstone (1994) produced simulations of Dynamics Explorer 1 UV airglow images, finding that the optically thick 130.4 nm oxygen emission is a fairly uniform 15–20 kR across the Earth's dayside disk, while the optically thin N2 LBH and oxygen 135.6 nm emissions both exhibit significant limb brightening.
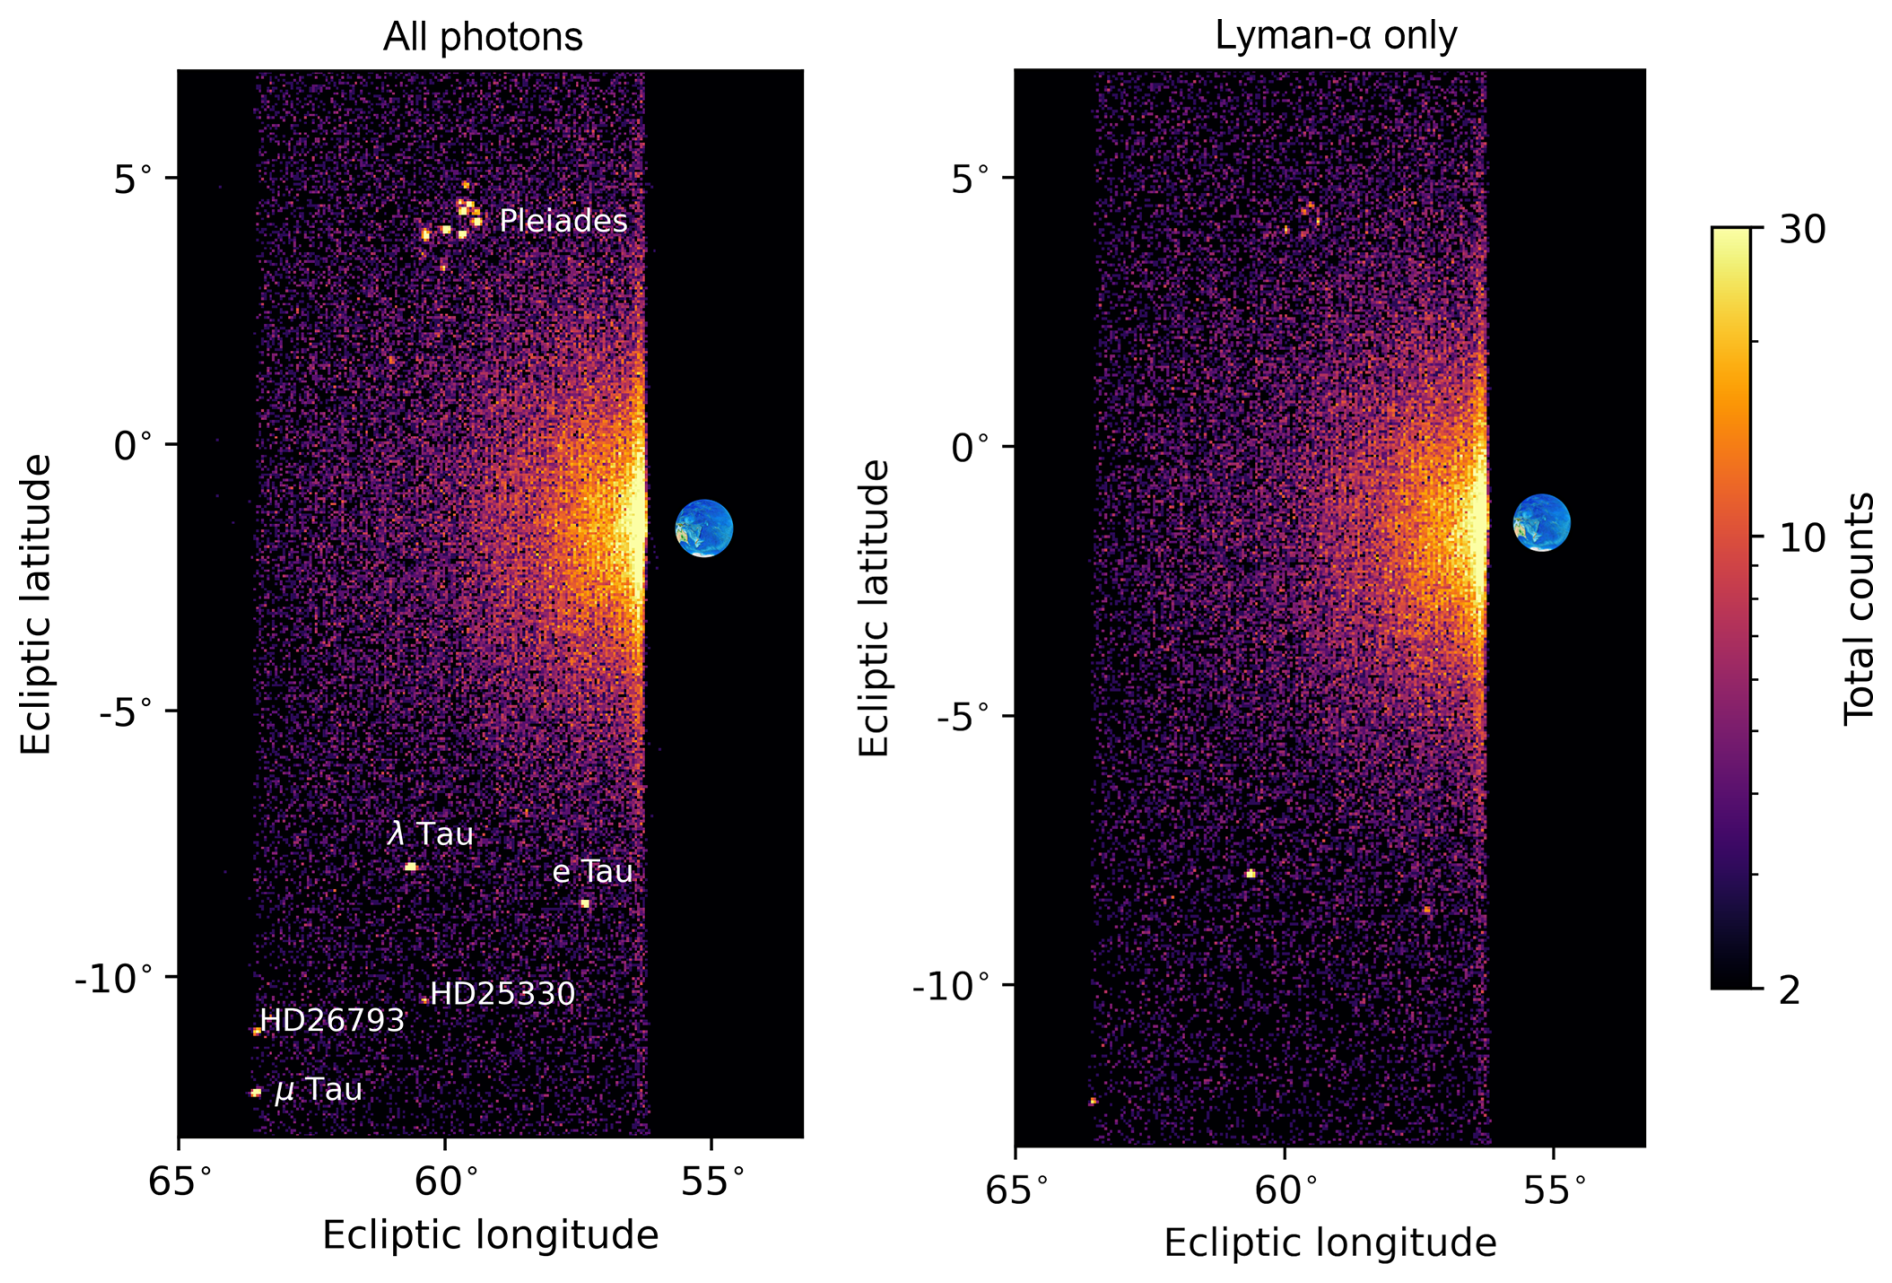
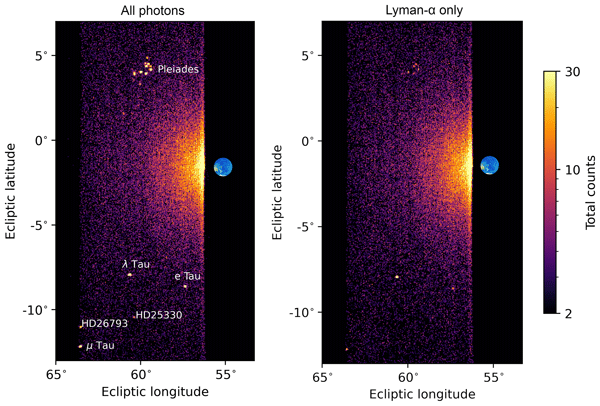
Figure 11JUICE-UVS map of a region near the Earth obtained a few days after the LEGA Earth flyby. Geocoronal H I Lyman-α emissions at 121.6 nm dominate near the Earth, as shown in the right panel, and UV-bright stars in the constellation Taurus become more prominent when the image is integrated over all wavelengths, as shown on the left.
4.3 Post-LEGA spin map of Earth's extended exosphere
Three days after the Earth flyby, UVS had one final opportunity to observe Earth's extended exosphere when JUICE performed a 360° roll around the spacecraft x axis, allowing UVS to map a 7.5° swath of the sky. While the FOV did not cross the Earth during this spin, it covered a region between ∼2 and 15 Earth radii (RE) above the surface. Figure 11 shows the mapped distribution of the photons observed in this area, with an image of the Earth scaled to the correct angular size and location at the time of the observation also shown for context. UV emissions from the Earth's extended geocorona are visible, as are the Pleiades star cluster and several UV-bright stars in the constellation Taurus. Almost all the near-Earth emissions can be attributed to Lyman-α, as shown by the right panel in Fig. 11 (both images use the same scaling, shown by the color bar). The stars appear much dimmer when mapping Lyman-α only, as expected. The relative intensity of each star at Lyman-α is determined by both its magnitude and its spectral type. We used the spin data to search for emissions of helium (58.4 nm) and oxygen (130.4 nm), which may also extend to high altitudes above the Earth, but none were present at detectable levels.

Figure 12Examples of analyses facilitated by the post-LEGA UVS scan observation: (a) map of Lyman-α brightness observed near the Earth by JUICE-UVS; (b) radial Lyman-α brightness profile extracted from a 0.2°-wide latitude region centered on the dashed white line in panel (a); (c) comparison between the observed positions of the 12 stars in the Pleiades with the highest expected UV flux and their known positions (shown by green dots).
Figure 12 demonstrates how this final post-LEGA observation can be used to provide further confidence in the accuracy of the UVS calibration. Panel (a) shows the observed distribution of geocoronal Lyman-α after conversion to brightness units of kR, while Fig. 12b shows a radial brightness profile extracted from a 0.2°-wide Ecliptic latitude region centered on the dashed white line in Fig. 12a. While the intensity of geocoronal Lyman-α is time variable, the observed brightnesses and distribution are consistent with previous observations (e.g., Bertaux, 1978; Baliukin et al., 2019). Finally, Fig. 12c compares the position of stars in the Pleiades mapped by UVS to the expected positions of UV-bright stars listed in the CUBS catalog (Velez et al., 2024), finding an excellent agreement.
The observations performed by UVS during the LEGA period demonstrate some of the key measurement techniques to be used during JUICE's tour of the Jovian system and its orbit around Ganymede. Here, we describe how observations similar to the LEGA ones will be used to study the icy moons, but the same techniques will also be applied to observations of Jupiter, as summarized by Fletcher et al. (2023) and Retherford et al. (2026).
During a typical flyby of one of Jupiter's icy moons, UVS will perform a series of disk scans and limb stares on approach and departure, as well as high-resolution surface observations at closest approach. Each disk scan will extend several hundred km above the limb of the target (nominally ∼ half the satellite radius); in addition to mapping the surface reflectance and the morphology of any auroral or airglow emissions during these scans, UVS will image the extended hydrogen and oxygen coronas of the moons, providing constraints on the composition, distribution, sources and sinks of the moon atmospheres. These coronal emissions will appear similar to the image of the Earth's extended hydrogen corona obtained after the LEGA Earth encounter (Figs. 11 and 12), but dimmer: Ganymede's hydrogen corona, for example, has a peak Lyman-α brightness in the range ∼250–560 R at the limb (Barth et al., 1997; Alday et al., 2017), while JUICE-UVS observed Lyman-α intensities >20 kR at the Earth's limb, reducing to <1 kR near 15 RE.
In between disk scans, limb stares will be performed at a range of latitudes and local times. In these periods, the UVS slit will be positioned either at a tangent to the sunlit limb, close to but not touching the surface, or perpendicular to this, with the boresight at the limb. The first design achieves the best coverage of the low altitudes where the tenuous atmospheres are densest, providing the best opportunity to detect weak emissions from minor species. The second design provides a measurement of the vertical structure of the atmosphere at a specific location and time of day. While the FUV spectra of the icy moon atmospheres are not expected to contain as many emission lines as the Earth spectral image shown in Fig. 7, the wavelength calibration facilitated by the filled-slit Earth observations is critical for the correct identification of any new spectral features observed in these limb stares. UVS will search for emissions of a range of possible atmospheric species, including carbon (156.1, 165.7 nm), carbon monoxide (Cameron and 4P band emissions), sulfur (138.9, 142.9, 147.9, 166.7 nm), chlorine (134.9, 138.6 nm), etc.
Since the icy Galilean satellite atmospheres are dominated by water group species, the two UV oxygen emissions at 130.4 and 135.6 nm are among the most important atmospheric emissions to map and monitor. Previous observations by the Hubble Space Telescope and Juno-UVS have detected these emissions at all three moons, with brightnesses ranging from a few Rayleighs at Callisto (Cunningham et al., 2015) to tens to hundreds of Rayleighs at Europa (Roth et al., 2016) and several hundred Rayleighs at Ganymede (e.g. Feldman et al., 2000; McGrath et al., 2013; Greathouse et al., 2022). By measuring the ratio of the two oxygen lines at different locations and local times – similar to the time series shown in Fig. 10 – JUICE-UVS will determine the spatial and temporal distribution of oxygen species including O2, H2O, and O. Regions dominated by O2, for example, will exhibit a nm intensity ratio of ∼2.3 (Kanik et al., 2003), while the addition of H2O or O produces significantly lower ratios. This technique has previously been used to confirm the presence of a localized H2O atmosphere above the subsolar point on Ganymede (Roth et al., 2021) and on the dayside trailing hemisphere of Europa (Roth, 2021).
Near the closest approach of each satellite flyby, JUICE will rotate from its nominal power-optimized steering attitude to align the spacecraft y axis with the direction of travel. This push-broom orientation means the motion of the UVS FOV over the surface will be in the across-slit direction, covering a much larger angular extent than the mostly along-slit image of the lunar surface shown in Fig. 3a. However, the spacecraft altitude during the UVS lunar observations was within the range of closest approach altitudes sampled by the mission – for example, the 10th Callisto flyby currently planned for 14 August 2032 has an altitude of 1109.7 km – and the image is therefore a good representation of the UVS mapping ability expected for a moderately close flyby (the minimum altitude of any flyby in the tour is 200 km). Within the UVS lunar map it is possible to resolve spatial variations on the scale of several km, such as the shadow within the 12.5 km diameter Langrenus N crater. The spatial resolution of the instrument varies with wavelength; in the 155–197 nm range used for the map the angular resolution is in the range 0.2–0.3° at most positions along the slit (Davis et al., 2020). This is equivalent to a spatial resolution of 3.8–5.8 km from an altitude of 1100 km, and the lunar map therefore appears in line with expectations.
The UV reflectance did not vary much over the region of the lunar surface observed by JUICE-UVS, as demonstrated by the similarity of the two spectra plotted in Fig. 4. At the icy moons, it is expected that larger contrasts will be observed, depending on the spatial distribution of water ice, which becomes highly reflective at wavelengths >165 nm, and other volatiles such as CO2 and SO2 that also have distinct spectral features in the UVS bandpass. UVS will map these volatiles by ratioing images obtained within different spectral regions, for example λ>165 nm λ<165 nm for water ice. This technique was used by Juno-UVS during the 2021 Juno flyby of Ganymede (Molyneux et al., 2022), but the JUICE-UVS maps will benefit from improved spatial coverage, temporal coverage, and longer integration times, leading to significantly improved understanding of the surface composition of each moon and how it is influenced by ongoing exogenic and/or endogenic processes.
While the LEGA observations are useful examples of JUICE-UVS measurement techniques based on reflectance and emission spectroscopy, absorption spectroscopy is also important and has not yet been demonstrated. Most of the UV emission lines expected at both Jupiter and its moons are atomic transitions, analyses of which rely on assumptions about the identity and number density of the parent molecular species, and the local electron population responsible for exciting the emissions. However, many of the expected atmospheric species – including H2O, O2, CO2 at the icy moons, and CH4, C2H2, NH3 at Jupiter – absorb light within the UVS bandpass. JUICE-UVS will measure this absorption using stellar and solar occultations, which provide high resolution, localized information about atmospheric composition and vertical structure. Observations of the Galilean moons as they transit across Jupiter will also be used to search for localized absorption around the limbs that may be associated with any active plumes. There were no opportunities to observe occultations by the Earth or Moon during the LEGA period. While there are some occultations of UV-bright stars by both bodies during the next Earth gravity assist (EGA2, 28 September 2026), none fall in the periods when off-pointing away from the nominal JUICE attitude is permitted and so they cannot be performed. A stellar occultation is therefore the highest priority activity identified by JUICE-UVS for the final gravity assist maneuver (EGA3) in January 2029.
During the JUICE Lunar Earth Gravity Assist period on 19–20 August 2024, JUICE-UVS observed ultraviolet sunlight reflected by the lunar surface and UV airglow emissions in the Earth's atmosphere. These observations provided the first opportunity for calibration of the instrument response to extended planetary targets. A full-resolution spectral image of the Earth's dayside was used to refine the detector wavelength solution, improving on the ground calibration described by Davis et al. (2020), and UV reflectance spectra of the Moon were compared to data from LAMP – another SwRI UV spectrograph with the same basic design as JUICE-UVS – with a generally good agreement found between the two instruments, demonstrating that the JUICE-UVS effective area at wavelengths >130 nm is well characterized. Mapping the first lunar dayside observation to the surface similarly demonstrated that the instrument pointing is accurately represented in the current instrument kernel. A final image of the Earth's extended atmosphere and nearby stars was obtained during a spacecraft spin on 23 August 2024. The measured locations of stars in the Pleiades cluster further confirmed the accuracy of the instrument pointing, and the observed brightness of geocoronal Lyman-α in the altitude range ∼2–15 RE was found to be consistent with previous observations of the same region.
The observations performed by UVS during LEGA covered most of the key observing techniques that will be used during the science phase of the mission and are useful for the development of data analysis tools and procedures in addition to their value for instrument calibration. Further observations in the remaining gravity assist periods will monitor the instrument performance and provide further tests of data collection methods, for example using different binning definitions in histogram observations. Payload operations were not permitted during JUICE's August 2025 Venus gravity assist, but planning is currently underway for the second Earth gravity assist (EGA2) on 28 September 2026. It is expected that JUICE-UVS will again perform filled-slit observations near closest approach, similar to those described in Sect. 4. A limited amount of pointing away from the nominal spacecraft attitude will be permitted within specific periods in the days around closest approach, and it is anticipated that UVS will ride along with distant observations of the Earth and Moon planned at these times. UVS will again ride along with rolls around the spacecraft x axis, similar to the one mapped in Figs. 11 and 12, and the possibility of performing a scan of the Earth's nightside during a period in eclipse on approach to the flyby is also being investigated. Further opportunities for Earth observations will occur during EGA3 on 17 January 2029, and UVS aims to prioritize stellar occultations during that final Earth flyby period.
The JUICE-UVS data acquired during the JUICE LEGA period are currently under the mission's cruise-phase proprietary period and will be made publicly available through the ESA Planetary Science Archive (PSA) following the first Cruise Archive Delivery in 2029. However, all data used for this study will also be included in the PSA Guest Storage Facility archive associated with this special issue (European Space Agency, 2026, ESA-JUICE_LEGA-Special-Issue_v1.0, https://doi.org/10.57780/esa-2bb387d).
The TIMED/SEE solar spectrum used to produce the lunar reflectance spectra in Fig. 5 is available through the LASP Interactive Solar Irradiance Datacenter (LISIRD) at https://lasp.colorado.edu/lisird/data/timed_see_ssi_l3 (last access: 8 October 2026).
PMM led the analysis and drafted the manuscript. MWD, RSG, TKG, TMB, KDR, GRG and JAK contributed to data analysis and interpretation of the results. TKG, MHV, SAF, MWD, PMM, KDR, JAK and RSG designed and implemented the observations. BJT produced the data reduction and calibration pipeline used to generate the UVS science data products. MAF and SCP provided project management. All authors reviewed the manuscript.
The contact author has declared that none of the authors has any competing interests.
Publisher's note: Copernicus Publications remains neutral with regard to jurisdictional claims made in the text, published maps, institutional affiliations, or any other geographical representation in this paper. The authors bear the ultimate responsibility for providing appropriate place names. Views expressed in the text are those of the authors and do not necessarily reflect the views of the publisher.
This article is part of the special issue “The first-ever lunar–Earth flyby: a unique test environment for Juice”. It is not associated with a conference.
JUICE is a mission under ESA leadership with contributions from its Member States, NASA, JAXA and the Israel Space Agency. It is the first Large-class mission in ESA's Cosmic Vision Program. JUICE-UVS is supported by NASA.
This research has been supported by the National Aeronautics and Space Administration, Marshall Space Flight Center (grant no. NNM13AA38C).
This paper was edited by Elias Roussos and reviewed by two anonymous referees.
Alday, J., Roth, L., Ivchenko, N., Retherford, K. D., Becker, T. M., Molyneux, P., and Saur, J.: New constraints on Ganymede's hydrogen corona: Analysis of Lyman-α emissions observed by HST/STIS between 1998 and 2014, Planet. Space Sci., 148, 35–44, https://doi.org/10.1016/j.pss.2017.10.006, 2017.
Baliukin, I. I., Bertaux, J. L., Quémerais, E., Izmodenov, V. V., and Schmidt, W.: SWAN/SOHO Lyman‐α mapping: The hydrogen geocorona extends well beyond the Moon, J. Geophys. Res.-Space Phys., 124, 861–885, https://doi.org/10.1029/2018JA026136, 2019.
Barth, C. A., Hord, C. W., Stewart, A. I. F., Pryor, W. R., Simmons, K. E., McClintock, W. E., Ajello, J. M., Naviaux, K. L., and Aiello, J. J.: Galileo ultraviolet spectrometer observations of atomic hydrogen in the atmosphere of Ganymede, Geophys. Res. Lett., 24, 2147–2150, https://doi.org/10.1029/97GL01927, 1997.
Bertaux, J.-L.: Interpretation of OGO-5 line shape measurements of Lyman-alpha emission from terrestrial exospheric hydrogen, Planet. Space Sci., 26, 431–447, https://doi.org/10.1016/0032-0633(78)90065-X, 1978.
Byron, B. D., Retherford, K. D., Greathouse, T. K., Wyrick, D., Cahill, J. T. S., Hendrix, A. R., Raut, U., Mandt, K. E., and Denevi, B. W.: Far‐UV observations of lunar rayed craters with LRO‐LAMP, J. Geophys. Res.-Planets, 125, e2019JE006269, https://doi.org/10.1029/2019JE006269, 2020.
Cunningham, N. J., Spencer, J. R., Feldman, P. D., Strobel, D. F., France, K., and Osterman, S. N.: Detection of Callisto's oxygen atmosphere with the Hubble Space Telescope, Icarus, 254, 178–189, https://doi.org/10.1016/j.icarus.2015.03.021, 2015.
Czajka, E., Retherford, K., Kramer, G., Hendrix, A., Cahill, J., Byron, B., Greenhagen, B., Greathouse, T., Magaña, L., Mandt, K., and Grava, C.: New Insights into Aristarchus Crater with LRO LAMP Far-ultraviolet Observations, Planet. Sci. J., 4, 137, https://doi.org/10.3847/PSJ/acdee9, 2023.
Davis, M. W., Gladstone, G. R., Greathouse, T. K., Slater, D. C., Versteeg, M. H., Persson, K. B., Winters, G. S., Persyn, S, C., and Eterno, J. S.: Radiometric performance results of the Juno ultraviolet spectrograph (Juno-UVS), Proc. SPIE 8146, UV/Optical/IR Space Telescopes and Instruments: Innovative Technologies and Concepts V, 814604, https://doi.org/10.1117/12.894274, 2011.
Davis, M. W., Siegmund, O. H. W., Gladstone, G. R., Martin, A., Molyneux, P. M., Retherford, K. D., Veach, T. J., and Vallerga, J. V.: Bench and thermal vacuum testing of the JUICE-UVS microchannel plate detector system, Proc. SPIE 11118, UV, Ex-Ray, and Gamma-Ray Space Instrumentation for Astronomy XXI, 111180Q, https://doi.org/10.1117/12.2529649, 2019.
Davis, M. W., Gladstone, G. R., Giles, R. S., Greathouse, T. K., Molyneux, P. M., Raut, U., Retherford, K. D., Baldor, S., Versteeg, M. H., Freeman, M., Persson, K., and Persyn, S. C.: Ground calibration results of the JUICE ultraviolet spectrograph, Proc. SPIE 11444, Space Telescopes and Instrumentation 2020: Ultraviolet to Gamma Ray, 1144404, https://doi.org/10.1117/12.2562986, 2020.
Davis, M. W., Gladstone, G. R., Greathouse, T. K., Molyneux, P. M., Retherford, K. D., Ferrell, S. A., Versteeg, M. H., and Persyn, S. C.: Results of the JUICE ultraviolet spectrograph near-Earth commissioning, Proc. SPIE 13093, Space Telescopes and Instrumentation 2024: Ultraviolet to Gamma Ray, 1309305, https://doi.org/10.1117/12.3020022, 2024.
Davis, M. W., Giles, R. S., Greathouse, T. K., Molyneux, P. M., Ferrell, S. A., Versteeg, M. H., Gladstone, G. R., Retherford, K. D., Trantham, B. J., Freeman, M. A., and Persyn, S. C.: Jupiter icy moons explorer ultraviolet spectrograph: results from payload checkouts 1 and 2 and the lunar-Earth gravity assist maneuver, Proc. SPIE 13625, UV, X-Ray, and Gamma-Ray Space Instrumentation for Astronomy XXIV, 1362508, https://doi.org/10.1117/12.3063995, 2025.
Denk, T., Williams, D. A., Tosi, F., Bell, J. F., Mottola, S., de Pater, I., Lainey, V., Molyneux, P., Matz, K.-D., Hartogh, P. Lopes, R. M., Solomonidou, A., Thomas, P. C., Huybrighs, H. L. F., Gurvits, L. I., Mura, A., Retherford, K. D., Rezac, L., Roatsch, T., Roth, L., Haslebacher, N., Tubiana, C., Lucchetti, A., Langevin, Y., Poulet, F., Lellouch, E., Tsuchiya, F., Vallat, C., Van Hoolst, T., Vorburger, A., Wurz, P., D’Aversa, E., Gladstone, R., Greathouse, T., Schneider, N., Zambon, F., Altobelli, N., Palumbo, P., Portyankina, G., Aharonson, O., Bruzzone, L., Carter, J., Cecconi, B., Cooper, N., Costa Sitjà, M., Escalante López, A., Futaana, Y., Mazzotta Epifani, E., Migliorini, A., Moore, W. B., Moreno, R., Murray, C., Penasa, L., Piccioni, G., Schmidt, J., Wahlund, J.-E., and Witasse, O.: Io and the Minor Jovian Moons – Prospects for JUICE, Space Sci. Rev., 222, 27, https://doi.org/10.1007/s11214-025-01263-6, 2026.
European Space Agency: ESA-JUICE_LEGA-Special-Issue_v1.0, European Space Agency [data set], https://doi.org/10.57780/esa-2bb387d, 2026.
Feldman, P. D., McGrath, M. A., Strobel, D. F., Moos, H. W., Retherford, K. D., and Wolven, B. C.: HST/STIS ultraviolet imaging of polar aurora on Ganymede, Astrophys. J., 535, 1085–1090, https://doi.org/10.1086/308889, 2000.
Fletcher, L. N., Cavalié, T., Grassi, D., Hueso, R., Lara. L. M.,Kaspi, Y., Galanti, E., Greathouse, T. K., Molyneux, P. M., Galand, M., Vallat, C., Witasse, O., Lorente, R., Hartogh, P., Poulet, F., Langevin, Y., Palumbo, P., Gladstone, G. R., Retherford, K. D., Dougherty, M. K., Wahlund, J.-E., Barabash, S., Iess, L., Bruzzone, L., Hussmann, H., Gurvits, L. I., Santolik, O., Kolmasova, I., Fischer, G., Müller-Wodarg, I., Piccioni, G., Fouchet, T., Gérard, J.-C., Sánchez-Lavega, A., Irwin, P. G. J., Grodent, D., Altieri, F., Mura, A., Drossart, P., Kammer, J., Giles, R., Cazaux, S., Jones, G., Smirnova, M., Lellouch, E., Medvedev, A. S., Moreno, R., Rezac, L., Coustenis, A., and Costa, M.: Jupiter Science Enabled by ESA's Jupiter Icy Moons Explorer, Space Sci. Rev., 219, https://doi.org/10.1007/s11214-023-00996-6, 2023.
Gladstone, G. R.: Simulations of DE 1 UV airglow images, J. Geophys. Res., 99, 11441–11448, https://doi.org/10.1029/93JA03525, 1994.
Gladstone, G. R., Stern, S. A., Retherford, K. D., Black, R. K., Slater, D. C., Davis, M. W., Versteeg, M. H., Persson, K. B., Parker, J. W., Kaufmann, D. E., Egan, A. F., Greathouse, T. K., Feldman, P. D., Hurley, D., Pryor W. R., and Hendrix, A. R.: LAMP: the Lyman alpha mapping project on NASA's Lunar reconnaissance orbiter mission, Space Sci. Rev., 150, 161–181, https://doi.org/10.1007/s11214-009-9578-6, 2010.
Gladstone, G. R., Persyn, S. C., Eterno, J. S., Walther, B. C., Slater, D. C., Davis, M. W., Versteeg, M. H., Persson, K. B., Young, M. K., Dirks, G. J., Sawka, A. O., Tumlinson, J., Sykes, H., Beshears, J., Rhoad, C. L., Cravens, J. P., Winters, G. S., Klar, R. A., Lockhart, W., Piepgrass, B. M., Greathouse, T. K., Trantham, B. J., Wilcox, P. M., Jackson, M. W., Siegmund, O. H. W., Vallerga, J. V., Raffanti, R., Martin, A., Gérard, J.-C., Grodent, D. C., Bonfond, B., Marquet, B., and Denis, F.: The ultraviolet spectrograph on NASA's Juno mission, Space Sci. Rev., 213, 447–473, https://doi.org/10.1007/s11214-014-0040-z, 2017.
Greathouse, T. K., Gladstone, G. R., Molyneux, P. M., Versteeg, M. H., Hue, V., Kammer, J. A., Davis, M. W., Bolton, S. J., Giles, R. S., Connerney, J. E. P., and Gerard, J.-C.: UVS observations of Ganymede's aurora during Juno orbits 34 and 35, Geophys. Res. Lett., 49, e2022GL099794, https://doi.org/10.1029/2022GL099794, 2022.
Kanik, I., Noren, C., Makarov, O. P., Vattipalle, P., Ajello, J. M., and Shemansky, D. E.: Electron impact dissociative excitation of O2: 2. Absolute emission cross sections of the OI (130.4 nm) and OI (135.6 nm) lines, J. Geophys. Res.-Planets, 108, https://doi.org/10.1029/2000JE001423, 2003.
McGrath, M. A., Jia, X., Retherford, K., Feldman, P. D., Strobel, D. F., and Saur, J.: Aurora on Ganymede, J. Geophys. Res.-Space Phys., 118, 2043–2054, https://doi.org/10.1002/jgra.50122, 2013.
Meier, R. R.: Ultraviolet spectroscopy and remote sensing of the upper atmosphere, Space Sci. Rev., 58, 1–185, https://doi.org/10.1007/BF01206000, 1991.
Molyneux, P. M., Greathouse, T. K., Gladstone, G. R., Versteeg, M. H., Hue, V., Kammer, J., Davis, M. W., Bolton, S. J., Giles, R., Connerney, J. E. P., and Gérard, J.-C.: Ganymede's UV reflectance from Juno‐UVS data, Geophys. Res. Lett., 49, e2022GL099532, https://doi.org/10.1029/2022GL099532, 2022.
Paxton, L. J., Christensen, A. B., Humm, D. C., Ogorzalek, B. S., Pardoe, C. T., Morrison, D., Weiss, M. B., Crain, W., Lew, P. H., Mabry, D. J., and Goldsten, J. O.: Global ultraviolet imager (GUVI): Measuring composition and energy inputs for the NASA Thermosphere Ionosphere Mesosphere Energetics and Dynamics (TIMED) mission, Proc. SPIE 3756, Optical Spectroscopic Techniques and Instrumentation for Atmospheric and Space Research III, https://doi.org/10.1117/12.366380, 1999.
Retherford, K. D., Becker, T. M., Gladstone, G. R., Greathouse, T.K., Davis, M. W., Velez, M. A., Freeman, M. A., Brooks, S. M., Ferrell, S., Giles, R. S., Hendrix, A. R., Hue, V., Johnson, E., Kammer, J. A., Marinan, A. D., Mamo, B. D., McGrath, M. A., Molyneux, P. M., Nerney, E. G., Perez, B., Persson, K. B., Pope, S., Raut, U., Rickerson, R., Roth, L., Saur, J., Siegmund, O. H. W, Spencer, J. R., Steffl, A. J., Stern, S. A., Trantham, B. J., Versteeg, M. H., Winkenstern, J., and the Europa-UVS Team: Europa Ultraviolet Spectrograph (Europa-UVS), Space Sci. Rev., 220, 89, https://doi.org/10.1007/s11214-024-01121-x, 2024.
Retherford, K. D., Molyneux, P. M., Greathouse, T. K., Davis, M. W., Gladstone, G. R., Persyn, S. C., Versteeg, M. H., Araujo, M. F., Bagenal, F., Becker, T. M. Beth, A., Black, R. K., Bonfond, B., Brooks, S. M., Bunce, E. J., Carapelle, A., Cortinas, S., Dirks, G. J., Esquivel, B., Feldman, P. D., Ferrell, S., Ferris, M., Fletcher, L. N., Freeman, M. A., Galand, M., Giles, R. S., Grodent, D., Hue, V., Johnson, E., Kammer, J. A., Kempe, C., Lamy, L., Martin, A., McGrath, M. A., Nerney, E. G., Nuñez, C., Olsen, Z., Pelletier, N., Perez, B., Persson, K. B., Quémerais, E., Raffanti, R., Raut, U., Rickerson, R., Roth, L., Siegmund, O. H. W., Spencer, J. R., Steffl, A. J., Trantham, B. J., Vallerga, J. V., Veach, T. J., Velez, M. A., Walther, B. C., and the JUICE-UVS Team: The Ultraviolet Spectrograph on ESA's Jupiter Icy Moons Explorer Mission (JUICE-UVS), arXiv [preprint], https://arxiv.org/abs/2609.02856, 2 September 2026.
Roth, L.: A stable H2O atmosphere on Europa's trailing hemisphere from HST images, Geophys. Res. Lett., 48, e2021GL094289, https://doi.org/10.1029/2021GL094289, 2021.
Roth, L., Saur, J., Retherford, K. D., Strobel, D. F., Feldman, P. D., McGrath, M. A., Spencer, J. R., Blöcker, A., and Ivchenko, N.: Europa's far ultraviolet oxygen aurora from a comprehensive set of HST observations, J. Geophys. Res.-Space Phys., 121, 2143–2170, https://doi.org/10.1002/2015JA022073, 2016.
Roth, L., Ivchenko, N., Gladstone, G. R., Saur, J., Grodent, D., Bonfond, B., Molyneux, P. M., and Retherford, K. D.: A sublimated water atmosphere on Ganymede detected from Hubble Space Telescope observations, Nat. Astron., 5, 1043–1051, https://doi.org/10.1038/s41550-021-01426-9, 2021.
Siegmund, O. H. W., McPhate, J. B., Jelinsky, S. R., Vallerga, J. V., Tremsin, A. S., and Hemphill, R.: Large area microchannel plate imaging counting detectors with sub-nanosecond timing, IEEE T. Nucl. Sci., 60, 923–931, https://doi.org/10.1109/TNS.2013.2252364, 2013.
Slater, D. C., Davis, M. W., Olkin, C. B., Scherrer, J., and Stern, S. A.: Radiometric performance results of the New Horizons' ALICE UV imaging spectrograph. Proc. SPIE 5906, Astrobiology and Planetary Missions, 590619, https://doi.org/10.1117/12.613127, 2005.
Stern, S. A., Slater, D. C., Scherrer, J., Stone, J., Versteeg, M., A'Hearn, M. F., Bertaux, J. L., Feldman, P. D., Festou, M. C., Parker, J. W., and Siegmund, O. H. W.: Alice: the Rosetta ultraviolet imaging spectrograph, Space Sci. Rev., 128, 507–527, https://doi.org/10.1007/s11214-006-9035-8, 2007.
Stern, S. A., Slater, D. C., Scherrer, J., Stone, J., Dirks, G., Versteeg, M., Davis, M., Gladstone, G. R., Parker, J. W., Young, L. A., and Siegmund, O. H. W.: ALICE: The ultraviolet imaging spectrograph aboard the New Horizons Pluto–Kuiper Belt mission, Space Sci. Rev., 140, 155–187, https://doi.org/10.1007/s11214-008-9407-3, 2008.
Tosi, F., Roatsch, T., Galli, A., Hauber, E., Lucchetti, A., Molyneux, P., Stephan, K., Achilleos, N., Bovolo, F., Carter, J., Cavalié, T., Cimò, G., D’Aversa, E., Gwinner, K., Hartogh, P., Huybrighs, H., Langevin, Y., Lellouch, E., Migliorini, A., Palumbo, P., Piccioni, G., Plaut, J. J., Postberg, F., Poulet, F., Retherford, K., Rezac, L., Roth, L., Solomonidou, A., Tobie, G., Tortora, P., Tubiana, C., Wagner, R., Wirström, E., Wurz, P., Zambon, F., Zannoni, M., Barabash, S., Bruzzone, L., Dougherty, M., Gladstone, R., Gurvits, L. I., Hussmann, H., Iess, L., Wahlund, J.-E., Witasse, O., Vallat, C., and Lorente, R.: Characterization of the surfaces and near-surface atmospheres of Ganymede, Europa and Callisto by JUICE, Space Sci. Rev., 220, https://doi.org/10.1007/s11214-024-01089-8, 2024.
Van Hoolst, T., Tobie, G., Vallat, C., Altobelli, N., Bruzzone, L., Cao, H., Dirkx, D., Genova, A., Hussmann, H., Iess, L., Kimura, J., Khurana, K., Lucchetti, A., Mitri, G., Moore, W., Saur, J., Stark, A., Vorburger, A., Wieczorek, M., Aboudan, A., Bergman, J., Bovolo, F., Breuer, D., Cappuccio, P., Carrer, L., Cecconi, B., Choblet, G., De Marchi, F., Fayolle, M., Fienga, A., Futaana, Y., Hauber, E., Kofman, W., Kumamoto, A., Lainey, V., Molyneux, P., Mousis, O., Plaut, J., Puccio, W., Retherford, K., Roth, L., Seignovert, B., Steinbrügge, G., Thakur, S., Tortora, P., Tosi, F., Zannoni, M., Barabash, S., Dougherty, M., Gladstone, R., Gurvits, L. I., Hartogh, P., Palumbo, P., Poulet, F., Wahlund, J.-E., Grasset, O., and Witasse, O.: Geophysical characterization of the interiors of Ganymede, Callisto and Europa by ESA's Jupiter ICy moons Explorer, Space Sci. Rev., 220, https://doi.org/10.1007/s11214-024-01085-y, 2024.
Velez, M. A., Retherford, K. D., Hue, V., Kammer, J. A., Becker, T. M., Gladstone, G. R., Davis, M. W., Greathouse, T. K., Molyneux, P. M., Brooks, S. M., Raut, U., and Versteeg, M. H.: Catalog of Ultraviolet Bright Stars: Strategies for UV Occultation Measurements, Planetary Illumination Modeling, and Sky Map Analyses Using Hybrid IUE-Kurucz Spectra, Planet. Sci. J., 5, 93, https://doi.org/10.3847/PSJ/ad0e70, 2024.
Woods, T. N., Eparvier, F. G., Bailey, S. M., Chamberlin, P. C., Lean, J., Rottman, G. J., Solomon, S. C., Tobiska, W. K., and Woodraska, D. L.: Solar EUV Experiment (SEE): Mission overview and first results, J. Geophys. Res.-Space Phys., 110, https://doi.org/10.1029/2004JA010765, 2005.
- Abstract
- Introduction
- Instrument design and operations
- UVS observations of the Moon
- UVS observations of the Earth
- Application to future observations of the Jupiter system
- Summary and Conclusions
- Data availability
- Author contributions
- Competing interests
- Disclaimer
- Special issue statement
- Acknowledgements
- Financial support
- Review statement
- References
- Abstract
- Introduction
- Instrument design and operations
- UVS observations of the Moon
- UVS observations of the Earth
- Application to future observations of the Jupiter system
- Summary and Conclusions
- Data availability
- Author contributions
- Competing interests
- Disclaimer
- Special issue statement
- Acknowledgements
- Financial support
- Review statement
- References