
the Creative Commons Attribution 4.0 License.
the Creative Commons Attribution 4.0 License.
 | 14 Oct 2026
In-flight receiver calibration of the Ganymede Laser Altimeter (GALA) by passive Earth observations

Alexander Stark
Klaus-Dieter Matz
Christian Hüttig
Kai Wickhusen
Livio Agostini
Christian Althaus
Jan Binger
Keigo Enya
Janot George
Kay Lingenauber
Jun Kimura
Masanori Kobayashi
Giulio Macrì
Wladimir Neumann
Luca Penasa
Ganna Portyankina
Cecilia Tubiana
Konrad Willner
Pasquale Palumbo
Hauke Hussmann
Post-launch characterization of the receiver telescope of the laser altimeter is essential for achieving precise georeferenced planetary measurements and for radiometric calibration to passively measure surface reflectance. For the Ganymede Laser Altimeter (GALA) aboard the Jupiter Icy Moons Explorer (Juice), such in-flight calibration was originally planned during a lunar flyby but could not be performed due to an unexpected reboot of the instrument. Instead, this study reports a passive noise measurement acquired during the Earth-farewell campaign on 9 September 2024 as an alternative opportunity for in-flight calibration. Using temporal variations in the GALA noise level as a proxy for photon flux incident on the GALA detector, we combine a theoretical noise model with Earth images obtained by the Jovis Amorum ac Natorum Undique Scrutator (JANUS) imager to constrain the GALA receiver boresight direction. By comparing the timing, magnitude, and temporal pattern of noise variations between observations and simulations, we find that the pre-launch boresight vector is inconsistent with the Earth-farewell observations. Our results further suggest that the GALA receiver boresight may have experienced a post-launch offset over 700 µrad, although a definitive conclusion can be drawn only with additional cruise-phase data. The methodology developed in this study offers a framework for in-flight alignment calibration of GALA during future flybys, which is broadly applicable to other planetary laser altimeters. The radiometric calibration performed in study is also prerequisite for the interpretation of passive albedo measurements of Jupiter and the Galilean moons.
- Article
(3556 KB) - Full-text XML
- BibTeX
- EndNote


Laser altimeters have been one of the most commonly-installed instruments on lunar and planetary exploration missions. The basic functionality of onboard laser altimeters is to measure the range between a spacecraft and planetary surface based on the travel time of laser pulses. Range data acquired by laser altimeters are used to derive surface topography (e.g., Araki et al., 2009; Smith et al., 2017), as well as tidal deformations and rotation states (e.g., Stark et al., 2015a, b; Xiao et al., 2025) to gain insights into planetary interior structure. Also, lateral variations in surface roughness, slope, and albedo can be characterized to investigate surface geologic processes (e.g., Neumann et al., 2003; Smith et al., 2017; Deutsch et al., 2024; Nishiyama et al., 2026b, a). Laser altimeters also play an important role in spacecraft navigation during landing operations (e.g., Kikuchi et al., 2021; Mizuno et al., 2017; Daly et al., 2017).
To achieve these scientific objectives and operations, precise determination of the laser altimeter alignment with respect to spacecraft reference system is essential for the accurate estimation of footprint positions on the surface of a celestial body. Alignment information is typically determined during pre-launch phase after integration of the laser altimeter into the spacecraft. However, launch-induced vibration and/or difference in thermal conditions in space may cause deviations from the pre-launch alignment. Therefore, post-launch in-flight calibration of the laser altimeter needs to be performed using several methods. For example, direct two-way laser ranging between a spacecraft and satellite laser ranging stations on the Earth can be used to characterize laser alignment as well as laser beam patterns (e.g., Smith et al., 2006, 2017; Barker et al., 2018; Noda et al., 2017, 2023). In addition, comparisons between laser altimeter profiles and images and/or image-based topography can be used to determine the alignment of laser altimeters (e.g., Noda et al., 2021).
Such a post-launch calibration has not yet been conducted for the Ganymede Laser altimeter (GALA; Hussmann et al., 2025) onboard the Jupiter Icy Moons Explorer (Juice) mission. Similar to previous laser altimeters on planetary exploration missions, GALA aims to provide surface topography data of icy moons, enabling investigations of geologic processes such as ice tectonics, cryovolcanism and impact cratering. Moreover, GALA targets measurements of Ganymede’s tidal deformation induced by Jupiter to gain insights into its interior structure and the possible presence of a subsurface ocean (e.g., Kamata et al., 2016; Kimura et al., 2019; Hussmann et al., 2019; Enya et al., 2022). In order to accomplish these measurements with accurate georeferencing, the boresight direction of GALA needs to be characterized after the launch of the Juice spacecraft in April 2023. As the Juice spacecraft is equipped with the Jovis Amorum ac Natorum Undique Scrutator (JANUS) imager (Palumbo et al., 2025), precise co-registration of GALA's boresight vector with JANUS images allows us to improve interpretation of the altimeter data in combination with surface imagery.
Determination of GALA's boresight vector in conjunction with JANUS images was originally planned to be performed during the lunar flyby of the Lunar Earth Gravity Assist (LEGA) maneuver, which took place from 19 to 20 August 2024 (Stark et al., 2024). GALA was planned to be switched on prior to the Juice's closest approach to the Moon and to acquire topographic profiles of the lunar surface as its first in-cruise opportunity. In addition, JANUS was expected to potentially detect GALA's laser pulses reflected from the lunar surface by taking long exposures for lunar nightside images, enabling more accurate geometric calibration. However, the goal was not achieved during this calibration opportunity. Although JANUS was operated successfully during the lunar flyby, GALA failed to fire laser pulses while pointing toward the Moon due to an unexpected reboot of the instrument.
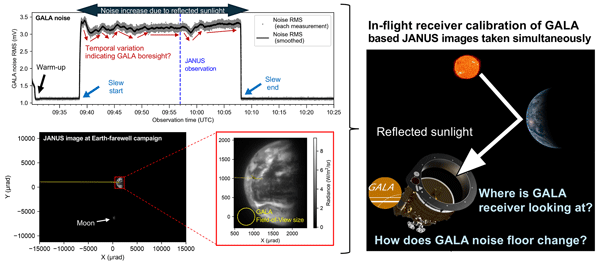
Instead, GALA had another opportunity for in-flight calibration during the Earth-farewell campaign on 9 September 2025. In this campaign, Juice observed the Earth from a distance of 5.65 million kilometers at a relative velocity of ∼ 3.2 km s−1. Between 09:39–10:08 on this day, the Juice spacecraft was operated to stare at the Earth by intermittently adjusting its pointing direction without rotating. Although the Earth was too far away for GALA to detect return pulses, GALA was operated in a passive mode. In this mode, GALA functioned as a single-pixel telescope and recorded a temporal variation in its noise level (Fig. 1a). Because the noise level is dependent on the amount of light reaching the avalanche photodiode (APD) used in the GALA detector, variations in the GALA noise level are indicative of changes in brightness within its field of view (FOV). This noise variation, in turn, corresponds to temporal variations in the spacecraft attitude with respect to the Earth. Simultaneously, JANUS obtained images of the Earth using all of its filters, enabling a direct comparison between the GALA noise data and the spatial distribution of reflected sunlight on the Earth. Thanks to the accurate alignment between JANUS and the spacecraft reference frame, through star fields imaging, the boresight vector of the GALA telescope with respect to spacecraft can be accurately determined through the JANUS-GALA comparison. While this comparison cannot derive the transmission direction of laser pulses, the line of sight of GALA's receiver (denoted as Rx-LoS hereafter) may be inferred to provide insights into the GALA alignment condition.
In this paper, we demonstrate boresight vector calibration using the GALA noise data obtained during the Earth-farewell campaign. Based on a theoretical prediction of the dependence of the GALA noise level on incoming solar flux, we establish a method to directly compare the GALA noise level with the JANUS images taken at the same time. Using this method, we report the implications of the Earth-farewell campaign for the GALA alignment and discuss prospects for future GALA measurements.
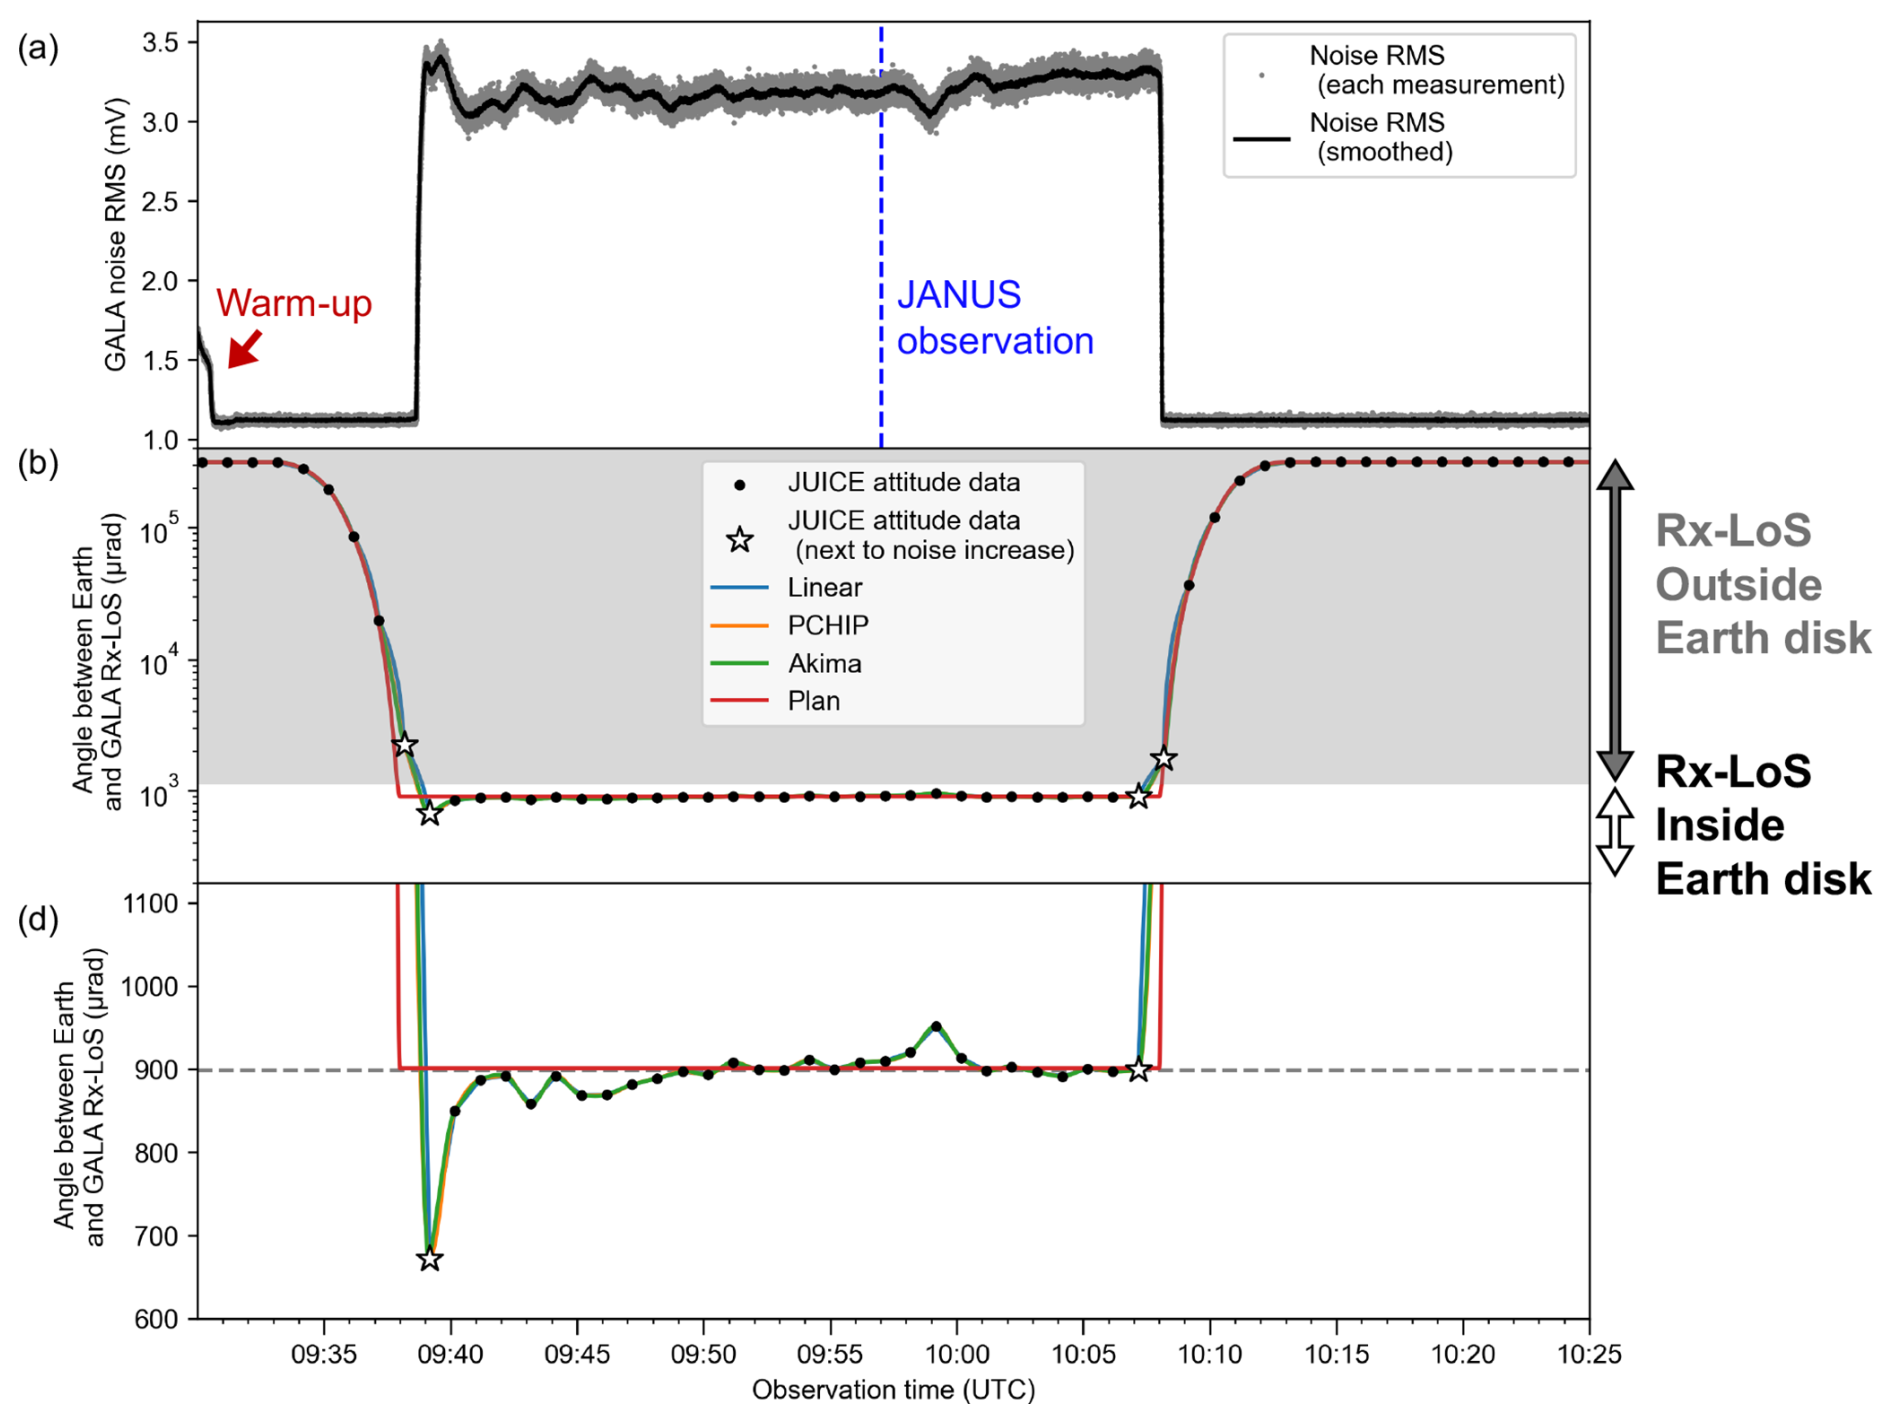
Figure 1Data used in this study. (a) GALA noise data acquired during the Earth-farewell campaign. The blue dashed line indicates the time at which the JANUS image used in this study was obtained. (b) Angle between the Earth center and the GALA Rx-LoS. The gray shaded region indicates the angular distance when the Rx-LoS is outside the Earth. The black points denote the acquisition times of the Juice attitude data (separated by one minute). Note that the data points next to the noise increase and decrease are shown in white stars. The colored lines show angular distances interpolated with different methods. Note that y-axis value is shown on a logarithmic scale. (c) The same plot as (b) shown on a linear scale. The gray dashed line corresponds to the angle where the GALA FOV is fully within the Earth disk.
2.1 GALA
GALA is composed of three units: the transceiver, electronics, and laser electronics units. The latter two units host electrical interface to the spacecraft and laser, including digital processing modules. The transceiver unit is mounted on the optical bench of the Juice spacecraft and includes all optics and baffles of GALA. The transceiver unit employs a Ritchey-Chretien telescope with an effective FOV radius of 225 µrad (Table 1) and a baffle that protects the optics against straylight from the target outside the laser footprint. The baffle is designed to provide a homogeneous thermal environment to the telescope structure and is mechanically decoupled from the transmitter and telescope. As a consequence, the pre-launch thermal vacuum test for the whole transceiver unit predicts that the thermal distortion induces variations in the transmitter axis below 100 µrad. After integration of GALA into the Juice spacecraft, the GALA boresight vector is measured in spacecraft alignment campaign via optical cube and is used as the default value in the SPICE kernels and following analyses. An end-to-end test was also conducted using optical ground support equipment, confirming the GALA Rx-LoS measured in spacecraft alignment campaign with an error of 510 µrad. The difference between the two characterization campaign could have been reduced by carrying out a finer scanning with the optical ground support equipment, although this was not conducted finally due to time constraints for the end-to-end test. More mechanical information on GALA may be found in Hussmann et al. (2025).
During the Earth-farewell campaign, GALA was operated in a passive mode for a total of 55 min, for which GALA was capable of detecting variations in incoming light at the 1064 nm wavelength as fluctuations of the noise level. Due to the discrete nature of photon arrivals and the subsequent stochastic processes of electron-hole pair generation within the APD, photons incident on GALA introduce additional noise atop of other noise sources, such as dark current. This additional noise is called solar noise. The magnitude of solar noise is proportional to the square root of the incident photon flux and can dominate the overall noise level of GALA when its telescope is pointed toward a sufficiently bright body (see details in Sect. 3.2).
The noise level of GALA was observed as the root-mean-square (RMS) of the electrical signals within every range window. When GALA finds return pulses from electrical signals with a digital matching method (Hussmann et al., 2025), the receiver chain samples the electrical signal at intervals of 5 ns by combining two Analog-to-Digital Converters (ADCs). All electrical signals within the full range window of 40.48 µs are recorded as range window samples composed of 8192 points in total. Although the full range window sample data were transmitted to the Earth only at intervals of 3 s, the RMS of the range window samples was computed onboard and transmitted to the Earth with a observation frequency of 30.3 Hz, enabling characterization of the the noise level for all observation cycles.
The noise data acquired during the Earth-farewell campaign clearly exhibit solar noise generated by sunlight reflected from Earth, as seen in Fig. 1a. After the warm-up phase of the instrument, characterized as relatively high noise level at the beginning, the noise RMS stays at approximately 1.12 mV. Around 09:38:38 (UTC), the noise level began to increase and remained elevated at 3.0–3.5 mV until it returned back to its original level around 10:08:07 (UTC). This period of increased noise roughly coincides with the duration when GALA's FOV was pointed toward the Earth. Figure 1b and c show the angular separation between the centers of the Earth and GALA Rx-LoS. When the angular separation is smaller than the Earth's apparent radius, the observed noise was at the increased level, implying contribution from the solar noise.
Notably, the noise RMS also exhibits significant fluctuations while the GALA FOV was pointed at the Earth, reflecting temporal variations in photon flux collected by the GALA telescope. In general, the noise level of laser altimeters is influenced by the APD temperature (e.g., Sun et al., 2020). However, during the Earth observation, the temperature of GALA's APD was monitored and kept at 25 °C with variations smaller than 0.1 K, corresponding to only 0.4 % in the noise level. In addition, the small variation of the GALA APD temperature does not show any patterns similar to the observed noise fluctuations. Therefore, the observed fluctuations of the noise level may be rather interpreted as temporal variations in photon flux incident on the GALA APD.
For the latter analysis, we use the RMS of GALA noise data after smoothing out statistical variation. Due to the limited number of data points in every range window, the RMS values computed onboard are subject to statistical uncertainty, as seen in Fig. 1a. Therefore, the RMS noise were smoothed out using a moving average with a 0.5 s window to enable comparison with the temporal variation of the incoming photon flux (the black line in Fig. 1a).
2.2 JANUS
To compare the temporal variation of the GALA noise level, we use radiance variations based on JANUS observations with filter-12. JANUS is equipped with 13 filters, including 12 narrowband filters and one broadband filter, covering a spectral range from 0.34 to 1.08 µm (Palumbo et al., 2025). These filters enable measurements of spectral characteristics of the surface and atmosphere of Jupiter and its icy moons (e.g., Tosi et al., 2024; Fletcher et al., 2023). For comparison with the GALA data obtained at 1064 nm wavelength, images acquired with filter-12 are suitable. The wavelength coverage of filter-12 spans from 949 to 1081 nm, covering the wavelength of GALA (see more details in Sect. 3.1).
During the Earth-farewell campaign, JANUS obtained images using all filters while the GALA FOV overlapped with the Earth (Fig. 1). In total, 168 images of the Earth were obtained. In this study, we use a filter-12 image taken at 09:57:02 (Fig. 2) because this image has the highest quality without saturation. Note that no latencies between GALA and JANUS is expected as GALA and JANUS observations are referenced to the same clock on the spacecraft. This approach implicitly assumes that the spatial radiance pattern of the Earth remains constant while the GALA FOV overlaps with the Earth. This assumption introduces only minor errors in the latter analysis because the time offset between the JANUS image acquisition and GALA noise increase is less than 20 min. On the Earth, cloud motion within 20 min is smaller than the pixel size of JANUS, which was 42 km at the Earth-Juice distance during this campaign. The Earth's rotation within 20 min corresponds to a longitudinal shift of at most 5°; this effect is explicitly accounted for in the latter analysis by calculating the corresponding latitudes and longitudes of each pixel on the Earth.
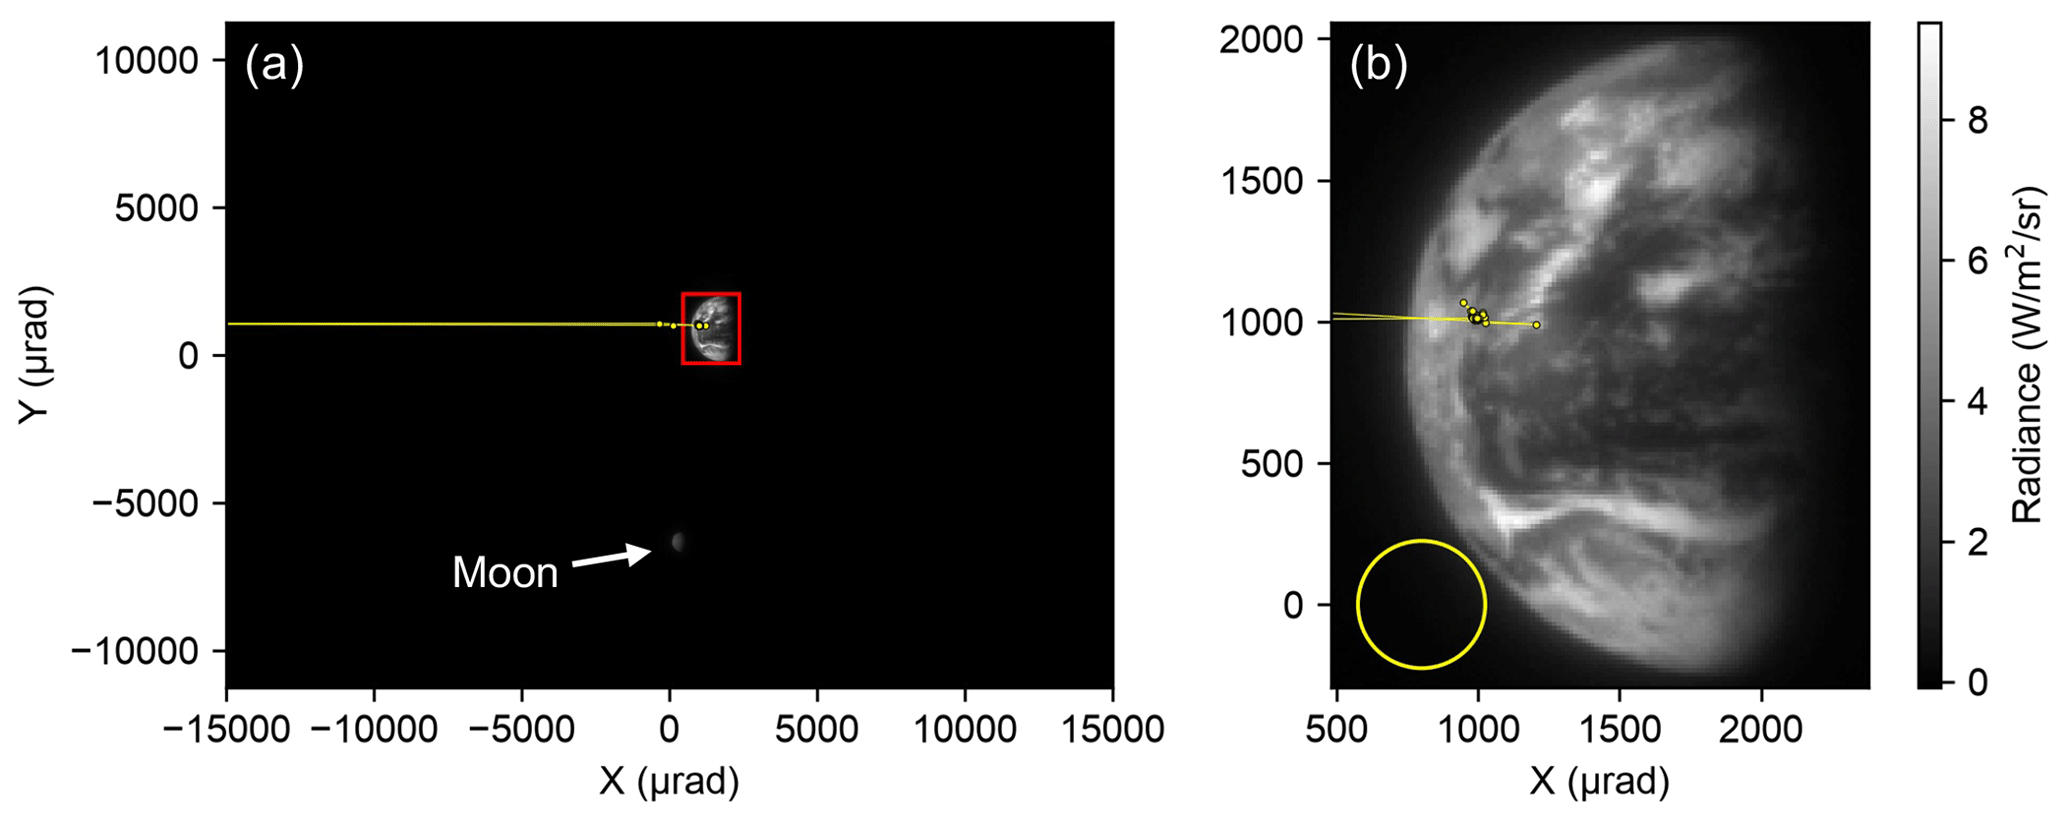
Figure 2JANUS image taken on 9 September 2024 at 09:57:02 (UTC). The full frame and and zoomed-in images are shown in (a) and (b), respectively. The yellow dots, interpolated by thin yellow lines, indicate the location of the GALA Rx-LoS at the acquisition timings of Juice attitude data assuming the GALA-base direction measured in the pre-launch phase. The yellow circle denotes the size of the GALA FOV on the JANUS image for reference. The Moon pictured in the same image is shown by a white arrow in (a).
2.3 Attitude of Juice spacecraft
Another important factor is the temporal resolution of the spacecraft attitude information. The pointing direction of the GALA FOV can be computed from the spacecraft attitude information using the Spacecraft, Planet, Instrument, C-matrix, Events (SPICE) Toolkit (Acton et al., 2018; Annex et al., 2020). To correlate the GALA noise data with temporal variation of pointing direction with respect to the Earth, Juice attitude information sampled at intervals comparable to the timescale of GALA noise variation is required. However, during the Earth-farewell campaign, the Juice attitude data were acquired only at one-minute intervals. While the acquisition rate may be increased upon specific requests, this default rate was used for this campaign, making it difficult to use the Juice attitude information directly in the analysis. Note that the obtained data contain Juice attitude at the time of data acquisition and do not represent an average or specific timing within a one-minute interval. It should also be noted that latency between the attitude data from the spacecraft and GALA/JANUS observations is negligible as the observation data are referenced to the same clock on the spacecraft.
To compensate for the limited temporal resolution of the Juice attitude data, we interpolated the spacecraft attitude by employing three interpolation methods: linear interpolation (i.e., SPICE built-in interpolation), Piecewise Cubic Hermite Interpolating Polynomial (PCHIP) interpolation (Fritsch and Butland, 1984), and Akima interpolation (Akima, 1970). Both PCHIP and Akima methods fit piecewise cubic polynomials with different constraints: PCHIP preserves monotonicity while maintaining continuity of the first derivative, whereas Akima interpolation estimates derivatives locally using a weighted average of slopes from neighboring samples (see Fritsch and Butland (1984) and Akima (1970) for details). By applying these interpolations to the quaternions that define the rotation matrix of the spacecraft attitude in the J2000 frame, we modeled high-resolution Juice attitude data. Note that other spline interpolation methods were found to be unsuitable, as they introduced overshooting between the coarsely sampled attitude points, resulting in unrealistic variations in the GALA pointing direction. For PCHIP and Akima interpolations, we use PchipInterpolator and Akima1DInterpolator functions from SciPy modules, respectively.
To consider the measurement error of the Juice attitude data, we also created the spacecraft attitude data, incorporating estimated error of Juice attitude measurements based on Attitude and Orbit Control System simulations. Adding a random noise with a standard deviation of 15 µrad to the measured attitude data points, the created attitude data are then interpolated in the same way with the aforementioned three methods. Note that the attitude measurement error has been estimated only for nominal operations, such as push-broom at flybys and orbiting phase at Ganymede. Therefore, actual measurement errors during the staring observation of the Earth might be different from the value in this study.
Note that this study considers only the measured data of Juice attitude. The commanded slew may give a rough estimate on the timings of FOV overlapping with the Earth. However, due to the guidance error and attitude stabilization of the spacecraft, the real attitude differs from the planned one. For example, the GALA Rx-LoS was still outside the Earth disk at 09:38, while the GALA FOV was expected to have already overlapped with the Earth based on the planned SPICE kernels (Fig. 1). SPICE kernels used in this study may be found in Juice SPICE Service (ESA, 2026a), where the observed and planned kernels used in this study are summarized in juice_ops.tm and juice_plan.tm, respectively.
A direct comparison between GALA and JANUS data is not straightforward because of differences in both wavelength coverage and observation data type. First, GALA detects photons within a narrow wavelength range of approximately 3 nm around 1064 nm, while filter-12 of JANUS collects photons over a broader spectral range. Second, the GALA observation in the passive mode consists of electrical noise signals whose amplitude needs to be quantitatively related to the photon flux incident on the APD. In this study, we convert radiance observed by JANUS into photon flux reaching the GALA APD by considering differences in spectral response between GALA and JANUS. We then apply a theoretical relationship between solar noise and incoming photon flux to compare the observed and predicted noise levels.
3.1 Conversion from JANUS radiance data to photon flux incident on GALA APD
Accounting for the difference in spectral sensitivity is essential for cross-calibration between measurements acquired by different instruments, as demonstrated in numerous previous studies (e.g., Pieters et al., 2013; Besse et al., 2013; Ohtake et al., 2013; Yumoto et al., 2024; Nishiyama et al., 2025). In this study, by incorporating the transmittance of the GALA bandpass filter, we compute the ratio of radiance collected by GALA to that measured by JANUS as
where RG is the transmittance of the GALA bandpass filter from Enya et al. (2022), and RJ is the wavelength coverage of JANUS's filter-12 from Palumbo et al. (2025). Because the JANUS image used in this study is calibrated as total radiance integrated over the filter coverage, RJ is approximated as a uniform rectangular response spanning wavelengths from 949 to 1081 nm.
Using this conversion ratio, the optical power of the photon flux reaching the GALA APD is calculated as
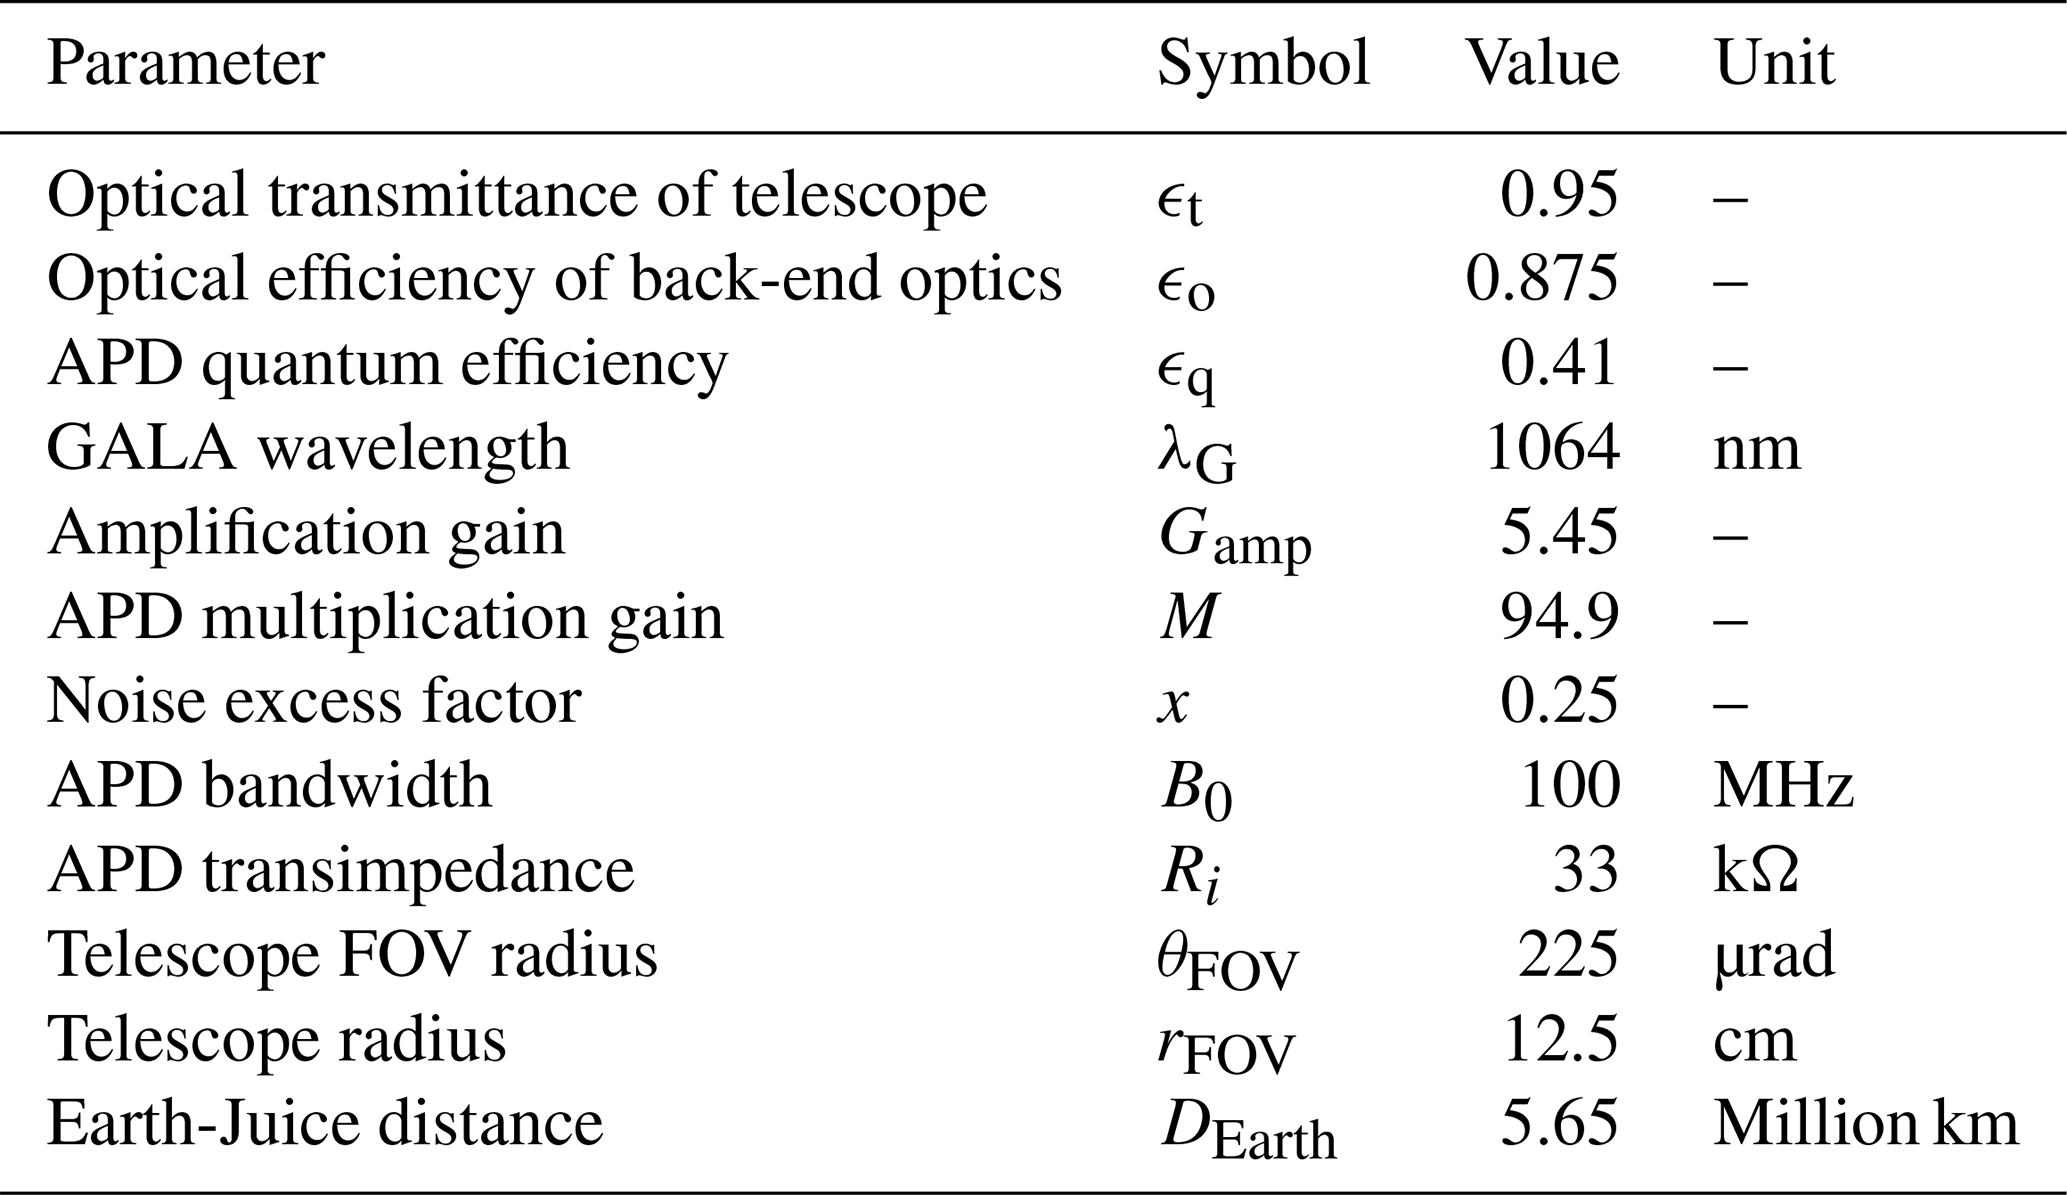
where ϵt is the optical transmission efficiency of the GALA telescope, ϵo is the optical efficiency of the GALA back-end optics, EJ is the radiance measured by JANUS and averaged over the GALA FOV, AFOV is the area of the GALA FOV at the Earth-Juice distance, and ΩFOV is the solid angle of GALA's telescope aperture seen from the Earth. Due to degradation possibly caused by contamination and/or particles, ϵt and ϵo are expected to potentially decrease from 0.95 to 0.83 and from 0.875 to 0.8, respectively, over the entire mission (Hussmann et al., 2025). As GALA components are expected to experience minimal degradation shortly after the launch, we adopt the upper-end values for both ϵt and ϵo.
AFOV and ΩFOV are expressed as
where θFOV is the angular radius of the telescope FOV, DEarth is the distance between the Earth and Juice spacecraft, and rFOV is the telescope radius. All parameters used in the calculation are summarized in Table 1.
It should be noted that this calculation implicitly assumes a flat spectral radiance over the wavelength coverage of the JANUS filter-12. However, artifacts due to different shape of the spectral radiance of the Earth are expected to be limited. For example, when non-flat spectra representative of continent, seawater, and clouds on the Earth based on calculation with Planetary Spectral Generator (PSG; Villanueva et al., 2018) are incorporated, results in 0.0306, 0.0332, 0.0290, respectively. Note that the PSG calculation assumed spectral properties of continent, seawater, and clouds based on spectral catalogs from Madden and Kaltenegger (2018), Clark et al. (2007), and Bohren and Huffman (1998), respectively. Thus, potential systematic errors due to spectral shape difference is limited to 9 % at most. This level of uncertainty is sufficiently small compared to variations in absolute reflectance among different area types of the Earth; for instance, the cloud reflectance can be an order of magnitude larger than that of seawater. Therefore, we adopt of 0.0326 based on the flat-spectrum assumption uniformly in the latter analysis.
3.2 Theoretical relationship between incoming photon flux and GALA noise
In general, the noise level of a laser altimeter in a passive mode can be expressed as (e.g, Steinbrügge et al., 2018)
where Nds is the APD surface dark current noise, Ndb is the APD bulk dark current noise and Nsn is the noise component induced by reflected sunlight incident on the APD. Note that the shot noise and electromagnetic compatibility noise are omitted from Eq. (5) because GALA does not fire any laser pulses in the passive observation.
Since Nds and Ndb are constant (i.e., independent of the incident photon flux), the background noise level of 1.12 mV observed before and after the Earth overlap corresponds to . The other component of noise, Nsn, is expressed as
where q is the elemental charge, ϵq is the APD quantum efficiency, λG is the GALA wavelength, h is the Plank constant, c is the speed of light, Gamp is the GALA receiver amplification gain, M is the APD multiplication gain, x is the noise excess factor, B0 is the APD band width, and Ri is the APD transimpedance. All values used in our calculation are summarized in Table 1.
Comparison between the observation and simulations can be performed using two observables. First, the timings at which the observed noise level began to increase and subsequently returned to the background level may be used, as these transitions are clear indicators of onset and termination of the Earth-FOV overlap. Second, the absolute magnitude and temporal variation of the GALA noise can be used for a direct quantitative comparisons between the observation and simulations. Since the noise increase induced by photon flux reaching the GALA APD can be computed using the formulations in Sect. 3, the magnitude and variability of the reflected sunlight can be directly compared with the observed noise data by taking the JANUS-based radiance averaged within the GALA FOV as a function of time. In this section, we present comparisons between simulations and observations from both perspectives.
4.1 Start and end of the noise increase
Figure 3 presents the observed noise RMS zoomed in around the onset and termination of the noise increase, along with schematic illustrations of the relative position of the GALA FOV with respect to the Earth at those times. Since the duration of the noise increase corresponds to period during which the GALA FOV overlaps with the Earth, the onset of the rapid rise in the RMS value (red arrow in Fig. 3a) indicates the moment when the Earth started to enter the GALA FOV. Conversely, the time at which the noise RMS dropped to the background level (red arrow in Fig. 3b) indicates when the Earth completely exited the GALA FOV. Figure 3 shows an asymmetric pattern in which the GALA noise gradually increased over a period of ∼ 20 s (Fig. 3a) but dropped rapidly within ∼ 5 s (Fig. 3b), corresponding to faster attitude movement at the end of the overlap.
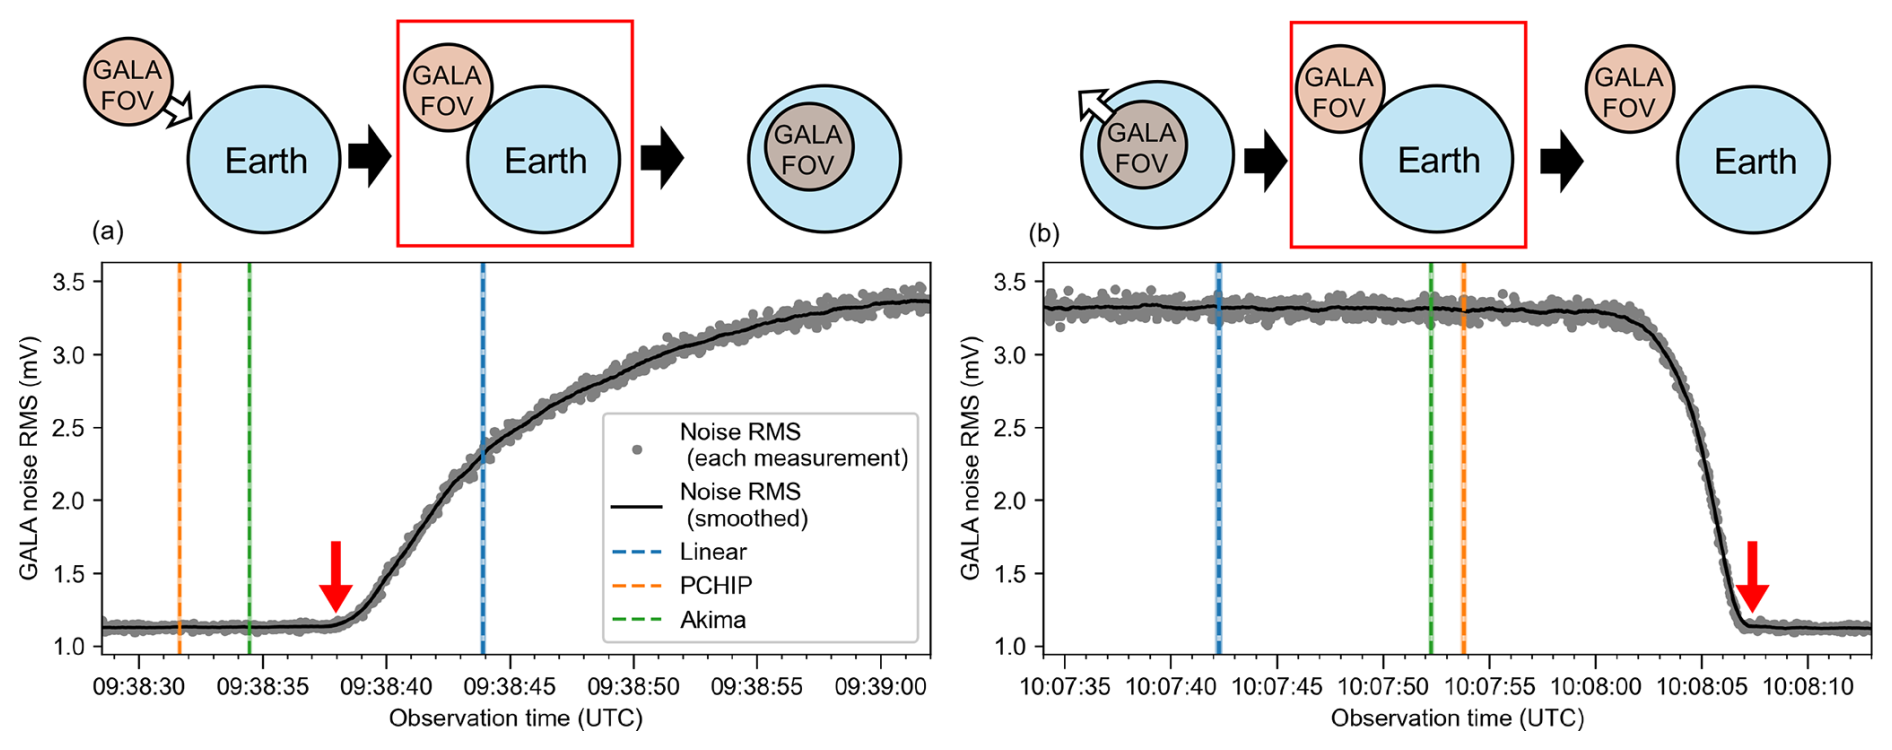
Figure 3GALA noise data around the start and end of the noise increase with schematic illustrations. (a) Noise RMS around the start of the noise increase. The upper panel shows a schematic view of the GALA FOV position relative to the Earth. The onset of the noise increase, indicated by the red arrow, corresponds to the configuration of the red-boxed schematic illustration. The colored vertical dashed lines indicate the simulated start of the overlap using different interpolation methods. Note that the pre-launch boresight vector is assumed in the calculation. The colored vertical bands show possible timing uncertainties in the simulations due to the effect of the Earth’s atmosphere. (b) Noise RMS around the end of the overlap, plotted in the same manner as (a).
Table 2Timing discrepancies using the pre-launch boresight vector.
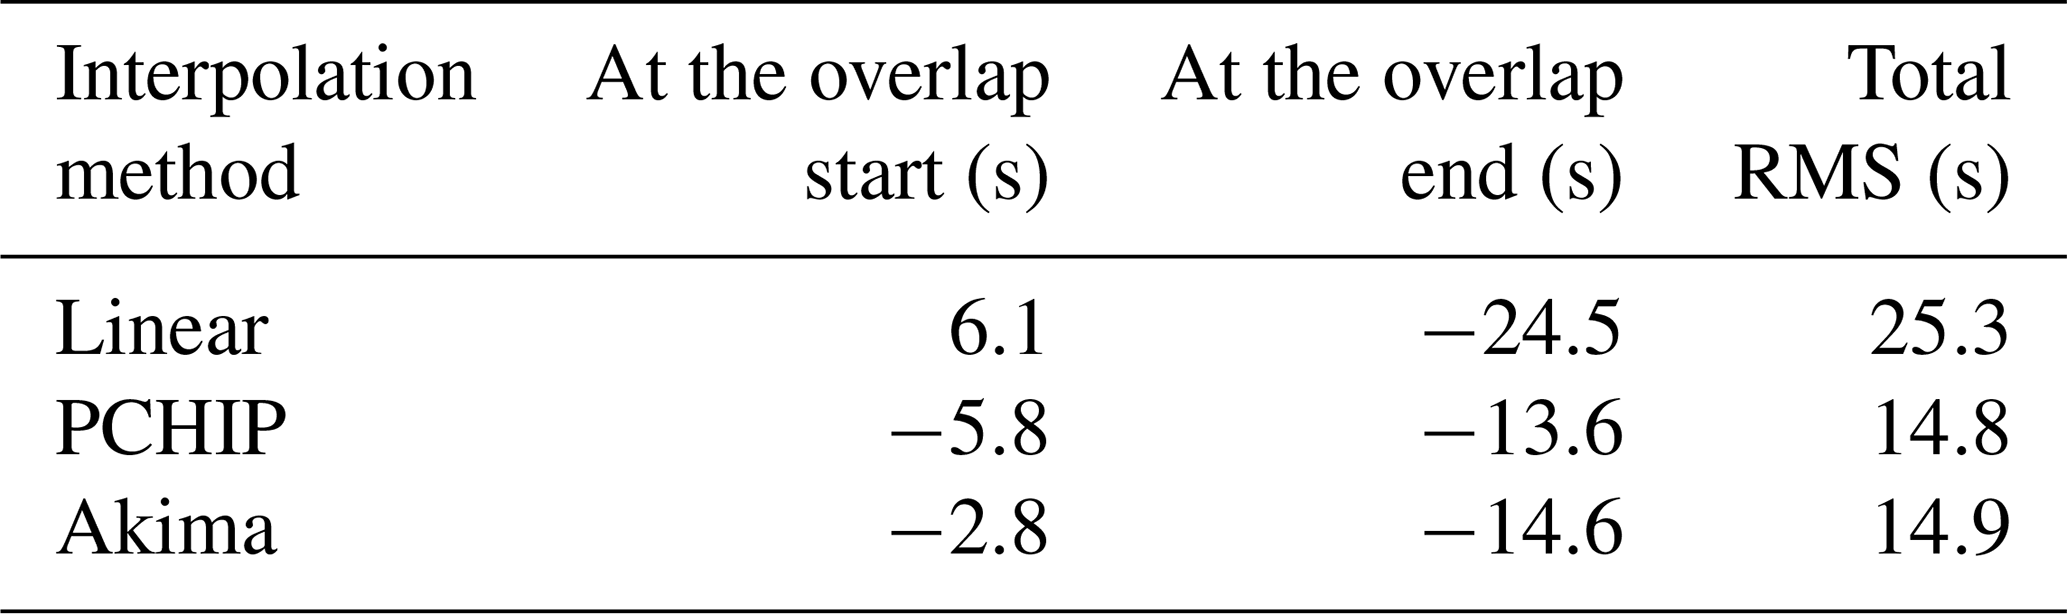
The observed timings of the onset and termination of the noise increase do not agree with simulations assuming that the pre-launch boresight vector of the GALA Rx-LoS remains unchanged during cruise. Figure 3 also shows the simulated start and end timings of the noise increase based on the SPICE-based simulations of the GALA FOV intersecting the Earth. Although the simulated timings depend on the different interpolation methods used to increase the temporal resolution of the Juice attitude information, none of the simulated results are consistent with the observations. At the start of the overlap, the linear interpolation predicts a later onset of the overlap, whereas the PCHIP and Akima interpolation predict earlier onsets. At the end of the overlap, all the interpolation methods predict an earlier decrease of the noise level, with discrepancies exceeding 13 s. All results are summarized in Table 2. These results suggest that the observations cannot be reproduced with the pre-launch boresight vector.
It should be noted that such timing discrepancies cannot be explained by the Earth's atmosphere. For example, images taken by Earth-observing satellites like Himawari-8/9 (e.g., Okuyama et al., 2018) show a bright atmospheric halo of the Earth with a thickness of approximately 30 km. However, its effect on the overlap timings is less than 0.3 s (colored bands in Fig. 3) and is negligible compared to the discrepancies between the observation and simulations.
A possible reason that may explain the timing gaps is an offset of the boresight vector of the GALA Rx-LoS after the launch, as any deviation from the true boresight vector introduces systematic differences between the simulated and observed overlap timings. To investigate such a post-launch offset, we repeated the comparisons shown in Fig. 3, changing the assumed GALA boresight vector of the GALA FOV. For each assumed boresight direction, the start and end times of the noise increase were simulated using different interpolation methods of the Juice attitude and compared with the observations.
Figure 4 shows maps of the timing discrepancies as a function of the assumed boresight vector direction in the spacecraft reference frame. For the start of the overlap, the boresight vectors consistent with the observation differ among the assumed interpolation methods. The linear interpolation yields a crescent-shaped region located to the right of the pre-launch boresight vector, whereas the corresponding regions obtained with PCHIP and Akima interpolations are located rather to the left of the pre-launch value (Fig. 4a, d, and g). Note that the crescent shape reflects the shape of the Earth's limb. In contrast, for the end of the overlap, the crescent-shaped parameter regions are consistently located to the right of the pre-launch boresight vector (Fig. 4b, e, and h) because the simulated end of the overlap needs to be delayed from the predictions assuming the pre-launch boresight vector (Fig. 3). It should also be noted that timing discrepancies show different patterns for the start and end of the overlap, reflecting higher slewing speed of Juice at the end than at the start.
As a representative measure of the total misfit between the observation and simulations, we computed the RMS of the timing gaps at both the start and the end of the overlap (Fig. 4c, f, and i). The total misfit maps suggest a potential offset of the GALA boresight vector in the positive x direction of the spacecraft reference frame (white dashed lines in Fig. 4c, f, and i). However, in the latter analysis, these results are used conservatively as supplementary information to determine the most-likely boresight direction of the GALA Rx-LoS. Instead, whether both start and end of predicted noise increase fall within ranges between Juice attitude acquisition timings next to the observed start and end (white stars in Fig. 1) poses strict constraints on the boresight vectors in the latter analysis (surrounded by white shades in Fig. 4c, f, and i).
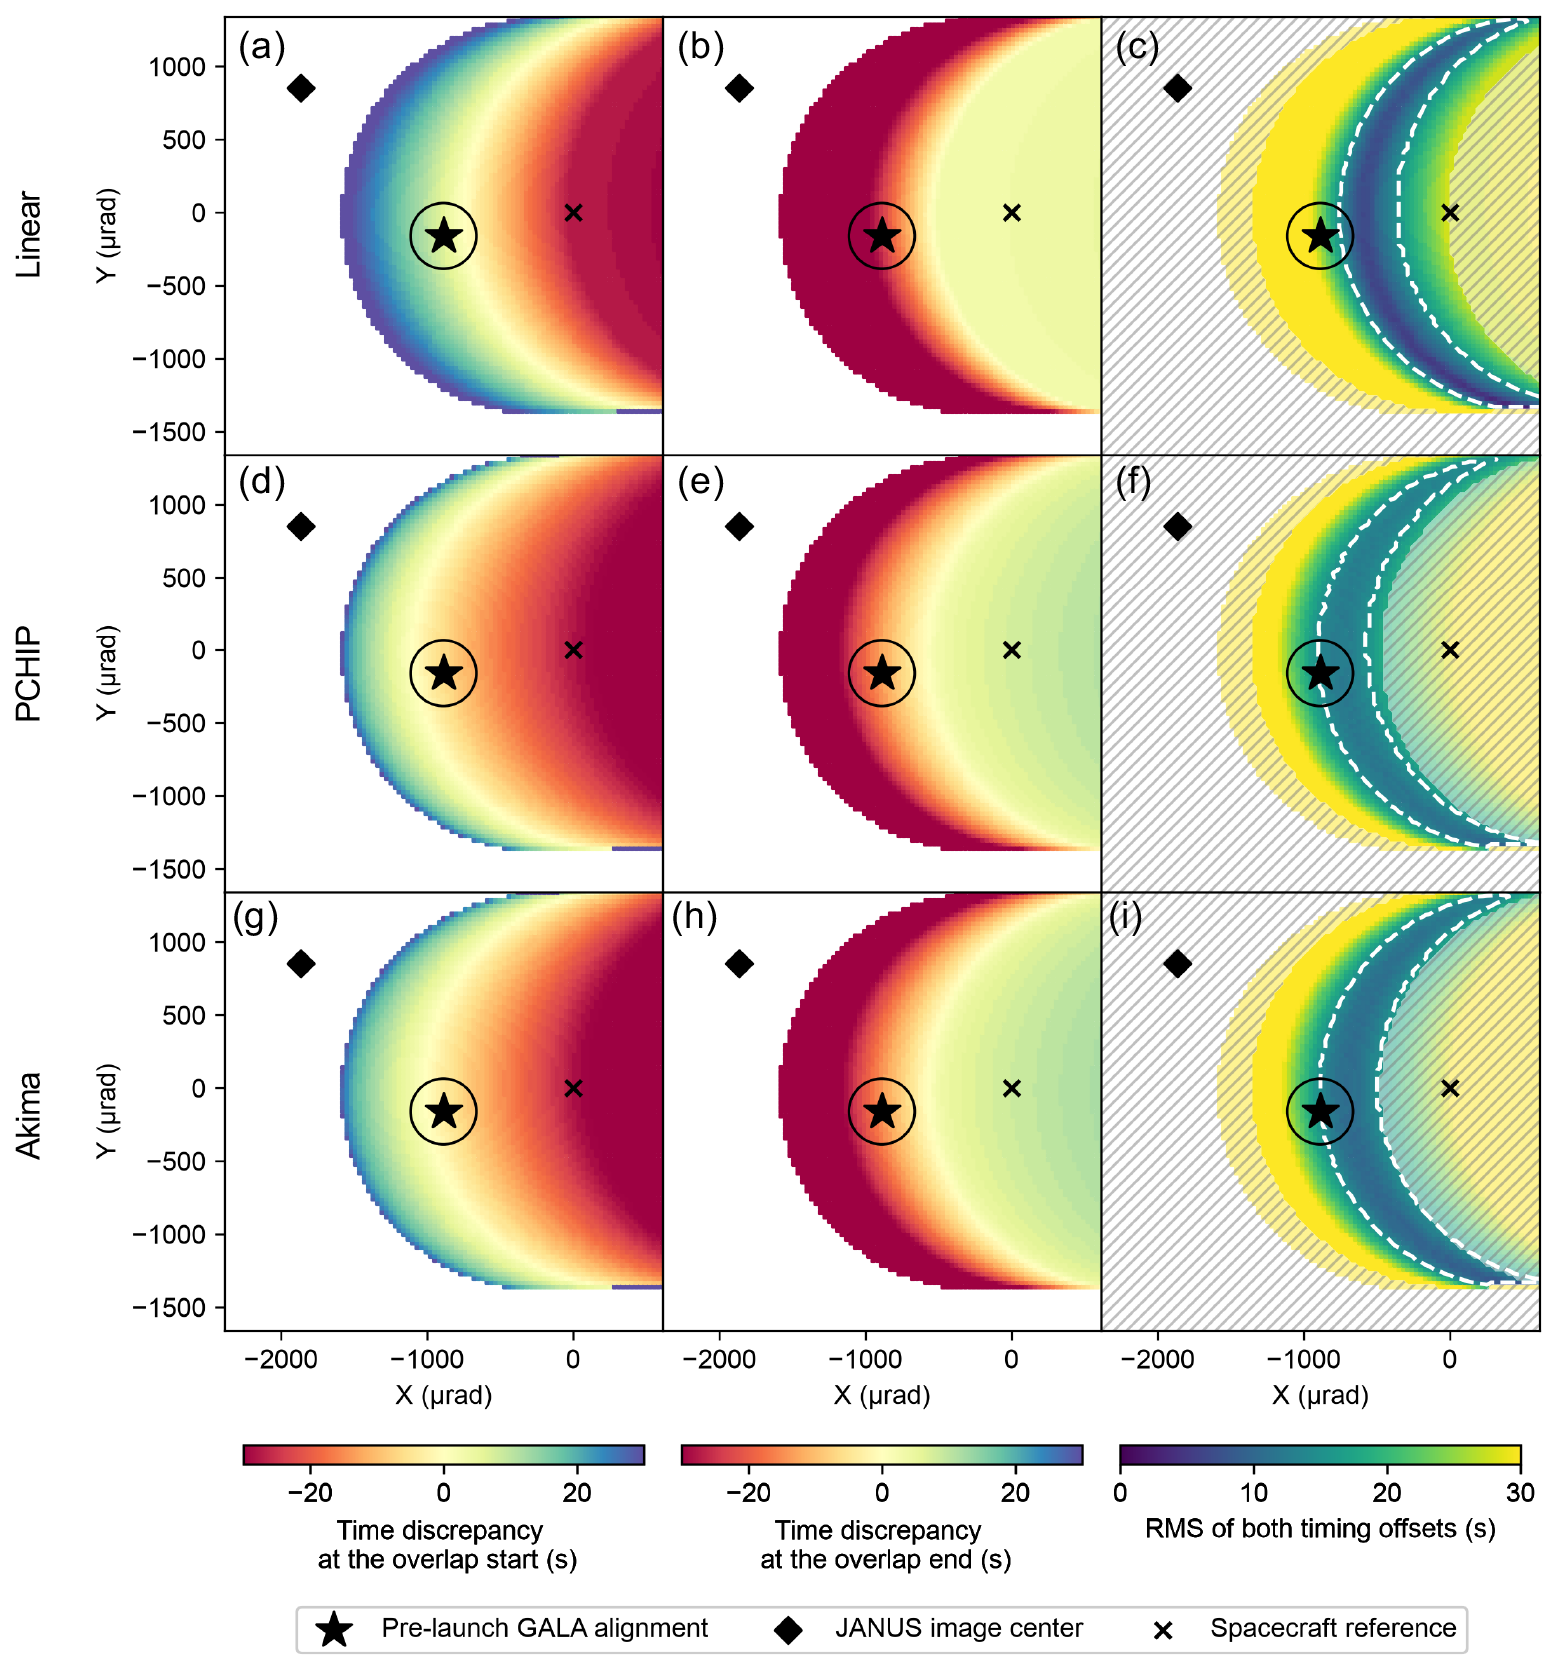
Figure 4Optimization results of the overlap start and end. (a, d, g) Maps of the time discrepancies between the simulated and observed start of the noise increase as a function of the assumed GALA boresight direction. The color map indicates the time differences obtained by subtracting the observed start time from the simulated start time. The white regions indicate parameter areas where the GALA FOV never intersects with the Earth. (b, e, h) Same maps for the end of noise increase. (c, f, i) Maps of total time residual for both the start and end of the noise increase. The dashed white lines show contours at RMS of 15 s. The boresight vectors for which either start or end of the noise increase falls outside ranges between the closest acquisition timings of Juice attitude data (white stars in Fig. 1) are shaded in white. In all panels, the black star, diamond, and cross marks denote the pre-launch GALA boresight, the center of JANUS image frame, and the spacecraft reference, respectively. The dark circle indicates the size of the GALA FOV. Results obtained using the linear, PCHIP, and Akima interpolations are shown in (a)–(c), (d)–(f), and (g)–(i), respectively. Note that each boresight vector is defined as in the spacecraft reference frame, where x and y are the coordinates shown in the plots.
4.2 Direct comparison in noise magnitude and pattern
A discrepancy between the observed and simulated increase of the noise level assuming the pre-launch boresight vector is also evident in the absolute noise magnitude of GALA. Figure 5 presents a direct comparison between the observed GALA noise and the JANUS-based simulations during the period when the GALA FOV overlaps with the Earth. Based on Eqs. (1)–(7), a simulation assuming the pre-launch boresight vector predicts systematically higher noise levels, indicating an inconsistency with the pre-launch boresight assumption. As the measurement noise in Juice attitude data induce only slight fluctuations in the noise level (thin black lines in Fig. 5), this offset is not likely to be caused by attitude measurement errors.
This inconsistency is also apparent in the temporal pattern of the GALA noise. For example, the observations exhibit local noise maxima at 09:39–09:40 and 09:42–09:43, whereas a simulation using the pre-launch boresight vector rather predicts local minima at these times. In addition, the observed noise shows a clear gradual increase after 09:47, while the simulated noise remains comparatively flat or even slightly decreases. Aside from a noise drop around 09:59, the overall temporal behavior of the observed noise supports the possible presence of a systematic offset in the GALA Rx-LoS alignment. Thus, both the absolute noise magnitude and its temporal pattern indicate the need to adjust the boresight direction.
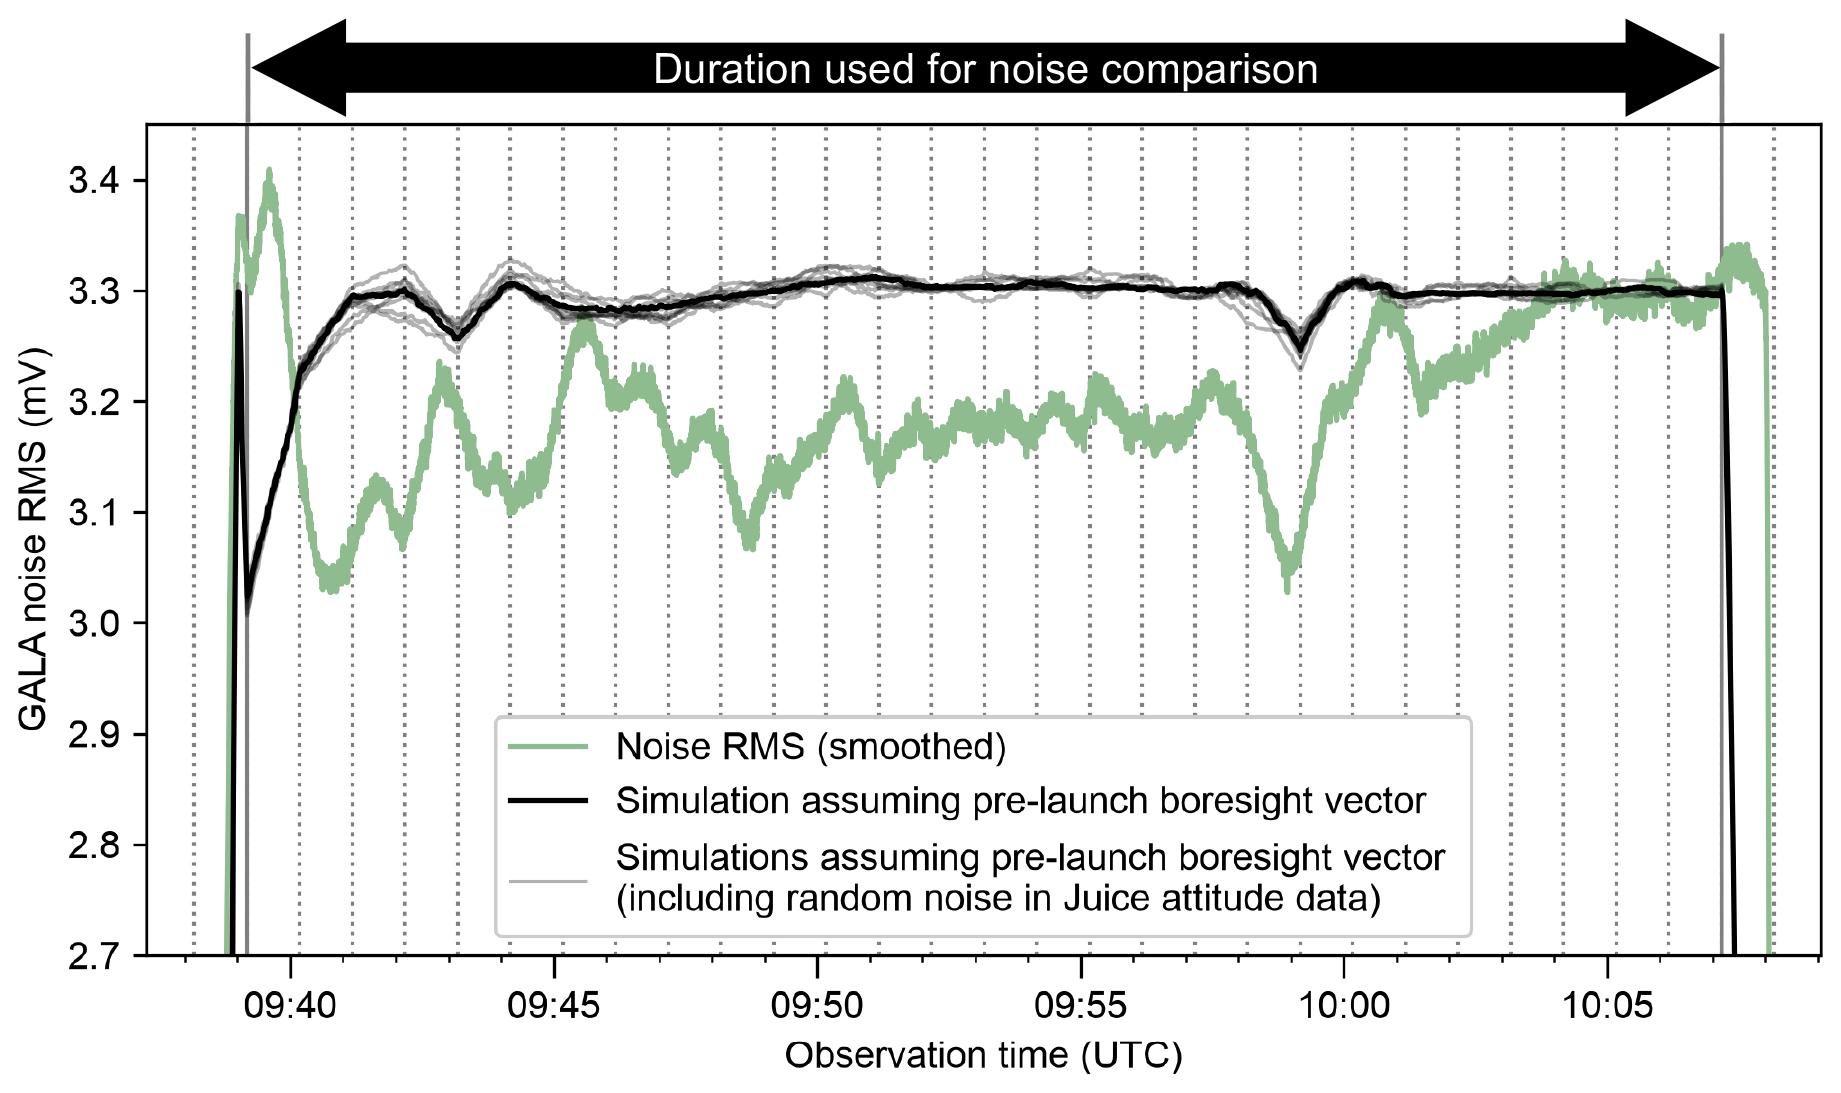
Figure 5Comparison in the magnitude and temporal pattern of the increased noise between the observation and simulations. The black thin lines represent 10 cases considering random measurement noise in Juice attitude data. The vertical gray dotted lines indicate acquisition times of the Juice attitude data. For direct comparison between observed and simulated GALA noise, only the duration between the two vertical gray solid lines is used. The linear interpolation is applied to the simulations shown in this plot.
The noise magnitude and temporal pattern can also be exploited for in-flight calibration of the GALA Rx-LoS alignment. Following the approach described in Sect. 4.1, we repeated the comparison shown in Fig. 5 while varying the assumed GALA Rx-LoS. After converting the JANUS-measured radiance averaged within the GALA FOV into GALA noise levels (see Sect. 3), discrepancies between the observation and simulations were evaluated in two ways. First, the mean difference between the observed and simulated noise levels was computed as a measure of agreement in absolute noise magnitude. Second, the correlation coefficient of the temporal noise variations was calculated to quantify how well the simulations reproduce the observed temporal variability. In both analyses, we use only data acquired during the period of increased noise, namely the duration between the first and last Juice attitude acquisitions while the elevated noise level was observed (indicated by the two vertical extended gray lines in Fig. 5).
Two approaches were adopted regarding the temporal resolution of the comparison. In the first approach, all observations were compared with simulations based on interpolated Juice attitude information. This approach provides higher temporal resolution but introduces uncertainty associated with attitude interpolation between discrete measurements. Note that we present results obtained with the linear interpolation hereafter, because only negligible differences were found among the three interpolation methods. In the second approach, only data points corresponding to the actual Juice attitude acquisition times were used. Although this approach reduces the number of used data points, it eliminates uncertainties introduced by interpolations. While the final results obtained using these two approaches are broadly consistent, the differences are not entirely negligible.
Optimization of the GALA Rx-LoS alignment based on noise magnitude reveals two candidate regions of boresight vectors that yield simulations consistent with the observations. In Fig. 6a and b, two irregular ring-shaped regions indicate where the mean simulated noise magnitude matches the observed values well. Both regions completely fall within the region that agrees with constraints from the start and end of the noise increase (white shades in Fig. 6), partially overlapping with the region where the total RMS residual of the start and end times of the noise increase is less than 15 s (black dashed lines in Fig. 6). This overlap suggests that the true GALA Rx-LoS may lie within either of these two areas. In contrast, the simulation using the pre-launch boresight vector predicts noise magnitude levels approximately 0.1 mV higher than the observation, as depicted in Fig. 5.
The temporal correlation of the noise pattern also provides additional constraints on the GALA boresight vector. Figure 6c and d show the distributions of correlation coefficients for different boresight directions. In both temporal-resolution approaches, the pre-launch boresight vector yields a negative correlation coefficient, reflecting discrepancies in temporal features such as the initial noise maximum (Fig. 7). The highest correlation coefficients are instead obtained for boresight vectors shifted by more than 700 µrad from the pre-launch direction (white triangles in Fig. 6). Although the precise locations of maximum correlation differ slightly between the two temporal-resolution methods, the overall distributions are qualitatively similar.
By combining constraints from the start and end timings of the noise increase, the absolute noise magnitude, and the temporal noise pattern, we determine the most-likely boresight solution. First, we exclude boresight vectors that predicts the start and end of the noise increase outside the range between the closest Juice attitude acquisitions (white stars in Fig. 1). Second, boresight vectors that predicts mean offset of 0.25 mV or larger compared to the GALA noise data are excluded. This criterion is determined based on possible calibration error of JANUS radiance data and conversion coefficient variation among terrain types (Sect. 3.1). While the relative radiometric accuracy of JANUS is expected to be below a few percents, Langevin et al. (2026) reports an radiance offset of 20 % between JANUS and the Moons And Jupiter Imaging Spectrometer (MAJIS) aboard Juice. Combined with conversion ratio variation among terrain types and the non-linear relationship between photon flux and GALA noise level, this bias may introduce 7.5 % offset of GALA noise level according to Eqs. (1)–(7), corresponding to 0.25 mV. Third, we focus on boresight directions for which the RMS of the timing residuals is less than 15 s. As difference in interpolation methods typically yields 10 s variation in predicted start and end of the overlap (Table 2), the corresponding RMS value of 15 s is employed to define more-likely boresight directions. Finally, the boresight vector yielding the highest correlation is selected as representative for each temporal-resolution approach (white stars in Fig. 6). Since similarly high correlation coefficients are found in a certain region (Fig. 6c and d), the standard deviations of boresight directions with correlation coefficients over 70 % of the maximum value are computed along both x- and y-axes as estimation errors.
The most-likely boresight is found at distinct locations from the pre-launch measurement. The most-likely boresight directions are summarized in Table 3. As the scanning movement of spacecraft before the Earth-staring aligns with x-axis in Fig. 6, the most-likely boresight contains components both along and across the scan. Although the direction of the boresight shift is found similar between with- and without-interpolation methods, differences in most-likely boresight directions are observed. The estimation error (i.e., one standard deviation range) for each method is less than 100 µrad, which is smaller than the difference between the two methods. This large offset implies potential uncertainty of more than 100 µrad possibly due to the insufficient temporal resolution of Juice attitude data (Table 3). This boresight offset from the pre-launch value is larger than that predicted for JANUS by an order of magnitude. Our simulation implicitly assumes that the boresight vector of JANUS has not been shifted drastically as expected in thermal analysis by Turella et al. (2019). This assumption is supported by the fact that the Earth position predicted in the JANUS image matches the observed position with an error of less than 2 pixels, corresponding to only 30 µrad. Therefore, this boresight shift is not attributable to JANUS data used in this study.
Simulations using these two most-likely boresight vectors reproduce more consistent behavior of the GALA noise level than a simulation using the pre-launch boresight (Fig. 7a). For example, the simulated noise exhibits an overall increasing trend and reproduces the noise drop around 09:59 (UTC). In the non-interpolated case, the local maximum around 09:39–09:40 is also qualitatively captured because the GALA FOV passes a thick cloud area on the Earth (Fig. 7b). This local maximum is not reproduced in the interpolated case, although the model matches the overall trend of the observed noise better than the pre-launch boresight case. These results imply a post-launch offset of the GALA Rx-LoS alignment relative to the pre-launch configuration by more than 700 µrad, although even these most-likely solutions do not reach perfect matches with the observation. Even when considering the expected uncertainties in spacecraft attitude knowledge, the most-likely cases are consistent only with the overall trend (thin lines in Fig. 7a). As a cause of this inconsistency, the poor knowledge of attitude data uncertainties for staring measurements cannot be ruled out but can possibly be resolved when combined with high-resolution data in future calibration activities.
Table 3Most-likely boresight directions and a range of one standard deviation. While the standard deviation is calculated separately for each method, the offset between the two methods is included in the average value of the estimated boresight shifts.
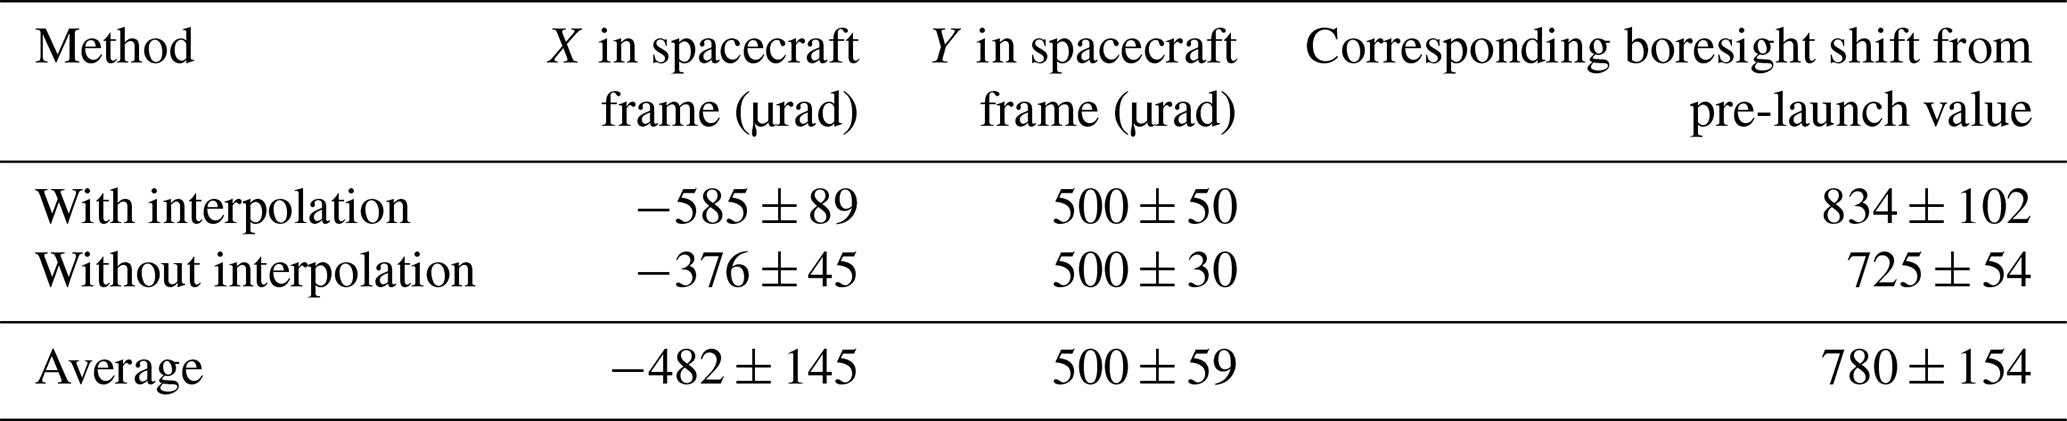
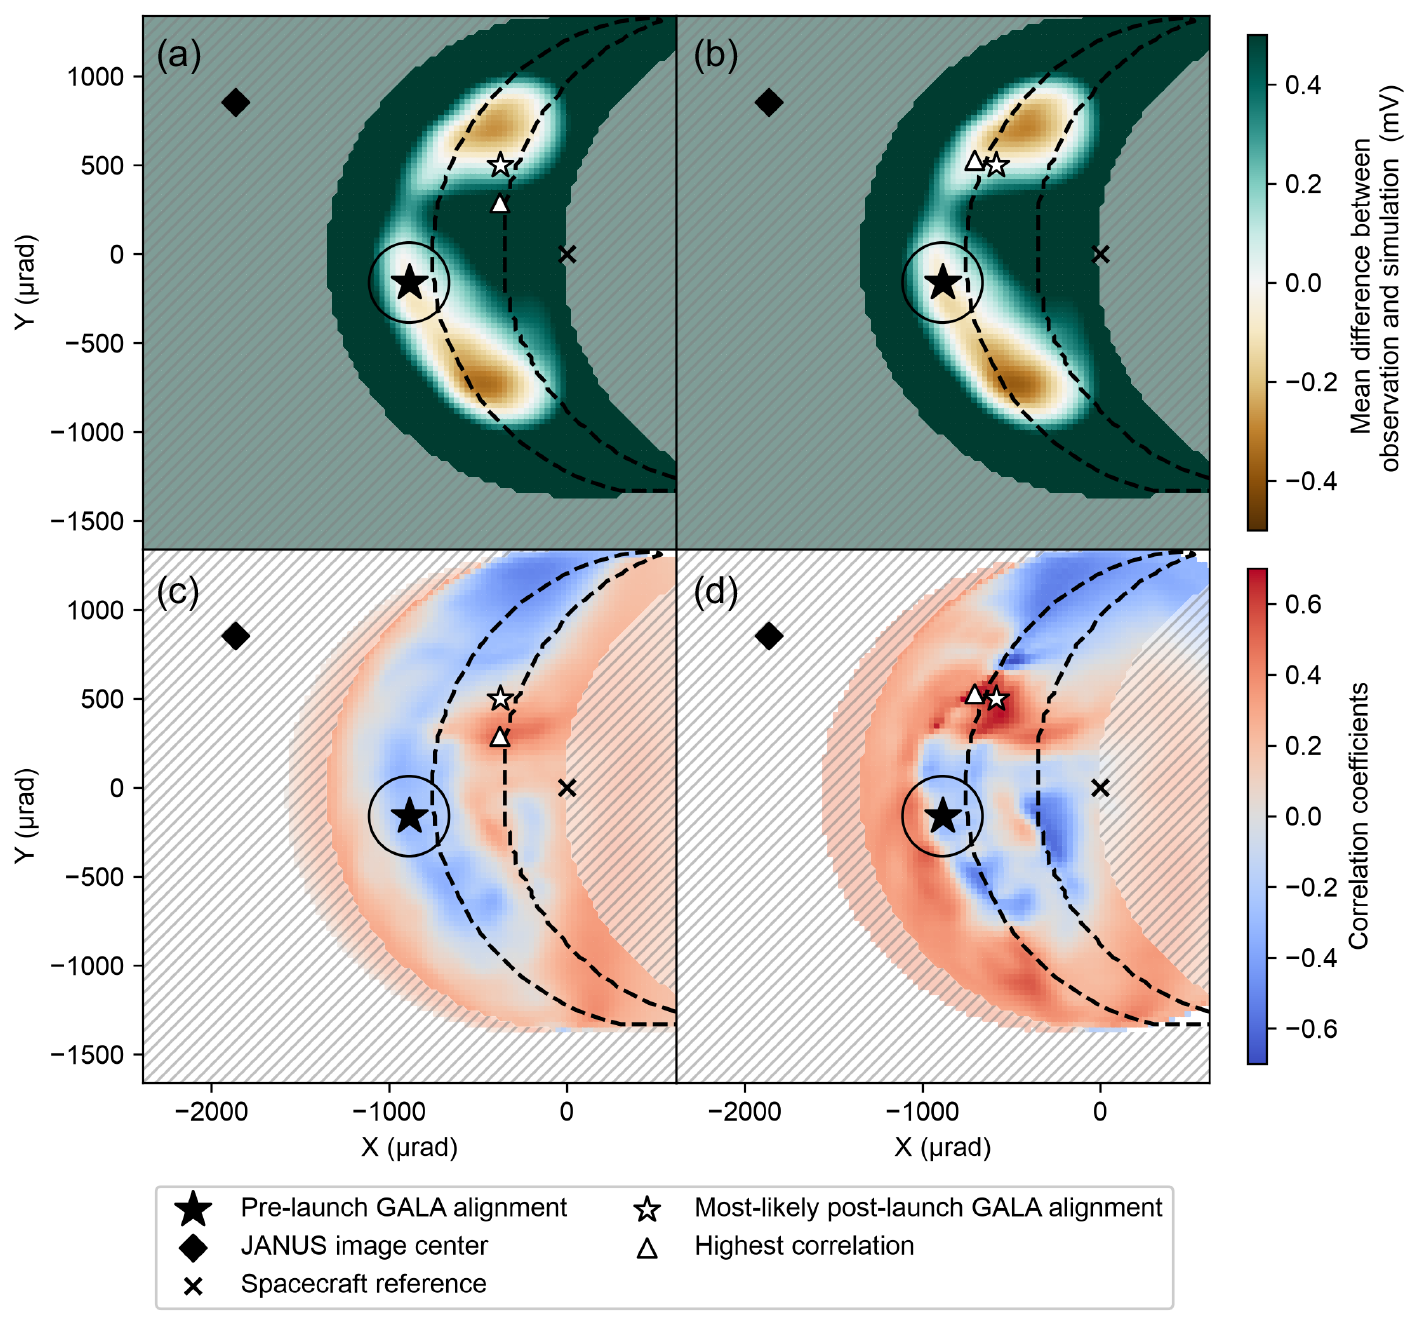
Figure 6Optimization results of the GALA Rx-LoS alignment based on the noise magnitude and temporal pattern. (a, b) Optimization based on the increased noise magnitude. The color scale indicates the mean difference obtained by subtracting the simulated noise from the observed noise. (c, d) Optimization based on the temporal variation of the noise. The white triangles denote the boresight vector with the highest correlation coefficients. Results obtained using all interpolated attitude points and using only the discrete Juice attitude acquisition times are shown in panels (a), (c) and (b), (d), respectively. Note that the linear interpolation is used for the simulations in this plot. In all panels, the white stars indicate the locations of the most-likely boresight vectors shown as the red and blue lines in Fig. 7. The boresight vectors for which the RMS residual of the start and end timings is below 15 s are surrounded by black dashed lines. The boresight vectors for which either start or end of the noise increase falls outside ranges between the closest acquisition timings of Juice attitude data are shaded in white.
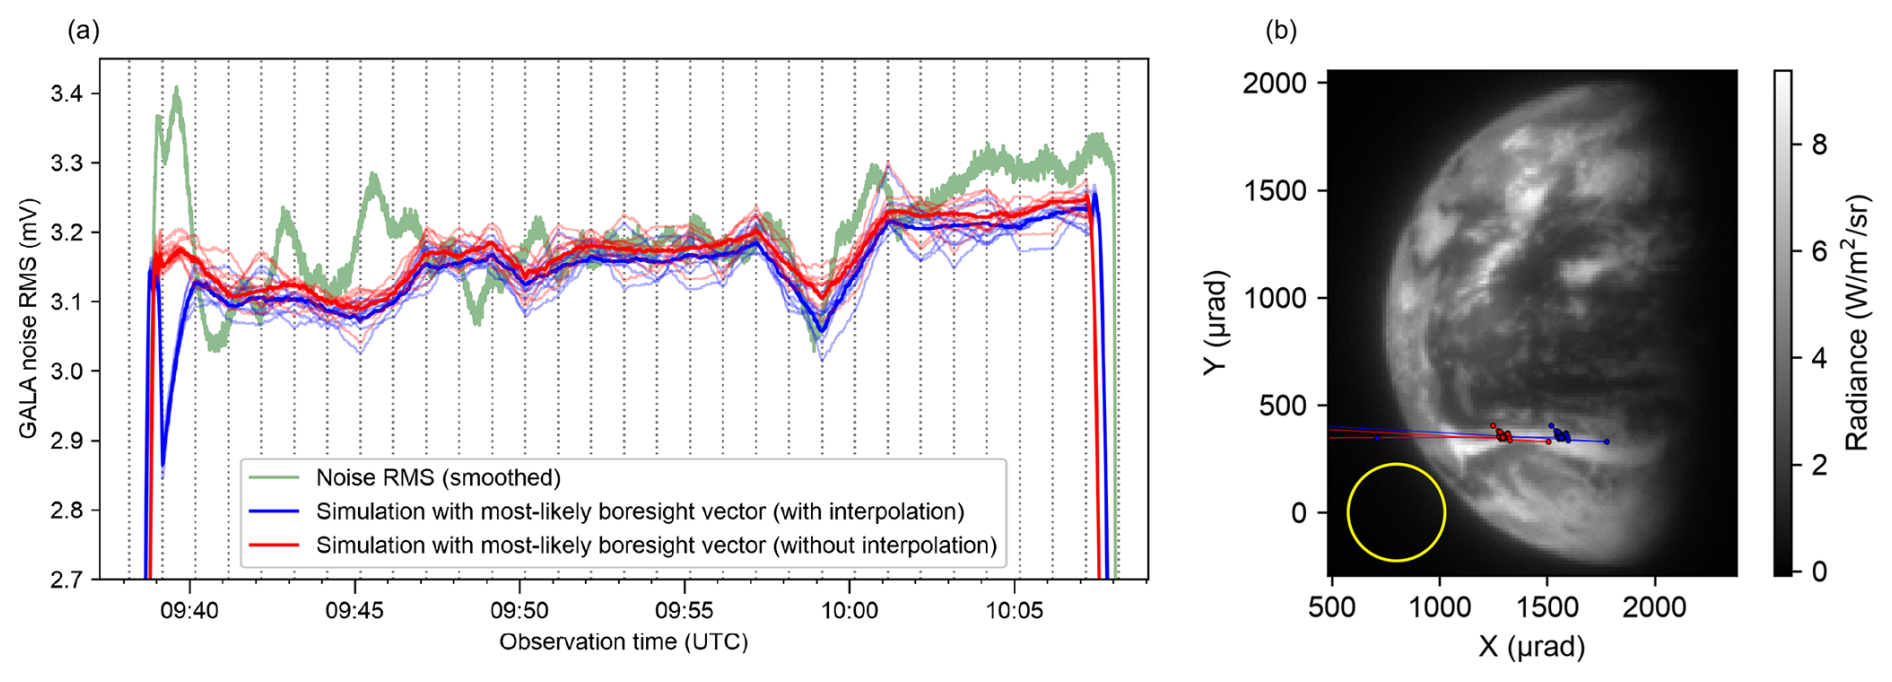
Figure 7Comparison between GALA data and most-likely model predictions. (a) Comparison in the noise RMS shown in the same way as Fig. 5. (b) GALA Rx-LoS locations on the JANUS image. The red and blue lines show GALA Rx-LoS locations calculated with most-likely boresight vectors derived using all interpolated attitude data and using only the discrete Juice attitude acquisition times, respectively.
Utilizing the Earth-farewell campaign of Juice as the first opportunity for in-flight calibration of GALA, we conducted a multifaceted comparison between the observed noise floor and simulations based on JANUS images. The results imply a potential offset of the GALA boresight vector from its pre-launch measurement. The absolute offset from the pre-launch phase may exceed 700 µrad. This offset is comparable to those reported for other laser altimeters. For example, the Light Detection and Ranging (LIDAR) instrument onboard the Hayabusa2 mission (Mizuno et al., 2017) shows a variation of approximately 1 mrad in its LoS directions when comparing multiple calibration methods (Noda et al., 2017, 2023; Matsumoto et al., 2020). Crossover analysis of the NEAR Laser Rangefinder (NLR) also reveals that the boresight shift of NEAR from the pre-launch value greatly exceeds 1 mrad, independent of temperature conditions (Neumann, 2001). Moreover, the Lunar Orbiter Laser Altimeter (LOLA) aboard the Lunar Reconnaissance Orbiter (LRO) found a similar magnitude of boresight variation between dayside and nightside operations due to thermal distortion (Barker et al., 2018). In the case of GALA, such a thermal distortion effect is expected to be smaller based on pre-launch characterization of the instrument. Thermal-vacuum cycling tests conducted prior to launch showed that the boresight offset for operational temperatures between +41 and −7 °C was less than 100 µrad (Hussmann et al., 2025). In addition, the offset induced by launch vibrations was expected to be smaller than 700 µrad by an order of magnitude. Therefore, no definitive physical cause for the inferred offset can be identified at present based on information taken during the pre-launch tests. Nevertheless, any post-launch changes in alignment can only be assessed through in-flight calibration activities such as those presented in this study. Further calibration campaigns are needed to refine the calibration results, avoiding a potential influence from the temporally coarse data of Juice attitude, and to identify the cause of the observed large discrepancies with the pre-launch measurements.
In addition to inferring the boresight alignment, our analysis also provides a radiometric calibration of the GALA receiver, deriving an empirical relationship between the photon flux incident on the GALA APD and noise RMS. Based on Eqs. (5)–(7), this relationship can be expressed by fitting the observed noise RMS, Nobs, to the photon flux estimated from the JANUS image, PG, using
where Nbg is the background noise level of 1.12 mV, and α is a conversion coefficient determined by the fitting. Note that PG is dependent on the assumed boresight vector in the calculation; therefore, different boresight assumptions lead to slightly different calibration lines. Figure 8 shows calibration lines obtained assuming various GALA Rx-LoS alignments. Although the fitted calibration lines are broadly similar, the calibration line derived under the pre-launch boresight assumption yields a GALA noise RMS lower than the theoretical prediction at a given photon flux. This behavior is consistent with the systematically higher simulated noise levels obtained using the pre-launch boresight vector (Fig. 5).
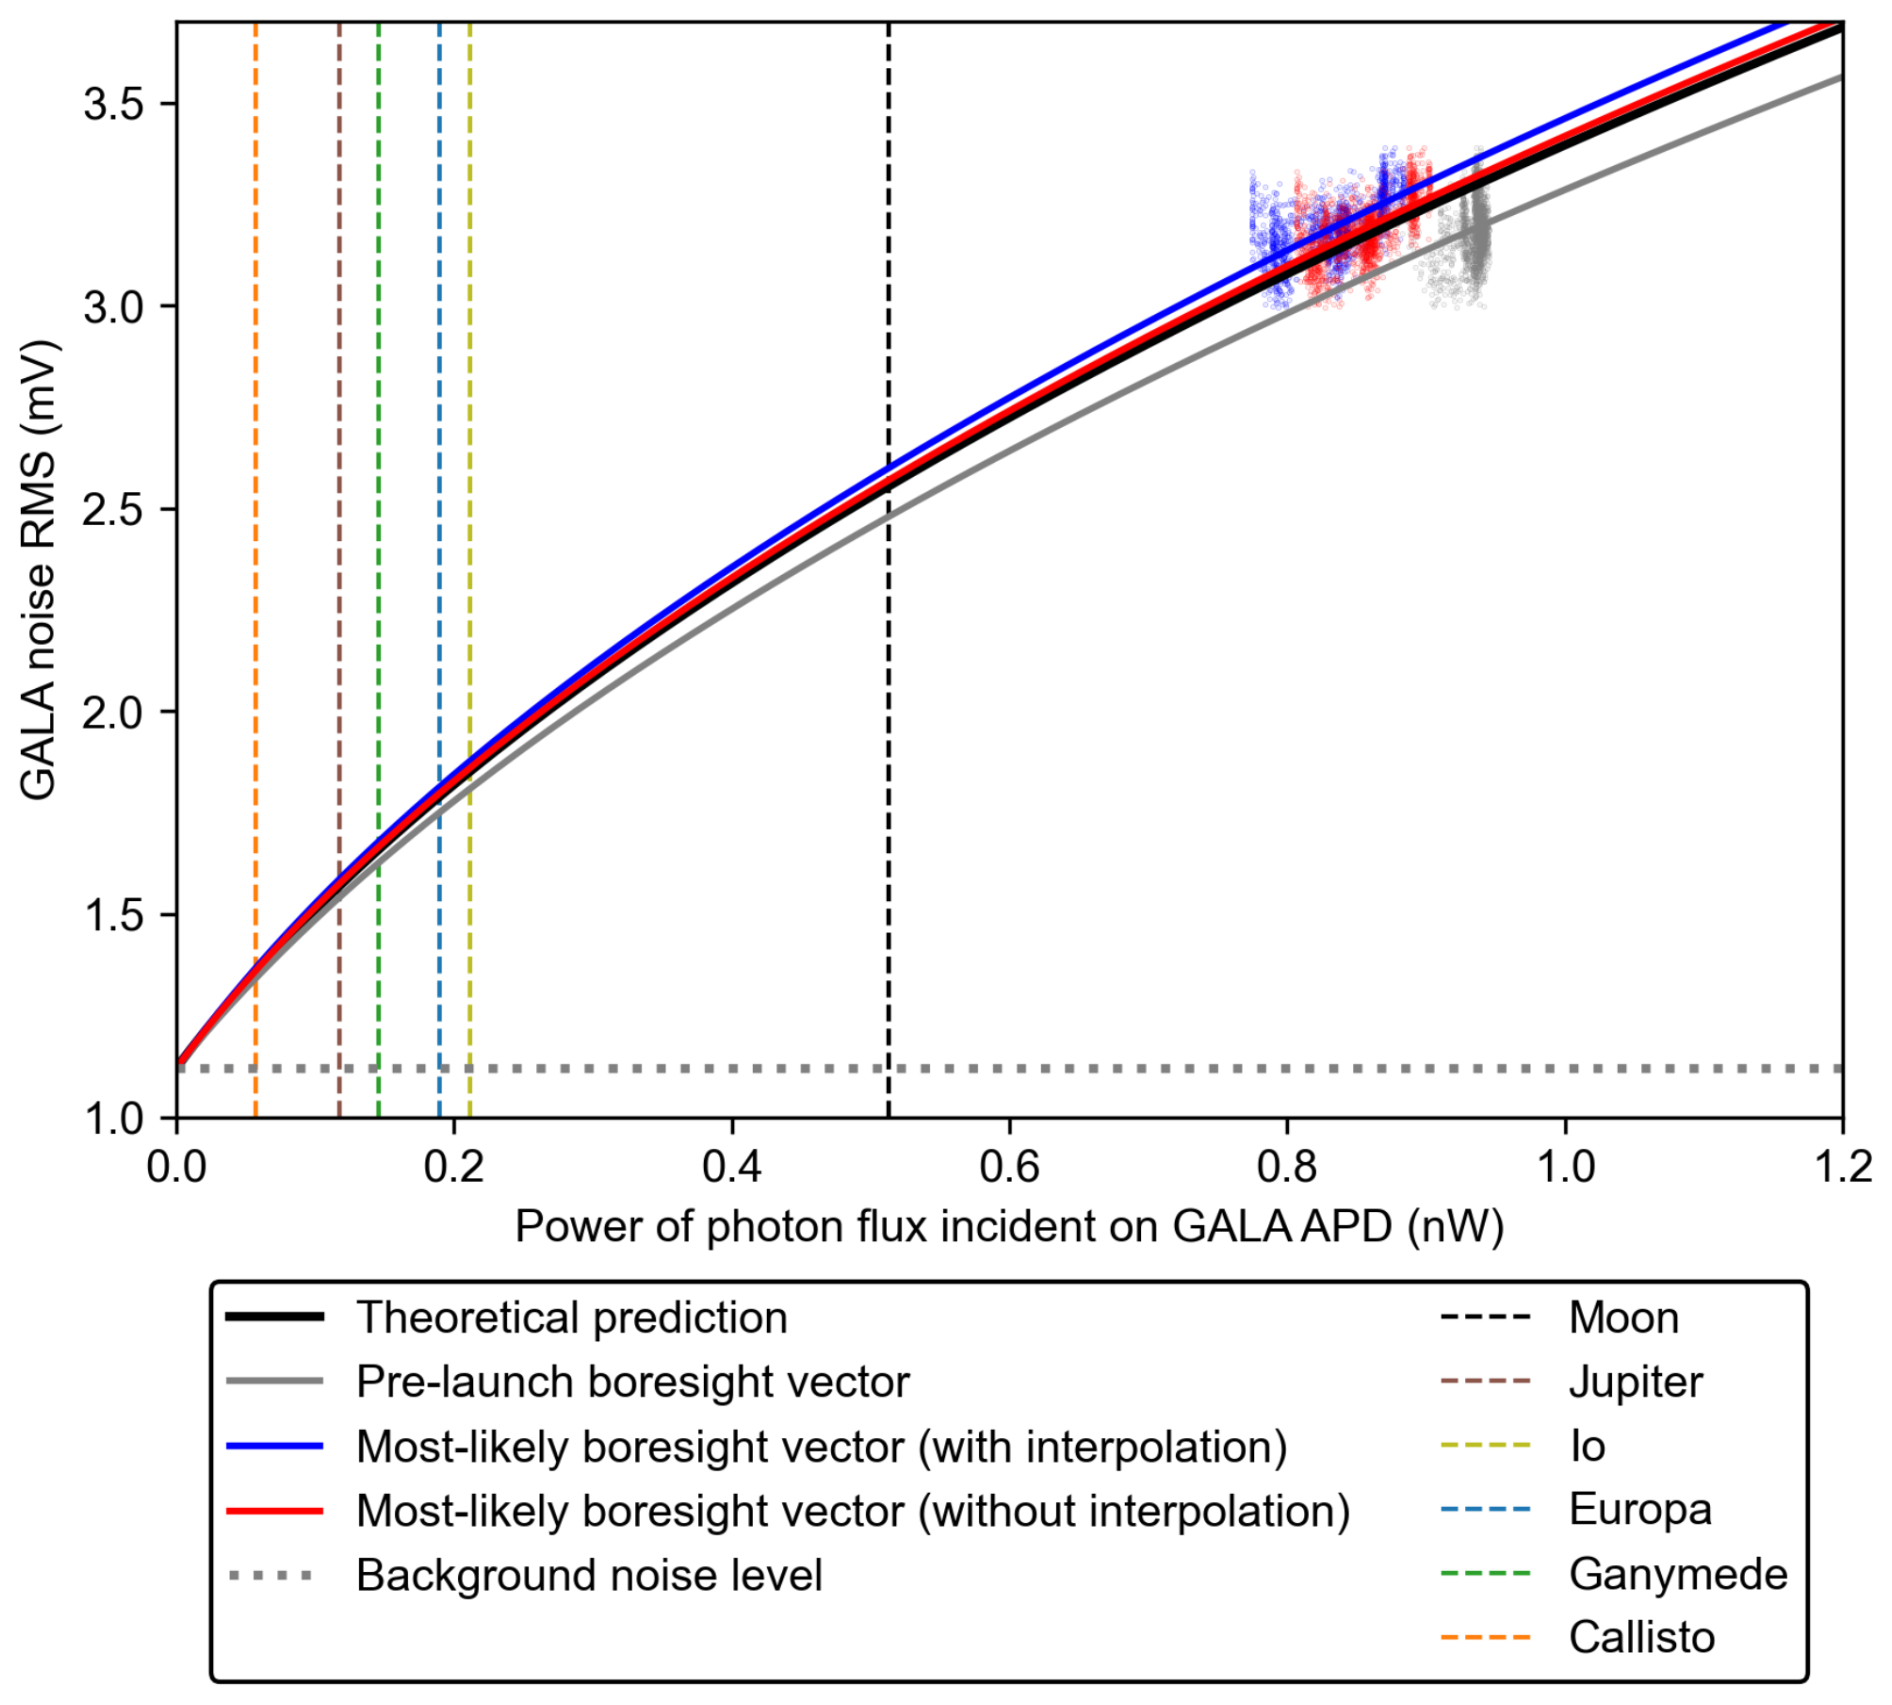
Figure 8Calibration lines between the power of photon flux incident on the GALA APD and the GALA noise RMS. The colored points are values used to fit Eq. (8). The vertical dashed lines indicate the power of photon flux from each planet and moon.
The calibration lines in Fig. 8 suggest that future observations will provide additional opportunities to validate and refine the GALA FOV boresight alignment using the methodology developed in this study. For example, based on the lunar radiance measured by JANUS during the Earth-farewell campaign (pointed by a white arrow in Fig. 2a), the GALA noise level is expected to increase by more than 110 % compared to the background noise level of 1.12 mV (black vertical line in Fig. 8). Given that the phase angle of the Moon was 70° during the Earth-farewell observation, the photon flux incident on the GALA APD could increase significantly when the Moon is observed with a lower phase angle. Moreover, observations of the lunar nearside are expected to yield lower noise levels, as the JANUS image acquired during the Earth-farewell campaign captures the lunar farside with a sub-Juice longitude of 175° E. On the nearside, observations of lunar maria, which have albedo at 1064 nm approximately half that of the highlands (e.g., Lucey et al., 2014), may decrease the noise level significantly. Compared to the Earth measurement, lunar observations are less influenced by the time-varying atmosphere and are more straightforward to interpret the GALA noise variation. Therefore, observation opportunities of the Moon around future Earth Gravity Assists of Juice may help further investigation of the GALA Rx-LoS alignment.
Future reflectance observations of Jupiter and Galilean moons may also be performed by GALA. Using the PSG (Villanueva et al., 2018) together with spectral catalogs of Galilean moons from Clark et al. (2007) and Jupiter from Madden and Kaltenegger (2018), we estimate GALA noise increases during the upcoming flybys in the Jupiter system (vertical dashed lines in Fig. 8). In this sense, the GALA noise level serves as a passive radiometric signal for deriving photon flux from the surface and its reflectance. Assuming Lambertian reflection models with zero phase angle, the maximum increase of the noise level is estimated. This condition corresponds to the time when the GALA FOV is fully covered by planetary surfaces at noon in local time and will be met once the Juice spacecraft arrives in the Jovian system. During all icy moon flybys, GALA may experience noise increases of 21 %–66 % from the background level, which is sufficiently large for boresight characterization under the cold temperature condition similar to the nominal operation at Ganymede and to use it as signals for surface reflectance measurements. However, due to harsh radiation conditions present at Jupiter a significant increase of the APD dark noise level may occur, which potentially could limit the capabilities to interpret the measurements.
Future calibration opportunities, especially when combined with higher-frequency acquisitions of Juice attitude data, will provide more favorable conditions for alignment calibration than the Earth-farewell campaign. Although the present analysis supports a post-launch offset from the pre-launch boresight vector, the inferred alignment is not yet fully conclusive. To a certain extent, discrepancies between simulations and observations remain (Fig. 7), perhaps due to uncertainties in spacecraft attitude knowledge. Due to the low temporal resolution of the Juice attitude data during the Earth-farewell campaign, the Juice attitude information between its discrete measurements needs to be interpolated, particularly for comparison in the noise increase start and end timings, possibly introducing unknown uncertainties in the analysis. Even when only non-interpolated data are considered, the noise magnitude comparison still supports a potential offset, but the influence of attitude sampling limitations cannot be entirely excluded. To resolve this ambiguity, acquisition of higher-frequency attitude data is essential. Since the comparison of interpolation methods shows differences (Fig. 4), such high-frequency data of the Juice attitude can also mitigate estimation errors associated with interpolation. Repeated application of this calibration approach during future flybys with an increased Juice attitude sampling rate will further improve our understanding of the GALA Rx-LoS alignment. Such an increase in the acquisition frequency of Juice attitude data is also mandatory for the planned two-way laser ranging experiments with ground-based satellite laser ranging stations to gain insights into the GALA FOV direction. Opportunities for these calibration activities are expected to arise around the time of the Earth Gravity Assist (EGA) maneuvers in September 2026 and January 2029, as well as during the intermittent payload checkouts scheduled until the arrival in the Jovian system in 2031.
The noise-based alignment calibration demonstrated in this study is broadly applicable for other planetary laser altimeters. For instance, the Mercury Laser Altimeter (MLA) aboard the MErcury Surface, Space Environment, GEochemistry, and Ranging (MESSENGER) spacecraft had similar passive observations to detect Earthshine to refine the pointing alignment (Neumann et al., 2005; Smith et al., 2006). The same calibration approach can be applied to the BepiColombo Laser Altimeter (BELA) aboard the ESA-JAXA BepiColombo mission to Mercury (Thomas et al., 2021). Because BELA measures return pulse shapes in a similar manner as GALA to infer surface albedo and roughness (Nishiyama et al., 2026b), accurate knowledge of the laser altimeter alignment with respect to imaging instruments is crucial for interpreting BELA measurements in a geologic context. This noise-based technique will provide an independent calibration approach, complementary to methods based on crossovers and topographic features (e.g., Xiao et al., 2025; Noda et al., 2021), enabling validation of the boresight vector from multiple perspectives. Therefore, the methodology demonstrated in this study not only supports future GALA measurements during the Juice mission but also offers a general framework for alignment calibration of laser altimeters in planetary exploration.
Juice cruise data are under instrument teams' proprietary period until the delivery to ESA's Planetary Science Archive (https://doi.org/10.57780/esa-2bb387d, (ESA, 2026b) later during the cruise. Meanwhile, all the GALA and JANUS data presented in this study are available upon reasonable requests to HH and PP, respectively.
GN, AS, CH, and HH contributed to the conception and design of the study. GN, AS, KDM, CH, KaWi, KL, CA, JB, JG, KoWi, JK, KE, MK, LA, CT, LP, GP, PP, and HH contributed to data acquisition and organizing the databases. GN wrote the first draft of the paper. All authors contributed to paper revision and approved the submitted version.
The contact author has declared that none of the authors has any competing interests.
Publisher's note: Copernicus Publications remains neutral with regard to jurisdictional claims made in the text, published maps, institutional affiliations, or any other geographical representation in this paper. The authors bear the ultimate responsibility for providing appropriate place names. Views expressed in the text are those of the authors and do not necessarily reflect the views of the publisher.
This article is part of the special issue “The first-ever lunar–Earth flyby: a unique test environment for Juice”. It is not associated with a conference.
This work was supported by JSPS KAKENHI Grant Number JP22K21344, JP26KJ0001, and JSPS Overseas Research Fellowship. Open Access funding enabled and organized by Projekt DEAL. We gratefully acknowledge the support by the JUICE project teams at ESTEC, ESOC, and ESAC. We thank the GALA Experiment teams at DLR (Institute of Space Research, Berlin), at Institute of Space and Astronautical Science (ISAS-JAXA, Tokyo), at University of Bern (Physikalisches Institut, Bern), and at Instituto de Astrofísica de Andalucía (IAA-CSIC, Granada) as well as the GALA Science Team. LA, LP, CT, and PP acknowledge support under ASI-INAF agreement n.2023-6-HH.0. We thank Dr. Daniel Cremons, Dr. Oliver Stenzel, and Dr. Xiaoli Sun for their constructive comments. We also thank the editor, Dr. Elias Roussos, for handling the manuscript.
This research has been supported by the Japan Society for the Promotion of Science (grant nos. JP22K21344 and JP26KJ0001).
The article processing charges for this open-access publication were covered by the German Aerospace Center (DLR).
This paper was edited by Elias Roussos and reviewed by Daniel Cremons, Xiaoli Sun, and Oliver Stenzel.
Acton, C., Bachman, N., Semenov, B., and Wright, E.: A look towards the future in the handling of space science mission geometry, Planet. Space Sci., 150, 9–12, https://doi.org/10.1016/j.pss.2017.02.013, 2018. a
Akima, H.: A New Method of Interpolation and Smooth Curve Fitting Based on Local Procedures, J. ACM, 17, 589–602, https://doi.org/10.1145/321607.321609, 1970. a, b
Annex, A., Pearson, B., Seignovert, B., Carcich, B., Eichhorn, H., Mapel, J., Von Forstner, J., McAuliffe, J., Del Rio, J., Berry, K., Aye, K.-M., Stefko, M., De Val-Borro, M., Kulumani, S., and Murakami, S.-y.: SpiceyPy: a Pythonic Wrapper for the SPICE Toolkit, Journal of Open Source Software, 5, 2050, https://doi.org/10.21105/joss.02050, 2020. a
Araki, H., Tazawa, S., Noda, H., Ishihara, Y., Goossens, S., Sasaki, S., Kawano, N., Kamiya, I., Otake, H., Oberst, J., and Shum, C.: Lunar Global Shape and Polar Topography Derived from Kaguya-LALT Laser Altimetry, Science, 323, 897–900, https://doi.org/10.1126/science.1164146, 2009. a
Barker, M. K., Sun, X., Mao, D., Mazarico, E., Neumann, G. A., Zuber, M. T., Smith, D. E., McGarry, J. F., and Hoffman, E. D.: In-flight characterization of the lunar orbiter laser altimeter instrument pointing and far-field pattern, Appl. Optics, 57, 7702, https://doi.org/10.1364/AO.57.007702, 2018. a, b
Besse, S., Yokota, Y., Boardman, J., Green, R., Haruyama, J., Isaacson, P., Mall, U., Matsunaga, T., Ohtake, M., Pieters, C., Staid, M., Sunshine, J., and Yamamoto, S.: One Moon, many measurements 2: Photometric corrections, Icarus, 226, 127–139, https://doi.org/10.1016/j.icarus.2013.05.009, 2013. a
Bohren, C. F. and Huffman, D. R.: Absorption and Scattering of Light by Small Particles, Wiley, 1 edn., ISBN 978-0-471-29340-8 978-3-527-61815-6, https://doi.org/10.1002/9783527618156, 1998. a
Clark, R. N., Swayze, G. A., Wise, R. A., Livo, K. E., Hoefen, T. M., Kokaly, R. F., and Sutley, S. J.: USGS Digital Spectral Library splib06a, Data Series, USGS [data set], https://doi.org/10.3133/ds231, 2007. a, b
Daly, M. G., Barnouin, O. S., Dickinson, C., Seabrook, J., Johnson, C. L., Cunningham, G., Haltigin, T., Gaudreau, D., Brunet, C., Aslam, I., Taylor, A., Bierhaus, E. B., Boynton, W., Nolan, M., and Lauretta, D. S.: The OSIRIS-REx Laser Altimeter (OLA) Investigation and Instrument, Space Sci. Rev., 212, 899–924, https://doi.org/10.1007/s11214-017-0375-3, 2017. a
Deutsch, A. N., Neumann, G. A., Kreslavsky, M. A., Pokorný, P., Martinez Camacho, J. M., Trang, D., Izenberg, N. R., Denevi, B. W., Galiano, A., and Filacchione, G.: Temperature-related Variations of 1064 nm Surface Reflectance on Mercury: Implications for Space Weathering, The Planetary Science Journal, 5, 8, https://doi.org/10.3847/PSJ/ad0e6d, 2024. a
Enya, K., Kobayashi, M., Kimura, J., Araki, H., Namiki, N., Noda, H., Kashima, S., Oshigami, S., Ishibashi, K., Yamawaki, T., Tohara, K., Saito, Y., Ozaki, M., Mizuno, T., Kamata, S., Matsumoto, K., Sasaki, S., Kuramoto, K., Sato, Y., Yokozawa, T., Numata, T., Mizumoto, S., Mizuno, H., Nagamine, K., Sawamura, A., Tanimoto, K., Imai, H., Nakagawa, H., Kirino, O., Green, D., Fujii, M., Iwamura, S., Fujishiro, N., Matsumoto, Y., Lingenauber, K., Kallenbach, R., Althaus, C., Behnke, T., Binger, J., Daurskikh, A., Eisenmenger, H., Heer, U., Hüttig, C., Lara, L. M., Lichopoj, A., Lötzke, H.-G., Lüdicke, F., Michaelis, H., Pablo Rodriguez Garcia, J., Rösner, K., Stark, A., Steinbrügge, G., Thabaut, P., Thomas, N., Del Togno, S., Wahl, D., Wendler, B., Wickhusen, K., Willner, K., and Hussmann, H.: The Ganymede Laser Altimeter (GALA) for the Jupiter Icy Moons Explorer (JUICE): Mission, science, and instrumentation of its receiver modules, Adv. Space Res., 69, 2283–2304, https://doi.org/10.1016/j.asr.2021.11.036, 2022. a, b
ESA: Juice SPICE Service, ESA [data set], http://spiftp.esac.esa.int/data/SPICE/JUICE/kernels/ (last access: 13 September 2026), 2026a. a
ESA: ESA-JUICE_LEGA-Special-Issue_v1.0, ESA [data set], https://doi.org/10.57780/esa-2bb387d, 2026b. a
Fletcher, L. N., Cavalié, T., Grassi, D., Hueso, R., Lara, L. M., Kaspi, Y., Galanti, E., Greathouse, T. K., Molyneux, P. M., Galand, M., Vallat, C., Witasse, O., Lorente, R., Hartogh, P., Poulet, F., Langevin, Y., Palumbo, P., Gladstone, G. R., Retherford, K. D., Dougherty, M. K., Wahlund, J.-E., Barabash, S., Iess, L., Bruzzone, L., Hussmann, H., Gurvits, L. I., Santolik, O., Kolmasova, I., Fischer, G., Müller-Wodarg, I., Piccioni, G., Fouchet, T., Gérard, J.-C., Sánchez-Lavega, A., Irwin, P. G. J., Grodent, D., Altieri, F., Mura, A., Drossart, P., Kammer, J., Giles, R., Cazaux, S., Jones, G., Smirnova, M., Lellouch, E., Medvedev, A. S., Moreno, R., Rezac, L., Coustenis, A., and Costa, M.: Jupiter Science Enabled by ESA’s Jupiter Icy Moons Explorer, Space Sci. Rev., 219, 53, https://doi.org/10.1007/s11214-023-00996-6, 2023. a
Fritsch, F. N. and Butland, J.: A Method for Constructing Local Monotone Piecewise Cubic Interpolants, SIAM J. Sci. Stat. Comp., 5, 300–304, https://doi.org/10.1137/0905021, 1984. a, b
Hussmann, H., Lingenauber, K., Kallenbach, R., Enya, K., Thomas, N., Lara, L. M., Althaus, C., Araki, H., Behnke, T., Castro-Marin, J. M., Eisenmenger, H., Gerber, T., Herranz De La Revilla, M., Hüttig, C., Ishibashi, K., Jiménez-Ortega, J., Kimura, J., Kobayashi, M., Lötzke, H.-G., Lichopoj, A., Lüdicke, F., Martínez-Navajas, I., Michaelis, H., Namiki, N., Noda, H., Oberst, J., Oshigami, S., Rodríguez García, J. P., Rodrigo, J., Rösner, K., Stark, A., Steinbrügge, G., Thabaut, P., Del Togno, S., Touhara, K., Villamil, S., Wendler, B., Wickhusen, K., and Willner, K.: The Ganymede laser altimeter (GALA): key objectives, instrument design, and performance, CEAS Space Journal, 11, 381–390, https://doi.org/10.1007/s12567-019-00282-8, 2019. a
Hussmann, H., Lingenauber, K., Stark, A., Enya, K., Thomas, N., Lara, L. M., Althaus, C., Araki, H., Behnke, T., Binger, J., Breuer, D., Casotto, S., Castro, J. M., Choblet, G., Christensen, U., Coppoolse, W., Eisenmenger, H., Ferraz-Mello, S., Fujii, M., Fujishiro, N., Gallina, G., Gwinner, K., Hauber, E., Heer, U., Henkelmann, R., Herranz, M., Hüttig, C., Iwamura, S., Jiménez, J., Kimura, J., Kirino, O., Kobayashi, M., Kurita, K., Lainey, V., Leikert, T., Lichopoj, A., Lötzke, H.-G., Lüdicke, F., Martínez-Navajas, I., Michaelis, H., Nakagawa, H., Namiki, N., Nishiyama, G., Noda, H., Oberst, J., Oshigami, S., Pommerol, A., Rech, M., Roatsch, T., Rodrigo, R., Rodríguez, A., Rösner, K., Touhara, K., Saito, Y., Sasaki, S., Sato, Y., Schmidt, F., Schreiber, U., Schulze-Walewski, S., Sohl, F., Spohn, T., Steinbrügge, G., Stephan, K., Tanimoto, K., Thabaut, P., Del Togno, S., Vermeersen, B., Wegert, H., Weidlich, K., Wendler, B., Wickhusen, K., Wieczorek, M., Willner, K., Wolff, F., Yokozawa, T., and Yseboodt, M.: The Ganymede Laser Altimeter (GALA) on the Jupiter Icy moons Explorer (JUICE) Mission, Space Sci. Rev., 221, 33, https://doi.org/10.1007/s11214-025-01149-7, 2025. a, b, c, d, e
Kamata, S., Kimura, J., Matsumoto, K., Nimmo, F., Kuramoto, K., and Namiki, N.: Tidal deformation of Ganymede: Sensitivity of Love numbers on the interior structure, J. Geophys. Res.-Planets, 121, 1362–1375, https://doi.org/10.1002/2016JE005071, 2016. a
Kikuchi, S., Saiki, T., Takei, Y., Terui, F., Ogawa, N., Mimasu, Y., Ono, G., Yoshikawa, K., Sawada, H., Takeuchi, H., Ikeda, H., Fujii, A., Sugita, S., Morota, T., Yamada, M., Honda, R., Yokota, Y., Sakatani, N., Kameda, S., Kouyama, T., Hirata, N., Hirata, N., Shirai, K., Kitazato, K., Nakazawa, S., Yoshikawa, M., Tanaka, S., Wada, K., Watanabe, S.-i., and Tsuda, Y.: Hayabusa2 pinpoint touchdown near the artificial crater on Ryugu: Trajectory design and guidance performance, Adv. Space Res., 68, 3093–3140, https://doi.org/10.1016/j.asr.2021.07.031, 2021. a
Kimura, J., Hussmann, H., Kamata, S., Matsumoto, K., Oberst, J., Steinbrügge, G., Stark, A., Gwinner, K., Oshigami, S., Namiki, N., Lingenauber, K., Enya, K., Kuramoto, K., and Sasaki, S.: Science Objectives of the Ganymede Laser Altimeter (GALA) for the JUICE Mission, Aerospace Technology Japan, 17, 234–243, https://doi.org/10.2322/tastj.17.234, 2019. a
Langevin, Y., Rodriguez, S., Guerlet, S., Poulet, F., Piccioni, G., Agostini, L., Armante, R., D'Aversa, E., Filacchione, G., Fletcher, L., Oliva, F., Royer, C., Seignovert, B., Stephan, K., Tosi, F., and Trent, T.: Post launch spectral and radiometric performances of MAJIS, the VIS-NIR imaging spectrometer of JUICE, Ann. Geophys., 44, 825–853, https://doi.org/10.5194/angeo-44-825-2026, 2026. a
Lucey, P. G., Neumann, G. A., Riner, M. A., Mazarico, E., Smith, D. E., Zuber, M. T., Paige, D. A., Bussey, D. B., Cahill, J. T., McGovern, A., Isaacson, P., Corley, L. M., Torrence, M. H., Melosh, H. J., Head, J. W., and Song, E.: The global albedo of the Moon at 1064 nm from LOLA, J. Geophys. Res.-Planets, 119, 1665–1679, https://doi.org/10.1002/2013JE004592, 2014. a
Madden, J. and Kaltenegger, L.: A Catalog of Spectra, Albedos, and Colors of Solar System Bodies for Exoplanet Comparison, Astrobiology, 18, 1559–1573, https://doi.org/10.1089/ast.2017.1763, 2018. a, b
Matsumoto, K., Noda, H., Ishihara, Y., Senshu, H., Yamamoto, K., Hirata, N., Hirata, N., Namiki, N., Otsubo, T., Higuchi, A., Watanabe, S.-i., Ikeda, H., Mizuno, T., Yamada, R., Araki, H., Abe, S., Yoshida, F., Sasaki, S., Oshigami, S., Tsuruta, S., Asari, K., Shizugami, M., Yamamoto, Y., Ogawa, N., Kikuchi, S., Saiki, T., Tsuda, Y., Yoshikawa, M., Tanaka, S., Terui, F., Nakazawa, S., Yamaguchi, T., Takei, Y., Takeuchi, H., Okada, T., Yamada, M., Shimaki, Y., Shirai, K., Ogawa, K., and Iijima, Y.-i.: Improving Hayabusa2 trajectory by combining LIDAR data and a shape model, Icarus, 338, 113574, https://doi.org/10.1016/j.icarus.2019.113574, 2020. a
Mizuno, T., Kase, T., Shiina, T., Mita, M., Namiki, N., Senshu, H., Yamada, R., Noda, H., Kunimori, H., Hirata, N., Terui, F., and Mimasu, Y.: Development of the Laser Altimeter (LIDAR) for Hayabusa2, Space Sci. Rev., 208, 33–47, https://doi.org/10.1007/s11214-015-0231-2, 2017. a, b
Neumann, G. A.: Some aspects of processing extraterrestrial LIDAR data: Clementine NEAR MOLA., vol. 34.3, W4, https://www.isprs.org/proceedings/xxxiv/3-W4/pdf/Neumann.pdf (last access: 12 October 2026), 2001. a
Neumann, G. A., Abshire, J. B., Aharonson, O., Garvin, J. B., Sun, X., and Zuber, M. T.: Mars Orbiter Laser Altimeter pulse width measurements and footprint‐scale roughness, Geophys. Res. Lett., 30, 2003GL017048, https://doi.org/10.1029/2003GL017048, 2003. a
Neumann, G. A., Smith, D. E., Zuber, M. T., Sun, X., Cavanaugh, J. F., McGarry, J. F., and Zagwodski, T. W.: An asynchronous laser transponder experiment in deep space using MESSENGER's Mercury Laser Altimeter, G51A–0808, https://ui.adsabs.harvard.edu/abs/2005AGUFM.G51A0808N (last access: 9 October 2026), 2005. a
Nishiyama, G., Suzuki, Y., Uno, S., Aoki, S., Iwanaka, T., Imamura, T., Fujii, Y., Müller, T. G., Taguchi, M., Kouyama, T., Barraud, O., D'Amore, M., Helbert, J., Adeli, S., and Hiesinger, H.: Temporal variation in the cloud-top temperature of Venus revealed by meteorological satellites, Earth Planets Space, 77, 91, https://doi.org/10.1186/s40623-025-02223-8, 2025. a
Nishiyama, G., Preusker, F., Broquet, A., Stark, A., Hussmann, H., Hauber, E., and Tosi, N.: First Global Map of Mercury’s Surface Roughness Down to Kilometric Baselines: Implications for the Planet’s Geologic Evolution, The Planetary Science Journal, 7, 59, https://doi.org/10.3847/PSJ/ae447c, 2026a. a
Nishiyama, G., Stark, A., Hüttig, C., Wickhusen, K., Althaus C., Behnke, T., Hauber, E., Gwinner, K., Willner, K., Namiki, N., Schmidt, F., Barron, J., Lancery, H., Arghavanian, A., and Hussmann H.: Prospects for Mercury Observations with the BepiColombo Laser Altimeter (BELA): Implications for Estimating Surface Roughness from Laser Altimetry, arXiv [preprint], arXiv:2609.20365, https://doi.org/10.48550/arXiv.2609.20365, 2026b. a, b
Noda, H., Kunimori, H., Mizuno, T., Senshu, H., Ogawa, N., Takeuchi, H., Moore, C., Pollard, A., Yamaguchi, T., Namiki, N., Kase, T., Saiki, T., and Tsuda, Y.: Laser link experiment with the Hayabusa2 laser altimeter for in-flight alignment measurement, Earth Planets Space, 69, 2, https://doi.org/10.1186/s40623-016-0589-8, 2017. a, b
Noda, H., Senshu, H., Matsumoto, K., Namiki, N., Mizuno, T., Sugita, S., Abe, S., Araki, H., Asari, K., Cho, Y., Fujii, A., Hayakawa, M., Higuchi, A., Hirata, N., Hirata, N., Honda, C., Honda, R., Ishihara, Y., Kameda, S., Kikuchi, S., Kouyama, T., Matsuoka, M., Mimasu, Y., Morota, T., Nakazawa, S., Ogawa, K., Ogawa, N., Ono, G., Oshigami, S., Saiki, T., Sakatani, N., Sasaki, S., Sawada, H., Shizugami, M., Suzuki, H., Takahashi, T., Takei, Y., Tanaka, S., Tatsumi, E., Terui, F., Tsuda, Y., Tsuruta, S., Watanabe, S.-i., Yamada, M., Yamada, R., Yamaguchi, T., Yamamoto, K., Yokota, Y., Yoshida, F., Yoshikawa, K., Yoshikawa, M., and Yoshioka, K.: Alignment determination of the Hayabusa2 laser altimeter (LIDAR), Earth Planets Space, 73, 21, https://doi.org/10.1186/s40623-020-01342-8, 2021. a, b
Noda, H., Senshu, H., Otsubo, T., Takeuchi, H., Courde, C., Kunimori, H., Moore, C., Schreiber, U., Ogawa, N., Saiki, T., Takei, Y., Aimar, M., Chabé, J., Eckl, J., Kamata, S., Higuchi, A., Hirai, T., Martinot-Lagarde, G., Mariey, H., Matsumoto, K., Maurice, N., Nakazono, J., Phung, D.-H., Scariot, J., Suetsugu, R., Torre, J.-M., Pollard, A., Viot, H., Namiki, N., and Mizuno, T.: Demonstration of deep-space synchronous two-way laser ranging with a laser transponder aboard Hayabusa2, Adv. Space Res., 71, 4196–4209, https://doi.org/10.1016/j.asr.2022.12.057, 2023. a, b
Ohtake, M., Pieters, C., Isaacson, P., Besse, S., Yokota, Y., Matsunaga, T., Boardman, J., Yamomoto, S., Haruyama, J., Staid, M., Mall, U., and Green, R.: One Moon, Many Measurements 3: Spectral reflectance, Icarus, 226, 364–374, https://doi.org/10.1016/j.icarus.2013.05.010, 2013. a
Okuyama, A., Takahashi, M., Date, K., Hosaka, K., Murata, H., Tabata, T., and Yoshino, R.: Validation of Himawari-8/AHI Radiometric Calibration Based on Two Years of In-Orbit Data, J. Meteorol. Soc. Jpn. Ser. II, 96B, 91–109, https://doi.org/10.2151/jmsj.2018-033, 2018. a
Palumbo, P., Roatsch, T., Lara, L. M., Castro-Marin, J. M., Della Corte, V., Hviid, S., Jaumann, R., Michaelis, H., Patel, M. R., Portyankina, G., Schmitz, N., Amoroso, M., Mugnuolo, R., Aboudan, A., Agostini, L., Althaus, C., Álvarez, F., Bartolomei, M., Behnke, T., Bilotta, T., Colombatti, G., Colosimo, A., Coustenis, A., Cremonese, G., Crews, C., Dattolo, A., Debei, S., Denk, T., Fiethe, B., Herranz, M., Hoffmann, H., Hueso, R., Koncz, A., Jiménez-Ortega, J., Lichopoj, A., Livi, L., Llamas, X., Lopes, R., Lucchetti, A., Martinez-Navajas, I., Mazzotta Epifani, E., Mertens, V., Pajola, M., Sarti, F., Schroedter, R., Stephan, K., Tosi, F., Tubiana, C., Wendler, B., Wendler, D., Williams, D., Wolff, F., Zusi, M., Chiodini, S., Ficai Veltroni, I., Galeotti, A., García-Segura, A., Greggio, D., Holland, A. D., Kenkmann, T., Leese, M. R., Magrin, D., Michalik, H., Munari, M., Noci, G. E., Paolinetti, R., Schipani, P., Soman, M., Stefanov, K. D., Turella, A., Aharonson, O., Bell, J. F., Bertini, I., Coates, A. J., Di Achille, G., Grassi, D., Groussin, O., Gwinner, K., Haruyama, J., Hauber, E., Hiesinger, H., Langevin, Y., Lainey, V., Marchi, S., Marinangeli, L., Marzari, F., Massironi, M., Mitri, G., Mottola, S., Oberst, J., Postberg, F., Poulet, F., Preusker, F., Schmidt, J., Schneider, N. M., Simon, A., Takahashi, Y., Tirsch, D., Vincendon, M., Balme, M. R., Bettanini, C., Borin, P., Capria, M. T., Elgner, S., Esposito, F., Ferranti, L., Ferrari, S., Fornasier, S., Galluzzi, V., Giacomini, L., Guzzetta, L., Jones, G. H., Kersten, E., Ledeit, L., Martellato, E., Matz, K.-D., Mennella, V., Murray, C., Otto, K. A., Pelizzo, M. G., Penasa, L., Politi, R., Popa, C., Pozzobon, R., Prieto Ballesteros, O., Re, C., Rotundi, A., Sato, M., Schmedemann, N., Shoji, D., Simioni, E., Sindoni, G., Trauthan, F., and Yair, Y.: The JANUS (Jovis Amorum ac Natorum Undique Scrutator) VIS-NIR Multi-Band Imager for the JUICE Mission, Space Sci. Rev., 221, 32, https://doi.org/10.1007/s11214-025-01158-6, 2025. a, b, c
Pieters, C., Boardman, J., Ohtake, M., Matsunaga, T., Haruyama, J., Green, R., Mall, U., Staid, M., Isaacson, P., Yokota, Y., Yamamoto, S., Besse, S., and Sunshine, J.: One Moon, many measurements 1: Radiance values, Icarus, 226, 951–963, https://doi.org/10.1016/j.icarus.2013.07.008, 2013. a
Smith, D. E., Zuber, M. T., Sun, X., Neumann, G. A., Cavanaugh, J. F., McGarry, J. F., and Zagwodzki, T. W.: Two-Way Laser Link over Interplanetary Distance, Science, 311, 53–53, https://doi.org/10.1126/science.1120091, 2006. a, b
Smith, D. E., Zuber, M. T., Neumann, G. A., Mazarico, E., Lemoine, F. G., Head Iii, J. W., Lucey, P. G., Aharonson, O., Robinson, M. S., Sun, X., Torrence, M. H., Barker, M. K., Oberst, J., Duxbury, T. C., Mao, D., Barnouin, O. S., Jha, K., Rowlands, D. D., Goossens, S., Baker, D., Bauer, S., Gläser, P., Lemelin, M., Rosenburg, M., Sori, M. M., Whitten, J., and Mcclanahan, T.: Summary of the results from the lunar orbiter laser altimeter after seven years in lunar orbit, Icarus, 283, 70–91, https://doi.org/10.1016/j.icarus.2016.06.006, 2017. a, b, c
Stark, A., Oberst, J., Preusker, F., Gwinner, K., Peale, S. J., Margot, J.-L., Phillips, R. J., Zuber, M. T., and Solomon, S. C.: Mercury's rotational parameters from MESSENGER image and laser altimeter data: A feasibility study, Planet. Space Sci., 117, 64–72, https://doi.org/10.1016/j.pss.2015.05.006, 2015a. a
Stark, A., Oberst, J., Preusker, F., Peale, S. J., Margot, J., Phillips, R. J., Neumann, G. A., Smith, D. E., Zuber, M. T., and Solomon, S. C.: First MESSENGER orbital observations of Mercury's librations, Geophys. Res. Lett., 42, 7881–7889, https://doi.org/10.1002/2015GL065152, 2015b. a
Stark, A., Hussmann, H., Althaus, C., Behnke, T., Binger, J., Choblet, G., Enya, K., Ferraz Mello, S., George, J. P., Hüttig, C., Kimura, J., Lingenauber, K., Nishiyama, G., Oberst, J., Palumbo, P., Portyankina, G., Tubiana, C., Wickhusen, K., Willner, K., Wieczorek, M., and GALA team: Performance of the Ganymede Laser Altimeter (GALA) based on cruise measurements, EPSC Abstracts, 17, EPSC2024-871, https://doi.org/10.5194/epsc2024-871, 2024. a
Steinbrügge, G., Stark, A., Hussmann, H., Wickhusen, K., and Oberst, J.: The performance of the BepiColombo Laser Altimeter (BELA) prior launch and prospects for Mercury orbit operations, Planet. Space Sci., 159, 84–92, https://doi.org/10.1016/j.pss.2018.04.017, 2018. a
Sun, X., Blair, J. B., Bufton, J. L., Faina, M., Dahl, S., Bérard, P., and Seymour, R. J.: Advanced silicon avalanche photodiodes on NASA's Global Ecosystem Dynamics Investigation (GEDI) mission, in: Photonic Instrumentation Engineering VII, edited by Soskind, Y. and Busse, L. E., p. 39, SPIE, San Francisco, United States, ISBN 978-1-5106-3337-7 978-1-5106-3338-4, https://doi.org/10.1117/12.2545203, 2020. a
Thomas, N., Hussmann, H., Spohn, T., Lara, L. M., Christensen, U., Affolter, M., Bandy, T., Beck, T., Chakraborty, S., Geissbuehler, U., Gerber, M., Ghose, K., Gouman, J., HosseiniArani, S., Kuske, K., Peteut, A., Piazza, D., Rieder, M., Servonet, A., Althaus, C., Behnke, T., Gwinner, K., Hüttig, C., Kallenbach, R., Lichopoj, A., Lingenauber, K., Lötzke, H.-G., Lüdicke, F., Michaelis, H., Oberst, J., Schrödter, R., Stark, A., Steinbrügge, G., Del Togno, S., Wickhusen, K., Castro, J. M., Herranz, M., Rodrigo, J., Perplies, H., Weigel, T., Schulze-Walewski, S., Blum, S., Casciello, A., Rugi-Grond, E., Coppoolse, W., Rech, M., Weidlich, K., Leikert, T., Henkelmann, R., Trefzger, B., and Metz, B.: The BepiColombo Laser Altimeter, Space Sci. Rev., 217, 25, https://doi.org/10.1007/s11214-021-00794-y, 2021. a
Tosi, F., Roatsch, T., Galli, A., Hauber, E., Lucchetti, A., Molyneux, P., Stephan, K., Achilleos, N., Bovolo, F., Carter, J., Cavalié, T., Cimò, G., D’Aversa, E., Gwinner, K., Hartogh, P., Huybrighs, H., Langevin, Y., Lellouch, E., Migliorini, A., Palumbo, P., Piccioni, G., Plaut, J. J., Postberg, F., Poulet, F., Retherford, K., Rezac, L., Roth, L., Solomonidou, A., Tobie, G., Tortora, P., Tubiana, C., Wagner, R., Wirström, E., Wurz, P., Zambon, F., Zannoni, M., Barabash, S., Bruzzone, L., Dougherty, M., Gladstone, R., Gurvits, L. I., Hussmann, H., Iess, L., Wahlund, J.-E., Witasse, O., Vallat, C., and Lorente, R.: Characterization of the Surfaces and Near-Surface Atmospheres of Ganymede, Europa and Callisto by JUICE, Space Sci. Rev., 220, 59, https://doi.org/10.1007/s11214-024-01089-8, 2024. a
Turella, A., Della Corte, V., Paolinetti, R., Palumbo, P., Amoroso, M., Castronuovo, M., and Mugnuolo, R.: Structural-Thermal-Optical-Performance (STOP) analysis for the prediction of the line-of-sight stability of JANUS camera on board JUICE ESA mission, in: Optical Modeling and System Alignment, edited by Kahan, M. A., Youngworth, R. N., and Sasián, J., p. 13, SPIE, San Diego, United States, ISBN 978-1-5106-2899-1 978-1-5106-2900-4, https://doi.org/10.1117/12.2529279, 2019. a
Villanueva, G., Smith, M., Protopapa, S., Faggi, S., and Mandell, A.: Planetary Spectrum Generator: An accurate online radiative transfer suite for atmospheres, comets, small bodies and exoplanets, J. Quant. Spectrosc. Ra., 217, 86–104, https://doi.org/10.1016/j.jqsrt.2018.05.023, 2018. a, b
Xiao, H., Stark, A., Steinbrügge, G., Briaud, A., Lara, L. M., and Gutiérrez, P. J.: Mercury's Tidal Love Number h2 From Co-Registration of MLA Profiles, Geophys. Res. Lett., 52, e2024GL112 266, https://doi.org/10.1029/2024GL112266, 2025. a, b
Yumoto, K., Tatsumi, E., Kouyama, T., Golish, D., Cho, Y., Morota, T., Kameda, S., Sato, H., Rizk, B., DellaGiustina, D., Yokota, Y., Suzuki, H., De León, J., Campins, H., Licandro, J., Popescu, M., Rizos, J., Honda, R., Yamada, M., Sakatani, N., Honda, C., Matsuoka, M., Hayakawa, M., Sawada, H., Ogawa, K., Yamamoto, Y., Lauretta, D., and Sugita, S.: Comparison of optical spectra between asteroids Ryugu and Bennu: I. Cross calibration between Hayabusa2/ONC-T and OSIRIS-REx/MapCam, Icarus, 417, 116122, https://doi.org/10.1016/j.icarus.2024.116122, 2024. a