the Creative Commons Attribution 4.0 License.
the Creative Commons Attribution 4.0 License.
Global long-term trends in the total electron content
Jaroslav Urbář
Total electron content (TEC) is an important parameter for ionospheric dynamics, global navigation satellite system/Global Positioning System (GNSS/GPS) signal propagation and related applications of GNSS/GPS signals. Despite this fact, the long-term trends in TEC have been studied only a little. Here, we analyze the JPL-35 (Jet Propulsion Laboratory-35) homogeneous series of global TEC data for 1994–2014 for selection of the optimum solar activity proxy for TEC analyses and the UPC (Universitat Politècnica de Catalunya) TEC data over 2003–2023 for estimating long-term trends in TEC. TEC trends are predominantly negative. TEC trends reveal a clear wavenumber 2 longitudinal structure in low/equatorial latitudes with strong negative trends in belts 0–60 and 180–240° E and weak trends in 90–150 and 270–330° E. For more detailed information on TEC trends, a longer series of reliable TEC data is required.
- Article
(1632 KB) - Full-text XML
- BibTeX
- EndNote
The increasing atmospheric concentration of greenhouse gases, particularly of carbon dioxide, and long-term changes in other trend drivers, mainly the secular change of Earth's magnetic field and stratospheric ozone concentration, result in long-term trends in the thermosphere and ionosphere (e.g., Laštovička et al., 2012). Since the pioneering work by Rishbeth and Roble (1992), investigations of long-term trends in the ionosphere have been developing for more than 30 years. The state of investigations of long-term trends in the mesosphere–thermosphere–ionosphere system has recently been reviewed by Laštovička (2023).
One of the most important ionospheric parameters is the vertical columnar total electron content (TEC), particularly due to its impact on propagation of signals of the global navigation satellite systems (GNSSs) such as the Global Positioning System (GPS) and their applications, e.g., precise positioning, causing serious issues for single-frequency receiver-based positioning and for precise positioning using differential GNSS techniques, like (network) real-time kinematic (RTK/NRTK) positioning (Hernández-Pajares et al., 2017). Global TEC data have only been available since 1994; therefore, trends in TEC have been studied less than trends in other main ionospheric parameters observed by the global ionosonde network since the International Geophysical Year in 1957/1958. The first paper on trends in TEC was published by Lean et al. (2011) for the period 1995–2010. They found the average trend to be positive, which is not consistent with trends in foF2. Laštovička (2013) used historical (1976–1996) Faraday rotation-based TEC data from Florence, Italy, i.e., the region where the Lean et al. (2011) trends were positive and much stronger than average trends. Laštovička found no long-term trend although they used data with a relatively large uncertainty, which called into question the results of Lean et al. (2011). Lean et al. (2016) analyzed TEC data over the period 1999–2015 and obtained a very weak statistically insignificant global TEC trend (negative but close to zero). Emmert et al. (2017) constructed homogeneous JPL-35 (Jet Propulsion Laboratory-35) TEC data series based on 35 globally distributed stations re-evaluated consistently by the same method. They compared the evolution of JPL-35 data with other data series for 1994–2014. Emmert et al. (2017, their Fig. 7) found a non-stable level of TEC in early years, particularly a jump of CODE data series by 3 TECU (TEC units) in autumn 2001. Laštovička et al. (2017) used the JPL-35 global TEC data series by Emmert et al. (2017), found a slight negative trend in global TEC and provided evidence that the Lean et al. (2011) positive trend was a consequence of a data problem in the early years (before autumn 2001) of TEC data series; they reported that the “better” result of Lean et al. (2016) is due to the fact that they included fewer “wrong” years in the analysis.
Before studying TEC trends, we have to solve the problem of the optimum solar activity proxy for removal of the solar cycle effect, because for foF2 it was found that trends are critically dependent on selection of the optimum solar activity proxy (Laštovička, 2024). This is the first task of this paper. F30 was found to be the optimum solar activity proxy for foF2 (Laštovička and Buresova, 2023; Danilov and Berbeneva, 2023, 2024; Zossi et al., 2023). The main task of this paper is to establish the regional TEC long-term trends globally.
In this work, we shall examine the regional TEC trends globally, depending on latitude and longitude. Section 2 describes the data and methods used. Section 3 deals with the selection of the optimum solar activity proxy for TEC investigations. Section 4 treats long-term trends in TEC. Section 5 contains conclusions.
To reach the first goal, to select the optimum solar activity proxy, the homogeneous global average JPL-35 TEC data by Emmert et al. (2017) will be used (Emmert et al., 2017, supporting information, “Data Set S1”). We shall analyze yearly average values based on monthly medians over the period 1994–2014. Criteria used for selection of the optimum solar activity proxy are described in Sect. 3.
To study the regional long-term trends in TEC, the UPC (Universitat Politècnica de Catalunya) TEC global map data are used (Hernandez-Pajares et al., 1998). We analyze yearly averages based on monthly medians around noon (10:00–14:00 LT, local time) for 2003–2023. The time interval has been selected to avoid data problems. Before 2002, the TEC data from all international resources (IGS, CODE, JPL, UPC, ESA) are more or less unstable according to Emmert et al. (2017), whereas since 2002 they have been stable with respect to JPL-35. Moreover, UPC data were issued with an epoch having a time step of 2 h before 2003 in odd hours and since 2003 in even hours. Data are separated by 2 h in local time (LT). Therefore, to have all data at the same LT, we are performing the analysis for averages in meridional belts spanning 30° of longitude (equal to 2 h of LT) with a latitudinal step/resolution of 2.5°. The first belt is centered at 0° E, the next at 30° E, etc.
The long-term trends are calculated in the traditional way. First the effect of solar activity is removed from the TEC data in order to remove the much stronger solar cycle effect. Then the trends are calculated from TEC residuals in the following way.
First, the dependence of TEC on solar proxies (i.e., parameters A and B) is calculated by linear regression, Eq. (1):
Second, using Eq. (1) with parameters A and B calculated in the first step, model values of TECmod are calculated for all individual years and all solar proxies. Third, using linear regression for TEC residuals, TECobs − TECmod is calculated, Eq. (2):
where TECobs is the observed value of TEC, and the long-term trend represented by the trend coefficient D is calculated.
For the selection of the optimum solar activity proxy, we use the homogenized JPL-35 TEC data by Emmert et al. (2017) (1994–2014) and six solar activity indices/proxies: F10.7, F30, Mg II, He II, sunspot number and the solar Lyman-α flux. The optimum solar activity proxy selection requires criteria according to which the selection may be made. We use four such criteria:
-
The percentage of total variance of TEC described by the solar activity proxy should be the largest one.
-
The standard error of the trend slope/coefficient D should be the smallest one.
-
The percentage of total variance of TEC residuals (TECobs−TECmod) described by the trend with the given solar proxy should be the largest one.
-
The average of absolute values of differences between observed and modeled (with solar proxy) TEC (TEC residuals) should be the smallest one.
Table 1 shows how these criteria are fulfilled for all six solar activity proxies used. The first row presents the percentage of total variance of TEC described by individual solar activity proxies. These percentages are equal, 99 %, for all solar activity proxies; thus, this criterion does not help to select the optimal proxy. However, 99 % confirms that the linear Eq. (1) may be used and that it is not an oversimplification. The second row shows the trend slope/coefficients and, more importantly, their standard errors. The smallest standard error (even though it had the highest trend slope) is for F30, but those for F10.7, Fα and Mg II differ very little. However, this criterion disqualifies He II. The third row provides information about the percentage of total variance of TEC residuals described by the trend with individual solar activity proxies. This criterion clearly very much favors F30 (percentage for F30 is more than twice as large as for all other solar activity proxies) and evidently disqualifies sunspot numbers. The fourth criterion (shown on the fourth row), i.e., the average of absolute values of differences between observed and modeled TEC, again supports F30 as the optimum solar activity proxy. Summing up, we may say that F30 is the optimum solar activity proxy for studying long-term trends of TEC based on yearly values. This result is not surprising, because F30 is also the optimum solar activity proxy for foF2, as discussed in the Introduction, and the F2 layer makes a very substantial contribution to TEC.

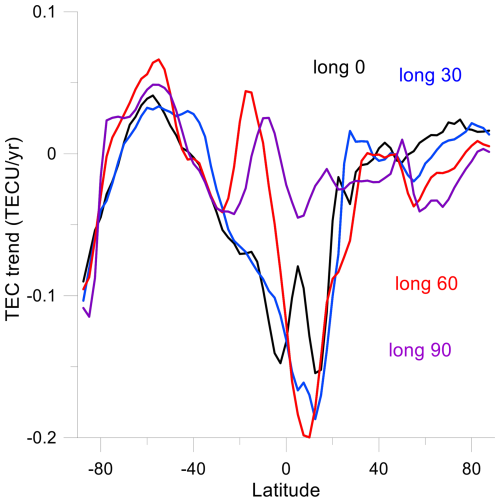
Figure 1Latitudinal dependence of TEC trends (TECU yr−1) for longitudinal belts centered at 0, 30, 60 and 90°, with latitudes of 87.5° S–87.5° N.

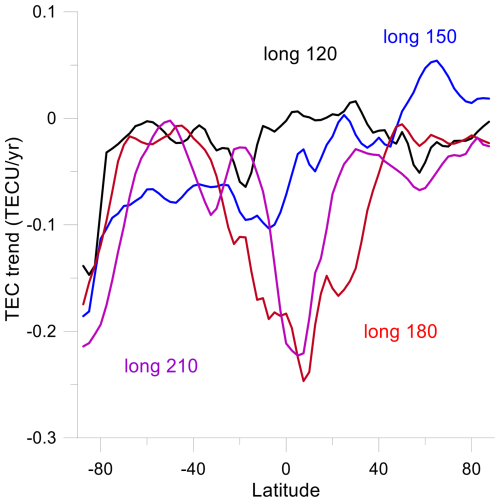
Figure 2Latitudinal dependence of TEC trends (TECU yr−1) for longitudinal belts centered at 120, 150, 180 and 210°, with latitudes of 87.5° S–87.5° N.

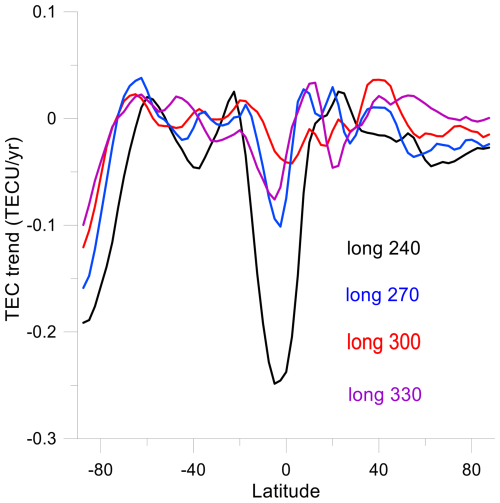
Figure 3Latitudinal dependence of TEC trends (TECU yr−1) for longitudinal belts centered at 240, 270, 300 and 330°, with latitudes of 87.5° S–87.5° N.
Table 1Global JPL-35 TEC, 1994–2014, and the fulfillment of selection criteria for the optimum solar activity proxy. “R2 solar” represents the percentage of total variance of TEC described by the solar activity proxy. “Slope D” as well as its standard error represents the trend coefficient. “R2 trend” represents the percentage of total variance of TEC residuals (TECobs−TECmod) described by the long-term trend. dTEC represents the average of the absolute values of differences between observed and modeled (with solar proxy) TEC (TEC residuals).

In Table 2, we repeat the search for the optimum solar activity proxy with the global UPC TEC calculated for noon (noon in all longitudinal bands; see Sect. 4). The first row reveals the highest percentage of total variance to be described by the solar activity proxy F30 (100 % means more than 99.5 %) followed by F10.7 and Mg II, and it disqualifies Fα (only 95 %). The smallest standard error in the second row is again for F30, even though the largest trend slope occurs with Mg II. A smaller trend slope for F30 might be the consequence of a very small part of the non-solar total variance of TEC for F30 (less than 0.5 %). This is probably also the reason for the smaller percentage of total variance of TEC residuals described by F30 compared to Mg II on the third row; this row disqualifies sunspot numbers. The last row, which shows the average of absolute values of differences between observed and modeled TEC, again favors F30. So, according to three out of four criteria, again F30 is the optimum solar activity proxy.
Since long-term trends in foF2 are most pronounced around noon (e.g., Danilov, 2015) and since the F2 region represents a very important contribution to TEC, we focus on TEC trends around noon (10:00–14:00 LT). They are calculated using Eqs. (1) and (2) and solar activity proxy F30. These trends are presented in Figs. 1–3 in the form of meridional profiles of trends separated by 30° in longitude. All three figures reveal a similar general latitudinal pattern. At higher latitudes (φ>30°, for Fig. 3 φ>20°) in both hemispheres the trends are weak, close to no trend and dominantly insignificant except for the southern very high latitudes, which display a larger negative trend; all longitudinal belts provide similar patterns. At lower latitudes, the pattern is clearly different. Strong negative trends occur for longitudinal belts 0–60 and 180–240° E. On the other hand, longitudinal belts 90–150 and 270–330° E reveal the same lower-latitude pattern as the higher-latitude pattern, i.e., weak or no trends.
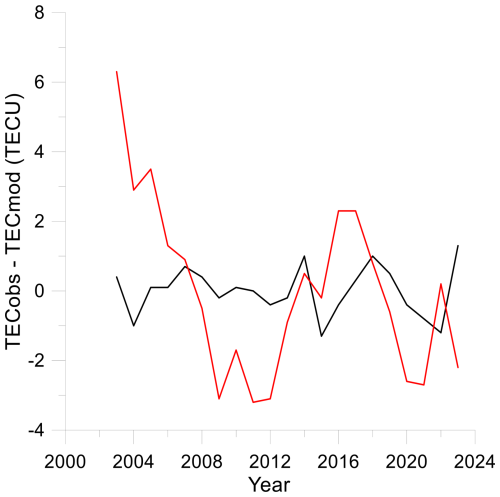
An important component of trend investigations is the statistical significance of results. The statistical significance of TEC trends is predominantly low. Trends with significance higher than 2 standard deviations (2σ) occur for all profiles at southern very high latitudes (on average 80–87.5° S). Trend profiles with large low-latitude trends are significant at the 2σ level typically between 20° N and 20° S, whereas profiles with weak trends are significant only in the vicinity of the Equator and for some profiles only. Profiles with weak low-latitude trends are mostly statistically significant at the 2σ level also at northern higher midlatitudes (typically 50–65° N). TEC trends appear to be statistically significant at southern very high latitudes (φ≥80° S); however, these latitudes suffer from a low density of data. All other parts of trend profiles reveal lower statistical significance, many of them even lower than 1σ. One reason for the low significance of the linear trend might be the change of trend during the analyzed period. To check this possibility, Fig. 4 shows the temporal evolution of TEC trends in terms of TEC residuals, ΔTEC, at 30° E for latitudes with the strongest (12.5° N) and weakest (40° N) trends. Thus, 40° N clearly reveals no change of trend, and also 12.5° N does not show an evident change in the linear trend. However, Fig. 4 displays large year-to-year variability of ΔTEC; with such a large variability, obtaining trends with sufficient statistical significance requires longer data sets for most of the trend values. In this sense, our results might be considered preliminary, except for a clear dominance of negative trends and a clear division of trends at low latitudes into four groups of strong and weak trends.

Figure 4Evolution of TEC residuals at 30° E, with latitudes of 40° N (black, no trend) and 12.5° N (red, the largest trend).
Andima et al. (2019) analyzed TEC trends for equatorial station Malindi in Kenya; our negative trend value for this region is within the range of their trend values. More positive/less negative trends of global TEC by Lean et al. (2011, 2016) are explained by the use of TEC data prior to 2002 without any correction. This data problem was unknown at the time of publication of results by Lean et al. (2011, 2016); it was detected first by Emmert et al. (2017).
As concerns model simulations of trends in TEC, our global JPL-35 TEC trend of −0.108 ± 0.024 TECU yr−1 (Table 1) calculated with F30 is somewhat higher than the trend simulated by Cnossen (2020; Table 1), which reached values between −0.060 ± 0.012 and −0.024 ± 0.008 TECU yr−1, but trends calculated with F10.7 (−0.048 ± 0.025), which was used by Cnossen (2020), are within the range of the Cnossen (2020) trend values. The global UPC TEC trend (Table 2) is at the lower end of the range of Cnossen (2020) trends. McInerney et al. (2024) used the WACCM-X model to calculate TEC trends. For March and June 1920–2010 (zonal means), they obtained negative trends of various magnitude at all latitudes. Thus, our trends in global TEC at least qualitatively agree with the trends from model simulations.
Why are low-latitude TEC trends separated into two longitudinally separated groups of strong and weak trends? The secular change of Earth's magnetic field does not seem to be responsible for the observed longitudinal structure of the low-latitude TEC trends, because it has a pronounced impact on the low-latitude ionospheric F2-region trends in the 270–330° E belt (Qian et al., 2021), where TEC trends are weak. If the TEC trends shown in global geographic coordinates are rebinned to the geomagnetic grid, this outcome will not change significantly. Another possibility could be the effect of non-migrating tides. There is a well-known effect of the DE3 non-migrating tide on the low-latitude/equatorial ionosphere, but it produces a longitudinal structure with wavenumber 4, whereas TEC trends display a longitudinal structure with the zonal wavenumber 2 at low/equatorial latitudes. This problem requires more detailed study, which is out of the scope of this paper; it will be treated in future investigations.
TEC is an important parameter for propagation and applications of GNSS/GPS signals. Despite this fact, the long-term trends in TEC have been studied only a little. Altogether, five papers have dealt with trends in observed TEC until now (Lean et al., 2011, 2016; Laštovička, 2013; Laštovička et al., 2017; Andima et al., 2019), and their results are not mutually consistent. The results of this work may be summarized as follows:
-
The TEC trends are mostly statistically insignificant at the 2σ level, even though in some latitudinal–longitudinal regions they are statistically significant. This means that only gross features, not fine details, may be considered reliable. A longer data series is required for getting a finer structure of TEC trends.
-
The optimum solar activity proxy for investigating long-term trends in TEC is F30, not F10.7, Mg II or sunspot numbers. This is consistent with F30 being the optimum solar proxy for foF2 trends (Laštovička and Buresova, 2023).
-
The long-term TEC trends are predominantly negative; all statistically significant trends are negative.
-
TEC trends reveal a clear zonal wavenumber 2 longitudinal structure in low/equatorial latitudes with strong negative trends in belts 0–60 and 180–240° E and weak trends in belts 90–150 and 270–330° E.
Future investigations will focus on the analysis of longer data series and on the search for an explanation of the longitudinal structure of TEC trends at low/equatorial latitudes.
Data used in this study are publicly available on the following websites. Solar activity indices were taken for F10.7 (observed) from https://lasp.colorado.edu/lisird/data/noaa_radio_flux/ (last access: 18 June 2024), F30 from https://solar.nro.nao.ac.jp/norp/data/daily/ (last access: 18 June 2024), Lyman-α from https://lasp.colorado.edu/data/timed_see/composite_lya/version3/ (last access: 18 June 2024), Mg II from http://www.iup.uni-bremen.de/UVSAT/Datasets/mgii (last access: 18 June 2024), sunspot numbers from https://sidc.be/silso/datafiles (last access: 18 June 2024) and He II from the SOLID project database (https://projects.pmodwrc.ch/solid-visualization/makeover/index.php?type=proxy&waveStart=215&waveEnd=215&dateStart=1970-01-01&dateEnd=2014-12-31) with the option “Proxies > Data selections > He II > Download”. Global TEC data were taken from Emmert et al. (2017), supporting information, “Data Set S1”. UPC TEC data were taken from https://cddis.nasa.gov/archive/gnss/products/ionex/2023/ (last access: 5 June 2024).
JL: conceptualization and analysis of global TEC data. JU: data mining and analysis of UPC TEC data. Both: writing of the paper.
The contact author has declared that neither of the authors has any competing interests.
Publisher’s note: Copernicus Publications remains neutral with regard to jurisdictional claims made in the text, published maps, institutional affiliations, or any other geographical representation in this paper. While Copernicus Publications makes every effort to include appropriate place names, the final responsibility lies with the authors.
This article is part of the special issue “Long-term trends in the stratosphere–mesosphere–thermosphere–ionosphere system”. It is a result of the 12th International Workshop on Long-Term Changes and Trends in the Atmosphere (TRENDS 2024), Ourense, Spain, 6–10 May 2024.
We acknowledge the work of all who contributed to the production of ionospheric and solar data used in this article. Support by the Czech Academy of Sciences via the Strategy 21 program, “Analysis of the relationship between solar-activity-induced and anthropogenic changes to the climate of the upper atmosphere”, is acknowledged.
This paper was edited by Ana G. Elias and reviewed by two anonymous referees.
Andima, G., Amabayo, E. B., Jurua, E., and Cilliers, P. J.: Modeling of GPS total electron content over the African low-latitude region using empirical orthogonal functions, Ann. Geophys., 37, 65–76, https://doi.org/10.5194/angeo-37-65-2019, 2019.
Cnossen, I.: Analysis and attribution of climate change in the upper atmosphere from 1950 to 2015 simulated by WACCM-X, J. Geophys. Res.-Space, 125, e2020JA028623, https://doi.org/10.1029/2020JA028623, 2020.
Danilov, A. D.: Seasonal and diurnal variations in foF2 trends, J. Geophys. Res.-Space, 120, 3868–3882, https://doi.org/10.1002/2014JA020971, 2015.
Danilov, A. D. and Berbeneva, N. A.: Statistical analysis of the critical frequency foF2 dependence on various solar activity indices, Adv. Space Res., 72, 2351–2361, https://doi.org/10.1016/j.asr.2023.05.012, 2023.
Danilov, A. D. and Berbeneva, N. A.: Dependence of foF2 on solar activity indices based on the data of ionospheric stations of the Northern and Southern Hemispheres, Geom. Aeron., 64, 224–234, https://doi.org/10.1134/S0016793223601035, 2024.
Emmert, J. T., Mannucci, A. J., McDonald, S. E., and Vergados, P.: Attribution of interminimum changes in global and hemispheric total electron content, J. Geophys. Res.-Space, 122, 2424–2439, https://doi.org/10.1002/2016JA023680, 2017.
Hernandez-Pajares, Juan, J. M., Sanz, J., and Sole, J. G.: Global observation of the ionospheric electronic response to solar events using ground and LEO GPS data, J. Geophys. Res.-Space, 103, 20789–20796, https://doi.org/10.1029/98JA01272, 1998.
Hernández-Pajares, M., Wielgosz, P., Paziewski, J., Krypiak-Gregorczyk, A., Krukowska, M., Stepniak, K., Kaplon, J., Hadas T., Sosnica K., Bosy J., Orus-Perez, R., Monte-Moreno E., Yang, H., Garcia-Rigo A., and Olivares-Pulido, G.: Direct MSTID mitigation in precise GPS processing, Radio Sci., 52, 321–337, https://doi.org/10.1002/2016RS006159, 2017.
Laštovička, J.: Are trends in total electron content (TEC) really positive?, J. Geophys. Res.-Space, 118, 3831–3835, https://doi.org/10.1002/jgra.50261, 2013.
Laštovička, J.: Progress in investigating long-term trends in the mesosphere, thermosphere and ionosphere, Atmos. Chem. Phys., 23, 5783–5800, https://doi.org/10.5194/acp-23-5783-2023, 2023.
Laštovička, J.: Dependence of long-term trends in foF2 at middle latitudes on different solar activity proxies, Adv. Space Res., 73, 685–689, https://doi.org/10.1016/j.asr.2023.09.047, 2024.
Laštovička, J. and Buresova, D.: Relationships between foF2 and various solar activity proxies, Space Weather, 21, e2022SW003359, https://doi.org/10.1029/2022SW003359, 2023.
Laštovička, J., Solomon, S. C., and Qian, L.: Trends in the neutral and ionized upper atmosphere, Space Sci. Revs., 168, 113–145, https://doi.org/10.1007/s11214-011-9799-3, 2012.
Laštovička, J., Urbar, J., and Kozubek, M.: Long-term trends in the total electron content (TEC), Geophys. Res. Lett., 44, 8168–8172, https://doi.org/10.1002/2017GL075063, 2017.
Lean, J., Emmert, J. T., Picone, J. M., and Meier, R. R.: Global and regional trends in ionospheric electron content, J. Geophys. Res., 116, A00H04, https://doi.org/10.1029/2010JA016378, 2011.
Lean, J. L., R. R. Meier, R. R., Picone, J. M., Sassi, F., Emmert, J. T., and Richards, P. G.: Ionospheric total electron content: Spatial patterns of variability, J. Geophys. Res.-Space, 121, 10367–10402, https://doi.org/10.1002/2016JA023210, 2016.
McInerney, J. M., Qian, L., Liu, H.-L., Solomon, S. C., and Nossal, S. M.: Climate change in the thermosphere and ionosphere from the early twentieth century to early twenty first century simulated by the Whole Atmosphere Community Climate Model-eXtended, J. Geophys. Res.-Space, 129, e2023JD039397, https://doi.org/10.1029/2023JD039397, 2024.
Qian, L., McInerney, J. M., Solomon, S. S., Liu, H., and Burns, A. G.: Climate Changes in the Upper Atmosphere: Contributions by the Changing Greenhouse Gas Concentrations and Earth's Magnetic Field From the 1960s to 2010s, J. Geophys. Res.-Space, 126, e2020JA029067, https://doi.org/10.1029/2020JA029067, 2021.
Rishbeth, H. and Roble, R. G.: Cooling of the upper atmosphere by enhanced greenhouse gases – modeling of thermospheric and ionospheric effects, Planet. Space Sci., 40, 1011–1026, 1992.
Zossi, Z. S., Medina, F. D., Tan Jun, G., Laštovička, J., Duran, T., Fagre, M., de Haro Barbas, B. F., and Elias, A. G.: Extending the analysis on the best solar activity proxy for long-term ionospheric investigations, Proc. Roy. Soc. A, 479, 20230225, https://doi.org/10.1098/rspa.2023.0225, 2023.


