the Creative Commons Attribution 4.0 License.
the Creative Commons Attribution 4.0 License.
Investigation of the October effect in very low-frequency (VLF) signals
Marc Hansen
Daniela Banyś
Mark Clilverd
David Wenzel
Tero Raita
Mohammed Mainul Hoque
Subionospheric very low-frequency (VLF) radio signals are reflected by free electrons in the ionospheric D-region at about 60–90 km altitude and can propagate over long distances, which makes them useful for monitoring the state of the D-region or perturbations due to solar flares. At the D-region height, the ionosphere is mainly ionized by solar Lyman-α radiation. The reflection characteristics of VLF signals depend on the state and dynamics of the D-region, which is highly influenced by Lyman-α radiation. Although the amplitude of the received terrestrial VLF signal changes as a function of solar zenith angle over the course of the year, the VLF amplitude shows a distinctive sharp decrease around October, which is hence called the “October effect”. This study investigates the occurrence of the October effect and its dependencies on latitude and longitude. We developed a method to detect the occurrence of the October effect in the long-term VLF data and derive key parameters characterizing (start and end date, intensity) the sudden decrease in the signal amplitude. This investigation using a network of VLF stations distributed over low-, middle-, and high-latitude regions shows that the occurrence of the October effect has a clear latitudinal dependency, occurring earlier in high-latitude regions than at midlatitudes. No low-latitude signature is found.
- Article
(2094 KB) - Full-text XML
-
Supplement
(632 KB) - BibTeX
- EndNote
The ionosphere consists of several regions, of which the so-called D-region is the least ionized but the most complex in terms of composition and a very dynamic layer. The D-region forms due to ionization by solar radiation (Nicolet and Aikin, 1960) at heights from about 60–90 km. The Lyman-α radiation photo-ionizes nitric oxide, and galactic cosmic rays ionize all the other the neutral constituents. As a result, during the day the D-region is at a height of about 70 km and during the night at 85 km (Thomson, et al., 2017). This dependency on the Lyman-α radiation is also visible in the comparison between times of high and low solar activity, as a reduction in the solar activity leads to a decreased electron density and therefore a weaker noon very low-frequency (VLF) amplitude (Thomson and Clilverd, 2000; Correia et al., 2011). In turn, an increase in solar activity leads to an increase in electron density (Singer et al., 2011). However, at higher latitudes galactic cosmic rays become more significant for the ionization as the solar zenith angle (SZA) increases (Thomson. et al., 2017).
Subionospheric VLF signals propagate through the Earth–ionosphere waveguide (Barr, 1971; Davies, 1990), with its upper boundary given by the D-region. The wave propagation is controlled by the index of refraction of the ionospheric medium and thus controlled by the D-region electron density and the collision frequency of the electrons with the predominant neutral constituents (i.e., N2 and O2; Hartree, 1931).
The annual variation of the noontime D-region electron density shows a gradual increase in the first half of the year until it reaches a plateau in summer. In October a strong decrease is observed and the electron density reaches a low level in winter (Renkwitz et al., 2023). These changes in the D-region electron number density also affect VLF propagation. During solar flare events (McRae and Thomson, 2004) and geomagnetic storms (Nwankwo et al., 2022) rapid temporal changes may occur in the D-region electron density and vertical structure (and thus collision frequency with neutral constituents), which influences VLF propagation.
Seen approximately from the middle of the year, the SZA at noon shows a symmetrical course over the year, and therefore the seasonal VLF signal amplitude behavior at noon would also be expected to be symmetrical. Recently, Macotela et al. (2021) found an asymmetry in the VLF signal amplitude noon curve, which is referred to as the fall effect. The VLF signal amplitude does not mirror the variation of the SZA and tends to remain at midsummer levels or increase somewhat before experiencing a strong and sudden decrease around October. This decrease in October has also been reported by Banyś (2017). We investigate the strong and sudden decrease at the beginning of October, which we refer to as the October effect. The term “October effect” was first used by Pancheva and Mukhtarov (1996) for the sharp transition of the electron density profile in the lower D-region in autumn, which in turn affects VLF propagation. In addition to that, recently Wendt et al. (2024) found that there is no October effect at night.
The October effect is shown in Fig. 1 for three propagation paths at different latitudes together with the solar elevation angle (SEA) observed at the mid-reflection point (MRP). The SEA is the opposite angle of the SZA. Figure 1a shows the location of the propagation paths and their corresponding transmitter (Tx), receiver (Rx), and MRP (black dot). Figure 1b shows the VLF composite signal amplitude at noon for the propagation path NAA–SOD (MRP at 64° N), with an early and strong October effect (marked by vertical broken lines), and Fig. 1c shows NAA–ESK (MRP at 54° N) with a later October effect. Additionally, Fig. 1b shows a decrease in VLF amplitude prior to the October effect. Finally, Fig. 1d shows the VLF amplitude for the propagation path from NAU–STJ (MRP at 33° N), and it shows no October effect. The VLF amplitude follows the overall trend of the SEA.
The investigation of the October effect's dependencies will help to better understand the course of the VLF signal amplitude fluctuations. As pointed out in Banyś (2017), considering the background VLF signal amplitude is crucial to correlate the VLF signal response to the strength of a solar flare. In order to identify the physical origin of the October effect, we attempt to quantify its characteristics and determine its variation with geographic latitude and longitude. The paper is structured as follows: first, the data sources and propagation paths used are presented in Sect. 2. Then, the method for determining the parameters of the October effect is introduced in Sect. 3. With that, we obtain clear results in Sect. 4 for determining the dependency of the October effect on latitude on longitude. The results are then discussed in Sect. 5, and our conclusions are summarized in Sect. 6.
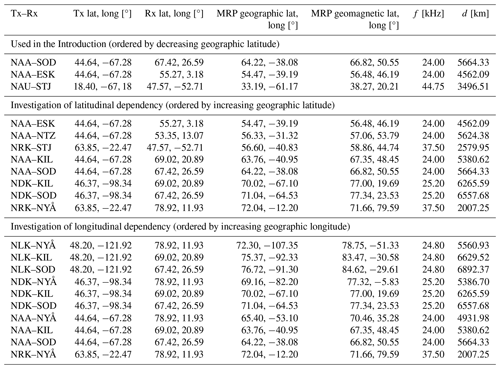
The data used in this study are made available by the Antarctic–Arctic Radiation-Belt (Dynamic) Deposition – VLF Atmospheric Research Konsortia (AARDDVARK) (Clilverd et al., 2009) network by the British Antarctic Survey (BAS) and the DLR's Global Ionospheric Flare Detection System (GIFDS) (Wenzel et al., 2016) network. The available datasets include either 1 or 10 Hz relative measurements of the signal amplitude and phase, depending on the receivable transmitters and receiver types used. The receiver stations of the AARDVARK network are mainly located at high latitudes, while GIFDS receiver stations are located at midlatitudes. For a detailed description of the technical background of GIFDS we refer to Banyś (2017). This work focuses on the analysis of the amplitude data. The transmitter (Tx)–receiver (Rx) combinations used and their corresponding frequencies, locations of Tx–Rx, and MRP are shown in Table 1.
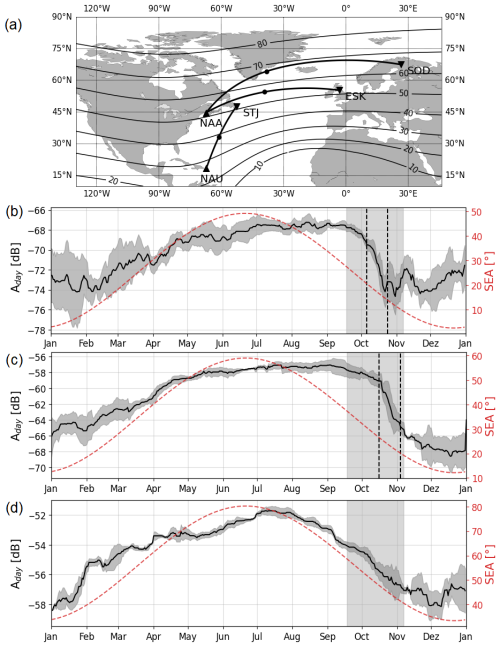
Figure 1Map of great circle propagation paths used in (a). Tx (triangle up), MRP (dot), Rx (triangle down). Aday (black) ±σ (gray) with the SEA (red) for three exemplary VLF links: (b) NAA–SOD, (c) NAA–ESK, and (d) NAU–STJ. Aday represents composites of different years due to different data availability: for NAU–STJ in 2014, 2016, and 2019; for NAA–ESK in 2016–2019, and for NAA–SOD in 2013, 2015–2016, and 2021. The relevant time period for the October effect is in light gray. The determined tstart and tend of Aday are shown as dashed vertical black lines in (b) and (c). Aday in (d) shows no October effect.
The propagation paths used are illustrated on their corresponding maps. The following VLF receiver station data are used in the analysis, and their abbreviations are given in parentheses: Eskdalemuir (ESK), Neustrelitz (NTZ), St. Johns (STJ), Kilpisjärvi (KIL), Sodankylä (SOD), and Ny-Ålesund (NYÅ). The transmitters are represented by their call signs. The propagation paths used are mainly over North America and the Atlantic. The signals originate mainly from US transmitter stations and are received in Europe. The Tx–Rx combinations used are chosen due to their comparability in latitude and longitude and availability of continuous measurements over a long time period. Furthermore, only years of propagation paths without huge data gaps or jumps in the amplitude signal level are considered, as these jumps could indicate a change of receiver hardware.
Data processing is crucial to derive meaningful conclusions. Since the measurements are relative and each receiver station is unique, it is challenging to formulate a general approach to the data and to make comparisons between the propagation paths. Therefore, we propose a detection method based on the derivatives, and therefore the data do not require further preprocessing. If comparable composites of data are required, a recent work by Schneider et al. (2024) provides a clear overview. In Fig. 2, we have considered the propagation path of NAA–NYÅ in 2021 and we describe the process of obtaining the key parameters of the October effect: the start date tstart, the end date tend, the date of maximum amplitude decrease tmax, and the intensity mOct of the October effect. First, we computed the median of VLF amplitude A for every 10 min interval for 1 entire year separately for each propagation path from the raw VLF amplitude measurements (see Fig. 2a). In the next step we define the local noontime as the time of the maximum SZA at the MRP of the propagation path. At this local noontime we set a time window of ±1 h to derive the median VLF amplitude noon curve Aday(t) from A(t) as a rolling median of 21 d. Palit et al. (2018) showed that short X-ray bursts also have just a very short effect on VLF modulation. Furthermore, Palit et al. (2018) also noted that during local noon the VLF modulation (due to a change in electron density as a result of X-ray burst) is small because the relative change is smaller. As we observe the October effect only during noon, the influences of such VLF modulations are further minimized. Other short-timed events like lightning or early/fast VLF events are very rapid events with short signal recovery times from 10 to 100 s (Haldoupis et al., 2006). Longer-lived events like solar flares also have a longer impact on VLF propagation (Banyś, 2017), which could significantly change Aday(t) on one day. During geomagnetic storms the VLF amplitude may be decreased for a couple of days (Nwankwo et al., 2022), which would also significantly change Aday(t) for these days. All these influences should be mitigated by the long 21 d rolling median to derive the overall noon curve. Altogether, the method ensures that effects of ionospheric perturbations on the VLF amplitude are minimized and can be considered negligible in our analysis.
From Aday(t) the first derivative and the second derivative are calculated (see Fig. 2c and d). We use the minimum and maximum in to define the start tstart and the end tend of the October effect (see the red points in Fig. 2b). Additionally, the time of the maximum decrease in the October effect tmax is found by getting the zero crossing . tmax also marks the point of the lowest gradient in Aday and is the local minimum in . From tstart and tend the duration of the October effect is easily computed by . To obtain a quantity of the intensity of the October effect the slope of Aday is used. The most northern propagation paths may not be completely in daylight during the winter, which leads to an uncertainty in finding tend. Therefore, the slope is calculated from tstart to tmax, and thus the intensity of the October effect is derived by .
Missing data and data within noise level may lead to false interpretation; for example, the regular vertical dark blue stripes in the daytime are from maintenance downtimes of the NAA transmitter. Therefore, is smoothed by a Gaussian filter. The method we use to calculate A and Aday considers NaNs in the data to be missing data and the median then gets calculated from fewer data points or is considered a NaN when there are no data points. Adding to that, we formulate certain criteria for the determination of the October effect.
tstart and tend need to lie in the same minimum in (see Fig. 2c). If this is not the case, the algorithm searches for the next set of tstart and tend by limiting the time window of the search.
No huge spikes ( dB d−1 avoid receiver stations where a hardware change has occurred. This would be visible due to a change in the overall level of Anoon.
at tstart and tend needs to be bigger than 0.005 dB d−2, as seen as a dotted horizontal line in Fig. 2d. This is to ensure that a significant decrease happens around October, and thus the October effect occurs.
Δt must be longer than 7 d to consider outages in the transmitter, which could be identified as sharp decreases.
Between tstart and tend there need to be more days with data points than .
The algorithm searches in a time window from 5 September to 15 November. tstart and tend should differ from these limits.
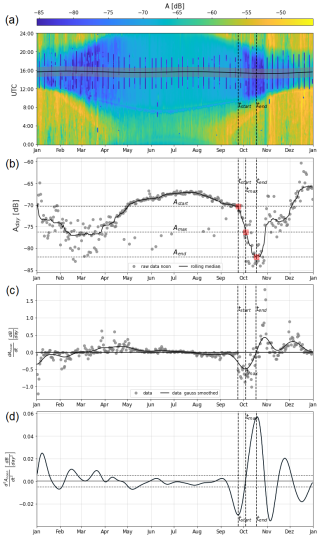
Figure 2Steps for deriving tstart, tmax, and tend of the October effect: (a) smoothed VLF amplitude over the year for each day with a time window (shaded) at local noon. (b) Deduced noon curve Aday (solid) with tstart, tmax, and tend (dashed) and associated values Astart, Amax, and Aend (dotted). (c) First derivative and (d) second derivative defining tstart, tmax, and tend if the threshold (dotted) is exceeded.
Next, we investigate how the October effect varies from year to year and with longitude and latitude. For this purpose, a careful selection of Tx–Rx pairs is necessary. For studying the variation of the October effect with longitude, propagation paths with the same latitude related to their MRP are selected. Likewise, propagation paths with the same longitude related to their MRP are selected for investigating the latitudinal dependency.
4.1 Year-to-year variability
First, the year-to-year variation is investigated and the results are shown in Fig. 3. To distinguish the different propagation paths, they are color-coded according to the latitude or longitude of the mid-reflection point. This is shown in Fig. 3a and e. The variation of tstart is shown in Fig. 4b and f, tend is shown in Fig. 3c and g, and the intensity mOct is shown in Fig. 3d and h. Comparing the different propagation paths over time, a clear trend in tstart, tend, or mOct of the October effect is not visible, but there is a significant variation over the years. This points to a highly variable D-region, which is driven by both variations in ionization and dynamics of the neutral atmosphere. From the color-coded tstart in Fig. 3b and f and tend in Fig. 3c and g of the October effect, a possible latitudinal and longitudinal dependency is visible, as the October effect occurs earlier at higher latitudes and more easterly longitudes – over the limited longitudinal range studied. This is investigated further in the next subsection.
4.2 Latitudinal dependency
To investigate the latitudinal dependence of the October effect, eight propagation paths (NAA–SOD/KIL/ESK/NTZ, NRK–STJ/ NYÅ, NDK–SOD/KIL) are used, as their MRPs are around 40° W. From tstart in Fig. 4b it is evident that the October effect occurs earlier at higher latitudes. Likewise, from the variation of tend in Fig. 4b we see that the October effect also ends earlier with increasing latitude. Interestingly, the duration Δt stays constant. The intensity mOct in Fig. 4c shows a wider spread at higher latitudes, which could point to less solar forcing of the October effect and therefore its dependency on the dynamics of the atmosphere.
It is important to point out that in Fig. 4a to c two additional propagation paths (NDK–SOD/KIL) are shown. For these paths the October effect occurs even earlier in the year, which suggests that not only the higher latitude but also being in the American sector could be relevant. This is further supported by the additionally shown propagation path NRK–NYÅ. The MRP for this propagation path has about the same latitude (∼70° N) as NDK–SOD/KIL, but the October effect occurs later. This could be attributed to the more eastern longitude.
Considering the geomagnetic latitude, which is shown in Fig. 5b, a linear trend in the latitudinal dependency is visible. Also, tstart and tend of NRK–NYÅ now align with the overall trend. The geomagnetic latitude of its MRP is about 71.6° N, while NDK–SOD/KIL is about 77.6° N in geomagnetic latitude.
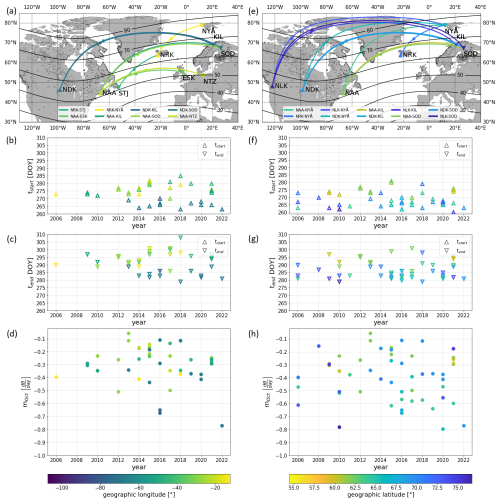
Figure 3Yearly variations of the October effect: panels (a) and (e) show maps with the propagation paths used. On the left (a–d) is the yearly variation of the latitudinal dependency investigation color-coded in latitude, and on the right (e–h) are the propagation paths for the longitudinal dependency investigation color-coded in longitude. Panels (b) and (f) show tstart, panels (c) and (g) tend, and panels (d) and (h) the intensity mOct of the October effect.
4.3 Longitudinal dependency
To investigate the longitudinal dependency 10 propagation paths (NLK–SOD/KIL/NYÅ, NDK–SOD/KIL/NYÅ, NAA–SOD/KIL/NYÅ, and NRK–NYÅ) are selected. While their MRPs are all at comparable latitudes of about 65 to 75° N, they differ greatly in longitude from 110 to 10° W. Figure 4d shows the great circle paths and their corresponding MRPs, marked with dots in the same line color. It should also be noted that although these propagation paths have different ranges, we considered them all to be long propagation paths.
In Fig. 4e and f the results for tstart, tend, and mOct are shown. In the American sector the October effect occurs earlier and also ends earlier. Again, the duration Δt stays about the same. Also, the intensity mOct does not vary with longitude; rather, it is scattered over a wide range of values. This is in contrast to the latitudinal dependency of mOct.
It is important to point out that the latitude, which also has an effect on tstart and tend, is slightly different for these propagation paths, but these are the best paths to compare in longitude, as the possibilities are very limited. Adding to this point, it should be considered that these propagation paths span a wide range of longitudes and therefore the longitudinal dependency might be smeared out over these long paths. Unfortunately, there are no paths that run meridional at different longitudes, as these would possibly be best for such a comparison. This is in contrast to the investigation of the latitudinal dependency, as the propagation paths used there have a more zonal propagation direction.
Another point is that the most eastern propagation path from NRK–NYÅ differs from the general trend of tstart and tend. One reason for this might be that the propagation path is much shorter and that the transmitter NRK has a higher frequency of 37.5 kHz, thus being in the low frequency (LF), because the VLF range is defined as the frequency range of 3–30 kHz. But as NRK–NYÅ aligns well in linear trend the geomagnetic latitudinal dependency (see Fig. 5d), the higher frequency, and the shorter propagation path do not seem to be a main influence here.
It should be noted that the most westward propagation path NLK–NYÅ also does not follow the general trend and the October effect occurs later in the year. This “S-shaped” behavior of the longitudinal dependency of the October effect suggests a connection to the distance from the auroral oval, as the shape and extension of the auroral oval differ at different longitudes. Here the direct comparison to the geomagnetic longitude shows no significant change in the overall trend and the S-shaped behavior is still visible, as can be seen in Fig. 5d.
VLF signal amplitude measurements conducted by the AARDDVARK and GIFDS networks from the years 2006 to 2022 for different propagation paths (see Table 1) show a distinct sudden sharp decrease in the VLF noon amplitude Aday (see Fig. 1) around October. This sudden decrease is called the October effect and does not have a satisfactory explanation yet. The variation of Aday in Fig. 1 would be expected to follow the overall symmetrical course of the SZA over the year, as the F10.7 irradiance from the Sun is the main driver of the electron density in the ionospheric D-region.
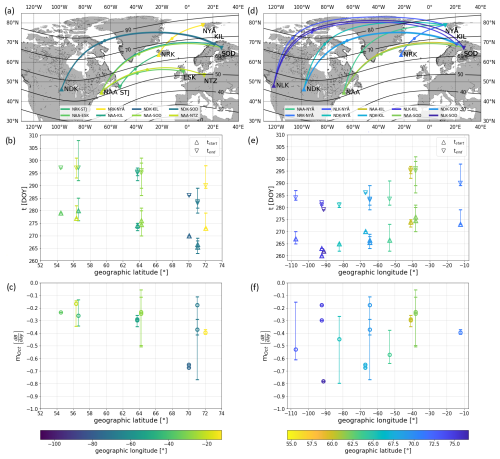
Figure 4Latitudinal and longitudinal dependency of the October effect: panels (a) and (d) show maps with the propagation paths used. On the left (a–c) is the latitudinal dependency color-coded in longitude and on the right (d–f) the longitudinal dependency color-coded in latitude. Panels (b) and (e) show the tstart (triangle up) and tend (triangle down) of the October effect. The triangles are at the median and the lines show the spread of the values. Panels (c) and (f) show the intensity mOct of the October effect.
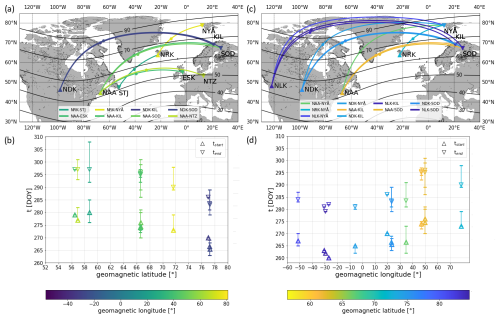
Figure 5Dependency of the October effect on geomagnetic latitude and longitude: panels (a) and (c) show maps with the propagation paths used. On the left (a–b) is the geomagnetic latitudinal dependency color-coded in geomagnetic longitude and on the right (c–d) the geomagnetic longitudinal dependency color-coded in geomagnetic latitude. Panels (b) and (d) show the tstart (triangle up) and tend (triangle down) of the October effect. The triangles are at the median and the lines show the spread of the values.
In this study we presented a method (Sect. 3, Fig. 2) to detect the October effect in the seasonal variation of the VLF amplitude Aday. With this method we quantified the start tstart, the end tend, the intensity mOct, and the duration Δt of the October effect. A strong yearly variation in tstart and tend is visible in Fig. 3b, c, f, and g. This yearly variation shows a latitudinal and longitudinal dependency of tstart and tend. The results presented here suggest two cases for further investigation: one with propagation paths, where the MRP is at a similar longitude range to isolate the latitudinal dependency, and another case where the MRP is at a similar latitudinal range to investigate the longitudinal dependency.
A challenge in detecting the October effect is the determination of tend, as the VLF amplitude in winter begins to rise again and also shows a stronger variation in some propagation paths. Therefore, the end point is not always clearly determined, especially a high latitudes where parts of the propagation paths do not lie in daylight during winter. This also has an effect on the determination of the duration Δt of the October effect. For the future we also plan to investigate the October effect in the Southern Hemisphere, although even fewer data are available for this.
We also investigated the dependency of the October effect on the solar activity, but we did not identify conclusive results. As we hypothesize that the October effect is connected to the dynamics of the neutral atmosphere, more solar forcing of the D-region should result in a weaker October effect. As an example of this solar forcing Clilverd et al. (2006) showed that the ionospheric effective height is lowered during solar proton events (SPEs), which occur when the Sun is active. The weaker October effect is sometimes visible in Aday, where the sudden decrease in Aday is more gradual than usual. Also, a wider spread of mOct was observed during times with lower solar activity for some propagation paths than at times with high solar activity. Additionally, Wendt et al. (2024) found an increase in neutral atmospheric temperature during the October effect, which supports the connection between the October effect and the dynamics of the neutral atmosphere. This will be a topic for our ongoing work.
From the results in Figs. 4 and 5, it can be concluded that the October effect is dependent on the latitude and also shows systematic variations over a limited range of longitude. It occurs earlier at higher latitudes and the spread of the intensity of the October effect (mOct) is also larger in that region. Additionally, it occurs earlier in the American sector than the European sector. The longitudinal dependency of tstart and tend of the October effect shows a distinct “S-shaped” behavior. This S-shaped behavior points strongly to an association with the distance from the auroral oval. When tstart and tend are considered in the terms of the magnetic latitude and longitude, a clear linear dependency on geomagnetic latitude is visible, while the S-shaped behavior of the longitudinal dependency continues to be visible in the geomagnetic longitude. Adding to that, as the spread of the intensity mOct is larger at higher latitudes, where less solar forcing occurs, the neutral atmosphere and its dynamic nature appear to be the main driver of the October effect. Summarizing our conclusion, the October effect is dependent on latitude, as the October effect occurs earlier at higher latitudes, and the spread of the intensity of the October effect (mOct) is also larger, and longitude, as the October effect occurs earlier in the American sector than in the European sector.
These behaviors are even clearer if tstart and tend are compared in terms of geomagnetic latitude and longitude instead of geographic latitude and longitude.
The AARDDVARK VLF data used can be accessed at https://psddb.nerc-bas.ac.uk/data/access/coverage.php?menu=4,7&bc=1&source=1&class=284,37,140,255,243,3,110,232,141,30,279&type=ULTRA (Clilverd and Raita, 2023). GIFDS VLF data can be provided by the corresponding authors upon request. The GIFDS data used here are made available as a Supplement to this publication.
The supplement related to this article is available online at: https://doi.org/10.5194/angeo-43-55-2025-supplement.
MH performed the systematic analysis of the VLF measurements, the investigation of the dependencies, and the visualization of the results. DB, MC, and DW provided supervision. MH and DB wrote the manuscript draft. MC, MMH, and DB reviewed and edited the manuscript.
The contact author has declared that none of the authors has any competing interests.
Publisher’s note: Copernicus Publications remains neutral with regard to jurisdictional claims made in the text, published maps, institutional affiliations, or any other geographical representation in this paper. While Copernicus Publications makes every effort to include appropriate place names, the final responsibility lies with the authors.
This work is supported by “AMELIE – Analysis of the MEsosphere and Lower Ionosphere fall Effect” (DLR project D/921/67286532). We thank all members of the AARDDVARK network, the UK Polar Data Centre (PDC), the Natural Environment Research Council (NERC), and the British Antarctic Survey (BAS) for providing the data throughout and for their willingness to share them publicly. We also thank the Sodankylä Geophysical Observatory (University of Oulu) for operating and sharing the data for SOD and KIL UltraMSK receivers.
This research has been supported by the Deutsches Zentrum für Luft- und Raumfahrt (grant no. D/921/67286532).
The article processing charges for this open-access publication were covered by the German Aerospace Center (DLR).
This paper was edited by Dalia Buresova and reviewed by Emilia Correia, Igo Paulino, and three anonymous referees.
Barr, R.: The propagation of ELF and VLF radio waves beneath an inhomogeneous anisotropic ionosphere, J. Atmos. Terr. Phys., 33, 343–353, https://doi.org/10.1016/0021-9169(71)90139-5, 1971.
Banyś, D.: Propagation of LF and VLF waves and their use for monitoring space weather events, PhD thesis, Christian-Albrechts University Kiel, https://macau.uni-kiel.de/receive/diss_mods_00026241 (last access: 2 December 2020), 2017.
Clilverd, M. and Raita, T.: AARDDVARK VLF ULTRA data, British Antarctic Survey – UK Polar Data Centre, https://psddb.nerc-bas.ac.uk/data/access/coverage.php?menu=4,7&bc=1&source=1&class=284,37,140,255,243,3,110,232,141,30,279&type=ULTRA, last access: 30 March 2023.
Clilverd, M. A., Seppälä, A., Rodger, C. J., Thomson, N. R., Verronen, P. T., Turunen, E., Ulich, T., Lichtenberger, J., and Steinbach, P.: Modeling polar ionospheric effects during the October–November 2003 solar proton events, Radio Sci., 41, RS2001, https://doi.org/10.1029/2005RS003290, 2006.
Clilverd, M. A, Rodger, C. J., Thomson, N. R, Brundell, J. B., Ulich, T., Lichtenberger, J., Cobbett, N., Collier, A. B., Menk, F. W., Seppälä, A., Verronen, P. T., and Turunen, E.: Remote sensing space weather events: Antarctic-Arctic Radiation-belt (Dynamic) Deposition-VLF Atmospheric Research Konsortium network, Space Weather, 7, S04001, https://doi.org/10.1029/2008SW000412, 2009.
Correia, E., Kaufmann, P., Raulin, J.-P., Bertoni, F., and Gavilan, H.R.: Analysis of daytime ionosphere behavior between 2004 and 2008 in Antarctica, J. Atmos. Sol.-Terr. Phy., 73, 2272–2278, https://doi.org/10.1016/j.jastp.2011.06.008, 2011.
Davies, K.: Ionospheric Radio, The Institution of Engineering and Technology, 2008 reprint edition, Institution of Engineering & Technology, ISBN 978-0-86341-186-1, 1990.
Hartree, D.: The Propagation of Electromagnetic Waves in a Refracting Medium in a Magnetic Field, Mathematical Proceedings of the Cambridge Philosophical Society, 27, 143–162, https://doi.org/10.1017/S0305004100009440, 1931.
Haldoupis, C., Steiner, R. J., Mika, Á., Shalimov, S., Marshall, R. A., Inan, U. S., Bösinger, T., and Neubert, T.: “Early/slow” events: A new category of VLF perturbations observed in relation with sprites, J. Geophys. Res., 111, A11321, https://doi.org/10.1029/2006JA011960, 2006.
Macotela, E. L., Clilverd, M., Renkwitz, T., Chau, J., Manninen, J., and Banyś, D.: Spring-fall asymmetry in VLF amplitudes recorded in the North Atlantic region: The fall-effect, Geophys. Res. Lett., 48, e2021GL094581, https://doi.org/10.1029/2021GL094581, 2021.
McRae, W. M. and Thomson, N. R.: Solar flare induced ionospheric D-region enhancements from VLF phase and amplitude observations, J. Atmos. Sol.-Terr. Phy., 66, 77–87, https://doi.org/10.1016/j.jastp.2003.09.009, 2004.
Nwankwo, V. U. J., Denig, W., Chakrabarti, S. K., Ogunmodimu, O., Ajakaiye, M. P., Fatokun, J. O., Anekwe, P. I., Obisesan, O. E., Oyanameh, O. E., and Fatoye, O. V.: Diagnostic study of geomagnetic storm-induced ionospheric changes over very low-frequency signal propagation paths in the mid-latitude D region, Ann. Geophys., 40, 433–461, https://doi.org/10.5194/angeo-40-433-2022, 2022.
Nicolet, M. and Aikin, A. C.: The formation of the D region of the ionosphere, J. Geophys. Res., 65, 1469–1483, https://doi.org/10.1029/JZ065i005p01469, 1960.
Palit, S., Raulin, J.-P., and Szpigel, S.: Response of Earth's upper atmosphere and VLF propagation to celestial X-ray ionization: Investigation with Monte Carlo simulation and long wave propagation capability code, J. Geophys. Res.-Space, 123, 10224–10238, https://doi.org/10.1029/2018JA025992, 2018.
Pancheva, D. and Mukhtarov, P. Y.: Modelling of the electron density height profiles in the mid-latitude ionospheric D-region, Ann. Geophys., 39, https://doi.org/10.4401/ag-4021, 1996.
Schneider, H., Wendt, V., Banys, D., Clilverd, M., and Raita, T.: Processing of VLF amplitude measurements: Deduction of a quiet time seasonal variation, Radio Sci., 59, e2023RS007834, https://doi.org/10.1029/2023RS007834, 2024.
Renkwitz, T., Sivakandan, M., Jaen, J., and Singer, W.: Ground-based noontime D-region electron density climatology over northern Norway, Atmos. Chem. Phys., 23, 10823–10834, https://doi.org/10.5194/acp-23-10823-2023, 2023.
Thomson, N. R. and Clilverd, M. A.: Solar cycle changes in daytime VLF subionospheric attenuation, J. Atmos. Sol.-Terr. Phy., 62, 601–608, https://doi.org/10.1016/S1364-6826(00)00026-2, 2000.
Thomson, N. R., Clilverd, M. A., and Rodger, C. J.: Midlatitude ionospheric D region: Height, sharpness, and solar zenith angle, J. Geophys. Res.-Space, 122, 8933–8946, https://doi.org/10.1002/2017JA024455, 2017.
Wendt, V., Schneider, H., Banyś, D., Hansen, M., Clilverd, M. A., and Raita, T.: Why does the October effect not occur at night?, Geophys. Res. Lett., 51, e2023GL107445, https://doi.org/10.1029/2023GL107445, 2024.
Wenzel, D., Jakowski, N., Berdermann, J., Mayer, C., Valladares, C., and Heber. B.: Global ionospheric are detection system (GIFDS), J. Atmos. Sol.-Terr. Phy., 138–139, 233–242, https://doi.org/10.1016/j.jastp.2015.12.011, 2016.


