the Creative Commons Attribution 4.0 License.
the Creative Commons Attribution 4.0 License.
 | 10 Jul 2025
Distinct ionospheric long-term trends in Antarctica due to the Weddell Sea Anomaly
Marayén Canales
Trinidad Duran
Manuel Bravo
Andriy Zalizovski
Alberto Foppiano
The Weddell Sea Anomaly (WSA), a summer ionospheric anomaly over the eastern Antarctic Peninsula, was first observed in 1958 and is characterized by a nighttime peak in electron concentration instead of a the typical daytime peak. There are some works that examine long-term trends at ionospheric stations in the WSA region, but they do not do a seasonal and diurnal analysis that is vital for differentiating the periods of the anomaly. This study investigates the seasonal and diurnal variation in the long-term trend in the F2-layer critical frequency (foF2) at ionospheric stations located within the WSA region: Vernadsky (Argentine Island; 65.1° S, 64.2° W) and Port Stanley (51.6° S, 57.9° W), both with long-term foF2 data. Data from Vernadsky (1960–2023) and Port Stanley (1960–2019) were analyzed alongside data from Syowa (69.0° S; 39.6° E) and Mawson (67.6° S, 62.9° E), two stations outside the WSA influence. The analysis reveals distinct seasonal and diurnal trends. For Vernadsky, negative foF2 trends (−0.02 MHz yr−1) are observed during summer nights, coinciding with the WSA's presence. Port Stanley shows similar trends but with a secondary nighttime maximum. The WSA's influence on Vernadsky is more pronounced, with Port Stanley exhibiting a weaker mid-latitude summer evening anomaly. In contrast, Syowa and Mawson show different trends, with Syowa not having a clear trend pattern, and Mawson showing negative trends throughout the year. The study concludes that the WSA significantly affects Vernadsky and, to a lesser extent, Port Stanley. The findings highlight regional variations in ionospheric behavior and contribute to the ongoing discussion on global ionospheric trends, suggesting that local phenomena like the WSA can modulate these trends.
- Article
(3272 KB) - Full-text XML
- BibTeX
- EndNote


The Weddell Sea Anomaly (WSA) is a summer abnormality in the ionosphere over the eastern Antarctic Peninsula, characterized by maximum electron concentration occurring during nighttime hours instead of the typical daytime peak. The anomaly was first observed by Bellchambers and Piggott (1958) at the Halley Bay ionosonde (75.5° S, 26.6° W) in Antarctica, located along the coast of the Weddell Sea. More recently, total electron concentration (TEC) determined from satellite measurements has shown this anomaly over the geographical region of 55 to 75° S and 80 to 30° W (Zakharenkova et al., 2017).
We used two ionosondes located in the WSA region with foF2 (F2-layer critical frequency) data records extensive enough to analyze long-term trends linked to the anthropogenic activity: Argentine Island, also called Vernadsky (65.1° S, 64.2° W), and Port Stanley (51.6° S, 57.9° W), located on the northern edge of the WSA. These trends have been of interest since a pioneering study in 1989 suggesting that the long-term increase in greenhouse gas concentration due to anthropogenic activity, particularly carbon dioxide, would produce a global cooling in the upper atmosphere in conjunction with the global warming in the troposphere (Roble and Dickinson, 1989; Rishbeth, 1990). Since then, long-term changes in the upper atmosphere, and particularly in the ionosphere, have become a significant topic in global change research, with many results already published, as can be appreciated in the review works by Laštovička and different co-authors (Laštovička et al., 2012, 2014; Laštovička, 2017, 2021a). Among these studies, we highlight those including the analysis of ionospheric stations located within the WSA region.
The first study reporting trends at Port Stanley is that by Upadhyay and Mahajan (1998). Considering the period from 1957–1990 and noon-time hours, they obtained an hmF2 (peak height of the F2 layer) trend of −0.33 km yr−1 and a foF2 trend of −0.004 MHz yr−1. A year later, Jarvis et al. (1998) analyzed hmF2 at Argentine Island and Port Stanley along the period from 1957–1995. The trends obtained in this work, which are mostly negative, vary with month and time of day at both sites. They interpreted these results as either a constant decrease in altitude combined with a decreasing thermospheric wind effect or a constant decrease in altitude which is altitude-dependent. Both interpretations left inconsistencies when the results from the two sites were compared at that time, but the estimated long-term hmF2 decrease along the period considered was of a similar order of magnitude to that which had been predicted to result in the thermosphere from anthropogenic greenhouse gas increase. There is no mention of the WSA, but this is expected since the anomaly is seen in foF2 daily variation and not in hmF2. It is worth mentioning that Alfonsi et al. (2001) tried to analyze the Halley Bay trend, but after detecting errors in foF2 data series in the period from 1957–1990, it was discarded from the study.
Some of these stations were included in later studies, such as Bremer et al. (2012), which conducted a global analysis considering the Damboldt and Suessman database (Damboldt and Suessman, 2012), which covers the period up to ∼ 2009, but again, no distinction was made about any anomalies and no markedly regional dependencies in trend values were found.
In the present study, the diurnal and seasonal variation in the foF2 long-term trend is analyzed for stations within the Weddell Sea Anomaly region to contribute to the still controversial ionospheric trend topic and the detection and attribution of their forcings.
The extensive dataset of monthly median foF2 from the Vernadsky ionospheric station, covering the period from 1996 to 2023, was built by including data spanning from 1960 to 1995 sourced from the database made available by Damboldt and Suessmann (2012) via the Australian Space Weather Forecasting Centre (https://www.sws.bom.gov.au, last access: 4 November 2024). The Vernadsky Academician's station is a Ukrainian research station in Antarctica located at Marina Point on Galindez Island in the Argentine Island group of the Wilhelm Archipelago (see Fig. 1). It was previously the Faraday Base (or F Base) of the United Kingdom, which transferred it to Ukraine in 1996.
The Port Stanley dataset covering 1960 to October 2006 was obtained from the database made available by Damboldt and Suessmann (2012), but it was supplemented with digisonde data from the Digital Ionogram Data Base (DIDBase, https://giro.uml.edu, last access: 4 November 2024), extending it until February 2019.
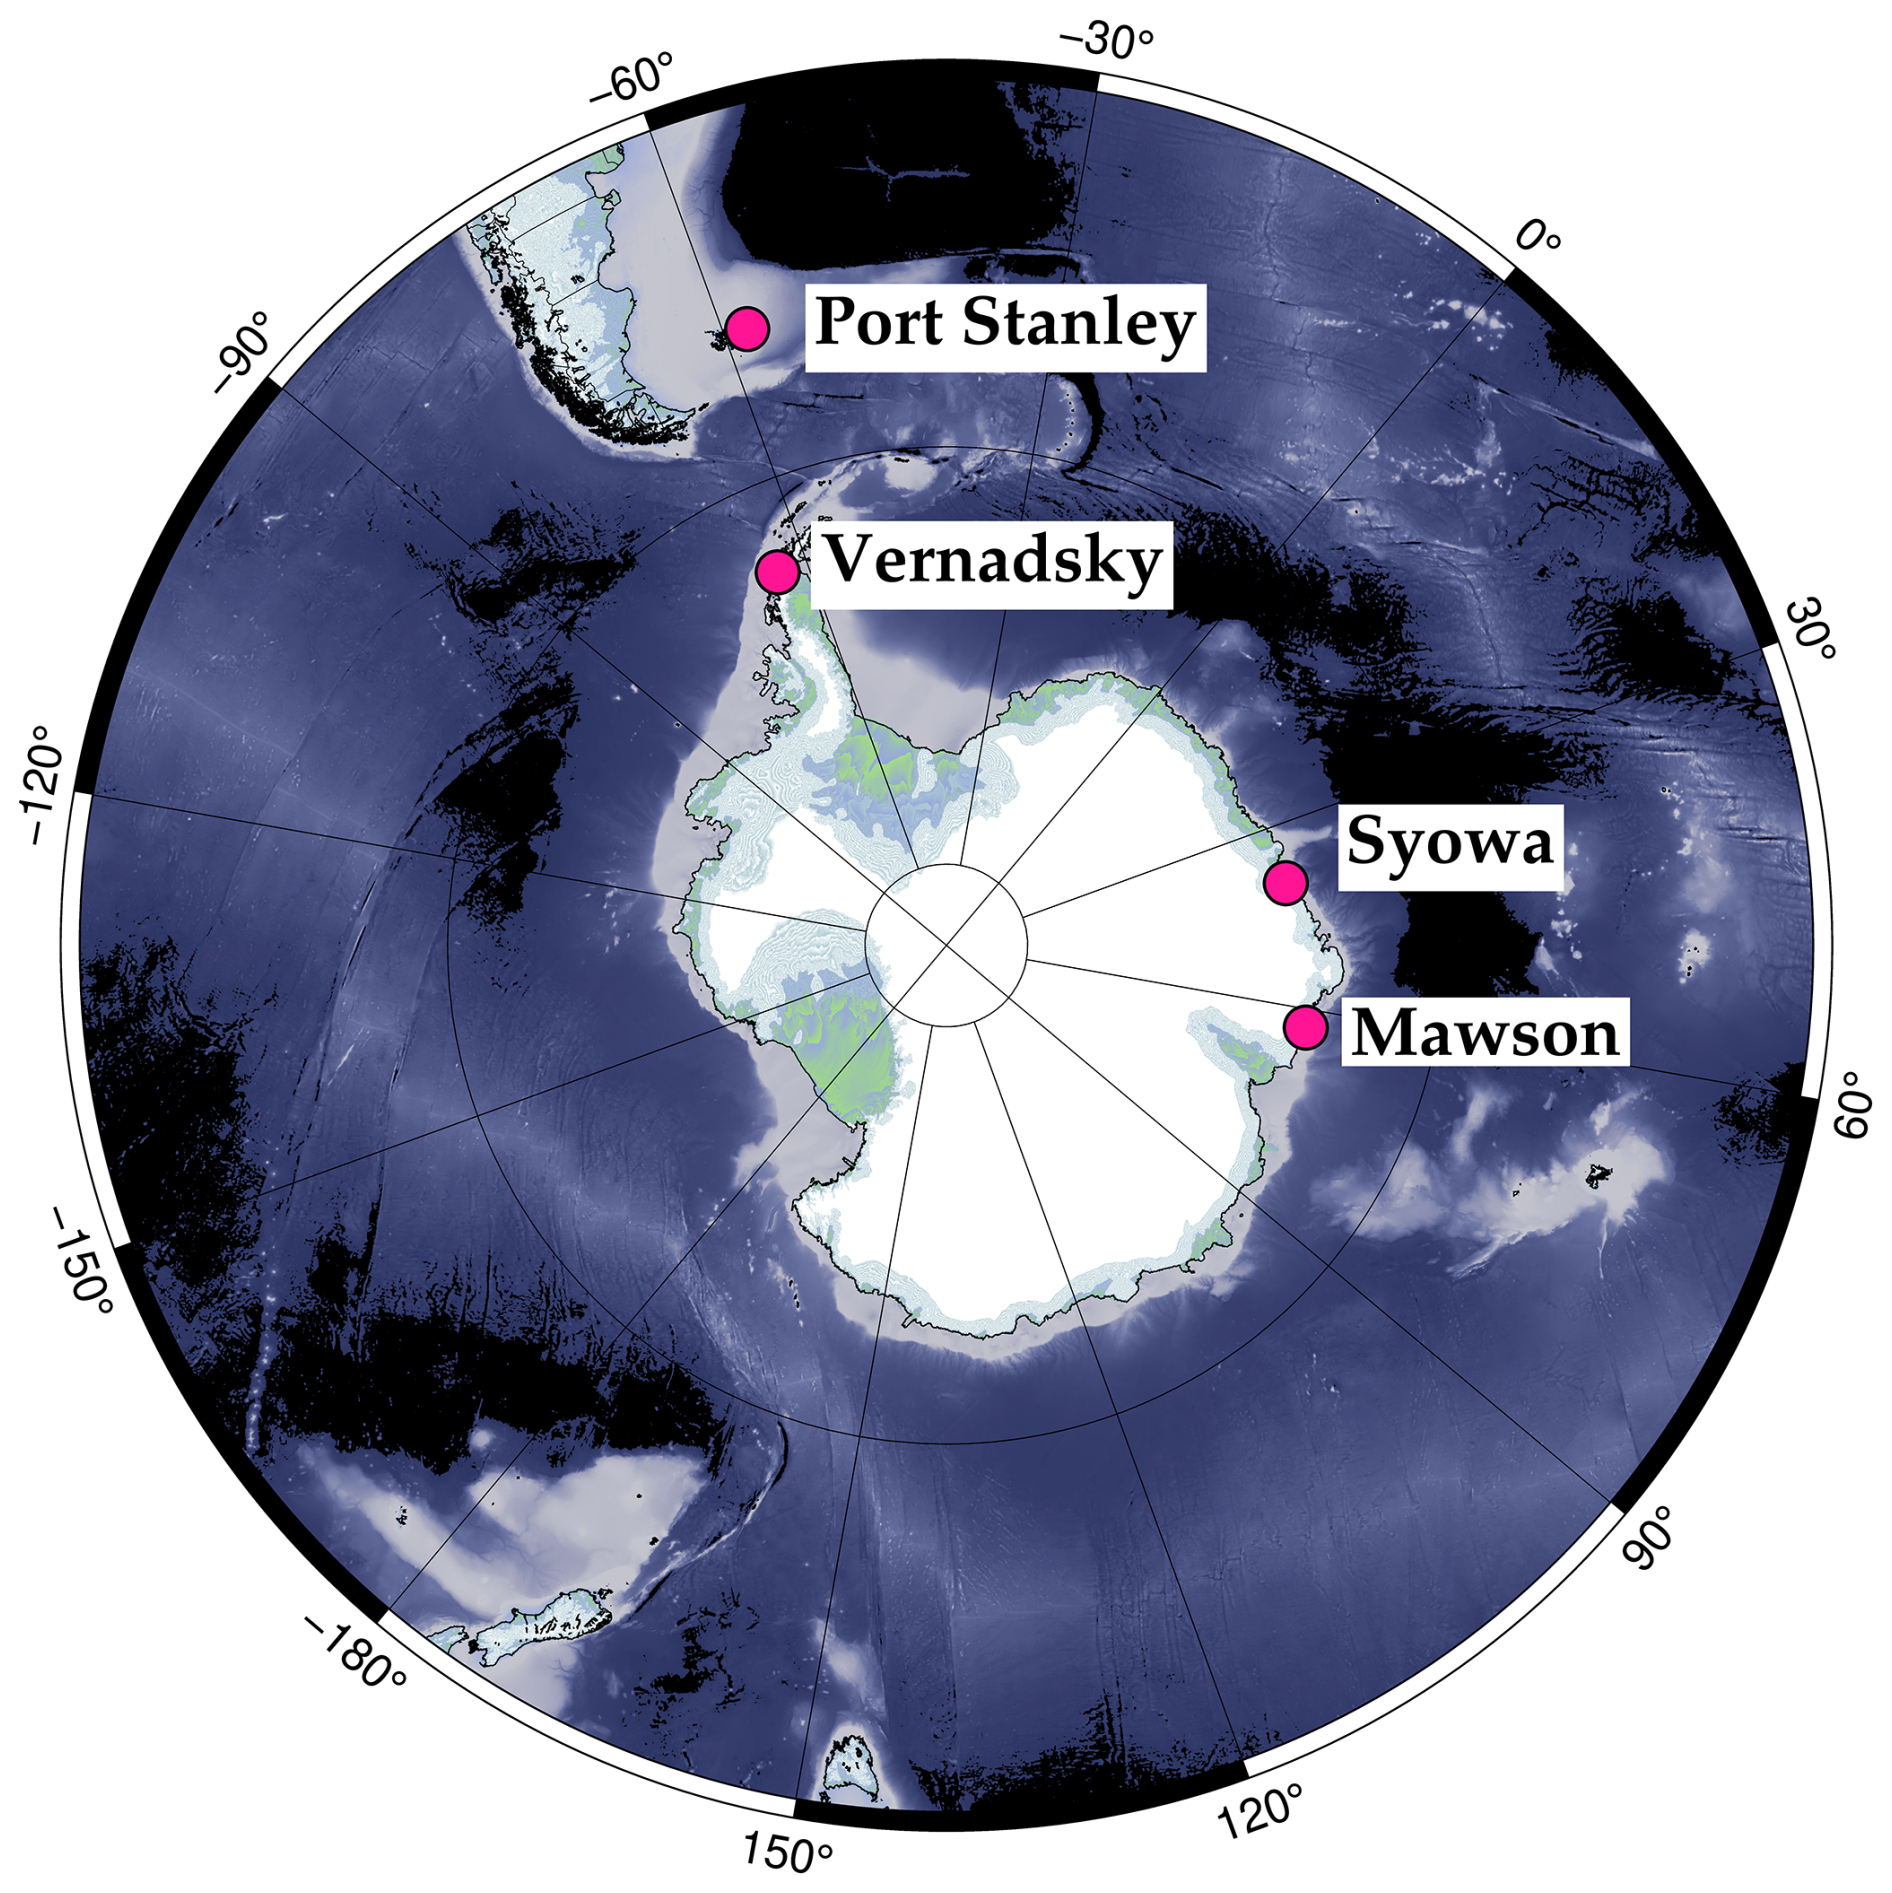
Figure 1Geographic locations of the ionospheric stations used in this work.
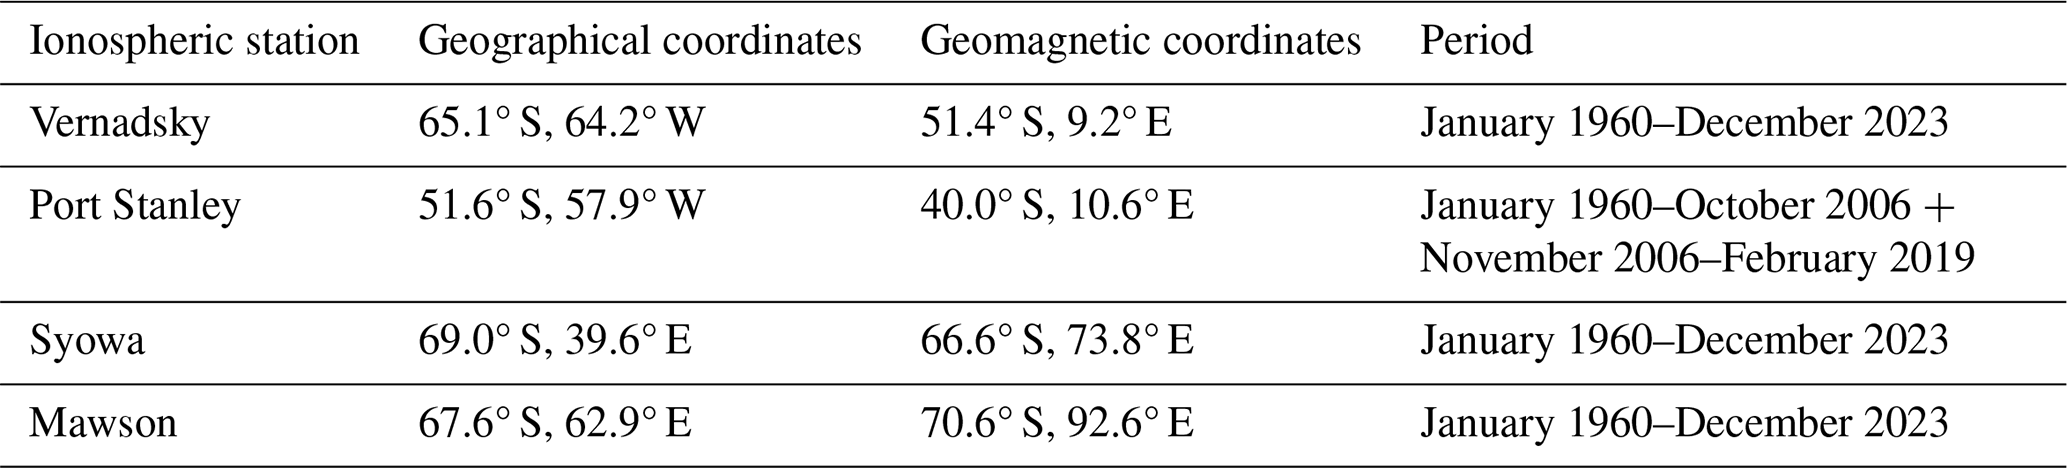
To investigate the potential impact of the Weddell Sea Anomaly on Vernadsky and Port Stanley ionospheric stations, the methodology will be applied to stations located outside the anomaly's influence zone. These stations are Syowa (69.0° S, 39.6° E) and Mawson (67.6° S, 62.9° E). Both datasets were also obtained from the database of Damboldt and Suessmann (2012). The geophysical information of each station is presented in Table 1. The data used begin in 1960 as it was decided to homogenize the study period to ensure a more consistent and precise comparison, avoiding the great solar maximum of 1958.
Table 1Geophysical information of ionospheric stations used in this work, according to the British Geological Survey (https://geomag.bgs.ac.uk/, last access: 17 December 2024).
Monthly medians foF2 for each of the 24 daily hours were considered along the period from January 1960–December 2023 of each station, except for Port Stanley, which covers the period from 1960–2019. It should be noted that most of the data are manually scaled. The year intervals used for Vernadsky and Syowa in particular are entirely manually scaled. While for Mawson and Port Stanley, they are a combination of manual scaling and autoscaling, the latter method has only been used for a little over a decade. Furthermore, the significant errors introduced by this combination should be reduced using monthly medians.
The presence of the WSA becomes evident at Vernadsky when comparing its summer diurnal foF2 variations with Syowa and Mawson stations (see Fig. 2). However, Port Stanley is not completely affected by the WSA, but there is only a secondary maximum at night or what is known as Mid-latitude Summer Evening Anomaly (MSEA) (Klimenko et al., 2015).
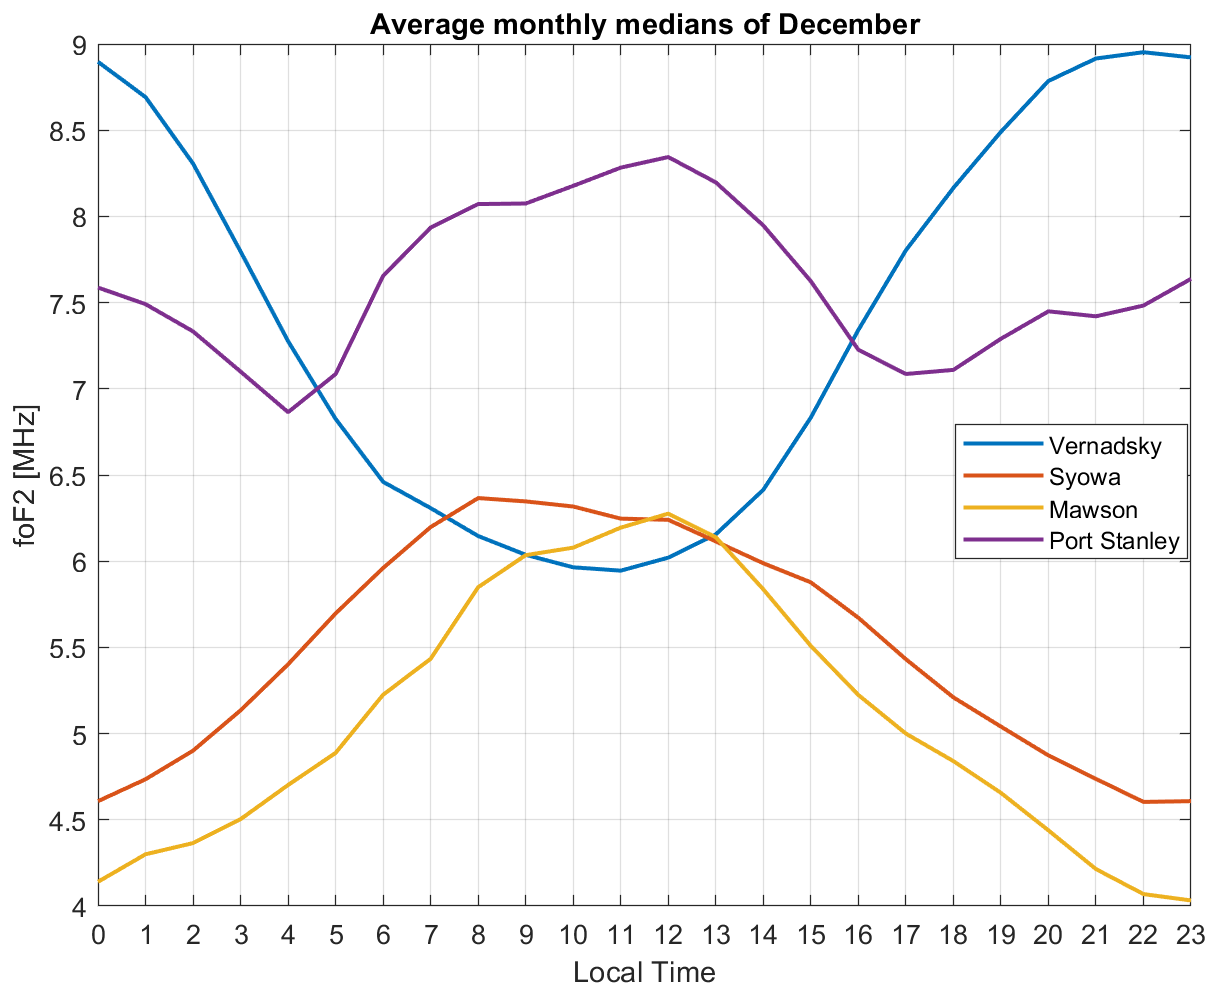
Figure 2Diurnal variation in December of the average monthly medians of foF2 for the period between 1960 and 2023 for Vernadsky, Syowa and Mawson stations and between 1960 and 2019 for Port Stanley station.
It is important to note that the data for Port Stanley come from two different sources: most of the records up to 2006 were obtained using an ionosonde, while from that date onward they began to be collected using a digisonde. When comparing the data from the same years, a satisfactory agreement was observed between the two sources, which led to the decision to use them together. It is even more relevant to assess the quality of data from the Mawson and Syowa ionospheric stations, especially considering that in some years complete records are not available. Possible deficiencies and missing data from these stations are presumed to be due to their proximity to the auroral oval, a highly dynamic region where geomagnetic conditions can significantly interfere with ionospheric measurements.
Monthly means of MgII (core-to-wing ratio of the MgII line), as an EUV solar proxy was used to filter out the solar activity effect from foF2. It was chosen in accordance with the recommendations provided by Laštovička (2021a, b) and de Haro Barbás et al. (2021). The MgII index is available from the University of Bremen at https://www.iup.uni-bremen.de/UVSAT/data/ (last access: 5 December 2024) (Viereck et al., 2004; Snow et al., 2014).
The geomagnetic activity index Ap was also considered an additional parameter in the filtering process. Monthly values were obtained from the Kyoto World Data Center for Geomagnetism at https://wdc.kugi.kyoto-u.ac.jp/index.html (last access: 5 December 2024).
Given that the foF2 trends we aim to detect are very subtle, it is essential to filter out all other regular or known variations in this parameter. By analyzing each month and hour individually, we can eliminate the seasonal and diurnal components of foF2 variation. This approach assumes that the remaining variability is primarily due to solar and geomagnetic activity along with random noise inherent in any physically measured series. The effect of solar and geomagnetic activity on each of these data series was filtered in the usual manner (e.g., Duran et al., 2023) by estimating the residuals (foF2gs) through a multiple regression between foF2 and MgII (as a proxy for solar activity) and Ap as follows:
where foF2exp represents the measured foF2 data, and A, B, C, and D are the least-squares parameters of the regression between foF2exp, the linear and quadratic terms of MgII, and the Ap index.
Finally, the foF2 linear trend, α, is estimated by
where α in MHz yr−1 and β in megahertz are the least-squares parameters of the linear regression between foF2 and time t in a year.
Figure 3 shows the values of the squared correlation coefficient, r2, between MgII, Ap, and foF2, indicating the fraction of foF2 monthly median variance explained by the MgII index and Ap through Eq. (1) along the period from 1960–2023, except for Port Stanley, which covers the period from 1960–2019.
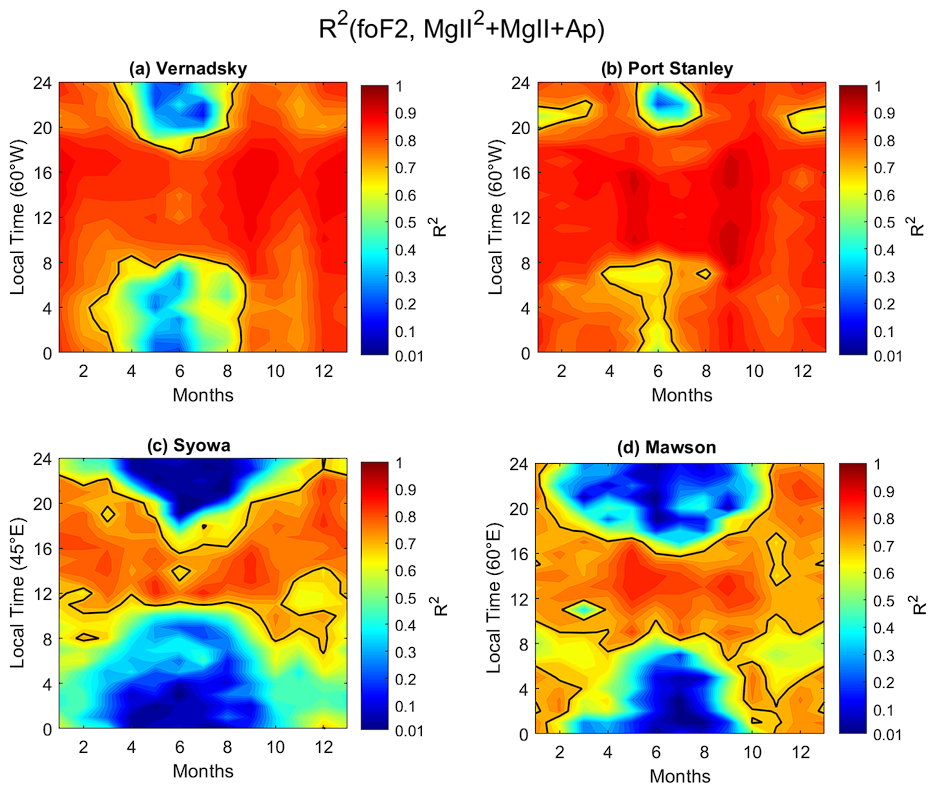
Figure 3Seasonal and diurnal variation in the squared correlation coefficient (r2) for (a) Vernadsky, (b) Port Stanley, (d) Syowa, and (c) Mawson. The solid black curve shows r2=0.75.
Figure 3 illustrates a strong solar and geomagnetic dependence at Vernadsky during all hours in the summer but only during daylight hours (08:00–19:00 LT) for the rest of the year. In particular, a detailed study of the morphology of the Akademik Vernadsky station and its dependence on UV and geomagnetic activity can be seen in Zalizovski et al. (2021). Port Stanley exhibits this strong dependence during almost all hours and across all seasons. This is due to its location at a lower latitude compared to the rest of the stations. A similar pattern to Vernadsky is observed at Mawson, although weaker correlations are observed during summer nights. In contrast, Syowa shows strong dependencies only during daylight hours and dusk, with almost no correlation during the period between 23:00 and 08:00 LT in winter months. The Antarctic stations (Vernadsky, Syowa, and Mawson) show a low to almost zero correlation during winter nights due to the polar night effect. This also occurs during summer nights, with the exception of Vernadsky, which shows a high correlation during these months, probably due to the presence of the WSA.
Trends are then calculated for all hours across all years included in the study following Eq. (2). The results are displayed in Fig. 4.
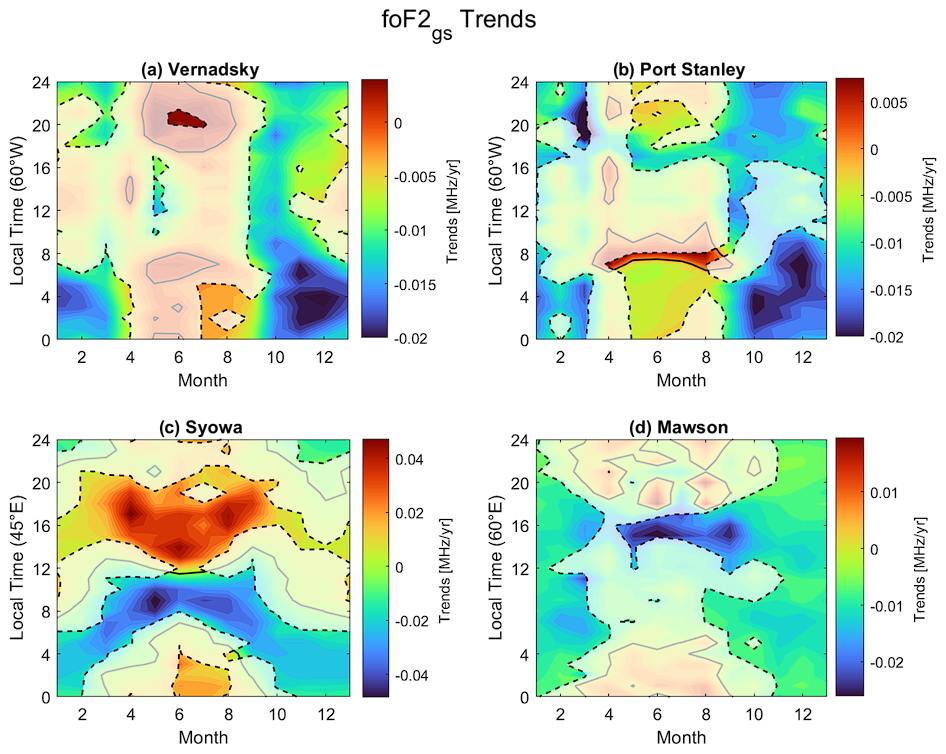
Figure 4Seasonal and diurnal variation in the foF2 linear trend for (a) Vernadsky, (b) Port Stanley, (c) Syowa, and (d) Mawson. The solid black curve is α=0. Dashed black curve is α with 95 % significance. White transparent areas represent non-significant trends.
Figure 4 shows negative trends (extreme values of −0.02 MHz yr−1) for Vernadsky in the intervals where the explained variance was significant, i.e., during all hours between the end of September and December and at nighttime hours from January to March. A small positive trend during winter between 20:00 and 21:00 LT is also observed. Similar negative trends are observed at Port Stanley at the same hours and in the same months. Syowa and Mawson display opposite trends to each other. While Syowa shows positive trends (+0.04 MHz yr−1) during the intervals of significant explained variance, negative trends (−0.02 MHz yr−1) are observed for Mawson at the same hours.
The negative trends observed at the Vernadsky station coincide with the months and hours when the Weddell Sea Anomaly is present. The physical phenomenon responsible for these trends during these intervals is likely the same as the one affecting Port Stanley. This can be inferred from the fact that Port Stanley exhibits a secondary maximum during the night (see Fig. 2). Such a pattern is not observed at the Syowa and Mawson stations, which, due to their differing prevailing placements within auroral and polar cap ionosphere, respectively, show significantly different trends from each other.
Regarding the Weddell Sea Anomaly and its impact on the ionosphere in this region, it is observed that it not only significantly influences the Vernadsky station but also affects, albeit to a lesser extent, the Port Stanley station. As shown in Fig. 2, during the summer months, the foF2 parameter increases at night. The shape of the curve in this figure appears to combine the expected trend in the absence of the anomaly (similar to the Mawson or Syowa curves) with a curve clearly influenced by the anomaly, such as the Vernadsky curve. This behavior suggests that the Weddell Sea Anomaly has a regionally differentiated effect, modulating ionospheric characteristics based on the location of each station.
Moreover, since the WSA has been suggested to arise because the area is located farther away from the austral auroral zone than locations at other longitude sectors along the same latitude (Richards et al., 2017, 2018), the WSA may also depend on the long-term trend of the auroral zone itself. Indeed, perusal of the long-term changes in the geomagnetic parameters in the Southern Hemisphere using the International Geomagnetic Reference Field (IGRF20, https://www.ngdc.noaa.gov/geomag/calculators/magcalc.shtml, last access: 10 December 2024) shows that the austral auroral zone does move away from middle latitudes in the American longitude sector between 1960 and 2024, so much so that the inclination of the magnetic field at the WSA is almost stationary (in contrast to Concepción and Tucumán, as seen in Foppiano et al., 1999), although the total intensity of the field does decrease. This latter fact is related to the westward movement of the South Atlantic Magnetic Anomaly (SAMA) during the same time interval.
In the case of Port Stanley, trends around −0.003 MHz yr−1 are observed during the winter months between 10:00 and 14:00 LT, which are similar to the trends reported by Upadhyay and Mahajan (1998), who calculated a trend of −0.004 MHz yr−1 for the period from 1957 to 1990 during the same hours. However, between October and February, the trends calculated in this study are lower than −0.005 MHz yr−1, reaching as low a value as −0.015 MHz yr−1 in October (Fig. 4).
According to Danilov and Mikhailov (2001), using a third-degree polynomial on the sunspot number to model foF2, the hourly average trends for Vernadsky are negative throughout the day, which is consistent with the trends observed in this study, but with different amplitudes (approximately half of the maximum value at 04:00 LT). When comparing these data with Port Stanley, we again find that the average hourly trends are negative for all hours, which is consistent with the trends in this study, but with double the maximum values. On the other hand, when comparing the trends at 04:00 LT, neither Port Stanley nor Vernadsky show differences in trends during the WSA months.
Syowa, according to model 1 of Alfonsi et al. (2001), shows negative trends in the monthly averages during the summer months and positive trends during the winter but with greater amplitude compared to this study. Model 1 consists of using the ITU-R global model to model foF2 and filter external forcings not linked to the greenhouse gas increase, which is a reason for the difference in the trend absolute values between this study and Alfonsi et al. (2001). Specifically, in this study, between 23:00 and 07:00 LT, positive trends were found during the winter and negative trends during the summer. Then, between 08:00 and 13:00 LT, these trends reverse between winter and summer, and between 14:00 and 22:00 LT, they are positive throughout the year. These same trends (model 1) for Mawson are negative throughout the year, which is consistent with this study, but with greater amplitudes. During daylight hours, the trends are negative year-round, while at night, the trends in winter are close to zero.
The possibility of using time series only up to 2005 was evaluated not only to maintain a single data source for Port Stanley but also because of solar minima that occurred after 2008, which could influence the trend results (Cnossen and Franzke, 2014), obtaining similar results.
When comparing trends with those from other mid-latitude stations in South America, Foppiano et al. (1999) analyzed foF2 time series from the Concepción ionospheric station (36.8° S, 73° W) for the period from 1958–1994. They found consistently negative trends between 08:00 and 19:00 LT throughout the year. However, between 00:00 and 07:00 LT, the trends were close to zero or positive, except during the summer months. Meanwhile, Jarvis et al. (1998), studying the trends (1957–1995) in hmF2 at the Argentine Islands and Port Stanley, observed seasonal and diurnal variations. They reported predominantly negative trends at Port Stanley, while smaller trends were noted at the Argentine Islands.
Several trend studies have been conducted on stations in the Southern Hemisphere. For example, Sharan and Kumar (2021) and Duran et al. (2023) analyzed foF2 data at 00:00 and 12:00 LT from Australian ionospheric stations. In Sharan and Kumar (2021), foF2 data from Hobart, Canberra, and Christchurch (1947–2006) were examined. Their results revealed more significant trends at midday (12:00 LT), with negative trends associated with F10.7 solar flux and small, insignificant positive trends linked to Rz. They concluded that foF2 decreased by 0.1–0.4 MHz over five solar cycles, likely due to increased CO2 in the troposphere cooling the upper atmosphere. For its part, Duran et al. (2023) analyzed foF2 data from mid- to low-latitude stations up to 2022, focusing on seasonal and diurnal variability. Their findings show overall negative trends, with the most significant declines observed around the equinox. Weaker or slightly positive trends were seen in December–February and June–August, while the diurnal pattern showed the strongest negative values during the day and the weakest at night.
To compare the experimental foF2 trend values with those from models assessing anthropogenic forcing effects, the results of Solomon et al. (2018) are considered. They carried out simulations using the Whole Atmosphere Community Climate Model-eXtended to investigate anthropogenic global changes across the entire atmosphere, including the thermosphere and ionosphere, and identified CO2 as the primary driver of temperature changes. For their simulations, they applied a CO2 increase of 16 ppmv per decade, which led to a 1.2 % reduction in peak electron density (NmF2). In this work, we find a foF2 maximum reduction of 3.5 % per decade for Vernadsky and Port Stanley during the months and hours of WSA. foF2 maximum reductions of 10 % and 6 % were found for Syowa and Mawson, respectively, during other months and hours. All of these percentages are much higher than those calculated in the literature (see de Haro Barbás and Elias, 2020; de Haro Barbás et al., 2021; Duran et al., 2023).
The same long-term trend analysis has been performed but using F30 instead of MgII as an EUV solar proxy, as suggested by recent studies (Laštovička and Burešová, 2023; Laštovička, 2024); however, the results (figure not shown) do not show significant differences to those done with MgII.
The seasonal and diurnal variation in the long-term foF2 trend for stations within the Weddell Sea Anomaly region is analyzed to contribute to the still controversial issue of the ionospheric trend. The WSA is shown to significantly impact ionospheric trends, particularly at Vernadsky, where negative trends are observed during periods when the WSA is active. This effect is also detected in Port Stanley, although to a lesser extent, showing only a secondary maximum during the evening. These trends seem to be consistent with the long-term apparent movement of the WSA relative to the austral auroral zone, which moves poleward during the studied time interval due to the decrease of the total intensity of the magnetic field over the area.
The trends in foF2 show seasonal and diurnal variations, with negative trends at Vernadsky and Port Stanley during specific hours and months where the WSA is present. In contrast, Syowa and Mawson stations, in longitude sectors outside the WSA region, do not show the same seasonal and diurnal behavior as the trends.
The results are consistent with some earlier studies, though the observed trend magnitudes differ. For example, trends at Port Stanley match previous studies in terms of negative values but with differing amplitudes. The study also aligns with findings from other Southern Hemisphere stations which report negative trends in foF2 at various latitudes.
Other studies suggest a 1.2 % reduction in NmF2 due to CO2-driven temperature changes. This study found foF2 maximum reduction values to be much larger than in the literature at all stations. Particularly, Vernadsky and Port Stanley show the same maximum reductions values at WSA months. Overall, the study underscores the complex interplay between solar, geomagnetic, and regional factors in shaping ionospheric trends, with specific attention paid to the regional effects of the WSA.
Ionospheric foF2 data were obtained from the Damboldt and Suessmann database available from the WDC (https://downloads.sws.bom.gov.au/wdc/iondata/medians/, Australian Space Weather Forecasting Centre, 2024). In the case of Port Stanley, to extend the dataset until 2019, additional data were incorporated from the Digital Ionogram Data Base (DIDBase) at Lowell GIRO Data Center (LGDC). Mg II data are obtained from the University of Bremen at https://www.iup.uni-bremen.de/UVSAT/data/ (University of Bremen, 2024). The Ap index was obtained from the Kyoto World Data Center for Geomagnetism at https://wdc.kugi.kyoto-u.ac.jp/index.html (Kyoto World Data Center for Geomagnetism, 2024).
MC: formal analysis, data curation, writing (original draft preparation), and validation. TD: formal analysis, data curation, and writing (original draft preparation). MB: conceptualization, methodology, and writing (original draft preparation). AZ: data mining. AF: supervision and writing (original draft preparation).
The contact author has declared that none of the authors has any competing interests.
Publisher’s note: Copernicus Publications remains neutral with regard to jurisdictional claims made in the text, published maps, institutional affiliations, or any other geographical representation in this paper. While Copernicus Publications makes every effort to include appropriate place names, the final responsibility lies with the authors.
This article is part of the special issue “Long-term trends in the stratosphere–mesosphere–thermosphere–ionosphere system”. It is a result of the 12th International Workshop on Long-Term Changes and Trends in the Atmosphere (TRENDS 2024), Ourense, Spain, 6–10 May 2024.
We thank Ana G. Elias for her collaboration in the discussion and partial analysis of the results obtained. This work was supported by the Universidad Adventista de Chile, regular project no. 204. The authors are thankful to the Antarctic Geospace and ATmosphere reseArch (AGATA) Scientific Research Programme. Manuel Bravo acknowledges the ANID/FONDECYT Regular 1211144 project. Andriy Zalizovski was supported by the STCU-EOARD project P775 (EOARD 22IOE019) and within the Long-term program of support for Ukrainian research teams at the Polish Academy of Sciences, carried out in cooperation with the US National Academy of Sciences and external partners (agreement no. PAN.BFB.S.BWZ.364.022.2023).
This paper was edited by Jan Laštovička and reviewed by two anonymous referees.
Alfonsi, L., De Franceschi, G., and Perrone, L.: Long term trend in the high latitude ionosphere, Phys. Chem. Earth Pt. C, 26, 303–307, https://doi.org/10.1016/S1464-1917(01)00003-4, 2001.
Australian Space Weather Forecasting Centre: Index of /wdc/iondata/medians, Australian Space Weather Forecasting Centre [data set], https://downloads.sws.bom.gov.au/wdc/iondata/medians/ (last access: 4 November 2024), 2024.
Bellchambers, W. H. and Piggott, W. R.: Ionospheric measurements made at Halley Bay, Nature, 182, 1596–1597, 1958.
Bremer, J., Damboldt, T., Mielich, J., and Suessmann, P.: Compar-ing long-term trends in the ionospheric F2-region with two dif-ferent methods, J. Atmos. Sol.-Terr. Phys., 77, 174–185, 2012.
Cnossen, I. and Franzke, C.: The role of the Sun in long-term change in the F2 peak ionosphere: New insights from EEMD and numerical modeling, J. Geophys. Res., 119, 8610–8623, https://doi.org/10.1002/2014JA020048, 2014.
Damboldt, T. and Suessmann, P.: Consolidated Database of Worldwide Measured Monthly Medians of Ionospheric Characteristics foF2 and M(3000)F2, INAG (Ionosonde Network Advisory Group) Bulletin 73, https://www.ursi.org/files/CommissionWebsites/INAG/web-73/2012/damboldt_consolidated_database.pdf (last access: 4 November 2024), 2012.
Danilov, A. D. and Mikhailov, A. V.: F2-layer parameters long-term trends at the Argentine Islands and Port Stanley stations, Ann. Geophys., 19, 341–349, https://doi.org/10.5194/angeo-19-341-2001, 2001.
de Haro Barbás, B. F. and Elias, A. G.: Effect of the Inclusion of Solar Cycle 24 in the Calculation of foF2 Long-Term Trend for Two Japanese Ionospheric Stations, Pure Appl. Geophys., 177, 1071–1078, https://doi.org/10.1007/s00024-019-02307-z, 2020.
de Haro Barbás, B. F., Elias, A. G., Venchiarutti, J. V., Fagre, M., Zossi, B. S., Tan Jun, G., and Medina, F. D.: MgII as a Solar Proxy to Filter F2-Region Ionospheric Parameters, Pure Appl. Geophys. 178, 4605–4618, https://doi.org/10.1007/s00024-021-02884-y, 2021.
Duran, T., Melendi, Y., Zossi, B. S., De Haro Barbás, B. F., Buezas, F. S., Juan, A., and Elias, A. G.: Contribution to ionospheric F2 region long-term trend studies through seasonal and diurnal pattern analysis, Global Planet. Change, 229, 104249, https://doi.org/10.1016/j.gloplacha.2023.104249, 2023.
Foppiano, A. J, Cid, L., and Jara, V.: Ionospheric long-term trends for South American mid-latitudes, J. Atmos. Sol.-Terr. Phys., 61, 717–723, https://doi.org/10.1016/S1364-6826(99)00025-5, 1999.
Jarvis, M. J., Jenkins, B., and Rodgers, G. A.: Southern hemisphere observations of a long-term decrease in F region altitude and thermospheric wind providing possible evidence for global thermospheric cooling, J. Geophys. Res., 103, 20775–20787, https://doi.org/10.1029/98JA01629, 1998.
Klimenko, M. V., Klimenko, V. V., Ratovsky, K. G., Zakharenkova, I. E., Yasyukevich, Y. V., Korenkova, N. A., Cherniak, I. V., and Mylnikova, A. A.: Mid-latitude Summer Evening Anomaly (MSEA) in F2 layer electron density and Total Electron Content at solar minimum, Adv. Space Res., 56, 1951–1960, 2015.
Kyoto World Data Center for Geomagnetism: WDC [data set], https://wdc.kugi.kyoto-u.ac.jp/index.html (last access: 5 December 2024), 2024.
Laštovička, J.: A review of recent progress in trends in the upper atmosphere, J. Atmos. Sol.-Terr. Phys., 163, 2–13, https://doi.org/10.1016/j.jastp.2017.03.009, 2017.
Laštovička, J.: Long-Term Trends in the Upper Atmosphere, in: Upper Atmosphere Dynamics and Energetics, edited by: Wang, W., Zhang, Y., and Paxton, L. J., American Geophysical Union, Washington D.C., USA, 325–344, https://doi.org/10.1007/978-94-007-0326-1_30, 2021a.
Laštovička, J.: What is the optimum solar proxy for long-term ionospheric investigations?, Adv. Space Res., 67, 2–8, https://doi.org/10.1016/j.asr.2020.07.025, 2021b.
Laštovička, J.: Dependence of long-term trends in foF2 at middle latitudes on different solar activity proxies, Adv. Space Res., 73, 685–689, https://doi.org/10.1016/j.asr.2023.09.047, 2024.
Laštovička, J. and Burešová, D.: Relationships between foF2 and various solar activity proxies, Space Weather, 21, e2022SW003359, https://doi.org/10.1029/2022SW003359, 2023.
Laštovička, J., Solomon, S., and Qian, L.: Trends in the Neutral and Ionized Upper Atmosphere, Space Sci. Rev., 168, 113–145, https://doi.org/10.1007/s11214-011-9799-3, 2012.
Laštovička, J., Beig, G., and Marsh, D. R.: Response of the mesosphere-thermosphere-ionosphere system to global change-CAWSES-II contribution, Prog. Earth Planet. Sci., 1, 21, https://doi.org/10.1186/s40645-014-0021-6, 2014.
Richards, P. G., Meier, R. R., Chen, S.-P., Drob, D. P., and Dandenault, P.: Investigation of the causes of the longitudinal variation of the electron density in the Weddell Sea Anomaly, J. Geophys. Res.-Space, 122, 6562–6583, https://doi.org/10.1002/2016JA023565, 2017.
Richards, P. G., Meier, R. R., Chen, S., and Dandenault, P.: Investigation of the causes of the longitudinal and solar cycle variation of the electron density in the Bering Sea and Weddell Sea anomalies, J. Geophys. Res.-Space, 123, 7825–7842, https://doi.org/10.1029/2018JA025413, 2018.
Rishbeth, H.: A greenhouse effect in the ionosphere?, Planet. Space Sci., 38, 945–948, 1990.
Roble, R. G. and Dickinson, R. E.: How will changes in carbon dioxide and methane modify the mean structure of the mesosphere and thermosphere?, Geophys. Res. Lett., 16, 1441–1444, 1989.
Sharan, A. and Kumar, S.: Long-term trends of the F2-region at mid-latitudes in the Southern Hemisphere, J. Atmos. Solar-Terr. Phys., 220, 105683, https://doi.org/10.1016/j.jastp.2021.105683, 2021.
Snow, M., Weber, M., Machol, J., Viereck, R., and Richard, R.: Comparison of Magnesium II core-to-wing ratio observations during solar minimum 23/24, J. Space Weather Space Clim., 4, A04, https://doi.org/10.1051/swsc/2014001, 2014.
Solomon, S. C., Liu, H. L., Marsh, D. R., McInerney, J. M., Qian, L., and Vitt, F. M.: Whole atmosphere simulation of anthropogenic climate change, Geophys. Res. Lett., 45, 1567–1576, https://doi.org/10.1002/2017GL076950, 2018.
University of Bremen: Mg II solar activity index, University of Bremen [data set], https://www.iup.uni-bremen.de/UVSAT/data/, last access: 5 December 2024.
Upadhyay, H. O. and Mahajan, K. K.: Atmospheric greenhouse effect and ionospheric trends, Geophys. Res. Lett., 25, 3375–3378, https://doi.org/10.1029/98GL02503, 1998.
Viereck, R. A., Floyd, L. E., Crane, P. C., Woods, T. N., Knapp, B. G., Rottman, G., Weber, M., Puga, L. C., and DeLand, M. T.: A composite Mg II index spanning from 1978 to 2003, Space Weather, 2, S10005, https://doi.org/10.1029/2004SW000084, 2004.
Zakharenkova, I., Cherniak, I., and Shagimuratov, I.: Observations of the Weddell Sea Anomaly in the ground-based and space-borne TEC measurements, J. Atmos. Sol.-Terr. Phys., 161, 105–117, https://doi.org/10.1016/j.jastp.2017.06.014, 2017.
Zalizovski, A., Stanislawska, I., Lisachenko, V., and Charkina, O.: Variability of Weddell Sea ionospheric anomaly as deduced from observations at the Akademik Vernadsky station, Ukrainian Antarctic Journal, 1, 47–55, https://doi.org/10.33275/1727-7485.1.2021.666, 2021.