the Creative Commons Attribution 4.0 License.
the Creative Commons Attribution 4.0 License.
 | 23 Jul 2024
Sensitivity analysis of a Martian atmospheric column model with data from the Mars Science Laboratory
Ari-Matti Harri
Mark Paton
Jouni Polkko
Maria Hieta
Hannu Savijärvi
An extensive sensitivity analysis was performed for a horizontally homogeneous and hydrostatic 1-D column model at the Mars Science Laboratory (MSL) location. Model experiments were compared with observations from the Curiosity Rover Environmental Monitoring Station humidity (REMS-H) device and ChemCam. Based on our earlier column model investigations, model surface temperature and pressure, dust optical depth (τ), and column precipitable water content (PWC) were the parameters that we investigated with our sensitivity analysis. Our analysis suggests that the most sensitive parameters for the column model temperature profile are τ and surface temperature. The initial value of PWC does not affect the temperature profile of the model, but it is the most important parameter for the humidity profile. The fixed value of τ also seems to have some effect on the humidity profile of the model. Based on our analysis, variations in surface pressure initialization are negligible for the model's temperature and almost negligible for the model's humidity predictions. The model simulations are generally in good agreement with the observations. Our additional model experiments with a different shape of the model's initial humidity profile yielded better results compared to the well-mixed assumption in the predicted water vapor volume mixing ratios at 1.6 m.
- Article
(7370 KB) - Full-text XML
- BibTeX
- EndNote


The 1-D column model, developed by the University of Helsinki (UH) and the Finnish Meteorological Institute (FMI), has been used to study the atmosphere of Mars since the 1990s (Savijärvi, 1991, 1995, 1999). It has turned out to be a very useful tool for studying the Martian atmosphere and testing new numerical algorithms, such as the adsorption–desorption scheme and adiabatic heating modification (e.g., Savijärvi et al., 2016; Paton et al., 2019), as the model is extremely fast and easy to modify. This study focuses on the sensitivity analysis of the model at the Curiosity location during different seasons. We use observations of Curiosity to initialize the model and to interpret the model predictions.
The overarching goal of this article is to better understand the inherent sensitivities in the initialization of the column model. This enhances the science return of the model when used with local in situ observations in analyses of the atmospheric vertical structure and regional meteorology. The results of this study can then also be used in future studies at various landing sites.
The dynamics of the atmospheres of Mars and Earth are very similar due to almost the same rotation rates and inclinations (Kieffer et al., 1992a; Zurek et al., 1992). Due to the dynamical similarities, several numerical atmospheric models made to study the Earth's atmosphere have been adapted for Mars, e.g., the Mars Limited Area Model (MLAM, Kauhanen et al., 2008) and 2-D Mars Mesoscale Circulation Model (MMCM, Savijärvi and Siili, 1993; Siili et al., 1999). However, the Martian atmosphere has some unique features. The Martian atmosphere is mainly composed of CO2 (> 95 %). The surface pressure is only 500–1000 Pa, with the atmosphere therefore reacting very quickly to changes in radiation. In addition, airborne dust has a strong influence on atmospheric temperatures as it absorbs solar radiation and emits thermal radiation. Since the sensible heat flux near the surface and latent heat flux throughout the atmosphere on Mars are very small (e.g., Savijärvi et al., 2004, Fig. 7), parameterizations used for the radiation must be accurate.
The Mars Science Laboratory (MSL) Curiosity rover landed on the floor of the Gale Crater in August 2012. It includes the Rover Environmental Monitoring Station (REMS, Gómez-Elvira et al., 2012) for measuring humidity (REMS-H, Harri et al., 2014a) and pressure (REMS-P, Harri et al., 2014b). The REMS also contains wind velocity, ground temperature, air temperature, and ultraviolet sensors. The REMS-H device measures relative humidity (at the sensor) and internal sensor temperature at an altitude of 1.6 m. Here, the REMS-H temperature sensor reading is used as a proxy for the atmospheric temperature in a similar fashion as in Savijärvi et al. (2016, 2019a, b), since they are estimated to deviate from the ambient temperatures by at most 1 K (Savijärvi et al., 2015). This also enables us to effectively compare the results of our model sensitivity study with previous analyses. The REMS-H instrument, mounted on REMS Boom 2 on board Curiosity, can be seen in Fig. 1.
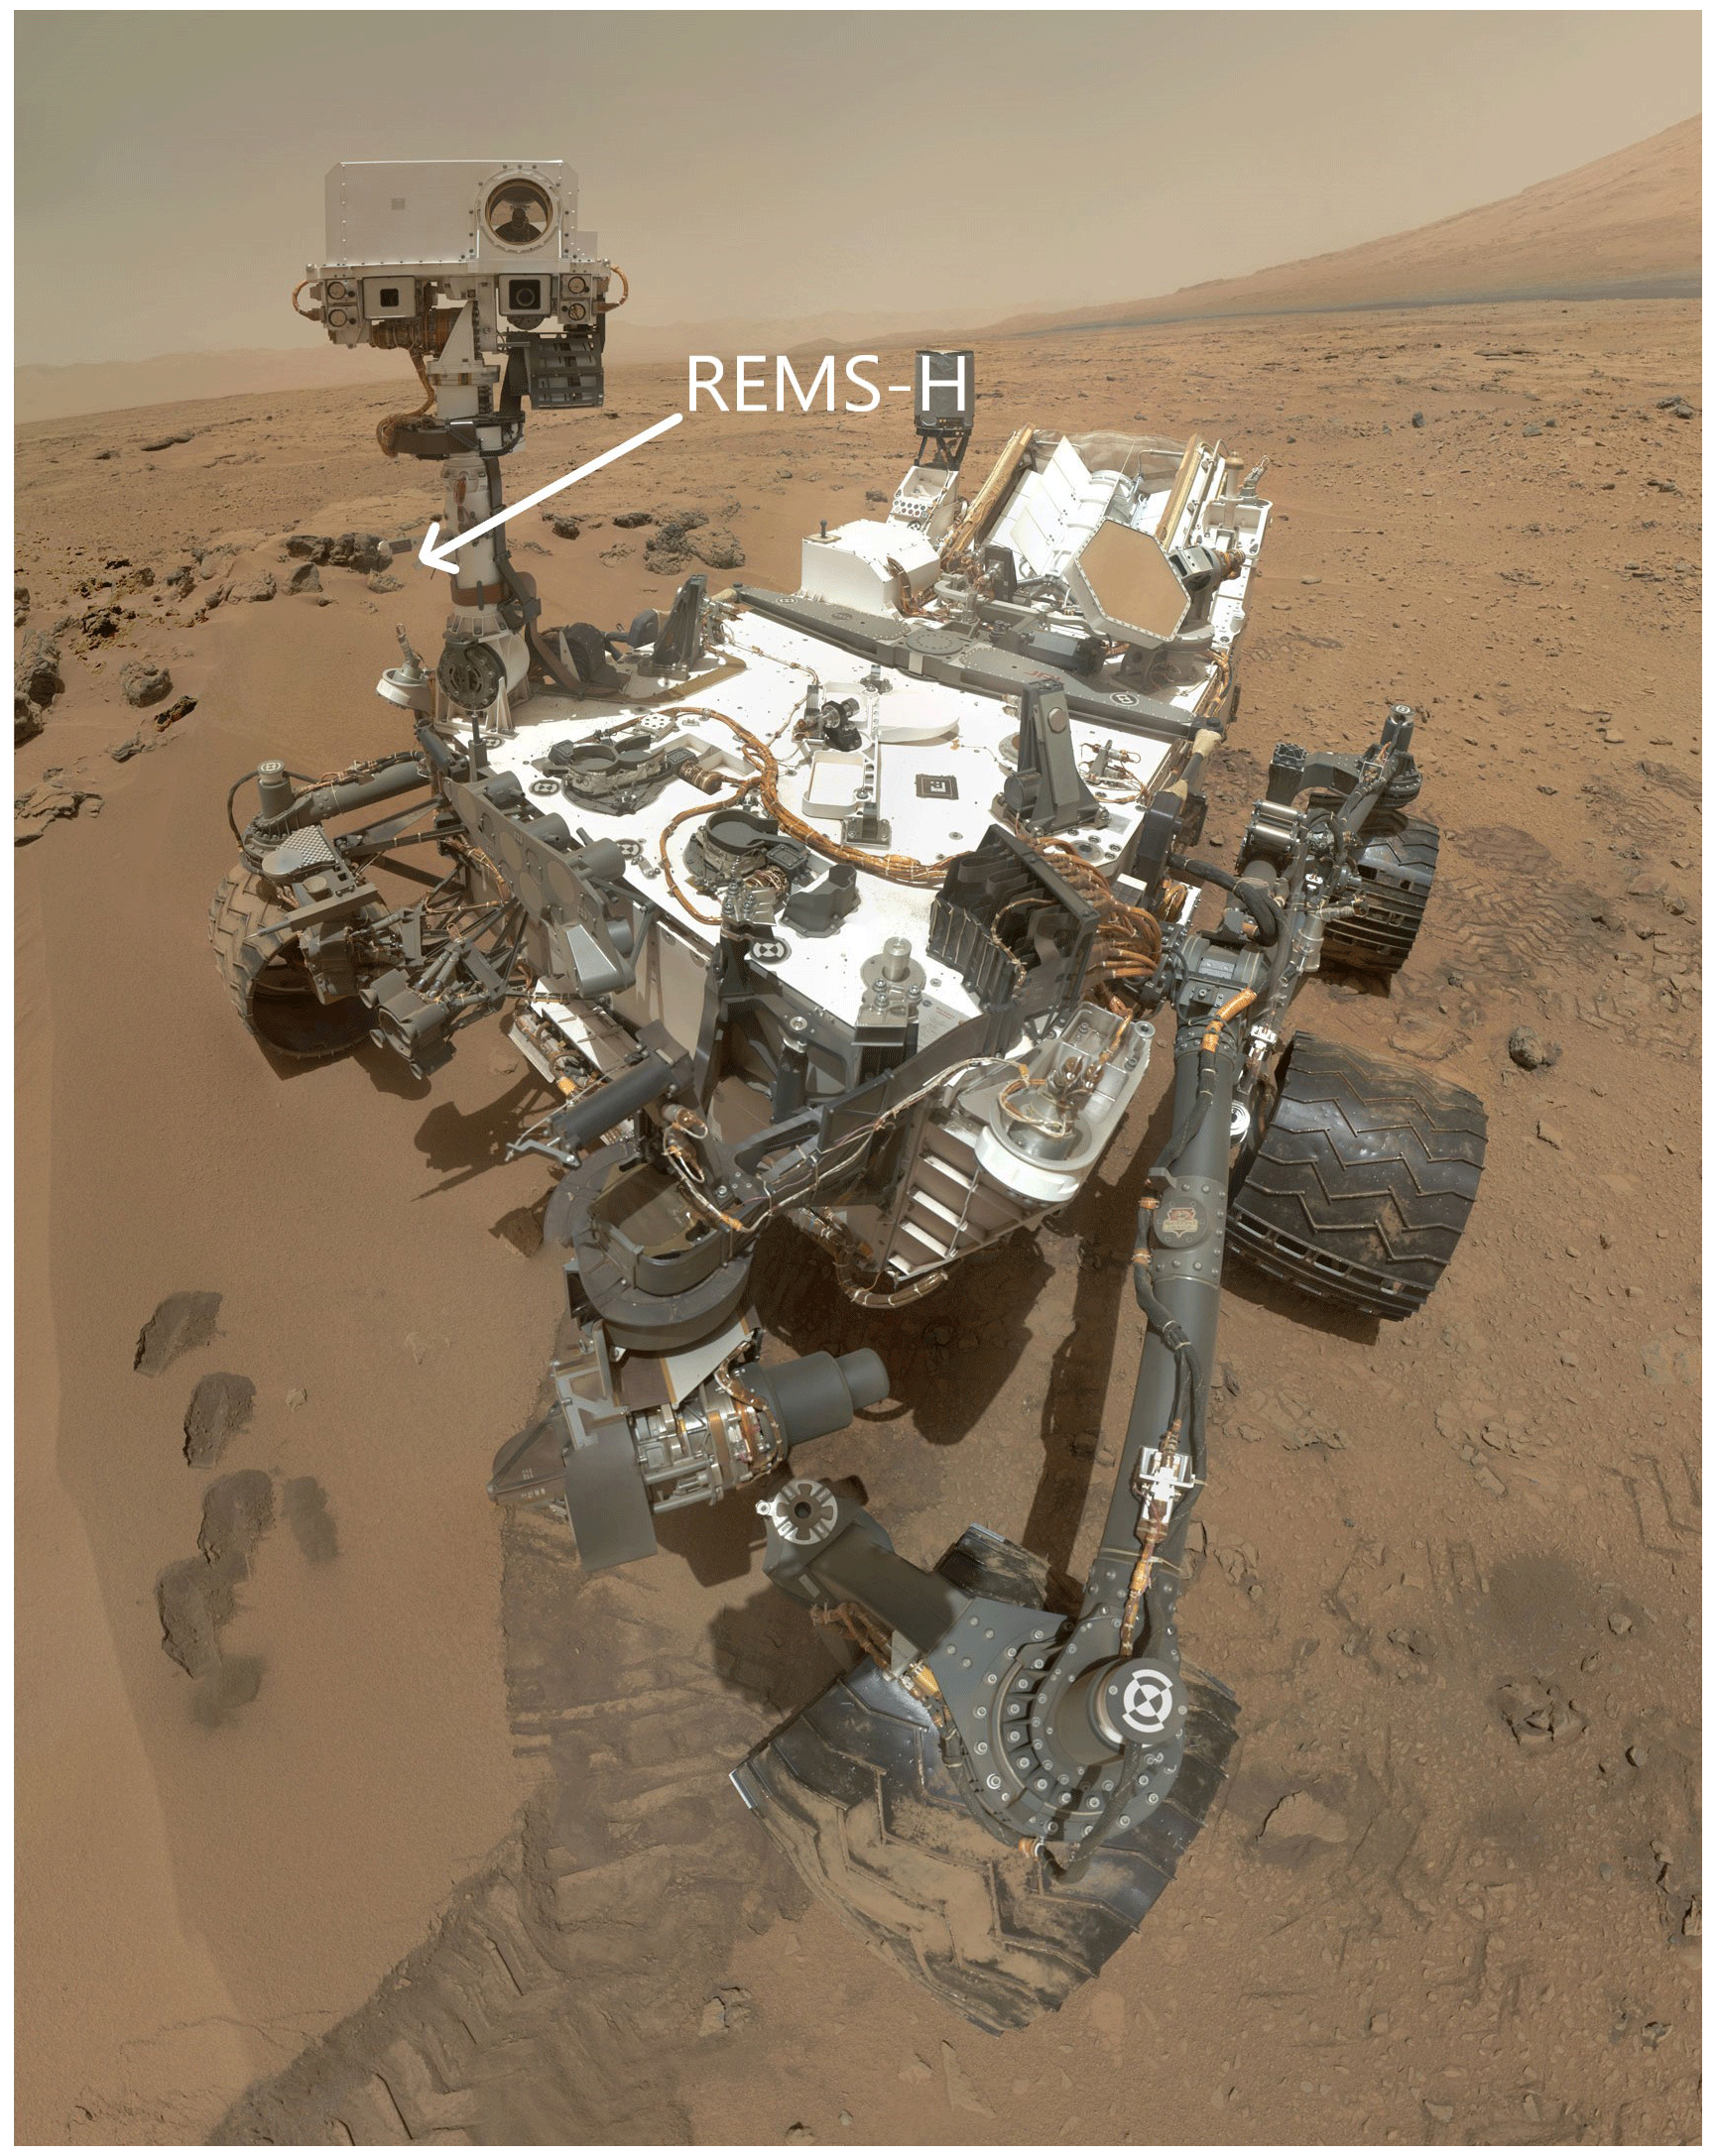
Figure 1A self-portrait of the Curiosity rover produced by the Mars Hand Lens Imager, which also shows the location of the REMS-H device (credit: NASA/JPL-Caltech/Malin Space Science Systems).
The REMS-H humidity measurements will be re-evaluated, which will modify the calibration coefficients. The REMS-H is designed and built at the FMI, where sensor testing and calibration are also performed (Harri et al., 2014a). Thus, the humidity values will change somewhat, but they still serve in their current form in the sensitivity analysis performed here.
The column model was used for the first time at the MSL site, when Savijärvi et al. (2015) studied diurnal temperature and moisture cycles. More advanced simulations were made in Savijärvi et al. (2016) when adsorption of moisture was included in the model. The column model experiments by Savijärvi et al. (2016, 2019a) have helped to interpret the moisture depletion in the evening and night as being caused by adsorption. Savijärvi et al. (2019a) used the model to study the diurnal moisture cycle in the warm (Ls 271°) and cool (Ls 90°) seasons, while Savijärvi et al. (2019b) studied the moisture and air temperatures for 3 Martian years at the MSL site. These studies showed that surface properties (thermal inertia and porosity) changed about 2.5 Martian years (MY) after landing, when the Curiosity rover started climbing Mount Sharp.
The model's diurnal adsorption process was further tested and validated by using the recalibrated Phoenix TECP data of Fischer et al. (2019), as described in Savijärvi et al. (2020a) and Savijärvi and Harri (2021). That adsorption scheme is applied here. The main features of the Martian water cycle may be successfully reproduced by the climate models. Surface observations at various locations as well as several model simulations have suggested that the near-surface moisture cycle on a diurnal timescale is dominated by adsorption–desorption and/or salt hydration (e.g., Zent, 2014; Savijärvi et al., 2015, 2016, 2018, 2019a, 2020a; Savijärvi and Harri, 2021; Fischer et al., 2019).
In this study, we perform an extensive sensitivity analysis of the 1-D column model and focus on parameters whose sensitivity has not been studied before. These include surface temperature and pressure, dust optical depth (τ), and column precipitable water content (PWC). The structure of the model used in this study and the configuration of the analysis are described in Sect. 2. The results are presented and analyzed in Sect. 3. Finally, the results are discussed and summarized in Sect. 4.
2.1 Structure of the column model
The 1-D column model, used here at the MSL site, is horizontally homogeneous and hydrostatic; therefore, it does not include advections. Numerical calculations are performed in a column, which includes 29 grid points from the surface up to 50 km (the lowest grid points being at 0, 0.3, 0.7, 1.6, 3.7, 8.5, and 20 m above the surface). The predicted quantities are horizontal wind components, potential temperature, and mass mixing ratios of water vapor and ice. In this study, the model's water vapor mass mixing ratios are converted to volume mixing ratios (VMRs). The model and its mathematical formulations are described in Savijärvi (1999), and the radiation scheme was tested and modified in Savijärvi et al. (2004) and Savijärvi et al. (2005). In this study, we use the latest version of the column model, so the model is briefly summarized here.
The turbulence scheme is described using a first-order closure, following the Blackadar approach (Blackadar, 1962) with the asymptotic mixing length of 300 m. Diffusion coefficients depend on the local stability functions and wind shear. These stability functions are based on the Monin–Obukhov similarity theory, depending on the local bulk Richardson number. In unstable conditions, the stability function is based on the suggestion by Delage and Girard (1992), while in other conditions, the function is based on Earth observations at midlatitudes and over the Arctic sea ice (Savijärvi and Määttänen, 2010). The Monin–Obukhov similarity theory is used for the surface layer and the surface transfer coefficients are defined with the same stability functions as above the lowest model layer. These stability functions depend on the height as the bulk Richardson number depends on the buoyancy and wind shear (Louis, 1979; Stull, 1988).
CO2, water vapor, and dust are taken into account in the radiation scheme (Savijärvi et al., 2005). An improved delta-discrete-ordinate two-stream (iDD) method is used for the dust in the shortwave scheme. The dust is assumed to be well-mixed, with a single-scattering albedo of 0.9 and an asymmetry parameter of 0.7. The amount of airborne dust is described by the visible dust optical depth (τ) at a wavelength of 0.88 µm. The CO2 absorption in the shortwave scheme is based on the parameterization used by Manabe and Wetherald (1967). The CO2 absorption also takes into account the radiation reflected from the surface. The Rayleigh scattering and trace gases (O2, O3, CO) are not taken into account as their effect is extremely small based on the spectrum-resolving model (SRM) results in Savijärvi et al. (2005).
The longwave radiation scheme uses a fast broadband emissivity approach. The gray-dust approximation (with different values of the dust ratio for upwelling and downwelling fluxes) is used for the dust (Savijärvi et al., 2004). Water vapor and ice also interact with the radiation and are transported by the turbulence. The amount of water vapor in the atmosphere is described by the column precipitable water content (PWC).
The diffusion equation (Savijärvi, 1995), driven by the predicted ground heat flux, is used to predict the soil temperature at eight subsurface levels. The soil moisture is modeled as in Savijärvi et al. (2016, 2019a, b, 2020a) and Savijärvi and Harri (2021), taking into account molecular diffusion together with adsorption at the same levels as the soil temperature. The adsorption isotherm from Jakosky et al. (1997) is currently used in the model. Condensation to fog and boundary layer clouds are allowed but did not occur in any of the present integrations due to the fairly dry equatorial Gale environment.
2.2 Configuration of the analysis
The REMS instrument, on board the MSL, measures pressure (P), relative humidity (RH), and temperature (T) at the rate of one sample per second for first 5 min of each hour at an altitude of about 1.6 m. In this study, we use the median of the first four hourly measurements of RH to remove the warming effect of the sensor heads (Harri et al., 2014a) and the hourly 5 min average of T measurements to remove turbulence. Here we use median of the last 20 measurements of P as the stable sensor (LL type) needs a long warm-up time (Harri et al., 2014b). The water vapor volume mixing ratio (VMR) values are derived from the observed P, RH, and T. The VMR is obtained via , where esat(T) is the saturation water vapor pressure over ice as in Savijärvi et al. (2016).
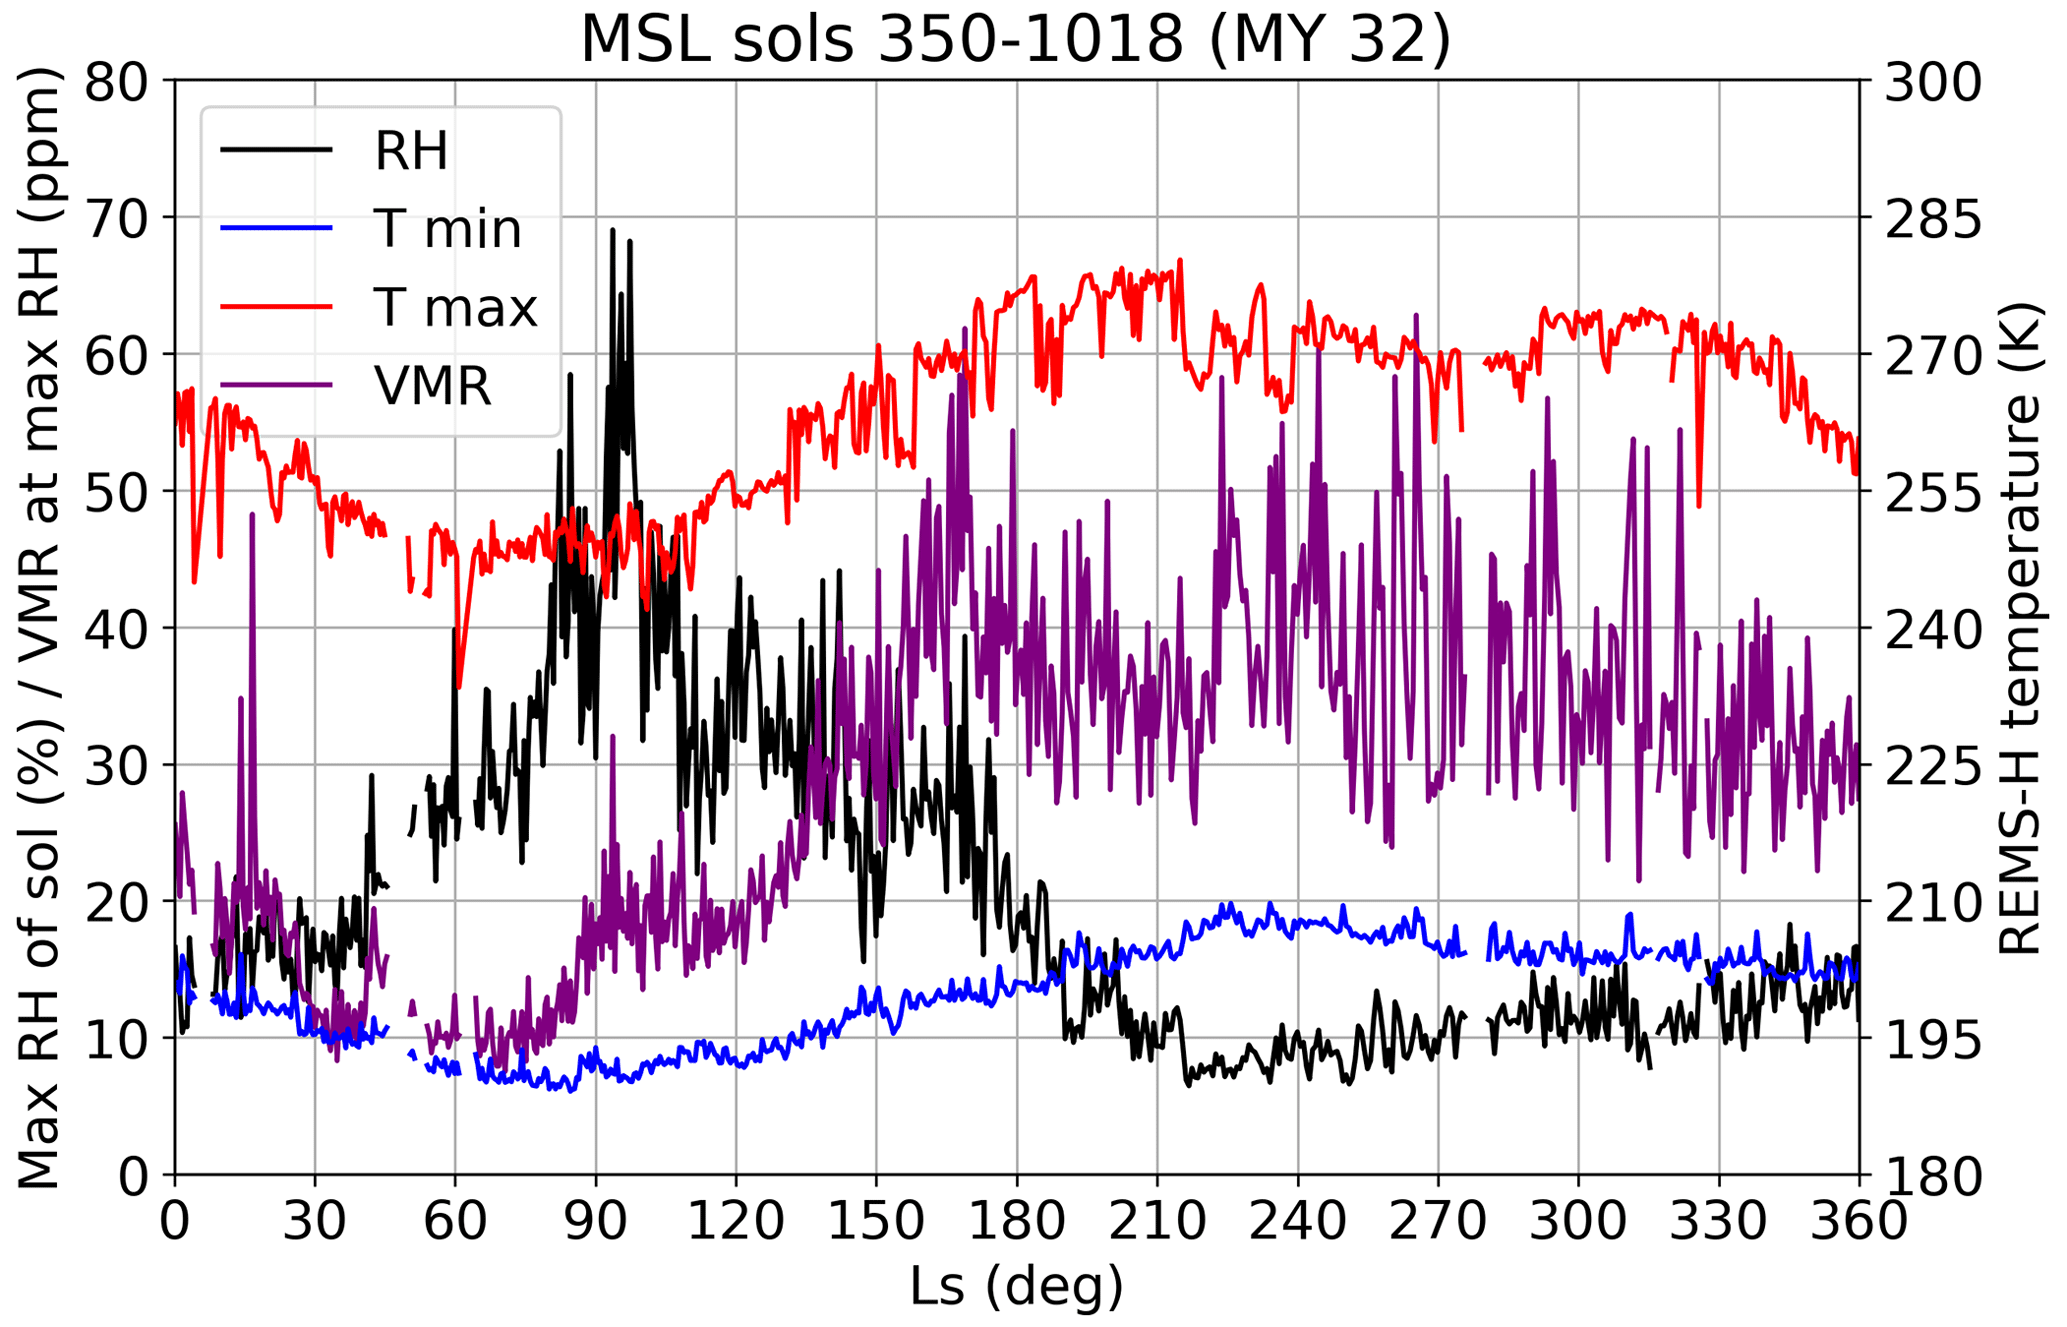
Figure 2Maximum relative humidity (RH) of sol from REMS-H (black) and the derived volume mixing ratio (VMR) at max RH (purple), together with maximum (red) and minimum (blue) temperatures from REMS-H during Martian year (MY) 32.
The REMS-H is the most accurate at the maximum RH, which typically occurs at night due to much lower temperatures compared to the daytime. Thus, Fig. 2 shows the REMS-H maximum RH (black) and derived VMR (purple) during Martian year (MY) 32 (MSL sols 350–1018). Figure 2 also displays the daily maximum (red) and minimum (blue) REMS-H temperatures.
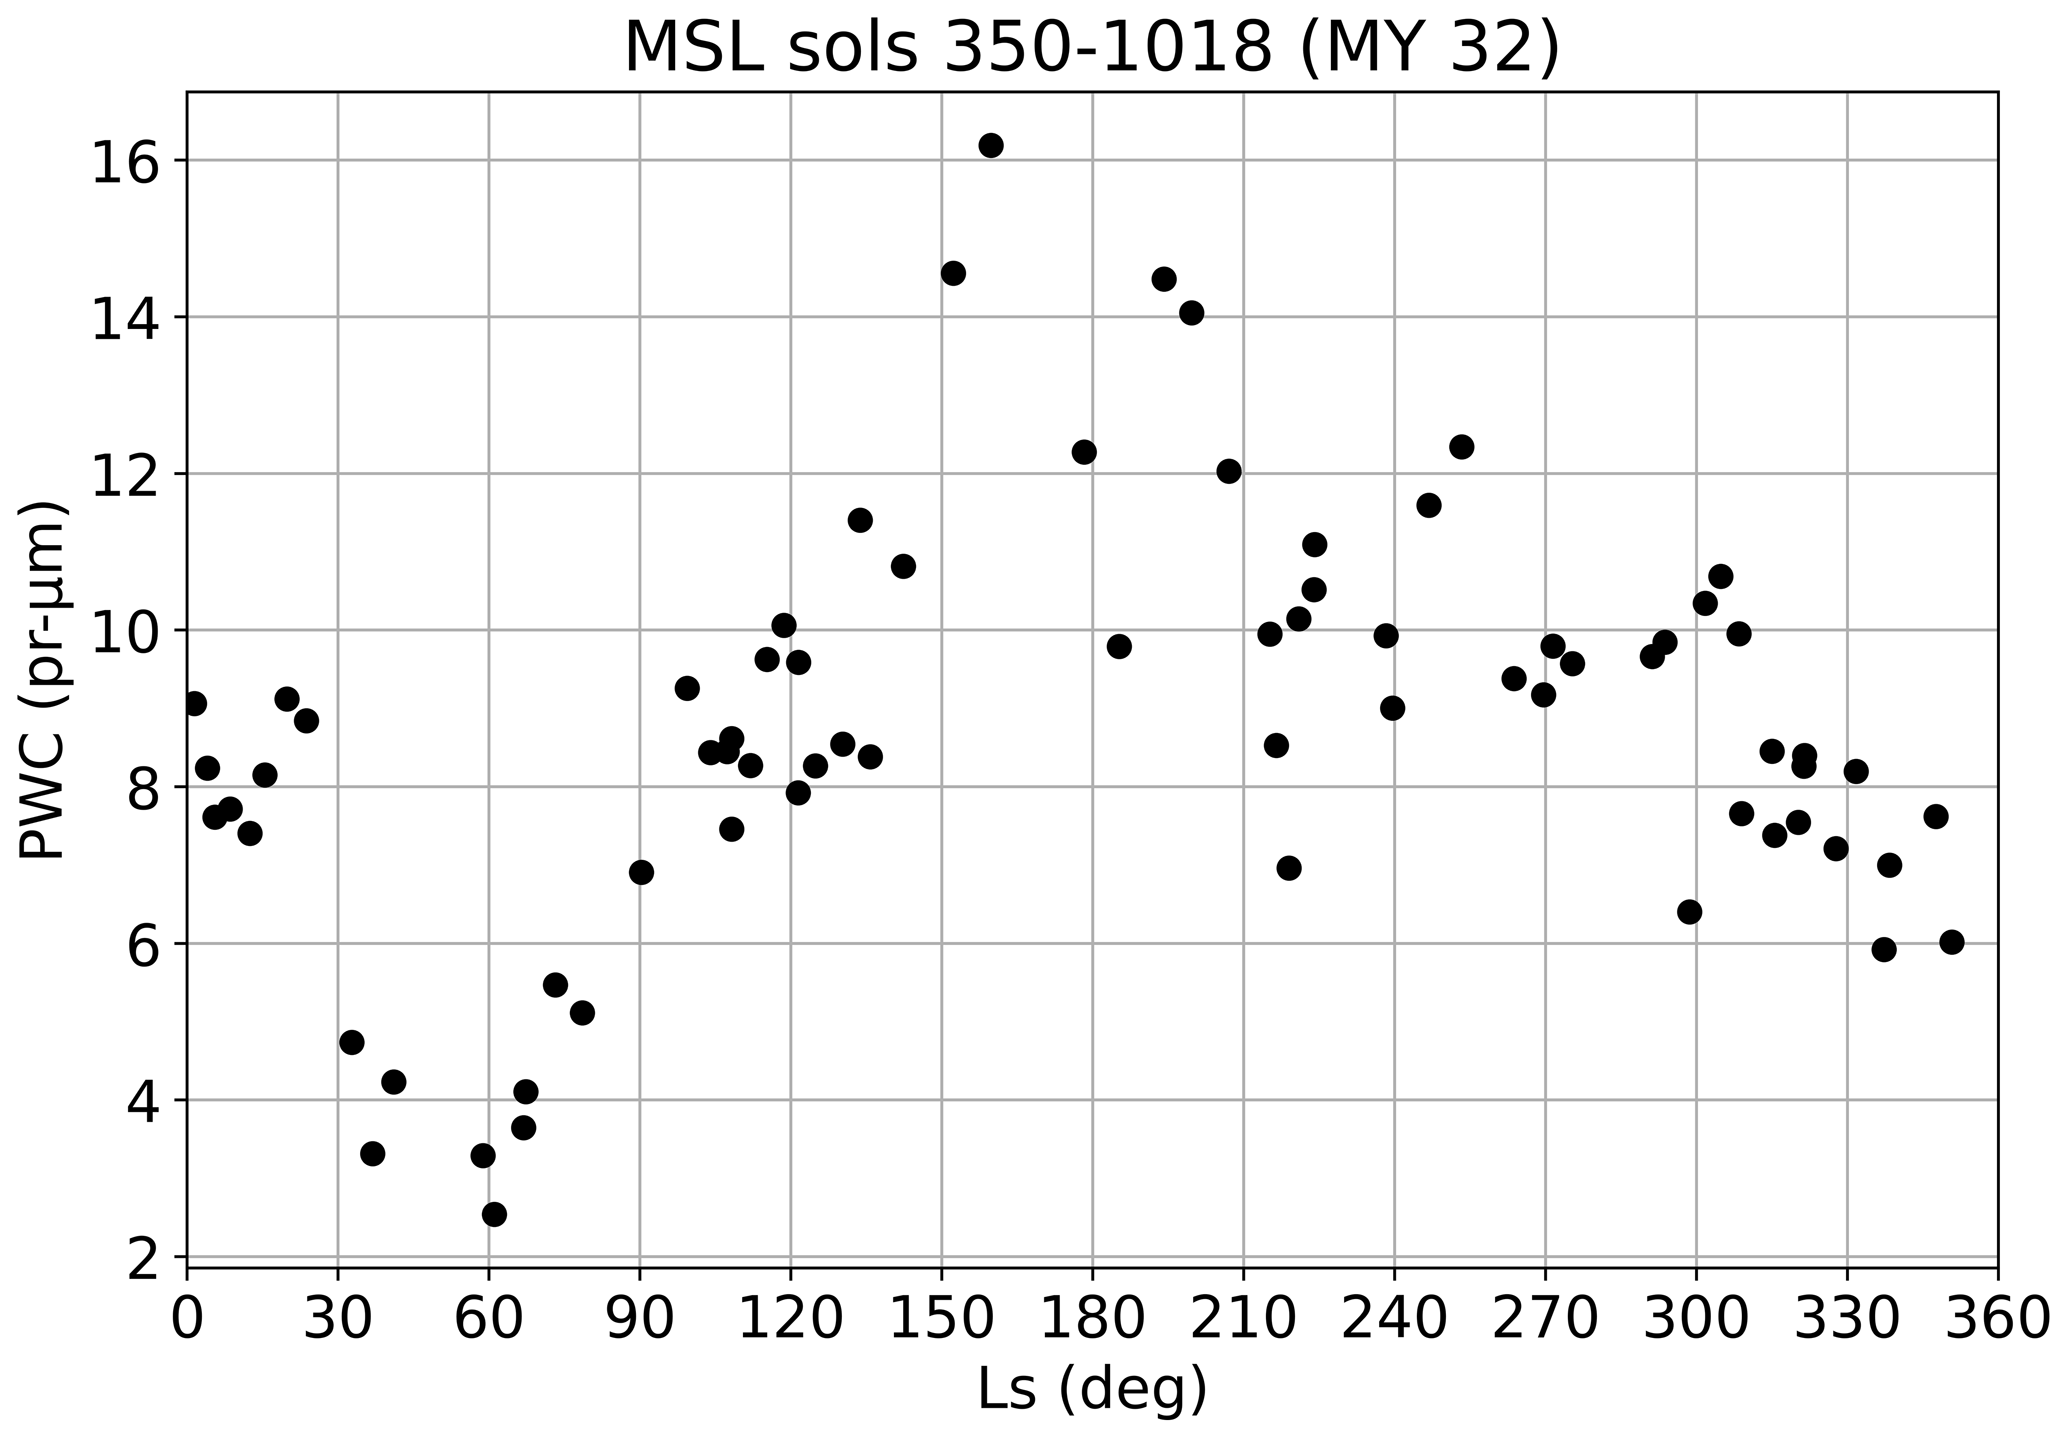
Figure 3MSL ChemCam column precipitable water content (PWC) retrievals during Martian year (MY) 32.
The warm and cool seasons are clearly displayed in Fig. 2. The coldest period occurs at around Ls 60–120°, while the warm perihelion period is at around Ls 220°–280°. In Fig. 2, the daytime maximum near-surface temperatures (red curve) appear to show a small decrease during this period due to the increased amount of airborne dust (Martínez et al., 2017). Lower daytime temperatures due to the increased amount of airborne dust are shown in Sect. 3. The maximum RH values are observed during the coldest time of the year, while the minimum values are during the warmest. The VMR at the maximum RH reaches a minimum around Ls 60–90°. This suggests, together with the Fig. 3 column precipitable water content (PWC) retrievals from the MSL ChemCam during MY 32 (McConnochie et al., 2018), that the atmospheric moisture content at the MSL site and the near-surface temperatures reach a minimum around the Southern Hemisphere winter solstice (Ls 90°).
The column model experiments are performed at the MSL location (4.6° S) during the cool (∼ Ls 90°, MSL sol 543) and warm (∼ Ls 271°, MSL sol 866) seasons in MY 32. The hourly REMS observations, described above, are used to initialize the column model at 00:00 LTST. The model's surface temperature and pressure are initialized with the sol-averaged values, calculated from the hourly REMS-H and REMS-P observations of the previous sol. In this study, we use REMS-H internal temperatures instead of REMS-T air temperatures or REMS-GTS ground temperatures due to additional uncertainties of REMS-T and REMS-GTS measurements. The REMS-T sensor is located only about 0.6 m above the rover deck. Thus, the heating of the rover by solar radiation and by the radioisotope thermoelectric generator (RTG) may affect the air temperature measurements (Martínez et al., 2017). The REMS-GTS measures the ground temperature on a small patch of nearby ground, which may be different from the larger region of ground influencing the atmosphere. In addition, the field of view of the GTS is within the area of the ground heated by thermal radiation from the RTG (Hamilton et al., 2014; Martínez et al., 2017). The temperature profile at the MSL site is initialized from the surface value with a typical lapse rate of 1 K km−1 (Savijärvi et al., 2019a, 2020b), and the pressure profile is calculated hydrostatically from the temperature profile.
The optical depth at 880 nm, τ, is measured with the MSL Mastcam (Lemmon et al., 2024), and the daily mean is used to calculate the model's dust profile, which is kept constant during the simulation. The model's dust profile is well-mixed and given by , where τ is the visible optical depth at the surface, z is the height above the surface, and H is the scale height of 11 km.
MSL ChemCam passive daytime sky scans (McConnochie et al., 2018) are used to initialize the moisture profile of the model. ChemCam measurements (single values for both sols) are used to estimate the column precipitable water content (PWC). The PWC is
where ps is the REMS-P surface pressure, q is the water vapor mass mixing ratio, and g is the acceleration of gravity. The model's moisture profile (q) is initially constant with height and is calculated from the estimated PWC and ps using Eq. (1).
The model is initialized here with albedo of 0.18, surface roughness length of 1 cm, geostrophic wind of 10 m s−1, thermal inertia of 300 , and porosity of 30 %. These soil properties are typical for the regolith along the Curiosity track during MY 32 (e.g., Vasavada et al., 2017). The model was then run for 3 sols as temperatures, winds, and moisture repeat their diurnal cycles after the 2-sol spin-up period.
Since the atmosphere of Mars is strongly driven by the solar radiation, we choose two opposite seasons (Ls 90° and Ls 271°) in our sensitivity experiments. As radiation is extremely important in the dynamics of the thin Martian atmosphere, airborne dust is also a key element in atmospheric models, as it absorbs solar radiation and emits thermal radiation. Since previous studies suggest a significant effect of airborne dust in the column model simulations (e.g., Savijärvi et al., 2005), the amount of dust in the atmosphere, τ, is one of the parameters of our experiments. The PWC is chosen because it determines the amount of water vapor in the atmosphere and is thus a very important model initialization parameter for the diurnal water cycle, as observed by earlier column model studies (e.g., Savijärvi et al., 2016, 2019a). Apart from that, we have quite a few observations about the amount of water vapor in the atmosphere. Therefore, it is important to study how sensitive the column model is to the initial value of PWC if we do not have direct measurements. The surface temperature is an essential variable predicted by the model and is therefore one of our parameters. The diurnal surface pressure cycle is not predicted in the model. However, the initialization of surface pressure is necessary to calculate the pressure profile, which is further used in the model calculations. Hence, we choose surface pressure as the last parameter to estimate the importance of initialization accuracy.
For Ls 90°, the default initial value for τ is 0.45, 6.91 pr µm for PWC, 210.9 K for REMS-H mean temperature, and 862 Pa for REMS-P mean pressure. The corresponding parameters for Ls 271° are 0.88, 9.79 pr µm, 232.9 K, and 911 Pa (compare Figs. 2 and 3).
The reported accuracies of the REMS-P pressure and REMS-H temperature sensors are ± 3.5 Pa (Martínez et al., 2017) and ± 0.1 K (Gómez-Elvira et al., 2012). These REMS-H temperatures are estimated to deviate from the ambient temperatures by at most 1 K (Savijärvi et al., 2015). By contrast, the reported accuracy for the REMS-T is ± 5 K (Martínez et al., 2017) and the accuracy of the ground temperature sensor (GTS) temperatures is affected by a number of environmental variables (Hamilton et al., 2014).
In this study we want to estimate the performance of the model if the initialization is not well-known. As there are lots of data gaps in the measurements, some sols may miss essential observations for determining the sol-averaged T and P. The seasonal pressure cycle is well-known at the MSL site, as there are more than 3000 sols of pressure data. Thus, the sol average pressure can be estimated relatively accurately, even from some other Martian year.
Dust optical depth measurements by the Mastcam have an accuracy of ± 0.03 (Martínez et al., 2017), but there are only 1160 measured values during sols 33–2575. There are even fewer PWC observations, with only 184 ChemCam PWC retrievals available during sols 230–3111. The extremely small number of measurements causes a rather large inaccuracy in the initialization of the model if there are no measurements in the vicinity of the simulated sol. The indicated precision for the ChemCam-retrieved PWC is ± 0.6 pr µm (McConnochie et al., 2018), with values typically on the order of 10 pr µm (see Fig. 3) at the MSL site.
Since we want to see the performance of the model if the initialization is unknown, we choose the sol-averaged surface pressure to vary ± 10 Pa around the default value, whereas the sol-averaged surface temperature is allowed to vary ± 10 K around the default value. In addition, variations of ± 0.3 in τ and ± 3 pr µm in PWC are used in this study. These values are based on the sensor uncertainties but are slightly higher as we do not want to only use the minimum values.
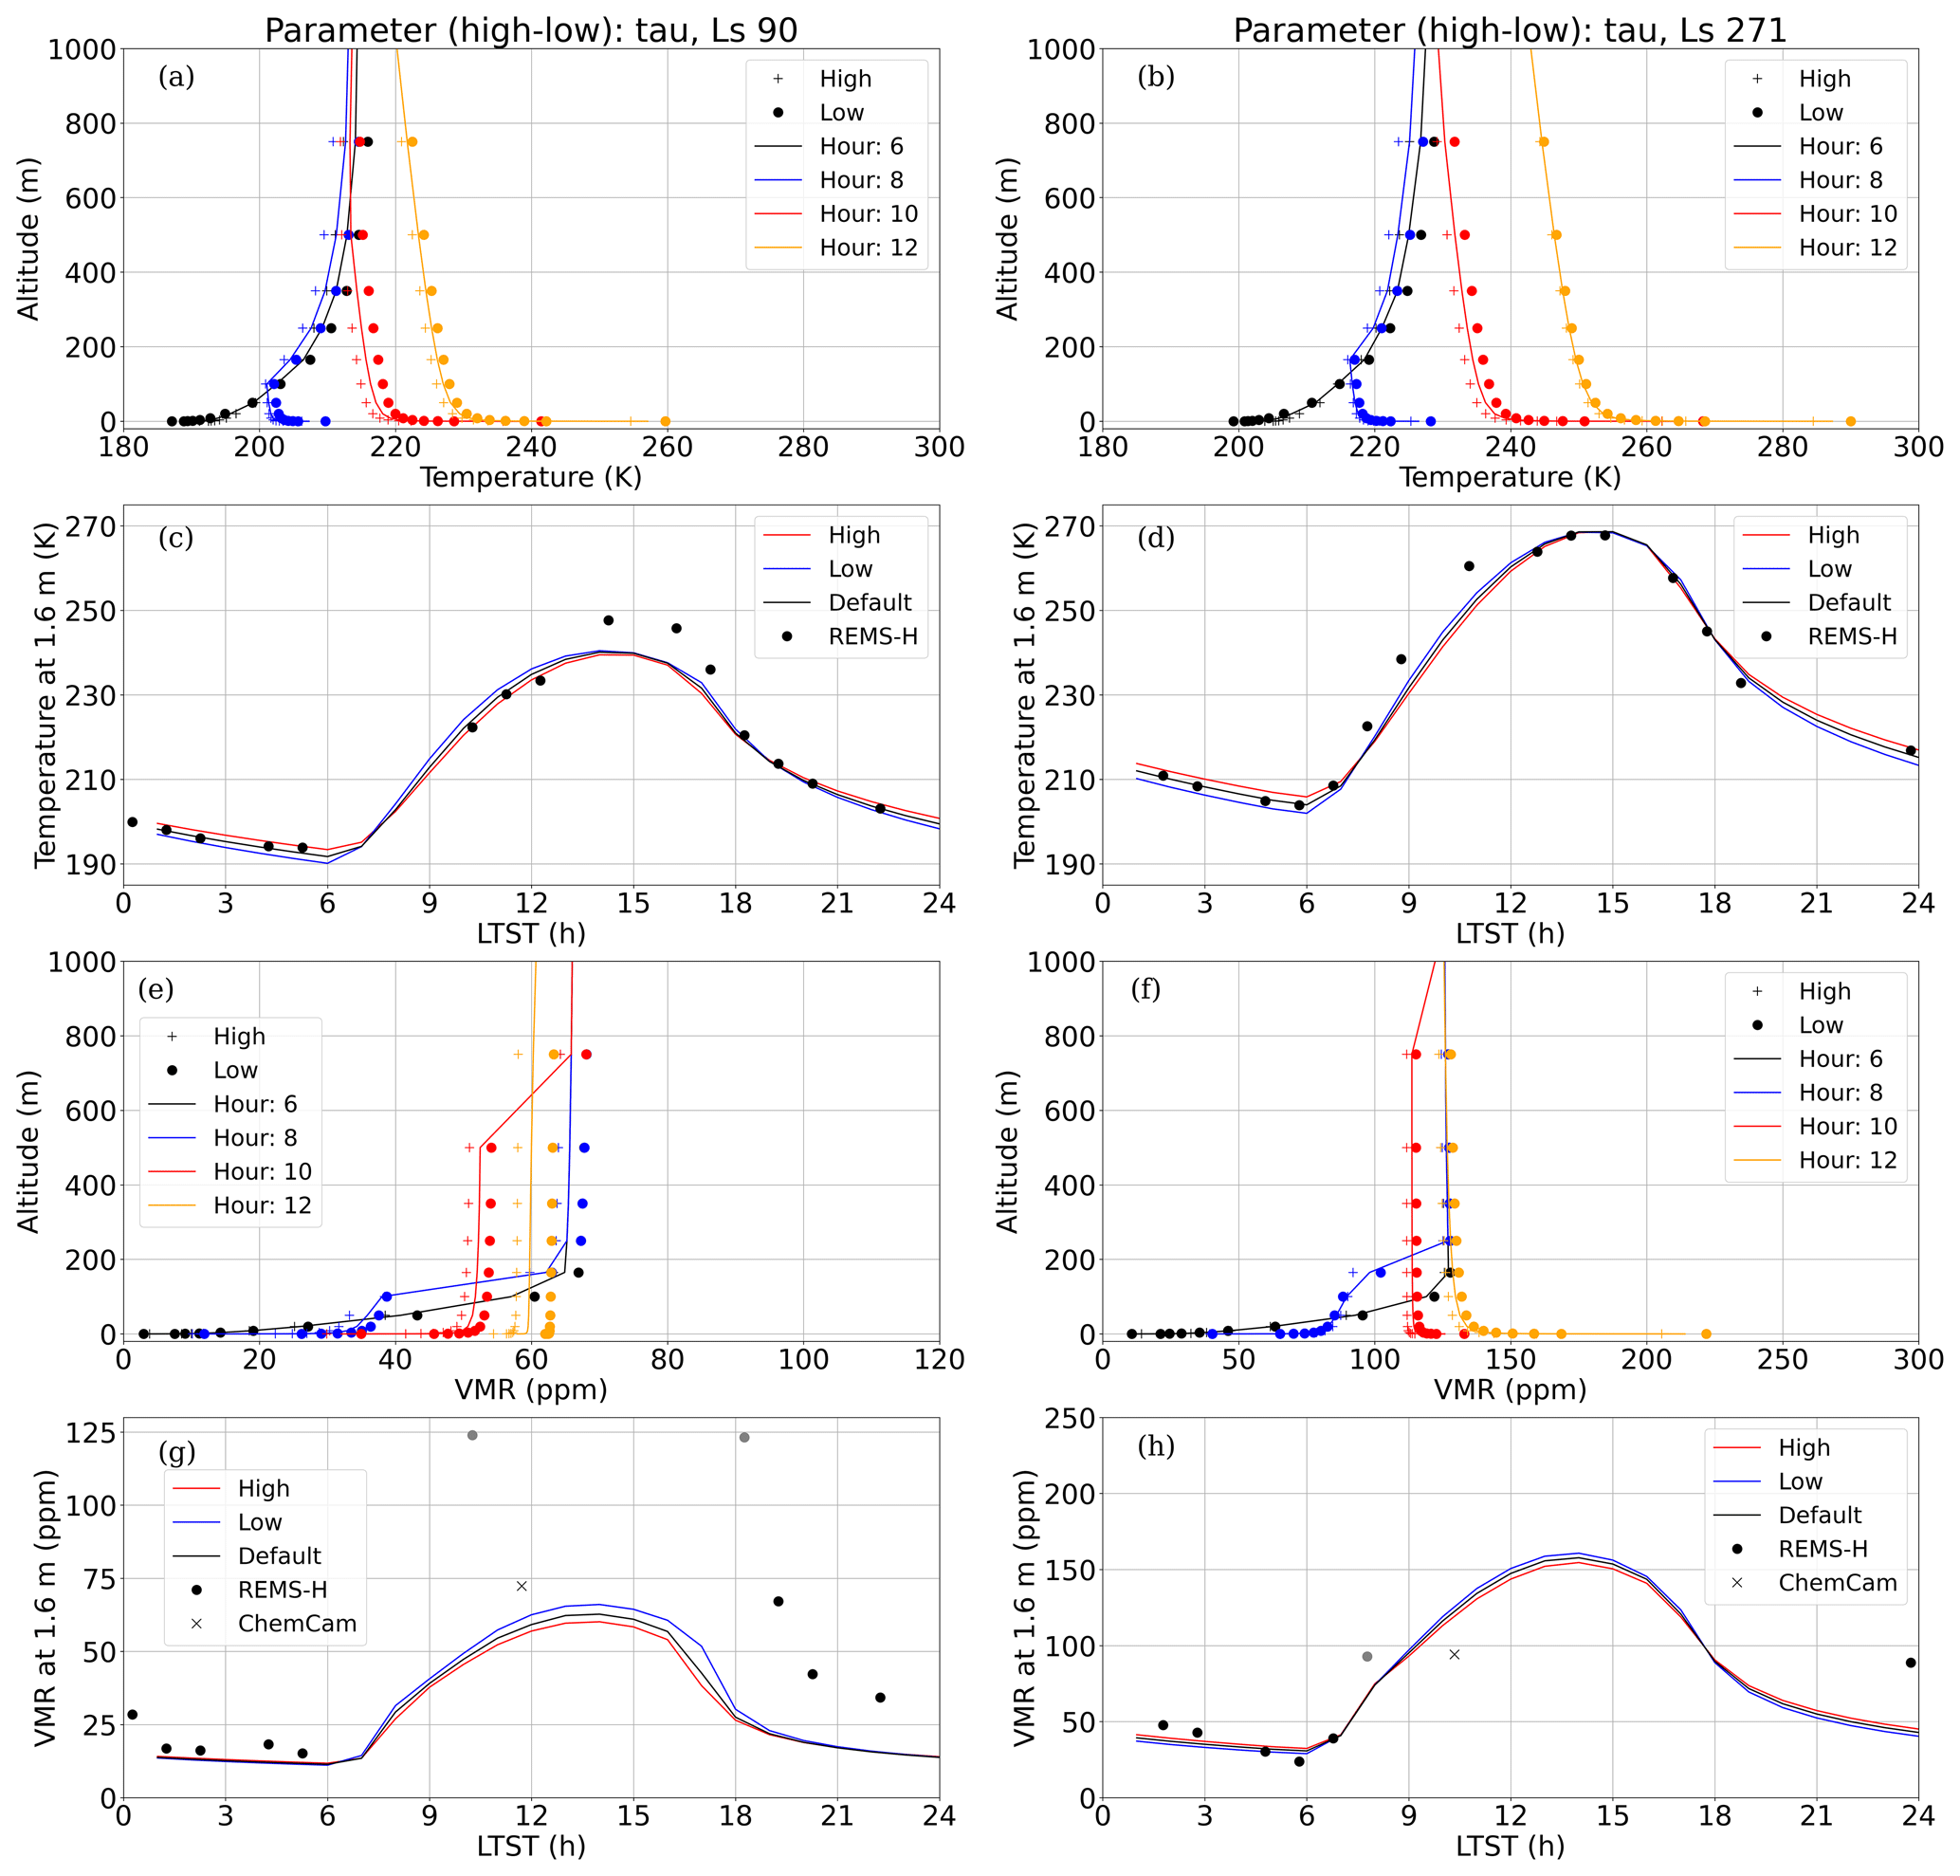
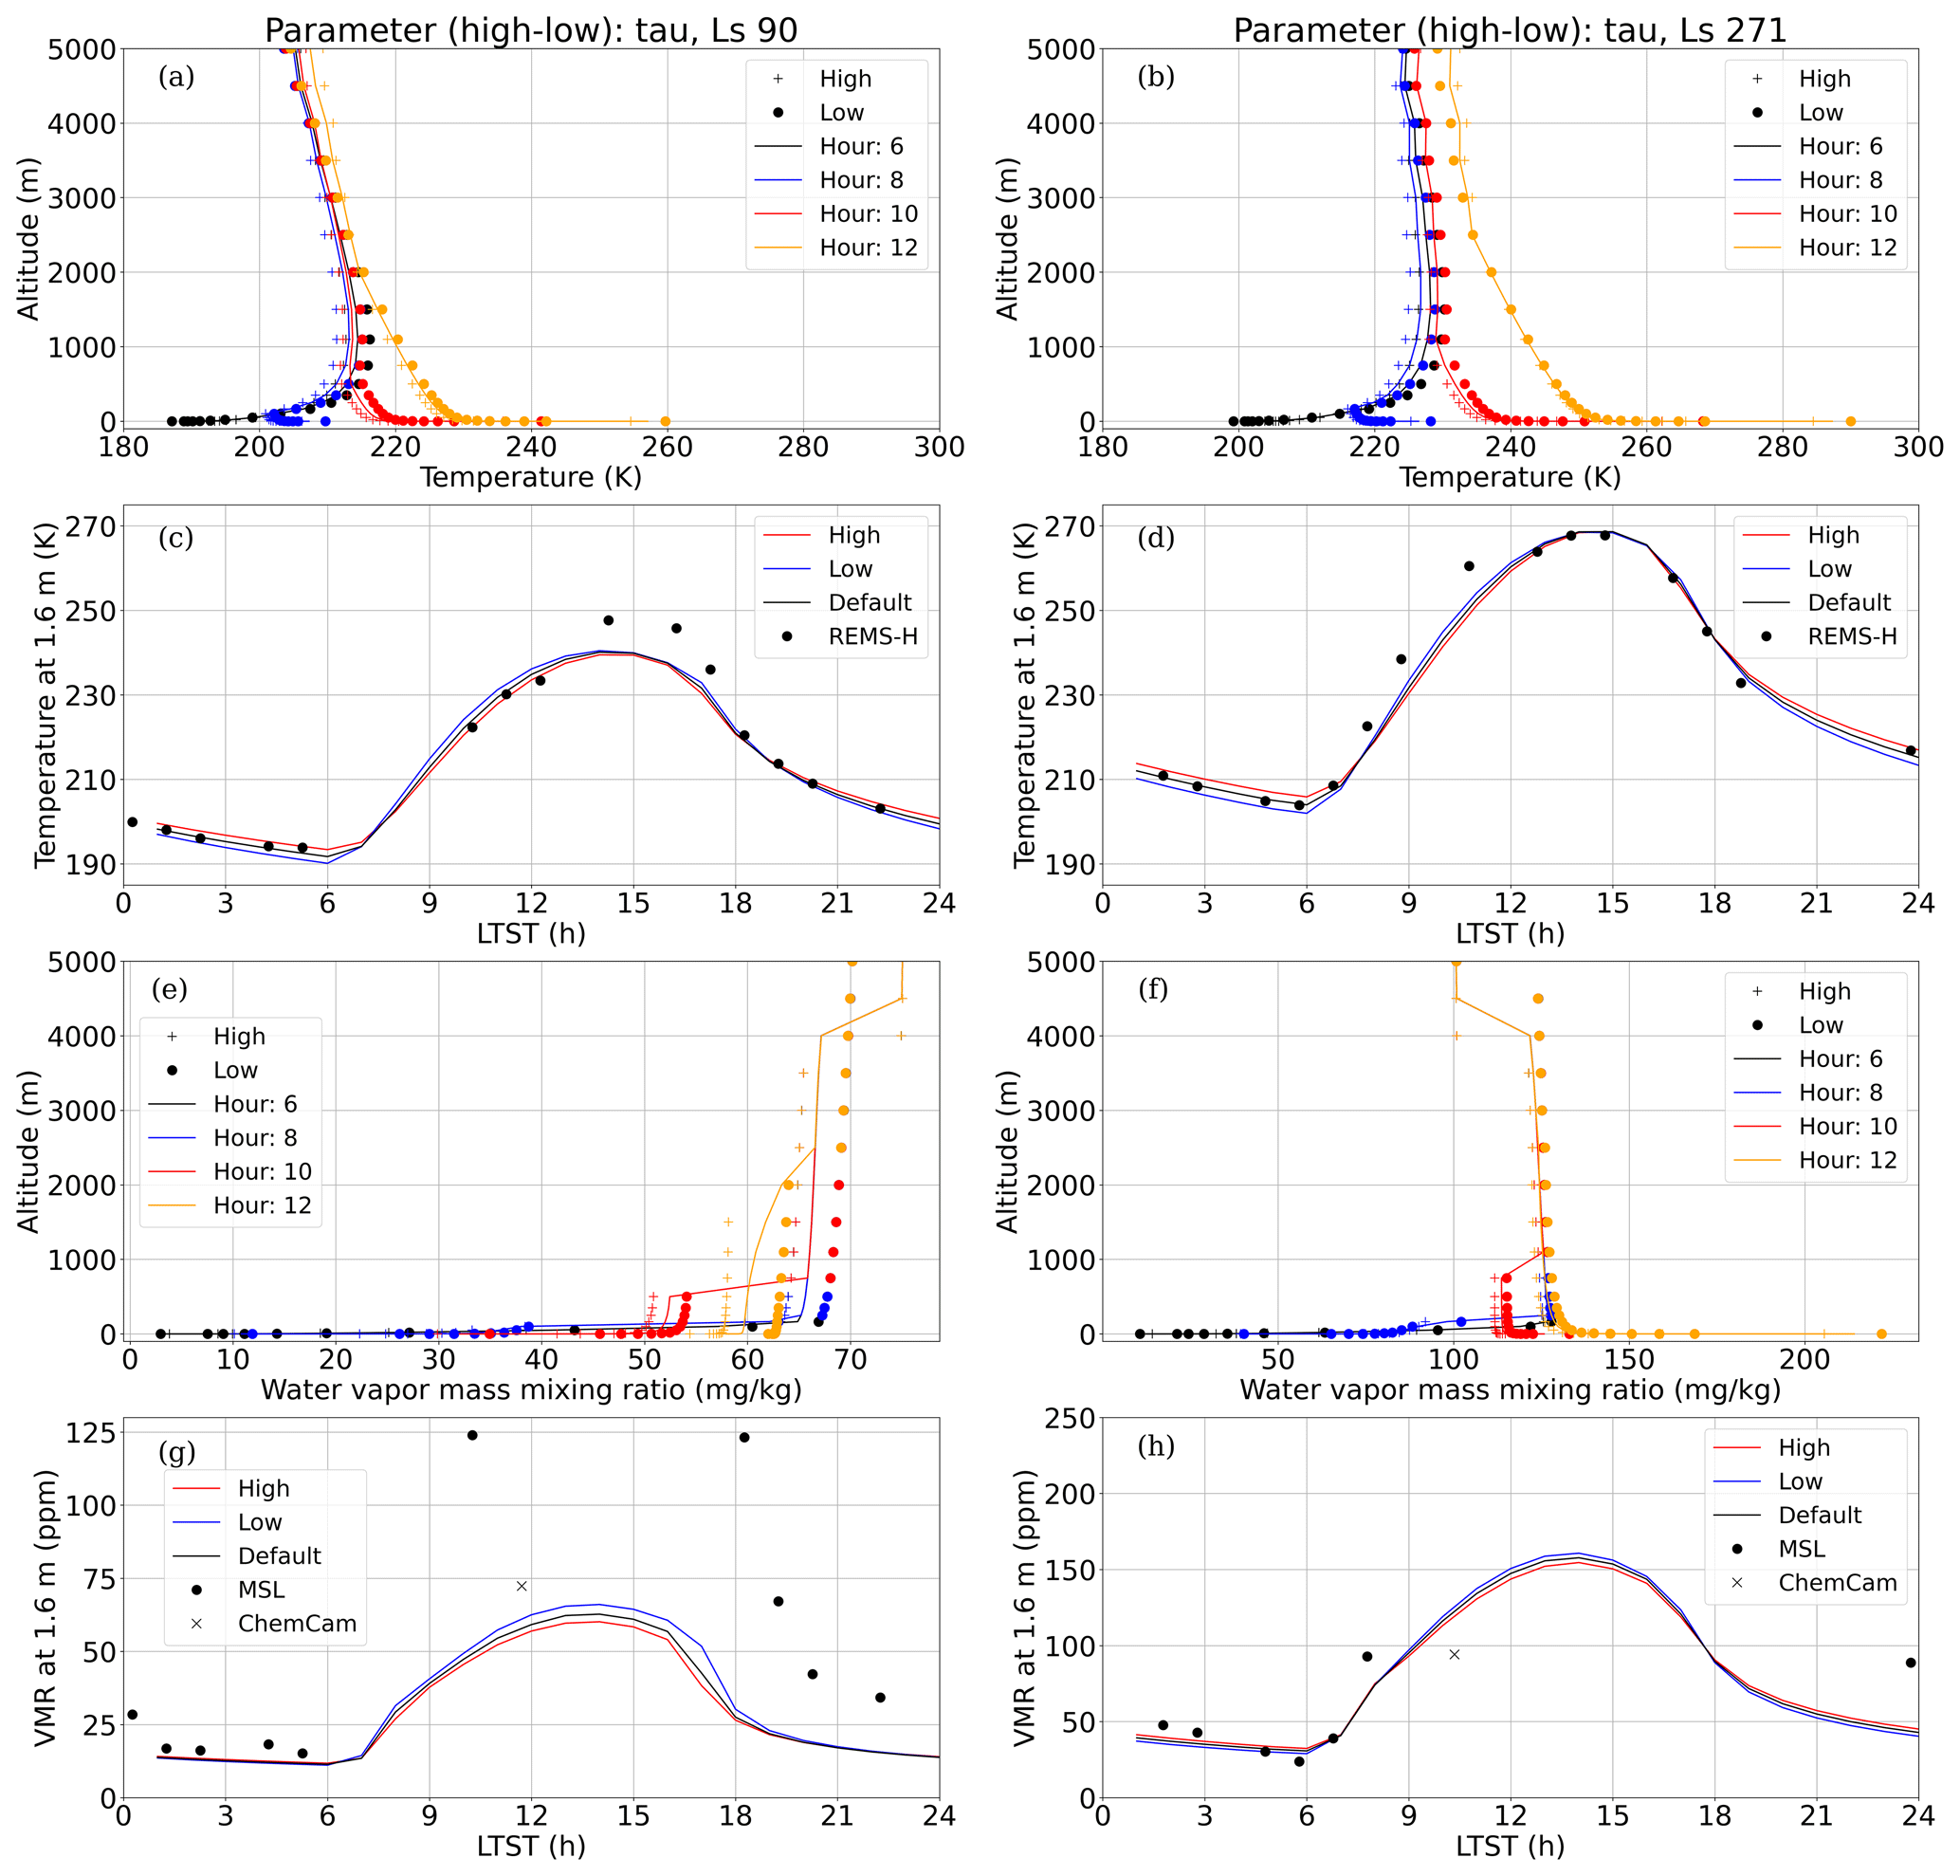
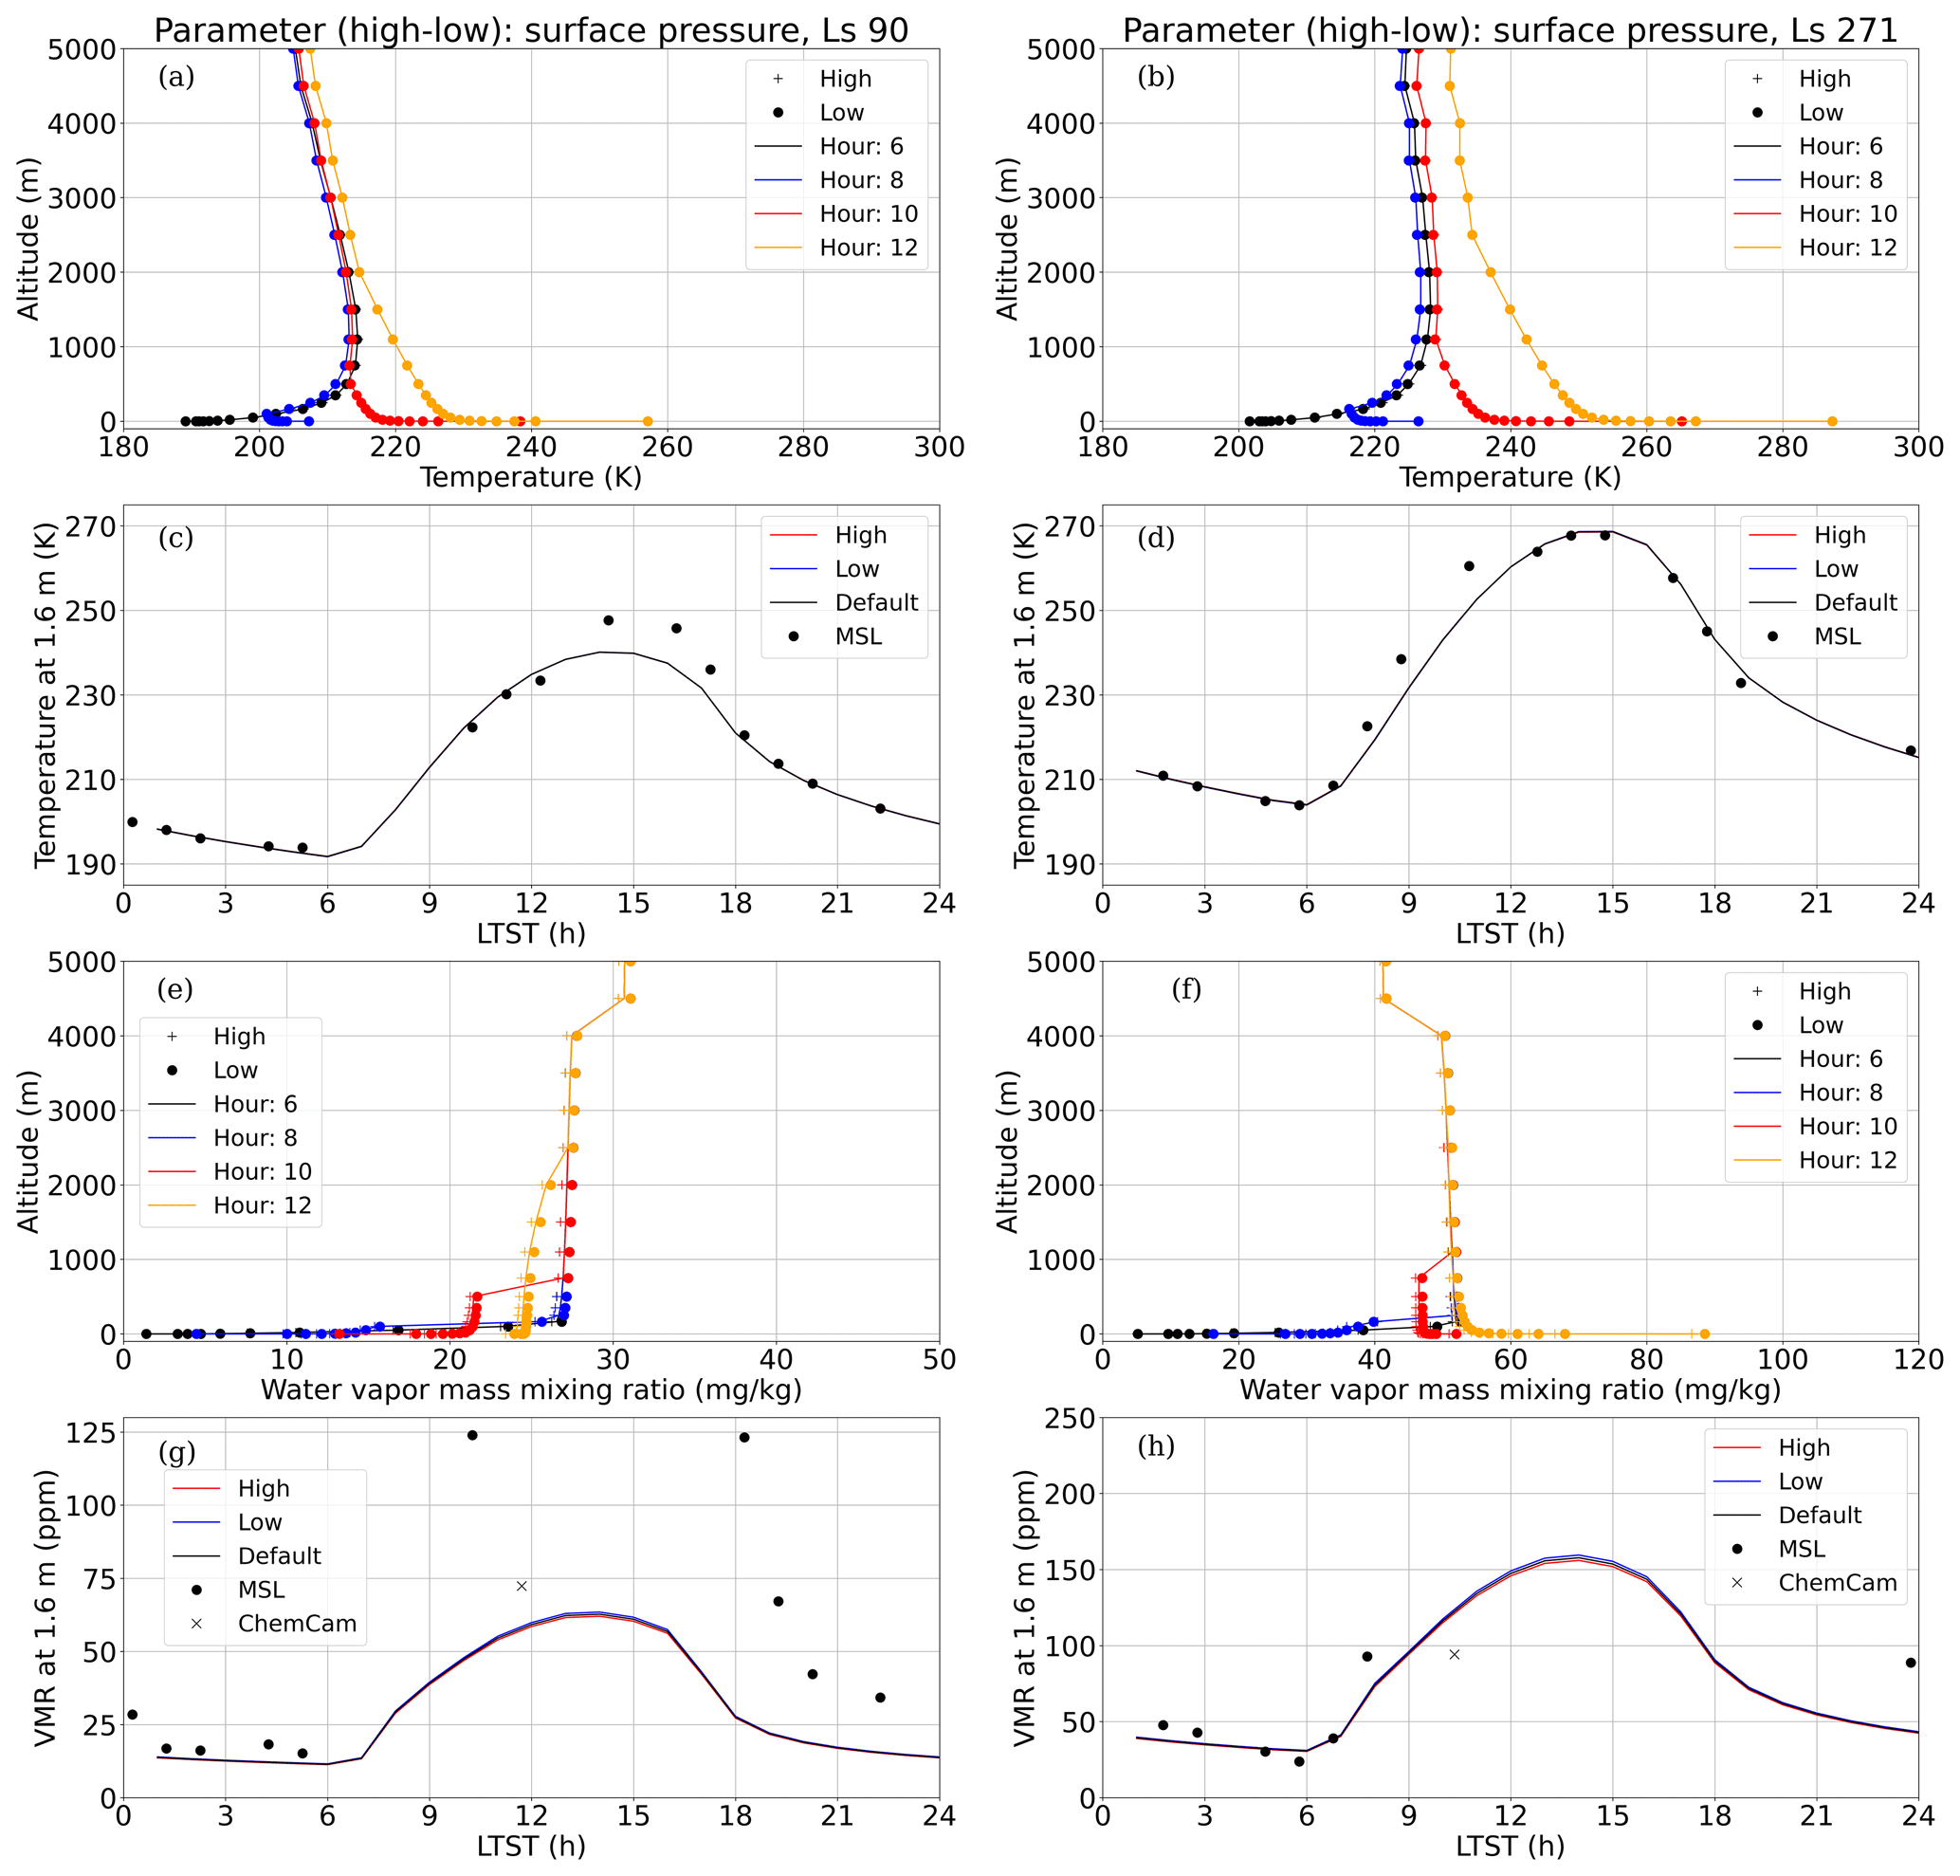
Figure 4Model results with τ being the varying parameter at Ls 90° (a, c, e, g) and at Ls 271° (b, d, f, h). Morning temperature profiles are shown in the top row (a b), near-surface diurnal temperature cycles with hourly REMS-H observations are in the second row (c, d), morning moisture profiles are in the third row (e, f), and diurnal near-surface water vapor VMR cycles with REMS-H-derived values (spheres) and ChemCam observations (X) are in the bottom row (g, h). Profiles at 06:00–12:00 local true solar time include high (+), default (continuous line), and low (spheres) parameter values, with each hour in a different color. Diurnal 1.6 m cycles include model simulations with high (red), default (black), and low (blue) parameter values, together with REMS-H observations. Unreliable REMS-H-derived VMR values are marked as gray spheres.
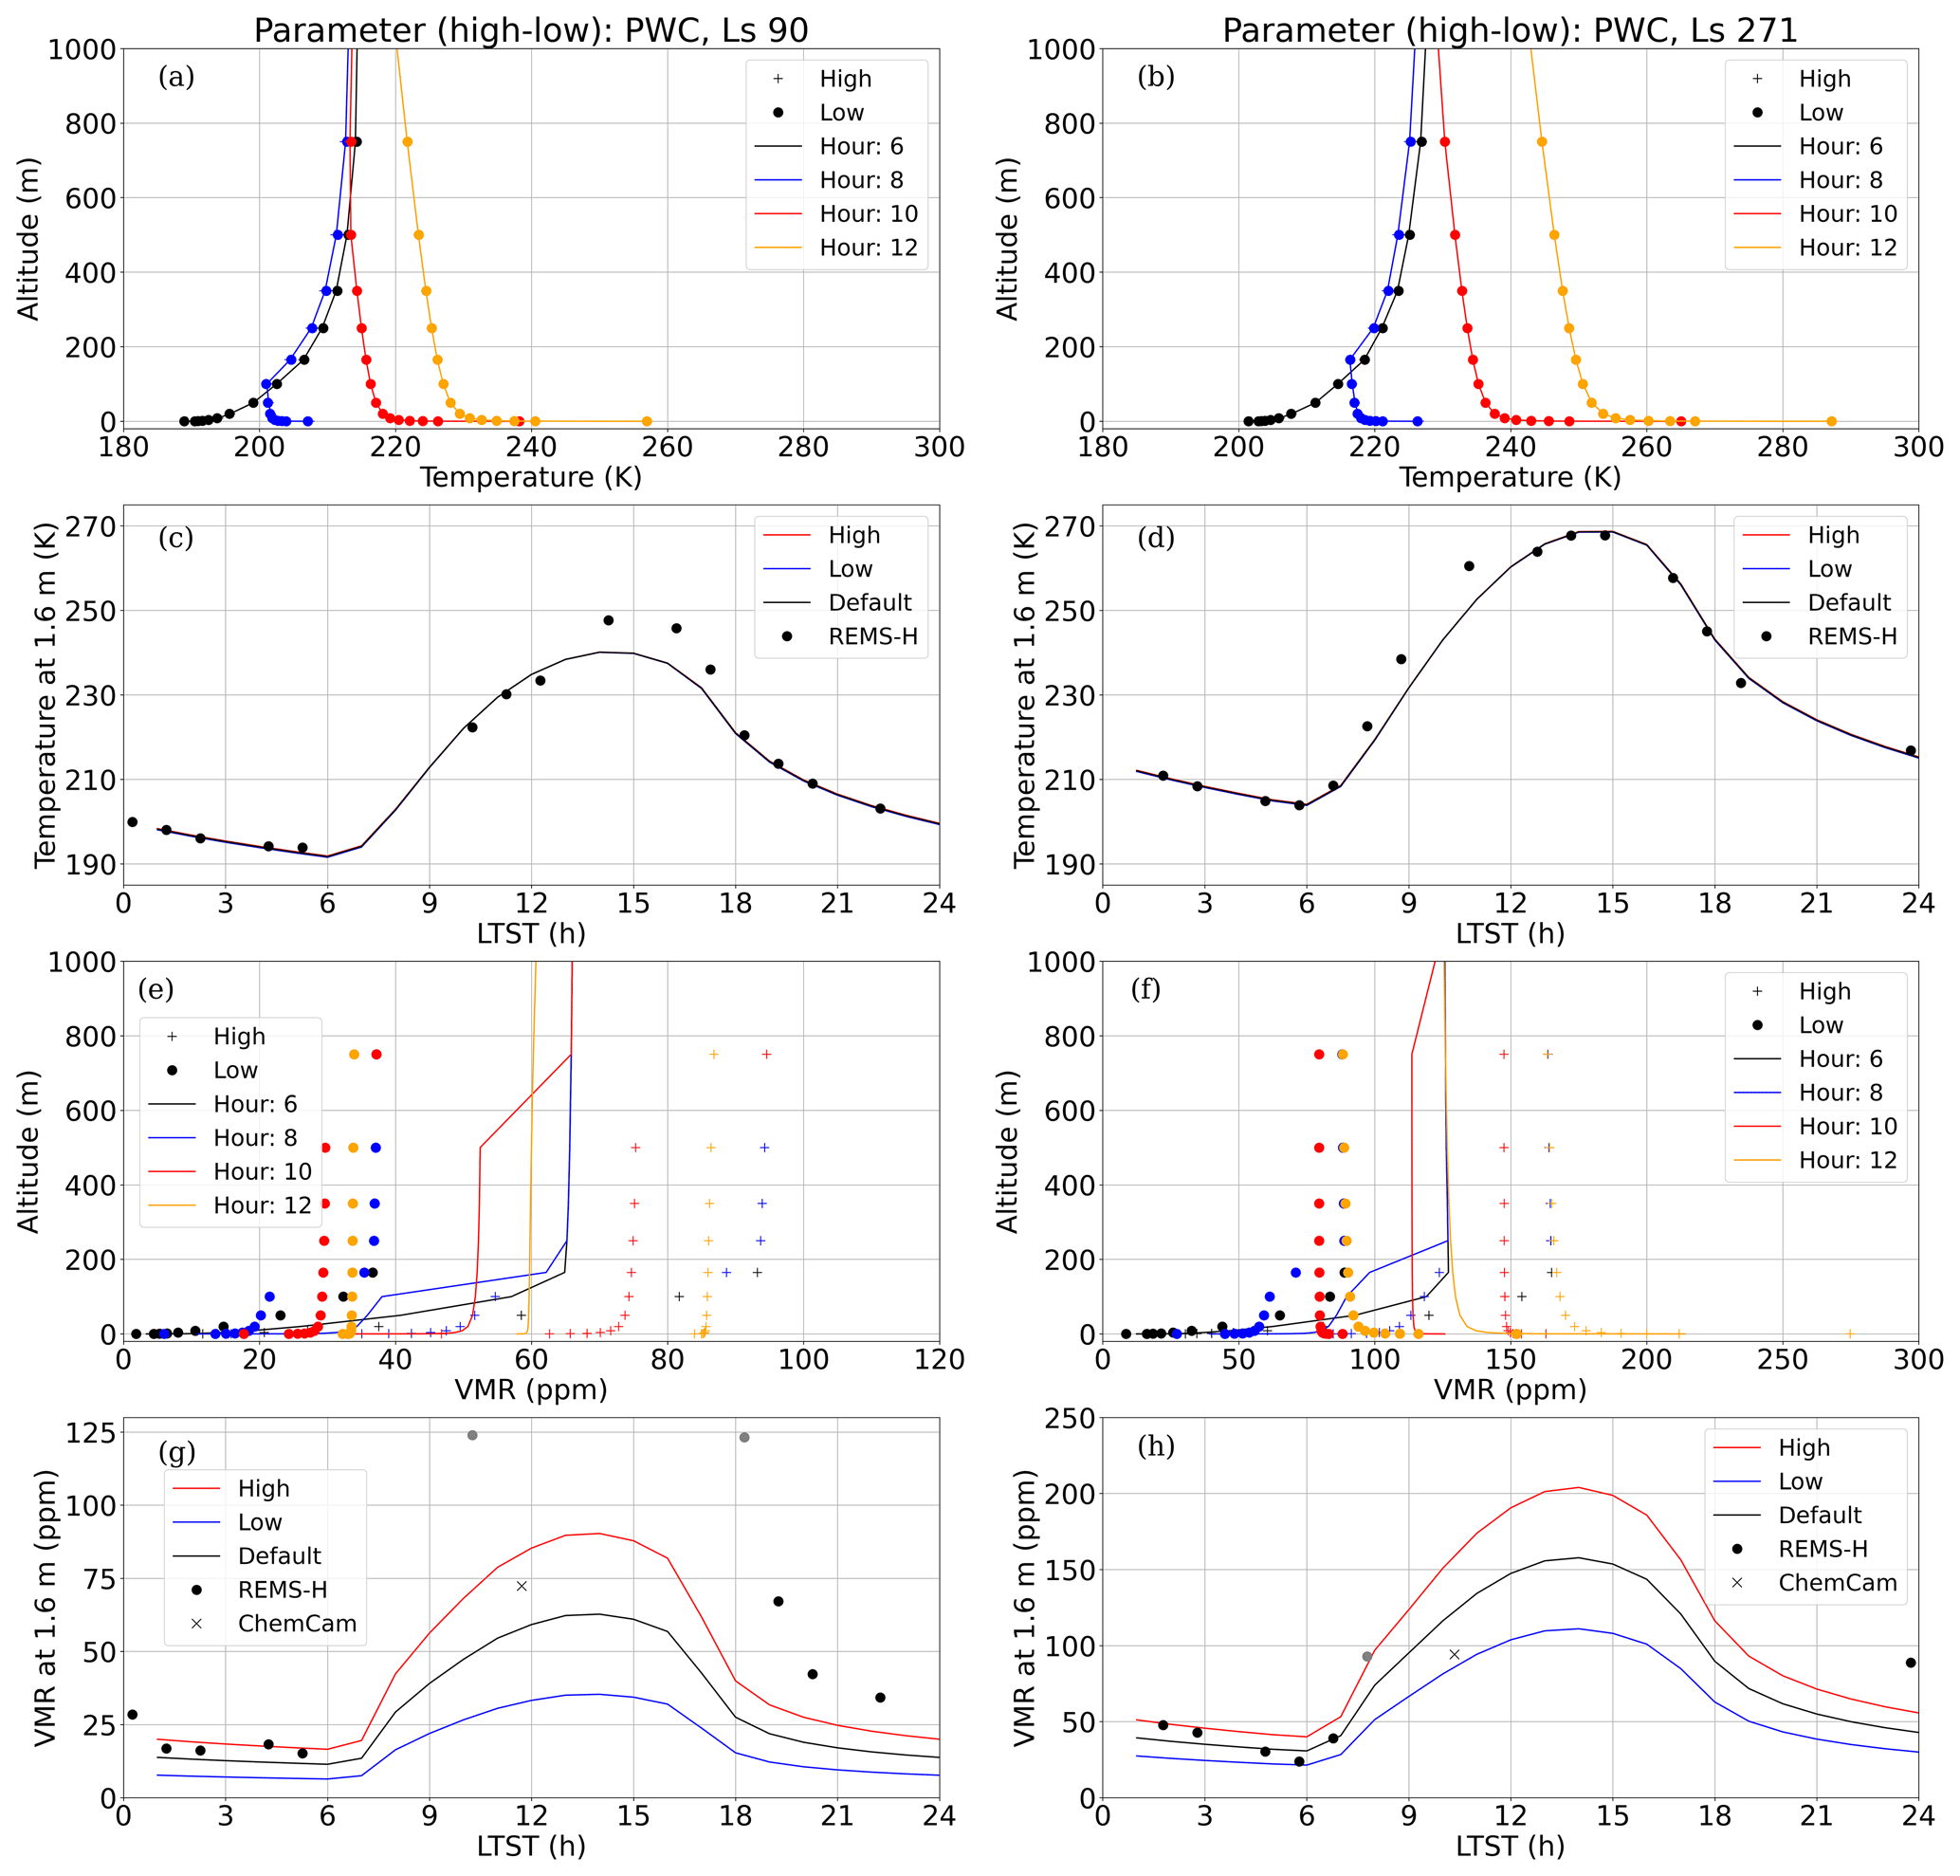
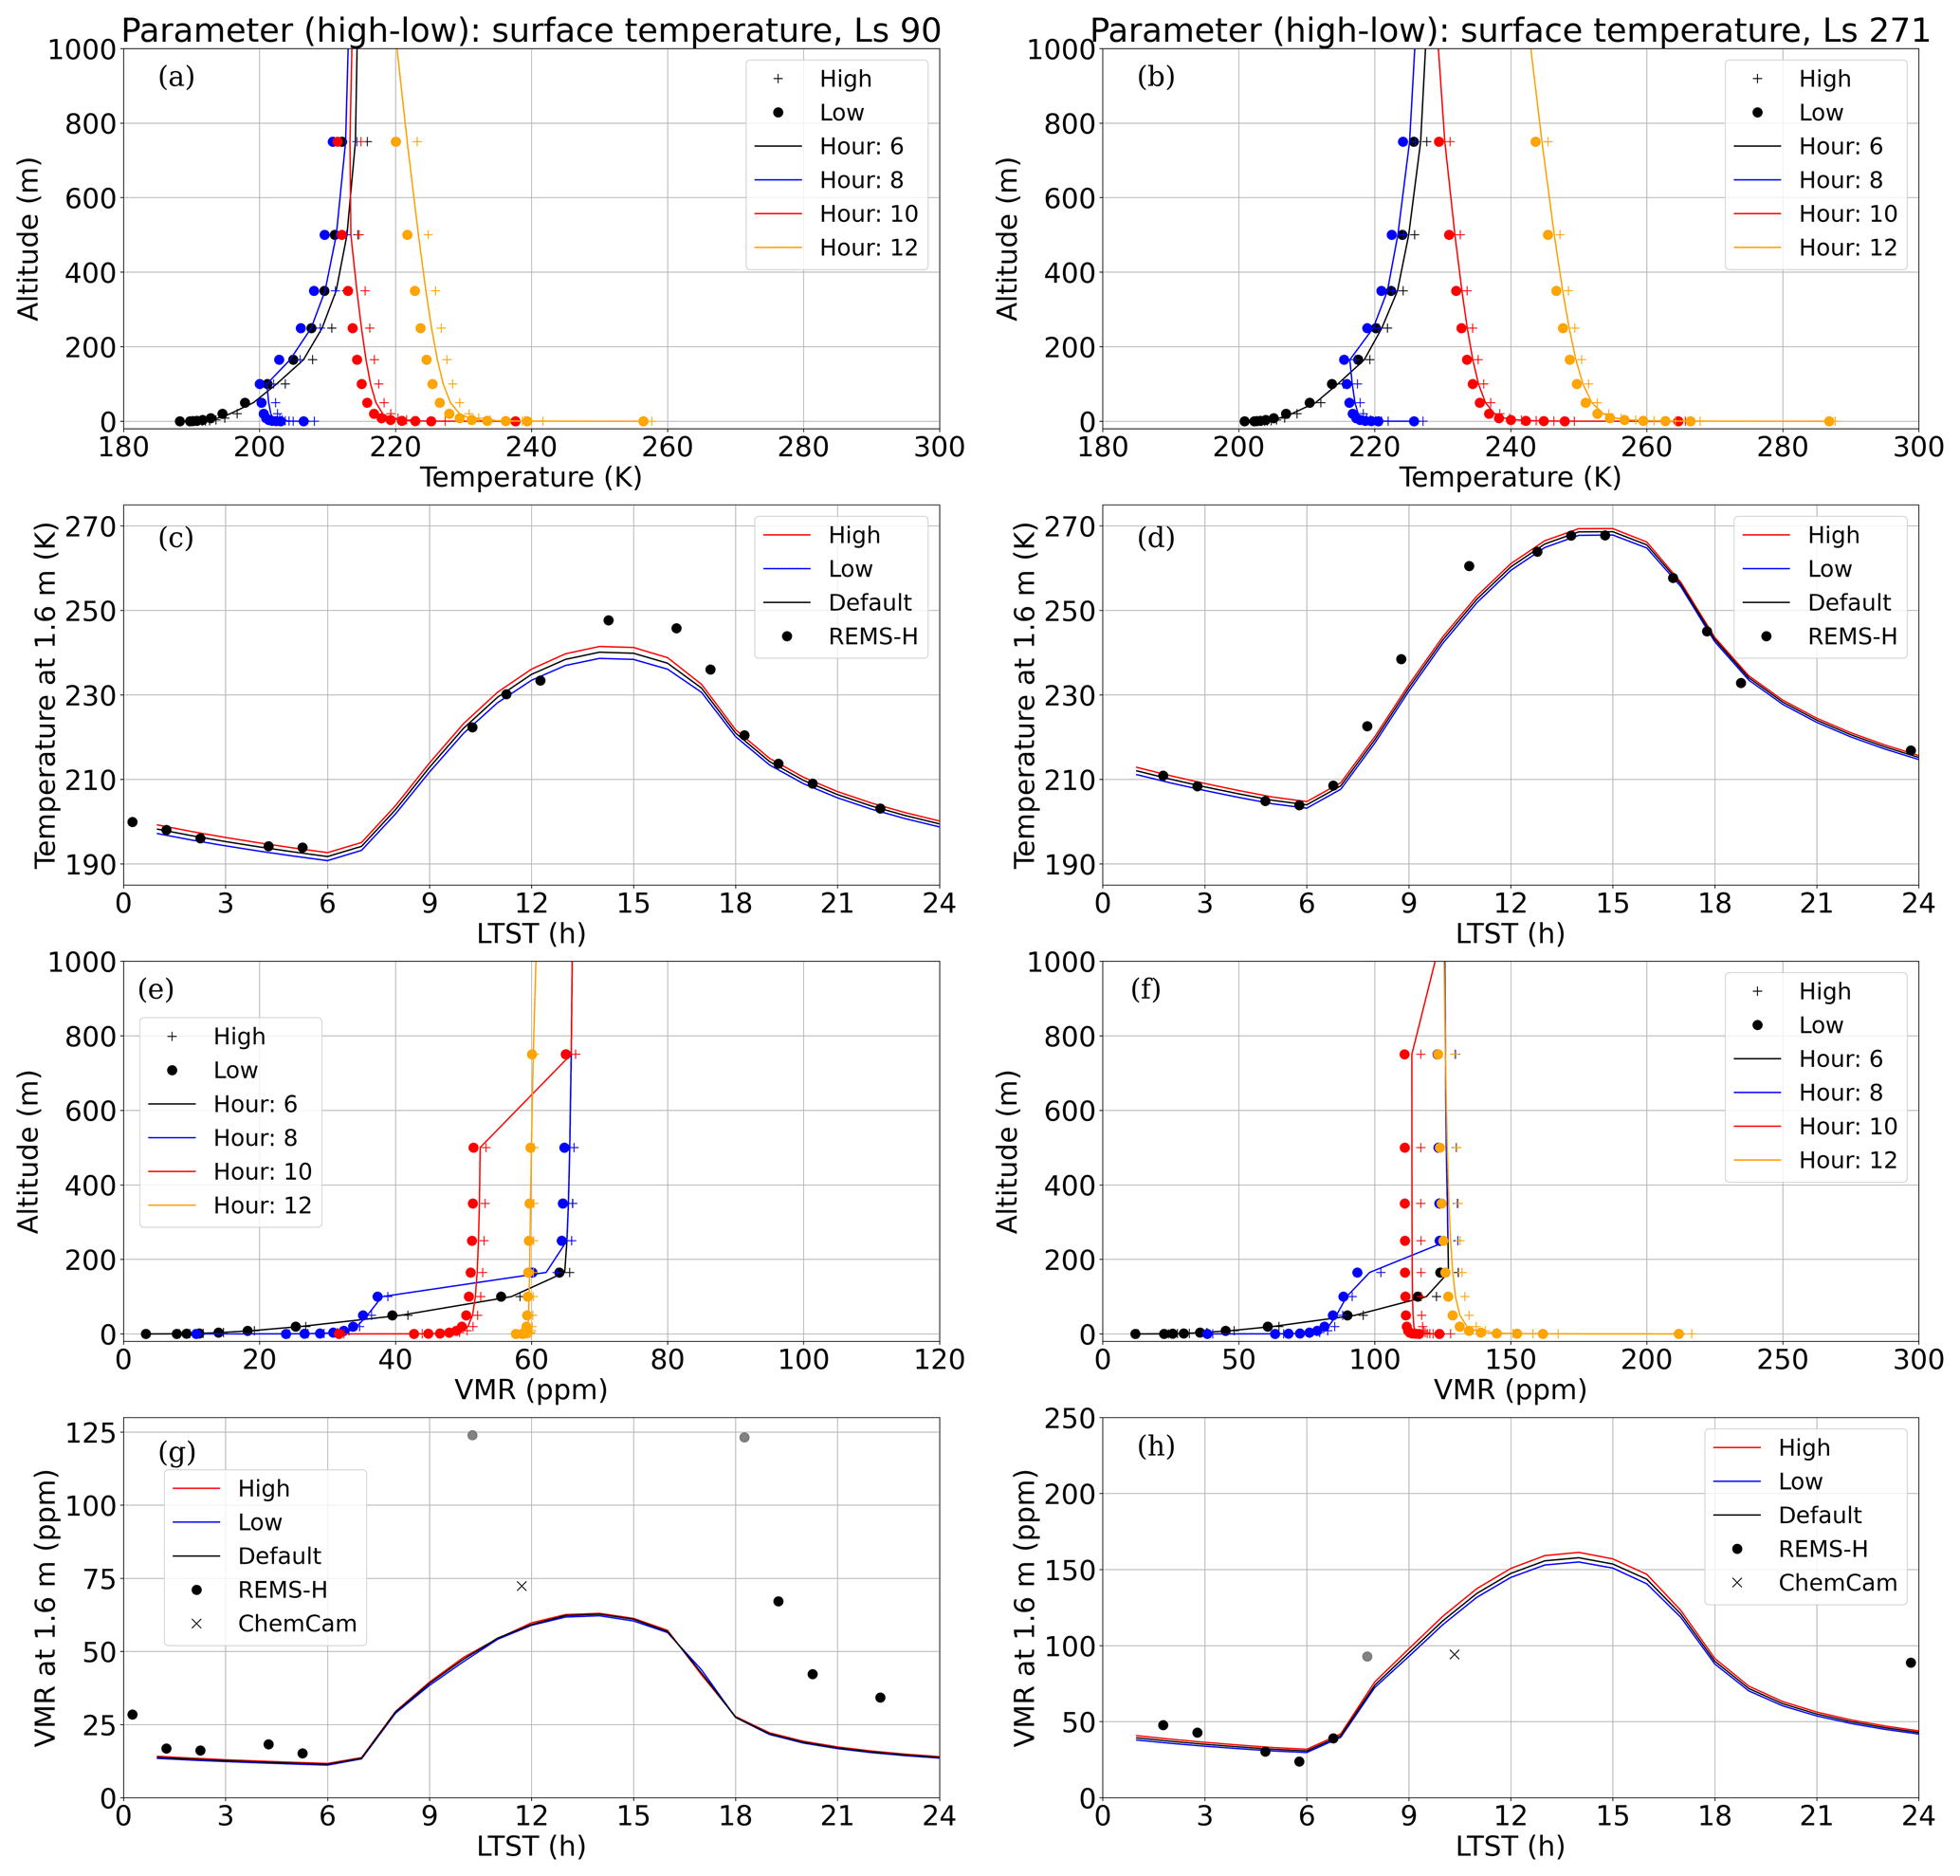
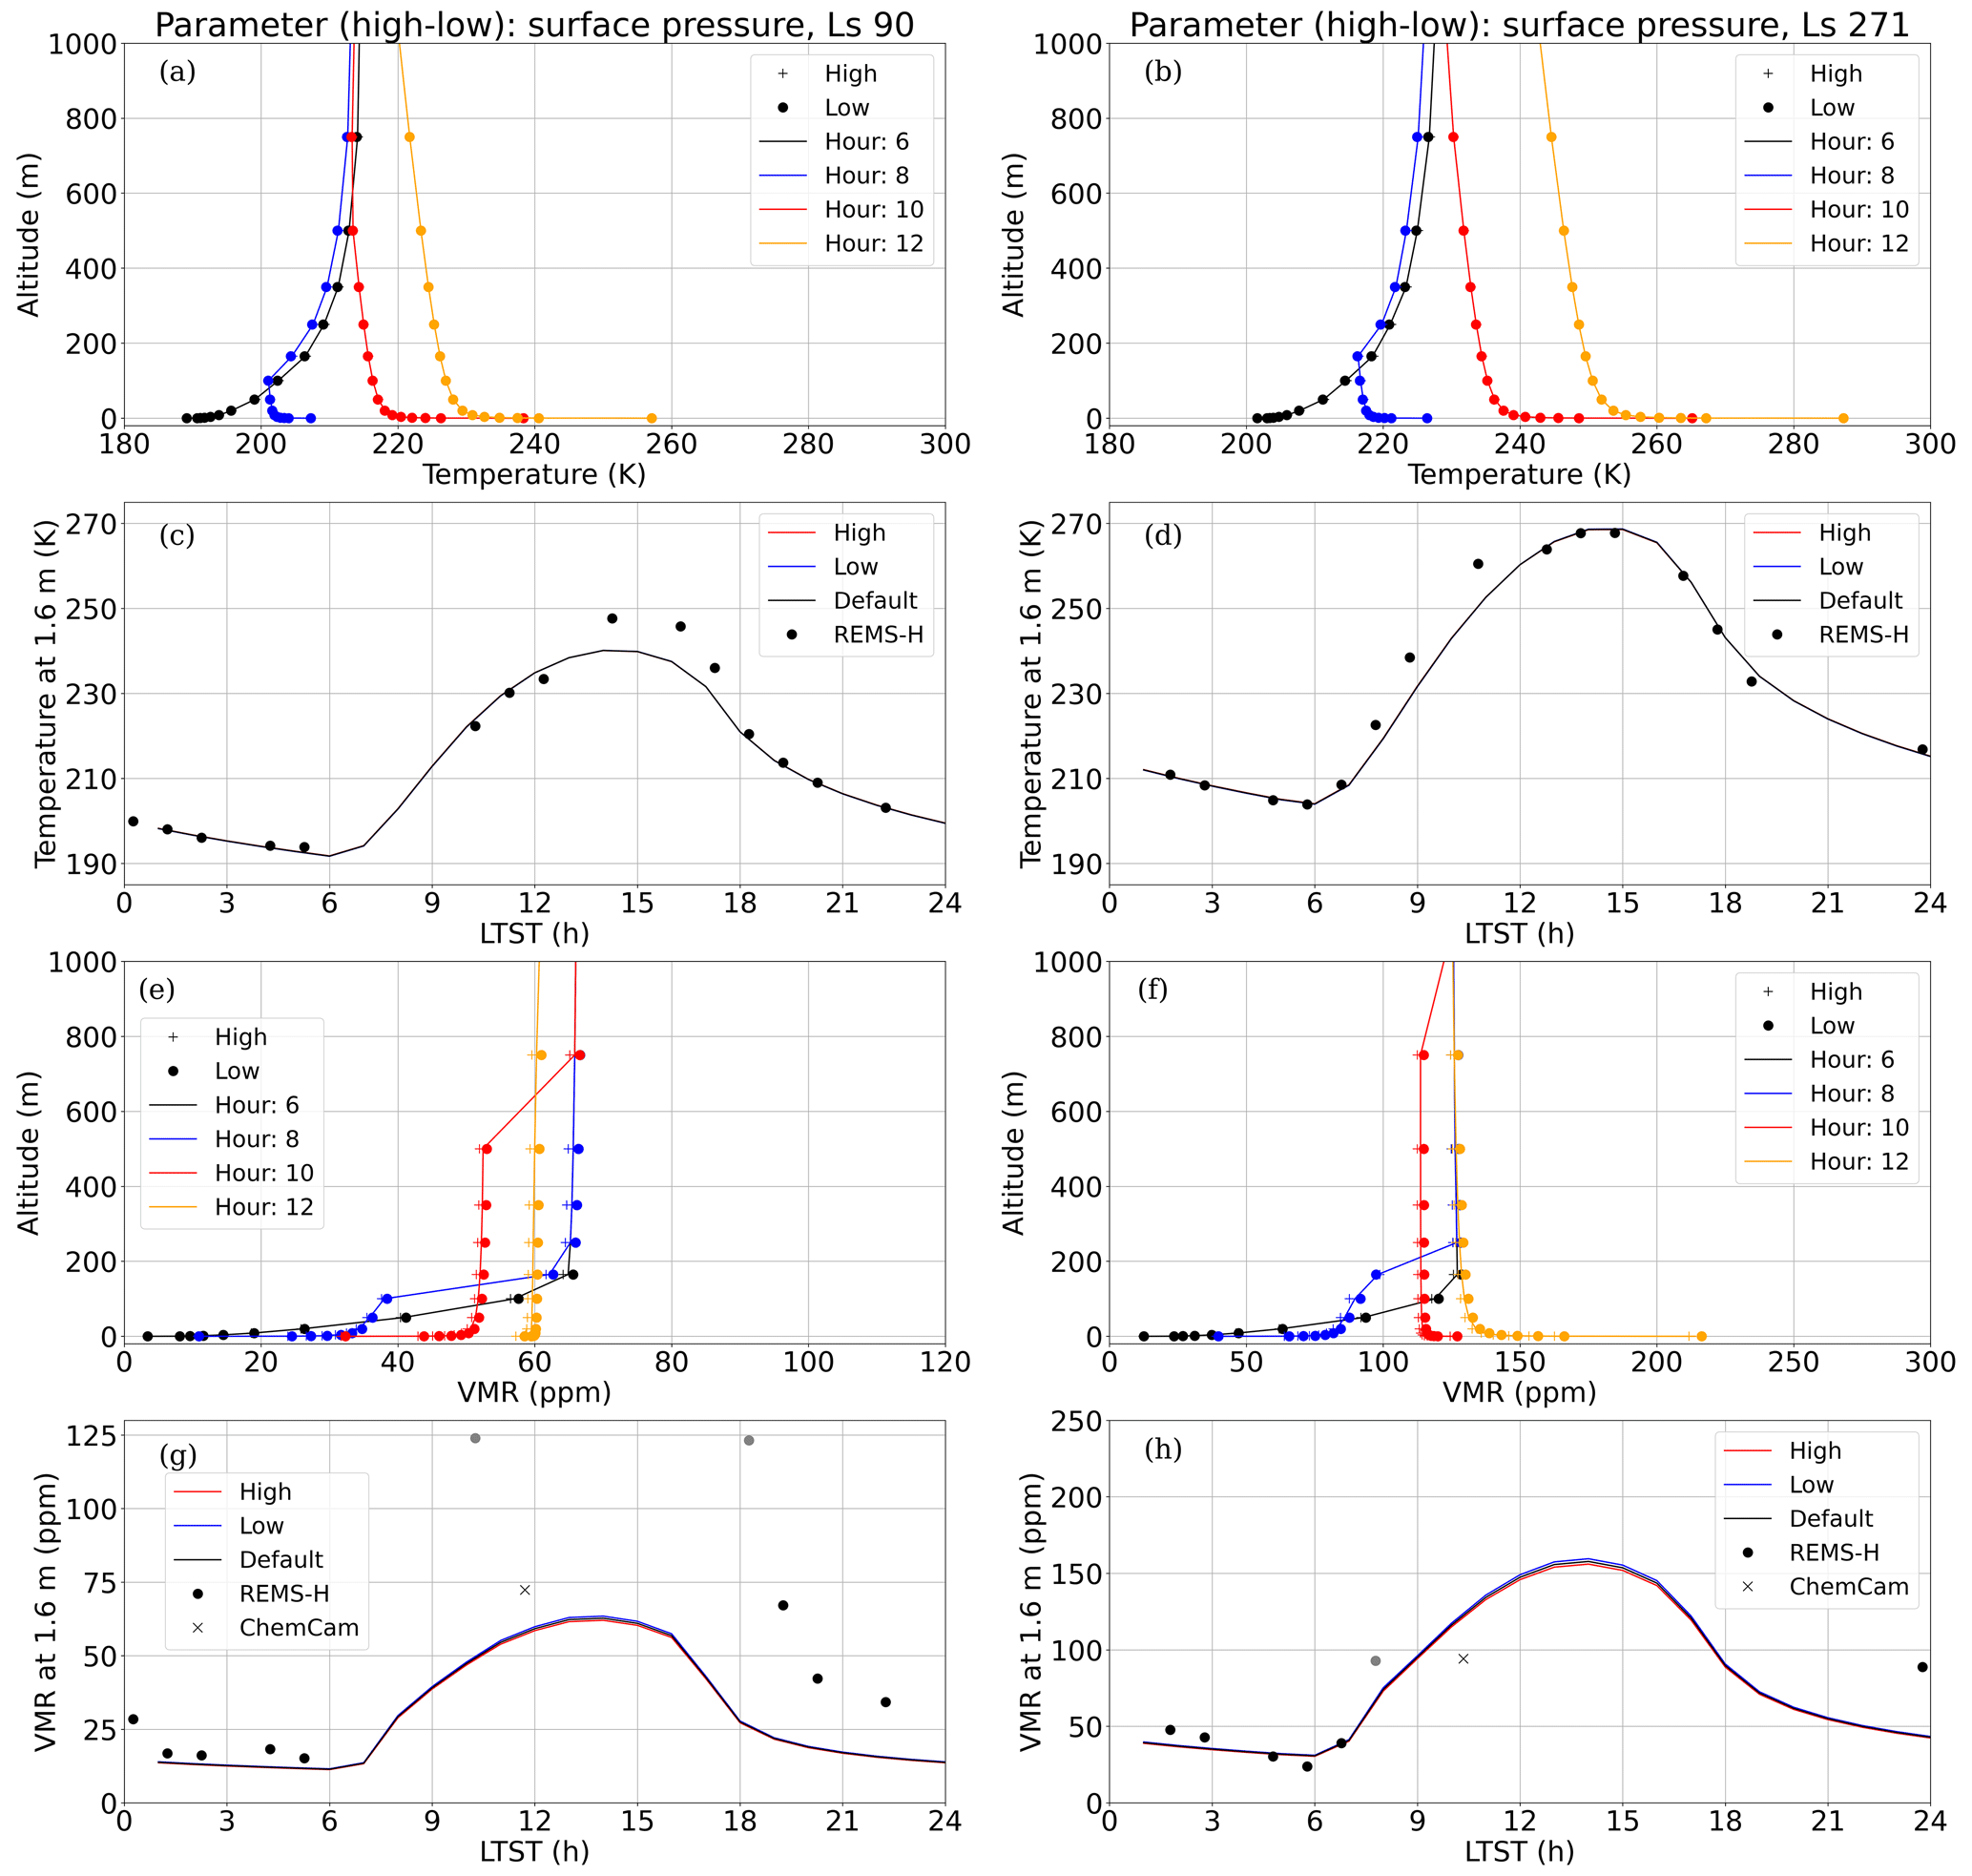
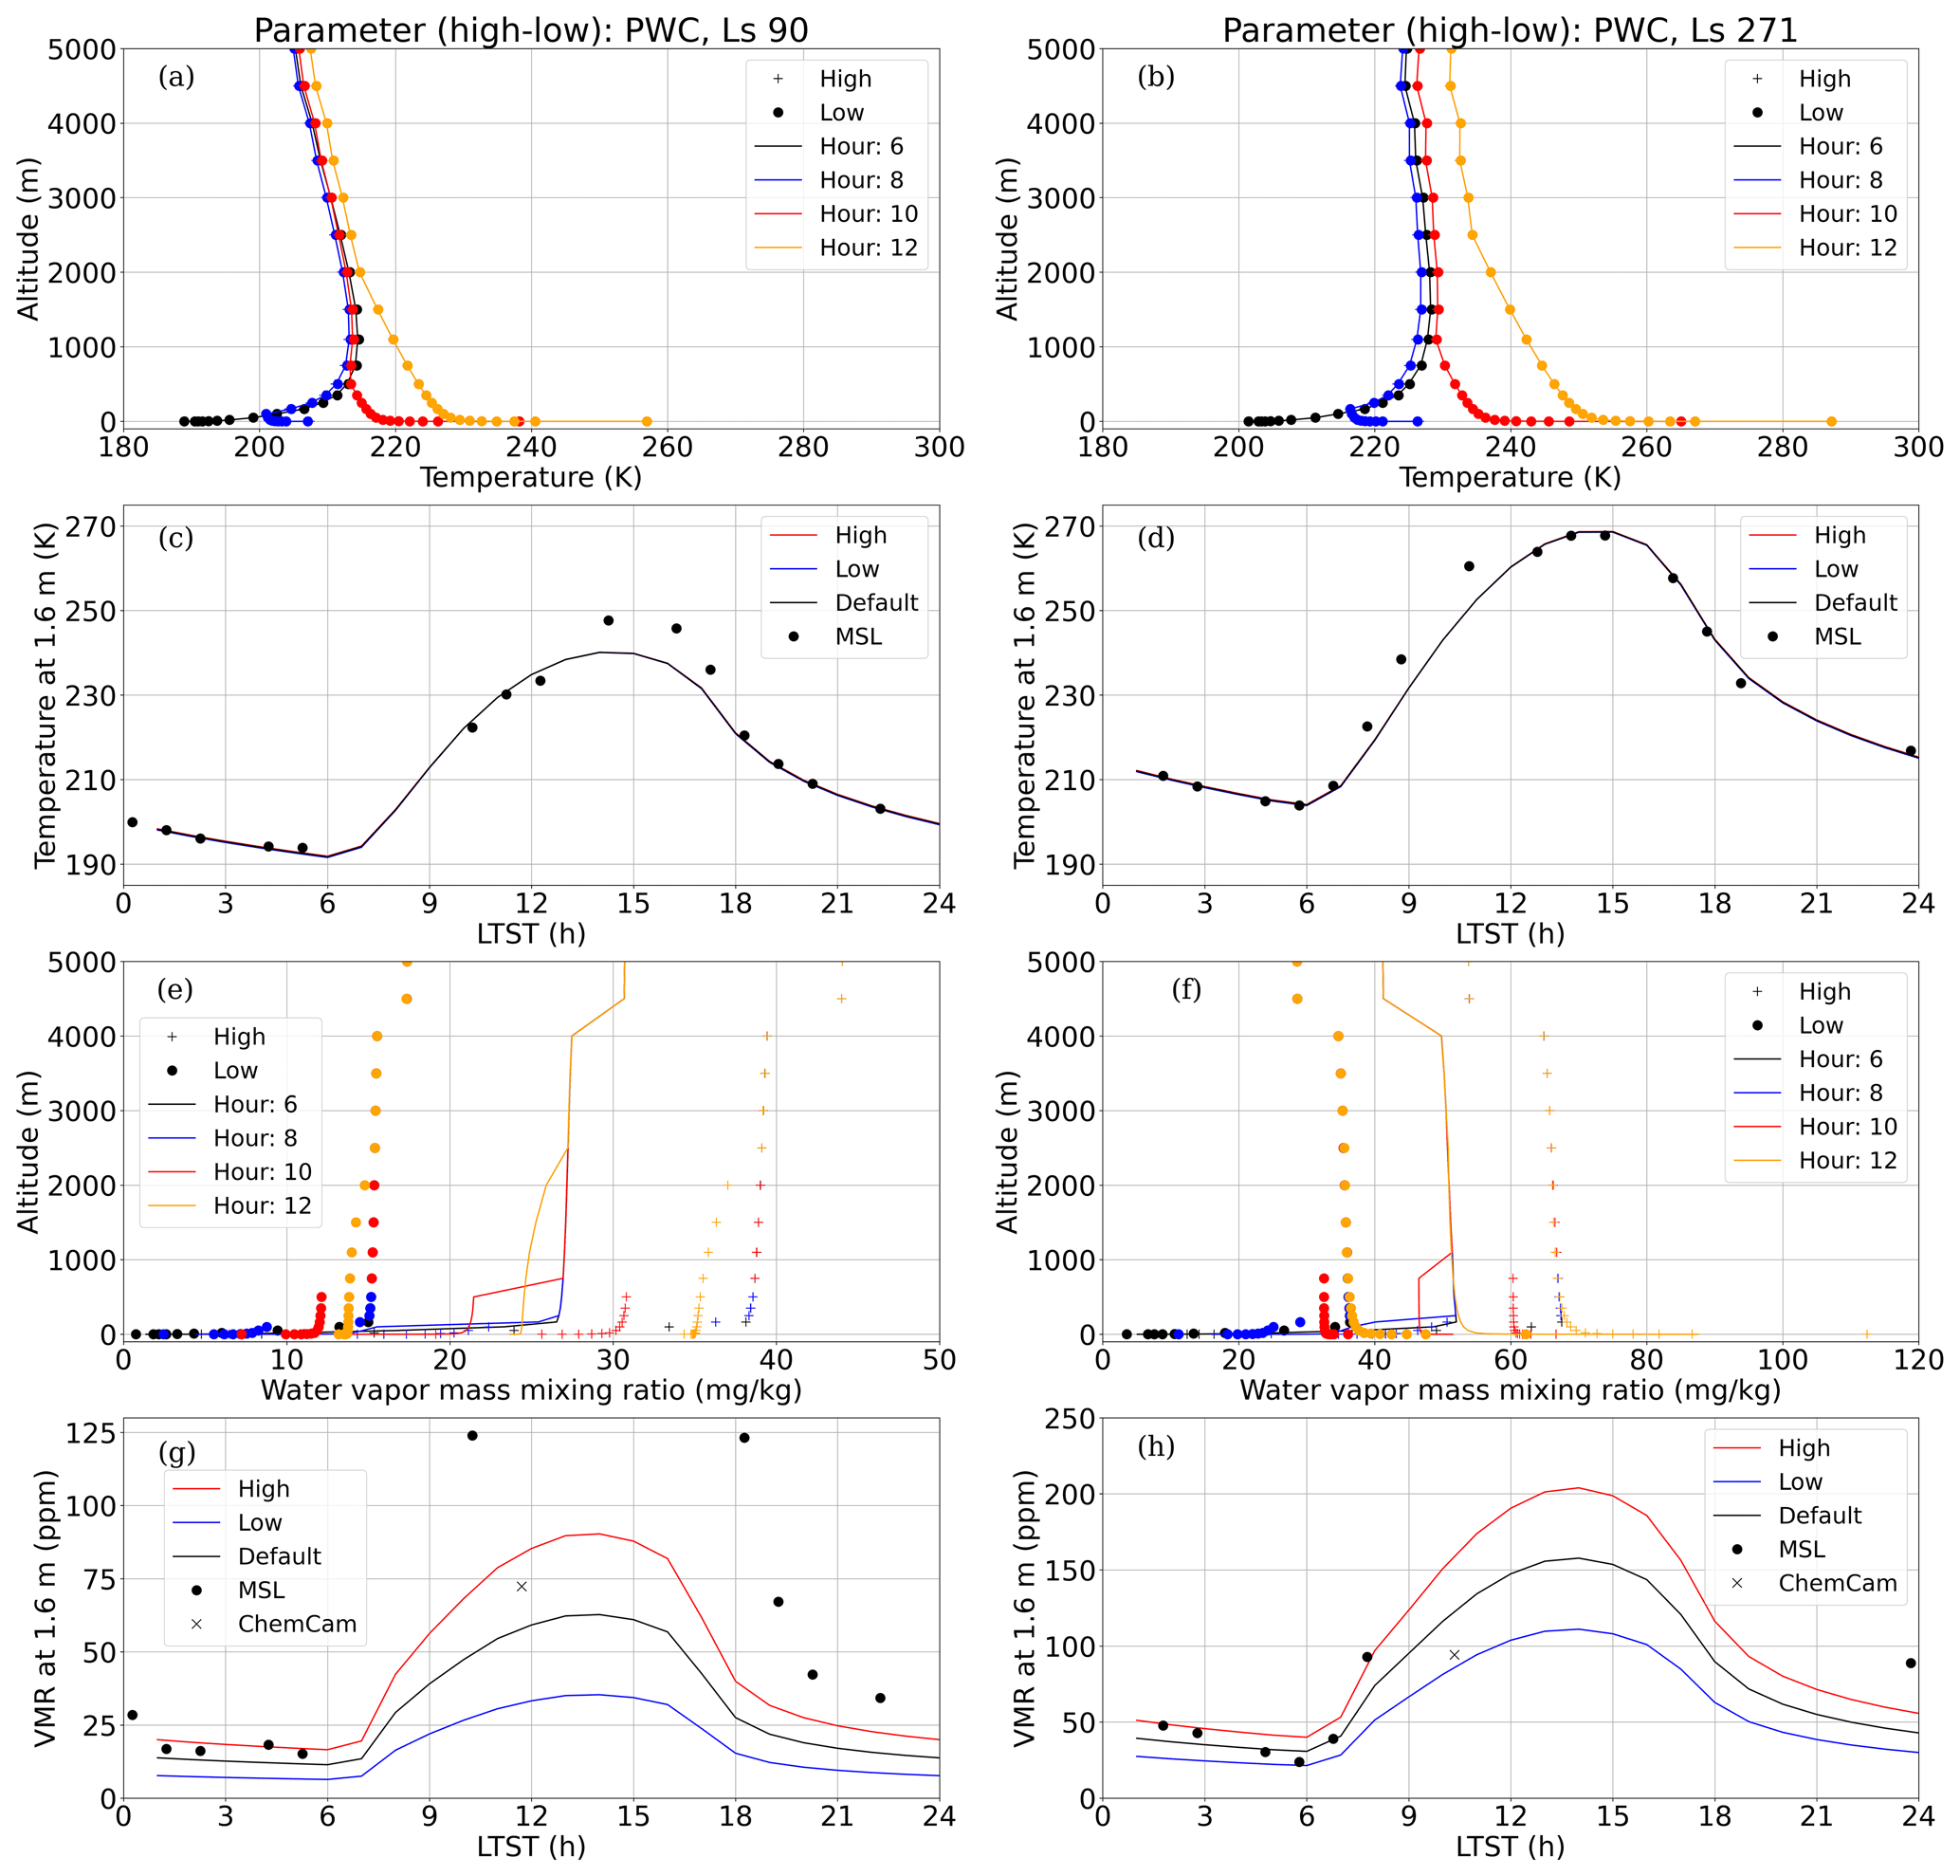
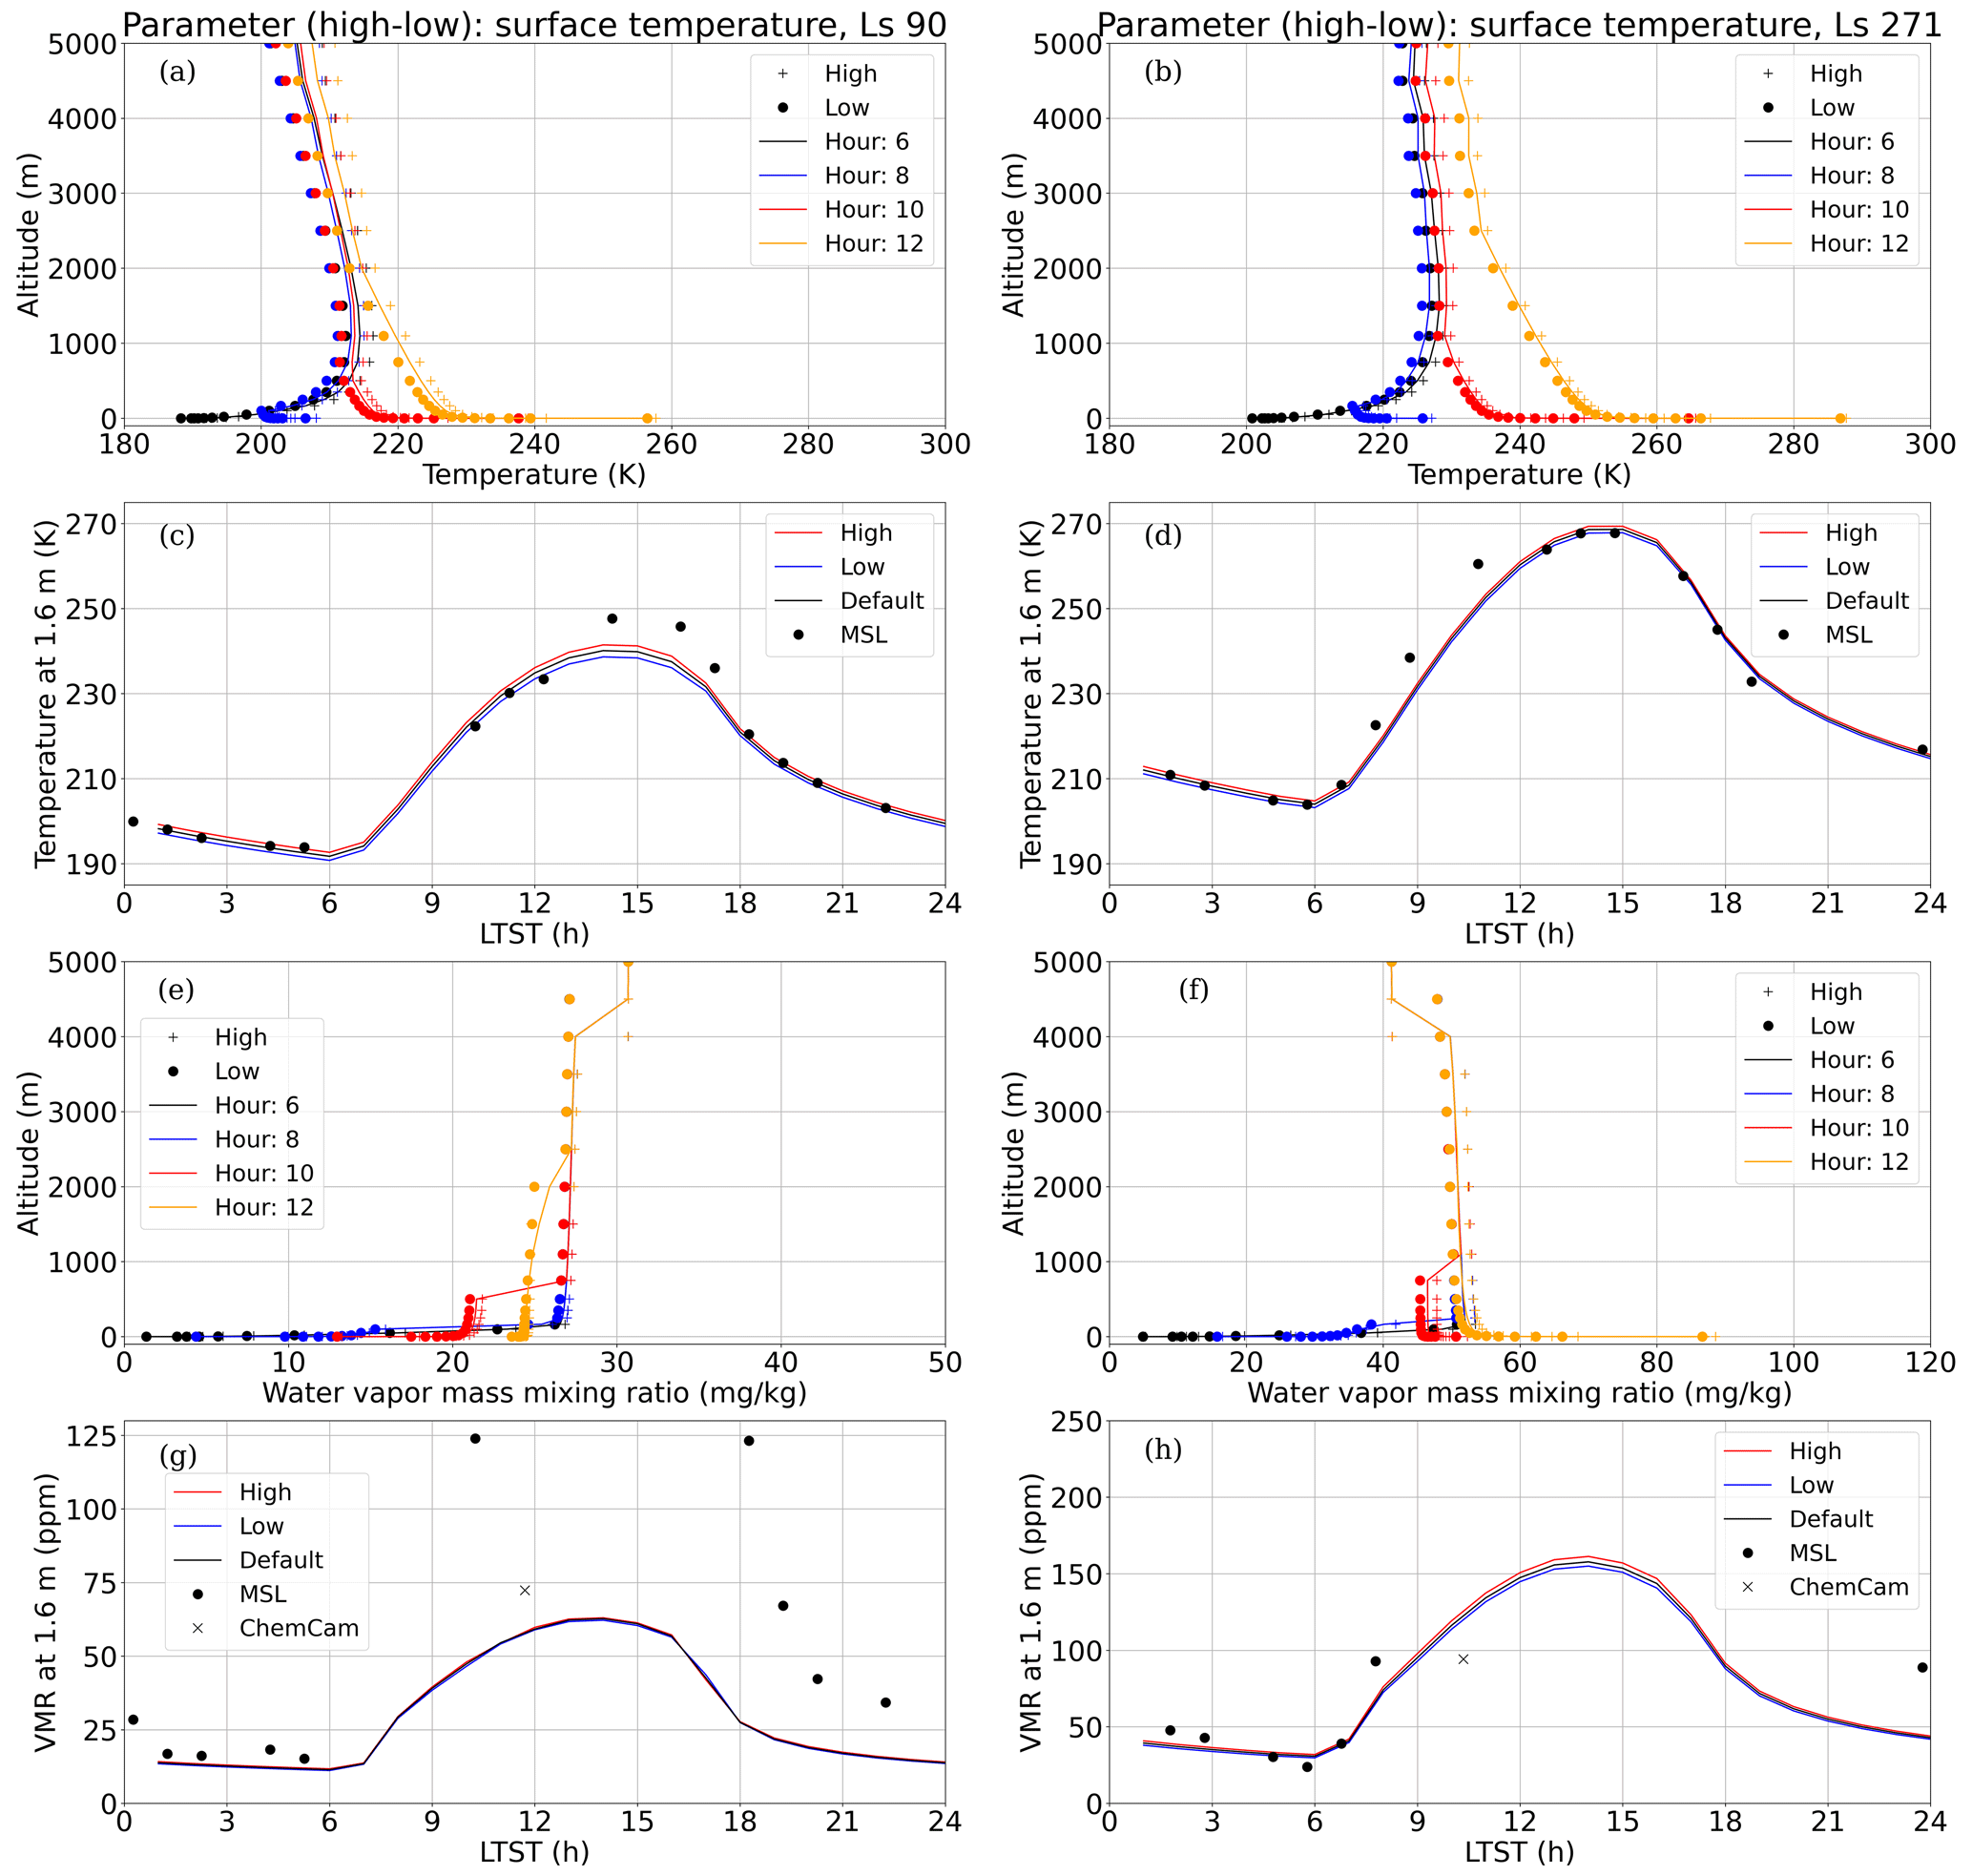
Figures 4–7 display all model experiments for the cool (Ls 90°, left panel) and warm (Ls 271°, right panel) seasons. Modeled profiles of temperature (Figs. 4–7, panels a and b) and humidity (Figs. 4–7, panels e and f) are shown at 06:00 (black), 08:00 (blue), 10:00 (red), and 12:00 (orange) local true solar time (LTST) from the surface up to 1 km. These times were selected because convection is the strongest during the morning hours as the Sun starts to heat the surface of Mars. The upper limit of 1 km was selected to see the effect of initialization near the surface. Appendix A shows the profiles up to 5 km. The profiles show a model run with the default parameter value as solid lines, along with the simulations for the higher (+) and lower (spheres) parameter value. Modeled cycles of diurnal temperature (Figs. 4–7, panels c and d) and water vapor VMR (Figs. 4–7, panels g and h) at 1.6 m include model runs with the default (black line), high (red line), and low (blue line) parameter values together with the REMS-H values (black spheres). On top of that, VMR cycles (Figs. 4–7, panels g and h) include the ChemCam-derived VMR (marked by X) estimated from the PWC assuming a well-mixed moisture profile (McConnochie et al., 2018).
Results from the sensitivity tests are displayed in four parts based on the varied initialization and fixed parameter. The first experiment with τ being the varying parameter is shown in Fig. 4. Figure 5 shows the model experiment with PWC being the changing initial parameter. The effect of surface temperature initialization is shown in Fig. 6. Finally, the sensitivity of the model to initialization of the surface pressure is shown in Fig. 7.
In the both seasons, temperature profiles (e.g., Fig. 4a and b) display a strong inversion, since temperature increases with altitude close to the surface between 06:00 and 08:00 LTST, while at 10:00 LTST it is no longer present. As the atmosphere of Mars is extremely thin, the surface of Mars reacts strongly to the changes in radiation. At 08:00 LTST (blue line) convection has already started as the solar radiation has started to strongly heat the surface of Mars. This can be seen from the lower end of the blue curve in Figs. 4–7 (panels a and b), since the temperature has changed from increasing with altitude to decreasing with altitude. In addition to the stronger convection in the warm season, a greater diurnal variation in temperature profiles and near-surface cycles is also easily visible.
The predicted diurnal 1.6 m T cycle is relatively close to the REMS-H-observed values in both seasons (Fig. 4c and d), but this comparison is limited by the absence of uncertainties. However, during the cool season (Ls 90°) the observed T is higher than the model's T at 14:00–17:00 LTST. Also, at Ls 271°, the model's T is somewhat lower than the observations after sunrise between 09:00 and 11:00 LTST. Savijärvi et al. (2016) suggested that these higher observed T values are due to advection or large-scale convective cells, as these are not included in the column model.
Our simulations suggest that initialization of the PWC (Fig. 5) or surface pressure (Fig. 7) does not affect model temperature profiles or 1.6 m cycles. The initialization of surface temperature affects the entire temperature profile and the shape remains similar, as can be seen in Fig. 6a and b. The absolute effect appears to be slightly larger at Ls 90° compared to Ls 271°, but the difference is very small.
The amount of airborne dust (Fig. 4), however, has a big impact. In daytime (10:00 and 12:00 LTST), the simulation with a higher dust loading (+ markers in Fig. 4a and b) causes more absorption of solar radiation. Compared to the default model run (lines), this causes the atmosphere to warm above about 3 km at 12:00 LTST (shown in Fig. A1) and cool below that in the both seasons, but the cooling effect is slightly more pronounced at Ls 90° (Fig. 4a) than at Ls 271° (Fig. 4b), however. Since the upper atmosphere absorbs more solar radiation, the radiation does not reach the lower atmosphere as efficiently, which causes the lowest model layers to cool (Fig. 4c and d).
At 06:00 LTST (black), the simulation with higher dust loading (+) causes temperatures to increase in the lowest 25 m (demonstrated in Fig. 4c and d), decrease above 25 m up to about 4.5 km (Fig. A1), and thereafter increase again compared to the default model run (lines). A warmer atmospheric layer due to the absorption by dust starts already at an altitude of 2 km at 14:00 LTST (not shown here). Hence, the atmosphere warms from a lower altitude due to increased solar radiation, but there is no time to heat the lowest part of the boundary layer (BL). After sunset, the warmer upper atmosphere in the high-dust scenario leads the dust particles to emit more thermal radiation, which warms the lower atmosphere (Fig. 4c and d) and in turn cools the emitting layer.
This is consistent with known effects of the dust storms on near-surface temperature cycles. Savijärvi et al. (2020b) clearly showed an increase in near-surface temperatures at night and a decrease during the day from the MSL measurements during the MY 34 global dust storm. During the same time period, Viúdez-Moreiras et al. (2020) showed the same effect of an increased amount of airborne dust at the InSight location.
The humidity profiles of both seasons (e.g., Fig. 5e and f) display a well-mixed layer in the BL. At 06:00–08:00 LTST, the well-mixed layer is very shallow and grows thereafter due to strong convection in both seasons. At 10:00 LTST (red curve), there seems to be a shallow well-mixed layer from ca. 100–500 m (Fig. 5e) and 50–750 m (Fig. 5f). That can be seen from the water vapor volume mixing ratio (VMR) being constant with altitude (see also Fig. A2e and f). A similar feature is not obvious for 06:00 and 08:00 LTST (black and blue curve). As the atmospheric moisture content in the model is higher at Ls 271°, adsorption and desorption are much stronger at Ls 271°(e.g., Fig. 5h) compared to Ls 90° (e.g., Fig. 5g, note the different scale on the y axes). This same effect is seen by varying the initial value of PWC (Fig. 5). This initialization affects the entire atmosphere without modifying the shape of the profiles.
Modified atmospheric dust loading also affects the model's humidity prediction (Fig. 4e and f) through radiation. Increased solar radiation near the surface in the morning, due to model initialization with less dust, drives water molecules back into the atmosphere after the nighttime adsorption. A larger quantity of available water molecules near the surface therefore increases the water content higher in the atmosphere, as turbulence transports them vertically. The predicted near-surface VMR values start to decrease quickly in the late afternoon, when the solar radiation has weakened (e.g., Fig. 4g). This is caused by the fast decrease in temperature when adsorption begins.
The model's humidity profiles and near-surface cycles are affected a little by the initialization of surface pressure (Fig. 7) and temperature (Fig. 6). The very small effect by the initialization of surface pressure to water vapor VMR is very likely caused by the fact that the VMR value depends on the pressure value (). Moreover, the water vapor mass mixing ratio and VMR values increase with a higher initial surface temperature value, which is at least partly due to the fact that they are a function of temperature. Therefore, if the temperature value increases at a given altitude, it immediately increases the mass mixing ratio and VMR values at that same altitude. This temperature dependence of moisture can also affect the model simulation with a modified dust load at a given altitude (Fig. 4e and f), as the initialization affects the local temperatures.
The most accurate REMS-H VMR values, derived from the RH, are observed at the maximum RH. The VMR values at very low RH (< 5 %) are considered unreliable, and hence model simulations cannot be compared to these during the daytime. These VMR values with very low RH (< 5 %) are shown as gray spheres in Figs. 4–7 (panels g and h). ChemCam-derived VMR gives an estimate of the daytime VMR. For the model moisture quantities (RH and ), it is important that the predicted temperatures are accurate, as these quantities are very sensitive to temperature. The nighttime VMR derived from the REMS-H, in Fig. 4g and h, is relatively close to the model simulation in both seasons, but the ChemCam-derived daytime VMR is higher at Ls 90° and lower at Ls 271° than the model prediction. However, some disagreement with the modeled and REMS-H-derived VMRs around 18:00–24:00 LTST is visible. This is very likely related to the low RH values, as they have not yet increased enough after the extremely low daytime values. For example, after dusk at Ls 271°, the observed RH is only slightly above 5 %. In contrast, the observed RH during the early morning hours is about 8 %–11 %.
If we assume that the initial PWC of the default run (from ChemCam) is correct, then the ChemCam-derived daytime VMR (marked by X in panels g and h in Figs. 4–7) should also be relatively accurate. This ChemCam VMR value is derived from the estimated PWC assuming a well-mixed moisture profile. In addition to this, the lowest VMR of the sol is the most accurate REMS-H observation. Thus, at Ls 90° (Fig. 5g), the higher ChemCam-derived VMR (X) suggests that the model daytime humidity should be increased at low altitudes if the column water content is kept the same. Also, the higher REMS-H-derived VMR at about 05:00 LTST (sphere, Fig. 5g) suggests that the nighttime VMR should be slightly higher. This is in good agreement with the experiments by Savijärvi et al. (2019a), as initially the “low-moist layer” (where humidity values were increased at low altitude relative to the well-mixed model experiment) in the model increased 1.6 m VMR values (Savijärvi et al., 2019a, Fig. 4) more during the day than at night. This is also supported by the moisture profile derived from the Mars Climate Database (MCD); see Fig. 8 in Savijärvi et al. (2019a). At Ls 271° (Fig. 5h) the situation is the opposite, as during the day and early morning (about 06:00 LTST) the moisture near the surface should be reduced. The simulation with a well-mixed initial moisture profile matched the observations well in Savijärvi et al. (2019a), but here the modeled moisture level is somewhat higher than the observations. This is most likely due to the higher PWC (the latest data set) in our simulations compared to the lower PWC in Savijärvi et al. (2019a). The moisture profile from the MCD (Savijärvi et al., 2019a, Fig. 8) suggests that the moisture content is more concentrated higher in the atmosphere.
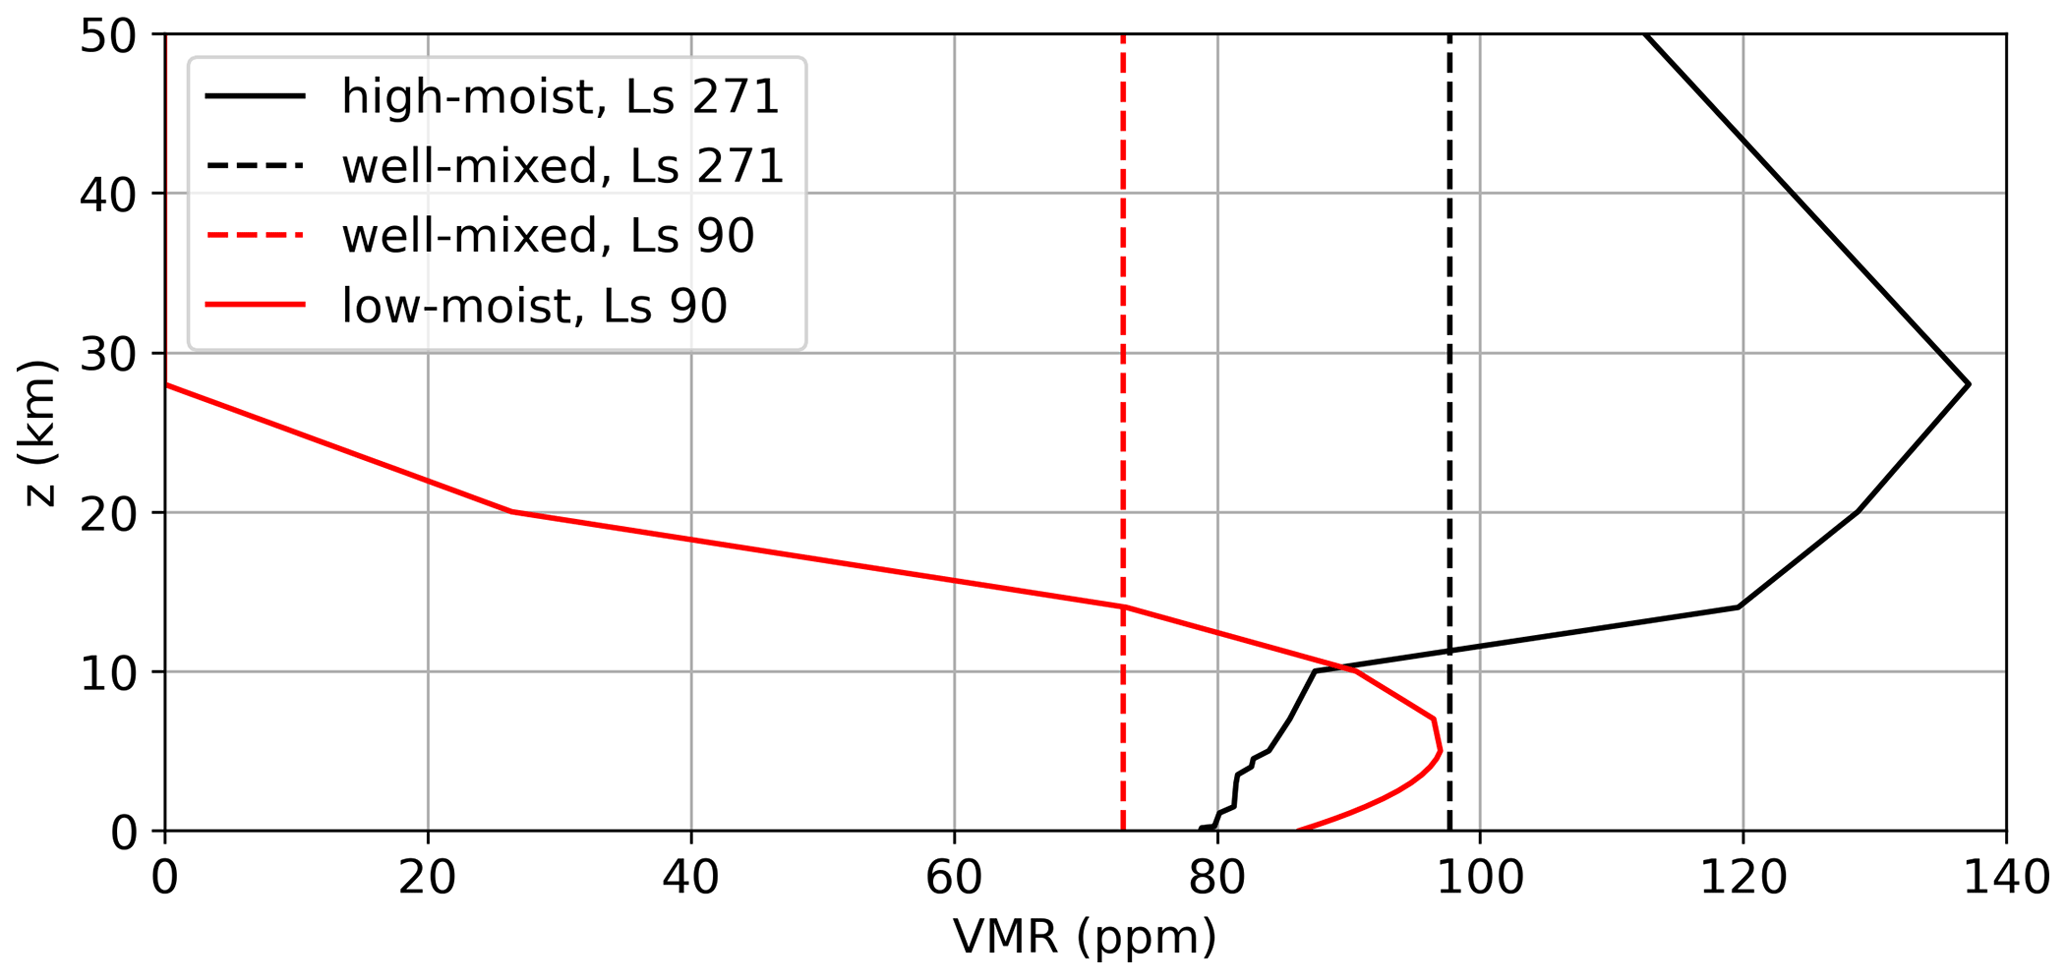
Figure 8Water vapor volume mixing ratio (VMR) profiles for initializing the column model at Ls 90° (red curves) and Ls 271° (black curves). The low- and high-layer moisture assumptions have the same PWC as the corresponding well-mixed profiles.
To test these hypotheses, column model simulations with a low-moist layer initialization at Ls 90° and a “high-moist layer” initialization at Ls 271° were performed. These initialization profiles are shown in Fig. 8 so that the “low- or high-moist layer” PWC is the same as the PWC for the corresponding well-mixed profile. This low-moist layer assumption is based on the GCM aphelion season results (e.g., Montmessin et al., 2017, Fig. 11.18), which suggests that the moisture is concentrated nearer the surface at the equatorial latitudes. However, the GCM-based MCD suggests the moisture to be more well-mixed at low altitudes during the warm season (Ls 271°), peaking at about 35 km. Hence, our high-moist layer assumption is based on the MCD moisture profile.
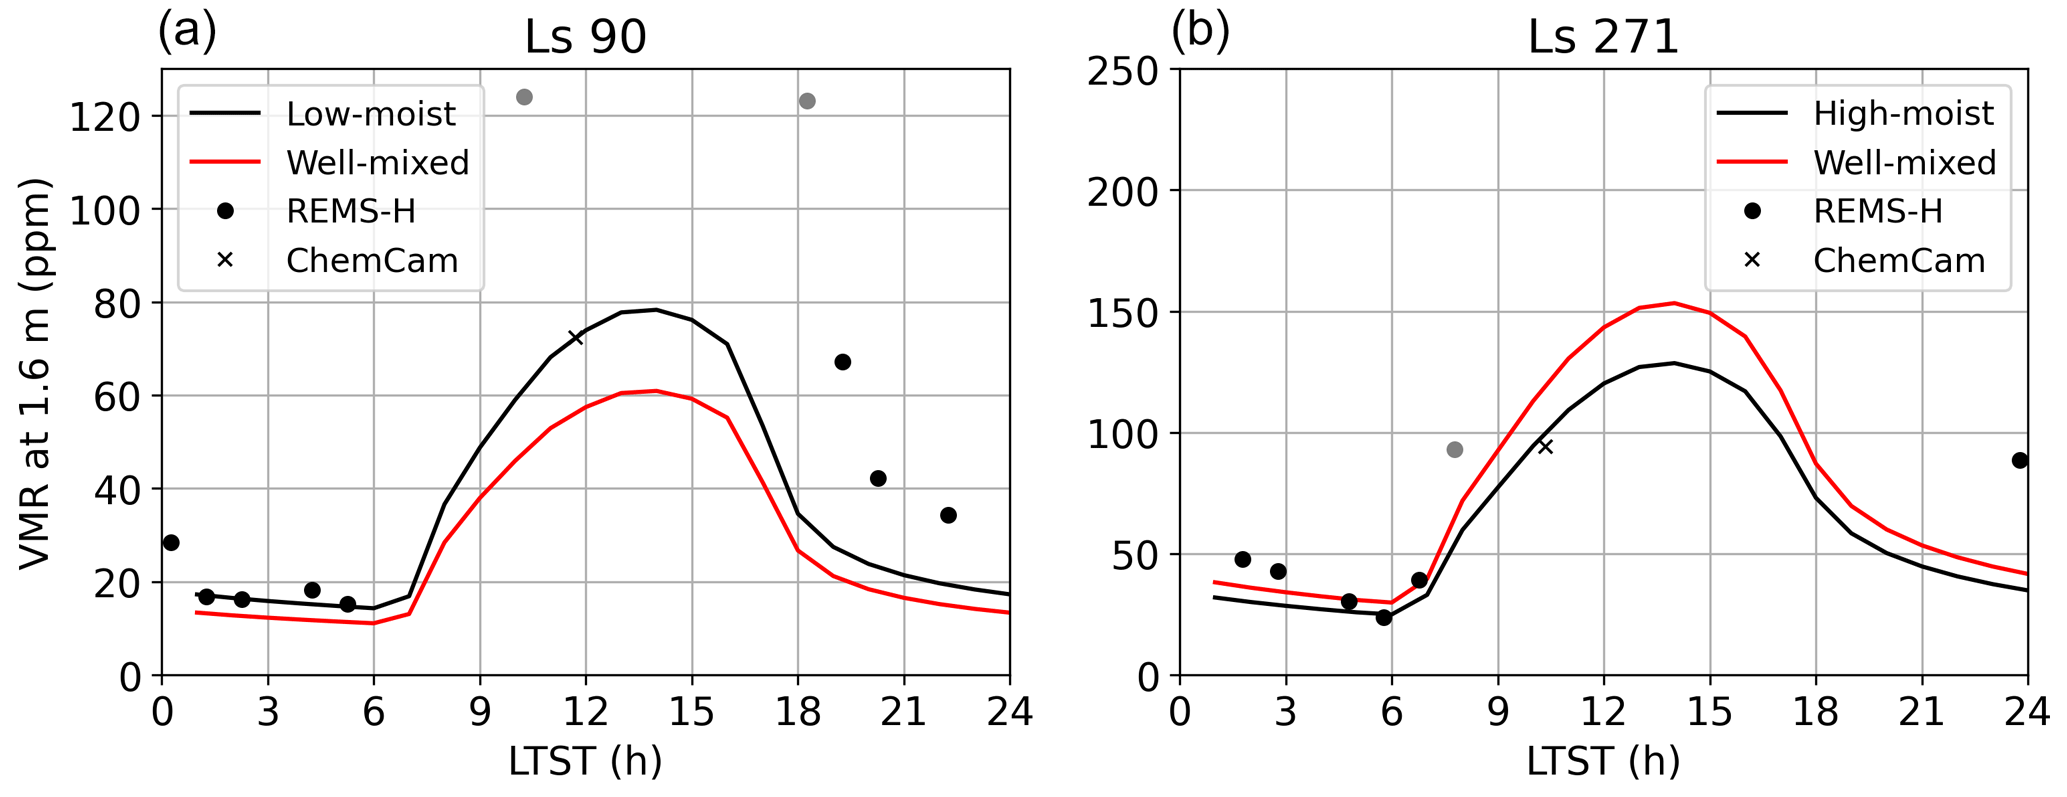
Figure 9Water vapor VMR diurnal cycles with REMS-H-derived values (spheres) and ChemCam observations (X) for Ls 90° (a) and Ls 271° (b). Well-mixed assumptions are shown as red curves and the low- or high-layer moisture assumptions are shown as black curves. Gray spheres show unreliable REMS-H-derived VMR values.
Figure 9 shows the simulated 1.6 m VMR cycles for Ls 90° (Fig. 9a) and Ls 271° (Fig. 9b) with the REMS-H-derived VMR values (spheres) and ChemCam-derived VMR values (marked by X). Simulated cycles include “well-mixed” assumptions (red) and low- or high-moist layer assumptions. Figure 9 indeed shows that these tuned assumptions perform better compared to the well-mixed assumption. At Ls 90°, the low-moist layer initialization now matches the REMS-H-derived VMR at about 05:00 LTST as well as the ChemCam-derived VMR. Similar matches at about 06:00 LTST REMS-H VMR and the daytime ChemCam VMR for Ls 271° are visible when using the high-moist layer initialization.
The sensitivity of the 1-D column model to its initial parameters was analyzed near the Equator at the MSL location in Martian year 32 during the local winter and summer. Default model initialization was made using REMS-observed temperature and pressure, Mastcam-measured optical depth (τ), and ChemCam-estimated column precipitable water content (PWC). We used four parameters in our analysis: τ, PWC, surface temperature, and pressure. The τ was chosen as studies of the Martian atmosphere (e.g., Savijärvi et al., 2005) indicate a major effect of dust on atmospheric temperatures through radiation. The PWC was chosen, since previous column model experiments in the Gale Crater (e.g., Savijärvi et al., 2016, 2019a) suggest the importance of the initial PWC for the diurnal water cycle. The predicted temperature cycle is extremely important, so we also studied the effect of the initial surface temperature. The surface pressure was chosen, since the diurnal pressure cycle is not predicted in the column model.
Our simulations showed that the initialization of PWC or surface pressure does not affect the predicted diurnal temperature cycle. We found that the initial value of surface temperature affects the entire temperature profile with a slightly larger effect at Ls 90°. This seems to be the case at all altitudes and is probably related to the smaller variations in the diurnal temperature cycles during the cold season compared to the warm season. The amount of airborne dust had the greatest effect due to absorption of solar radiation.
The model's 1.6 m VMR cycle was close to the MSL-observed values, but they were slightly higher in the cool season and slightly lower in the warm season compared to the model prediction. However, this comparison is slightly limited by the absence of uncertainties. An earlier study by Savijärvi et al. (2019a), a large-scale model moisture profile from the MCD (Fig. 8 in Savijärvi et al., 2019a), and our sensitivity experiments (Fig. 5g and h) suggest that the model's initial humidity profile at the MSL site should vary with the season to provide a better moisture prediction near the surface. Column model simulations with initial moisture concentrated nearer the surface (low-moist layer) at Ls 90° and initial moisture concentrated higher in the atmosphere (high-moist layer) at Ls 271° provided good matches to REMS-H VMR observations and ChemCam-derived VMR values. This seasonally varying humidity profile at the MSL site is likely due to the large-scale Hadley circulation that transports moisture in the equatorial region. It modifies the vertical distribution of moisture as well as the regional atmospheric moisture content with the season (Richardson and Wilson, 2002; Navarro et al., 2014; Steele et al., 2014; Millour et al., 2017; Montmessin et al., 2017). This is an interesting result, and an increased number of in situ observations would benefit us in our research.
In addition to the shape of the initial moisture profile of the column model, the choice of adsorption–desorption scheme may play a role. This is because the adsorption–desorption is very strong on Mars, so the modeling scheme may also affect the prediction of the diurnal moisture cycle directly near the surface and higher up via turbulence in the atmosphere. New missions to Mars that provide in situ observations may help us better understand the Martian water cycle.
We found that higher moisture content during the warm season, initialization of the PWC, and higher near-surface diurnal variation of temperature due to lower atmospheric dust content cause higher adsorption and desorption. This also caused the water content to increase higher up in the atmosphere as a result of the turbulence. We also showed that the initialization of surface pressure and temperature has a very small effect on the predicted diurnal moisture cycle. This is very likely due to the temperature and pressure dependence of the model's moisture quantities.
Thus, based on our sensitivity experiments, the fixed value of τ and the initialization of surface temperature appear to be the most important parameters for the predicted temperature profiles, while the PWC and fixed τ look like the most important parameters for the predicted humidity profiles. The varied PWC seems to be insignificant for the predicted temperatures, and the modified surface pressure, in turn, looks to be almost negligible for both variables. Hence, the sol-averaged surface pressure can be used even from previous years if there are no measurements nearby. However, if the altitude of the rover is not the same, hydrostatic adjustment can be used to estimate the surface pressure. The local atmospheric dust content is, however, crucial for the model. Initialization from local observations is the most beneficial, but it can also be taken from the MCD, for example, if local observations are not available. The shape of the model's moisture profile should be adjusted to the location and can also be taken from the MCD if there are no local measurements to initialize the column model.
A diurnal cycle of aerosol opacity has been observed in the Gale Crater (e.g., Lemmon et al., 2024). Nonetheless, this cycle is not simulated in the column model, but we assume that it should be affected in a similar fashion as in the sensitivity experiment with varying τ. Higher opacity during the day would decrease near-surface temperatures as the atmosphere absorbs more solar radiation. By contrast, during the nighttime a higher quantity of aerosols in the atmosphere would increase near-surface temperatures due to increasing thermal radiation. In future column model simulations, it would be interesting to test this feature in practice.
Derived data products analyzed and presented in the paper are available at https://doi.org/10.57707/FMI-B2SHARE.CAEC9FAFFD1A4166938715A0A8DA9125 (Leino et al., 2024).
JL, AMH, and MP planned the study. JL and AMH performed the measurements and analyzed the data. JL wrote the manuscript draft. AMH, MP, JP, MH, and HS reviewed and edited the manuscript.
The contact author has declared that none of the authors has any competing interests.
Publisher's note: Copernicus Publications remains neutral with regard to jurisdictional claims made in the text, published maps, institutional affiliations, or any other geographical representation in this paper. While Copernicus Publications makes every effort to include appropriate place names, the final responsibility lies with the authors.
This research has been supported by the Suomalainen Tiedeakatemia (grant no. 310509).
This paper was edited by Dalia Buresova and reviewed by two anonymous referees.
Blackadar, A. K.: The vertical distribution of wind and turbulent exchange in a neutral atmosphere, J. Geophys. Res. (1896–1977), 67, 3095–3102, https://doi.org/10.1029/JZ067i008p03095, 1962. a
Delage, Y. and Girard, C.: Stability functions correct at the free convection limit and consistent for for both the surface and Ekman layers, Bound.-Lay. Meteorol., 58, 19–31, 1992. a
Fischer, E., Martínez, G. M., Rennó, N. O., Tamppari, L. K., and Zent, A. P.: Relative Humidity on Mars: New Results From the Phoenix TECP Sensor, J. Geophys. Res.-Planets, 124, 2780–2792, https://doi.org/10.1029/2019JE006080, 2019. a, b
Gómez-Elvira, J., Armiens, C., Castañer, L., Domínguez, M., Genzer, M., Gómez, F., Haberle, R., Harri, A. M., Jiménez, V., Kahanpää, H., Kowalski, L., Lepinette, A., Martín, J., Martínez-Frías, J., McEwan, I., Mora, L., Moreno, J., Navarro, S., de Pablo, M. A., Peinado, V., Peña, A., Polkko, J., Ramos, M., Renno, N. O., Ricart, J., Richardson, M., Rodríguez-Manfredi, J., Romeral, J., Sebastián, E., Serrano, J., de la Torre Juárez, M., Torres, J., Torrero, F., Urquí, R., Vázquez, L., Velasco, T., Verdasca, J., Zorzano, M. P., and Martín-Torres, J.: REMS: The Environmental Sensor Suite for the Mars Science Laboratory Rover, Space Sci. Rev., 170, 583–640, https://doi.org/10.1007/s11214-012-9921-1, 2012. a, b
Hamilton, V. E., Vasavada, A. R., Sebastián, E., de la Torre Juárez, M., Ramos, M., Armiens, C., Arvidson, R. E., Carrasco, I., Christensen, P. R., De Pablo, M. A., Goetz, W., Gómez-Elvira, J., Lemmon, M. T., Madsen, M. B., Martín-Torres, F. J., Martínez-Frías, J., Molina, A., Palucis, M. C., Rafkin, S. C. R., Richardson, M. I., Yingst, R. A., and Zorzano, M.-P.: Observations and preliminary science results from the first 100 sols of MSL Rover Environmental Monitoring Station ground temperature sensor measurements at Gale Crater, J. Geophys. Res.-Planets, 119, 745–770, https://doi.org/10.1002/2013JE004520, 2014. a, b
Harri, A.-M., Genzer, M., Kemppinen, O., Gomez-Elvira, J., Haberle, R., Polkko, J., Savijärvi, H., Rennó, N., Rodriguez-Manfredi, J. A., Schmidt, W., Richardson, M., Siili, T., Paton, M., Torre-Juarez, M. D., Mäkinen, T., Newman, C., Rafkin, S., Mischna, M., Merikallio, S., Haukka, H., Martin-Torres, J., Komu, M., Zorzano, M.-P., Peinado, V., Vazquez, L., and Urqui, R.: Mars Science Laboratory relative humidity observations: Initial results, J. Geophys. Res.-Planets, 119, 2132–2147, https://doi.org/10.1002/2013JE004514, 2014a. a, b, c
Harri, A.-M., Genzer, M., Kemppinen, O., Kahanpää, H., Gomez-Elvira, J., Rodriguez-Manfredi, J. A., Haberle, R., Polkko, J., Schmidt, W., Savijärvi, H., Kauhanen, J., Atlaskin, E., Richardson, M., Siili, T., Paton, M., de la Torre Juarez, M., Newman, C., Rafkin, S., Lemmon, M. T., Mischna, M., Merikallio, S., Haukka, H., Martin-Torres, J., Zorzano, M.-P., Peinado, V., Urqui, R., Lapinette, A., Scodary, A., Mäkinen, T., Vazquez, L., Rennó, N., and the REMS/MSL Science Team: Pressure observations by the Curiosity rover: Initial results, J. Geophys. Res.-Planets, 119, 82–92, https://doi.org/10.1002/2013JE004423, 2014b. a, b
Jakosky, B. M., Zent, A. P., and Zurek, R. W.: The Mars Water Cycle: Determining the Role of Exchange with the Regolith, Icarus, 130, 87–95, 1997. a
Kauhanen, J., Siili, T., Järvenoja, S., and Savijärvi, H.: The Mars limited area model and simulations of atmospheric circulations for the Phoenix landing area and season of operation, J. Geophys. Res., E00A14, https://doi.org/10.1029/2007JE003011, 2008. a
Kieffer, H. H., Jakosky, B. M., and Snyder, C. W.: The planet Mars: from antiquity to present, in: Mars, edited by: George, M., University of Arizona Press, 1–32, https://ui.adsabs.harvard.edu/abs/1992mars.book....1K, 1992a. a
Kieffer, H. H., Jakosky, B. M., Snyder, C. W., and Matthews, M. S. (Eds.): Mars, University of Arizona Press, https://ui.adsabs.harvard.edu/abs/1992mars.book..835Z, 1992b.
Leino, J., Harri, A.-M., Paton, M., Polkko, J., Hieta, M., and Savijärvi, H.: Derived data products analyzed and presented in the manuscript “Sensitivity analysis of a Martian atmospheric column model with data from the Mars Science Laboratory”, Finnish Meteorological Institute [data set], https://doi.org/10.57707/FMI-B2SHARE.CAEC9FAFFD1A4166938715A0A8DA9125, 2024. a
Lemmon, M., Guzewich, S., Battalio, J., Malin, M., Vicente-Retortillo, A., Zorzano, M.-P., Martín-Torres, J., Sullivan, R., Maki, J., Smith, M., and Bell, J.: The Mars Science Laboratory record of optical depth measurements via solar imaging, Icarus, 408, 115 821, https://doi.org/10.1016/j.icarus.2023.115821, 2024. a, b
Louis, J. F.: A parametric model of vertical eddy fluxes in the atmosphere, Bound.-Lay. Meteorol., 17, 187–202, 1979. a
Manabe, S. and Wetherald, R. T.: Thermal Equilibrium of the Atmosphere with a Given Distribution of Relative Humidity, J. Atmos. Sci., 24, 241–259, https://doi.org/10.1175/1520-0469(1967)024<0241:TEOTAW>2.0.CO;2, 1967. a
Martínez, G. M., Newman, C. N., De Vicente-Retortillo, A., Fischer, E., Renno, N. O., Richardson, M. I., Fairén, A. G., Genzer, M., Guzewich, S. D., Haberle, R. M., Harri, A. M., Kemppinen, O., Lemmon, M. T., Smith, M. D., de la Torre-Juárez, M., and Vasavada, A. R.: The Modern Near-Surface Martian Climate: A Review of In-situ Meteorological Data from Viking to Curiosity, Space Sci. Rev., 212, 295–338, https://doi.org/10.1007/s11214-017-0360-x, 2017. a, b, c, d, e, f
McConnochie, T. H., Smith, M. D., Wolff, M. J., Bender, S., Lemmon, M., Wiens, R. C., Maurice, S., Gasnault, O., Lasue, J., Meslin, P.-Y., Harri, A.-M., Genzer, M., Kemppinen, O., Martínez, G. M., DeFlores, L., Blaney, D., Johnson, J. R., and Bell, J. F.: Retrieval of water vapor column abundance and aerosol properties from ChemCam passive sky spectroscopy, Icarus, 307, 294–326, https://doi.org/10.1016/j.icarus.2017.10.043, 2018. a, b, c, d
Millour, E., Forget, F., Spiga, A., Vals, M., Zakharov, V., Navarro, T., Montabone, L., Lefevre, F., Montmessin, F., Chaufray, J.-Y., Lopez-Valverde, M., Gonzalez-Galindo, F., Lewis, S., Read, P., Desjean, M.-C., and MCD/GCM Development Team: The Mars Climate Database (MCD version 5.3), in: EGU General Assembly Conference Abstracts, https://ui.adsabs.harvard.edu/abs/2017EGUGA..1912247M, p. 12247, 2017. a
Montmessin, F., Smith, M. D., Langevin, Y., Mellon, M. T., and Fedorova, A.: The Water Cycle, Cambridge Planetary Science, 338–373, https://doi.org/10.1017/9781139060172.011, 2017. a, b
Navarro, T., Madeleine, J.-B., Forget, F., Spiga, A., Millour, E., Montmessin, F., and Määttänen, A.: Global climate modeling of the Martian water cycle with improved microphysics and radiatively active water ice clouds, J. Geophys. Res.-Planets, 119, 1479–1495, https://doi.org/10.1002/2013JE004550, 2014. a
Paton, M., Harri, A.-M., Vierkens, O., and Savijärvi, H.: A user-orientated column modelling framework for efficient analyses of the Martian atmosphere, Geosci. Instrum. Method. Data Syst., 8, 251–263, https://doi.org/10.5194/gi-8-251-2019, 2019. a
Richardson, M. I. and Wilson, R. J.: Investigation of the nature and stability of the Martian seasonal water cycle with a general circulation model, J. Geophys. Res.-Planets, 107, 7-1–7-28, https://doi.org/10.1029/2001JE001536, 2002. a
Savijärvi, H.: A model study of the PBL structure on Mars and the Earth., Contributions to Atmospheric Physics/Beitraege zur Physik der Atmosphaere, 64, 219–229, 1991. a
Savijärvi, H.: Mars Boundary Layer Modeling: Diurnal Moisture Cycle and Soil Properties at the Viking Lander 1 Site, Icarus, 117, 120–127, https://doi.org/10.1006/icar.1995.1146, 1995. a, b
Savijärvi, H.: A model study of the atmospheric boundary layer in the Mars pathfinder lander conditions, Q. J. Roy. Meteor. Soc., 125, 483–493, https://doi.org/10.1002/qj.49712555406, 1999. a, b
Savijärvi, H. and Harri, A.-M.: Water vapor adsorption on Mars, Icarus, 357, 114 270, https://doi.org/10.1016/j.icarus.2020.114270, 2021. a, b, c
Savijärvi, H. and Määttänen, A.: Boundary-layer simulations for the Mars Phoenix lander site, Q. J. Roy. Meteor. Soc., 136, 1497–1505, https://doi.org/10.1002/qj.650, 2010. a
Savijärvi, H. and Siili, T.: The Martian slope winds and the nocturnal PBL jet, J. Atmos. Sci., 50, 77–88, 1993. a
Savijärvi, H., Määttänen, A., Kauhanen, J., and Harri, A.-M.: Mars Pathfinder: new data and new model simulations, Q. J. Roy. Meteor. Soc., 130, 669–683, 2004. a, b, c
Savijärvi, H., Crisp, D., and Harri, A.-M.: Effects of CO2 and dust on present-day solar radiation and climate on Mars, Q. J. Roy. Meteor. Soc., 131, 2907–2922, https://doi.org/10.1256/qj.04.09, 2005. a, b, c, d, e
Savijärvi, H., Harri, A.-M., and Kemppinen, O.: The diurnal water cycle at Curiosity: Role of exchange with the regolith, Icarus, 265, 63–69, https://doi.org/10.1016/j.icarus.2015.10.008, 2016. a, b, c, d, e, f, g, h, i, j
Savijärvi, H., Paton, M., and Harri, A.-M.: New column simulations for the Viking landers: Winds, fog, frost, adsorption?, Icarus, 310, 48–53, https://doi.org/10.1016/j.icarus.2017.11.007, 2018. a
Savijärvi, H., McConnochie, T. H., Harri, A.-M., and Paton, M.: Annual and diurnal water vapor cycles at Curiosity from observations and column modeling, Icarus, 319, 485–490, https://doi.org/10.1016/j.icarus.2018.10.008, 2019a. a, b, c, d, e, f, g, h, i, j, k, l, m, n, o, p
Savijärvi, H., McConnochie, T. H., Harri, A.-M., and Paton, M.: Water vapor mixing ratios and air temperatures for three martian years from Curiosity, Icarus, 326, 170–175, https://doi.org/10.1016/j.icarus.2019.03.020, 2019b. a, b, c
Savijärvi, H., Martinez, G., Fischer, E., Renno, N., Tamppari, L., Zent, A., and Harri, A.-M.: Humidity observations and column simulations for a warm period at the Mars Phoenix lander site: Constraining the adsorptive properties of regolith, Icarus, 343, 113 688, https://doi.org/10.1016/j.icarus.2020.113688, 2020a. a, b, c
Savijärvi, H., Martinez, G., Harri, A.-M., and Paton, M.: Curiosity observations and column model integrations for a martian global dust event, Icarus, 337, 113 515, https://doi.org/10.1016/j.icarus.2019.113515, 2020b. a, b
Savijärvi, H. I., Harri, A.-M., and Kemppinen, O.: Mars Science Laboratory diurnal moisture observations and column simulations, J. Geophys. Res.-Planets, 120, 1011–1021, https://doi.org/10.1002/2014JE004732, 2015. a, b, c, d
Siili, T., Haberle, R., Murphy, J., and Savijarvi, H.: Modelling of the combined late-winter ice cap edge and slope winds in Mars' Hellas and Argyre regions, Planet. Space Sci., 47, 951–970, https://doi.org/10.1016/S0032-0633(99)00016-1, 1999. a
Steele, L. J., Lewis, S. R., Patel, M. R., Montmessin, F., Forget, F., and Smith, M. D.: The seasonal cycle of water vapour on Mars from assimilation of Thermal Emission Spectrometer data, Icarus, 237, 97–115, https://doi.org/10.1016/j.icarus.2014.04.017, 2014. a
Stull, R. B.: An Introduction to Boundary Layer Meteorology, vol. 13 of Atmospheric and Oceanographic Sciences Library, Springer Netherlands, Dordrecht, ISBN 9027727694, 1988. a
Vasavada, A. R., Piqueux, S., Lewis, K. W., Lemmon, M. T., and Smith, M. D.: Thermophysical properties along Curiosity's traverse in Gale crater, Mars, derived from the REMS ground temperature sensor, Icarus, 284, 372–386, https://doi.org/10.1016/j.icarus.2016.11.035, 2017. a
Viúdez-Moreiras, D., Newman, C. E., Forget, F., Lemmon, M., Banfield, D., Spiga, A., Lepinette, A., Rodriguez-Manfredi, J. A., Gómez-Elvira, J., Pla-García, J., Muller, N., Grott, M., and the TWINS/InSight team: Effects of a Large Dust Storm in the Near-Surface Atmosphere as Measured by InSight in Elysium Planitia, Mars. Comparison With Contemporaneous Measurements by Mars Science Laboratory, J. Geophys. Res.-Planets, 125, e2020JE006 493, https://doi.org/10.1029/2020JE006493, 2020. a
Zent, A. P.: The Phoenix TECP relative humidity sensor, in: Eighth International Conference on Mars, https://ui.adsabs.harvard.edu/abs/2014LPICo1791.1474Z, Abstract 1474, 2014. a
Zurek, R. W., Barnes, J. R., Haberle, R. M., Pollack, J. B., Tillman, J. E., and Leovy, C. B.: Dynamics of the atmosphere of Mars, in: Mars, edited by: George, M., University of Arizona Press, https://ui.adsabs.harvard.edu/abs/1992mars.book..835Z, 835–934, 1992. a
- Abstract
- Introduction
- Atmospheric column model sensitivity analysis
- Results of the sensitivity experiments
- Summary and discussion
- Appendix A: Sensitivity experiments extending up to 5 km
- Data availability
- Author contributions
- Competing interests
- Disclaimer
- Financial support
- Review statement
- References