the Creative Commons Attribution 4.0 License.
the Creative Commons Attribution 4.0 License.
 | 07 May 2024
Simultaneous OI 630 nm imaging observations of thermospheric gravity waves and associated revival of fossil depletions around midnight near the equatorial ionization anomaly (EIA) crest
Saranya Padincharapad
Anand Kumar Singh
Prasanna Mahavarkar
Ashok Priyadarshan Dimri
We report F-region airglow imaging of fossil plasma depletions around midnight that revived afresh under persisting thermospheric gravity wave (GW) activity. An all-sky imager recorded these events in OI 630 nm imaging over Ranchi (23.3° N, 85.3° E; mlat. ∼19° N), India, on 16 April 2012. Northward-propagating and east–west-aligned GWs (λ∼210 km, v∼64 m s−1, and τ∼0.91 h) were seen around midnight. Persisting for ∼2 h, this GW activity revived two co-existing and eastward-drifting fossil depletions, DP1 and DP2. GW-driven revival was prominently seen in depletion DP1, wherein its apex height grew from ∼600 to >800 km, and the level of intensity depletion increased from ∼17 % to 50 %. The present study is novel in the sense that simultaneous observations of thermospheric GW activity and the associated evolution of depletion in OI 630 nm airglow imaging, as well as that around local midnight, have not been reported earlier. The current understanding is that GW phase fronts aligned parallel to the geomagnetic field lines and eastward-propagating are more effective in seeding Rayleigh–Taylor (RT) instability. Here, GW fronts were east–west-aligned (i.e., perpendicular to the geomagnetic field lines) and propagated northward, yet they revived fossil depletions.
- Article
(8972 KB) - Full-text XML
-
Supplement
(573 KB) - BibTeX
- EndNote


Gravity waves (GWs) are well-known for influencing the mesosphere–lower thermosphere–ionosphere (MLTI) region. GWs significantly contribute to the momentum and energy budget of the MLT region via wave-dissipation processes (Fritts and Alexander, 2003; Holton, 1983). Apart from the dominant solar and geomagnetic inputs, GWs are the key element in some of the electrodynamical processes in the ionosphere, e.g., irregularities, atmosphere–ionosphere (AI) coupling, or traveling ionospheric disturbances. In the equatorial F region, GWs modulate the ionospheric plasma into wave-like ionization structures. Under favorable conditions, these structures act as a seed for the generalized Rayleigh–Taylor (GRT) instability that generates the irregularities (Fritts et al., 2009; Huba and Joyce, 2007, 2010; Huba and Liu, 2020; Hysell et al., 1990; Kelley, 2009; Woodman, 2009). GWs are also important in the AI coupling during deep convection activity, thunderstorms, lightning, cyclones, tornadoes, transient luminous event (TLE) or sprite initiation, or tsunami (Azeem and Barlage, 2018; Maurya et al., 2022; Huba et al., 2015). GWs can also generate medium-scale traveling ionospheric disturbances (MSTIDs) (Fukushima et al., 2012; Figueiredo et al., 2018; Heale et al., 2022, and the references cited therein). In the course of their propagation, GWs can also induce periodic fluctuations in the ionospheric parameters, e.g., the electron density or total electron content (TEC), the F-region height, temperatures, winds (Ford et al., 2006, 2008; Klausner et al., 2009; Parihar et al., 2018; Vadas and Azeem, 2021), or airglow emission (Huba et al., 2015; Makela et al., 2011).
The crucial role of GWs in seeding the post-sunset equatorial Spread-F (ESF) or plasma bubbles (EPBs) is fairly well understood (Abdu et al., 2009; Fritts et al., 2009; Huba and Joyce, 2007, 2010; Hysell et al., 1990; Kelley, 2009; Singh et al., 1997; Tsunoda, 2010; Tulasi Ram et al., 2014; Woodman, 2009). However, their role in the seeding of the midnight or post-midnight irregularities remains poorly understood, especially when the important criteria for the triggering of the GRT instability are absent (e.g., the favorable alignment of the solar terminator with the geomagnetic field lines or the pre-reversal enhancement, PRE, of the zonal electric field). Recently, Huba and Liu (2020) reported the global simulations of the ESF using the SAMI3/WACCM-X coupled model. SAMI3 is the abbreviation for “Sami3 is Another Model of the Ionosphere” (Huba et al., 2008), and WACCM-X stands for the “Whole Atmosphere Community Climate Model with thermosphere and ionosphere extension” (Liu et al., 2010). For the first time, Huba and Liu (2020) demonstrated through simulations that GWs are the dominant seed mechanism and can spontaneously generate the ESF and that the EPBs develop self-consistently in the post-sunset ionosphere. Studies by Nishioka et al. (2012) show that the GRT instability can occur near midnight under the influence of enhanced GW activity and then can lead to the growth of irregularities. MSTIDs are an important generation mechanism of post-midnight irregularities wherein the electric field perturbations associated with them acts as the seed (Miller et al., 2009; Taori et al., 2015). Otsuka (2018) presented an elaborative review of these mechanisms. All-sky airglow imaging (ASAI) along with the radar, ionosonde, and GPS measurements has significantly contributed to our understanding of the crucial role of GWs in seeding the EPBs (Mendillo and Baumgardner, 1982; Mendillo et al., 1997; Taori et al., 2010; Yadav et al., 2017). The Spread-F Experiment (SpreadFEx) carried out in Brazil during September–November 2005 is one such example (Fritts et al., 2009). In the Indian subcontinent, Sreeja et al. (2009) reported the GWs in OI 630 nm dayglow intensity variations that acted as a seed for the ESF irregularities.
GWs that give rise to the EPBs have usually been reported in the MLT region airglow imaging (e.g., Fritts et al., 2009; Paulino et al., 2011; Takahashi et al., 2009; Taori et al., 2013). Reports featuring them in the F-region airglow imaging are rare and limited to those of Makela et al. (2011), Paulino et al. (2016), Paulino et al. (2018), Sau et al. (2018), and Smith et al. (2015). Makela et al. (2011) and Smith et al. (2015) reported the thermospheric imaging observations of GWs associated with tsunami and earthquake, respectively. Paulino et al. (2016), Paulino et al. (2018), and Sau et al. (2018) presented their observations in OI 630 nm imaging from Brazil and India, respectively. However, these authors did not report any occurrence of depletions during the ongoing GW activity. We report, for the first time, simultaneous observations of GWs and depletions in the F-region airglow imaging.
In the course of temporary campaign-based ASAI observations of OI 630 nm emission under the Climate And Weather of Sun-Earth System (CAWSES) India Phase II program at Ranchi (23.3° N, 85.3° E; mlat. ∼19° N), GW activity and fossil depletions were seen together on 16 April 2012, with the former reviving the latter. Fossil depletions are the remnants of airglow depletion or EPBs that have ceased growing upward or poleward; however, they continue to persist and move with ambient plasma drift. Under the Maui Middle Atmosphere and Lower Thermosphere (Maui-MALT) initiative, Makela et al. (2004) reported their extensive observations in OI 630 nm imaging from Haleakala volcano (20.7° N, 203.7° E; mlat. 21.3° N), Hawaii, during the solar maximum of 2002–2003. Chapagain et al. (2011) presented their limited observations from Christmas Island (2.1° N, 157.4° W; mlat. 2.8° N) during September 1995. In India, Sekar et al. (2007) presented their case study from Gadanki (13.5° N, 79.2° E; mlat. 6.3° N). However, these investigations did not discuss any resurgence of fossil depletions associated with the GW activity. The novelty of this study is that the fossil depletions revived into “active depletions” after the emission layer witnessed the GW activity. Recently, Wrasse et al. (2021) presented an interesting event wherein a fossil EPB merged with other ones after interacting with an electrified MSTID and turned into an active bubble.
Under the CAWSES India Phase II program, ASAI was implemented for limited nightglow observations at Ranchi (23.3° N, 85.3° E; mlat. ∼19° N), located near the crest of the equatorial ionization anomaly (EIA) in India during April 2012. Parihar et al. (2017) and Parihar (2019) have described this ASAI system in detail. OI 630 nm emission was monitored using a 2.2 nm half-power bandwidth optical filter with a transmittance of ∼77 %. Our imager's field of view roughly covered a region of about 7–8° in latitude and longitude at 250 km over Ranchi. Airglow images were flat-fielded to reduce the inhomogeneous contribution at lower elevations due to the van Rhijn effect and non-uniform sensitivity of a charge-coupled device (CCD) detector at different pixels. Next, following the technique described by Wrasse et al. (2021), we detrended the individual images to enhance the contrast of airglow features using a 1 h running average image. Using known astral positions and assuming an OI 630 nm emission peak at 250 km, the geographic coordinates of each pixel were determined following the technique of Garcia et al. (1997). Using this information, all-sky images were unwarped. We follow the technique discussed by Pimenta et al. (2003) to determine the drift velocity of the depletions. First, for a given latitude, two intensity profiles along the east–west direction as a function of distance were generated using two successive unwarped images. Next, the east–west displacement of depletion was estimated using these two profiles, from which drift speed was determined (see Pimenta et al., 2003, for the details of this technique). Similarly, the propagation characteristics of GW fronts were estimated by tracking a faint crest and trough along the propagation direction in the consecutive images. As GW fronts were unclear in the images, we used contrast-enhanced images. We also generated north–south (NS) keograms to visualize GW traces and determine their speed. A keogram is a time-versus-latitude plot generated by extracting a NS column from individual images and stacking them horizontally. Next, GW speed was also estimated from the slope of the wave traces seen in these keograms (Makela et al., 2006). We looked into the total electron content (TEC) measurements from the International GNSS Service station Hyderabad (17.3° N, 78.6° E; mlat. ∼12.0° N, located nearby and south of Ranchi) to ascertain the GW activity seen in the ASAI observations (source: https://t-ict4d.ictp.it/nequick2/gnss-tec-calibration, last access: 1 May 2024, Ciraolo et al., 2007). Quiet geomagnetic conditions prevailed on this night, with Kp<2, Ap=4, and nT.
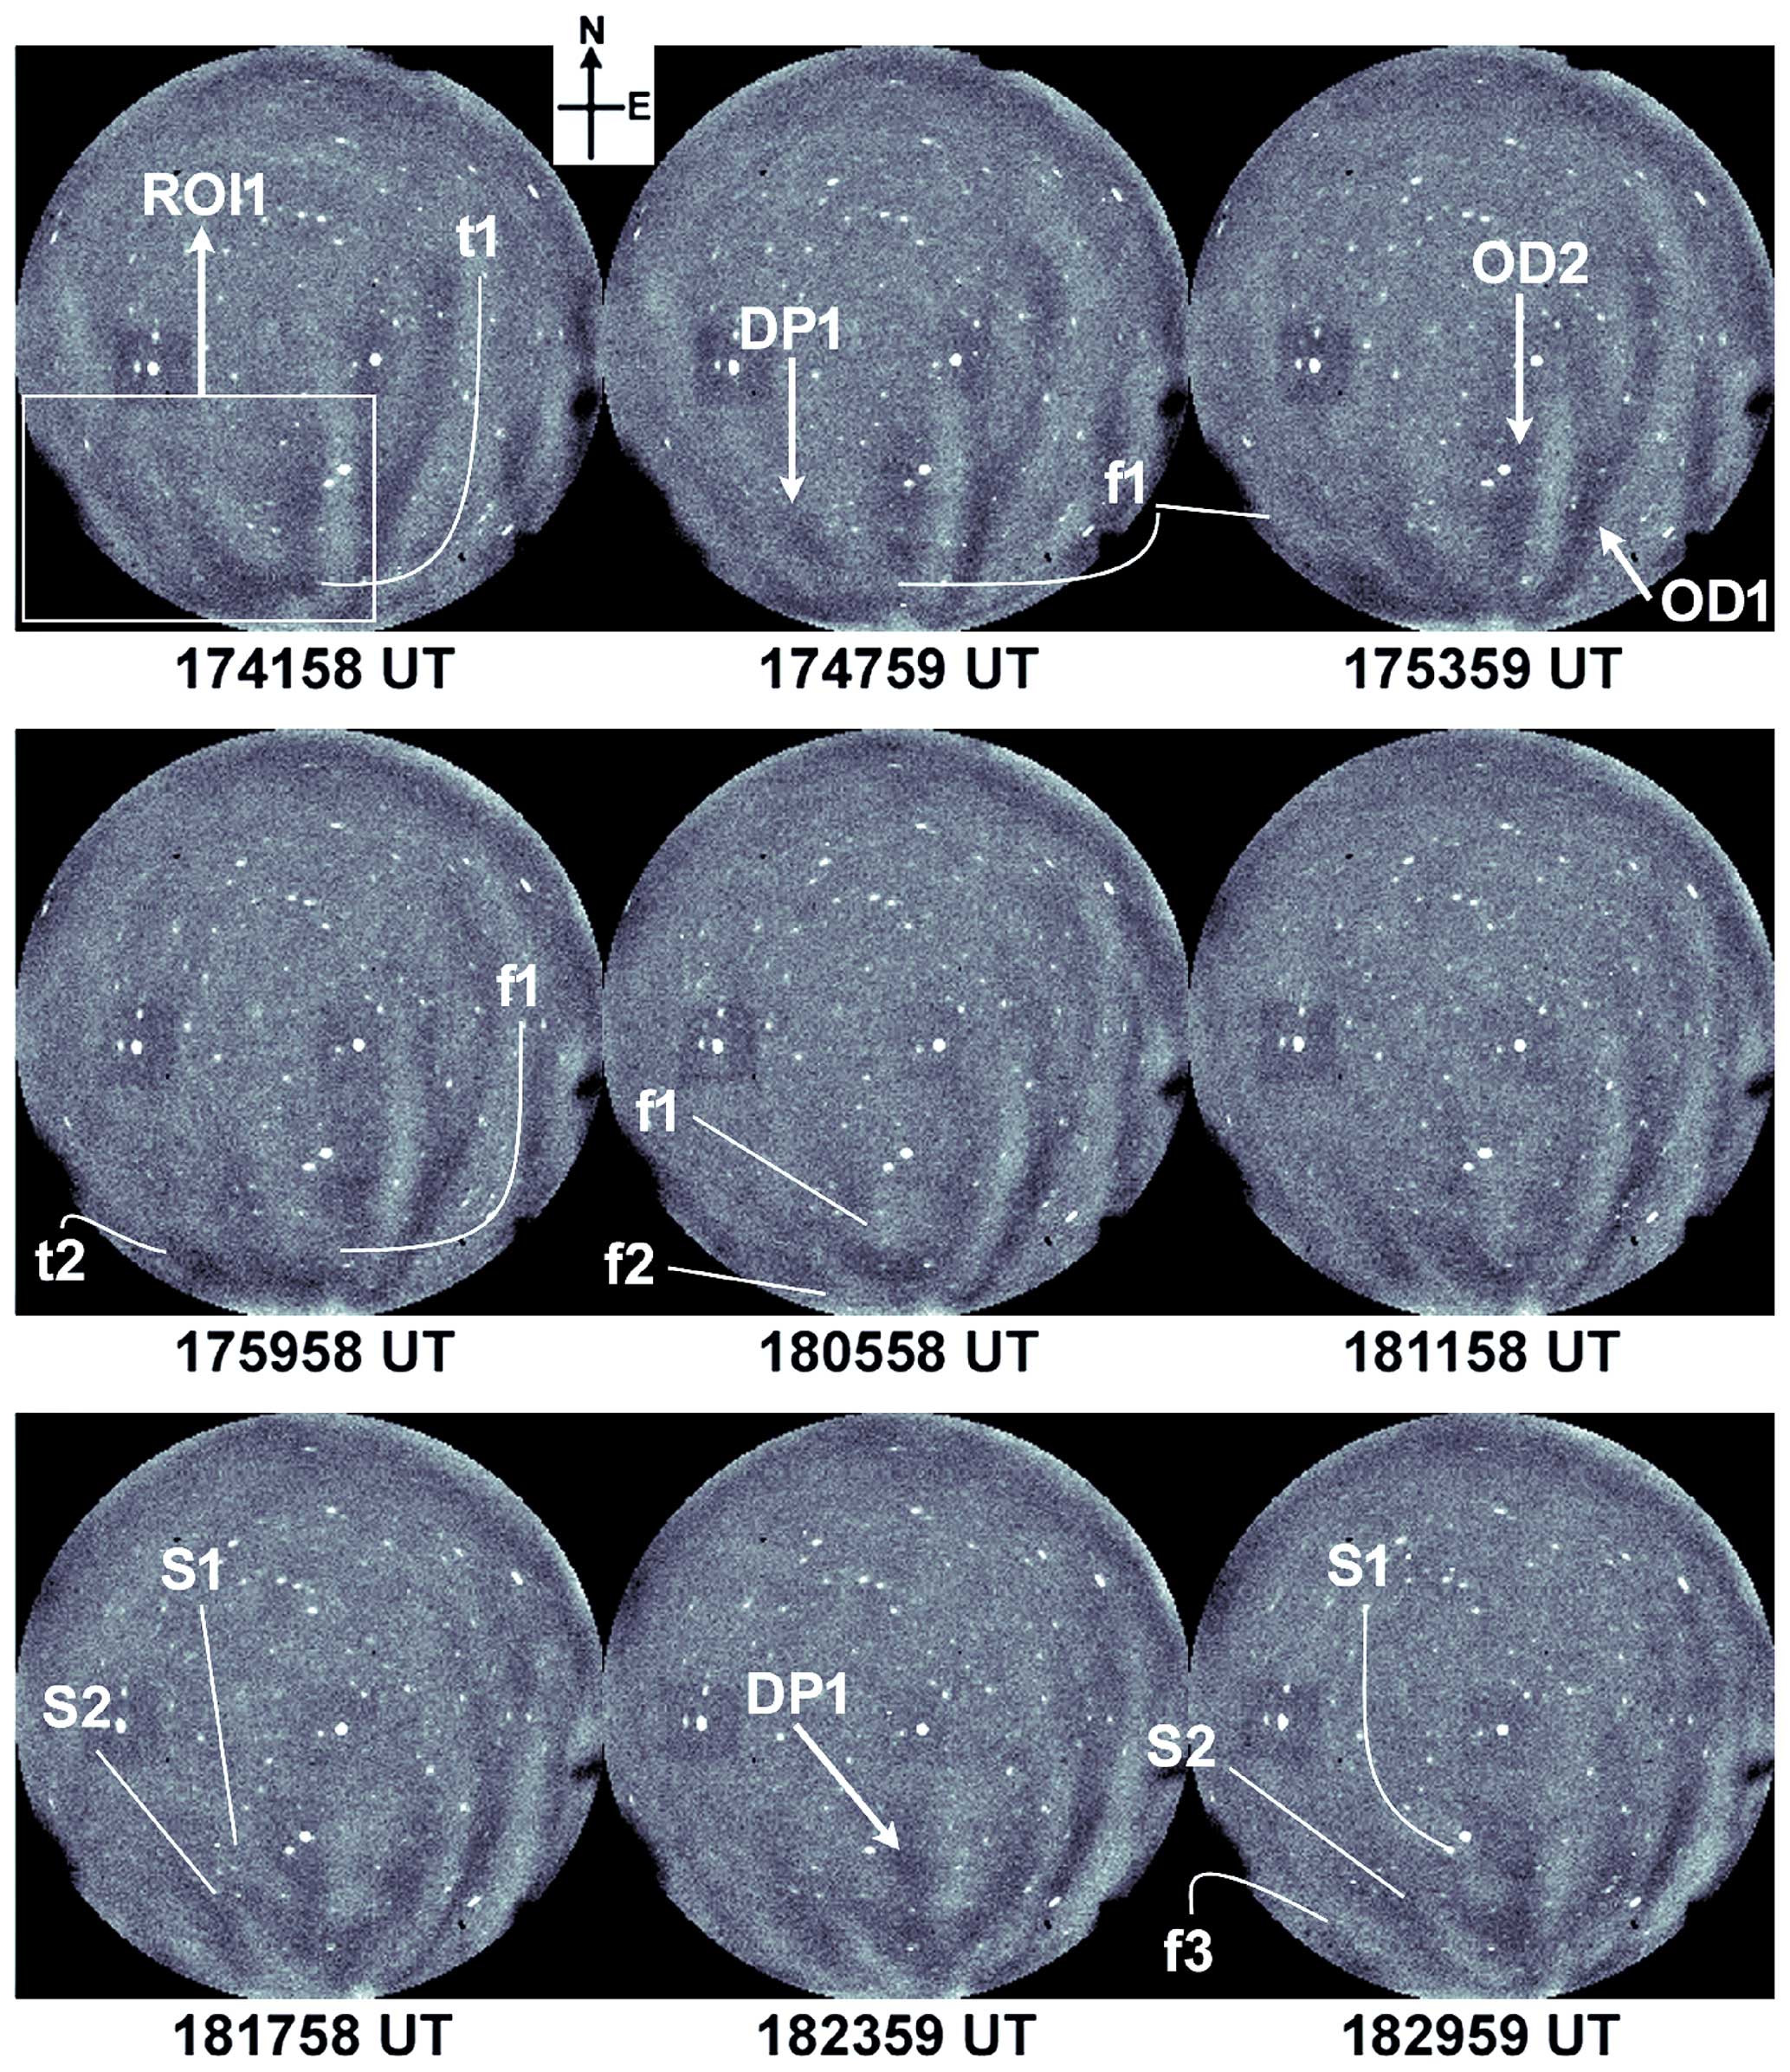
Figure 1ASAI images during 17:42–18:30 UT over Ranchi (23.3° N, 85.3° E; mlat. ∼19° N) on 16 April 2012. DP1 is the first fossil plasma depletion that showed GW-driven revival. Depletions OD1 and OD2 preceded depletion DP1. ROI1 is the region of interest wherein the south–north-propagating GW activity and faint signatures of eastward-drifting depletion DP1 were seen initially. Some weakly noticeable GW fronts are “f1”, “f2”, and “f3” (in succession). t1 and t2 are troughs that precede fronts f1 and f2, respectively. Upon interaction with depletions present in ROI1, EW-aligned GW fronts f1 and f2 fragmented and formed structures “S1” and “S2” that, subsequently, were linked to the western wall of depletion DP1 and started moving in unison.
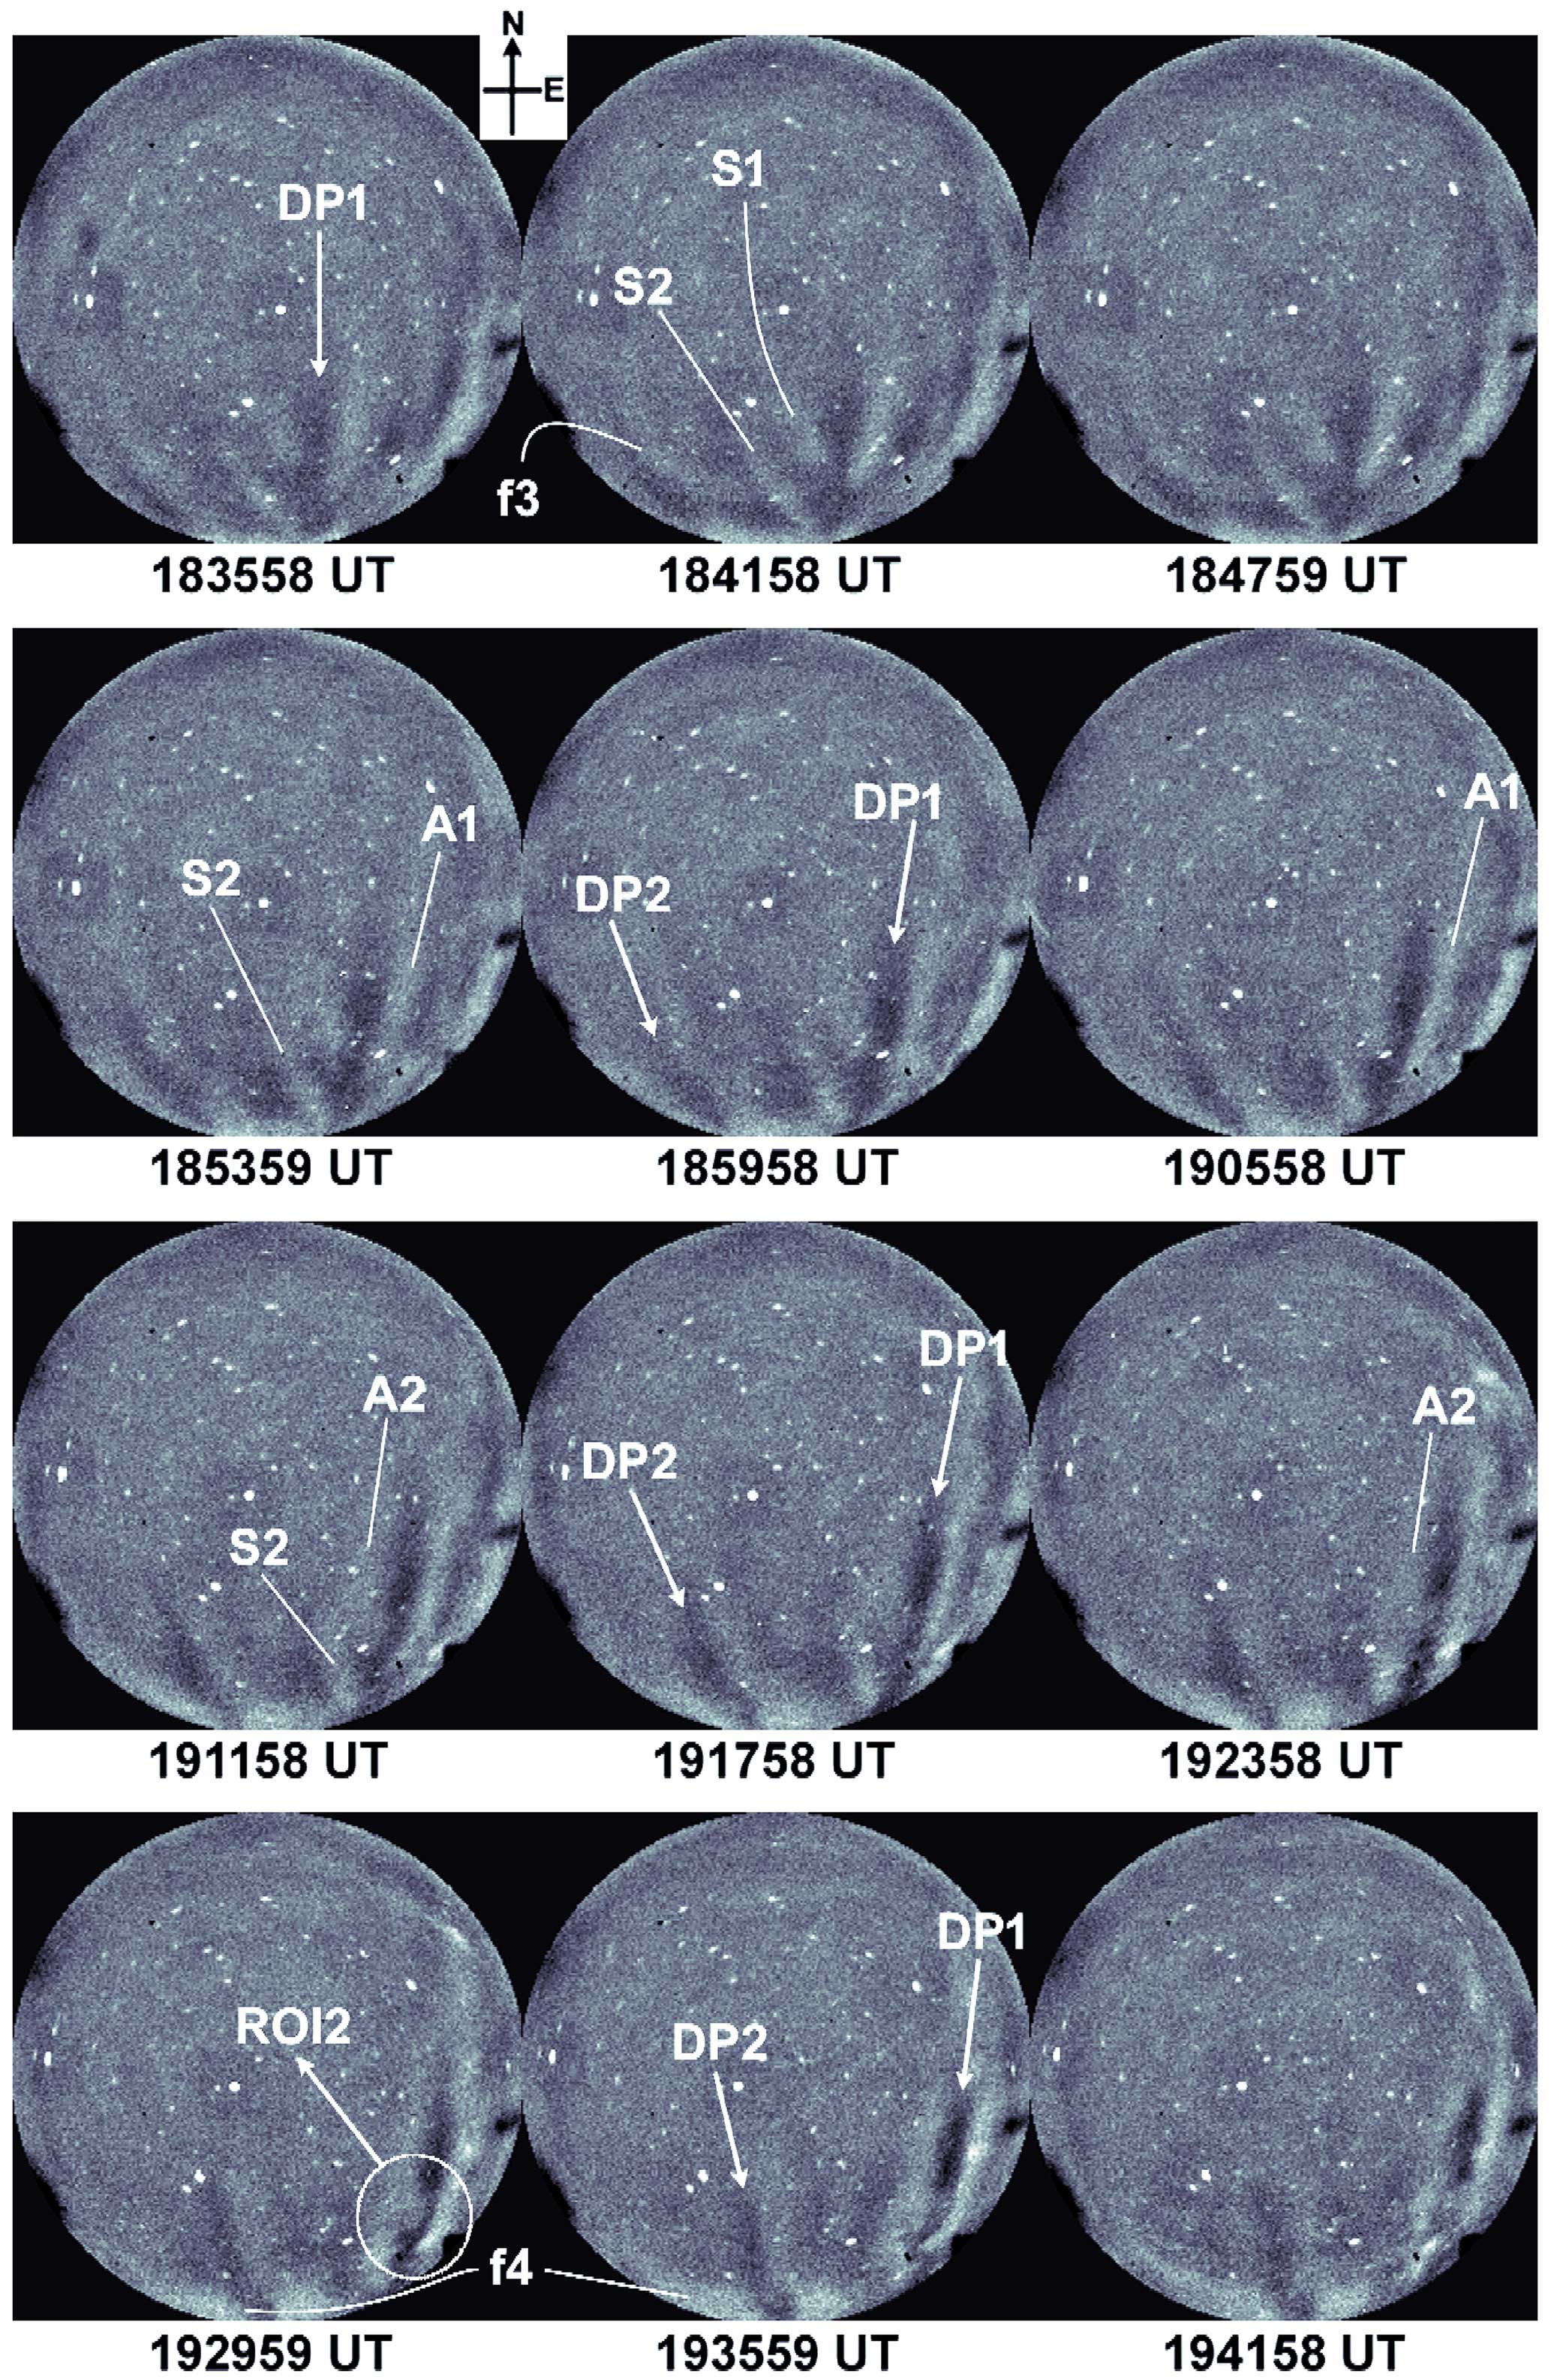
Figure 2Airglow images showing the subsequent evolution of depletion DP1 during 18:36–19:42 UT. In the course of their eastward motion, structures S1 and S2 significantly tilted eastwards, aligned with the western wall of depletion DP1, and contributed to its revival. DP2 is another fossil depletion that showed GW-driven revival. Some noticeable GW fronts are f3 and f4. A1 and A2 are two arc-shaped regions of airglow enhancement near the eastern and western walls of depletion DP1. ROI2 is the region of interest wherein ambient plasma diffusion occurred across the western wall of depletion DP1.
Such GW-driven revival of fossil depletions was recorded in airglow images during 17:00–20:00 UT on 16 April 2012. Here, Indian standard time (IST) is universal time (UT) + 05:30 and local time (LT) is ≈ IST. As such, 17:00–20:00 UT corresponds to ∼1.5 h duration before and after the local midnight. Figures 1 and 2 present airglow images that depict this event seen over Ranchi during 17:42–19:42 UT on 16 April 2012. As the faint airglow features were getting lost in the unwarping process, warped all-sky images are presented. Supplement Video S1 shows the movie created from these images that feature this event. Fossil depletions of interest to us that showed the GW-driven revival are marked as DP1 and DP2 in Figs. 1 and 2. Here, ROI1 is the region of interest wherein a few weakly perceivable fronts of GWs and fossil depletions coexisted initially.

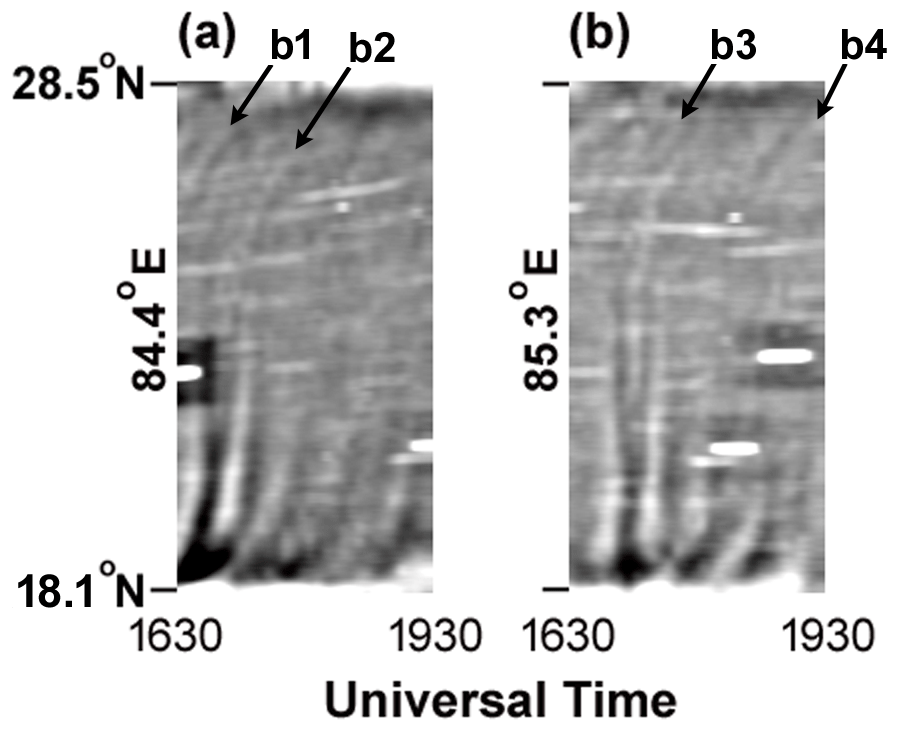
Figure 4(a–b) North–south (NS) keogram along 84.4 and 85.3° E longitude generated from OI 630 nm images during 17:30–19:30 UT. Alternating bright and dark intensity striations (i.e., wave traces) can be seen over the north, probably depletion–masked GW features over the south, and hence these wave traces were not seen. The slope of these striations indicates the south–north movement of the GW fronts. A few clear wave traces that were used to estimate the speeds of the GWs are marked by black arrows as “b1”, “b2”, “b3”, and “b4”.
3.1 Signatures of GW activity in the F region
We first observed faint signatures of GW activity near the southern edge of the field of view (FOV) during ∼ 17:15–17:24 UT. Successive images showed unclear signatures of GW activity. Starting at ∼ 17:30 UT, their presence became more evident and continued until 19:06 UT or so. GW fronts were not clearly seen because of their interaction with co-existing depletions. Some weakly perceivable bright fronts are marked as “f1”, “f2”, “f3”, and “f4” in Figs. 1 and 2. Similarly, dark troughs that precede fronts f1 and f2 are marked as “t1” and “t2”, respectively. Often, GWs in OI 630 nm imaging are faint and unclear. Under similar conditions, Makela et al. (2011) found that time difference (TD) images have shown the ability to reflect such GW faint fronts. In their work, initial analysis of raw images did not show any GW activity linked with tsunami; however, TD images indeed reflected the associated GWs. We generated such TD images that are shown in Fig. 3, which clearly shows dark troughs t1 and t2 and GW fronts f1 and f2. NS keograms (shown in Fig. 4a and b) showed a few clear alternating bright and dark intensity striations over the north, and their slope indicates that GWs propagated towards the north. We estimated GW propagation characteristics using the slope of wave traces (marked by black arrows as “b1”, “b2”, “b3”, and “b4”) in keograms and cross-verified them with the intensity profiling technique. We found that these GWs propagated from the south to the north with a phase speed (v) of m s−1 and had a horizontal wavelength (λ) and period (τ) of km and h, respectively.
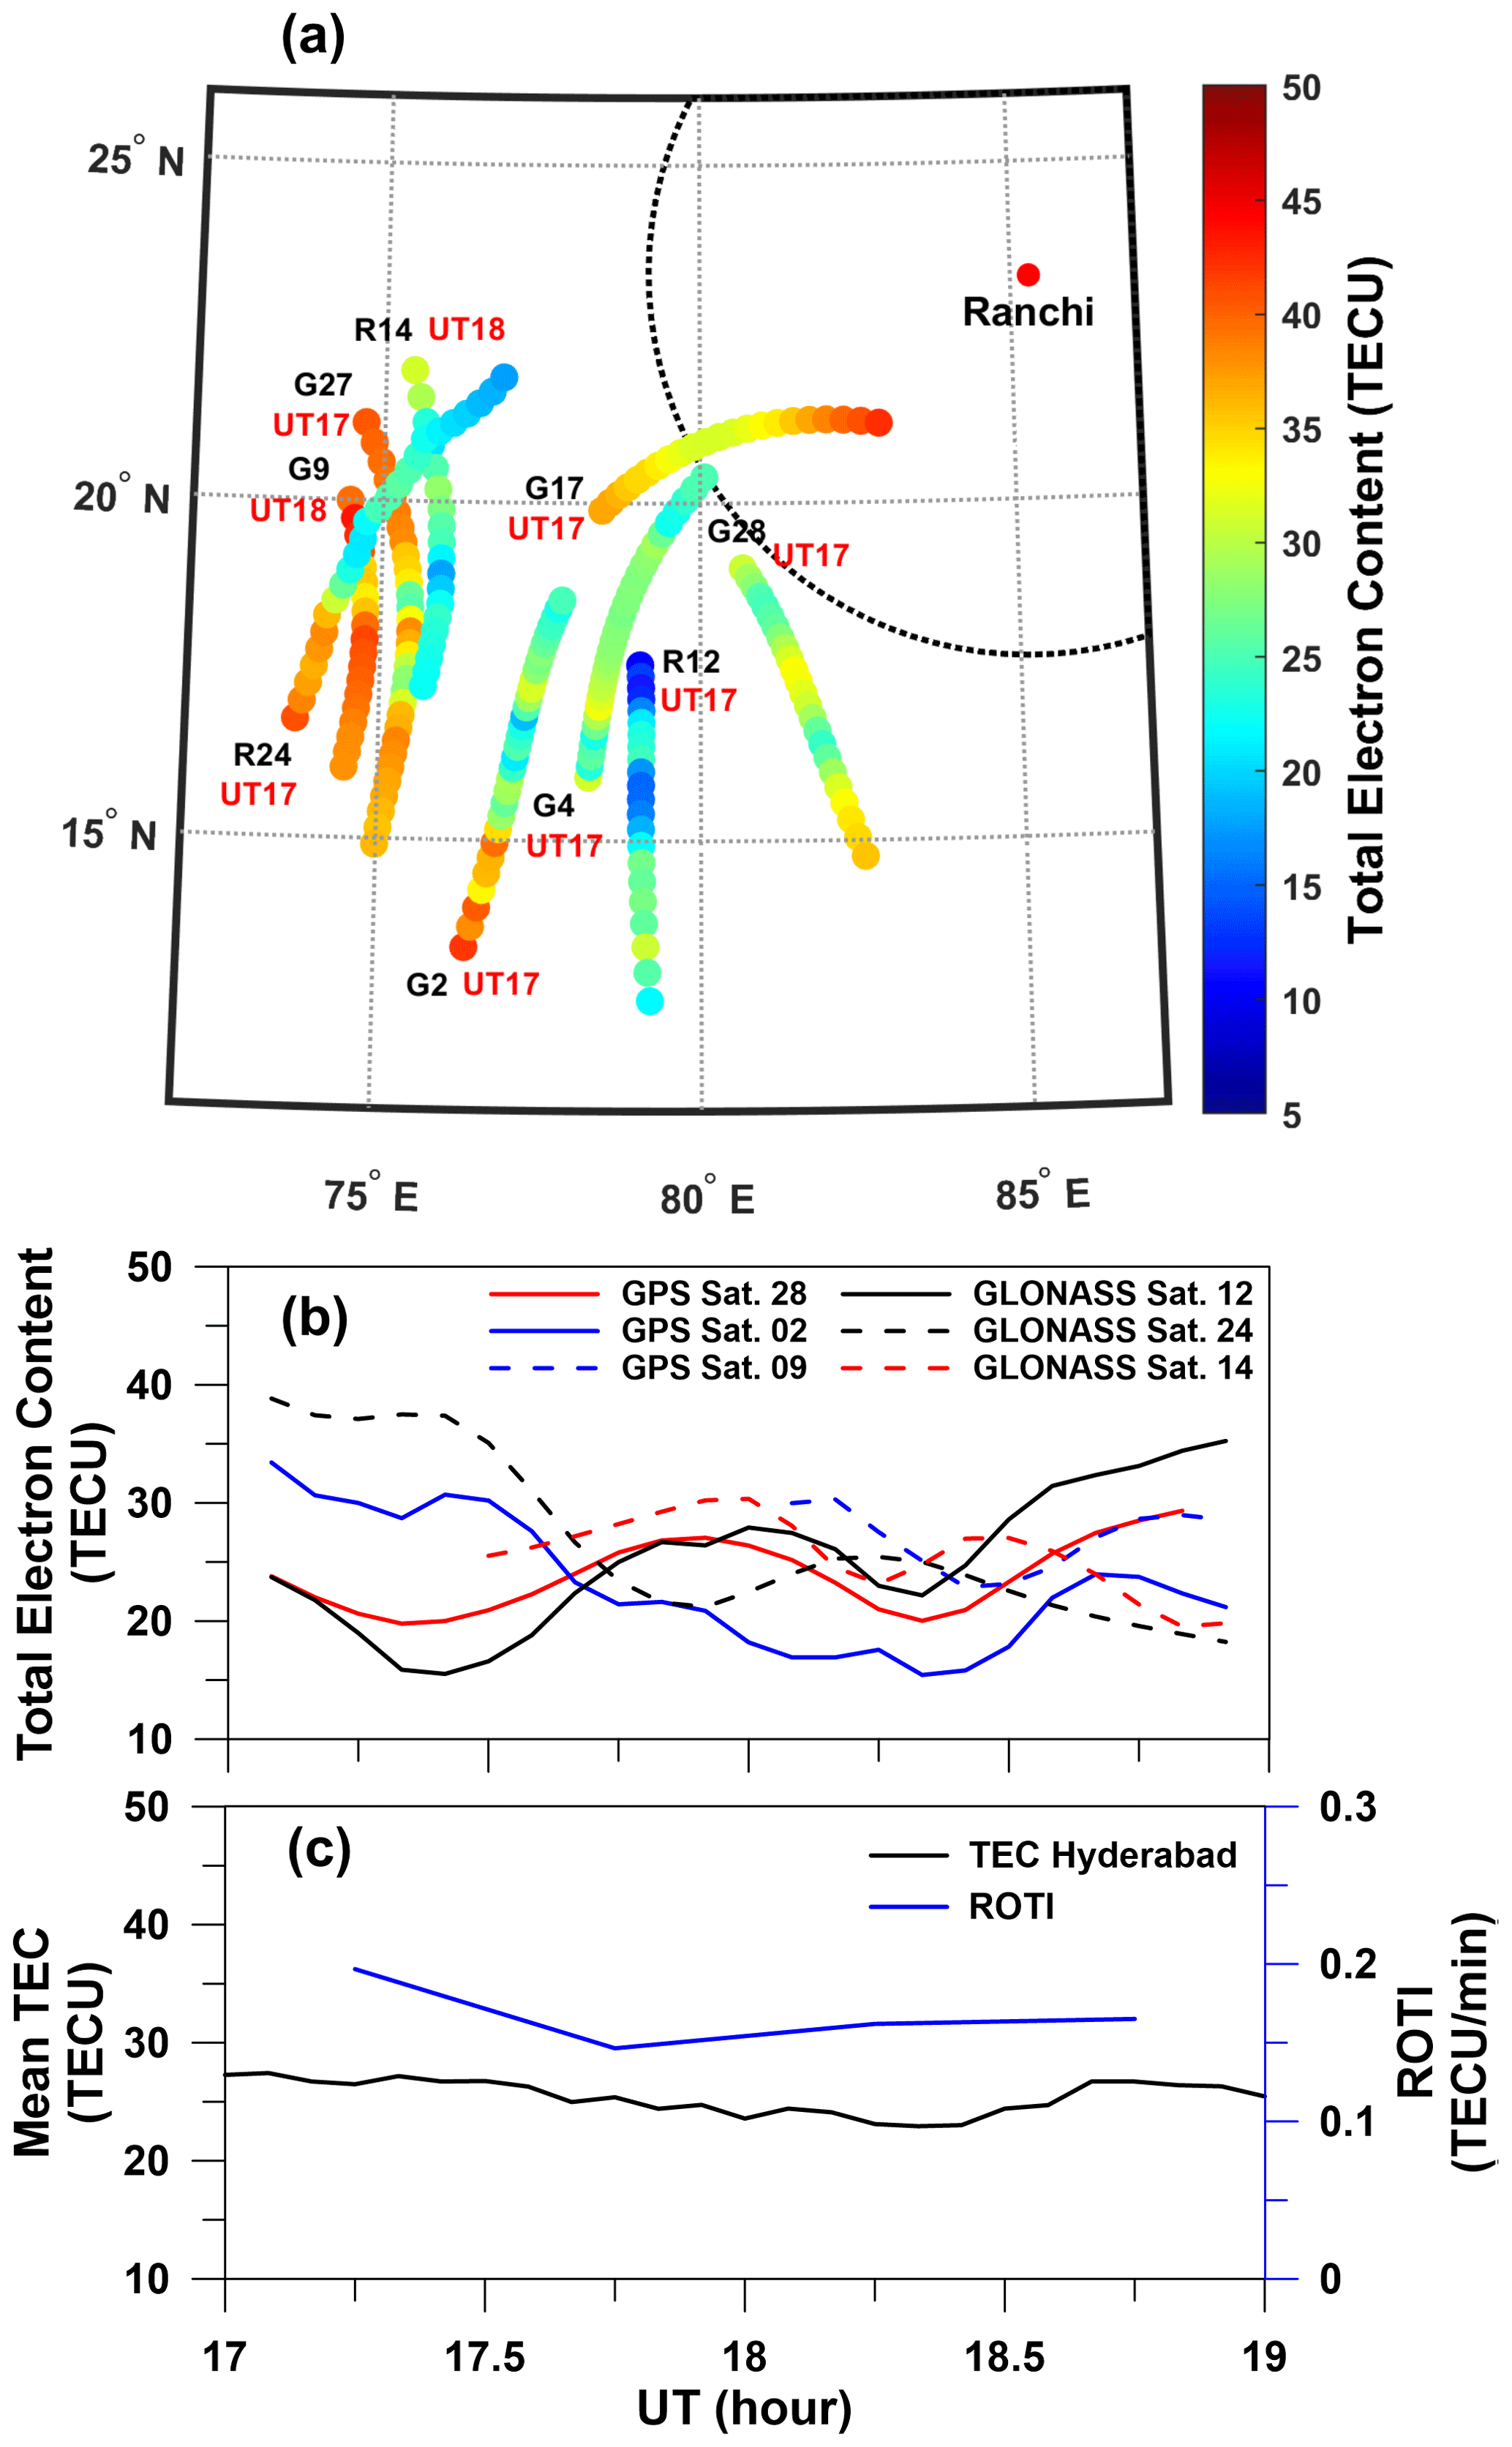
Figure 5(a) Scatter plot of the TEC along the track of IPPs for a few GPS and GLONASS satellites (prefixed as “G” and “R”, respectively) in the geographic grid of 5–35° N × 65–95° E during 16:30–19:30 UT on 16 April 2012. PRN numbers of GPS/GLONASS satellites along with the start time at 17:00 UT are marked adjacent to the corresponding IPP trajectory. G28’s trajectory lay close to the southwestern sector of the ASAI. Imager’s field of view is shown with a dashed quarter circle with its center at Ranchi. (b) TEC variations of a few GPS/GLONASS satellites showing the presence of GW activity. (c) Mean TEC and ROTI variation over Hyderabad (17.3° N, 78.6° E; mlat. ∼12.0° N, located equatorward of Ranchi).

Figure 6Selected ASAI images showing the revival of fossil depletion DP3 during 17:30–18:54 UT on 6 March 2013 over Ranchi. ROI3 is the region of interest wherein depletion DP3 appeared sliced by an unclear thin streak of slightly enhanced airglow. BR1 and BR2 are two structures that developed on its eastern wall.
We further looked into the TEC measurements from IGS station Hyderabad (17.3° N, 78.6° E; mlat. ∼12.0° N), India, to confirm this ongoing GW activity. Figure 5 shows the TEC measurements depicting GW activity in and around Hyderabad during 17:00–20:00 UT on this night. Figure 5a shows the scatter plots of the TEC along the trajectory of ionospheric pierce points (IPPs) for different GPS satellites during 17:00–19:30 UT on this night. Pseudo-random noise (PRN) numbers of GPS satellites, along with the start time at 17:00 UT, are indicated next to the corresponding IPP trajectory. TEC variations along the NS-aligned IPP tracks (e.g., G27 and G28) clearly show the wavelike fluctuations in the 15–20° N latitude range. The temporal evolution of the TEC for a few satellites is shown in Fig. 5b. The mean TEC and its change index, i.e., ROTI, are shown in Fig. 5c. Of interest to us is G28's TEC measurement as its IPP trajectory lay close to the imager’s ROI1 during 17:00–18:00 UT, which showed a strong signature of GWs. By performing the periodogram analysis of the temporal and spatial variation of its TEC, we estimated the propagation characteristics of GW to be h, km, and m s−1, which is in good agreement with the ASAI observations. Further, the propagation direction of GWs seen in airglow imaging is in good agreement with these previous reports. Studies of the GW activity at the MLT heights over a farther low-latitude station Prayagraj (25.5° N, formerly Allahabad) in India showed their propagation to be either northward or northeast around midnight during April–May (Mukherjee et al., 2010). A comprehensive study of thermospheric GWs in the ASAI observations over Tirunelveli (8.7° N) in India during 2013–2015 indicated their propagation toward north-northwest during the equinoxes (Sau et al., 2018).
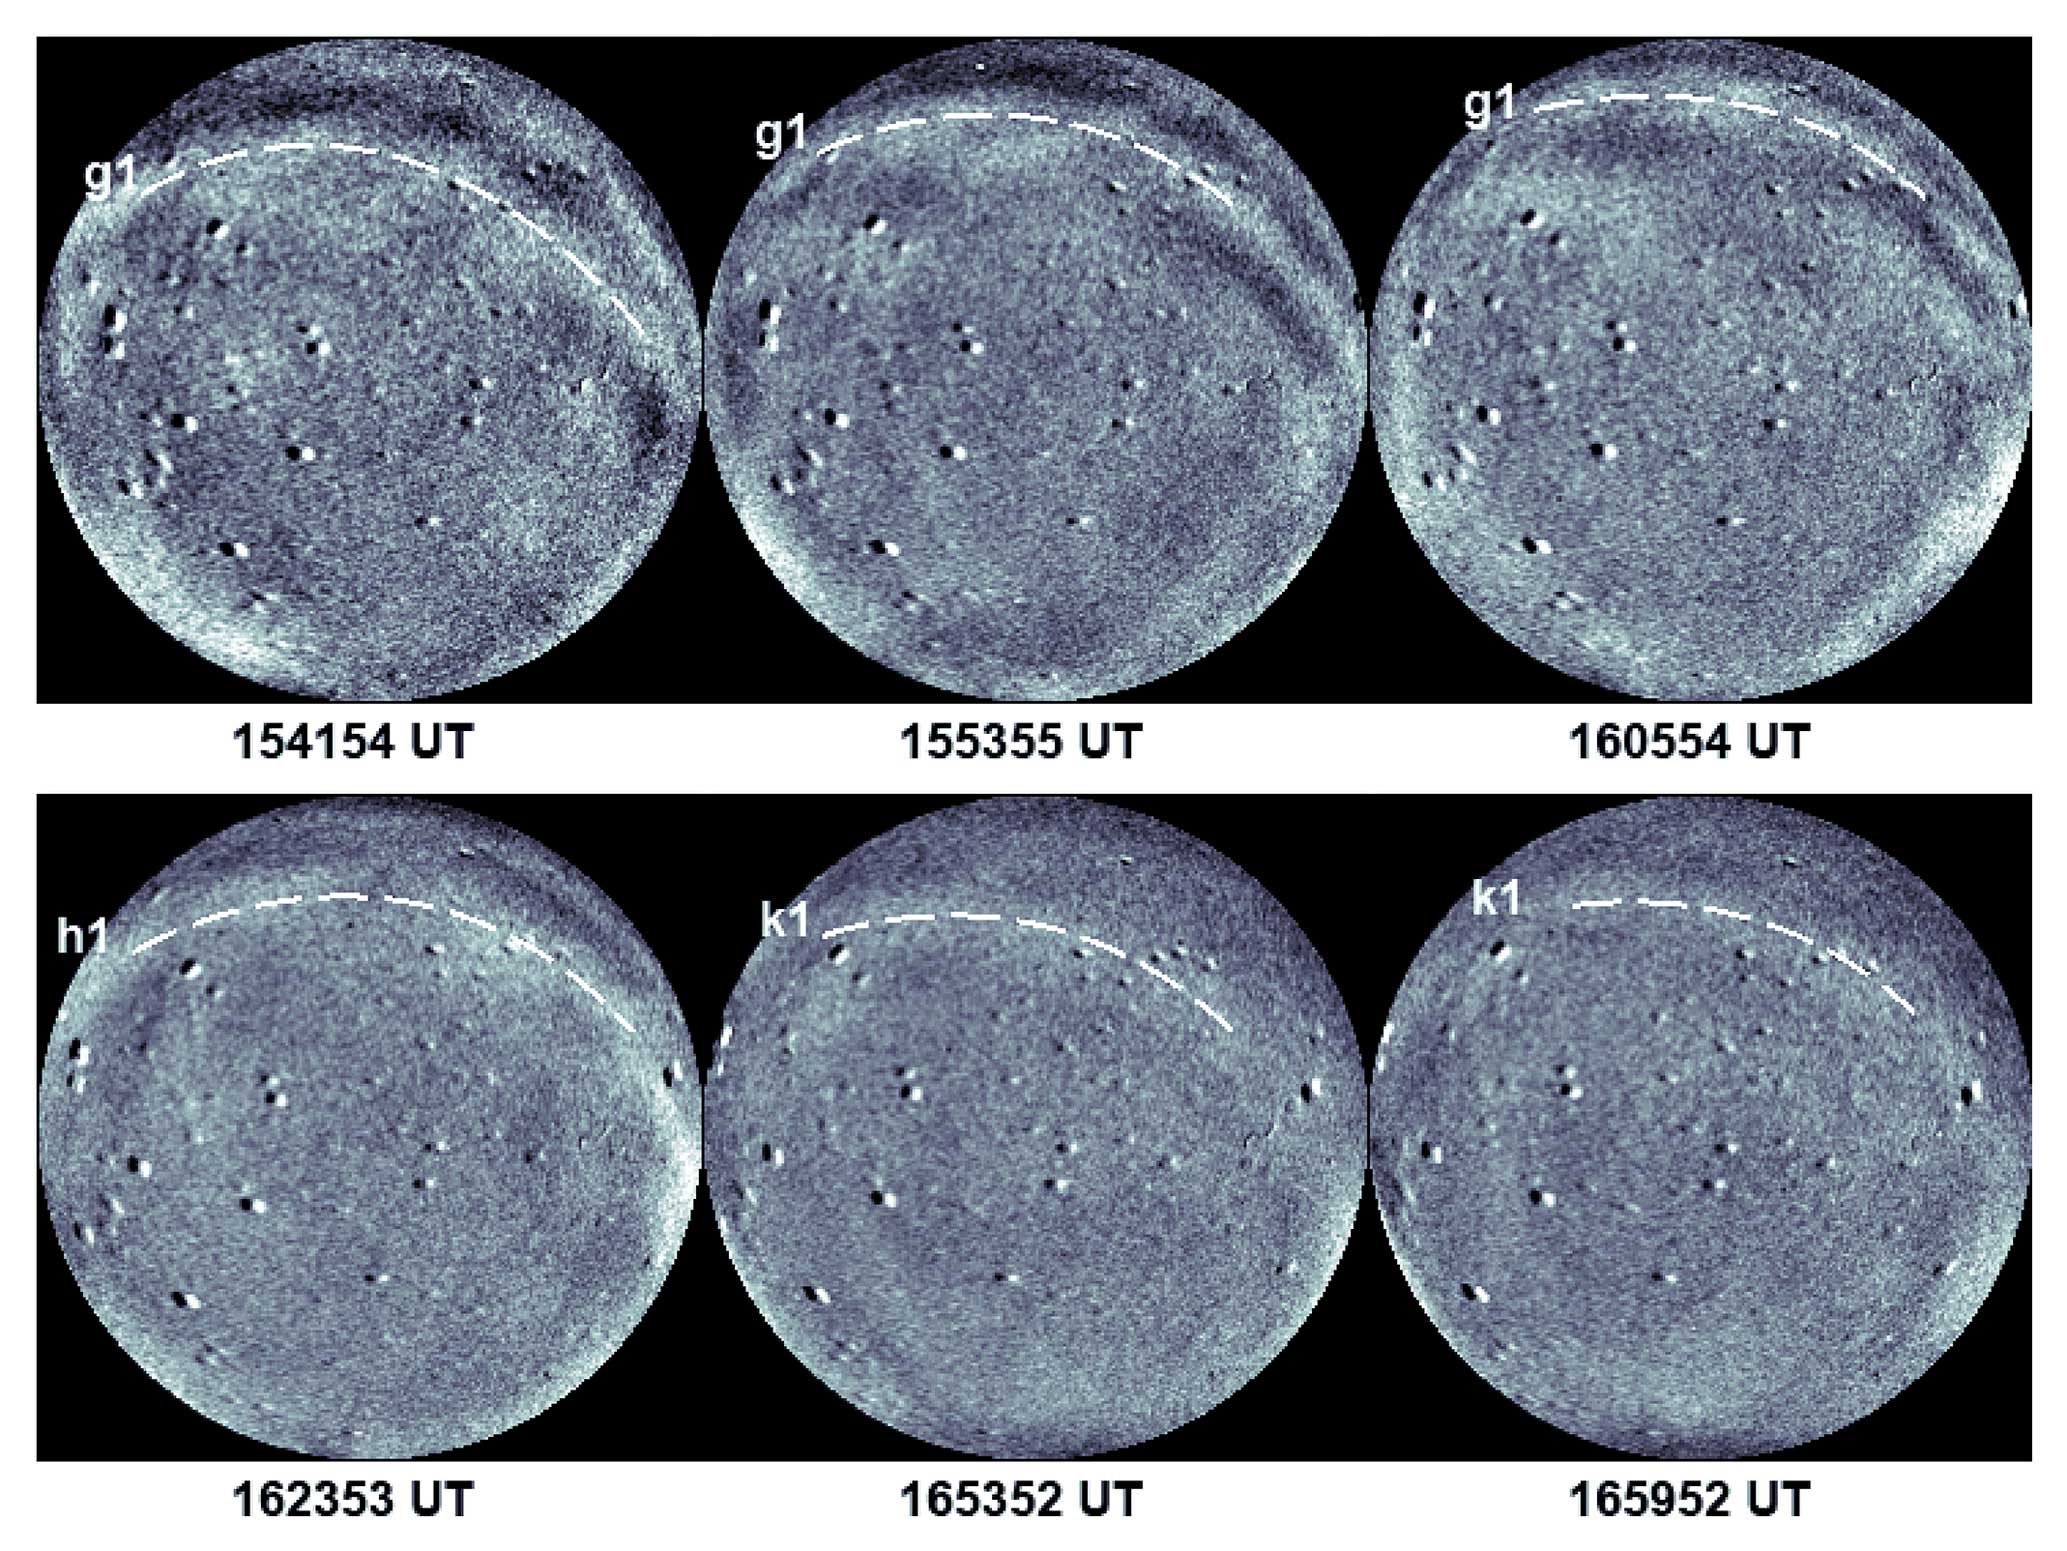
Figure 7Limited time difference ASAI images showing GW activity during 15:30–17:00 UT on 6 March 2013. Beginning at 13:36 UT, GW signatures were seen in airglow images; however, activity intensified during 15:30–17:36 UT. Some of the clear GW fronts are marked as “g1”, “h1”, and “k1”.
3.2 GW-driven revival of fossil depletions
During 17:30–17:48 UT, faint signatures of depletion DP1 that revived were seen in ROI1. Depletion DP1 lacked any poleward growth during 17:30–18:06 UT. Using the equation given in Kelley (2009) and by tracking the poleward tip of depletion, we estimated the apex height of the associated geomagnetic flux tubes (AH) and found it to be steady at ∼600 km. Within it, the level of intensity reduction with respect to that of the ambient region (i.e., ) was ∼17 %. However, depletion DP1 drifted gradually to the east with a speed of 59–70 m s−1. Beginning at 18:12–18:18 UT, this depletion started to intensify steadily, gain contrast against the background, and become noticeable. The southern end of depletion DP1 was fused with that of a preceding depletion, OD2. A few faint NS-aligned depletions were also present in ROI1. Along with depletion DP1, they intersected the EW-aligned fronts f1 and f2 of GWs and fragmented them into a few isolated structures. Later on, these structures were attached to the western wall of depletion DP1 and started moving in unison. Clear signs of two such fragments (marked as S1 and S2 in Figs. 1 and 2) can be seen at ∼ 18:30 and ∼ 18:06–18:12 UT, respectively. Starting at 18:24–18:30 UT, we noted that airglow enhancement occurred near its eastern wall and then started to become distinct. As a result, an inverted arrowhead-shaped depletion with an unusually wide southern fraction was evident during 18:36–18:54 UT. As two attached structures S1 and S2 drifted along with depletion DP1, they tilted considerably to the east by ∼60–75° (see the ASAI images beginning at 18:30 UT in Figs. 1 and 2). At ∼ 19:00 UT, structure S1 was almost aligned and merged with the western wall of depletion DP1, which led to a fairly distinct western wall (seen as weak airglow enhancement). Airglow enhancement near both the eastern and western walls (marked as A1 and A2, respectively, in Fig. 2) continued, and a linear NS-aligned depletion DP1 (with AH>800 km and ) was seen at 19:06–19:12 UT. Within the next 6–12 min, the apex of structure S2 merged with airglow enhancement A2 near the western wall.
Next, some airglow enhancement occurred on the inner edge of the western wall of depletion DP1 at 19:24 UT (see the region of interest, ROI2 in Fig. 2). We interpret this as a consequence of some ambient plasma intrusion across its western wall. Later, such intrusion led to the disappearance of its southern fraction and the formation of an isolated depletion at 19:42 UT. Possibly these disappearances occurred due to the filling of the EIA plasma into depletion across its western wall (see Otsuka et al., 2012). Similarly, fossil depletion DP2 also revived; however, its evolution was much simpler than that of depletion DP1.
We present rare simultaneous observations of GW activity and the associated revival of fossil depletions in the F-region airglow imaging around midnight over an off-equatorial station, Ranchi (located near the EIA crest), in India. Post-sunset ionospheric irregularities, in the equatorial region, are generated by the GRT instability that begins with a suitable combination of (i) favorable alignment of a solar terminator with geomagnetic field lines, (ii) rapid height rise of the F layer, (iii) the absence of strong transequatorial wind, and (iv) necessary seed perturbation (Fejer and Kelley, 1980; Kelley, 2009; Makela and Otsuka, 2012; Woodman, 2009). The stronger the height rise of the F layer and an initial seed perturbation are, the faster the growth rate of the GRT instability, which ultimately leads to rapid evolution of the irregularities (Huba and Joyce, 2007; Huang et al., 1993; Hysell et al., 2014; Kelley et al., 1981; Krall et al., 2013; Tsunoda, 2010; Zalesak and Ossakow, 1980). GWs are well known for deforming the bottom-side plasma of the F region into the wavelike ionization structures that then act as a seed for GRT instability, which in turn generates irregularities (Kelley et al., 1981; Hysell et al., 1990; Huba and Liu, 2020). While their role in the generation of the post-sunset irregularities is well known, our understanding is limited in the context of midnight or post-midnight irregularities. The present study features midnight fossil airglow depletions that revived due to undergoing GW activity and turned into an active depletion.
Northward-propagating GWs with λ∼210 km, v∼64 m s−1, and τ∼0.91 h were recorded in 630 nm nightglow images during 17:15–19:06 UT. Supporting airglow observations, TEC measurements, too, showed the presence of similar GWs. Simultaneously, an eastward-drifting fossil depletion DP1 (AH∼600 km and ) co-existed during 17:30–17:48 UT. Next, depletion DP1 and other co-existing depletions intercepted EW-aligned GW fronts and fragmented them during 18:06–18:24 UT. Subsequently, two such fragments viz. S1 and S2 that lay close to depletion DP1 were attached to its western wall, started drifting eastward in unison, tilted significantly to the east, and were almost aligned with the western wall. Next, depletion DP1 gradually intensified, surged polewards, and became a well-developed linear depletion (AH>800 km and ) during 19:06–19:12 UT. Meanwhile, airglow enhancement continued to develop near both its walls, and an uneven broadening was seen in its southern half. Next, some ambient plasma diffusion occurred near this uneven region, leading to airglow enhancement on the inner edge of its western wall at 19:24 UT. Such intrusion continued, its southern fraction gradually disappeared, and an isolated depletion formed at 19:42 UT. The present observations clearly indicate that “fossil depletion” DP1 revived and became an “active depletion” under the influence of the co-existing GW activity. Another succeeding depletion, DP2, too, showed a similar revival.
An important consideration in the GW seeding of the GRT instability is the alignment of their wavefronts with the geomagnetic field lines. The current understanding is that the strength of the polarization electric field generated by the GWs greatly depends on the angle between them, and the maximum polarization occurs when their wavefront is aligned with the geomagnetic field (Huba et al., 2015; Hysell et al., 2014; Krall et al., 2013; Tulasi Ram et al., 2014; Tsunoda, 2010). Numerical simulations by Hysell et al. (2014) suggest that the GW-induced modulations were most severe when their fronts were aligned with the magnetic meridian. Using Communications/Navigation Outrage Forecasting System (C/NOFS) mission TEC measurements, Tulasi Ram et al. (2014) studied the characteristics of large-scale wave structures (LSWSs) at the base of the F region and their association with the EPB occurrences in Southeast Asia and Africa. The authors found that the EPBs frequently occurred when the amplitudes of LSWs were adequately increased, and their phase fronts were geomagnetic-field-aligned.
In the present study, the GW fronts were east–west-aligned (i.e., transverse to the geomagnetic field lines) and propagated northward. However, fossil depletions DP1 and DP2 revived and are intriguing. Meridional wind perturbations associated with GWs are known to be ineffective in the initiation and development of depletions. The present observations are in contrast to this notion and point towards another excitation mechanism rather than GRT instability, which we conjecture is the spatial resonance mechanism of these reasons. Good matching was seen between the GW phase speed (v∼64–67 m s−1) and the eastward drift of depletion DP1 (v∼59–70 m s−1). Horizontal Wind Model 2007 estimates also indicated a zonal thermospheric wind speed of 51–61 m s−1 (Drob et al., 2008). We estimated the speed at which the apex of DP1 progressed poleward and found it to be in the range of 46–56 m s−1. The spatial resonance theory of GW seeding of irregularities states that the effects of GW perturbations are strongest when its phase speed and the plasma drift velocity are nearly equal (Kelley et al., 1981). Under such conditions, the ionospheric plasma exerts the GW-associated forcing for a longer duration, thereby accelerating the formation of ionization structures. As such, we conjecture that this GW-driven revival of fossil depletions occurred via the spatial resonance mechanism. Numerical simulations by Huang and Kelley (1996) suggest that this mechanism can accelerate the formation of depletions. Possibly continuously ongoing GW activity for 2 h in the F region sufficiently intensified the magnitudes of the associated ionization modulations, which in turn triggered and sustained the revival of fossil depletions via the spatially resonant mechanism.
Similar events of GW-associated revival of a fossil depletion occurred around midnight on 6 March 2013 as well and are shown in Fig. 6. On this night, GW activity persisted during 15:30–17:45 UT and concerned fossil depletion DP3 revived during 17:30–18:54 UT. Typical ASAI images showing signs of GW activity are presented in Fig. 7. During 16:36–17:36 UT, GWs had km, m s−1, and h; they propagated SW–NE; and their fronts were ∼74° aligned with the geomagnetic field line. First, the southern fraction of depletion DP3 drifted onto the western edge of the FOV at 17:06–17:12 UT. Later, this depletion was seen as an isolated linear depletion during 17:30–17:36 UT confined within the ∼20.1–23.2° N latitude regime with an NS extension of km. In the course of its eastward drift, depletion DP3 gradually intensified and developed both poleward and equatorward. During 17:06–18:00 UT, its base swiftly surged equatorward from approximately 20.2 to 17.7° N. Comparatively, its poleward growth was slower. When well developed at 19:00 UT, its NS extension was at 17–26° N (i.e., greater than 980±22 km). Simultaneously, two structures, BR1 and BR2, developed on its eastern wall, and an isolated depletion (ID1) lay to its east at ∼20.5° N latitude. We found its drift speed to be in the 81–109 m s−1 range.
Meridional wind can influence the growth rate of GRT instability by altering the field-line-integrated Pederson conductivity. Maruyama (1988) and Abdu et al. (2006) found that strong meridional winds could reduce the growth rate of RTI and suppress irregularities. Huba and Krall (2013) reported both stabilizing and destabilizing effects of the meridional winds on the RT instability. Devasia et al. (2002) found that a suitable combination of the meridional wind and F-region base height favors ESF development. In the present study, the meridional wind measurements using a Fabry–Perot interferometer were not available; hence, their possible role in the evolution of these fossil depletions could not be investigated.
We know that the electric field perturbations associated with MSTIDs can influence the growth of irregularities. Otsuka et al. (2012) and Shiokawa et al. (2015) reported the disappearance of an EPB upon interaction with MSTIDs and large-scale traveling ionospheric disturbances (LSTIDs), respectively. The authors suggested that the electric field associated with MSTIDs and LSTIDs can move the ambient plasma into the bubble across the geomagnetic field line through E×B drift, which will result in the filling and subsequent disappearance of the depletion. Studies by Miller et al. (2009), Taori et al. (2015), and Takahashi et al. (2020) suggest that MSTIDs can directly seed EPBs. A simulation study by Krall et al. (2011) further indicates that the electric field associated with electrified MSTIDs can enhance the growth of EPBs. Recently, Wrasse et al. (2021) presented an interesting observation of the interaction of a fossil EPB with an electrified MSTID over 13.3° S. After interaction with the MSTID, the involved fossil EPBs merged with another four EPBs, developed poleward, and bifurcated. Using detrended TEC data, Takahashi et al. (2021) studied the LSWS over Latin America and found them to be effective in seeding EPBs.
We present, here, airglow imaging observations of fossil plasma depletions that revived afresh under the action of prolonged GW activity and became active depletions. Such simultaneous imaging of thermospheric GWs and depletions was recorded in the ASAI of OI 630 nm emission over Ranchi (mlat. ∼19° N), India, on 16 April 2012. Salient features of the present study are as follows.
-
First, airglow images showed EW-aligned and SN-propagating GWs (λ∼210 km, v∼64 m s−1, and τ∼0.91 h) over Ranchi during 17:15–19:06 UT. Similar GWs were, also, seen in TEC measurements over the lower-latitude station Hyderabad.
-
A co-existing and prominent fossil depletion, DP1, revived under this GW activity, wherein its apex increased from 600 to >800 km and the level of the intensity depletion increased from 17 % to 50 %. Another fossil depletion, DP2, revived too. Interestingly, GW phase fronts were transverse to the geomagnetic field lines, yet two fossil depletions revived under their influence and became active depletions.
-
As the GW phase speed (v∼64–67 m s−1) nearly matched the eastward drift of depletion DP1 (v∼59–70 m s−1), we conjecture that the GW-driven revival of these fossil depletions possibly occurred via the spatial resonance mechanism.
-
An uneven region of increased thickness existed in the southern half of the revived depletion DP1, wherein some airglow enhancement was seen later on the inner edge of its western wall. Possibly, the gradual disappearance of its southern fraction occurred because of the intrusion of ambient plasma across the western wall.
Contrary to the current understanding, this study shows that the GW fronts aligned perpendicularly to the geomagnetic field lines can effectively grow irregularities. Present observations of the GW-driven revival of fossil airglow depletions further contribute to our understanding of their generation mechanism around midnight.
Airglow data used in the present study are available through the institutional data repository (http://www.iigm.res.in/, last access: 1 May 2024) or https://doi.org/10.5281/zenodo.8143215 (Parihar, 2023). Calibrated TEC data are available from https://t-ict4d.ictp.it/nequick2/gnss-tec-calibration (Ciraolo et al., 2007).
A movie created from all-sky 630 nm nightglow images showing the gravity wave activity and the evolution of depletions DP1 and DP2 is available from https://doi.org/10.5281/zenodo.10851669 (Parihar, 2024).
The supplement related to this article is available online at: https://doi.org/10.5194/angeo-42-131-2024-supplement.
NP conceptualized the research problem and prepared the first draft. All the authors subsequently contributed to the investigation (interpretation of the results and discussion) as well as the writing, review, and editing of the manuscript.
The contact author has declared that none of the authors has any competing interests.
Publisher’s note: Copernicus Publications remains neutral with regard to jurisdictional claims made in the text, published maps, institutional affiliations, or any other geographical representation in this paper. While Copernicus Publications makes every effort to include appropriate place names, the final responsibility lies with the authors.
GNSS TEC calibrated data were downloaded from https://t-ict4d.ictp.it/nequick2/gnss-tec-calibration (last access: 1 May 2024), and the Telecommunications/ICT for Development (T/ICT4D) Laboratory of the Abdus Salam International Centre for Theoretical Physics, Trieste, Italy, is gratefully acknowledged. Saranya Padincharapad is grateful to the director of the Indian Institute of Geomagnetism, Navi Mumbai, for the award of a research scholarship. The authors sincerely thank the editor and reviewers for their encouragement and critical comments.
Funds for routine airglow research at the Indian Institute of Geomagnetism are being provided by the Department of Science and Technology (DST), Government of India, New Delhi. Additional grants were provided by the Indian Space Research Organization (https://www.isro.gov.in/, last access: 1 May 2024) under the CAWSES India Phase II Programme during 2010–2013.
This paper was edited by Igo Paulino and reviewed by three anonymous referees.
Abdu, M. A., Alam Kherani, E., Batista, I. S., de Paula, E. R., Fritts, D. C., and Sobral, J. H. A.: Gravity wave initiation of equatorial spread F/plasma bubble irregularities based on observational data from the SpreadFEx campaign, Ann. Geophys., 27, 2607–2622, https://doi.org/10.5194/angeo-27-2607-2009, 2009. a
Abdu, M. A., Iyer, K. N., de Medeiros, R., Batista, I. S., and Sobral, J. H.: Thermospheric meridional wind control of equatorial spread F and evening prereversal electric field, Geophys. Res. Lett., 33, L07106, https://doi.org/10.1029/2005GL024835, 2006. a
Azeem, I. and Barlage, M.: Atmosphere-ionosphere coupling from convectively generated gravity waves, Adv. Space Res., 61, 1931–1941, https://doi.org/10.1016/j.asr.2017.09.029, 2018. a
Chapagain, N. P., Taylor, M. J., and Eccles, J. V.: Airglow observations and modeling of F region depletion zonal velocities over Christmas Island, J. Geophys. Res.-Space, 116, A02301, https://doi.org/10.1029/2010JA015958, 2011. a
Ciraolo, L., Azpilicueta, F., Brunini, C., Meza, A., and Radicella, S. M.: Calibration errors on experimental slant total electron content (TEC) determined with GPS, J. Geodesy, 81, 111–120, https://doi.org/10.1007/s00190-006-0093-1, 2007 (data available at: https://t-ict4d.ictp.it/nequick2/gnss-tec-calibration, last access: 1 May 2024). a
Devasia, C., Jyoti, N., Subbarao, K., Viswanathan, K., Tiwari, D., and Sridharan, R.: On the plausible linkage of thermospheric meridional winds with the equatorial spread F, J. Atmos. Sol.-Terr. Phy., 64, 1–12, https://doi.org/10.1016/S1364-6826(01)00089-X, 2002. a
Drob, D., Emmert, J., Crowley, G., Picone, J., Shepherd, G., Skinner, W., Hays, P., Niciejewski, R., Larsen, M., She, C., Meriwether, J. W., Hernandez, G., Jarvis, M. J., Sipler, D. P., Tepley, C. A., O'Brien, M. S., Bowman, J. R., Wu, Q., Murayama, Y., Kawamura, S., Reid, I. M., and Vincent, R. A.: An empirical model of the Earth's horizontal wind fields: HWM07, J. Geophys. Res.-Space, 113, A12304, https://doi.org/10.1029/2008JA013668, 2008. a
Fejer, B. and Kelley, M.: Ionospheric irregularities, Rev. Geophys., 18, 401–454, https://doi.org/10.1029/RG018i002p00401, 1980. a
Figueiredo, C. A. O. B., Takahashi, H., Wrasse, C. M., Otsuka, Y., Shiokawa, K., and Barros, D.: Medium-scale traveling ionospheric disturbances observed by detrended total electron content maps over Brazil, J. Geophys. Res.-Space, 123, 2215–2227, https://doi.org/10.1002/2017JA025021, 2018. a
Ford, E. A. K., Aruliah, A. L., Griffin, E. M., and McWhirter, I.: Thermospheric gravity waves in Fabry-Perot Interferometer measurements of the 630.0nm OI line, Ann. Geophys., 24, 555–566, https://doi.org/10.5194/angeo-24-555-2006, 2006. a
Ford, E. A. K., Aruliah, A. L., Griffin, E. M., and McWhirter, I.: Statistical analysis of thermospheric gravity waves from Fabry-Perot Interferometer measurements of atomic oxygen, Ann. Geophys., 26, 29–45, https://doi.org/10.5194/angeo-26-29-2008, 2008. a
Fritts, D. C., Abdu, M. A., Batista, B. R., Batista, I. S., Batista, P. P., Buriti, R., Clemesha, B. R., Dautermann, T., de Paula, E. R., Fechine, B. J., Fejer, B. G., Gobbi, D., Haase, J., Kamalabadi, F., Kherani, E. A., Laughman, B., Lima, P. P., Liu, H.-L., Medeiros, A., Pautet, P.-D., Riggin, D. M., Rodrigues, F. S., São Sabbas, F., Sobral, J. H. A., Stamus, P., Takahashi, H., Taylor, M. J., Vadas, S. L., Vargas, F., and Wrasse, C. M.: Overview and summary of the Spread F Experiment (SpreadFEx), Ann. Geophys., 27, 2141–2155, https://doi.org/10.5194/angeo-27-2141-2009, 2009. a, b, c, d
Fritts, D. C. and Alexander, M. J.: Gravity wave dynamics and effects in the middle atmosphere, Rev. Geophys., 41, 1003, https://doi.org/10.1029/2001RG000106, 2003. a
Fukushima, D., Shiokawa, K., Otsuka, Y., and Ogawa, T.: Observation of equatorial nighttime medium-scale traveling ionospheric disturbances in 630-nm airglow images over 7 years, J. Geophys. Res.-Space, 117, A10324, https://doi.org/10.1029/2012JA017758, 2012. a
Garcia, F., Taylor, M. J., and Kelley, M.: Two-dimensional spectral analysis of mesospheric airglow image data, Appl. Optics, 36, 7374–7385, https://doi.org/10.1364/AO.36.007374, 1997. a
Heale, C., Inchin, P., and Snively, J.: Primary versus secondary gravity wave responses at F-region heights generated by a convective source, J. Geophys. Res.-Space, 127, e2021JA029947, https://doi.org/10.1029/2021JA029947, 2022. a
Holton, J. R.: The influence of gravity wave breaking on the general circulation of the middle atmosphere, J. Atmos. Sci., 40, 2497–2507, 1983. a
Huang, C.-S. and Kelley, M. C.: Nonlinear evolution of equatorial spread F: 1. On the role of plasma instabilities and spatial resonance associated with gravity wave seeding, J. Geophys. Res.-Space, 101, 283–292, https://doi.org/10.1029/95JA02211, 1996. a
Huang, C.-S., Kelley, M., and Hysell, D.: Nonlinear Rayleigh-Taylor instabilities, atmospheric gravity waves and equatorial spread F, J. Geophys. Res.-Space, 98, 15631–15642, https://doi.org/10.1029/93JA00762, 1993. a
Huba, J. and Joyce, G.: Equatorial spread F modeling: Multiple bifurcated structures, secondary instabilities, large density “bite-outs,” and supersonic flows, Geophys. Res. Lett., 34, L07105, https://doi.org/10.1029/2006GL028519, 2007. a, b, c
Huba, J. and Joyce, G.: Global modeling of equatorial plasma bubbles, Geophys. Res. Lett., 37, L17104, https://doi.org/10.1029/2010GL044281, 2010. a, b
Huba, J. and Krall, J.: Impact of meridional winds on equatorial spread F: Revisited, Geophys. Res. Lett., 40, 1268–1272, https://doi.org/10.1002/grl.50292, 2013. a
Huba, J. and Liu, H.-L.: Global modeling of equatorial spread F with SAMI3/WACCM-X, Geophys. Res. Lett., 47, e2020GL088258, https://doi.org/10.1029/2020GL088258, 2020. a, b, c, d
Huba, J., Joyce, G., and Krall, J.: Three-dimensional equatorial spread F modeling, Geophys. Res. Lett., 35, L10102, https://doi.org/10.1029/2008GL033509, 2008. a
Huba, J., Drob, D., Wu, T.-W., and Makela, J.: Modeling the ionospheric impact of tsunami-driven gravity waves with SAMI3: Conjugate effects, Geophys. Res. Lett., 42, 5719–5726, https://doi.org/10.1002/2015GL064871, 2015. a, b, c
Hysell, D., Kelley, M., Swartz, W., and Woodman, R.: Seeding and layering of equatorial spread F by gravity waves, J. Geophys. Res.-Space, 95, 17253–17260, https://doi.org/10.1029/JA095iA10p17253, 1990. a, b, c
Hysell, D., Jafari, R., Fritts, D., and Laughman, B.: Gravity wave effects on postsunset equatorial F region stability, J. Geophys. Res.-Space, 119, 5847–5860, https://doi.org/10.1002/2014JA019990, 2014. a, b, c
Kelley, M., Larsen, M., LaHoz, C., and McClure, J.: Gravity wave initiation of equatorial spread F: A case study, J. Geophys. Res.-Space, 86, 9087–9100, https://doi.org/10.1029/JA086iA11p09087, 1981. a, b, c
Kelley, M. C.: The Earth's ionosphere: Plasma physics and electrodynamics, Academic Press, Elsevier, 2009. a, b, c, d
Klausner, V., Fagundes, P. R., Sahai, Y., Wrasse, C. M., Pillat, V. G., and Becker-Guedes, F.: Observations of GW/TID oscillations in the F2 layer at low latitude during high and low solar activity, geomagnetic quiet and disturbed periods, J. Geophys. Res.-Space, 114, A02313, https://doi.org/10.1029/2008JA013448, 2009. a
Krall, J., Huba, J., Ossakow, S., Joyce, G., Makela, J., Miller, E., and Kelley, M.: Modeling of equatorial plasma bubbles triggered by non-equatorial traveling ionospheric disturbances, Geophys. Res. Lett., 38, L08103, https://doi.org/10.1029/2011GL046890, 2011. a
Krall, J., Huba, J., and Fritts, D.: On the seeding of equatorial spread F by gravity waves, Geophys. Res. Lett., 40, 661–664, https://doi.org/10.1002/grl.50144, 2013. a, b
Liu, H.-L., Foster, B. T., Hagan, M. E., McInerney, J. M., Maute, A., Qian, L., Richmond, A. D., Roble, R. G., Solomon, S. C., Garcia, R. R., Kinnison, D., Marsh, D. R., Smith, A. K., Richter, J., Sassi, F., and Oberheide, J.: Thermosphere extension of the whole atmosphere community climate model, J. Geophys. Res.-Space, 115, A12302, https://doi.org/10.1029/2010JA015586, 2010. a
Makela, J. J., Ledvina, B. M., Kelley, M. C., and Kintner, P. M.: Analysis of the seasonal variations of equatorial plasma bubble occurrence observed from Haleakala, Hawaii, Ann. Geophys., 22, 3109–3121, https://doi.org/10.5194/angeo-22-3109-2004, 2004. a
Makela, J., Kelley, M., and Nicolls, M.: Optical observations of the development of secondary instabilities on the eastern wall of an equatorial plasma bubble, J. Geophys. Res.-Space, 111, A09311, https://doi.org/10.1029/2006JA011646, 2006. a
Makela, J., Lognonné, P., Hébert, H., Gehrels, T., Rolland, L., Allgeyer, S., Kherani, A., Occhipinti, G., Astafyeva, E., Coïsson, P., Loevenbruck, A. , Clévédé, E., Kelley, M. C., and Lamouroux, J.: Imaging and modeling the ionospheric airglow response over Hawaii to the tsunami generated by the Tohoku earthquake of 11 March 2011, Geophys. Res. Lett., 38, L00G02, https://doi.org/10.1029/2011GL047860, 2011. a, b, c, d
Makela, J. J. and Otsuka, Y.: Overview of nighttime ionospheric instabilities at low-and mid-latitudes: Coupling aspects resulting in structuring at the mesoscale, Space Sci. Rev., 168, 419–440, https://doi.org/10.1007/s11214-011-9816-6, 2012. a
Maruyama, T.: A diagnostic model for equatorial spread F, 1, Model description and application to electric field and neutral wind effects, J. Geophys. Res.-Space, 93, 14611–14622, https://doi.org/10.1029/JA093iA12p14611, 1988. a
Maurya, A. K., Parihar, N., Dube, A., Singh, R., Kumar, S., Chanrion, O., Tomicic, M., and Neubert, T.: Rare observations of sprites and gravity waves supporting D, E, F-regions ionospheric coupling, Sci. Rep.-UK, 12, 581, https://doi.org/10.1038/s41598-021-03808-5, 2022. a
Mendillo, M. and Baumgardner, J.: Airglow characteristics of equatorial plasma depletions, J. Geophys. Res.-Space, 87, 7641–7652, https://doi.org/10.1029/JA087iA09p07641, 1982. a
Mendillo, M., Baumgardner, J., Colerico, M., and Nottingham, D.: Imaging science contributions to equatorial aeronomy: initial results from the MISETA program, J. Atmos. Sol.-Terr. Phy., 59, 1587–1599, https://doi.org/10.1016/S1364-6826(96)00158-7, 1997. a
Miller, E., Makela, J., and Kelley, M.: Seeding of equatorial plasma depletions by polarization electric fields from middle latitudes: Experimental evidence, Geophys. Res. Lett., 36, L18105, https://doi.org/10.1029/2009GL039695, 2009. a, b
Mukherjee, G., Pragati Shikha, R., Parihar, N., Ghodpage, R., and Patil, P.: Studies of the wind filtering effect of gravity waves observed at Allahabad (25.45° N, 81.85° E) in India, Earth Planet. Space, 62, 309–318, https://doi.org/10.5047/eps.2009.11.008, 2010. a
Nishioka, M., Otsuka, Y., Shiokawa, K., Tsugawa, T., Effendy, n., Supnithi, P., Nagatsuma, T., and Murata, K.: On post-midnight field-aligned irregularities observed with a 30.8-MHz radar at a low latitude: Comparison withF-layer altitude near the geomagnetic equator, J. Geophys. Res.-Space, 117, A08337, https://doi.org/10.1029/2012JA017692, 2012. a
Otsuka, Y.: Review of the generation mechanisms of post-midnight irregularities in the equatorial and low-latitude ionosphere, Prog. Earth Planet. Sci., 5, 1–13, https://doi.org/10.1186/s40645-018-0212-7, 2018. a
Otsuka, Y., Shiokawa, K., and Ogawa, T.: Disappearance of equatorial plasma bubble after interaction with mid-latitude medium-scale traveling ionospheric disturbance, Geophys. Res. Lett., 39, L14105, https://doi.org/10.1029/2012GL052286, 2012. a, b
Parihar, N.: Rare occurrence of off-equatorial edge initiating and equatorward surging plasma depletions observed in OI 630-nm imaging, J. Geophys. Res.-Space, 124, 2887–2896, https://doi.org/10.1029/2018JA026155, 2019. a
Parihar, N.: OI 630 nm Airglow Images for 20120416, Zenodo [data set], https://doi.org/10.5281/zenodo.8143215, 2023. a
Parihar, N.: Movie showing GWs Driven Revival of Fossil Depletions around Midnight on 16 April 2012, Zenodo [video], https://doi.org/10.5281/zenodo.10851669, 2024. a
Parihar, N., Singh, D., and Gurubaran, S.: A comparison of ground-based hydroxyl airglow temperatures with SABER/TIMED measurements over 23° N, India, Ann. Geophys., 35, 353–363, https://doi.org/10.5194/angeo-35-353-2017, 2017. a
Parihar, N., Radicella, S. M., Nava, B., Migoya-Orue, Y. O., Tiwari, P., and Singh, R.: An investigation of the ionospheric F region near the EIA crest in India using OI 777.4 and 630.0 nm nightglow observations, Ann. Geophys., 36, 809–823, https://doi.org/10.5194/angeo-36-809-2018, 2018. a
Paulino, I., Takahashi, H., Medeiros, A. F. d., Wrasse, C. M., Buriti, R. A., Sobral, J. H. D. A., and Gobbi, D.: Mesospheric gravity waves and ionospheric plasma bubbles observed during the COPEX campaign, J. Atmos. Sol.-Terr. Phy., 73, 1575–1580, https://doi.org/10.1016/j.jastp.2010.12.004, 2011. a
Paulino, I., Medeiros, A. F., Vadas, S. L., Wrasse, C. M., Takahashi, H., Buriti, R. A., Leite, D., Filgueira, S., Bageston, J. V., Sobral, J. H. A., and Gobbi, D.: Periodic waves in the lower thermosphere observed by OI630 nm airglow images, Ann. Geophys., 34, 293–301, https://doi.org/10.5194/angeo-34-293-2016, 2016. a, b
Paulino, I., Moraes, J. F., Maranhão, G. L., Wrasse, C. M., Buriti, R. A., Medeiros, A. F., Paulino, A. R., Takahashi, H., Makela, J. J., Meriwether, J. W., and Campos, J. A. V.: Intrinsic parameters of periodic waves observed in the OI6300 airglow layer over the Brazilian equatorial region, Ann. Geophys., 36, 265–273, https://doi.org/10.5194/angeo-36-265-2018, 2018. a, b
Pimenta, A. A., Fagundes, P. R., Sahai, Y., Bittencourt, J. A., and Abalde, J. R.: Equatorial F-region plasma depletion drifts: latitudinal and seasonal variations, Ann. Geophys., 21, 2315–2322, https://doi.org/10.5194/angeo-21-2315-2003, 2003. a, b
Sau, S., Narayanan, V. L., Gurubaran, S., and Emperumal, K.: Study of wave signatures observed in thermospheric airglow imaging over the dip equatorial region, Adv. Space Res., 62, 1762–1774, https://doi.org/10.1016/j.asr.2018.06.039, 2018. a, b, c
Sekar, R., Chakrabarty, D., Sarkhel, S., Patra, A. K., Devasia, C. V., and Kelley, M. C.: Identification of active fossil bubbles based on coordinated VHF radar and airglow measurements, Ann. Geophys., 25, 2099–2102, https://doi.org/10.5194/angeo-25-2099-2007, 2007. a
Shiokawa, K., Otsuka, Y., Lynn, K. J., Wilkinson, P., and Tsugawa, T.: Airglow-imaging observation of plasma bubble disappearance at geomagnetically conjugate points, Earth Planet. Space, 67, 1–12, https://doi.org/10.1186/s40623-015-0202-6, 2015. a
Singh, S., Johnson, F., and Power, R.: Gravity wave seeding of equatorial plasma bubbles, J. Geophys. Res.-Space, 102, 7399–7410, https://doi.org/10.1029/96JA03998, 1997. a
Smith, S. M., Martinis, C. R., Baumgardner, J., and Mendillo, M.: All-sky imaging of transglobal thermospheric gravity waves generated by the March 2011 Tohoku Earthquake, J. Geophys. Res.-Space, 120, 10992–10999, https://doi.org/10.1002/2015JA021638, 2015. a, b
Sreeja, V., Vineeth, C., Pant, T. K., Ravindran, S., and Sridharan, R.: Role of gravity wavelike seed perturbations on the triggering of ESF – a case study from unique dayglow observations, Ann. Geophys., 27, 313–318, https://doi.org/10.5194/angeo-27-313-2009, 2009. a
Takahashi, H., Taylor, M. J., Pautet, P.-D., Medeiros, A. F., Gobbi, D., Wrasse, C. M., Fechine, J., Abdu, M. A., Batista, I. S., Paula, E., Sobral, J. H. A., Arruda, D., Vadas, S. L., Sabbas, F. S., and Fritts, D. C.: Simultaneous observation of ionospheric plasma bubbles and mesospheric gravity waves during the SpreadFEx Campaign, Ann. Geophys., 27, 1477–1487, https://doi.org/10.5194/angeo-27-1477-2009, 2009. a
Takahashi, H., Wrasse, C. M., Figueiredo, C. A. O. B., Barros, D., Paulino, I., Essien, P., Abdu, M. A., Otsuka, Y., and Shiokawa, K.: Equatorial plasma bubble occurrence under propagation of MSTID and MLT gravity waves, J. Geophys. Res.-Space, 125, e2019JA027566, https://doi.org/10.1029/2019JA027566, 2020. a
Takahashi, H., Essien, P., Figueiredo, C. A. O. B., Wrasse, C. M., Barros, D., Abdu, M. A., Otsuka, Y., Shiokawa, K., and Li, G.: Multi-instrument study of longitudinal wave structures for plasma bubble seeding in the equatorial ionosphere, Earth Planet. Phys., 5, 368–377, https://doi.org/10.26464/epp2021047, 2021. a
Taori, A., Makela, J., and Taylor, M.: Mesospheric wave signatures and equatorial plasma bubbles: a case study, J. Geophys. Res.-Space, 115, A06302, https://doi.org/10.1029/2009JA015088, 2010. a
Taori, A., Jayaraman, A., and Kamalakar, V.: Imaging of mesosphere–thermosphere airglow emissions over Gadanki (13.5° N, 79.2° E) – First results, J. Atmos. Sol.-Terr. Phy., 93, 21–28, https://doi.org/10.1016/j.jastp.2012.11.007, 2013. a
Taori, A., Parihar, N., Ghodpage, R., Dashora, N., Sripathi, S., Kherani, E., and Patil, P.: Probing the possible trigger mechanisms of an equatorial plasma bubble event based on multistation optical data, J. Geophys. Res.-Space, 120, 8835–8847, https://doi.org/10.1002/2015JA021541, 2015. a, b
Tsunoda, R. T.: On seeding equatorial spread F: Circular gravity waves, Geophys. Res. Lett., 37, L10104, https://doi.org/10.1029/2010GL043422, 2010. a, b, c
Tulasi Ram, S., Yamamoto, M., Tsunoda, R., Chau, H., Hoang, T., Damtie, B., Wassaie, M., Yatini, C., Manik, T., and Tsugawa, T.: Characteristics of large-scale wave structure observed from African and Southeast Asian longitudinal sectors, J. Geophys. Res.-Space, 119, 2288–2297, https://doi.org/10.1002/2013JA019712, 2014. a, b, c
Vadas, S. L. and Azeem, I.: Concentric secondary gravity waves in the thermosphere and ionosphere over the continental United States on March 25–26, 2015 from deep convection, J. Geophys. Res.-Space, 126, e2020JA028275, https://doi.org/10.1029/2020JA028275, 2021. a
Woodman, R. F.: Spread F – an old equatorial aeronomy problem finally resolved?, Ann. Geophys., 27, 1915–1934, https://doi.org/10.5194/angeo-27-1915-2009, 2009. a, b, c
Wrasse, C. M., Figueiredo, C. A. O. B., Barros, D., Takahashi, H., Carrasco, A. J., Vital, L. F. R., Resende, L. C. A., Egito, F., Rosa, G. D. M., and Sampaio, A. H. R.: Interaction between Equatorial Plasma Bubbles and a Medium-Scale Traveling Ionospheric Disturbance, observed by OI 630 nm airglow imaging at Bom Jesus de Lapa, Brazil, Earth Planet. Phys., 5, 397–406, https://doi.org/10.26464/epp2021045, 2021. a, b, c
Yadav, S., Sridharan, R., Sunda, S., and Pant, T. K.: Further refinements to the spatiotemporal forecast model for L-band scintillation based on comparison with C/NOFS observations, J. Geophys. Res.-Space, 122, 5643–5652, https://doi.org/10.1002/2017JA023869, 2017. a
Zalesak, S. and Ossakow, S.: Nonlinear equatorial spread F: Spatially large bubbles resulting from large horizontal scale initial perturbations, J. Geophys. Res.-Space, 85, 2131–2142, https://doi.org/10.1029/JA085iA05p02131, 1980. a