the Creative Commons Attribution 4.0 License.
the Creative Commons Attribution 4.0 License.
 | 13 Dec 2023
On mechanisms for high-frequency pump-enhanced optical emissions at 557.7 and 630.0 nm from atomic oxygen in the high-latitude F-region ionosphere
Tima Sergienko
Urban Brändström
Björn Gustavsson
Michael T. Rietveld
The EISCAT (European Incoherent Scatter Scientific Association) Heating facility was used to transmit powerful high-frequency (HF) electromagnetic waves into the F-region ionosphere to enhance optical emissions at 557.7 and 630.0 nm from atomic oxygen. The emissions were imaged by several stations of ALIS (Auroral Large Imaging System) in northern Sweden, and the EISCAT UHF incoherent scatter radar was used to obtain plasma parameter values. The ratio of the 557.7 to 630.0 nm column emission rates changed from for the HF pump frequency f0=6.200 MHz ≈4.6fe to when f0=5.423 MHz ≲4fe, where fe is the ionospheric electron gyro frequency. The observations are interpreted in terms of decreased electron heating efficiency and thereby weaker enhancement at 630.0 nm for f0=5.423 MHz ≲ 4 fe. The emissions at 557.7 nm are attributed to electron acceleration by upper hybrid waves of metre-scale wavelengths that can be excited with f0=5.423 MHz ≲ 4 fe.
- Article
(2688 KB) - Full-text XML
- BibTeX
- EndNote


Powerful high-frequency (HF) electromagnetic waves transmitted into the ionosphere from the ground may enhance optical emissions from atmospheric constituents, notably atomic oxygen and molecular nitrogen. Such emissions can be detected on the ground and are studied to get information on a variety of phenomena related to plasma energization by HF pumping. Following the first unambiguous observations of HF pump-enhanced optical emissions at high latitudes (Brändström et al., 1999; Kosch et al., 2002b), a number of interesting results have been obtained. Here we limit ourselves to HF pumping with the frequency f0 below or near the ionospheric critical frequency and with left-handed circular polarization (often referred to as ordinary mode) which gives the strongest effects.
The spatial distribution of optical emissions enhanced above background levels has shown that the strongest coupling between an HF beam and the ionospheric F-region plasma at high latitudes and long timescales occurs for a beam in the direction of geomagnetic zenith. Even with a vertical beam, the most intense optical emissions occur towards magnetic zenith within the beam. This was observed in emissions at 630.0 nm from the O(1D) excited state as obtained with the EISCAT (European Incoherent Scatter Scientific Association) Heating facility in Norway (Kosch et al., 2000), with the Sura facility in Russia (Grach et al., 2007; Shindin et al., 2015), and with the HAARP (High-Frequency Active Auroral Research Program) facility in Alaska, USA (Pedersen and Carlson, 2001), and also at 557.7 nm from O(1S) (Pedersen et al., 2003, 2008). In addition, optical emissions show evidence of complex HF beam reorganization during pumping and associated nonlinear effects in the pump–plasma interactions, as found in experiments at both EISCAT and HAARP (Kosch et al., 2004, 2007).
Imaging of enhanced optical emissions from several stations with ALIS (Auroral Large Imaging System) in northern Sweden and HF transmissions with EISCAT Heating provided for the first tomography-like reconstruction of the volume emission at 630.0 nm (Gustavsson et al., 2001). By comparing the obtained altitude and temporal variations of the optical emissions with modelled emissions of excitation of O(1D) by a Maxwellian electron velocity distribution, the authors predicted the source distribution for the emissions to be Maxwellian at low energies but with a depletion above 1.96 eV (which is the threshold for the excited state).
Observation of optical emissions simultaneously at several wavelengths, each requiring different minimum electron energy to be enhanced, provides the possibility to study electron energization in the excited plasma turbulence. Gustavsson et al. (2002) obtained nearly simultaneous images of enhancements at 557.7 and 630.0 nm in experiments with EISCAT Heating. The 557.7 to 630.0 nm intensity ratio of 0.3–0.4 was relatively high, which implies that the optical enhancements were caused by a nonthermal tail in the electron velocity distribution. A similarly high ratio has been observed in experiments with HAARP (Pedersen et al., 2003).
Gustavsson and Eliasson (2008) observed emissions at 427.8, 557.7, 630.0 and 844.6 nm, together with incoherent scatter radar measurements of the ion temperature, electron temperature and concentration at EISCAT. By using a two-stream electron transport code, they could estimate the electron flux between 1.9 and 100 eV that is needed to account for the observations. The electron energy distribution was found to be depleted approximately in the range 2–4 eV, probably due to excitation of vibrational states in N2, and have a nonthermal tail at higher energies.
Experimental results on pump-enhanced optical emissions have been presented for varying f0 near a harmonic s (s = 3, 4) of the ionospheric electron gyro frequency fe. Kosch et al. (2002a) observed, simultaneously, emissions at 630.0 nm and small-scale geomagnetic field-aligned density striations with the CUTLASS (Collaborative UK Twin Located Auroral Sounding System) coherent scatter radar. They found a significant reduction in the optical enhancement and the radar backscatter when f0 ≈ 3 fe, indicating that the 630.0 nm emissions are linked to upper hybrid turbulence and associated filamentary striations.
Further, Gustavsson et al. (2006) performed EISCAT experiments with f0 stepping near sfe (s = 3, 4) and optical imaging at 630.0, 557.7 and 427.8 nm together with incoherent scatter radar measurements of the electron temperature. The pump-enhanced emissions as well as electron temperature were all minimum for f0 ≈ 4 fe. Whereas the enhancement of the emission intensity at 630.0 nm and electron temperature were roughly symmetric for f0 around 4 fe, the emissions at 427.8 nm were markedly stronger for f0 a few tens of kilohertz above sfe. This suggests that there are different electron energization processes underlying the emissions at 630.0 and 427.8 nm. The observations at 427.8 nm were the first direct evidence of pump-induced ionization of thermospheric N2. The experimental results are consistent with theory that predicts electron acceleration by upper hybrid oscillations localized in cylindrical density depletions and formation of a suprathermal tail in the electron velocity distribution (Istomin and Leyser, 2003; Najmi et al., 2017). The acceleration efficiency is the largest for f0 slightly above sfe for s≥3.
To further analyse these experimental results, Sergienko et al. (2012) performed Monte Carlo simulations of the transport of energized electrons into the ambient thermosphere. The observed 630.0 nm emissions could be accounted for by predominantly thermal electrons (>70 % of the emission intensity), with accelerated electrons playing a minor role for the emissions. However, in addition to the electron heating, to explain the observed intensity ratios for the different optical lines, electrons must be accelerated to 60 eV or more.
Shindin et al. (2015) observed emissions at 557.7 and 630.0 nm at the Sura facility for f0 near 4 fe, an effective radiative power (ERP) of about 100 MW, and the HF beam directed either vertically or tilted 12∘ S from the vertical in the magnetic meridional plane towards magnetic zenith (19∘ S). Simultaneous observations of the frequency spectrum of stimulated electromagnetic emissions were used to determine where f0 was relative to 4 fe. The pump-enhanced 630.0 nm emissions did not exhibit a dependence on f0 near 4 fe. And no minimum in the optical emission intensities was observed when f0 ≈ 4 fe, which is contrary to previous measurements by others as mentioned above. The authors attribute this to natural variations in the ionospheric interaction altitudes during the experiments. Further, the authors found that for a vertical HF beam, 557.7 nm emissions occurred for f0 about 5–15 kHz below 4 fe and also at about 220–280 kHz above 4 fe. With the HF beam directed towards magnetic zenith, pump-enhanced emissions were observed for f0 about 15–20 kHz above 4 fe.
In addition to these results for f0≳3 fe, a number of interesting experiments and theories have been presented for f0 near 2fe, but those are outside the scope of the present paper, as the relevant dispersion properties of electron Bernstein modes and upper hybrid modes are different for s=2 and s≥3. Here we are concerned with f0 near 4 fe and higher.
We present experimental results from EISCAT Heating and optical imaging at 557.7 and 630.0 nm from atomic oxygen. Both the temporal evolution of the pump-enhanced emissions following pump-on time and their intensity ratio were studied. With imaging from three ALIS sites, tomography-like reconstruction of the volume emission rates provided altitude profiles that under some assumptions imply a limit on the wavelength range of upper hybrid waves believed to be instrumental in the mechanism that causes the optical enhancements. Specifically, we discriminate conditions for the two different optical lines for f0 near and well above 4 fe.
The EISCAT Heating facility (Rietveld et al., 2016) was used to transmit HF waves in the cycle of 150 s on and 85 s off with the beam pointing in geomagnetic zenith (∼78∘ elevation south) and with left-handed circular polarization (ordinary mode; “left-handed” is with respect to the direction of the geomagnetic field), on 16 February 2015. From 16:00:00 to 16:49:30 UT, f0=6.200 MHz, and the ERP was approximately 138 MW. To keep f0 below the decreasing ionospheric ordinary-mode critical frequency foF2 after sunset, f0=5.423 MHz from 16:50:55 to 17:09:05 UT, and the ERP was 116 MW. The difference in the ERP is mainly due to different antenna gains at the different f0 values. Local time was UT+1 h.
Optical emissions observed with the ALIS stations in Abisko, Kiruna and Tjautjas were analysed. The cameras had a field of view of 60∘ and gave an image size of 512×512 pixels with a temporal resolution of 7 s. In the data analysis, no additional integration was done apart from the exposure time. Emissions were imaged at 427.8 nm from N(1NG) with the threshold 18.6 eV (Holma et al., 2006), 557.7 nm from O(1S) with the threshold 4.17 eV (Haslett and Megill, 1974), 630.0 nm from O(1D) with the threshold 1.96 eV (Haslett and Megill, 1974) and 844.6 nm from O(3p3P) with the threshold 10.99 eV (Gustavsson et al., 2005). However, in the present treatment we focus on the 557.7 and 630.0 nm lines which are the strongest and for which we have the most data, thereby minimizing uncertainties. Kvammen et al. (2019) analysed all four emission lines for this same experiment and presented tomography-like reconstructions of the three-dimensional distribution of the optical volume emission rates. We too employed tomography-like inversion to get altitude profiles of the volume emission rates for the two spectral lines, by a method similar to that described by Gustavsson et al. (2001).
To get the pump-induced enhancements of the optical lines, the background nightglow needs to be subtracted from the total column emissions measured. The background was estimated by cutting out the well-defined pump-enhanced blob in the images and then estimating the background nightglow in that area by linear interpolation pixel by pixel from the nightglow outside the pump-enhanced region. This background was then subtracted from the measured intensities.
The EISCAT UHF incoherent scatter radar, transmitting 1.3–1.4 MW at about 930 MHz, was operated with the parabolic dish antenna scanning in a meridional pattern to obtain background plasma parameter values at different angles to the geomagnetic field, employing the beata programme with a temporal resolution of 5 s and altitude resolution of approximately 3 km. Figure 1 shows the geometry of the experiment with the relative positions of the EISCAT facilities at the Ramfjordmoen site outside Tromsø, Norway, and the ALIS sites in the Kiruna region, Sweden.
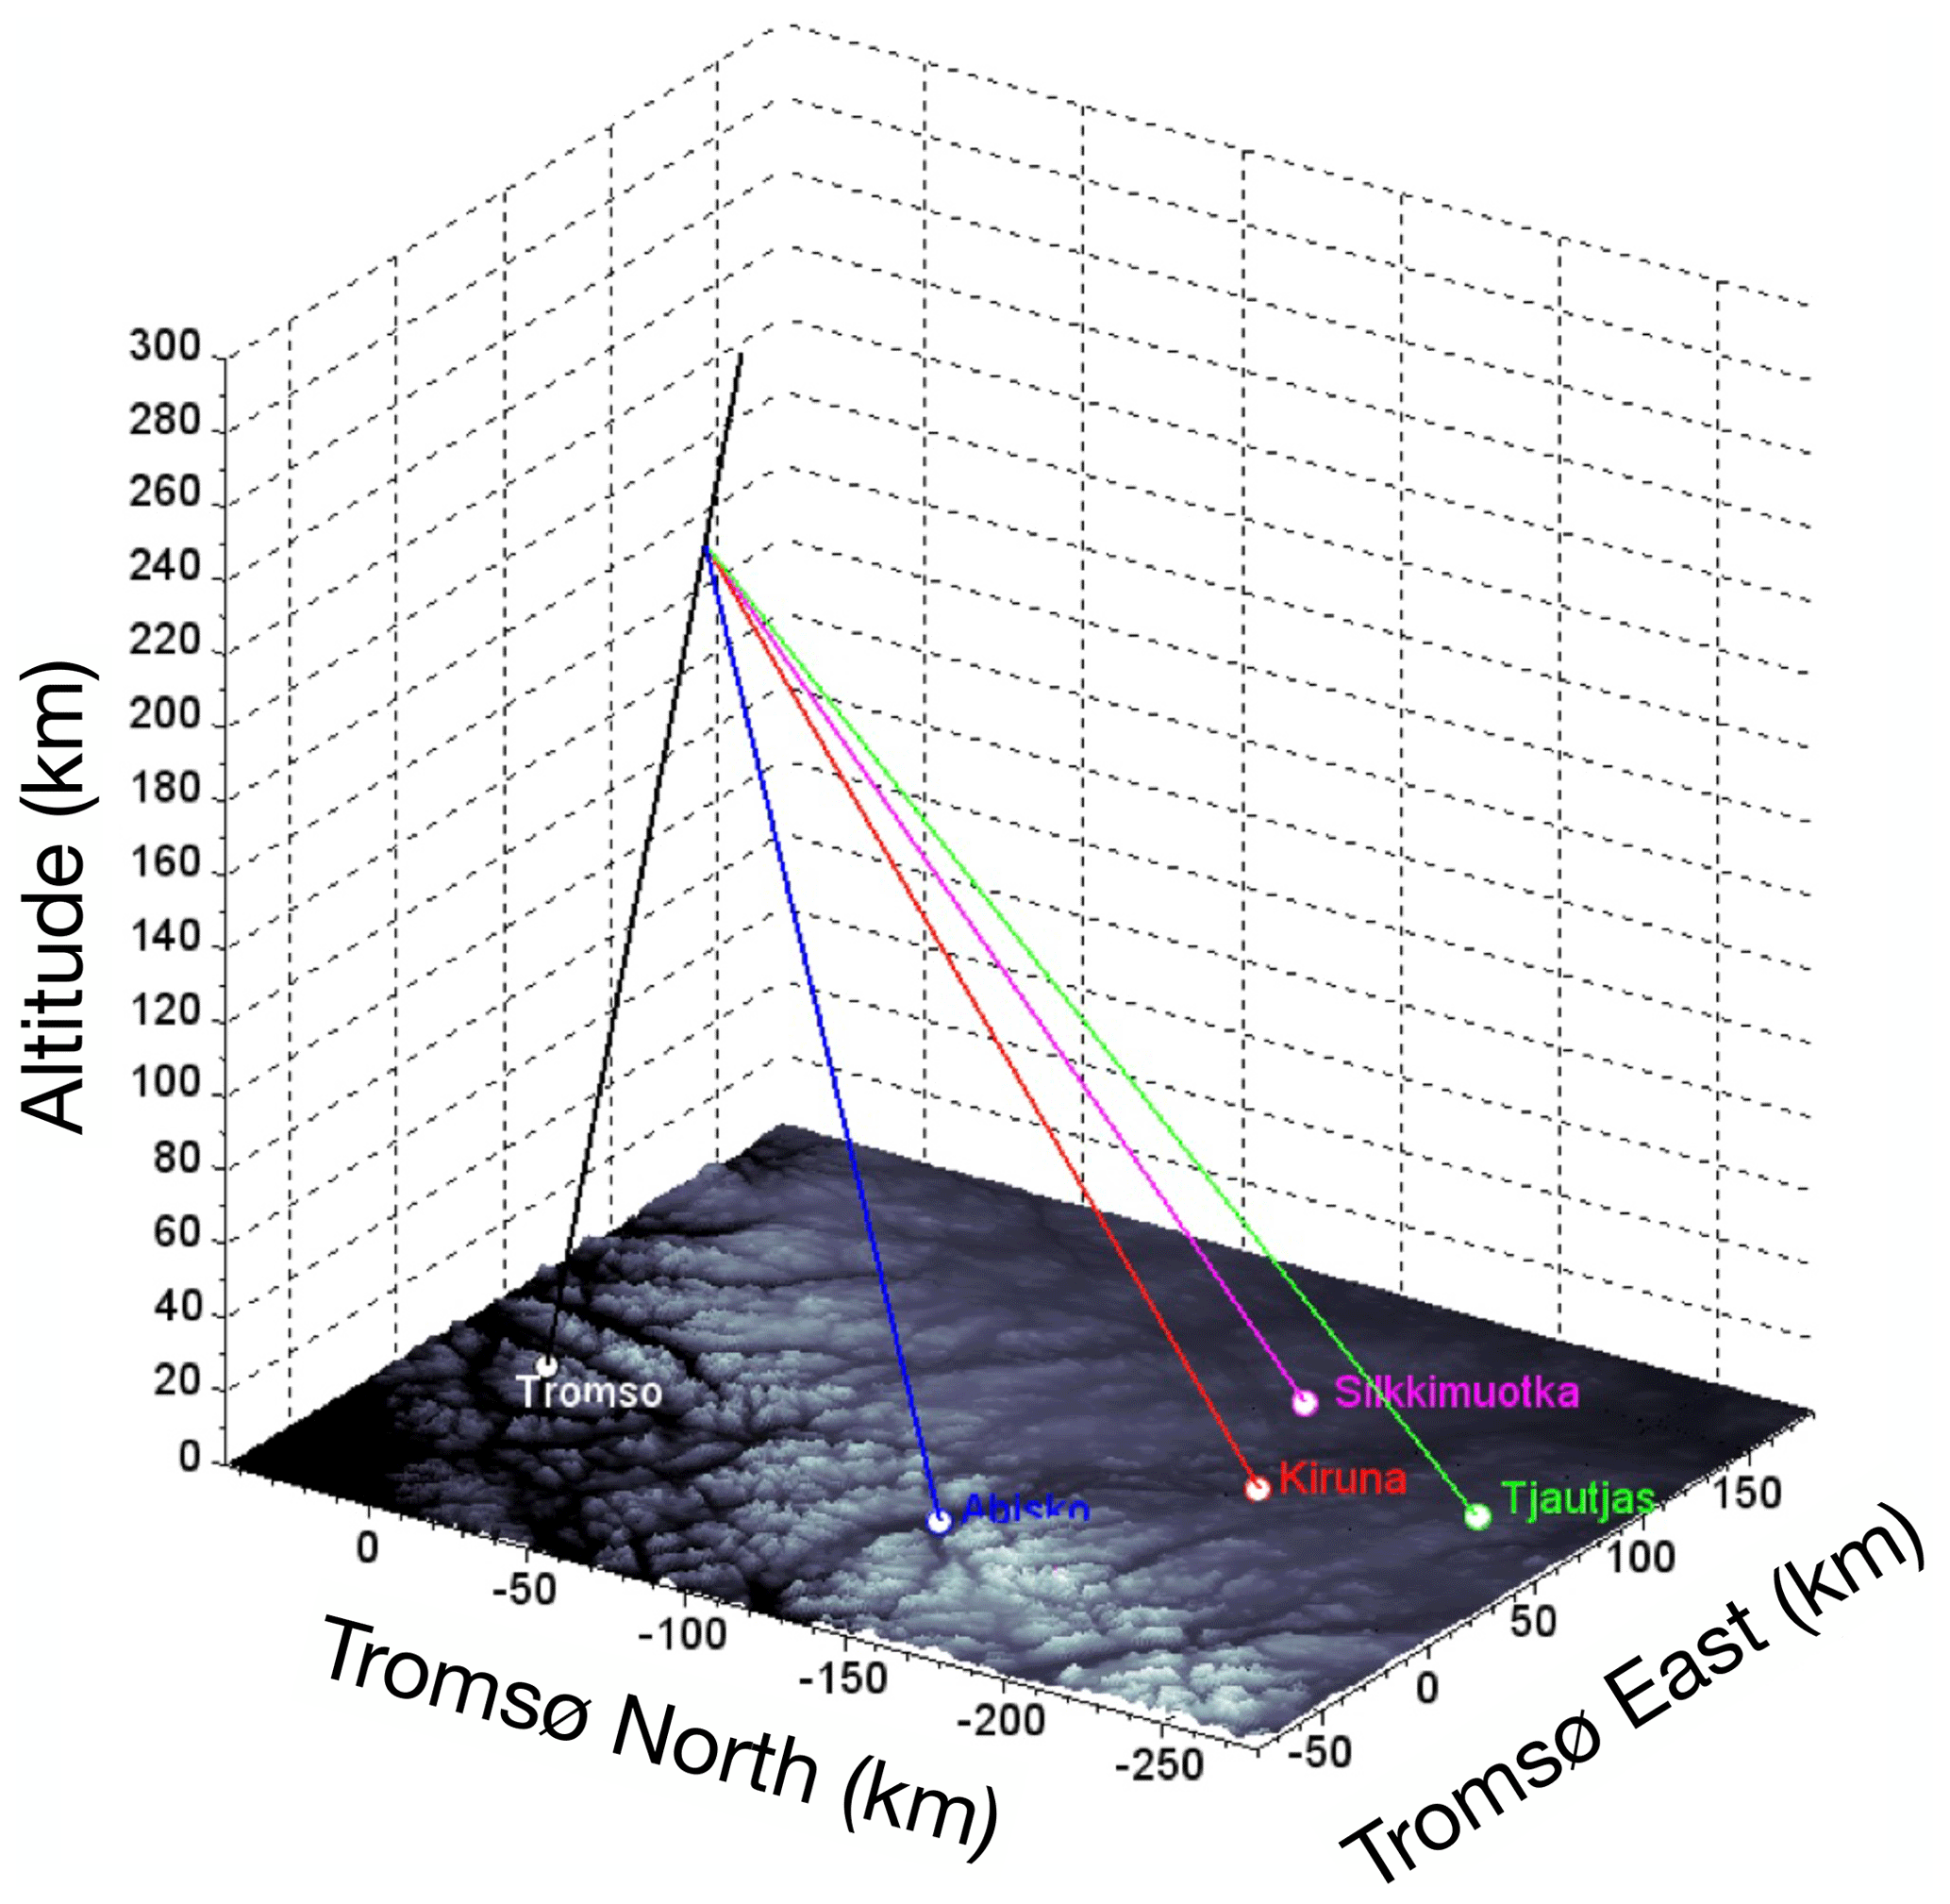
Figure 1Illustration of the relative positions of the EISCAT facilities at the Ramfjordmoen site outside Tromsø, Norway, and the ALIS stations in the Kiruna region, Sweden. The black line shows the direction of magnetic zenith. Data from the ALIS site at Silkkimuotka was not used in the analysis.
Stimulated electromagnetic emissions were received on the ground in Kroken (Tromsø) but were weak and only rarely exhibited spectral structure. Ionograms from the EISCAT dynasonde show elevated D-region absorption.
Figure 2 shows keograms of the altitude profiles of pump-enhanced optical emissions at 630.0 nm above background as observed from the three ALIS sites during the experiment. The column emission rate weakened as f0 was changed from 6.200 to 5.423 MHz at about 16:50 UT. For the second HF pulse at f0=5.423 MHz observed at the Abisko station, the relatively short duration shown in the enhancement is due to lacking synchronization between the pump cycle and optical filter wheel sequence. In the keograms, the slow growth of the emission intensity and extension towards higher altitudes during the pump pulses can be seen. Also, the emissions occurred at lower altitudes for the lower f0. Further, an altitude oscillation of the optical enhancements occurred with an amplitude of ∼30 km and minima at approximately 16:28 and 16:58 UT, implying a period of ∼30 min. This is presumably an atmospheric gravity wave and associated travelling ionospheric disturbance (e.g. Hunsucker, 1982). The altitude decrease as f0 was lowered is likely a combination of this ionospheric oscillation and the fact that an HF wave with a lower f0 will reflect at a lower altitude because the plasma density increases with height in the bottom-side ionosphere.
Figure 3 displays, similarly, an overview of the enhanced emissions at 557.7 nm for the same time period. The emission intensity did not weaken as f0 was decreased at about 16:50 UT. The images from the Kiruna site even show an increase in the emissions as f0 was decreased, despite a lower ERP. But again the altitude region of the emissions decreased as f0 was lowered. It is interesting that Kvammen et al. (2019) observed a clear intensity increase in the 844.6 nm line which has a threshold of 10.99 eV, which similarly to the threshold of 4.17 eV of the 557.7 nm line is several times above the threshold of 1.96 eV for 630.0 nm.
Figure 4 shows the altitude profiles of the electron density, electron temperature and ion temperature obtained with the EISCAT UHF radar in geomagnetic zenith. Clear pump-induced enhancements in the electron temperature can be seen which are slowly conducted upwards in the ionosphere with time, along the geomagnetic field where the thermal conductivity is the highest. A similar slow upwards motion can be seen in the 630.0 nm data (Fig. 2). The electron temperature reaches above 3000 K. The electron density and ion temperature did not exhibit notable pump-induced modulations. However, the electron density slowly decreased with time as the experiments occurred shortly after sunset.
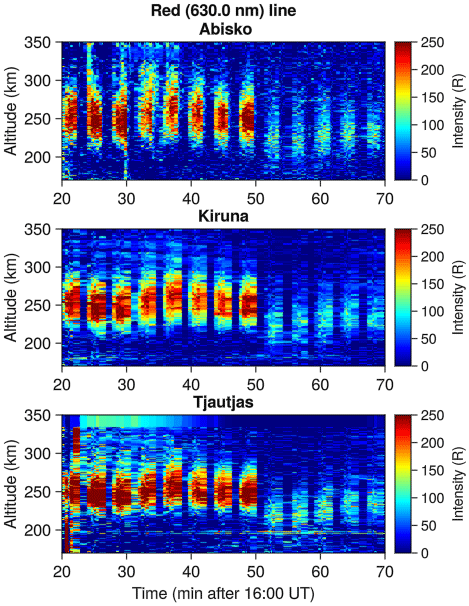
Figure 2Keograms of pump-enhanced column emissions above background at 630.0 nm from 16:20:00 to 17:09:05 UT on 16 February 2015. From 16:00:00 to 16:49:30 UT, f0=6.200 MHz, and from 16:50:55 to 17:09:05 UT, f0=5.423 MHz.
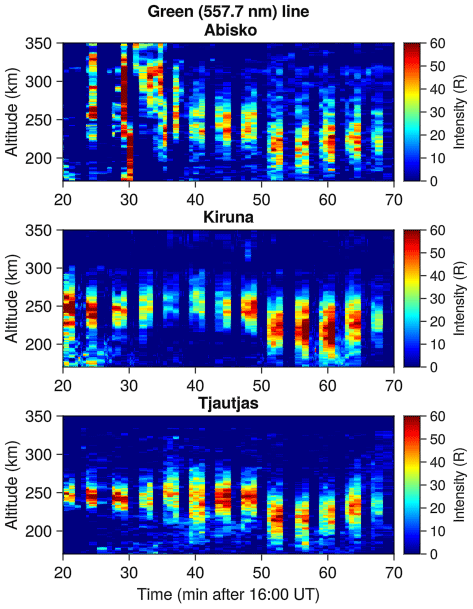
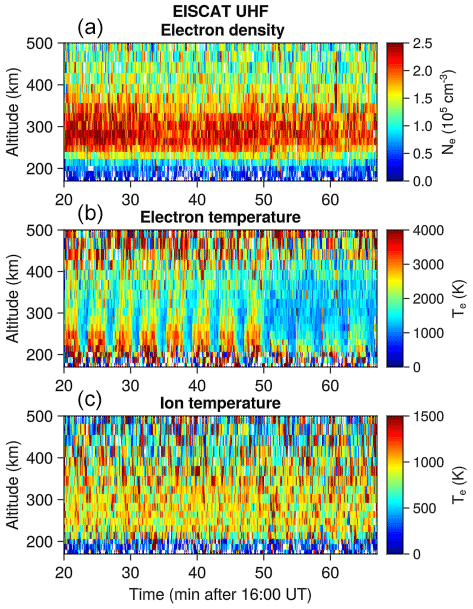
Figure 4Overview of the electron density (a), electron temperature (b) and ion temperature (c) as obtained with the EISCAT UHF radar directed in magnetic zenith, from 16:20:00 to 17:09:05 UT on 16 February 2015. From 16:00:00 to 16:49:30 UT, f0=6.200 MHz, and from 16:50:55 to 17:09:05 UT, f0=5.423 MHz.
Figure 5 shows the altitude profiles of the volume emission rates at 630.0 nm (left) and 557.7 nm (right) for the last pump cycle at f0=6.200 MHz, obtained by tomography-like reconstruction of the emission regions. The maximum volume emission rates occurred at approximately the same height for the two spectral lines, near km. The altitude profile for the 557.7 nm emission is wider than that for 630.0 nm, which is consistent with the fact that the excitation threshold for the former (4.17 eV) is higher than for the latter (1.96 eV). Electrons with higher energies will have longer mean free paths, so the volume within which they collide with neutrals and excite optical emissions will be larger. The times for the plotted profiles are determined by the sequence in the filter wheels for the ALIS cameras. Figure 6 shows, similarly, the height profiles of the volume emission rate for the third pump pulse at f0=5.423 MHz. In this case, the maximum of the emissions at 557.7 nm (right) occurred about 7–10 km below that at 630.0 nm (left). Also, by comparing Figs. 5 and 6, we see that the emission rates for both lines grow slower with f0=5.423 MHz.
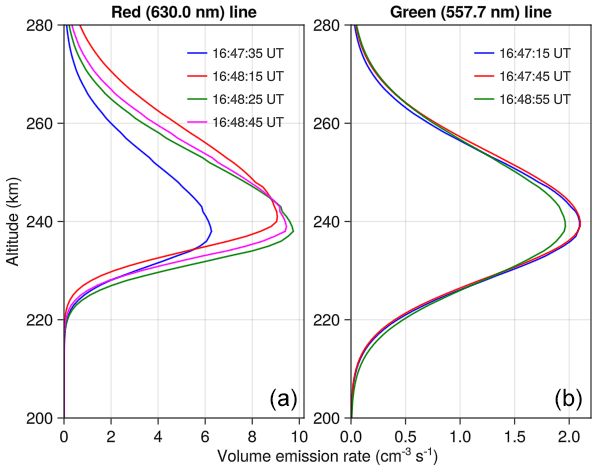
Figure 5Temporal evolution of the height profile of the pump-enhanced volume emission rates in magnetic zenith at 630.0 nm (a) and 557.7 nm (b) for f0=6.200 MHz. The accuracy of the height determination is approximately ±1 km.
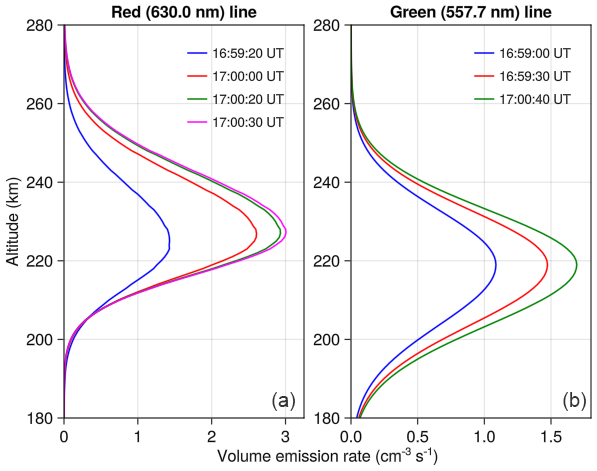
Figure 7 summarizes the temporal evolution of the column emission rates at 630.0 nm (left) and 557.7 nm (right) during the growth phase following pump-on time for f0=6.200 MHz (red) and f0=5.423 MHz (blue), which is for the same data as in Figs. 5 and 6. The 630.0 nm emissions are seen to be weaker for f0=5.423 MHz than for f0=6.200 MHz. However, the emission intensity at 557.7 nm is approximately the same for the two f0 values towards the end of the pump pulses. The intensity ratio towards the end of the plotted time interval is for f0=6.200 MHz and for f0=5.423 MHz, which agrees with Kvammen et al. (2019) for the same experiment. We do not have data for the remaining part of the pump pulse of 150 s because of the used sequence for the filter wheels.
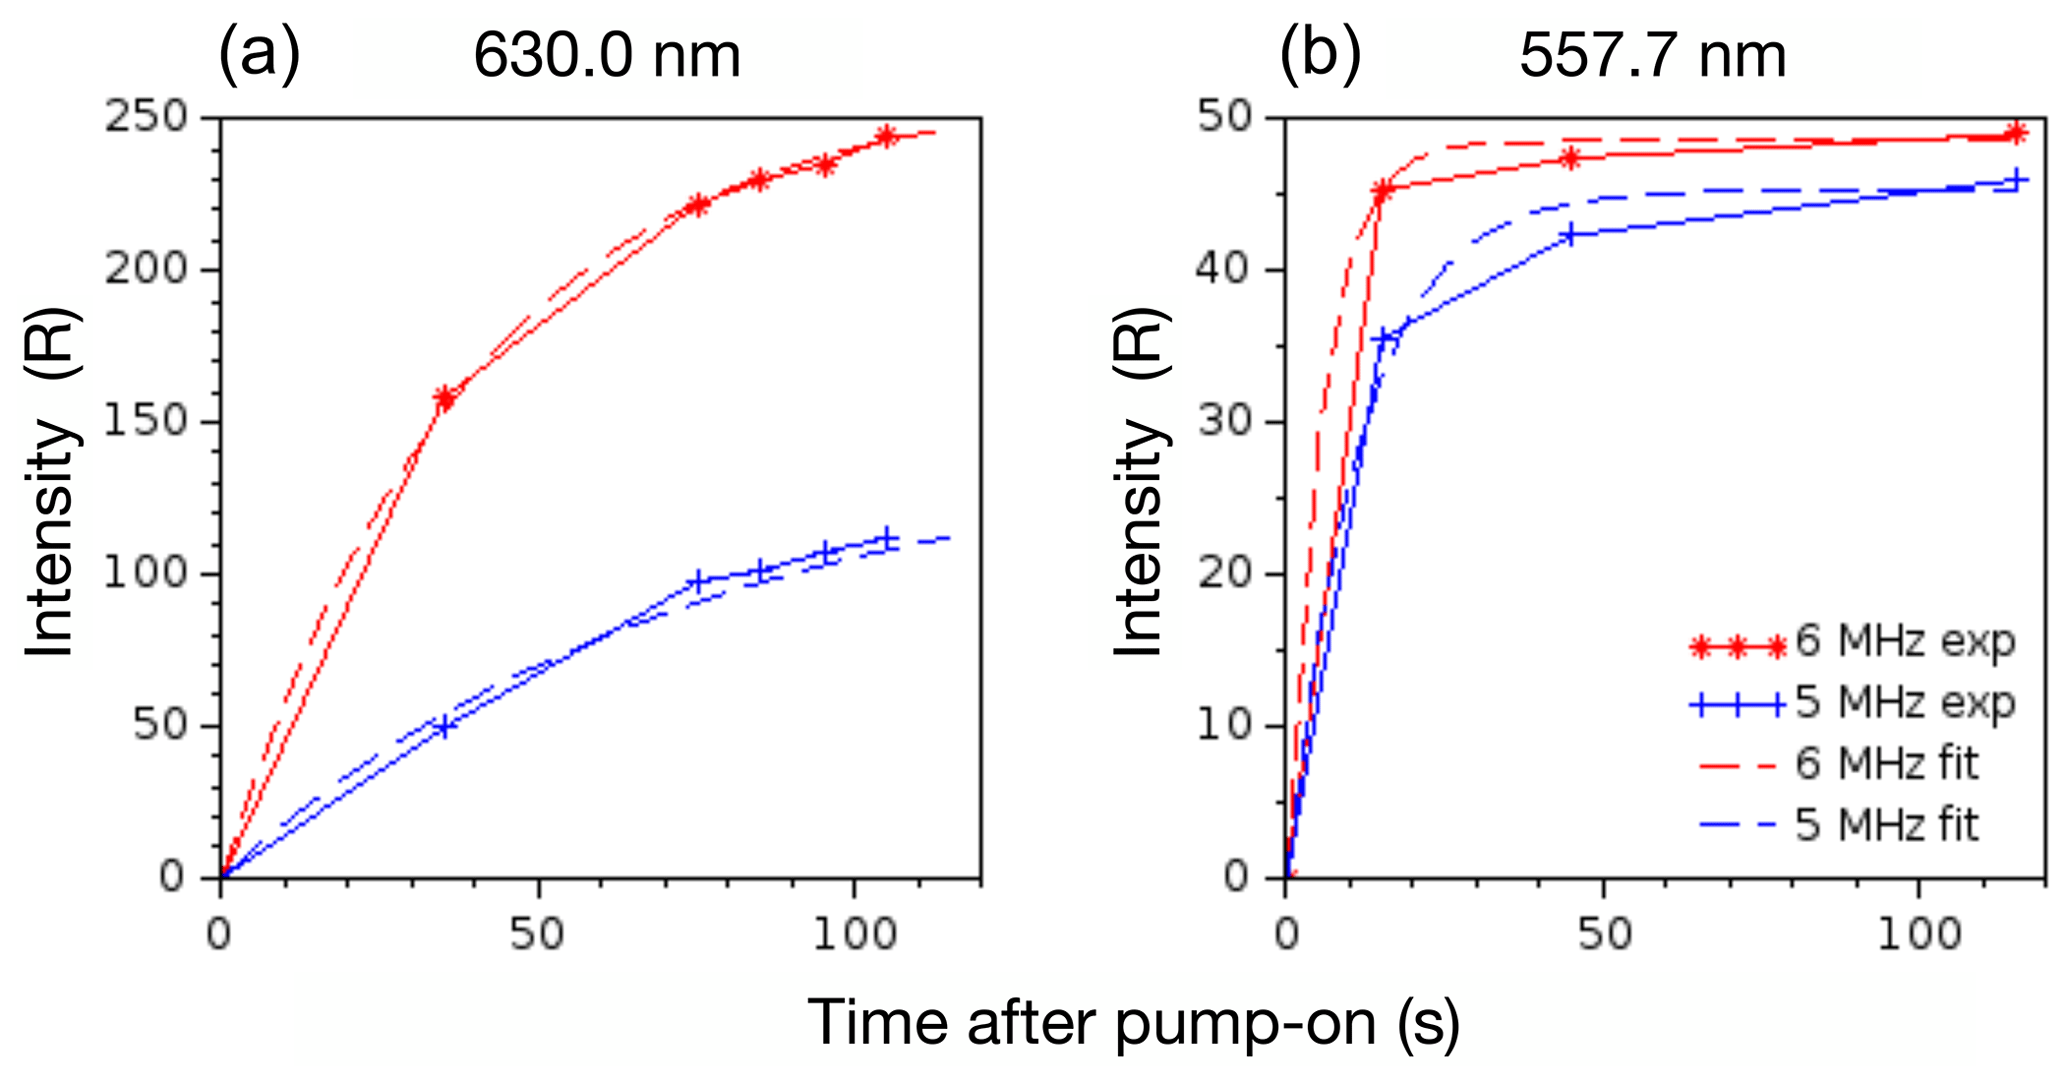
Figure 7Temporal evolution of the pump-enhanced column emission rates at 630.0 nm (a) and 557.7 nm (b) after pump-on time at time t=0 s, which is for the same pump pulses as in Figs. 5 and 6. The solid lines connect the data points shown by markers (red ∗ symbols for f0=6.200 MHz and blue + symbols for f0=5.423 MHz). The dashed lines are the fits with Eq. (3) which give τobs.
To obtain a measure of the growth time of the optical intensities after pump-on time, we fit a theoretical growth time to the experimental data for the emission from a given excited state. The temporal evolution of an emission can be described by the continuity equation for the number density nα of atoms in the excited state α (O(1D), O(1S)). nα is related to the observed column emission rate Iλ through , where Aα is the Einstein coefficient(s) for the emission, and Dλ is the observed spatial scale of the imaged optical region at the wavelength λ. The number density nα is described by the equation
where Qα is the excitation rate which includes the electron impact excitation (thermal and accelerated) and chemical reactions. The loss rate Lα is given by
where qi is the rate coefficient for collisional de-excitation (quenching) by collisions with other species with the number density ni. The last term is the sum of the Einstein coefficients for all emissions originating from the excited state in question. For the 630.0 nm emission, includes the sum of three Einstein coefficients, and qi is for reactions with the main neutrals in the thermosphere at the heights of the F-region ionosphere (N2, O2 and O) as well as with thermal electrons. For the 557.7 nm line, is the sum of the Einstein coefficients only since the O(1S) state is not quenched by collisions at the F-region altitudes of the experiments. Furthermore, for the experiment conditions, the term ∇⋅(nαv) in Eq. (1) can be neglected because of the low velocity v of the neutrals. For the purpose of the present analysis, the spatial dependencies of Qα and Lα are neglected as we are only interested in a relatively small spatial region around the intensity maximum, not in the entire emitting volume.
For our case of HF pump-enhanced emissions, the loss rate is constant with , where τα is the effective lifetime of the excited state α. For the O(1S) state, equals the radiative lifetime so that s, because this state is not quenched by collisions. For the O(1D) state, is affected by quenching, and we take for the relevant altitudes from Gustavsson et al. (2001).
For the purpose of our analysis, we take the source term Qα to be constant. The solution to Eq. (1) is
With Qα constant, the growth time is τ=τα. However, for the general case when Qα is time dependent, τ is determined by both the lifetime τα and Qα(t). Therefore, if fitting the experimental data by Eq. (3) for which Qα is constant gives an observed growth time τobs very different from τα, this implies that the source Qα is not constant.
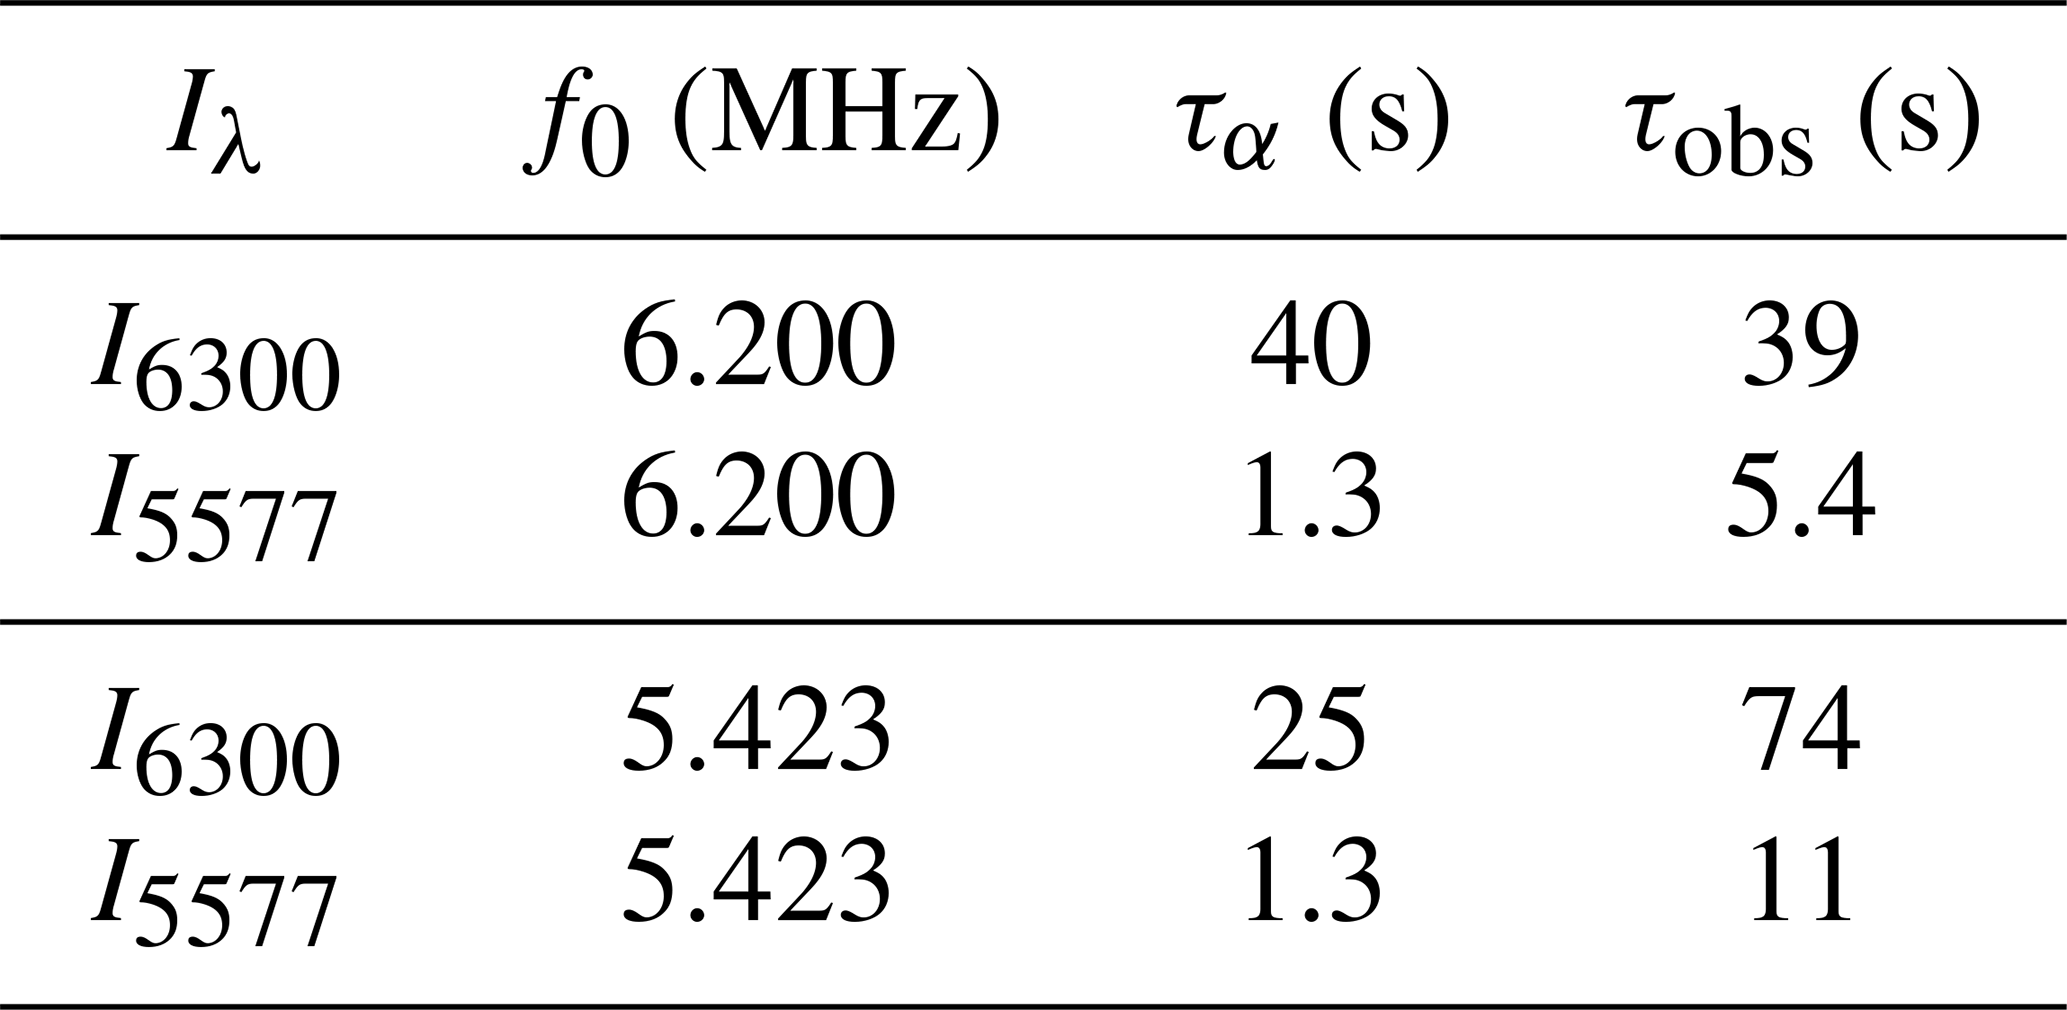
Table 1Emission growth times τobs after pump-on time obtained by fitting Eq. (3) with the observed column emission rates at 630.0 nm (I6300) and 557.7 nm (I5577). τα is the theoretical effective lifetime of the excited state α.
To obtain τobs from the measurements, we recall that so that the observed intensity Iλ(t)∝nα(t) for a fixed Dλ. Thus, Iλ(t) is fitted with a quantity proportional to Eq. (3) for the images at the different t=tk of the data. Iλ(tk) is averaged over a small square (15×15 pixels) around the maximum intensity in the images. The fitting was done by the least squares Levenberg–Marquardt algorithm.
Table 1 summarizes τobs for the column emission rates at 557.7 and 630.0 nm. The theoretical lifetime s in the third column from the left is for the altitude km (Gustavsson et al., 2001), where the 630.0 nm volume emission rate is maximum for f0=6.200 MHz (Fig. 5). Similarly, s is for km (Gustavsson et al., 2001) with f0=5.423 MHz (Fig. 6).
With f0=6.200 MHz, τobs for the 630.0 nm line is almost equal to . For the 557.7 nm line, τobs is approximately 4 times larger than . These results suggest that for f0=6.200 MHz the excitation sources Qα for both emissions reach their maximum faster than s but slower than s, and probably the source growth rates are different for the two emissions.
On the other hand, with f0=5.423 MHz, τobs for both emissions is several times larger than τα. In addition, τobs for both emissions is larger than with f0=6.200 MHz. This suggests that for f0=5.423 MHz the source Qα increases during pumping and is slower than for f0=6.200 MHz. A relatively slow growth of emissions at 557.7 nm has also been observed in experiments at the HAARP facility with f0=7.8 MHz and an ERP of approximately 160 MW (Pedersen et al., 2003). The 557.7 to 630.0 nm intensity ratio in that case was approximately 1 : 3.
HF pump excitation of the O(1D) state, the source of the 630.0 nm line, has been attributed mainly to electron heating from a Maxwellian electron distribution (Mantas, 1994; Mantas and Carlson, 1996), taking into account collisional de-excitation by collisions with molecular oxygen and nitrogen in the atmosphere (Gustavsson et al., 2001). The association of the 630.0 nm emissions with electron heating is consistent with our results for the optical (Fig. 2) and electron temperature enhancements (Fig. 4). Both decreased when f0 was changed from 6.200 to 5.423 MHz at about 16:51 UT.
Klimenko et al. (2017) attributed observations of pump-enhanced emissions at 630.0 nm to electron acceleration rather than heating for experiments at the Sura facility. This conclusion was arrived at by modelling the contributions to the 630.0 nm emissions from dissociative recombination of O ions and electrons, thermal electron heating, and acceleration. The best fit of modelled and experimental results was obtained with moderate electron temperatures of 1100–1900 K. Further, Klimenko et al. (2017) found that the 630.0 nm emissions would be mainly due to electron heating for electron temperatures above about 2500 K. This is consistent with our results and conclusion of the importance of heating as we measured electron temperatures above 3000 K (Fig. 4). And this was obtained with an ERP of ∼138 MW and ∼116 MW compared to the ∼100 MW in the Sura experiments.
One feature of the results by Klimenko et al. (2017) was that no enhancements were observed when foF2 ≲ f0+0.5 MHz. In our case, foF2 ≲ f0+0.5 MHz throughout the experiment, as obtained from the EISCAT dynasonde. This difference in conditions for pump enhancements may possibly be related to the different latitudes of the experiments, with EISCAT at high latitudes within the auroral zone and with Sura at midlatitudes with a smaller dip angle of the geomagnetic field. The dip angle can influence the importance of HF pump excitation parallel to the geomagnetic field (Langmuir turbulence) relative to perpendicular to the magnetic field (electron Bernstein and upper hybrid phenomena).
HF pump-enhanced optical emissions have been connected to upper hybrid waves because the emission intensities are sensitive to f0 near sfe (Kosch et al., 2002a; Gustavsson et al., 2006). The response of ionospheric F-region plasma to HF pumping is asymmetric around sfe (Leyser et al., 1989; Stubbe et al., 1994; Honary et al., 1995; Gustavsson et al., 2006). This is related to asymmetries in the dispersion characteristics of upper hybrid and electron Bernstein modes for frequencies near sfe and s≥3. Theories of the localization of upper hybrid oscillations in density depletions of filamentary density striations along the geomagnetic field predict an asymmetry in the trapping mechanism with deeper depletions for f0≳sfe than for f0≲sfe (Mjølhus, 1993). Therefore, stronger pump-induced effects are expected for f0≳sfe than for f0≲sfe, which gives a corresponding asymmetry also in the anomalous absorption of HF waves by scattering on the striations (Honary et al., 1995; Gurevich et al., 1996) and electron acceleration by the localized upper hybrid oscillations (Istomin and Leyser, 2003). These phenomena are expected to be correlated with electron temperature enhancements which are the source of optical emissions at 630.0 nm and which therefore, too, are expected to be stronger for f0≳sfe than for f0≲sfe. With f0≈sfe, upper hybrid and electron Bernstein phenomena are suppressed because of the linear dispersion characteristics.
In order to find out the relation between f0=5.423 MHz and 4fe in our experiment, we use the IGRF model (International Geomagnetic Reference Field, 13th generation) for the altitude variation of the geomagnetic field in the pump–ionosphere interaction region. We find that MHz occurred at the height of h≈235 km for the date of our experiment. This altitude is above that for the maximum volume emission rates at both 630.0 and 557.7 nm. Figure 6 shows this height to be km for 630.0 nm and km for 557.7 nm. Since fe increases with decreasing altitude, we conclude that f0<4fe in the regions with maximum volume emission rates. The IGRF model gives for the 630.0 nm emissions fe≈1.360 MHz at km, so kHz. For the emissions at 557.7 nm, fe≈1.364 MHz at km, giving kHz.
Stimulated electromagnetic emissions can also be used to estimate the vicinity of f0 to sfe (Leyser, 2001). In our experiment, the emissions were generally too weak for spectral structure to be identified. However, for the fourth pump pulse at f0=5.423 MHz, a weak broad upshifted maximum (BUM) can be observed. Figure 4 shows the electron temperature to be slightly more enhanced in the fourth (and last) pump pulse than in the preceding pulses at f0=5.423 MHz, which indicates a stronger plasma excitation in the last pulse. Figure 8 displays a 130 kHz wide spectrum of the stimulated electromagnetic emissions in the top panel with the ionospherically reflected pump wave at f0 and, for comparison, the noise level with interfering HF transmissions in the same frequency range during pump-off time in the bottom panel. The BUM has its spectral maximum at fBUM≈f0 + 15–20 kHz, which is near the so-called cutoff frequency of the BUM (Leyser, 2001), which is the minimum frequency upshift of the BUM from f0 below which the BUM is not excited. For s=4, the BUM has been observed in the range 4fe−20 kHz ≲ f0≲4 fe + 120 kHz (Frolov et al., 1998), thus mainly for f0≳4fe. However, the proximity of fBUM to the cutoff frequency indicates that f0≈4fe is in the excitation region. The fact that no downshifted maximum (DM) is visible at about f0−10 kHz is another indication that f0≈4 fe. It may be that the optical emissions and the BUM emissions were excited at different altitudes with slightly different fe values. Presumably the weak BUM could have been excited at higher altitudes where f0≈4 fe and the optical emissions at lower altitudes where f0≲4 fe. Also, we note that the height profiles in Figs. 5 and 6 are for the third pump pulse for which the quality of the optical data is higher than for the fourth pulse. The pump–plasma interaction altitudes may have increased slightly between the two pulses, due to the decreasing solar irradiation of the ionosphere after sunset.
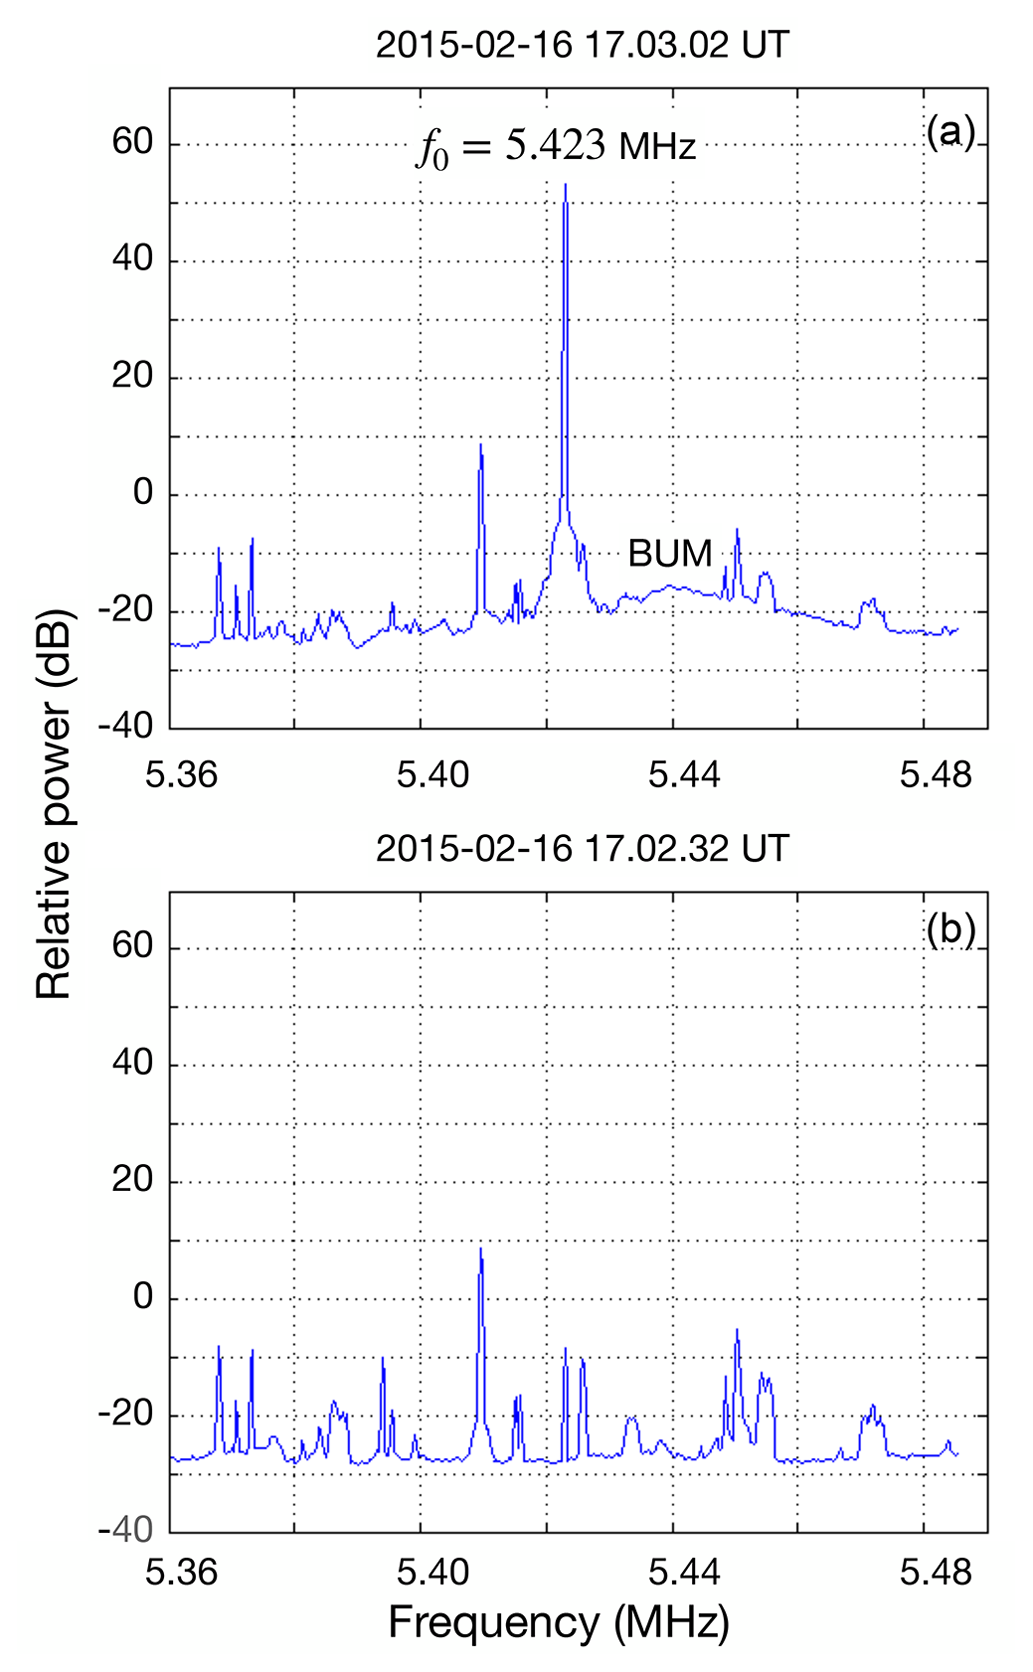
Figure 8Stimulated electromagnetic emissions observed with f0=5.423 MHz at 17:03:02 UT (a) and noise level with pump-off time at 17:02:32 UT (b). A weak BUM with its peak intensity upshifted from f0 by 15–20 kHz can be identified.
Gustavsson and Eliasson (2008) discussed pump-enhanced optical emissions at 427.8, 557.7, 630.0 and 844.6 nm for f0=5.423 MHz and cycling the pump wave with 4 min on and 2 min off. By fitting observed optical emissions and modelled enhanced electron fluxes, they obtained estimates of the volume emission rates for the different optical lines. They found that the maximum volume emission rate for all spectral lines occurred at approximately the same altitude (their Fig. 7), which agrees with our observations for f0=6.200 MHz (Fig. 5). Also, the ratio of the column emission rates for the emissions at 557.7 and 630.0 nm varied in the range –0.4 during the experiment (from their Fig. 2), which agrees with our ratio for the same emission lines but again at f0=6.200 MHz. In our case with f0=5.423 MHz, the maximum of the emissions at 557.7 nm occurred about 7–10 km below that at 630.0 nm (Fig. 6). Further, the ratio is slightly higher than that for the same emission lines presented by Gustavsson and Eliasson (2008) for f0=5.423 MHz.
Gustavsson and Eliasson (2008) found the maximum volume emission rate for 630.0 and 557.7 nm at km and higher, depending on time in the experiment (their Fig. 7). According to the IGRF model for the date of their experiments, 4 fe ≈ 5.414 MHz at 220 km and lower at increasing altitudes. Thus, in their case f0≳4 fe in the height region with the main pump-enhanced optical emissions. In view of the similarities between the results by Gustavsson and Eliasson (2008) and our case with f0=6.200 MHz, together with the fact that in our case f0=5.423 MHz ≲4 fe at the altitudes of maximum volume emission rates as discussed above, we conjecture that f0=5.423 MHz ≲ 4 fe in the energization regions where the optical emissions were enhanced in our experiment.
Further, the dispersion characteristics of upper hybrid waves (Leyser et al., 1989; Istomin and Leyser, 1995; Mishin et al., 2005) are similar for the case of Gustavsson and Eliasson (2008) with f0=5.423 MHz ≳ 4 fe and our case for f0=6.200 MHz ≈ 4.6 fe. In both cases, upper hybrid waves can have a wide range of wave numbers, which facilitates large electron temperature enhancements and emissions at 630.0 nm. On the other hand, for f0≲4 fe, as in our case for f0=5.423 MHz, upper hybrid waves with positive group dispersion are limited to relatively small wave numbers only, which is expected to give less electron heating and lower emission levels at 630.0 nm. Therefore, our result of appears consistent with ≈ 0.1–0.4 as observed by Gustavsson and Eliasson (2008), both with f0=5.423 MHz but the former with f0≲4 fe and the latter with f0≳4 fe.
The fact that the column emission rate at 630.0 nm in our case decreased when f0 was lowered from f0=6.200 to f0=5.423 MHz is consistent with the theoretically predicted asymmetry in pump-induced effects for f0 around 4 fe, with weaker enhancements for f0≲4 fe and the largest excitations for f0≳4 fe. For f0=6.200 MHz ≈4.6fe, the excitation level should be somewhere in between these two cases, that is, stronger than for f0=5.423 MHz ≲ 4 fe, as observed. However, we note that no such asymmetry in the 630.0 nm emission has been observed in previous experiments (Gustavsson et al., 2006; Shindin et al., 2015), although the emission intensity was at a minimum for f0≈sfe.
Emission at 557.7 nm has been interpreted in terms of electron acceleration giving a nonthermal tail in the electron distribution rather than electron heating (Gustavsson et al., 2002, 2005). Istomin and Leyser (2003) presented a model of electron acceleration by upper hybrid oscillations localized in the density depletion of a striation pumped by a left-handed circularly polarized electromagnetic wave that gives a power-law tail in the electron velocity distribution. From their equation (40), we obtain an estimate of the maximum upper hybrid wave number perpendicular to the geomagnetic field for kHz (557.7 nm) as , where ρe is the thermal electron gyro radius. With an electron temperature of 2500 K (Fig. 4), ρe≈0.023 m, which gives m−1 or upper hybrid wavelengths longer than about 1 m. For kHz (630.0 nm), is even smaller, which implies an even smaller range of possible upper hybrid wavelengths. For wave numbers , upper hybrid waves have negative group dispersion for which the waves cannot be localized in density depletions and therefore can only be relatively weakly excited.
As the 557.7 nm column emission rate in our case was approximately the same or even increased as f0 was decreased, we conclude that this emission is excited through electron acceleration by relatively long upper hybrid wavelengths, about 1 m or longer that can be excited for f0=5.423 MHz ≲ 4 fe as well as for f0=6.200 MHz. This assumes that the pump-induced electron energization occurred approximately at the altitudes where the optical volume emission rates are the largest. The slow growth of the 557.7 nm line relative to the lifetime of the O(1S) state (Table 1) is consistent with the fact that upper hybrid waves need to be localized in the slowly growing density depletions of striations for efficient electron acceleration. The fact that both the 630.0 and 557.7 nm emissions exhibited a much longer growth time than the lifetime of the corresponding excited states is consistent with the relatively weak level of upper hybrid phenomena that is expected for f0≲4 fe as only relatively long wavelengths can be excited.
The emission intensity at 557.7 nm for f0=5.423 MHz was relatively high despite the slightly lower ERP and the expected limited wavelength range of upper hybrid oscillations. This can be understood by the assumption that the anomalous absorption of the pump wave (and associated electron temperature enhancements) decreased as f0 was lowered from 6.200 to 5.423 MHz, thereby giving stronger pumping of the long-wavelength upper hybrid oscillations for electron acceleration. Conversely, the larger enhancements of both the 630.0 nm intensity and the electron temperature for f0=6.200 MHz are attributed mainly to the wider range of upper hybrid wavelengths that are available compared to that for f0=5.423 MHz ≲ 4 fe, in addition to the slightly higher ERP.
Kvammen et al. (2019) concluded for the same experiment that f0=5.423 MHz ≳ 4 fe by comparing their observed increase in the enhancement at 844.6 nm (10.99 eV threshold) for f0=5.423 MHz to Gustavsson et al. (2006), who observed larger enhancements at 427.8 nm (18.75 eV threshold) for f0≳4 fe than for f0≲4 fe. We note that the ERP in the experiments by Gustavsson et al. (2006) was 4 to 5 times higher than in the present experiment, implying that a comparison between the experiments may not be obvious. In view of the fact that f0=5.423 MHz ≲ 4 fe at the altitudes of maximum volume emission rates, we suggest the possibility that f0≲4 fe in the excitation regions of the optical emissions. With f0≲4 fe at lower altitudes and f0≳4 fe at higher altitudes, there would be a region with f0≈4 fe in between with minimum pump–plasma interaction involving upper hybrid and electron Bernstein modes and therefore minimum electron heating and enhancements at 630.0 nm. With f0 sufficiently near 4 fe, regardless of whether f0≲4 fe or f0≳4 fe, upper hybrid and electron Bernstein oscillations would only have relatively long wavelengths, which are suggested to be involved in the electron acceleration that enhances emissions at 557.7 nm (and 844.6 nm as studied by Kvammen et al., 2019).
Najmi et al. (2017) presented results from Vlasov and test-particle simulations that indicate the physics of electron energization by wave modes perpendicular to the ambient magnetic field and trapped in the density depletion of a striation in the upper hybrid resonance region. When f0 is between 3 fe and 4 fe, bulk electron heating occurs by electron Bernstein waves, which leads to an essentially thermal electron velocity distribution. For f0≳4 fe, resonant interaction with the upper hybrid mode was found to dominate, which leads to electron acceleration and the formation of a suprathermal tail of energetic electrons. However, with f0=4.01 fe in their simulations, the frequency shift of f0 above 4 fe is less than the lower hybrid frequency they used. This implies that decay products of parametric interaction between upper hybrid oscillations at f0 and lower hybrid oscillations have frequencies below 4 fe, so the interaction involves upper hybrid waves both slightly above and below 4 fe. Their results can therefore not be used for a comparison of electron energization efficiency of f0≲4 fe and f0≳4 fe as would be relevant for the present study. But the importance of electron heating for f0 not near sfe is consistent with our result of enhanced 630.0 nm emissions and electron temperatures for f0=6.200 MHz.
Shindin et al. (2015) detected enhancements at 557.7 nm only for f0 about 15–20 kHz above 4 fe in experiments at the Sura facility, with the HF beam tilted 12∘ S from vertical in the magnetic meridional plane and the photometers directed in magnetic zenith (19∘ S). For a vertical HF beam, emissions were observed with f0 about 5–15 kHz below 4 fe and also at about 220–280 kHz above 4 fe. Our suggestion that the emission was enhanced for f0≲4 fe with the Heating beam in magnetic zenith thus agrees with Shindin et al. (2015) for a vertical Sura beam, but it disagrees with their observations for the Sura beam tilted towards magnetic zenith. However, we do not find it clear whether Shindin et al. (2015) actually obtained conditions with f0≲4 fe and the HF beam tilted towards magnetic zenith so that a comparison with the observed 557.7 nm enhancements for f0≳4 fe could actually be made. Further, although Shindin et al. (2015) by superposed epoch analysis convincingly bring forth the pump-enhanced 557.7 nm emission, their data remain noisy with variations in the natural background airglow. The experimental conditions in our case were better, and the optical emissions were enhanced well above background. Another point is that even with f0 about 15–20 kHz above 4 fe in some altitude region, enhancement of optical emissions could also occur at some 10 km or lower altitudes at which f0≲4 fe.
Gustavsson et al. (2002) observed ≈ 0.3–0.4 for f0=4.040 MHz which is near 3 fe, in experiments with EISCAT Heating and an ERP of approximately 73 MW. From estimates of the reflection altitude, the authors found that f0≲3 fe in the early part of the experiment which changed to f0≳3 fe in the later part because of the slowly increasing pump reflection height during the evening. We note that the largest ratio was observed in the early part of the experiment (their Fig. 2), when f0≲3 fe, which is consistent with our results with f0=5.423 MHz ≲ 4 fe.
Kosch et al. (2005) presented experimental results from the HAARP facility and found ≈ 0.2–0.4 but for f0≳3 fe (their Fig. 1). We note that the largest ratio was observed in the first displayed pump pulse when f0 was the closest to 3 fe. The ERP was 47.8 MW. However, no results were obtained for f0≲3 fe to compare with. Thus, Kosch et al. (2005) observed the largest ratio for f0≳3 fe, while Gustavsson et al. (2002) observed their largest ratio for f0≲3 fe. In addition, the ERP was larger in the experiment by Gustavsson et al. (2002) than for Kosch et al. (2005). One difference between these two experiments that may have influenced the excitation efficiency for the optical emissions is that Gustavsson et al. (2002) used a vertically transmitted pump beam, while Kosch et al. (2005) transmitted the beam in magnetic zenith where maximum optical effects are expected (Kosch et al., 2000; Pedersen and Carlson, 2001; Pedersen et al., 2008). This could have contributed to the high ratio for f0≳3 fe observed by Kosch et al. (2005) despite the lower ERP.
The EISCAT Heating facility was used to excite ionospheric F-region plasma by HF pumping with 150 s on and 85 s off and with the beam pointing in geomagnetic zenith, first with f0=6.200 MHz and thereafter with f0=5.423 MHz. Optical emissions imaged at 557.7 and 630.0 nm from three ALIS sites were analysed, and plasma parameter values were obtained with the EISCAT UHF incoherent scatter radar. In addition, stimulated electromagnetic emissions were detected on the ground. From tomography-like reconstruction of the altitude distribution of the optical volume emission rates, we conclude that f0=6.200 MHz ≈ 4.6 fe and f0=5.423 MHz ≲ 4 fe in the height regions with the largest optical enhancements. The ratio of the column emission rates was for f0=6.200 MHz. As f0 was decreased to 5.423 MHz, the pump-induced enhancements of both the 630.0 nm emission and electron temperature decreased. This is consistent with the fact that the O(1D) state is excited mainly by electron heating, as reduced electron temperature means reduced heating. On the other hand, the emission intensity at 557.7 nm was approximately the same or even increased slightly as f0 was decreased to 5.423 MHz so that . Whereas emission at 630.0 nm has been attributed to excitation of the O(1D) state mainly by electron heating, emission at 557.7 nm from the O(1S) excited state is due to accelerated electrons. However, in view of the large ratio and the importance of electron acceleration for the emissions at 557.7 nm, it is reasonable that electron acceleration also contributed to the 630.0 nm emission. The obtained altitude profiles of the optical volume emission rates provide a limit on the wavelength range of upper hybrid waves considered to be instrumental for the electron acceleration. The 557.7 nm enhancement is suggested to depend primarily on upper hybrid waves with wavelengths of 1 m or longer that due to the linear dispersion characteristics can be excited for f0=5.423 MHz ≲ 4 fe. The fact that the growth times of both emissions in this case were several times longer than the lifetimes of their respective excited states indicates that both emissions depend on the formation of small-scale density striations, which due to the limited upper hybrid wavelength range is expected to be slower for f0≲4 fe than for f0 not near sfe (s≥3).
ALIS data are available at https://alis.irf.se/stdnames/ (Brändström, 2023). Raw EISCAT data used in this analysis are available at http://portal.eiscat.se/schedule/schedule.cgi (Sergienko, 2023), and the GUISDAP (Grand Unified Incoherent Scatter Design and Analysis Package) software used to analyze the EISCAT raw data is available at https://eiscat.se/scientist/user-documentation/guisdap/ (Häggström, 2022).
TBL organized the experiment, interpreted the results and wrote the paper. TS analysed the data, did the theoretical modelling and provided the plots for the figures. All authors took part in the experiment and contributed to the paper.
The contact author has declared that none of the authors has any competing interests.
Publisher’s note: Copernicus Publications remains neutral with regard to jurisdictional claims made in the text, published maps, institutional affiliations, or any other geographical representation in this paper. While Copernicus Publications makes every effort to include appropriate place names, the final responsibility lies with the authors.
The authors gratefully acknowledge the three referees, two anonymous and Savely M. Grach, for their valuable comments on the paper. EISCAT is an international association supported by research organizations in China (CRIRP), Finland (SA), Japan (NIPR and ISEE), Norway (NFR), Sweden (VR) and the United Kingdom (UKRI).
This paper was edited by Igo Paulino and reviewed by Savely Grach and two anonymous referees.
Brändström, B. U. E., Leyser, T. B., Steen, Å., Rietveld, M. T., Gustavsson, B., Aso, T., and Ejiri, M.: Unambiguous evidence of HF pump-enhanced airglow at auroral latitudes, Geophys. Res. Lett., 26, 3561–3564, https://doi.org/10.1029/1999GL010693, 1999. a
Brändström, B. U. E.: ALIS database at IRF [data set], https://alis.irf.se/stdnames/, (last access: 11 December 2023), 2023. a
Frolov, V. L., Ekukhimov, L. M., Kagan, L. M., Komrakov, G. P., Sergeev, E. N., and Stubbe, P.: Two-component nature of the broad up-shifted maximum in stimulated electromagnetic emission spectra, Phys. Rev. Lett., 81, 1630–1633, https://doi.org/10.1103/PhysRevLett.81.1630, 1998. a
Grach, S. M., Kosch, M. J., Yashnov, V. A., Sergeev, E. N., Atroshenko, M. A., and Kotov, P. V.: On the location and structure of the artificial 630-nm airglow patch over Sura facility, Ann. Geophys., 25, 689–700, https://doi.org/10.5194/angeo-25-689-2007, 2007. a
Gurevich, A. V., Lukyanov, A. V., and Zybin, K. P.: Anomalous absorption of powerful radio waves on the striations developed during ionospheric modification, Phys. Lett. A, 211, 363–372, https://doi.org/10.1016/0375-9601(95)00970-1, 1996. a
Gustavsson, B. and Eliasson, B.: HF radio wave acceleration of ionospheric electrons: Analysis of HF-induced optical enhancements, J. Geophys. Res.-Space, 113, A08319, https://doi.org/10.1029/2007JA012913, 2008. a, b, c, d, e, f, g
Gustavsson, B., Sergienko, T., Rietveld, M. T., Honary, F., Steen, Å., Brändström, B. U. E., Leyser, T. B., Arulia, A., Aso, T., and Ejiri, M.: First tomographic estimate of volume distribution of enhanced airglow emission caused by HF pumping, J. Geophys. Res., 106, 29105–29123, https://doi.org/10.1029/2000JA900167, 2001. a, b, c, d, e, f
Gustavsson, B., Brändström, B. U. E., Steen, Å., Sergienko, T., Leyser, T. B., Rietveld, M. T., Aso, T., and Ejiri, M.: Nearly simultaneous images of HF pump-enhanced airglow at 6300 Å and 5577 Å, Geophys. Res. Lett., 29, 73-1–73-4, https://doi.org/10.1029/2002GL015350, 2002. a, b, c, d, e, f
Gustavsson, B., Sergienko, T., Kosch, M. J., Rietveld, M. T., Brändström, B. U. E., Leyser, T. B., Isham, B., Gallop, P., Aso, T., Ejiri, M., Grydeland, T., Steen, Å., LaHoz, C., Kaila, K., Jussila, J., and Holma, H.: The electron energy distribution during HF pumping, a picture painted with all colors, Ann. Geophys., 23, 1747–1754, https://doi.org/10.5194/angeo-23-1747-2005, 2005. a, b
Gustavsson, B., Leyser, T. B., Kosch, M., Rietveld, M. T., Steen, A., Brändström, B. U. E., and Aso, T.: Electron Gyroharmonic Effects in Ionization and Electron Acceleration during High-Frequency Pumping in the Ionosphere, Phys. Rev. Lett., 97, 195002, https://doi.org/10.1103/PhysRevLett.97.195002, 2006. a, b, c, d, e, f
Haslett, J. C. and Megill, L. R.: A model of the enhanced airglow excited by RF radiation, Radio Sci., 9, 1005–1019, https://doi.org/10.1029/RS009i011p01005, 1974. a, b
Häggström, I.: Guisdap 9.2, https://eiscat.se/scientist/user-documentation/guisdap/, (last access: 11 December 2023), 2022. a
Holma, H., Kaila, K., Kosch, M., and Rietveld, M.: Recognizing the blue emission in artificial aurora, Adv. Space Res., 38, 2653–2658, https://doi.org/10.1016/j.asr.2005.07.036, 2006. a
Honary, F., Stocker, A. J., Robinson, T. R., Jones, T. B., and Stubbe, P.: Ionospheric plasma response to HF radio waves operating at frequencies close to the third harmonic of the electron gyrofrequency, J. Geophys. Res., 100, 21489–21501, https://doi.org/10.1029/95JA02098, 1995. a, b
Hunsucker, R. D.: Atmospheric gravity waves generated in the high-latitude ionosphere: A review, Rev. Geophys., 20, 293–315, https://doi.org/10.1029/RG020i002p00293, 1982. a
Istomin, Y. N. and Leyser, T. B.: Parametric decay of an electromagnetic wave near electron cyclotron harmonics, Phys. Plasmas, 2, 2084–2097, https://doi.org/10.1063/1.871295, 1995. a
Istomin, Y. N. and Leyser, T. B.: Electron acceleration by cylindrical upper hybrid oscillations trapped in density irregularities in the ionosphere, Phys. Plasmas, 10, 2962–2970, https://doi.org/10.1063/1.1578637, 2003. a, b, c
Klimenko, V., Grach, S., Sergeev, E. N., and Shindin, A. V.: Features of the Ionospheric Artificial Airglow Caused by Ohmic Heating and Plasma Turbulence-Accelerated Electrons Induced by HF Pumping of the Sura Heating Facility, Radiophys. Quant. El., 60, 431–449, https://doi.org/10.1007/s11141-017-9812-0, 2017. a, b, c
Kosch, M. J., Rietveld, M. T., Hagfors, T., and Leyser, T. B.: High-latitude HF-induced airglow displaced equatorwards of the pump beam, Geophys. Res. Lett., 27, 2817–2820, https://doi.org/10.1029/2000GL003754, 2000. a, b
Kosch, M. J., Rietveld, M. T., Kavanagh, A. J., Davies, C., Yeoman, T. K., Honary, F., and Hagfors, T.: High-latitude pump-induced optical emissions for frequencies close to the third electron gyro-harmonic, Geophys. Res. Lett., 29, 2112, https://doi.org/10.1029/2002GL015744, 2002a. a, b
Kosch, M. J., Rietveld, M. T., Yeoman, T. K., Cierpa, K., and Hagfors, T.: The high-latitude artificial aurora of 21 February 1999: An analysis, Adv. Polar Upper Atmos. Res., 16, 1–12, 2002b. a
Kosch, M. J., Rietveld, M. T., Senior, A., McCrea, I. W., Kavanagh, A. J., Isham, B., and Honary, F.: Novel artificial optical annular structures in the high latitude ionosphere over EISCAT, Geophys. Res. Lett., 31, L12805, https://doi.org/10.1029/2004GL019713, 2004. a
Kosch, M. J., Pedersen, T., Hughes, J., Marshall, R., Gerken, E., Senior, A., Sentman, D., McCarrick, M., and Djuth, F. T.: Artificial optical emissions at HAARP for pump frequencies near the third and second electron gyro-harmonic, Ann. Geophys., 23, 1585–1592, https://doi.org/10.5194/angeo-23-1585-2005, 2005. a, b, c, d, e
Kosch, M. J., Pedersen, T., Mishin, E., Starks, M., Gerken-Kendall, E., Sentman, D., Oyama, S., and Watkins, B.: Temporal evolution of pump beam self-focusing at the High-Frequency Active Auroral Research Program, J. Geophys. Res., 112, A08304, https://doi.org/10.1029/2007JA012264, 2007. a
Kvammen, A., Gustavsson, B., Sergienko, T., Brändström, U., Rietveld, M., Rexer, T., and Vierinen, J.: The 3-D Distribution of Artificial Aurora Induced by HF Radio Waves in the Ionosphere, J. Geophys. Res.-Space, 124, 2992–3006, https://doi.org/10.1029/2018JA025988, 2019. a, b, c, d, e
Leyser, T. B.: Stimulated electromagnetic emissions by high-frequency electromagnetic pumping of the ionospheric plasma, Space Sci. Rev., 98, 223–328, https://doi.org/10.1023/A:1013875603938, 2001. a, b
Leyser, T. B., Thidé, B., Derblom, H., Hedberg, Å., Lundborg, B., Stubbe, P., and Kopka, H.: Stimulated electromagnetic emission near electron cyclotron harmonics in the ionosphere, Phys. Rev. Lett., 63, 1145–1147, https://doi.org/10.1103/PhysRevLett.63.1145, 1989. a, b
Mantas, G. P.: Large 6300-Å airglow intensity enhancements observed in Ionosphere Heating Experiments are excited by thermal electrons, J. Geophys. Res.-Space, 99, 8993–9002, https://doi.org/10.1029/94JA00347, 1994. a
Mantas, G. P. and Carlson, H. C.: Reinterpretation of the 6300-Å airglow enhancements observed in ionospheric heating experiments based on analysis of Platteville, Colorado, data, J. Geophys. Res., 101, 195–209, https://doi.org/10.1029/95JA02760, 1996. a
Mishin, E. V., Kosch, M. J., , Pedersen, T., and Burke, W. J.: HF-induced airglow at magnetic zenith: Thermal and parametric instabilities near electron gyroharmonics, Geophys. Res. Lett., 32, L23106, https://doi.org/10.1029/2005GL023864, 2005. a
Mjølhus, E.: On the small scale striation effect in ionospheric radio modification experiments near harmonics of the electron gyro frequency, J. Atmos. Terr. Phy., 55, 907–918, https://doi.org/10.1016/0021-9169(93)90030-3, 1993. a
Najmi, A., Eliasson, B., Shao, X., Milikh, G., Sharma, A. S., and Papadopoulos, K.: Vlasov simulations of electron acceleration by radio frequency heating near the upper hybrid layer, Phys. Plasmas, 24, 102904, https://doi.org/10.1063/1.4999768, 2017. a, b
Pedersen, T., Esposito, R., Starks, M., and McCarrick, M.: Quantitative determination of HF radio-induced optical emission production efficiency at high latitudes, J. Geophys. Res., 113, A11316, https://doi.org/10.1029/2008JA013502, 2008. a, b
Pedersen, T. R. and Carlson, H. C.: First observations of HF heater-produced airglow at the High Frequency Active Auroral Research Program facility: Thermal excitation and spatial structuring, Radio Sci., 36, 1013–1026, https://doi.org/10.1029/2000RS002399, 2001. a, b
Pedersen, T. R., McCarrick, M., Gerken, E., Selcher, C., Sentman, D., Carlson, H. C., and Gurevich, A.: Magnetic zenith enhancement of HF radio-induced airglow production at HAARP, Geophys. Res. Lett., 30, 1169, https://doi.org/10.1029/2002GL016096, 2003. a, b, c
Rietveld, M. T., Senior, A., Markkanen, J., and Westman, A.: New capabilities of the upgraded EISCAT high-power HF facility, Radio Sci., 51, 1533–1546, https://doi.org/10.1002/2016RS006093, 2016. a
Sergienko, T., Gustavsson, B., Brändström, U., and Axelsson, K.: Modelling of optical emissions enhanced by the HF pumping of the ionospheric F-region, Ann. Geophys., 30, 885–895, https://doi.org/10.5194/angeo-30-885-2012, 2012. a
Sergienko, T.: Database at EISCAT [data set], http://portal.eiscat.se/schedule/schedule.cgi, (last access: 11 December 2023), 2023. a
Shindin, A., Grach, S. M., Klimenk, V. V., Nasyrov, I. A., Sergeev, E. N., Beletski, A. B., Taschilin, M. A., and Gumerov, R. I.: The 630 nm and 557.7 nm Airglow During HF Ionosphere Pumping by the SURA Facility Radiation for Pump Frequencies Near the Fourth Electron Gyroharmonic, Radiophys. Quant. El., 57, 759–772, https://doi.org/10.1007/s11141-015-9562-9, 2015. a, b, c, d, e, f, g
Stubbe, P., Stocker, A. J., Honary, F., Robinson, T. R., and Jones, T. B.: Stimulated electromagnetic emission and anomalous HF wave absorption near electron gyroharmonics, J. Geophys. Res., 99, 6233–6246, https://doi.org/10.1029/94JA00023, 1994. a