the Creative Commons Attribution 4.0 License.
the Creative Commons Attribution 4.0 License.
 | 04 Aug 2023
Electron radiation belt safety indices based on the SafeSpace modelling pipeline and dedicated to the internal charging risk
Antoine Brunet
Sebastien Bourdarie
Christos Katsavrias
Guillerme Bernoux
Stefanos Doulfis
Afroditi Nasi
Ingmar Sandberg
Constantinos Papadimitriou
Jesus Oliveros Fernandez
Ioannis Daglis
In this paper, we present the SafeSpace prototype for a safety warning system, dedicated to the electron radiation-belt-induced internal charging hazard aboard spacecraft. The space weather tool relies on a synergy of physical models associated in a chain that covers the whole Sun–interplanetary-space–Earth's inner magnetosphere medium. With the propagation of uncertainties along the modelling pipeline, the safety prototype provides a global nowcast and forecast (within a 4 d lead time) of the electron radiation belt dynamic as well as tailored indicators for space industry operators. They are meant to inform the users about the severity of the electron space environment via a three-coloured alarm system, which sorts the index intensity according to a representative historical distribution of in situ data. The system was tested during the challenging 2015 St Patrick's Day storm in order to assess its performance. It showed overall good nowcasting and forecasting capabilities due to its broad physics-driven pipeline.
- Article
(1267 KB) - Full-text XML
- BibTeX
- EndNote


Since the advent of the space era, space applications (commercial, technical and scientific) have become progressively more and more important for our societies. Earth observation, telecommunication and geo-positioning are among the needs covered by the space industry – to which one can add scientific activities (Devezas et al., 2012; George, 2019). These activities involve different types of actors such as spacecraft operators, space agencies, governmental institutions, technology corporations and aerospace manufacturers. With over 5000 orbiting spacecraft in 2022 (Satellite Industry Association, 2022) and an expected exponential growth for the next decade due to the involvement of the “new space” players (Mann et al., 2018; Kodheli et al., 2020), the need for a well-specified operating environment is essential.
The space radiation environment is one of the most challenging constraints met by human space-based activities (Koons et al., 1999). Indeed, the near-Earth space environment – and, more generally speaking, the inner magnetosphere – is filled with several types of particle populations, including trapped energetic electrons and protons (shaping the so-called radiation belts), solar energetic particles resulting from the solar eruptive activity, and cosmic emissions (Bourdarie and Xapsos, 2008; Zheng et al., 2019). These populations have specific multi-scale complex dynamics, some components of which are due to their interaction with the Earth's electromagnetic configuration and the solar-wind–magnetosphere coupling (Russell and Thorne, 1970; Lyon, 2000).
In-orbit spacecraft can suffer temporary failures and/or permanent damage caused by their interaction with particles in space. These disruptions, which depend on the nature and energy range of the incident particles, can be classified according to the physical nature of the damage caused, among which are the following:
-
surface and internal charging phenomena due to the build-up of charge on surfaces and leading to electrostatic discharges affecting sensitive components (Garrett and Whittlesey, 2000);
-
single-event effects caused by energetic protons and ions that deposit energy inside integrated circuits, causing component upset or even destruction (Petersen, 2011; Caron et al., 2018);
-
increased drag due to the heating of the high atmosphere by higher ultraviolet solar emissions during active times, leading to recurrent orbital changes (Doornbos and Klinkrad, 2006);
-
impacts on spacecraft communications and navigation accuracy due to the local disruption of the ionosphere (radio signal propagation medium) leading to scintillation, deviation, attenuation or absorption of radio signals (Roston, 1970);
-
cumulative degradation of materials due to energy deposit by incident particles or photons, leading to ionization or atomic displacement (Dever et al., 2005).
Note that the exposure of satellites to these hazards depends strongly on their orbit. For instance, low-Earth-orbit (LEO) satellites are more likely to be subject to drag and trapped radiation and medium-Earth-orbit (MEO) satellites undergo strong radiation doses and deep charging, while geosynchronous-Earth-orbit (GEO) satellites go through a highly variable radiation environment and occasional solar energetic protons (McCormack, 1988; Benton and Benton, 2001; Bourdarie and Xapsos, 2008).
Due to the near impossibility of performing in situ repairs on damaged satellites, manufacturers impose conservative assumptions throughout the satellite design phase to ensure adequate robustness during the operational life of the spacecraft (Durante, 2002; Durante and Cucinotta, 2011). More precisely, they rely on specification or engineering models derived from statistical and empirical studies associated with the field of space climatology (Vette, 1991; Mursula et al., 2007; Sicard et al., 2018). Quite recently, the growing need for nowcasting and forecasting of small-scale variations in the space environment has led to the development of the field of space weather (Rockville, 2019). Space weather services enable space operators to effectively deploy protective measures during periods of intense geomagnetic activity and to mitigate its effects, in addition to improving current situational awareness, operation scheduling, testing, maintenance and post-event analysis (Bothmer and Daglis, 2007; Moldwin, 2022). This evolution was made possible by the consequent improvement in the physical and empirical models which describe the dynamics of the various inner magnetosphere's components (plasma waves, electron plasma density, radiation belts, etc.) (Tsyganenko, 2013; Fok, 2020; Ripoll et al., 2020).
In this context, the European Union's Horizon 2020 SafeSpace project aims to improve the space weather nowcasting and forecasting capabilities by building a safety service prototype (Daglis, 2022). The latter relies on a chain of physical and semi-empirical models, covering the whole Sun-to-Earth domain. The synergy of these models allows the propagation of physical information and uncertainties that are used to estimate tailored particle radiation indicators for the space industry. In addition, the SafeSpace prototype provides a 2 to 4 d forecast window, enabling an early warning system for hazardous space weather events. In this paper, we present new developments carried out to construct radiation belt activity indices specifically related to the risk of internal charging due to electron radiation belts. More specifically, these indices must meet specific industrial needs, provided here by Thales Alenia Space, which represents the industrial member in the SafeSpace team (Daglis, 2022).
This article is organized as follows. First, we present the SafeSpace modelling pipeline and its components (Sect. 2). Then, in Sect. 3 we focus on the methodology for constructing the new activity indices. In Sect. 4 we provide an example of index nowcasting and forecasting during a real geomagnetic storm and compare their accuracy to observation-deduced indices. We conclude by briefly discussing these results and highlighting their strengths and weaknesses, which opens the way for future developments.
The SafeSpace safety service relies on a physical modelling pipeline that enables ensemble nowcasting and forecasting of the electron outer radiation belt fluxes, as shown in Fig. 1. The pipeline can be roughly subdivided into three main segments. The first one is the heliospheric propagation segment, in which the Multi-VP, Helio1D (1D MHD) and EUHFORIA codes are chained together to simulate the development and the propagation of the solar wind and coronal mass ejections (CMEs) from the surface of the Sun (using photospheric magnetograms as inputs) to the interplanetary region (Samara et al., 2021, 2022; Kieokaew et al., 2022). This segment provides estimates of three solar wind parameters at L1 (density, velocity and temperature) as well as the By component of the interplanetary magnetic field (IMF) as an ensemble forecast comprising 21 members. These parameters are also fed to OGNN (ONERA Geoeffectiveness Neural Network), the aim of which is to estimate the geomagnetic index Kp (Matzka et al., 2021) or, in other words, the geoeffectiveness of the estimated solar wind conditions. OGNN is a neural network based on long short-term memory recurrent layers (Hochreiter and Schmidhuber, 1997), which have been extensively used in the community to forecast geomagnetic indices (Gruet et al., 2018; Chakraborty and Morley, 2020; Bernoux et al., 2021). Note that the Bz component of the IMF, which is notoriously one of the most important components of the IMF for predicting the geoeffectiveness of the solar wind and solar transients (see, e.g., Richardson and Cane, 2011), is not reliably estimated by Helio1D, which is why we have to restrict ourselves to By in this study. In Brunet et al. (2023), the authors discuss the implications of the lack of Bz for the SafeSpace modelling pipeline capabilities.
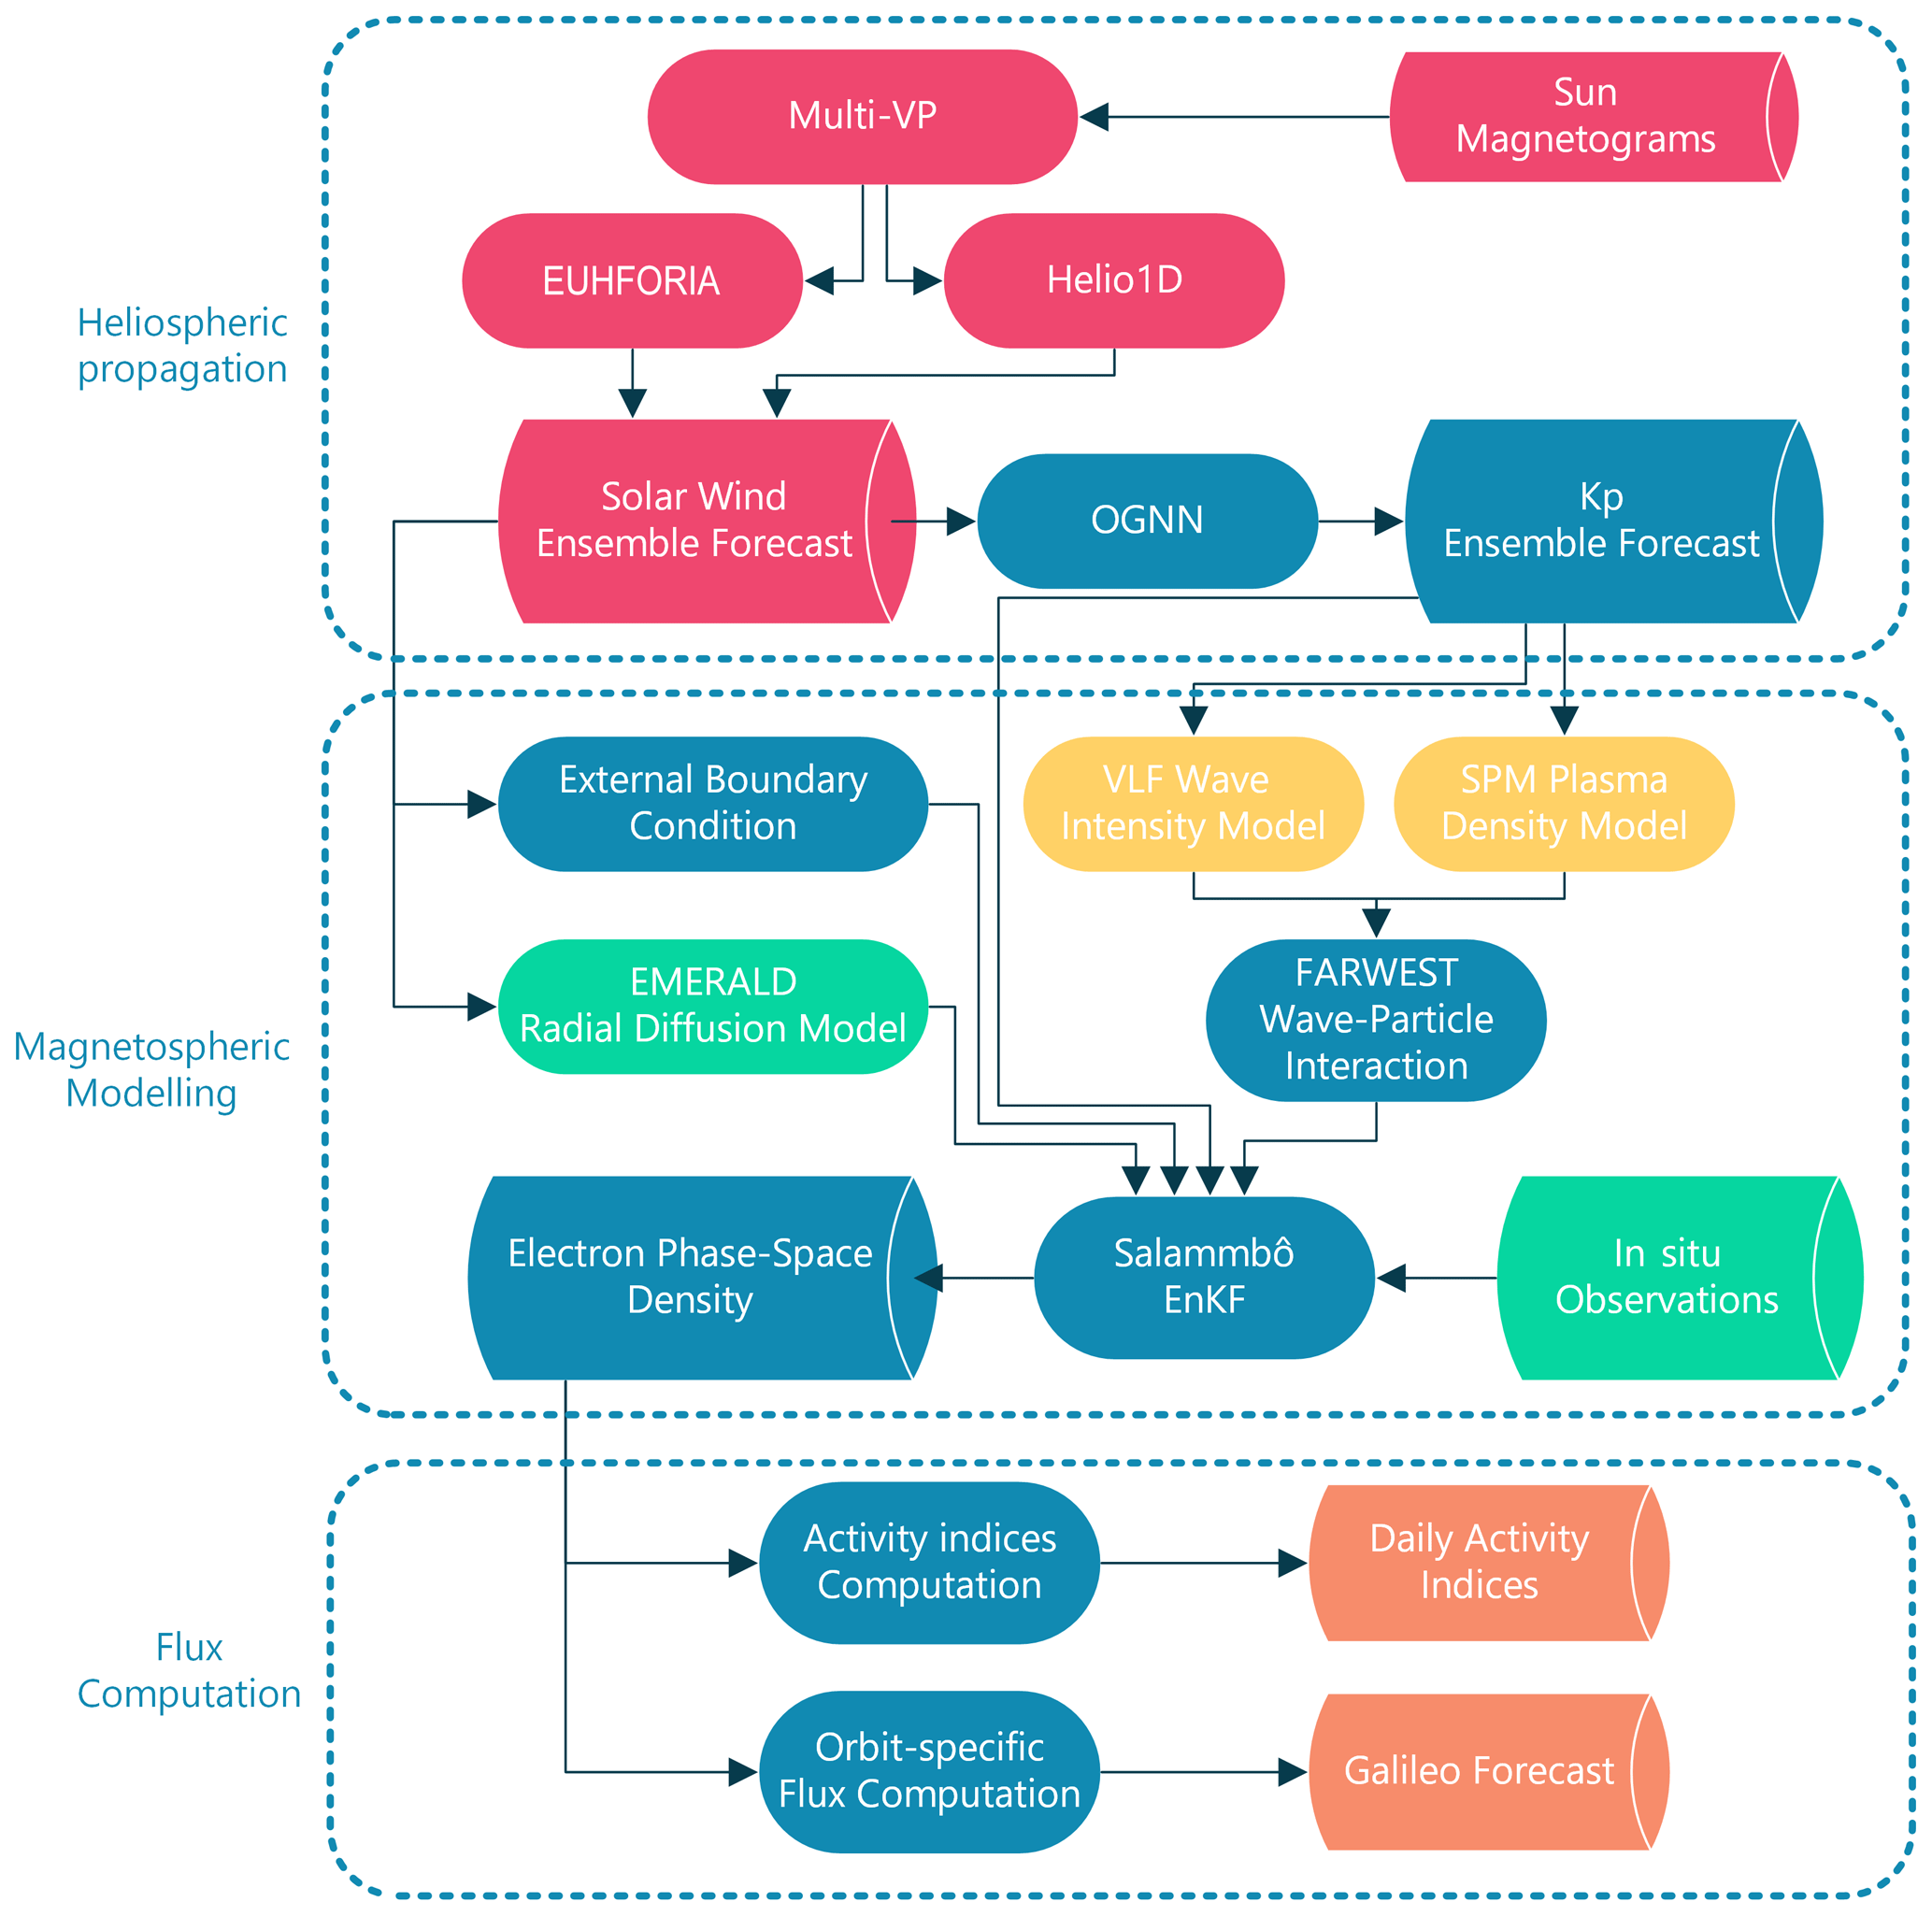
Figure 1The SafeSpace pipeline, describing the Sun–interplanetary-space–Earth’s inner magnetosphere interactions.
The second segment is the inner magnetosphere modelling segment (for which an exhaustive description is available in Brunet et al., 2023). Its purpose is to prepare and estimate the inputs for the Salammbô–EnKF, which is the combination of
-
the Salammbô–Electron 3D code, a physical model that solves the Fokker–Planck equation describing the statistical distribution of magnetically trapped electrons in the (Ec, y=sin (αeq), L*) phase space (Beutier and Boscher, 1995; Bourdarie and Maget, 2012), with Ec being the electron's energy, αeq its equatorial pitch angle with Earth's magnetic field and L* the Roederer parameter (Roederer, 2012), and
-
the EnKF (ensemble Kalman filter), a sequential data assimilation tool that combines model forecasts from Salammbô and in situ data to determine an optimal estimation of the actual conditions (Evensen, 2003). It is expected that the implementation of Salammbô–EnKF in the fully operational SafeSpace pipeline, will operate with observations from the NOAA GOES-16 electron monitor (Onsager et al., 1996) as well as the EMU instrument onboard Galileo GSAT 0207 and 0215 satellites (Sandberg et al., 2019).
The input data required by Salammbô–EnKF (in the SafeSpace project context) are the following:
-
time-dependent diffusion rates describing the radial diffusion process, using the solar-wind-driven neural-network-based EMERALD model (Aminalragia-Giamini et al., 2022).
-
time-dependent pitch angle and energy diffusion rates, induced by resonant interaction with waves and computed by the FARWEST code (Dahmen et al., 2022). The local diffusion computations in FARWEST are based on the cold plasma cartography estimated by SPM (Pierrard et al., 2021a; Botek et al., 2021) and the VLF (very low-frequency) wave distributions for the whistler mode hiss and upper and lower chorus as presented in (Santolík et al., 2021).
-
boundary conditions provided by the solar-wind-driven GEO model (Katsavrias et al., 2021).
For each one of the 21 solar wind ensemble members derived in the first segment, we compute an internal ensemble of magnetospheric parameters consisting of 10 members. Therefore, an ensemble totalling parameters is fed hourly to Salammbô–EnKF to compute two types of trapped electron flux maps: nowcast flux maps and forecast flux maps with a 4 d lead when possible.
In the SafeSpace pipeline's third segment, the computed flux maps are used to derive electron radiation belt activity indices. These user-driven indices are the core of our paper and are extensively described in the next section.
In terms of computational cost, the SafeSpace pipeline requires approximately 5 h to provide its estimation of the radiation belt activity indices, after following a timed computational sequence represented in Fig. 2. It shows that the computational cost is shared almost exclusively between the building of the input data for Salammbô (around 3 h) and the Salammbô–EnKF simulation (around 2 h).
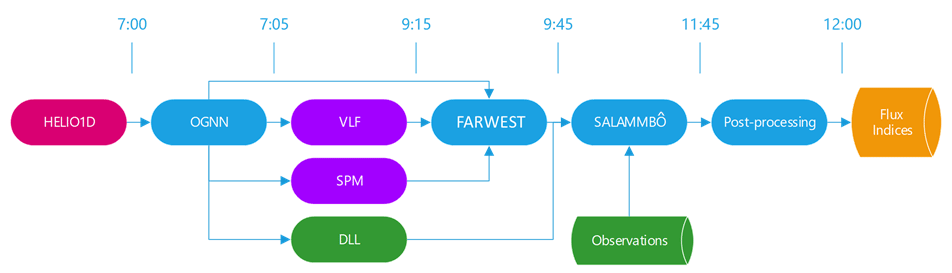
Figure 2The timeline of the SafeSpace pipeline. The time codes refer to the approximate computation end time of the previous computational step and by extension to the time when output data are available for the next computation step.
3.1 Description of the indices
The electron radiation belt activity indices are the keystone of the SafeSpace safety service. They are meant to indicate how severe the electron space environment is at a given time. They can be nowcast in real time and forecast with a 4 d lead. The nowcast indices are meant, e.g., for post-event anomaly analysis, and the forecast ones can be used to prevent some anomalies on board spacecraft. These indices are based on daily averaged electron fluxes. Since the electron population varies greatly according to the considered orbit, one single activity index cannot accurately cover all orbits. Therefore we provide not one but three indices covering three standard orbits, namely the LEO, MEO (GNSS) and GEO. In addition, space radiation environment effects on spacecraft are greatly dependent on the nature and the energy of the particle fluxes. After consultation and feedback from the space industry stakeholders, we decided to dedicate the indices to the quantification of the internal charging risk.
It is well established that internal charging events are attributed to electrons with energy greater than 400 keV. As a result, deriving a radiation belt index relevant to internal charging can be done using any electron channel above 400 keV . Hence, we propose nowcast and forecast activity indices computed from the following estimated fluxes:
-
an internal charging risk in the LEO index, computed from daily averaged electron flux with energies E>1.2 MeV, computed on the POES spacecraft orbit;
-
an internal charging risk in the MEO/GNSS orbit index, computed from daily averaged electron flux with energies E>0.8 MeV computed on the GPS spacecraft orbit;
-
an internal charging risk in the GEO index, computed from daily averaged electron flux with energies E>0.8 MeV computed on the GOES spacecraft orbit.
The activity indices given here are targeted at spacecraft operators and industry end users. Therefore, they have to be easily understandable by every user, including those who are not space radiation environment experts. This means that we cannot simply provide average flux values but rather propose a warning system in the form of a three-colour system. To define these periods, we need to define flux threshold values, which must be representative of the risk under consideration and the needs of the consulted stakeholders. Thus, we specified the levels of risk as follows:
-
a period is considered “active” (red) if the daily averaged flux is among the 2 % strongest historical flux values;
-
a period is considered “moderate” (yellow) if the daily averaged flux is among the 20 % strongest historical flux values;
-
the remaining periods (among the 80 % weakest historical flux values) are considered “quiet” (green).
These statistical limits correspond to threshold values of daily averaged flux, deducted from the statistical distributions of daily energetic electron flux values at each of the considered orbits. We will see in Sect. 3.2 how we obtain these statistical distributions from long-term measurement data.
3.2 Historical distributions
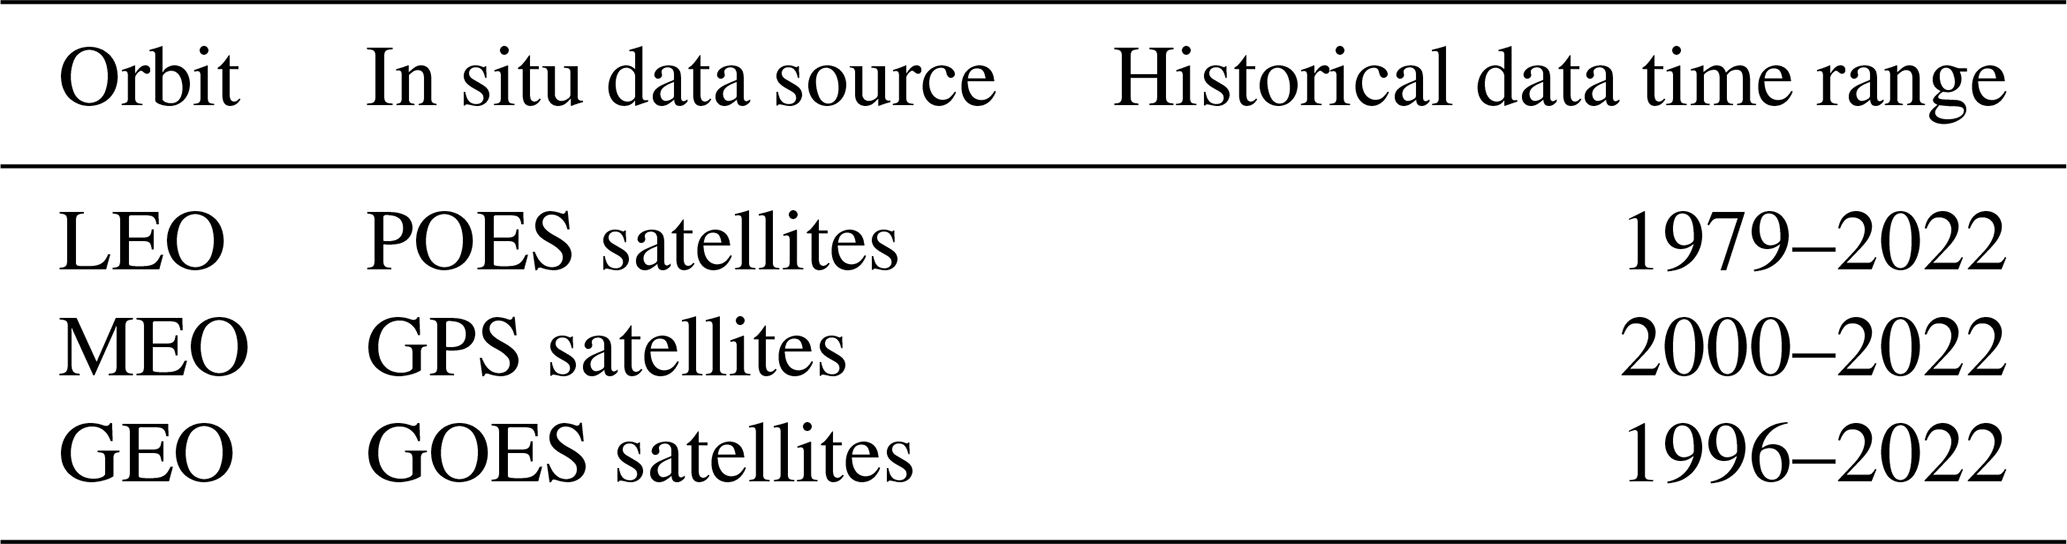
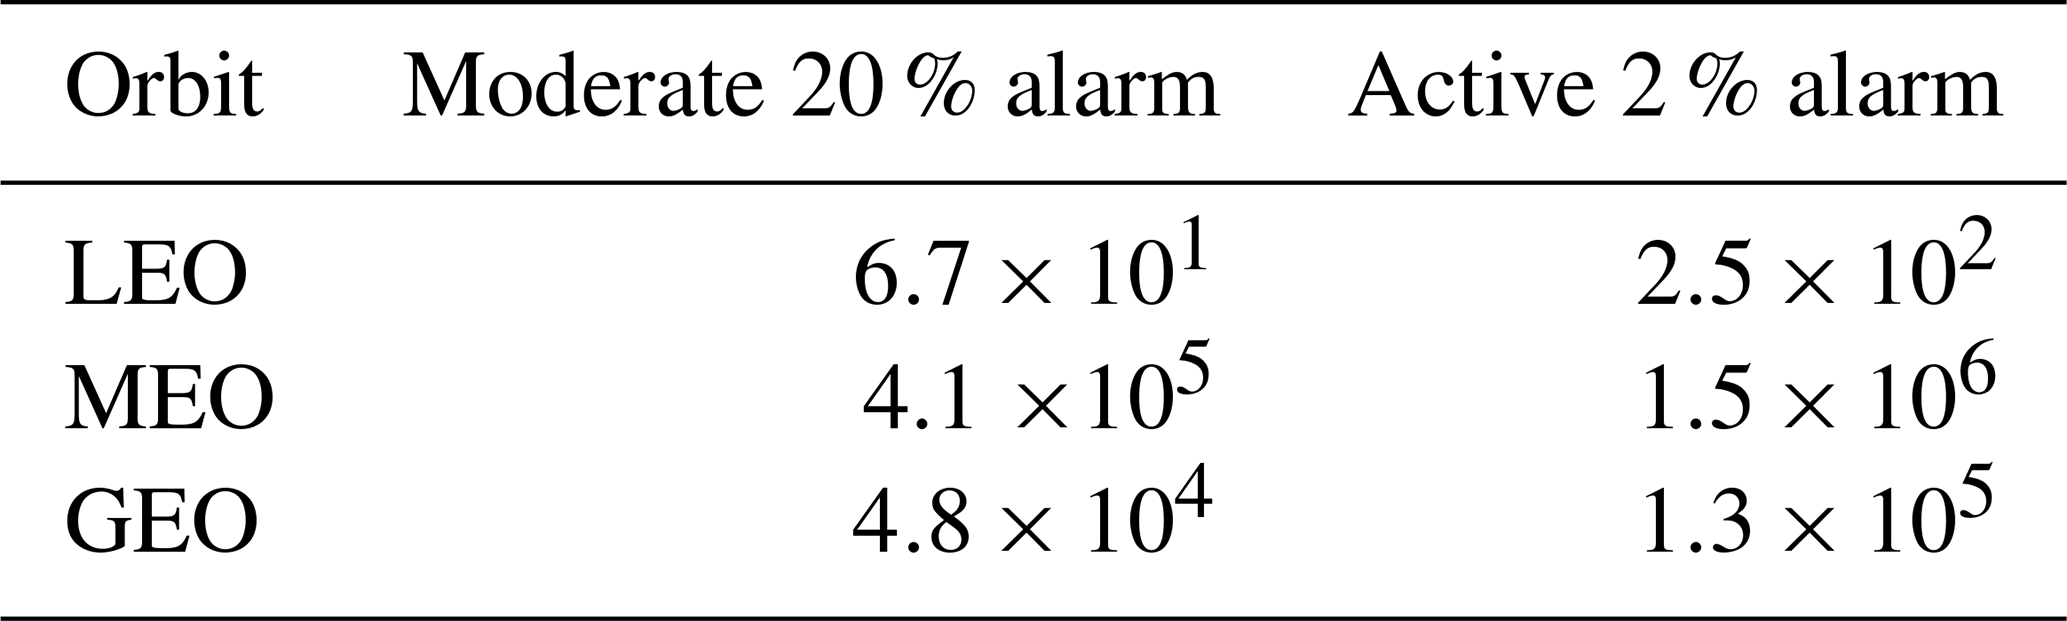
At the same time, the statistical distributions serve to gauge the intensity of the indices in their presumed statistical range and to define the alarm thresholds needed in the warning system and corresponding to the 20 % and 2 % limits. They were constructed for each one of the three studied orbits by gathering historical data of daily averaged electron flux as reported in Table 1.
Table 1Time range of the data used to construct the historical distributions for each orbit.
After cleaning and cross-calibrating the data (see Fig. 3), a statistical investigation was operated on the historical distributions which led to a statistical distribution of daily fluxes from which complementary cumulative distribution functions or tail distributions were derived for each orbit. These are presented in Fig. 4 and Table 2, with the three levels of risk delimited as previously defined. The data cleaning step is indispensable in order to minimize bias sources in the historical distribution. For instance, it was stated that measurements of relativistic electrons in the inner belt are subject to consequent proton contamination (Claudepierre et al., 2017; Pierrard et al., 2021b).
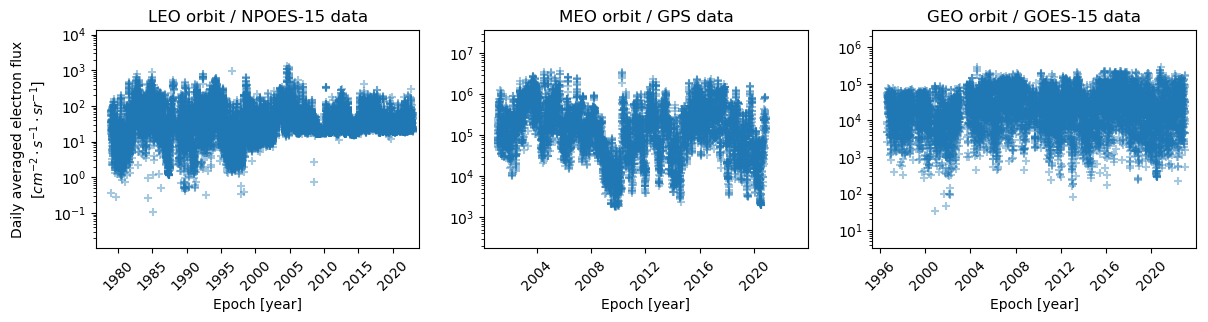
Figure 3Cleaned and cross-calibrated measurement data used for each orbit to construct the statistical distributions. The energies of the integral flux reported in each panel are those stated in Sect. 3.1 (>1.2 MeV for the LEO; >0.8 MeV for the MEO; >0.8 for the GEO).
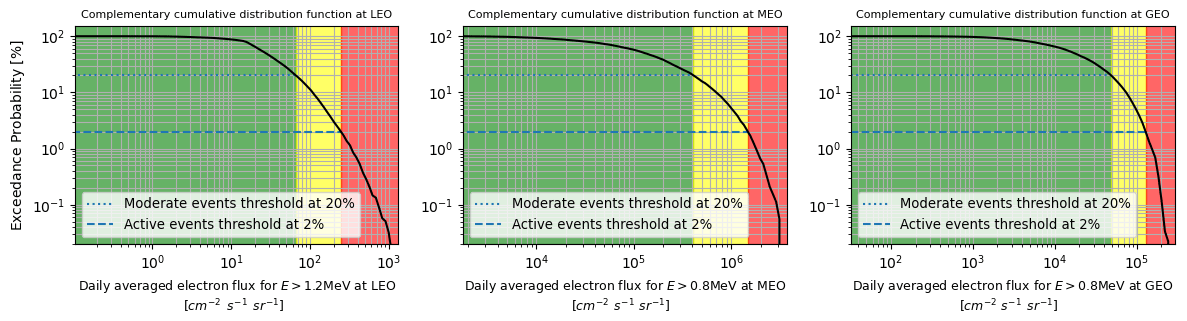
Figure 4Complementary cumulative distribution functions constructed for each orbit and demarcation of the three activity levels, along with the moderate and active alarm thresholds.
Table 2Thresholds flux values for the moderate and active alarms expressed in .
Using an extensive historical distribution is necessary to ensure that the computed statistical distribution is representative of the full range of the electron radiation belts' dynamics. Indeed, it is notorious that solar cycle 24 (2008–2019) was a weak cycle during which few intense events were observed. Studies dedicated to the analysis of extreme events in the electron radiation belts (such as Meredith et al., 2015, and Bernoux and Maget, 2020) show that no extreme events where witnessed during solar cycle 24, whereas multiple ones where observed during solar cycle 23 (1996–2008). Therefore, using a short data set made of measurements from solar cycle 24 alone would probably bias the statistical distribution and more importantly its tail. The “red” threshold would hence be too low, and fluxes above such a threshold could be observed more often than simply 2 % of the time, which would trigger too many alerts. Using data from at least two solar cycles to derive the statistical distribution lowers the risk of biasing our results. In addition, results from Bernoux and Maget (2020, see, e.g., Fig. 14 in their paper) suggest that 20-year-long electron flux data sets starting around 1996 are most probably statistically representative of the distribution of extreme events in the electron radiation belts, which confirms our approach.
To assess the reliability of the SafeSpace safety service segment, we decided to test it over the March 2015 period when the CME-driven St Patrick's Day storm occurred (see Fig. 5). Precisely, the dynamics of the electron radiation belts during this intense and representative event were replicated with the SafeSpace pipeline. To eliminate the uncertainties linked to the heliospheric part of the modelling pipeline, which are discussed in Kieokaew et al. (2023), we generated a synthetic forecast from the OMNI2 hourly data set, by adding a lognormal uncertainty distribution with a standard deviation of 30 % in the different solar wind parameters as well as the Kp index. Salammbô–EnKF assimilated measurements from the Magnetosphere Electron Detector (MAGED) on board the GOES-15 satellite (Hanser, 2011) and the CXD instrument on board the GPS-NS54 satellite (Carver et al., 2018), shown in Fig. 5.
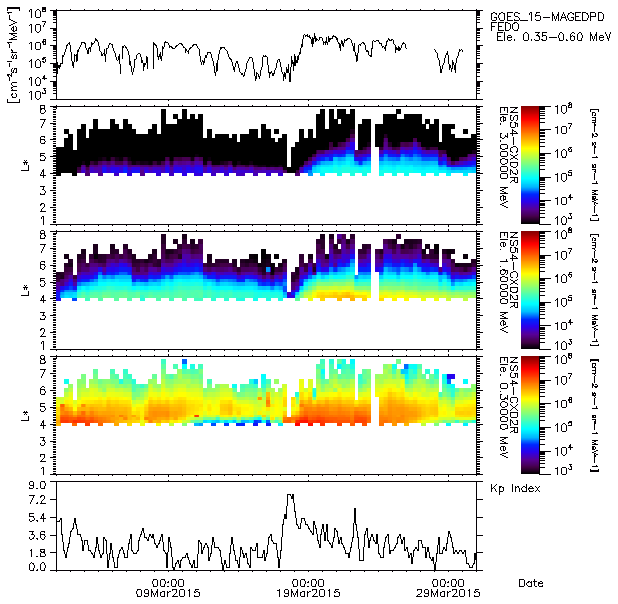
Figure 5Overview of the assimilated data in Salammbô–EnKF during the March 2015 simulations. From top to bottom: GOES-15 MAGED omnidirectional differential flux measurements for electrons from 350 to 600 keV; the GPS-NS54 CXD omnidirectional differential flux measurements for electrons at 3, 1.6 and 300 keV; and the Kp index.
In order to measure the nowcasting and the forecasting capabilities of the SafeSpace pipeline, we conducted two different simulations of the March 2015 period:
-
an ensemble simulation of the whole month with the assimilation of GOES and GPS data during the whole simulation period;
-
an ensemble forecast simulation (no assimilation) of the main phase of the storm (from 17 to 20 March), considering as an initial state the previous simulations's assimilated state on 17 March.
After generating the appropriate indices for each simulation as defined in Sect. 3, we compared them to reference satellite observations of the same indices in the studied time period and taken from
-
the NPOES-15/SEM-2 instrument for the LEO (Evans, 2000; Davis, 2007);
-
the GPS-NS54/CXD detector for the MEO (Carver et al., 2018);
-
the GOES-15/MAGED detector for the GEO (Onsager et al., 1996; Hanser, 2011).
These observation-based indices will be regarded as perfect references that the simulation-based indices seek to replicate and will serve in the performance evaluation of the SafeSpace warning system. Their relevance to perfectly depicting reality will not be treated in this paper.
Figure 6 reports the time evolution of the indices for the nowcast simulation and forecast simulation estimated by the SafeSpace pipeline along with the reference observations of these same indices. On the other hand, Tables 3 and 4 report the warning system performance scores for the nowcast and forecast simulations.
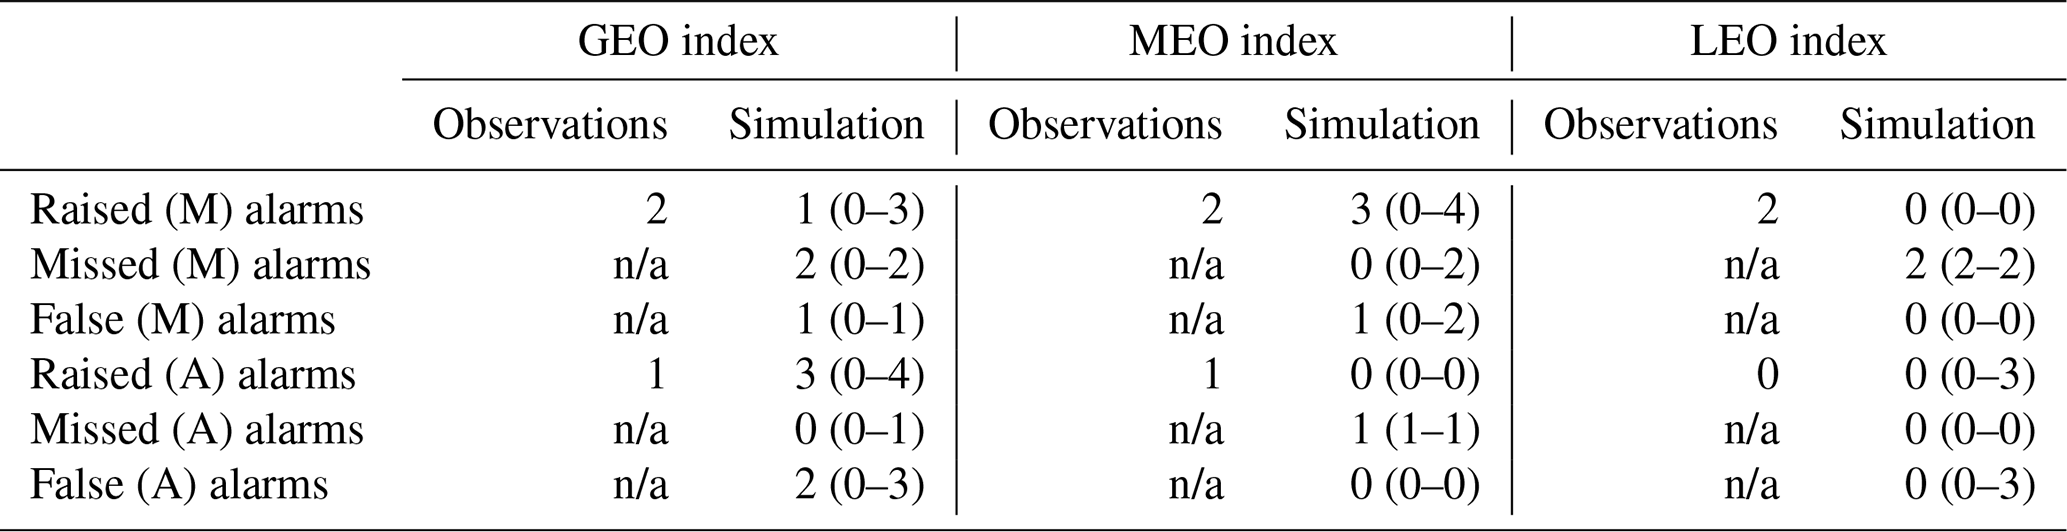
Table 3Assessing the performance of the warning system over the 1-month-long nowcast simulation: counting the raised alarms for moderate (M) and active (A) times by observation-based indices (serving as a reference) and by simulation-based indices, along with the missed and false alarms for the latter. Simulation results are formatted as “median (min–max)” with min and max respectively the minimum and maximum values attained by the 10th–90th percentile range of the ensemble simulation.
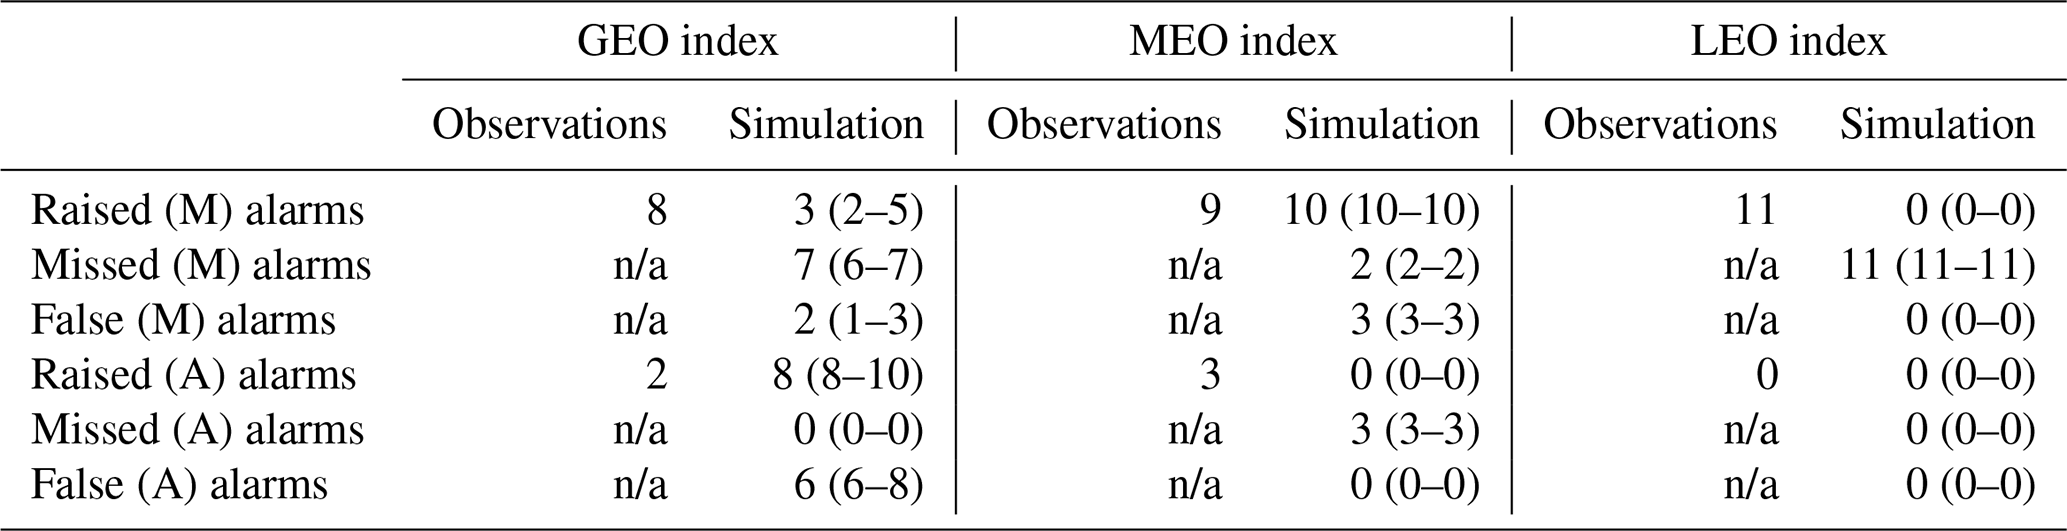
n/a: not applicable
We can attest from Fig. 6 that the nowcast indices perform moderately well with reduced uncertainties most of the time. In the GEO, the SafeSpace nowcast index is very close to the GOES-15 index during the first half of the simulated month. Besides, the latter is often contained in the nowcast index ensemble. From the beginning of the main phase of the storm on 17 March and later, the nowcast index overestimates the GOES-15 index. This is mainly explained by the absence of dropout in the physical representation of the pipeline and the lack of assimilated data related to highly energetic electrons in the GEO.
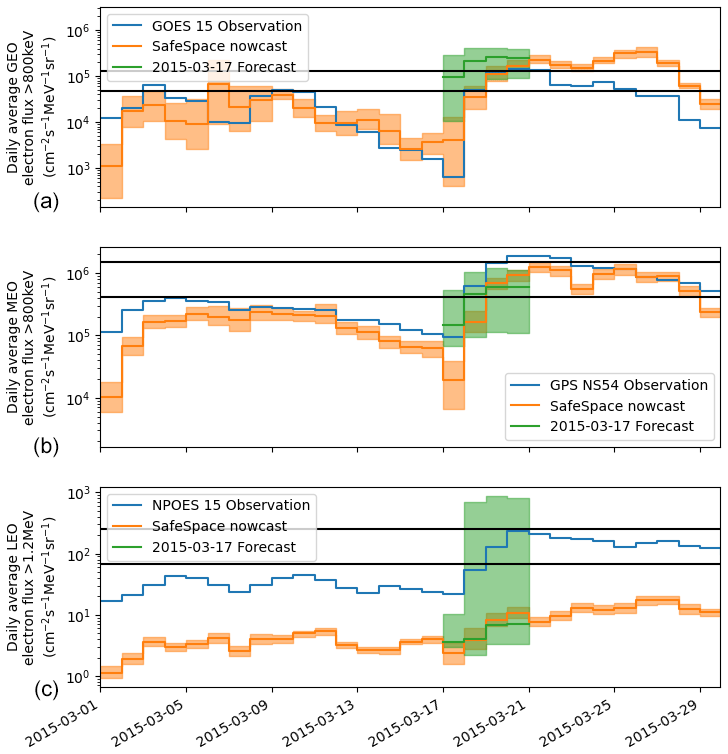
Figure 6Comparison between the indices derived from the SafeSpace nowcast simulation (in orange for the median and light orange for the 10th–90th percentile ensemble range) and from the SafeSpace forecast simulation (in green for the median and light green for the 10th–90th percentile ensemble range), with their associated reference observations (a: GEO; b: MEO; c: LEO). The solid black lines represent, by increasing order, the moderate and active alarm thresholds.
In the MEO, the nowcast index also manages to reconstruct accurately the dynamic of the observed GPS index with a slight underestimation (average factor of 0.66). This is expected due to the presence of adequate assimilated data in the studied orbit. In the LEO, the nowcast performs very poorly. Indeed, the nowcast stays almost 1 order of magnitude below the observed index during the whole simulation. This behaviour is explained by two major factors: first, the limited physical description of the inner-belt dynamics (still an open subject investigated by the community; Ripoll et al., 2020), especially the balance between radial diffusion and pitch angle precipitation; second, the inadequacy of the numerical solver, with the adopted grid refined, to capture the strong gradients observed in the region in the vicinity of the loss cone. One can consider refining the grid to improve the LEO index estimation, but this operation will impose too intensive a computational cost on the daily pipeline.
As regards the forecast results, Fig. 6 shows encouraging median results but with relatively large uncertainties. This is particularly the case for the MEO and GEO, for which the median forecast closely matches the observed and nowcast indices with definitely larger uncertainties than with the nowcast. This is due to the accurate initial condition and physical representation of the pipeline considered by the forecast before the main phase of the storm in March 2015. In the LEO, the forecast ensemble extends over almost 4 orders of magnitudes and due to the dominant grid refinement constraint, the nowcast and forecast median join and stay way below the observed index.
As regards the warning system performances, Table 3 shows that the nowcast simulation offers overall adequate results for the MEO and GEO, related to their associated index results (as presented in Fig. 6). For the GEO index, all the “critical” active time alarms were activated on time. However, seven out of eight moderate time alarms were missed. This is mainly due to the overestimation of the nowcast GEO index observed after 21 March that also led to the over-activation of the active time alarms in that same period. Still, the warning system remains relevant as it activates false active time alarms during a risky period. Hence, the system is conservative and manages, at least, to discriminate between risky (M and A alarms) and non-risky states.
Table 4Assessing the performance of the warning system over the 4 d long forecast simulation: counting of the raised alarms for moderate (M) and active (A) times by observation-based indices (serving as a reference) and by simulation-based indices, along with the missed and false alarms for the latter. Simulation results are formatted as “median (min–max)” with min and max respectively the minimum and maximum values attained by the 10th–90th percentile range of the ensemble simulation.
n/a: not applicable
In the MEO, the system performs better with the moderate time alarm. In fact, only two out of nine moderate alarms were missed and few false positives were raised. However, the system missed all the active time alarms raised by the GPS observations. In the LEO, the warning system is totally overwhelmed and misses all the moderate time alarms due to the substantial underestimation of the LEO index as previously stated. It should be noted from the ensemble's results in Table 3 that the warning system's performance would not change radically if the whole ensemble range was considered due to the low uncertainty reported in the nowcast indices.
The warning system performance in the case of the forecast simulation is adequate and presents a similar missed- and false-alarm distribution as for the nowcast simulation. However, its associated ensemble range is much bigger due to the higher uncertainties reported in the index forecast.
In this article, we introduced indices dedicated to internal charging and tailored to the space industry; these are derived from the SafeSpace physical chain of codes that models the outer electron radiation belt dynamics. We presented the different components of the sun-to-Earth pipeline, with its heliospheric propagation, inner magnetosphere and safety warning system segments. We focused on the latter part by presenting the dedicated safety indices defined for three standard orbits (LEO, MEO, GEO) and constructed using the daily averaged electron fluxes. We also specified the risk levels for moderate and active alarms in the warning system and showed the data sets used to build the statistical distribution for the indices for each orbit. We discussed the importance of a long and representative historical distribution for a reliable and trustworthy warning system. Finally, we tested the new implementation on the representative CME-driven St Patrick's Day storm of 2015. Results show adequate nowcast and forecast of the observed indices by the SafeSpace pipeline in the GEO and MEO but a poor estimation of the index in the LEO. Similarly, the warning system performance seems acceptable for the nowcast and forecast simulations at the respective orbits. However, to adequately assess the full potential of the SafeSpace pipeline in its current form, the warning system capabilities and its potential sensitivity to geomagnetic events (CME-driven events, or SIR-driven events, for example), it is essential to conduct the previous investigation not on only one but on a myriad of pre-selected geomagnetic storms over a long simulated period. Without a doubt, the GEO and MEO index results demonstrate the relevance of the SafeSpace sun-to-Earth pipeline. They also point at the importance of a time-dependent physical description of the outer electron belt, which necessarily requires an accurate description of VLF waves and plasma distributions (Ripoll et al., 2023). As a straightforward improvement to the pipeline, we recommend the integration of dropouts modelling (as done in Herrera et al., 2016), after taking care of the Bz parameter estimation. This modification will surely decrease the intensity of the GEO index especially before geomagnetic storms and reduce the number of false active alarms. With regard to the poor results of the LEO index, one can advocate for the refinement of the grid near the loss cone as an upfront improvement to capture the strong gradients witnessed in that region. However, this operation will introduce an additional computational cost that will degrade the operability of the SafeSpace pipeline and make it obsolete for space weather applications. This is why we strongly recommend the transition to dedicated numerical schemes that would tackle the numerical limitations (like strong gradients) imposed by radiation belt modelling and highly inhomogeneous and anisotropic diffusion problems in general (Dahmen et al., 2020). Finally, a review of the current physical comprehension of the inner-belt dynamics seems necessary in order to improve its modelling.
The SafeSpace safety service website (http://www.safespace-service.eu/, Sandberg et al., 2023) gathers data for the indices computed by the SafeSpace pipeline for the current day (nowcast), the day before and 4 d ahead in time (forecast) in addition to plots of the indices in coloured bar charts, according to their activity state and the location of the indices in their associated cumulative distribution function. The GOES-15/MAGED particle data are produced in real time by the NOAA Space Weather Prediction Center (SWPC) and are distributed by the NOAA National Geophysical Data Center (NGDC) (https://www.ncei.noaa.gov/data/goes-space-environment-monitor/access/full/2015/03/goes15/, Hanser, 2011). We acknowledge the CXD team at Los Alamos National Laboratory for the GPS-NS54/CXD electron fluxes. Data access is provided by the NOAA Solar and Terrestrial Physics Branch (https://www.ngdc.noaa.gov/stp/space-weather/satellite-data/satellite-systems/gps/data/ns54, Carver et al., 2018).
ND drafted and organized the paper with the participation of all co-authors. AB contributed to software developments and the generation of figures. SB and GB revised the paper and contributed to the statistical study along with CK, SD, AN and JOF. AB, GB and SB helped with the result interpretation. CK, SD, AN, IS, CP and IAD contributed to the development of the service website.
At least one of the (co-)authors is a member of the editorial board of Annales Geophysicae. The peer-review process was guided by an independent editor, and the authors also have no other competing interests to declare.
Publisher’s note: Copernicus Publications remains neutral with regard to jurisdictional claims in published maps and institutional affiliations.
This research has been supported by the European Union’s Horizon 2020 research and innovation programme “SafeSpace” under grant no. 870437.
This paper was edited by Christopher Mouikis and reviewed by Yihua Zheng and one anonymous referee.
Aminalragia-Giamini, S., Katsavrias, C., Papadimitriou, C., Daglis, I., Nasi, A., Brunet, A., Bourdarie, S., Dahmen, N., and Balasis, G.: The EMERALD model for the estimation of the radial diffusion coefficients in the outer Van Allen belt, Space Weather, 21, e2022SW003283 https://doi.org/10.1029/2022SW003283,, 2022. a
Benton, E. R. and Benton, E.: Space radiation dosimetry in low-Earth orbit and beyond, Nuclear Instruments and Methods in Physics Research Section B: Beam Interactions with Materials and Atoms, 184, 255–294, 2001. a
Bernoux, G. and Maget, V.: Characterizing Extreme Geomagnetic Storms Using Extreme Value Analysis: A Discussion on the Representativeness of Short Data Sets, Space Weather, 18, e2020SW002450, https://doi.org/10.1029/2020SW002450, 2020. a, b
Bernoux, G., Brunet, A., Buchlin, É., Janvier, M., and Sicard, A.: An operational approach to forecast the Earth’s radiation belts dynamics, J. Space Weather Spac., 11, 60, https://doi.org/10.1051/swsc/2021045, 2021. a
Beutier, T. and Boscher, D.: A three-dimensional analysis of the electron radiation belt by the Salammbô code, J. Geophys. Res.-Space Phys., 100, 14853–14861, 1995. a
Botek, E., Pierrard, V., and Darrouzet, F.: Assessment of the Earth’s cold plasmatrough modeling by using Van Allen Probes/EMFISIS and Arase/PWE electron density data, J. Geophys. Res.-Space Phys., 126, e2021JA029737, https://doi.org/10.1029/2021JA029737, 2021. a
Bothmer, V. and Daglis, I. A.: Space weather: physics and effects, Springer Science & Business Media, ISBN 10 3-540-23907-3, 2007. a
Bourdarie, S. A. and Maget, V. F.: Electron radiation belt data assimilation with an ensemble Kalman filter relying on the Salammbô code, Ann. Geophys., 30, 929–943, https://doi.org/10.5194/angeo-30-929-2012, 2012. a
Bourdarie, S. and Xapsos, M.: The near-earth space radiation environment, IEEE Trans. Nucl. Sci., 55, 1810–1832, 2008. a, b
Brunet, A., Dahmen, N., Katsavrias, C., Santolík, O., Bernoux, G., Pierrard, V., Botek, E., Darrouzet, F., Nasi, A., Aminalragia-Giamini, S., Papadimitriou, C., Bourdarie, S., and Daglis, I. A.: Improving the electron radiation belt nowcast and forecast using the SafeSpace data assimilation modelling pipeline, Space Weather, accepted, 2023. a, b
Caron, P., Inguimbert, C., Artola, L., Chatry, N., Sukhaseum, N., Ecoffet, R., and Bezerra, F.: Physical mechanisms inducing electron single-event upset, IEEE Trans. Nucl. Sci., 65, 1759–1767, 2018. a
Carver, M. R., Sullivan, J. P., Morley, S. K., and Rodriguez, J. V.: Cross calibration of the GPS constellation CXD proton data with GOES EPS, Space Weather, 16, 273–288, 2018 (data available at: https://www.ngdc.noaa.gov/stp/space-weather/satellite-data/satellite-systems/gps/data/ns54, last access: 2 August 2023). a, b, c
Chakraborty, S. and Morley, S. K.: Probabilistic prediction of geomagnetic storms and the Kp index, J. Space Weather Spac., 10, 36, https://doi.org/10.1051/swsc/2020037, 2020. a
Claudepierre, S. G., O'Brien, T. P., Fennell, J., Blake, J., Clemmons, J., Looper, M., Mazur, J., Roeder, J., Turner, D. L., Reeves, G. D., and Spence, H. E.: The hidden dynamics of relativistic electrons (0.7–1.5 MeV) in the inner zone and slot region, J. Geophys. Res.-Space Phys., 122, 3127–3144, 2017. a
Daglis, I. A.: Advanced Prediction of the Outer Van Allen Belt Dynamics and a Prototype Service: the H2020 SafeSpace project, Tech. rep., Copernicus Meetings, 2022. a, b
Dahmen, N., Rogier, F., and Maget, V.: On the modelling of highly anisotropic diffusion for electron radiation belt dynamic codes, Comput. Phys. Commun., 254, 107342, https://doi.org/10.1016/j.cpc.2020.107342, 2020. a
Dahmen, N., Sicard, A., Brunet, A., Santolik, O., Pierrard, V., Botek, E., Darrouzet, F., and Katsavrias, C.: FARWEST: Efficient Computation of Wave-Particle Interactions for a Dynamic Description of the Electron Radiation Belt Diffusion, J. Geophys. Res.-Space Phys., 127, e2022JA030518, https://doi.org/10.1029/2022JA030518, 2022. a
Davis, G. K.: History of the NOAA satellite program, J. Appl. Remote Sens., 1, 012504, https://doi.org/10.1117/1.2642347, 2007. a
Dever, J., Banks, B., de Groh, K., and Miller, S.: Degradation of spacecraft materials, in: Handbook of environmental degradation of materials, Elsevier, pp. 465–501, https://doi.org/10.1016/B978-081551500-5.50025-2, 2005. a
Devezas, T., de Melo, F. C. L., Gregori, M. L., Salgado, M. C. V., Ribeiro, J. R., and Devezas, C. B.: The struggle for space: past and future of the space race, Technol. Forecast. Soc., 79, 963–985, 2012. a
Doornbos, E. and Klinkrad, H.: Modelling of space weather effects on satellite drag, Adv. Space Res., 37, 1229–1239, 2006. a
Durante, M.: Radiation protection in space, La Rivista del Nuovo Cimento, 25, 1–70, 2002. a
Durante, M. and Cucinotta, F. A.: Physical basis of radiation protection in space travel, Rev. Mod. Phys., 83, 1245, https://doi.org/10.1103/RevModPhys.83.1245, 2011. a
Evans, D. S.: Polar orbiting environmental satellite space environment monitor-2: instrument description and archive data, NOAA technical memorandum OAR SEC, 93, https://repository.library.noaa.gov/view/noaa/19636/noaa_19636_DS1.pdf (last access: 2 August 2023), 2000. a
Evensen, G.: The ensemble Kalman filter: Theoretical formulation and practical implementation, Ocean Dynam., 53, 343–367, 2003. a
Fok, M.-C.: Current status of inner magnetosphere and radiation belt modeling, Dayside Magnetosphere Interactions, Chap. 13, 231–242, ISBN 9781119509592, 2020. a
Garrett, H. B. and Whittlesey, A. C.: Spacecraft charging, an update, IEEE T. Plasma Sci., 28, 2017–2028, 2000. a
George, K. W.: The economic impacts of the commercial space industry, Space Policy, 47, 181–186, 2019. a
Gruet, M. A., Chandorkar, M., Sicard, A., and Camporeale, E.: Multiple-hour-ahead forecast of the Dst index using a combination of long short-term memory neural network and Gaussian process, Space Weather, 16, 1882–1896, 2018. a
Hanser, F.: EPS/HEPAD calibration and data handbook (Tech. Rep. GOESN-ENG-048D), Carlisle, MA: Assurance Technology Corporation, 2011 (data available at: https://www.ncei.noaa.gov/data/goes-space-environment-monitor/access/full/2015/03/goes15/, last access: 2 August 2023). a, b, c
Herrera, D., Maget, V., and Sicard-Piet, A.: Characterizing magnetopause shadowing effects in the outer electron radiation belt during geomagnetic storms, J. Geophys. Res.-Space Phys., 121, 9517–9530, 2016. a
Hochreiter, S. and Schmidhuber, J.: Long short-term memory, Neural Computation, 9, 1735–1780, 1997. a
Katsavrias, C., Aminalragia-Giamini, S., Papadimitriou, C., Sandberg, I., Jiggens, P., Daglis, I. A., and Evans, H.: On the interplanetary parameter schemes which drive the variability of the source/seed electron population at GEO, J. Geophys. Res.-Space Phys., 126, e2020JA028939, https://doi.org/10.1029/2020JA028939, 2021. a
Kieokaew, R., Pinto, R. F., Lavraud, B., Brunet, A., Bernoux, G., Samara, E., Poedts, S., Génot, V., Rouillard, A., Bourdarie, S., Grison, B., Souček, J., and Daglis, I.: Modeling the propagation of solar disturbances to Earth for the EU H2020 SafeSpace project, Authorea Preprints [preprint], 2022. a
Kieokaew, R., Pinto, R., Samara, E., Tao, C., Indurain, M., Lavraud, B., Brunet, A., Génot, V., Rouillard, A., André, N., Bourdarie, S., Katsavrias, C., Darrouzet, F., Grison, B., and Daglis, I.: Physics-based model of solar wind stream interaction regions: Interfacing between Multi-VP and 1D MHD for operational forecasting at L1, arXiv [preprint], https://doi.org/10.48550/arXiv.2303.09221, 2023. a
Kodheli, O., Lagunas, E., Maturo, N., Sharma, S. K., Shankar, B., Montoya, J. F. M., Duncan, J. C. M., Spano, D., Chatzinotas, S., Kisseleff, S., Querol, J., Lei, L., Vu, T. X., and Goussetis, G.: Satellite communications in the new space era: A survey and future challenges, IEEE Communications Surveys & Tutorials, 23, 70–109, 2020. a
Koons, H., Mazur, J., Selesnick, R., Blake, J., and Fennell, J.: The impact of the space environment on space systems, Tech. rep., AEROSPACE CORP EL SEGUNDO CA EL SEGUNDO TECHNICAL OPERATIONS, 1999. a
Lyon, J. G.: The solar wind-magnetosphere-ionosphere system, Science, 288, 1987–1991, 2000. a
Mann, I., Di Pippo, S., Opgenoorth, H. J., Kuznetsova, M., and Kendall, D.: International collaboration within the United Nations Committee on the Peaceful Uses of Outer Space: Framework for international space weather services (2018–2030), Space Weather, 16, 428–433, 2018. a
Matzka, J., Stolle, C., Yamazaki, Y., Bronkalla, O., and Morschhauser, A.: The Geomagnetic Kp Index and Derived Indices of Geomagnetic Activity, Space Weather, 19, e2020SW002641, https://doi.org/10.1029/2020SW002641, 2021. a
McCormack, P. D.: Radiation hazards in low earth orbit, polar orbit, geosynchronous orbit, and deep space, in: Terrestrial Space Radiation and Its Biological Effects, Springer, pp. 71–96, https://doi.org/10.1007/978-1-4613-1567-4_6, 1988. a
Meredith, N. P., Horne, R. B., Isles, J. D., and Rodriguez, J. V.: Extreme relativistic electron fluxes at geosynchronous orbit: Analysis of GOES E>2 MeV electrons, Space Weather, 13, 170–184, https://doi.org/10.1002/2014SW001143, 2015. a
Moldwin, M.: An introduction to space weather, Cambridge University Press, https://doi.org/10.1017/9781108866538, 2022. a
Mursula, K., Usoskin, I. G., and Maris, G.: Introduction to space climate, Adv. Space Res., 40, 885–887, 2007. a
Onsager, T., Grubb, R., Kunches, J., Matheson, L., Speich, D., Zwickl, R. W., and Sauer, H.: Operational uses of the GOES energetic particle detectors, in: GOES-8 and Beyond, vol. 2812, pp. 281–290, SPIE, https://doi.org/10.1117/12.254075, 1996. a, b
Petersen, E.: Single event effects in aerospace, John Wiley & Sons, 2011. a
Pierrard, V., Botek, E., and Darrouzet, F.: Improving predictions of the 3D dynamic model of the plasmasphere, Frontiers in Astronomy and Space Sciences, 8, 681401, https://doi.org/10.3389/fspas.2021.681401, 2021a. a
Pierrard, V., Ripoll, J.-F., Cunningham, G., Botek, E., Santolik, O., Thaller, S., Kurth, W. S., and Cosmides, M.: Observations and simulations of dropout events and flux decays in October 2013: Comparing MEO equatorial with LEO polar orbit, J. Geophys. Res.-Space Phys., 126, e2020JA028850, https://doi.org/10.1029/2020JA028850, 2021b. a
Richardson, I. and Cane, H.: Geoeffectiveness (Dst and Kp) of interplanetary coronal mass ejections during 1995–2009 and implications for storm forecasting, Space Weather, 9, https://doi.org/10.1029/2011SW000670, 2011. a
Ripoll, J.-F., Claudepierre, S., Ukhorskiy, A., Colpitts, C., Li, X., Fennell, J., and Crabtree, C.: Particle dynamics in the Earth's radiation belts: Review of current research and open questions, J. Geophys. Res.-Space Phys., 125, e2019JA026735, https://doi.org/10.1029/2019JA026735, 2020. a, b
Ripoll, J.-F., Pierrard, V., Cunningham, G., Chu, X., Sorathia, K., Hartley, D., Thaller, S. A., Merkin, V., Delzanno, G. L., De Pascuale, S., and Ukhorskiy, A. Y.: Modeling of the cold electron plasma density for radiation belt physics, Front. Astron. Space Sci., 10, 1096595, https://doi.org/10.3389/fspas.2023.1096595, 2023. a
Rockville, M.: Customer Needs and Requirements for Space Weather Products and Services, report for Abt Associates Inc., Rockville, MD, NOAA Office for Coastal Management, 2019. a
Roederer, J. G.: Dynamics of geomagnetically trapped radiation, vol. 2, Springer Science & Business Media, https://doi.org/10.1007/978-3-642-49300-3, 2012. a
Roston, R.: The space radiation environment at synchronous altitude and its effects on communication satellites, in: 3rd Communications Satellite Systems Conference, 481 pp., https://doi.org/10.2514/6.1970-481, 1970. a
Russell, C. and Thorne, R.: STRUCTURE OF THE INNER MAGNETOSPHERE, Tech. rep., Univ. of California, Los Angeles, NSA-24-032754, 1970. a
Samara, E., Pinto, R. F., Magdalenić, J., Wijsen, N., Jerčić, V., Scolini, C., Jebaraj, I. C., Rodriguez, L., and Poedts, S.: Implementing the MULTI-VP coronal model in EUHFORIA: Test case results and comparisons with the WSA coronal model, Astronomy & Astrophysics, 648, A35, https://doi.org/10.1051/0004-6361/202039325, 2021. a
Samara, E., Laperre, B., Kieokaew, R., Temmer, M., Verbeke, C., Rodriguez, L., Magdalenić, J., and Poedts, S.: Dynamic Time Warping as a Means of Assessing Solar Wind Time Series, Astrophys. J., 927, 187, https://doi.org/10.3847/1538-4357/ac4af6, 2022. a
Sandberg, I., Aminalragia-Giamini, S., Provatas, G., Hands, A., Ryden, K., Heynderickx, D., Tsigkanos, A., Papadimitriou, C., Nagatsuma, T., Evans, H., and Rodgers, D.: Data exploitation of new Galileo environmental monitoring units, IEEE T. Nucl. Sci., 66, 1761–1769, 2019. a
Sandberg, I., Papadimitriou, C., Katsavrias, C., Doulfis, S., Katsavrias, C., Nasi, A., and Daglis, I. A.: Space Safety Service page of the Horizon 2020 SafeSpace project, SafeSpace, http://www.safespace-service.eu/, last access: 31 July 2023. a
Santolík, O., Miyoshi, Y., Kolmašová, I., Matsuda, S., Hospodarsky, G., Hartley, D., Kasahara, Y., Kojima, H., Matsuoka, A., Shinohara, I., Kurth, W. S., and Kletzing, C. A.: Inter-Calibrated Measurements of Intense Whistlers by Arase and Van Allen Probes, J. Geophys. Res.-Space Phys., 126, e2021JA029700, https://doi.org/10.1029/2021JA029700, 2021. a
Satellite Industry Association: Satellite Industry Association website, https://sia.org/, last access: 6 December 2022. a
Sicard, A., Boscher, D., Bourdarie, S., Lazaro, D., Standarovski, D., and Ecoffet, R.: GREEN: the new Global Radiation Earth ENvironment model (beta version), Ann. Geophys., 36, 953–967, https://doi.org/10.5194/angeo-36-953-2018, 2018. a
Tsyganenko, N. A.: Data-based modelling of the Earth's dynamic magnetosphere: a review, Ann. Geophys., 31, 1745–1772, https://doi.org/10.5194/angeo-31-1745-2013, 2013. a
Vette, J. I.: The AE-8 trapped electron model environment, vol. 91, National Space Science Data Center (NSSDC), World Data Center A for Rockets, 1991. a
Zheng, Y., Ganushkina, N. Y., Jiggens, P., Jun, I., Meier, M., Minow, J. I., O'Brien, T. P., Pitchford, D., Shprits, Y., Tobiska, W. K., Xapsos MA, Guild, T. B., Mazur, J. E., and Kuznetsova, M. M.: Space radiation and plasma effects on satellites and aviation: Quantities and metrics for tracking performance of space weather environment models, Space Weather, 17, 1384–1403, 2019. a