the Creative Commons Attribution 4.0 License.
the Creative Commons Attribution 4.0 License.
 | 17 Apr 2023
Effects of the super-powerful tropospheric western Pacific phenomenon of September–October 2018 on the ionosphere over China: results from oblique sounding
Leonid F. Chernogor
Kostiantyn P. Garmash
Qiang Guo
Victor T. Rozumenko
Doppler measurements at oblique propagation paths from the city of Harbin, the People's Republic of China (PRC), to 10 high-frequency (HF) radio broadcast stations in the PRC, Japan, Mongolia, and the Republic of Korea captured the response in the ionosphere to the activity of the super typhoon, Typhoon Kong-rey, from 30 September to 6 October 2018. The Harbin Engineering University coherent software-defined radio system generates the database containing the complex amplitudes of the radio signals that have been acquired along 14 propagation paths since 2018. The complex amplitudes are used for calculating the temporal dependences of the Doppler spectra and signal amplitudes, and the Doppler spectra are used to plot the Doppler shift as a function of time, fD(t), for all rays. The scientific objectives of this study are to reveal the possible perturbations caused by the activity of Typhoon Kong-rey and to estimate the magnitudes of wave parameters of the ionospheric plasma and radio signals. The amplitudes, fDa, of the Doppler shift variations were observed to noticeably increase (factor of ∼2–3) on 1–2 and 5–6 October 2018, while the 20–120 min periods, T, of the Doppler shift variations suggest that the wavelike disturbances in the ionosphere are caused by atmospheric gravity waves. The periods and amplitudes of quasi-sinusoidal variations in the Doppler shift, which have been determined for all propagation paths, may be used to estimate the amplitudes, δNa, of quasi-sinusoidal variations in the electron density. Thus, T≈20 min and fDa≈0.1 Hz yield δNa≈0.4 %, whereas T≈30 min and fDa≈0.2 Hz give δNa≈1.2 %. If T≈60 min and fDa≈0.5 Hz, then δNa≈6 %. The periods T are found to change within the 15–120 min limits, and the Doppler shift amplitudes, fDa, show variability within the 0.05–0.4 Hz limits.
- Article
(18003 KB) - Full-text XML
- BibTeX
- EndNote


A violent tropical cyclone arising in the northwestern Pacific Ocean is termed a typhoon. In record-breaking typhoons, the atmospheric pressure drops down to 870 hPa, while the pressure deficit reaches 140 hPa, and the wind speed attains a maximum of 85 m s−1, with 94 m s−1 maximum gusts.
Prasad et al. (1975) were the first to ascertain the influence of meteorological processes, namely, tropical cyclones on the ionosphere. Hung and Kuo (1978, 1985) described observations of traveling ionospheric disturbances (TIDs) as the manifestations of the atmospheric gravity waves (AGWs) generated by hurricanes. Krishmam Raju et al. (1981) have studied the influence of infrasound generated by thunderstorms. Observations of AGWs from meteorological origin have been reported elsewhere (Boška and Šauli, 2001; Šindelářova et al., 2009; Chernigovskaya et al., 2015).
The coupling between typhoons and the ionosphere and overlying magnetosphere occurs via a range of mechanisms. Observational studies conducted in recent years have shown that typhoons significantly influence the upper atmosphere, including the ionosphere. Recently, theoretical studies on the coupling between the lower and upper atmosphere, which occurs through AGWs, have been published as well (Hickey et al., 2001, 2011; Kuester et al., 2008; Gavrilov and Kshevetskii, 2015; Karpov and Kshevetskii, 2017). Such a mechanism for coupling is naturally called the acoustic–gravity mechanism (Chernogor, 2006, 2012).
Typhoons are accompanied by water vapor condensation, the development of powerful convective lift, and the appearance of severe thunderstorms (Mikhailova et al., 2002). Lightning discharges act to generate electromagnetic emissions that may be capable of heating electrons and perturbing the electron density in the ionospheric D region (Nickolaenko and Hayakawa, 1995; Chernogor, 2006, 2012). The fluxes of electromagnetic emissions that are large enough lead to pitch angle scattering of energetic electrons in the radiation belts via wave–particle interaction, and, consequently, result in electron precipitation into the lower ionosphere (Inan et al., 2007; Voss et al., 1984, 1998; Bortnik et al., 2006). As a result, secondary perturbations in the plasma conductivity (∼100–150 km altitude) and in the geomagnetic and electric fields capable of affecting processes in the magnetosphere can arise. Such a mechanism should be considered an electromagnetic mechanism (Chernogor, 2006, 2012).
An increase in the quasi-stationary electric field may be of different origin (Isaev et al., 2002, 2010; Sorokin et al., 2005; Pulinets et al., 2014). Localized A m−2 electric currents arise within thunderstorm clouds at 10–15 km altitude, which disturb the global electric circuit and increase quasi-sinusoidal electric fields that are mapped to the ionosphere and magnetosphere by 1–2 orders of magnitude and affect the motion of high-energy electrons trapped in the radiation belts. Under certain conditions, the precipitation of these electrons into the ionosphere may occur, and a repeated coupling between the subsystems in the ocean–atmosphere–ionosphere–magnetosphere (OAIM) system happens (Chernogor, 2006, 2012). This mechanism for coupling may be termed the electric mechanism (Chernogor, 2006, 2012). Thus, powerful typhoons are capable of governing the coupling between the subsystems in the OAIM system.
A lot of studies deal with the acoustic–gravity mechanism, and therefore this mechanism has been studied better than the others. The major role AGWs play in coupling different atmospheric regions under the influence of typhoons and hurricanes on the upper atmosphere is discussed by Okuzawa et al. (1986), Xiao et al. (2007), Vanina–Dart et al. (2007), Afraimovich et al. (2008), Polyakova and Perevalova (2011, 2013), Zakharov and Kunitsyn (2012), Suzuki et al. (2013), Chou et al. (2017), Li et al. (2017, 2018), Chum et al. (2018), and Zakharov et al. (2019, 2022). These researchers invoked various measurement techniques for probing the ionosphere: GPS technology, ionosondes, rocket techniques, and the high-frequency (HF) Doppler technique.
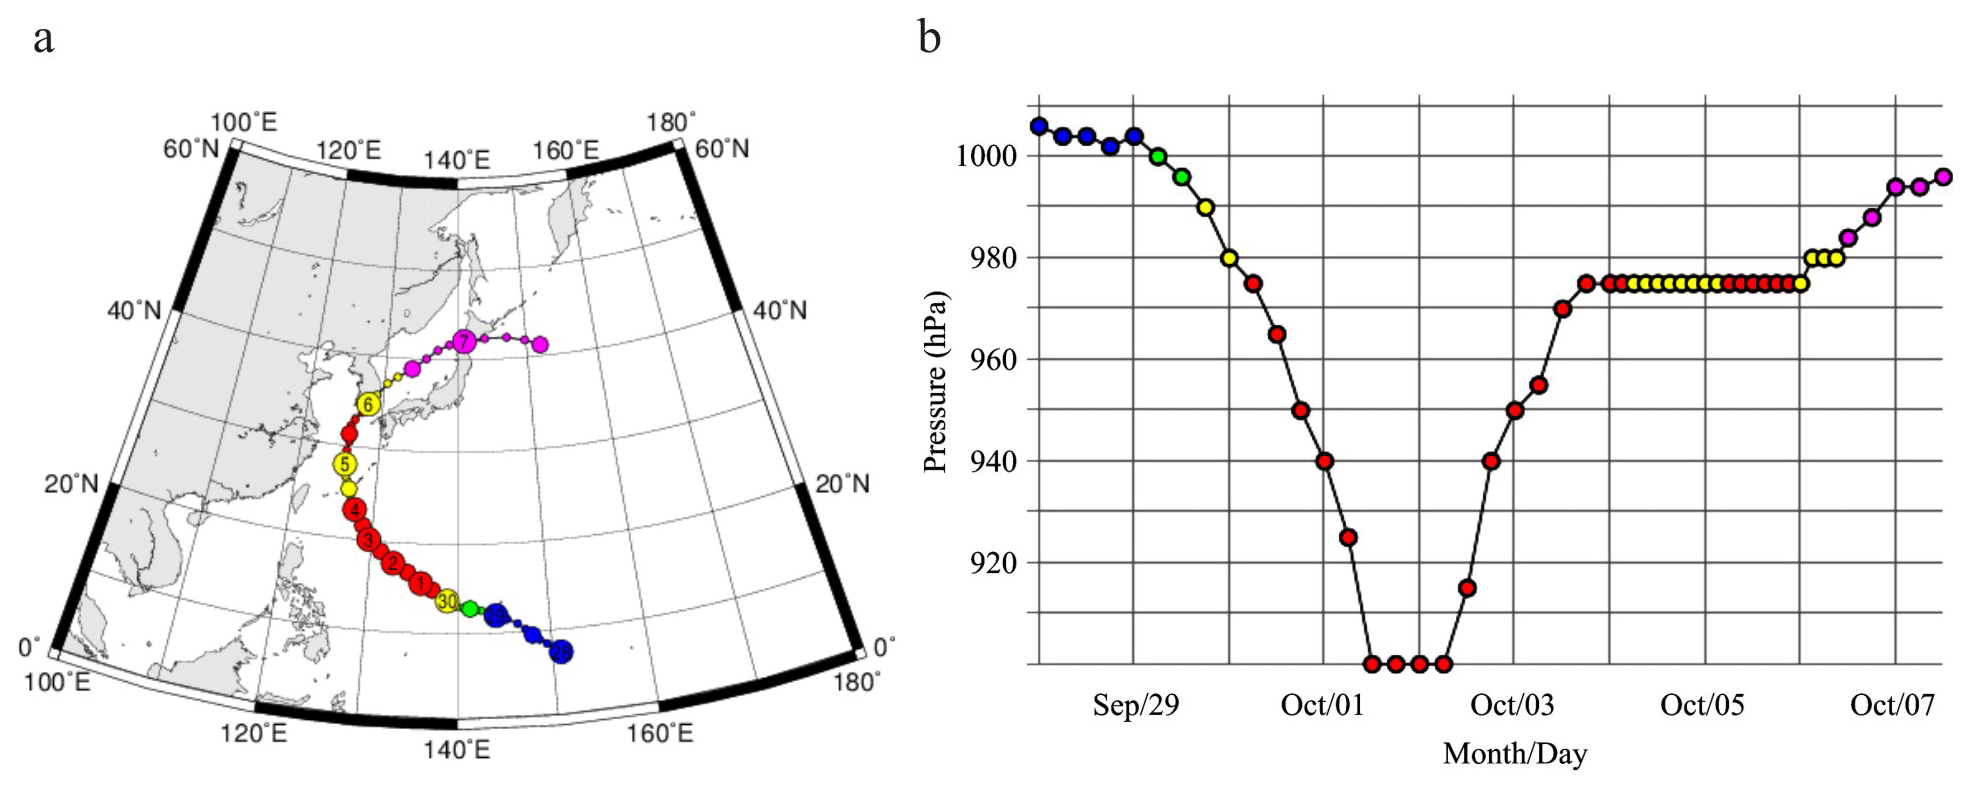
Figure 1The (a) trajectory and (b) pressure of Typhoon Kong-rey (courtesy of Asanobu Kitamoto, Digital Typhoon, National Institute of Informatics, Japan).
The manifestations of the ionospheric response to the super typhoons Hagibis, Lingling, Faxai, and Lekima in radio-wave characteristics in the 5–10 MHz band have been studied by Chernogor et al. (2021, 2022) and Zheng et al., (2022). The variations in the main features of radio waves have been determined, and aperiodic and quasi-sinusoidal perturbations in the electron density have been ascertained.
The effect of sudden stratospheric warming events, variations in space weather, solar activity, and AGWs on the coupling between the subsystems in the atmosphere–ionosphere system has been analyzed in the review by Yiğit et al. (2016), whereas 20 years earlier, the review by Hocke and Schlegel (1996) could only point to the AGW–TID relationship. Since then, data have been compiled for some parameters of medium-scale traveling ionospheric disturbances (MSTIDs), one of the mechanisms for affecting the ionosphere by typhoons. The parameters of interest to typhoon–ionosphere coupling studies include the propagation direction. Of particular interest to the current study, which is conducted in the area roughly to the west of Japan, are data collected in Japan. Using airglow images, a clear preference for southwestward propagation has been shown by Kubota et al. (2000) and Shiokawa et al. (2003), while Fukushima et al. (2012) made observations over a 7-year period in Indonesia that estimated the propagation direction to be within ±30∘ from the source directions of MSTIDs in 81 % of the MSTID events. Otsuka et al. (2008) investigated a relationship between nighttime MSTIDs and the sporadic E layer, another phenomenon of interest to typhoon–ionosphere coupling. Observations made in the western hemisphere are in agreement with those made over the Pacific Ocean (Paulino et al., 2016; Frissell et al., 2014; Paulino et al., 2018). The latter study by Paulino et al. (2018) is noteworthy because it showed that the observed anisotropy in the propagation direction can be fully explained by thermospheric winds.
The results of the latest observations are presented in papers by Kong et al. (2017), Li et al. (2018), Zhao et al. (2018), Song et al. (2019), Wen and Jin (2020), Chen et al. (2020), Ke et al. (2020), Zhao et al. (2020), Das et al. (2021), Freeshah et al. (2021), Chernogor et al. (2021, 2022), and Zakharov et al. (2019, 2022). They show that the influence of typhoons on the ionosphere might be expected to significantly depend on typhoon parameters, local time, season, solar cycle changes, and the state of atmospheric and space weather. To date, there remains insufficient knowledge about this influence, and therefore the study of the ionospheric response to any new typhoon is of interest. In this paper, a super typhoon, Typhoon Kong-rey, the most powerful typhoon worldwide in 2018, has been chosen to analyze the ionospheric response to the typhoon activity.
The scientific objectives of this study are to determine the response of the ionosphere to Typhoon Kong-rey as it approaches by making use of variations in the Doppler spectra, Doppler shift, and HF signal amplitudes recorded at oblique propagation paths, as well as to estimate the parameters of the ionospheric perturbations. An estimate of the joint influence of the typhoon and the dusk terminator is also a phenomenon of interest. The observations were made using the Harbin Engineering University, the People's Republic of China (PRC), multifrequency multiple-path coherent software-defined radio system for probing the ionosphere at oblique incidence. The data sets discussed in this paper may be obtained from the website at https://doi.org/10.7910/DVN/VHY0L2 (Garmash, 2022), and the Software for Passive 14-Channel Doppler radar may be obtained from https://doi.org/10.7910/DVN/MTGAVH (Garmash, 2021).
Table 1 presents basic information on Typhoon Kong-rey, a Category 5 tropical storm; part of the information was retrieved from http://agora.ex.nii.ac.jp/digital-typhoon/summary/wnp/s/201825.html.en (last access: 17 March 2023). It shows that the typhoon originated on 29 September 2018 and ceased to exist on 6 October 2018. A noticeable decrease in pressure took place on 30 September 2018, when the pressure reached a minimum value of 900 hPa, while the pressure deficit attained a maximum of 105 hPa (see also Fig. 1). The wind speed attained a maximum of 215 km h−1 or 60 m s−1, with 77 m s−1 maximum gusts. The largest radius of the storm wind was 260 km, and the largest radius of the gale wind was 750 km. The length of the typhoon path is estimated to be 4107 km, with an average speed of 23.6 km h−1 or 6.6 m s−1. The dynamic wind pressure is estimated to attain 2.25 kPa, with a maximum gust pressure of 3.8 kPa. The kinetic energy of the rotating air was estimated to be close to 1.65×10¹⁸ J, while the mean power was estimated to attain 1.7×10¹³ W. On 1 and 2 October 2018, the super-typhoon energy was a maximum, and on 2 October 2018 the typhoon moved to the system probing the ionosphere closer by ∼600 km (Fig. 1). On 5 October 2018, the typhoon was 250 km off the shores of the PRC when the pressure deficit was observed to be ∼30 hPa.
Table 1Basic parameters of Typhoon Kong-rey (courtesy of Asanobu Kitamoto, Digital Typhoon, National Institute of Informatics, Japan).
A comprehensive analysis of space weather is required in order to ascertain the ionospheric response to the super-typhoon activity.
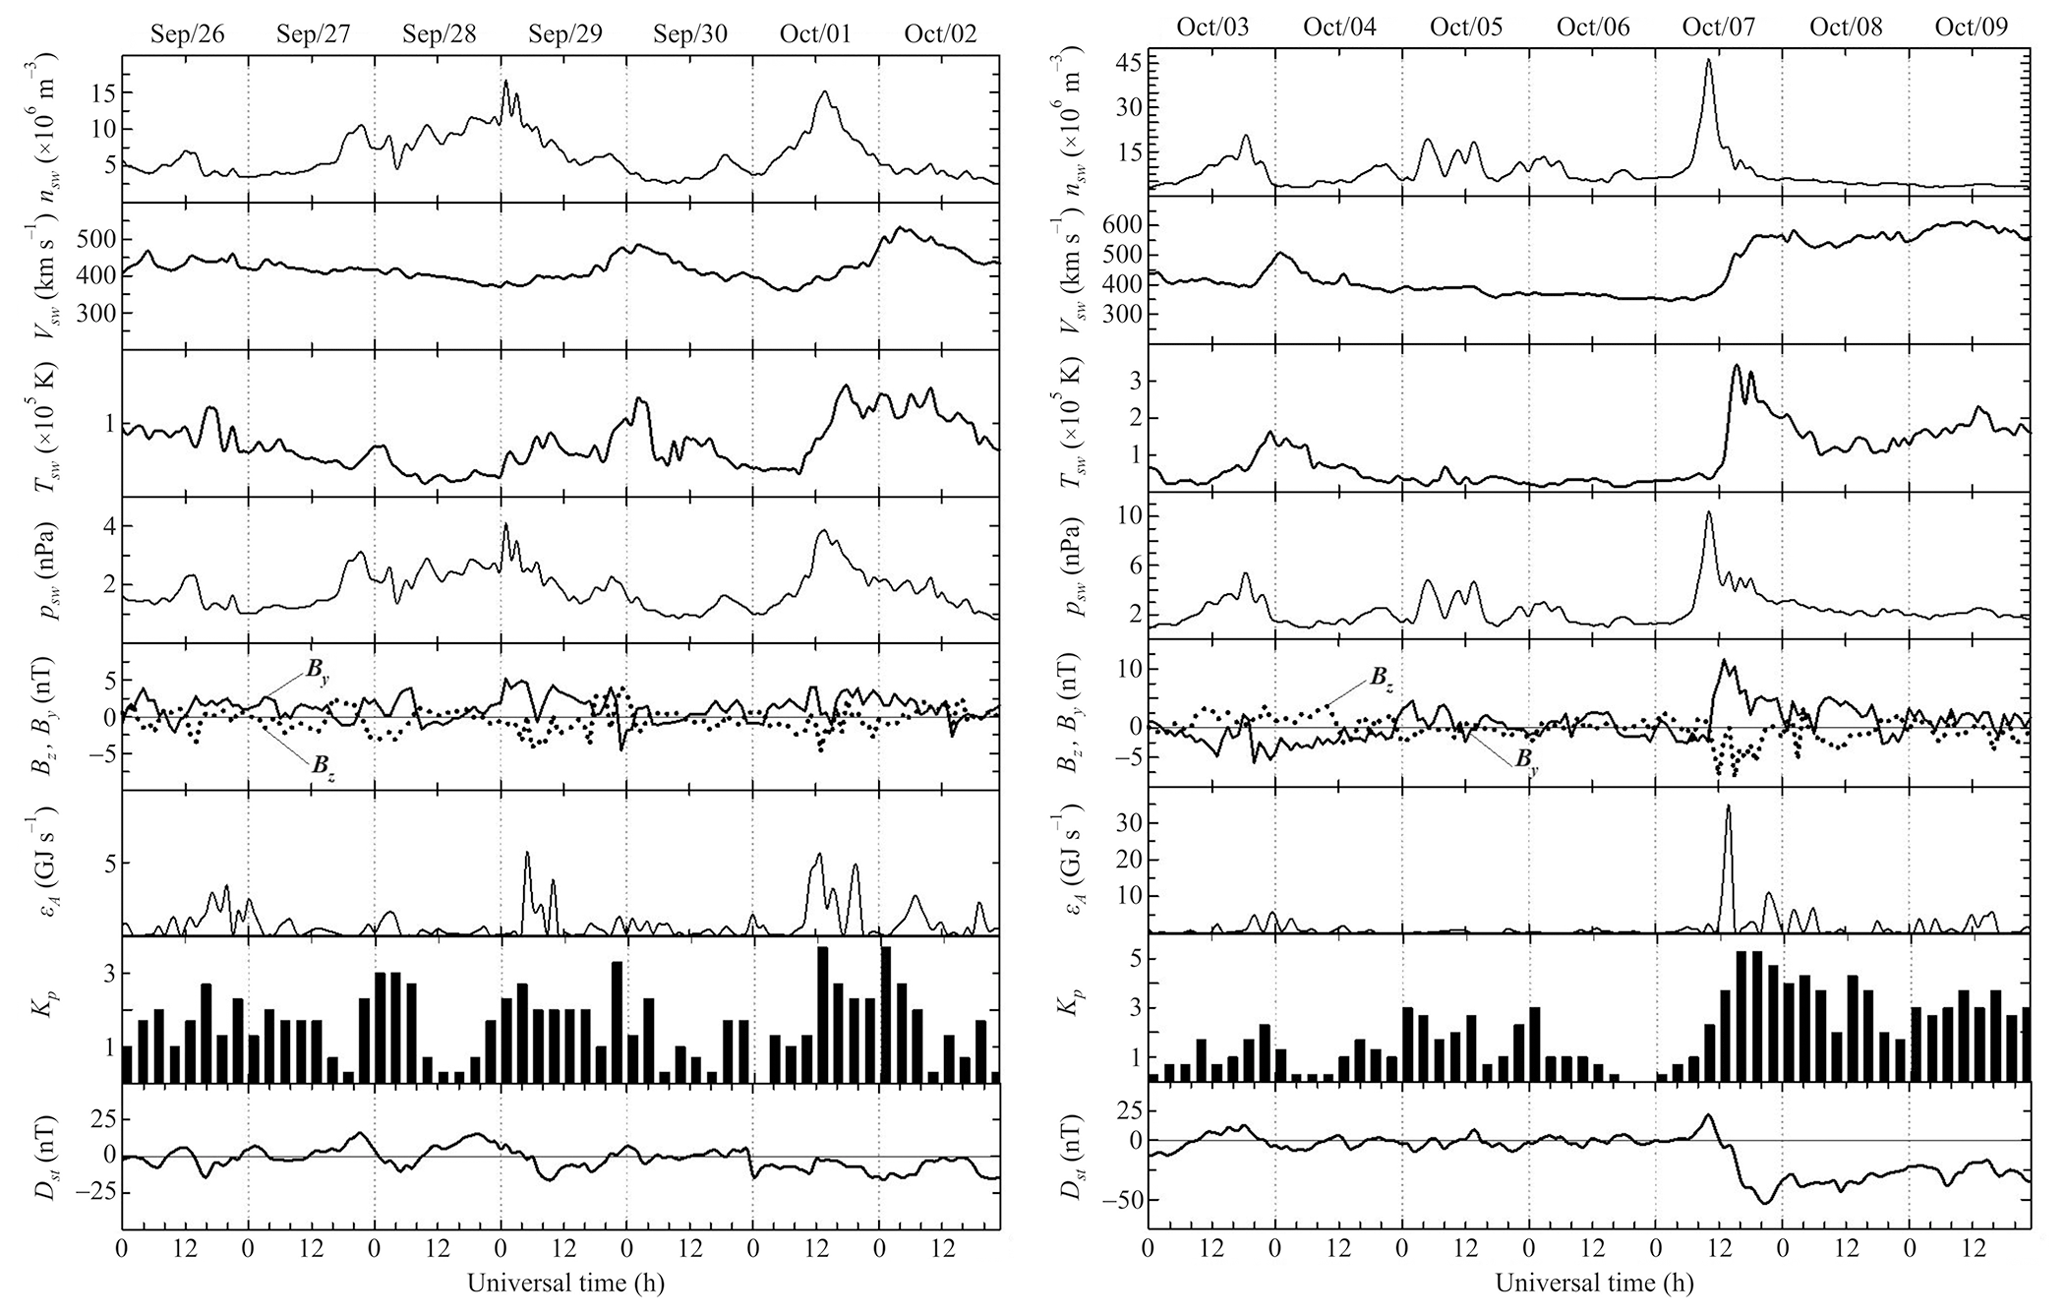
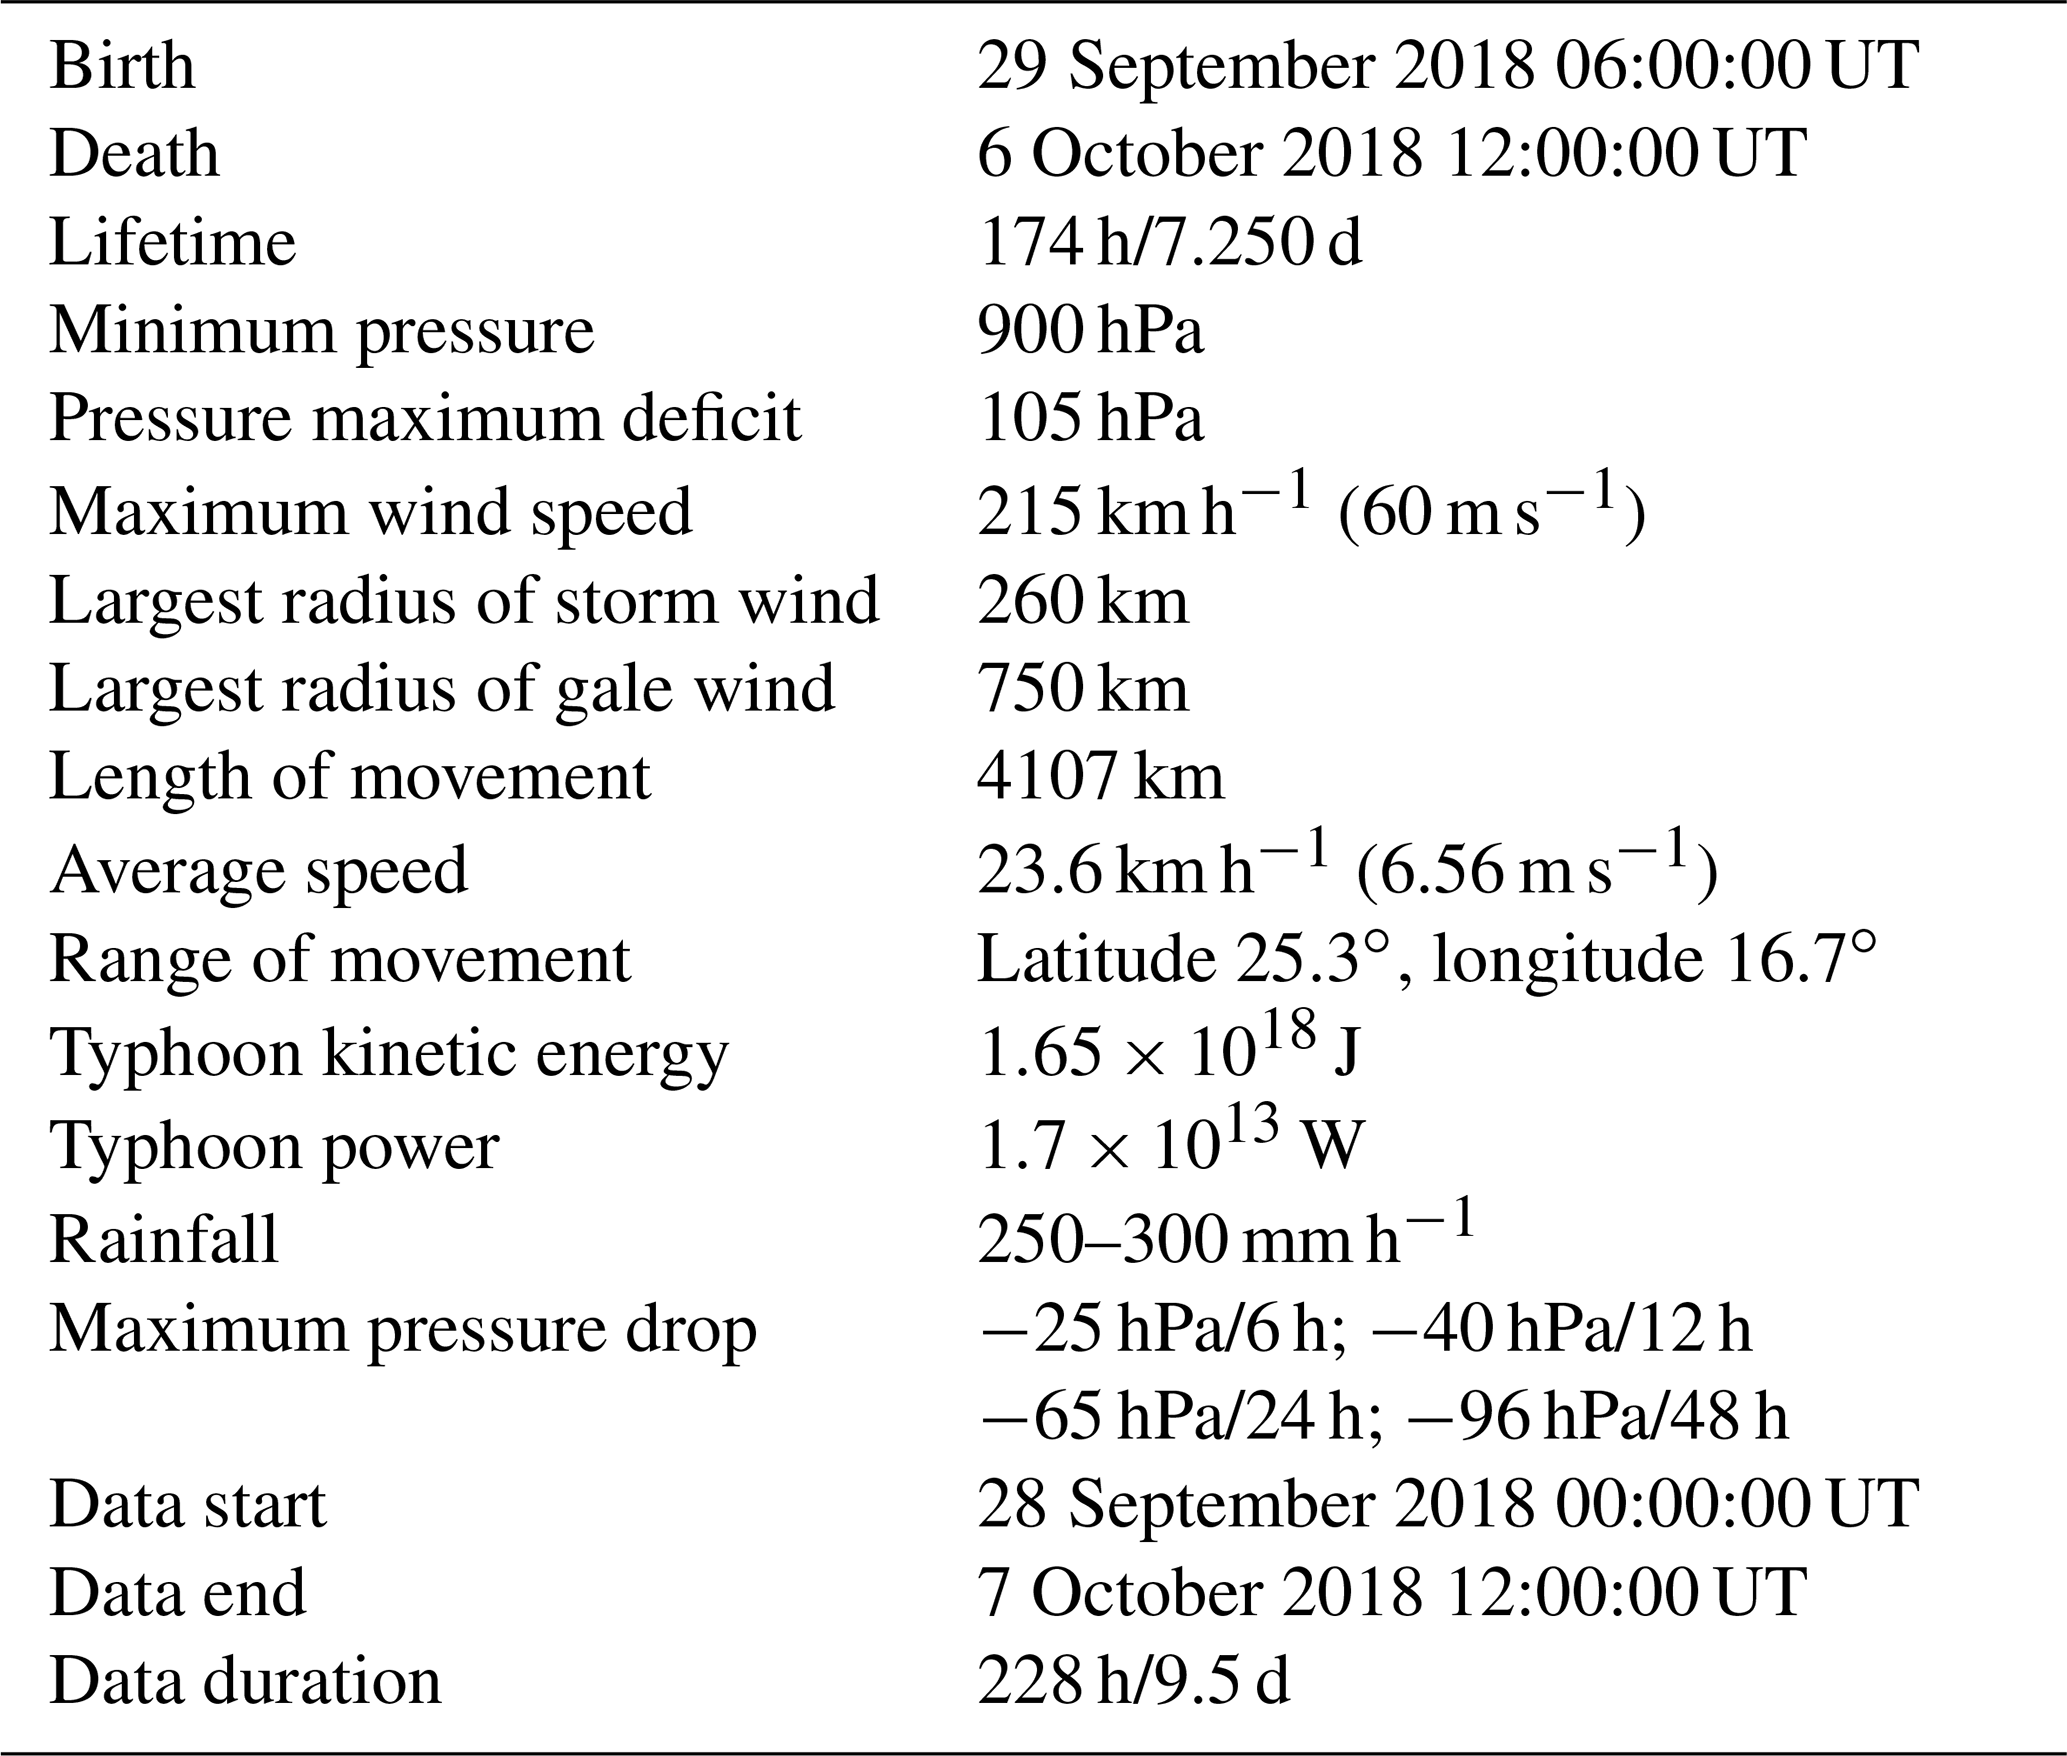
Figure 2Universal time dependences of the solar wind parameters: proton number density nsw, plasma flow speed Vsw, plasma temperature Tsw, dynamic solar wind pressure psw, Bz and By components of the interplanetary magnetic field, calculated energy input εA into the Earth's magnetosphere from the solar wind, and Kp and Dst indices for the 26 September–2 October and 3–9 October 2018 periods.
Figure 2 displays accumulated knowledge regarding the state of space weather during the super-typhoon event of Typhoon Kong-rey. First, consider the parameters of the solar wind (retrieved from https://omniweb.gsfc.nasa.gov/form/dx1.html, last access: 17 March 2023). Under quiet conditions, the proton number density is observed to be close to 5×10⁶ m−3, whereas on 29 September and 1, 3, and 5 October 2018, it shows increases up to (15–20) × 106 m−3. On 26 and 30 September 2018, as well as on 3–4 October 2018, the plasma flow speed increases from ∼400 to 500–520 km s−1. During the same UT (universal time) period, plasma temperature increases from ∼(2–3) × 104 K to ∼(1.2–1.5)×105 K, while the dynamic solar wind pressure increases from ∼1 to 4–5 nPa. The By component of the interplanetary magnetic field exhibits temporal variability within the −5.9 to 11.6 nT limits, while the Bz component changes from −4.7 to 4.0 nT.
On 26 and 29 September 2018, as well as on 1 and 3–4 October 2018, the calculated energy input, εA, into the Earth's magnetosphere from the solar wind shows increases up to ∼5 GJ s−1.
The Kp index exhibits sporadic increases to 3.0–3.7, while the Dst index shows fluctuations from −16 to 16 nT.
Table 2 presents temporal variations in the radio flux at 10.7 cm (F10.7) index for the 26 September to 9 October 2018 period.
Thus, solar activity and the state of space weather were conducive to observing the ionospheric effects from Typhoon Kong-rey. Only on 7 October 2018 did a moderate magnetic storm start, with Kpmax=5.3 and Dstmin≈ −53 nT. Thus, the days of 26 and 27 September 2018, the first half of 28 September 2018, the entire day of 29 September 2018, and partially the days of 1 and 2 October 2018 were weakly disturbed. The magnetic storm occurred after the typhoon ceased to exist, from 7 through 9 October 2018, when the Doppler shifts exhibited variations greater than those observed under the activity of the typhoon, which justifies the need for a thorough analysis of space weather. Consequently, 28 September and 4 October 2018 have been chosen to be quiet time references.
Figure 3Universal time variations in ionogram parameters determined with an update rate of one measurement per 1 h: minimum frequency, fmin, observed on the ionograms, and critical frequencies foE, foEs, and foF2 for the 29 September–2 October and 3–6 October 2018 periods.
The state of the ionosphere was monitored by the ionosonde nearest to Harbin, i.e., the WK546 URSI code ionosonde located in the city of Wakkanai (45.16∘ N, 141.75∘ E) in Japan (Guo et al., 2019a, b, 2020; Chernogor et al., 2020; Luo et al., 2020). Figure 3 shows UT variations in the main ionogram parameters. The minimum frequency, fmin, observed on ionograms exhibited fluctuations around 1.5 MHz. The critical frequencies of the E layer, foE, were close to 3 MHz during the day and gradually decreased to 1.8–2.0 MHz in the evening hours. At night, measurements of foE were impossible. The blanketing frequency of the sporadic E layer most often showed fluctuations within the 3–8 MHz limits; however sometimes it could attain 13–15 MHz. The ordinary-wave critical frequency foF2 was observed to be 4–6 MHz during the day and to decrease to 3.0–3.5 MHz at night.
Table 2Daily F10.7 index for the 26 September–9 October 2018 period.

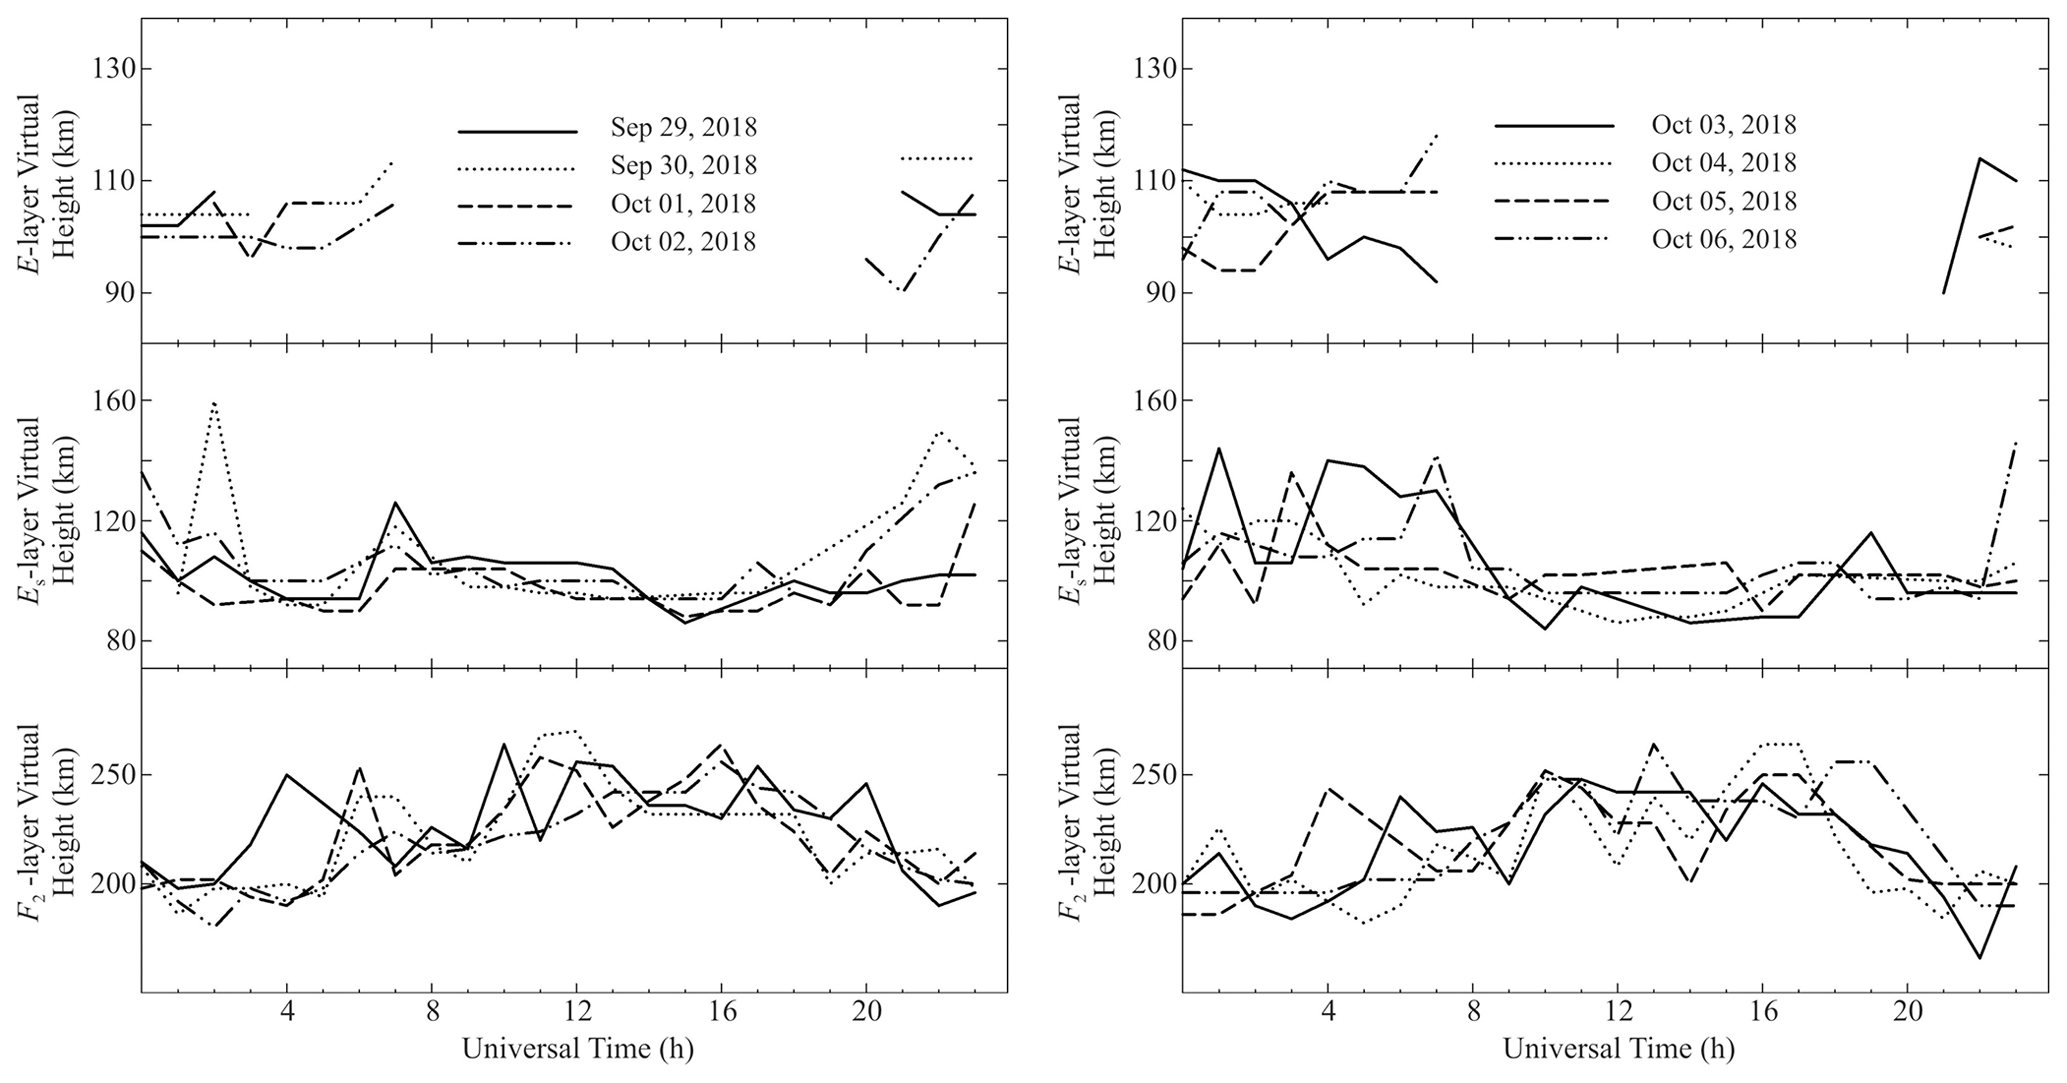
Figure 4Universal time variations in ionogram parameters determined with an update rate of one measurement per 1 h: virtual heights , , and for 29 September–2 October and 3–6 October 2018 periods.
Figure 4 shows temporal variations in the virtual heights. The virtual heights are observed to vary mainly within the 95–105 km, whereas the virtual heights most frequently show variations within the 90–110 km limits, which could sometimes exhibit an increase to 140–160 km.
The study of the effects from the super typhoon was conducted using the Harbin Engineering University multifrequency multiple-path coherent software-defined radio system for probing the ionosphere at oblique incidence (Guo et al., 2019a, b, 2020; Chernogor et al., 2020; Luo et al., 2020). The system utilizes radio transmissions of broadcast stations located in the PRC, the Republic of Korea, Japan, the Russian Federation, and Mongolia, the signals of which are received and processed at the Harbin Engineering University campus (45.78∘ N, 126.68∘ E).
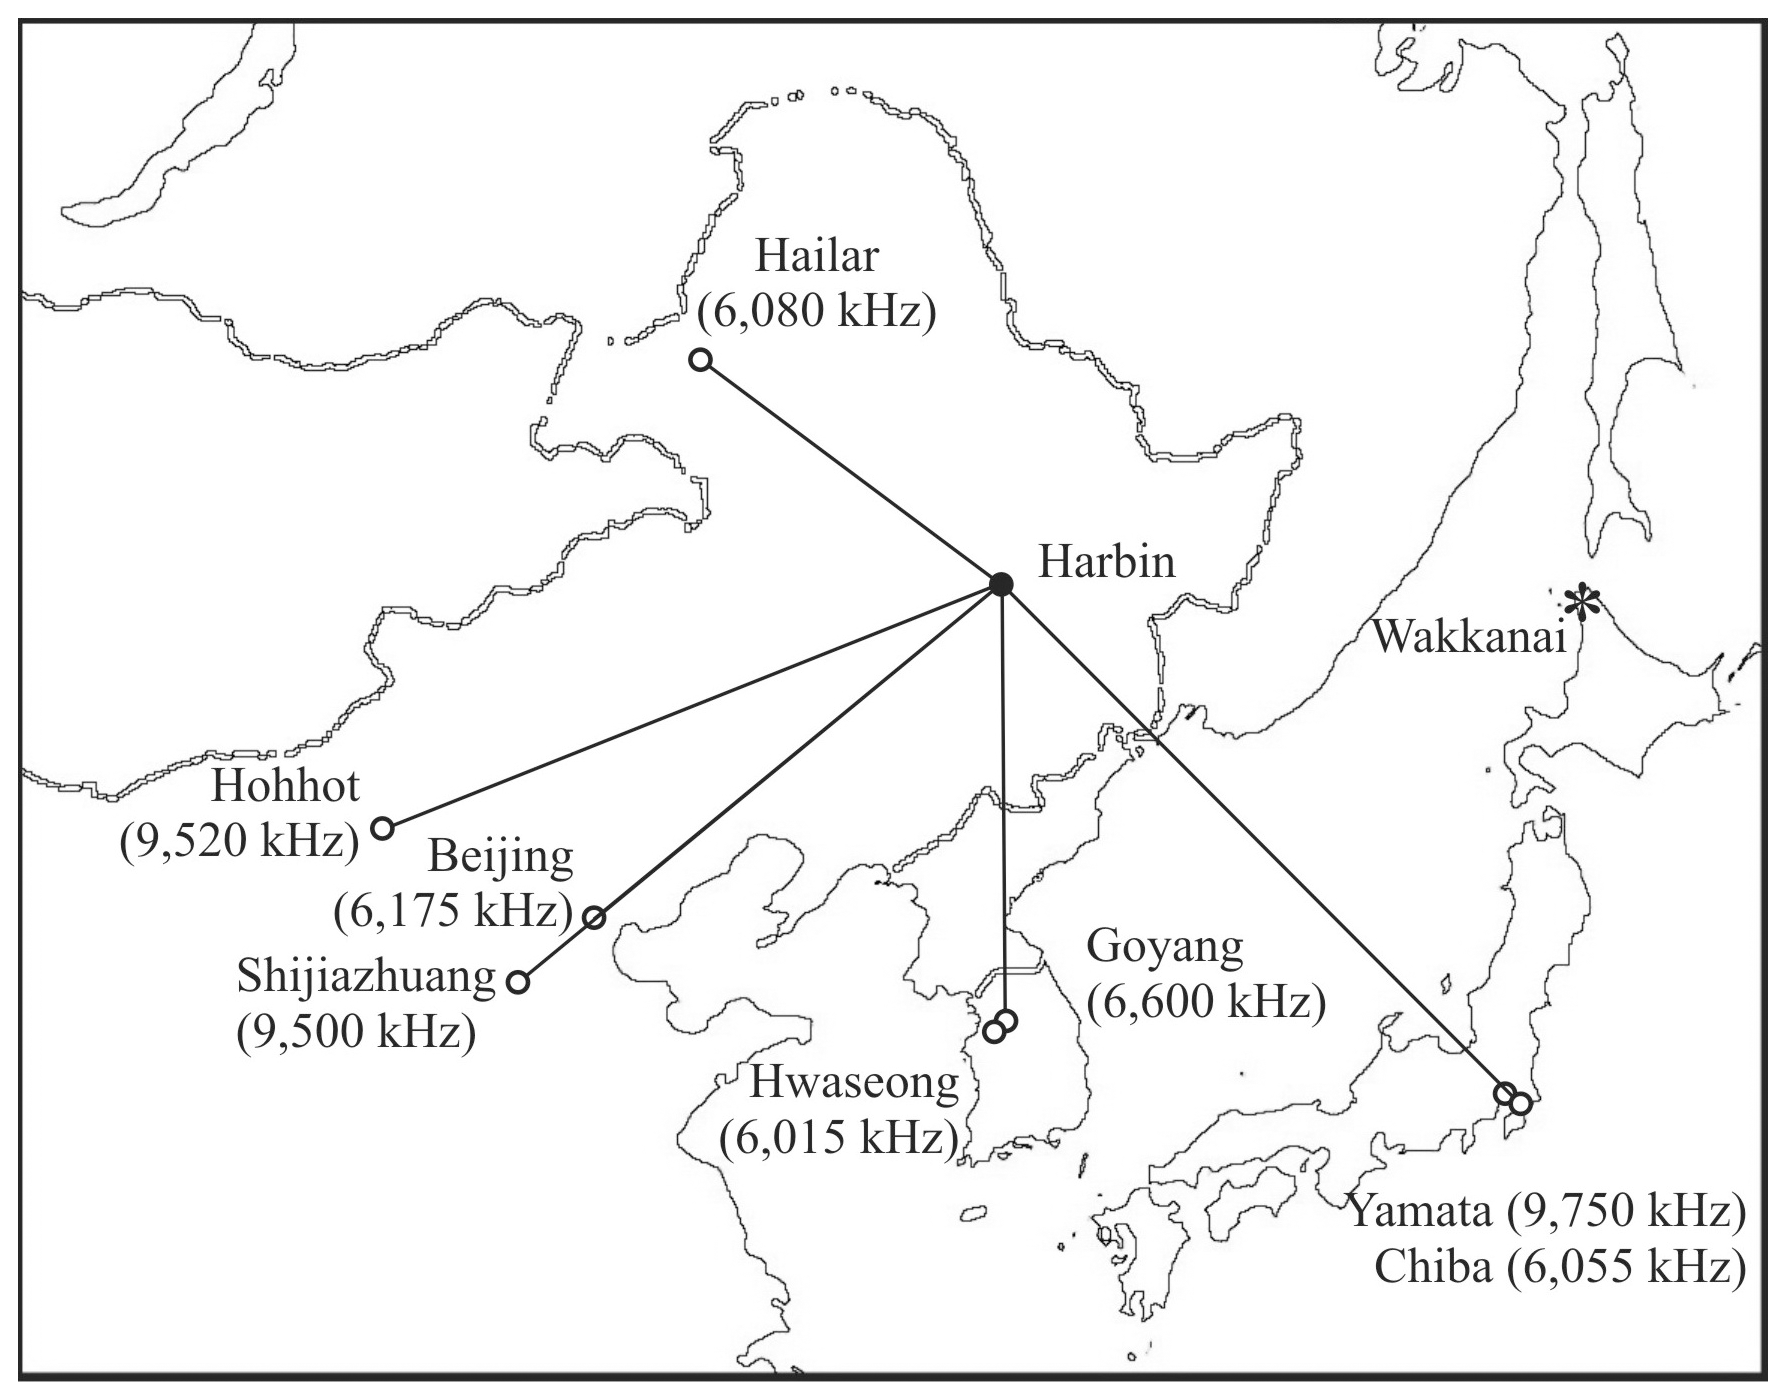
Figure 5Layout of the propagation paths used for monitoring dynamic processes operating in the ionosphere.
Continuous monitoring of the dynamic processes operating in the ionosphere is done along 14 propagation paths in the ∼5–10 MHz band (Table 3, Fig. 5) as described by Guo et al. (2019a, b, 2020), Chernogor et al. (2020), and Luo et al. (2020). In the event under study, post-analysis of the data acquired along six propagation paths has shown that the data are not suitable for processing.
Monitoring the dynamic processes in the ionosphere is done via calculating the temporal dependences of the Doppler spectra and signal amplitudes. The Doppler spectra are used to plot the Doppler shift as a function of time, fD(t), for all rays under analysis.
Spectrum analysis is performed by applying the autoregressive technique of Marple (1987), which provides a frequency resolution of 0.01 Hz over ∼20 s intervals with 7.5 s time resolution.
The fD(t) dependences can be used to calculate the trend and the fluctuations , and the system spectral analysis can be undertaken over 60–280 min intervals to select harmonics in the T≤5 and T=10–140 min period ranges (Chernogor, 2008).
For over about 50 years, one of the co-authors, Leonid F. Chernogor, has developed a general methodology for revealing perturbations launched in the ionosphere by various significant inputs of energy into the lithosphere–atmosphere–ionosphere–magnetosphere system. To put the development of this methodology into perspective, one should remember that the development of this methodology has been accompanied by tremendous, unparalleled technological advances, from analogue instruments and film-based recordings to new software-defined radio sensors.
Used in this study, the radio system probes the ionosphere at 14 radio propagation path midpoints of the order of 1000 km distance apart, which are randomly distributed in the ∼100–300 km altitude range. Generally, the perturbations under study may be produced either by an impulsive release of energy at a fixed location, as in the case of an earthquake, or by significant releases of energy, which change their location and power as well as persisting for a few days, as in the case of a typhoon. On the way from their origin to the radio propagation path midpoints in the upper atmosphere, the perturbations may undergo various nonlinear transformations. In the case of a typhoon event, atmospheric gravity waves, generated via a nonlinear process (Drobyazko and Krasil'nikov, 1975), travel up to the ionosphere (partially dissipating their energy for heating the neutral air) and launch secondary gravity waves in the wave breaking regions (see, e.g., Vadas et al., 2003; Vadas and Crowley, 2010). The latter waves in the atmosphere modulate the electron density, which can result in the level of reflection variability, the appearance of a few rays, or, in some cases, in diffuseness in the Doppler measurements or spread F in ionograms, which is an indicator of the occurrence of plasma irregularities in the ionosphere (see, e.g., Perkins, 1973). As a consequence, the measurements taken at each midpoint produce a single realization of a random process, which means that the Doppler or amplitude signatures of the sources of perturbations are unrepeatable neither in time nor in space. The observational methodology that enables identification and investigation of such perturbations arising from any deposition of large amounts of energy include the following basic principles invoked consecutively. (i) During the initial stage of employing this methodology, the perturbations originating from a particular powerful source are in principle not distinguishable qualitatively from the perturbations caused by energy released from any other powerful source. (ii) A particular powerful source releasing energy can be associated with any changes in the character of the signal (Doppler shift, Doppler spectrum, the number of rays, discrete spectrum broadening, changes in the signal amplitude, etc.), in accordance with (i) above. This condition is necessary but insufficient. (iii) Intercomparisons between the behavior of radio-wave characteristics observed prior to and after an impulsive release of energy must be made. (iv) An intercomparison of the behavior of the radio-wave characteristics observed on the day when a particular massive release of energy occurred and during quiet-time-reference days must be made. Any differences may be due to this particular source. Points (iii) and (iv) serve as control stages. During these stages, the effects that are not associated with the massive release of energy are discarded. (v) The magnitudes of the speeds of propagation of the disturbances must have a physical significance and correspond to known types of waves (seismic, atmospheric gravity waves, infrasound, magnetohydrodynamic). This stage proves sufficiency. (vi) The data acquired over a large (10–14, in the case of the Harbin Engineering University system) number of propagation paths must be consistent with each other to prove sufficiency additionally. (vii) The main signs of a particular powerful source should be observed during other analogous events. First of all, this principle refers to the observed velocities and types of waves. The speeds of perturbations traveling to the radio propagation path midpoints should be contained within the speed limits characteristic of each particular wave type.
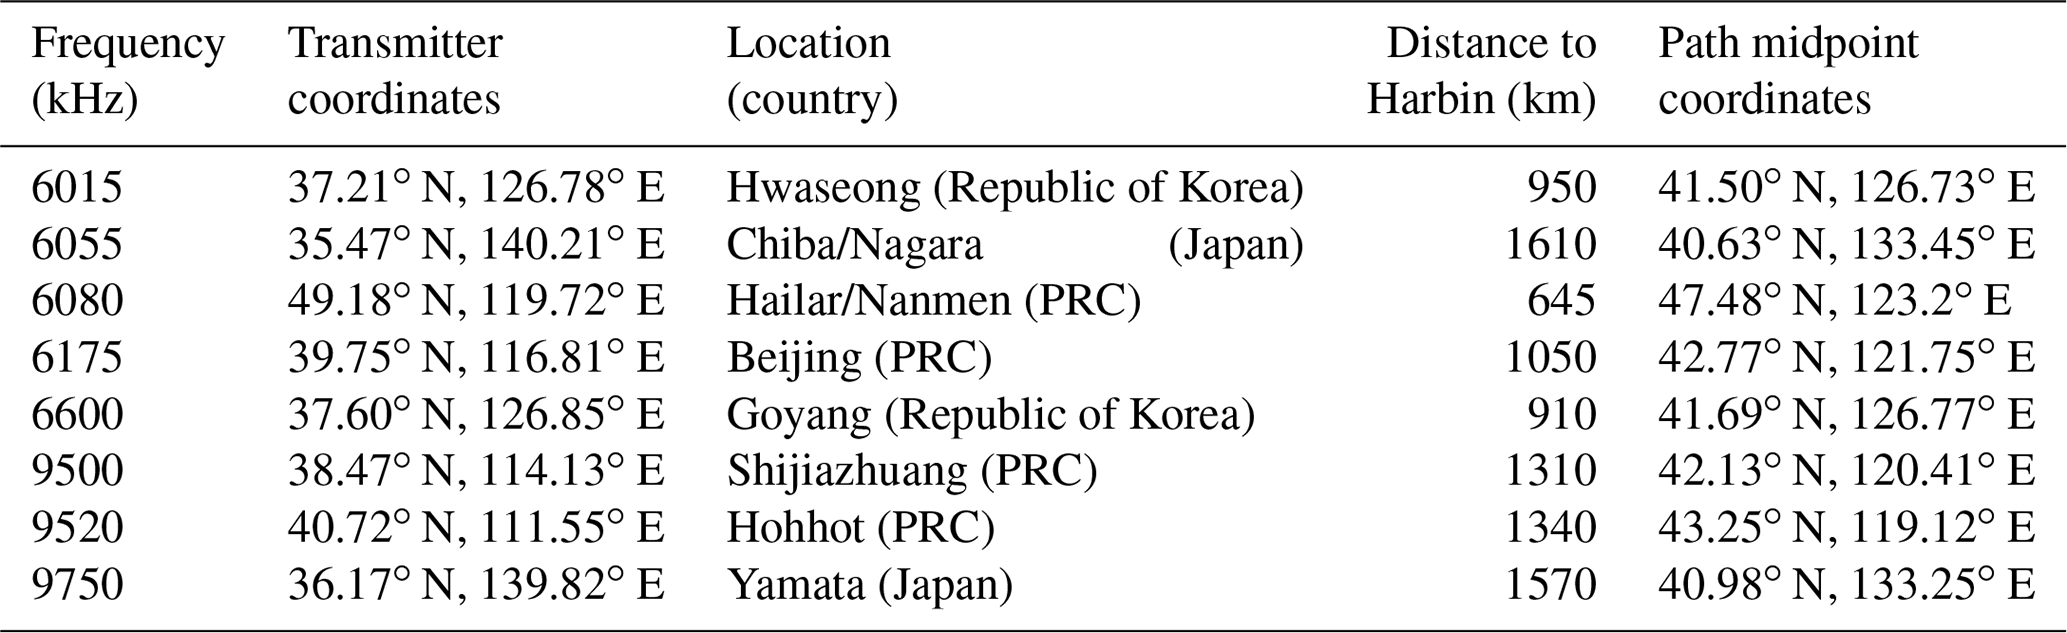
The post-analysis of the data collected during Typhoon Kong-rey has shown that the transmissions from only 8 of the 14 transmitters in the ∼6–10 MHz band are suitable for studying the super-typhoon event (Fig. 5). The specifications of the transmitters and radio-wave propagation paths are presented in Table 3. Since the lengths of the propagation paths are found to be ∼1000–2000 km, and the frequencies of the sounding radio waves are relatively small, the sounding waves were reflected either from the E layer or from the sporadic E during the daytime when the Doppler shift, fD, was observed to be ∼0 Hz. Consequently, these measurements were ineffective in observing ionospheric dynamics. At night, the radio waves were reflected from the ionospheric F region and only sometimes from the sporadic E. The Doppler shift of the radio waves reflected from the F region exhibited variations from ∼0.1 to ∼0.5 Hz and greater. Therefore, the measurements made during nights, evenings, and mornings could be used for studying ionospheric dynamics. The observations suffer another drawback: the transmitters of the broadcast radio stations did not transmit continuously.
The Doppler spectra, Doppler shift, and the signal amplitudes in the main rays along all propagation paths exhibited relatively small variability. The smallest variations were observed to occur on 28 September 2018, which was chosen to be as a quiet time reference.
The Doppler spectra and Doppler shift in the main rays and the signal amplitudes showed the greatest variability on 7 and 8 October 2018 which occurred due to the magnetic storm, which is not dealt with in detail in this study.
6.1 Hwaseong to Harbin radio-wave propagation path
This transmitter operating at 6015 kHz is located in the Republic of Korea at a great-circle range, R, of ∼950 km from the receiver; it was switched off from 00:00 to 03:30 UT.
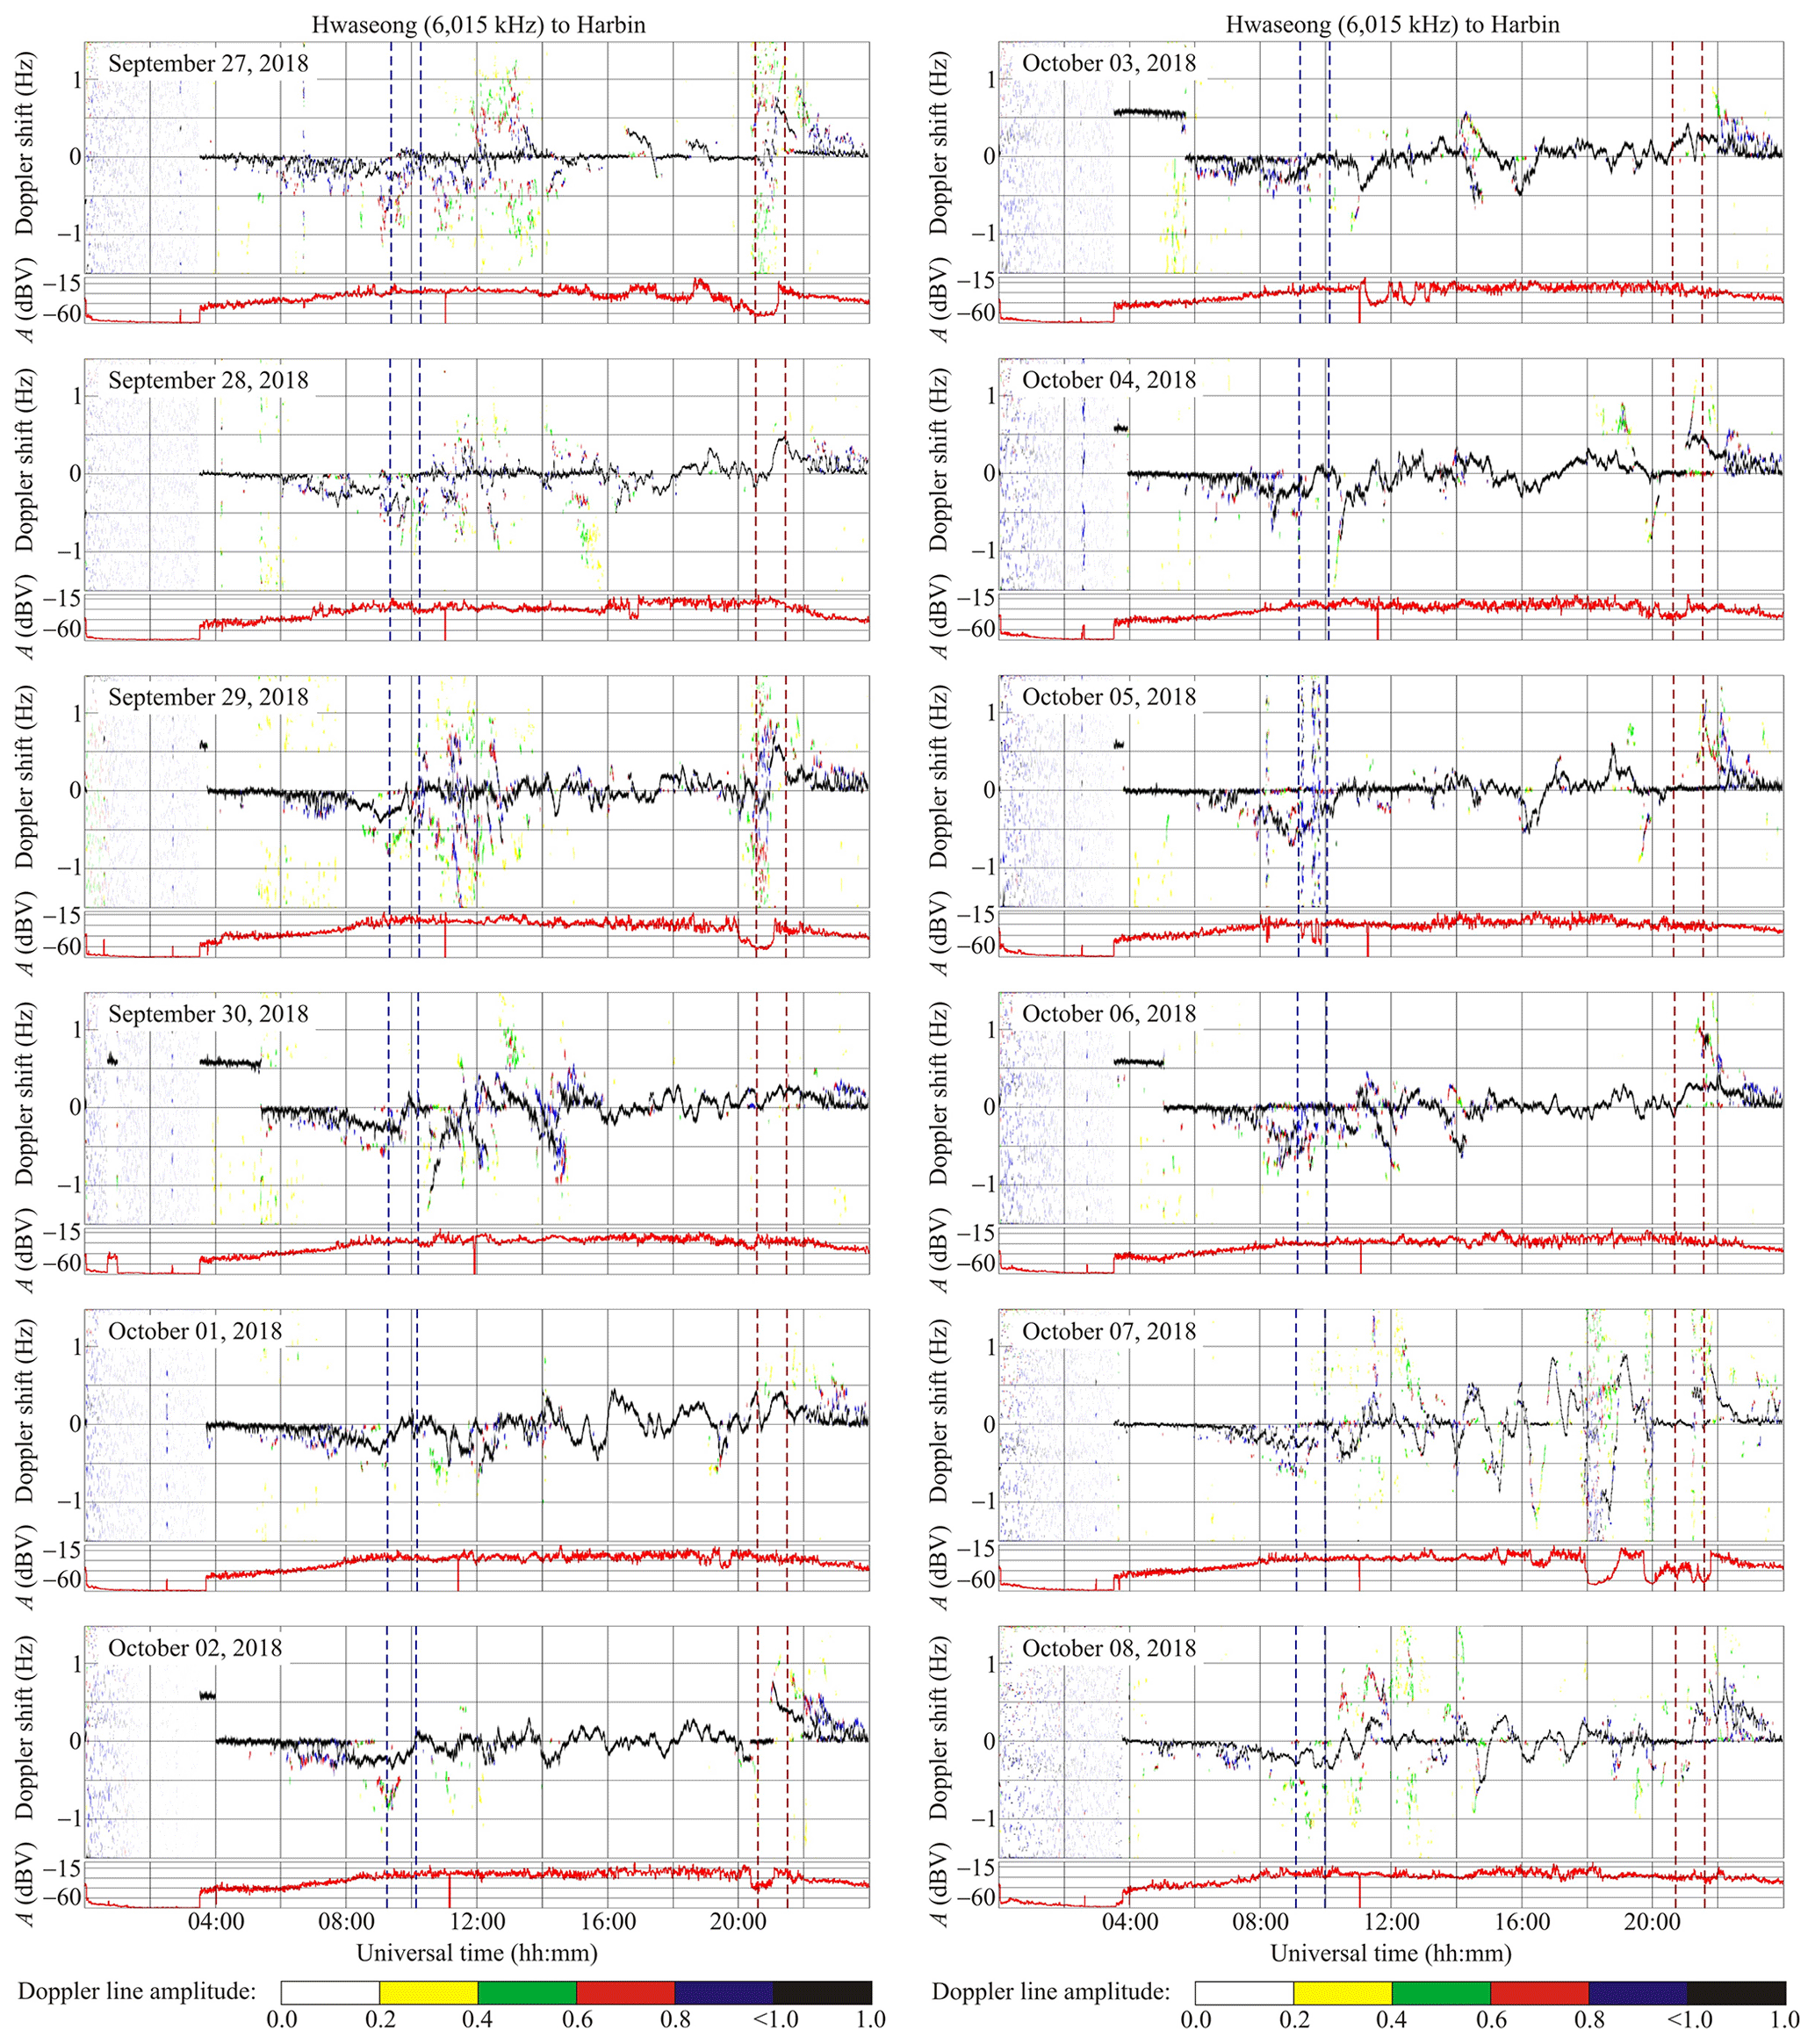
Figure 6Universal time variations in the Doppler spectra and relative signal amplitude, A, along the Hwaseong to Harbin propagation path for the 27 September–2 October and 3–8 October 2018 periods. Vertical dashed lines designate instances of sunrise (two right-hand red lines) and sunset (two left-hand blue lines) at the ground and at 100 km altitude. The signal amplitude, A, at the receiver output in decibels, dBV (relative to 1 V), is shown below the Doppler spectra in each panel.
On 29 and 30 September 2018, the Doppler shift was observed to be less than ±(0.2–0.3) Hz (Fig. 6). From 09:00 to 15:00 UT, the Doppler spectra showed diffuseness, and the Doppler shift exhibited quasi-sinusoidal variations with a ∼20–30 min period, T, and an amplitude, fDa, of ∼0.1–0.2 Hz respectively.
Doppler spectra broadening was absent during the interval from 1 to 6 October 2018. On 1 October 2018, fDa≈0.3–0.5 Hz, and T≈20–120 min.
On 2 October 2018, the 20–80 min period amplitude of the Doppler shift did not exceed 0.1–0.3 Hz. A single 140 min period wavelet in fDa up to 0.5 Hz originated on 3 October 2018. On 4 October 2018, the amplitude of the Doppler shift did not exceed 0.2 Hz, while observable quasi-sinusoidal processes were practically absent. On 5 and 6 October 2018, the Doppler shift exhibited sporadic increases up to 0.5–0.6 Hz and decreases down to −(0.5–0.7) Hz; over the rest of the time, fDa≈0.1 Hz, while T≈20–30 min.
The amplitudes of individual variations in the signal strengths did not exceed 10–15 dBV.
Table 3Basic information on radio-wave paths. The data are retrieved from https://fmscan.org/index.php (last access: 17 March 2023).
6.2 Chiba/Nagara to Harbin radio-wave propagation path
The radio station operating at 6055 kHz is located in Japan at a great-circle range, R, of ∼1610 km; it was switched off from 15:00 to 22:00 UT.
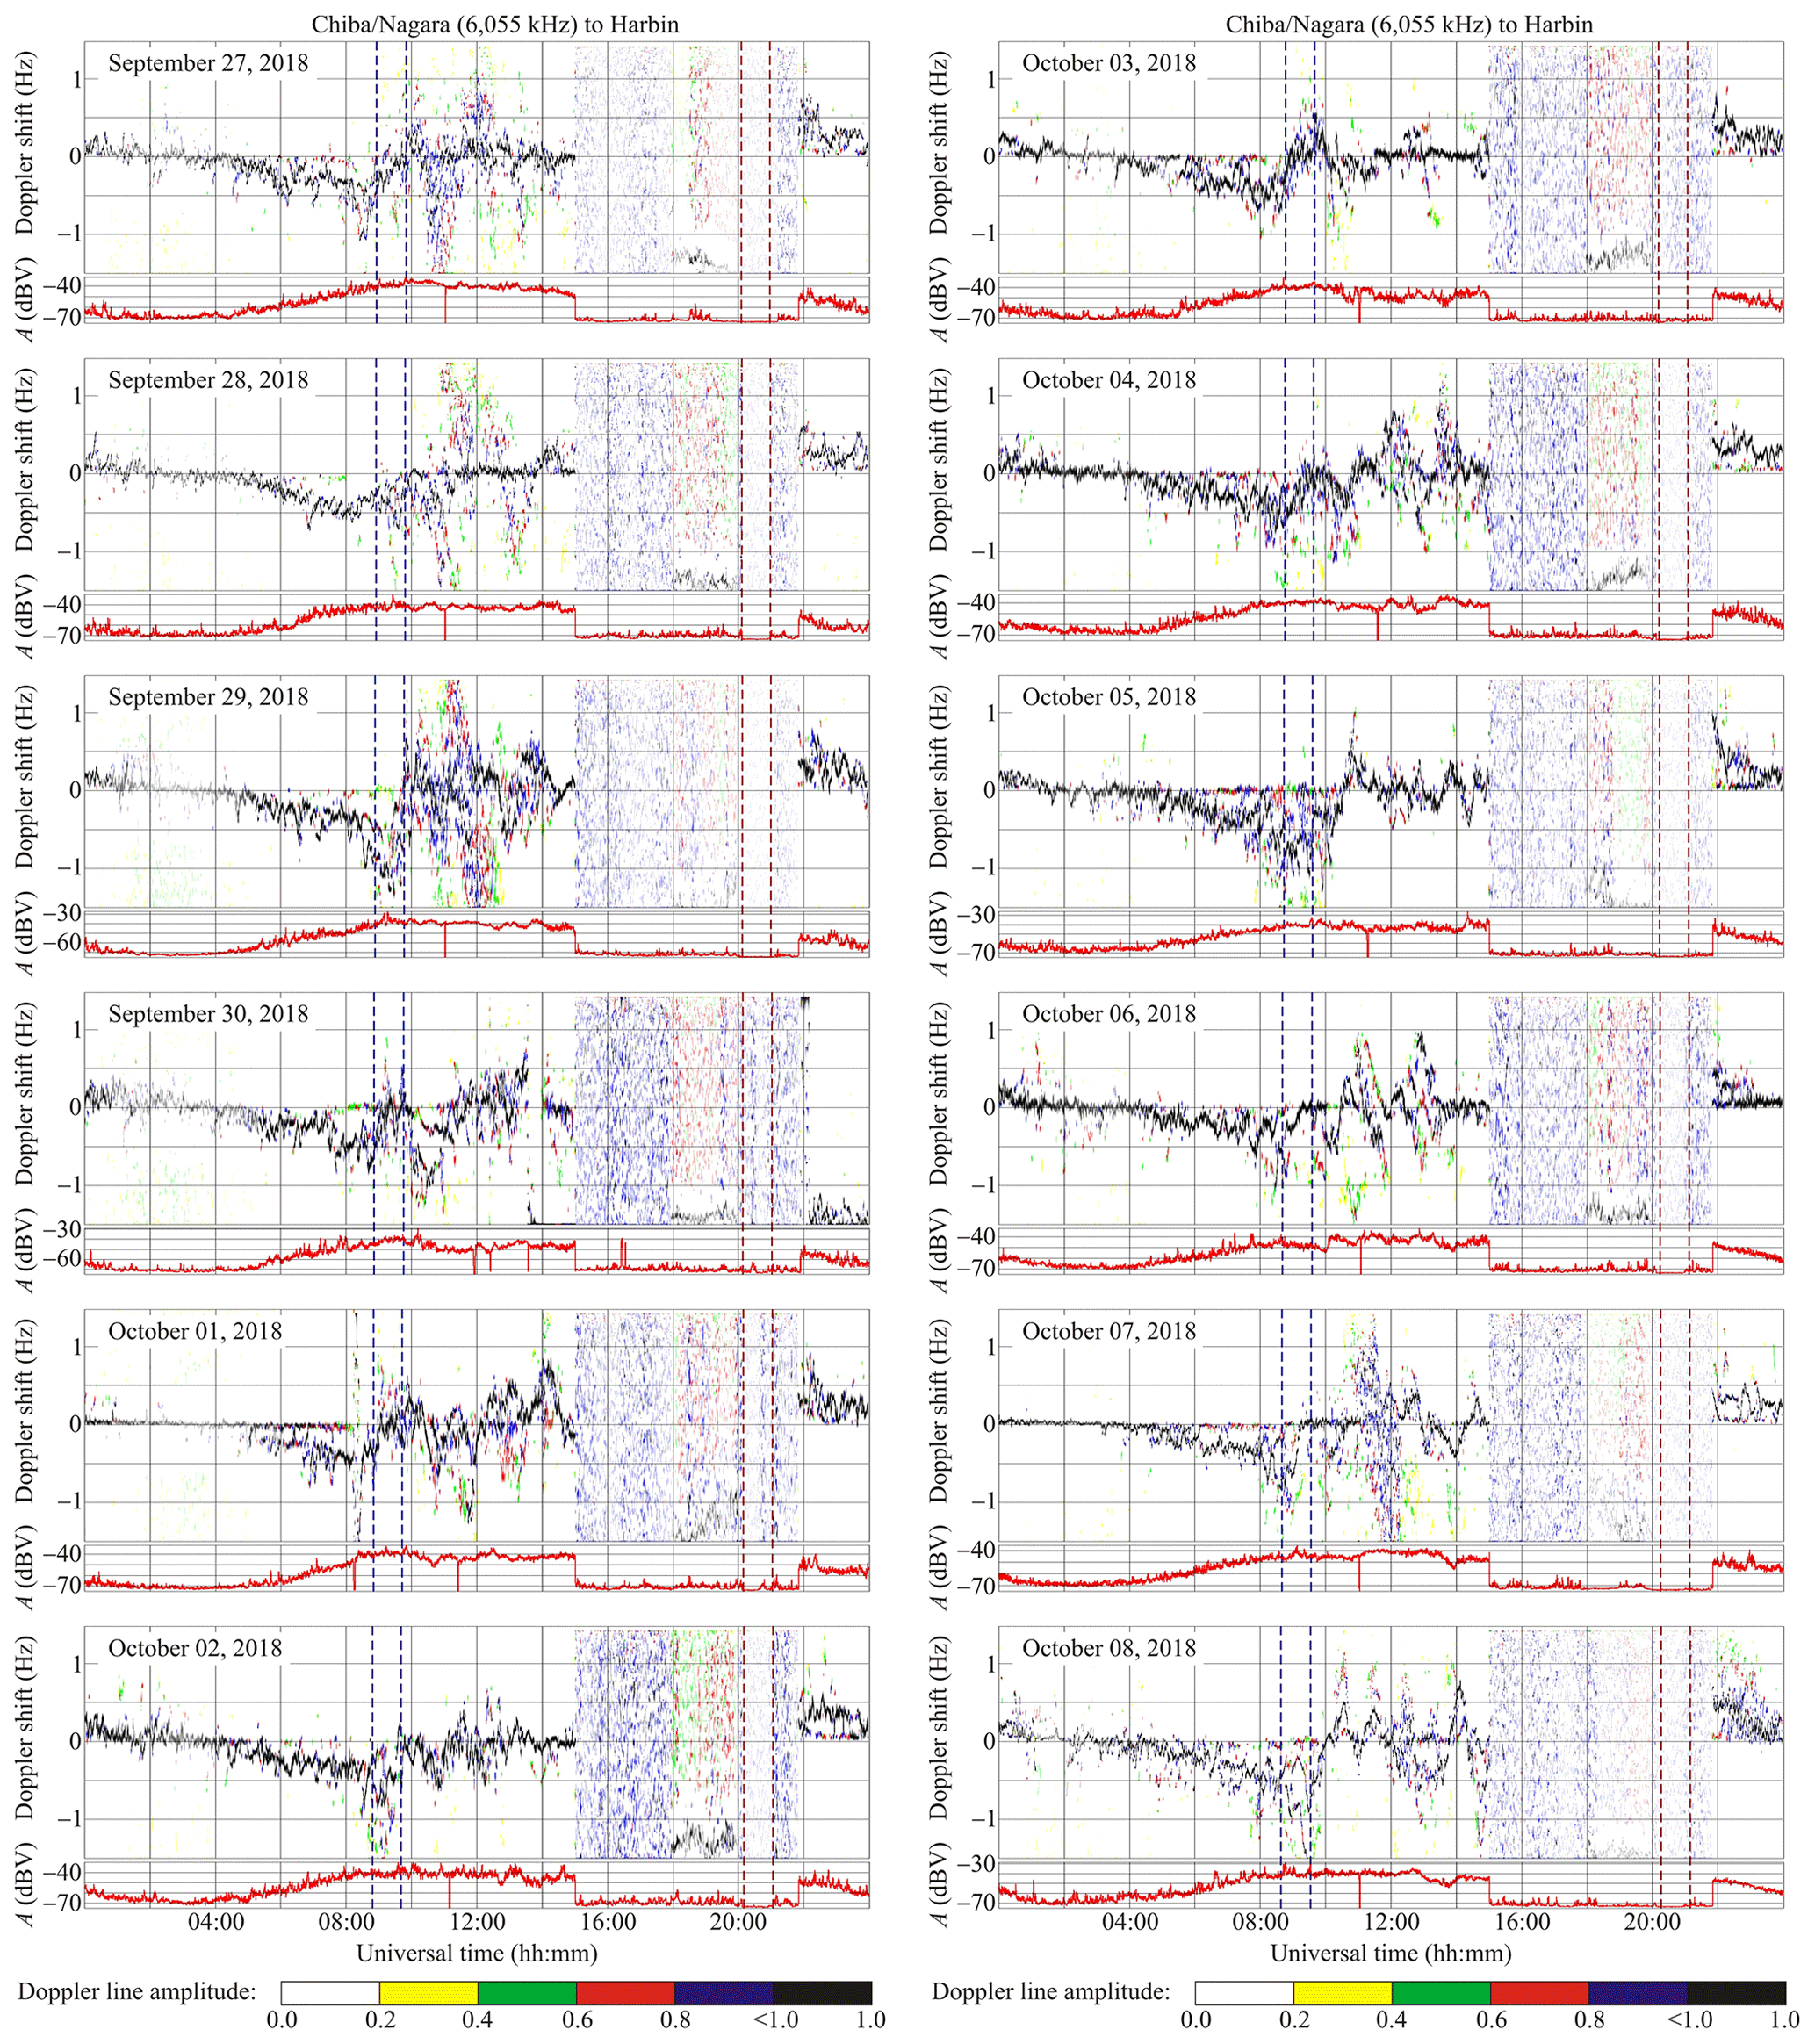
Figure 7Same as in Fig. 6 but for the Chiba/Nagara to Harbin radio-wave propagation path at 6055 kHz for the 27 September–2 October and 3–8 October 2018 periods.
Figure 7 shows that the Doppler spectra exhibit significant broadening of up to ±1.5 Hz and such a diffuseness that the main ray is practically not distinguishable during the 27–30 September 2018 period. On 1 October 2018, the Doppler shift shows quasi-sinusoidal variations with a period, T, of ∼60 min and an ∼0.3–0.4 Hz amplitude, whereas the signal amplitude, A(t), exhibits variations with a period, T, of ∼30 min and a 5 dBV amplitude. On 5 and 6 October 2018, quasi–sinusoidal variations are also noted in the Doppler spectra, with amplitudes, fDa, of ∼0.4–0.6 Hz and with periods, T, of ∼60 and 120 min. On 6 October 2018, the signal amplitude exhibits quasi-sinusoidal variations with a period, T, of ∼30 and ∼60 min and a ∼5 dBV amplitude.
6.3 Hailar to Harbin radio-wave propagation path
This transmitter operating at 6080 kHz is located in the PRC at a great-circle range, R, of 646 km; the transmissions were absent from 02:30 to 09:30 UT, whereas the observations of ionospheric dynamics were made impossible during the 14:30–20:00 UT period.
The variations in the Doppler spectra and the Doppler shift during sunlit hours on the reference days and on 1–2 October 2018 and 5 October 2017 were practically the same (Fig. 8).

Figure 8Same as in Fig. 6 but for the Hailar/Nanmen to Harbin radio-wave propagation path at 6080 kHz for the 27 September–2 October and 3–8 October 2018 periods.
6.4 Beijing to Harbin radio-wave propagation path
This radio station operated at 6175 kHz in the PRC at a great-circle range, R, of ∼1050 km from the receiver. The transmitter was switched off during 00:00 to 09:00 UT and from 18:00 to 20:00 UT periods.
On 29 September 2018, as well as on the next day, the Doppler shift showed small variations ∼0.1 Hz (Fig. 9), which exhibited increases of up to 0.3–0.5 Hz only over separate time intervals. On 1 October 2018, the Doppler shift exhibited quite ordered variations, with oscillations of periods, T, of ∼30 and ∼110 min and amplitudes, fDa, attaining 0.5 Hz. On 2 October 2018, the amplitude fDa decreased to 0.3 Hz, whereas the periods were observed to vary from 20 to 110 min.
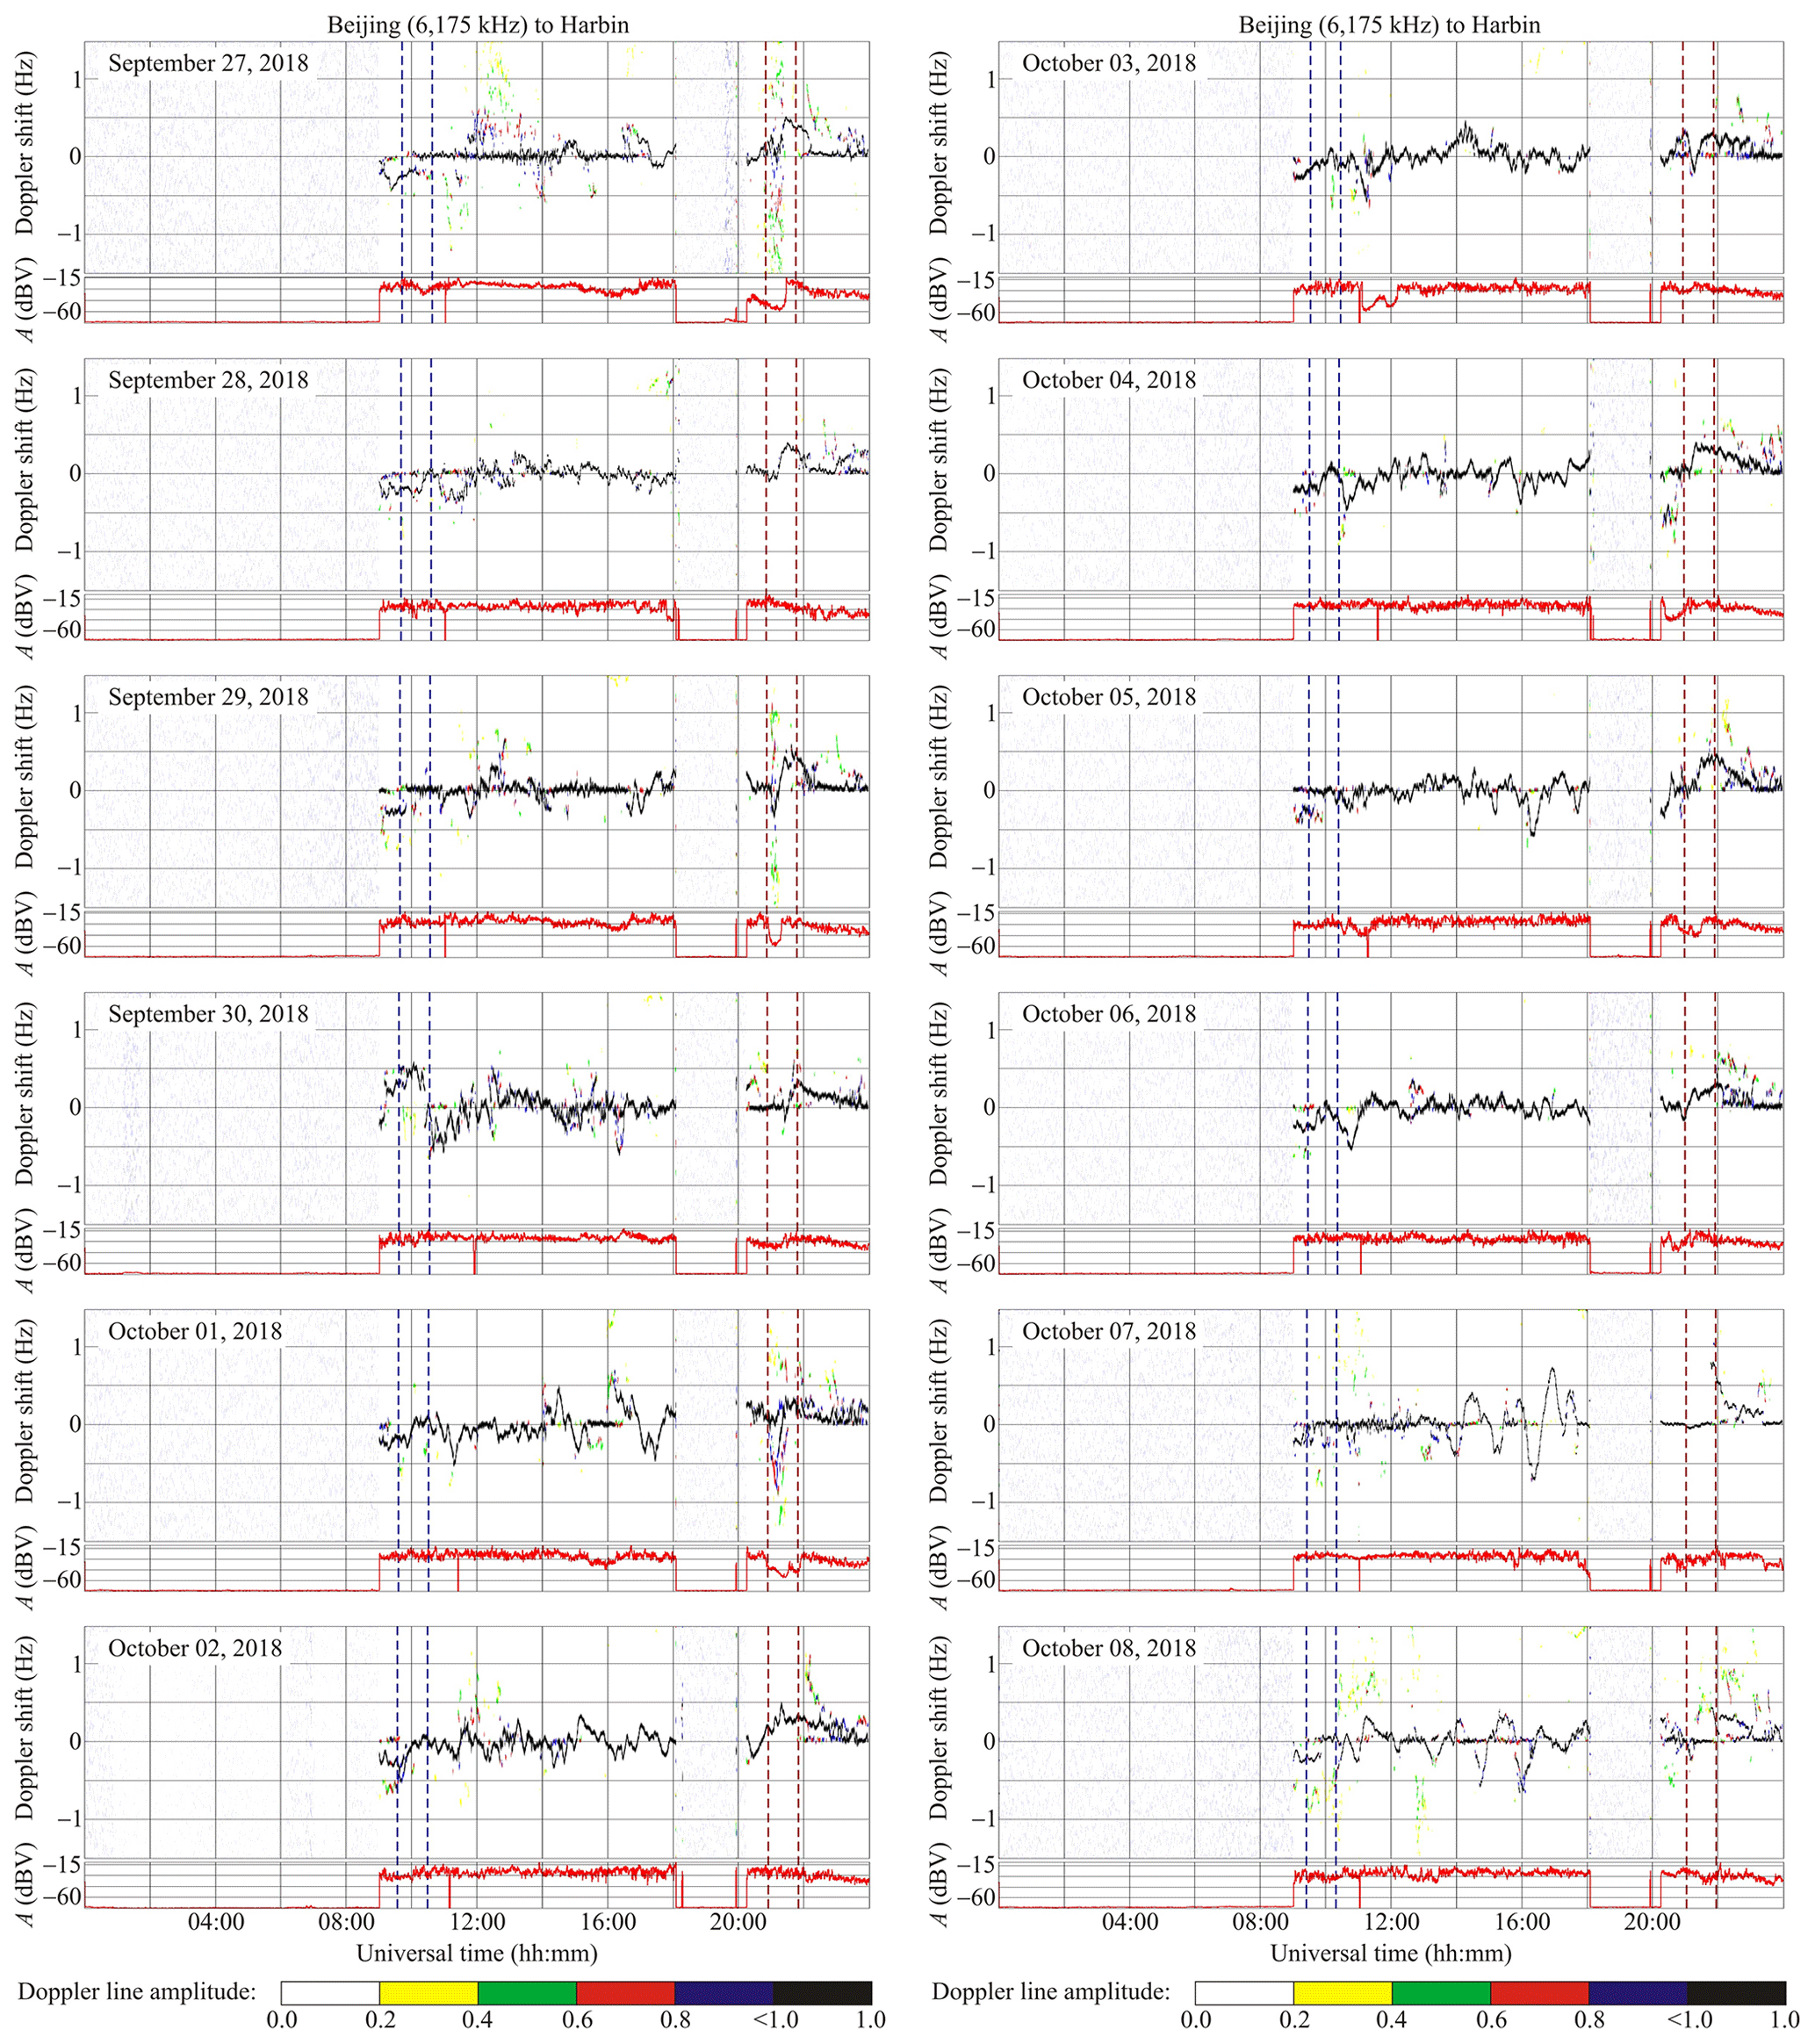
Figure 9Same as in Fig. 6 but for the Beijing to Harbin radio-wave propagation path at 6175 kHz for the 27 September–2 October and 3–8 October 2018 periods.
On 3, 4, and 6 October 2018, the Doppler shift showed quasi-sinusoidal variations with periods, T, in the 20 to 90 min range and with amplitudes, fDa, of 0.1–0.2 Hz.
After 14:00 UT on 5 October 2018, the Doppler shift amplitude, fDa, was observed to increase to 0.2–0.4 Hz and to exhibit periods, T, in the range from 20 to 80 min.
The signal amplitude exhibited temporal variability within the 10 dBV limits.
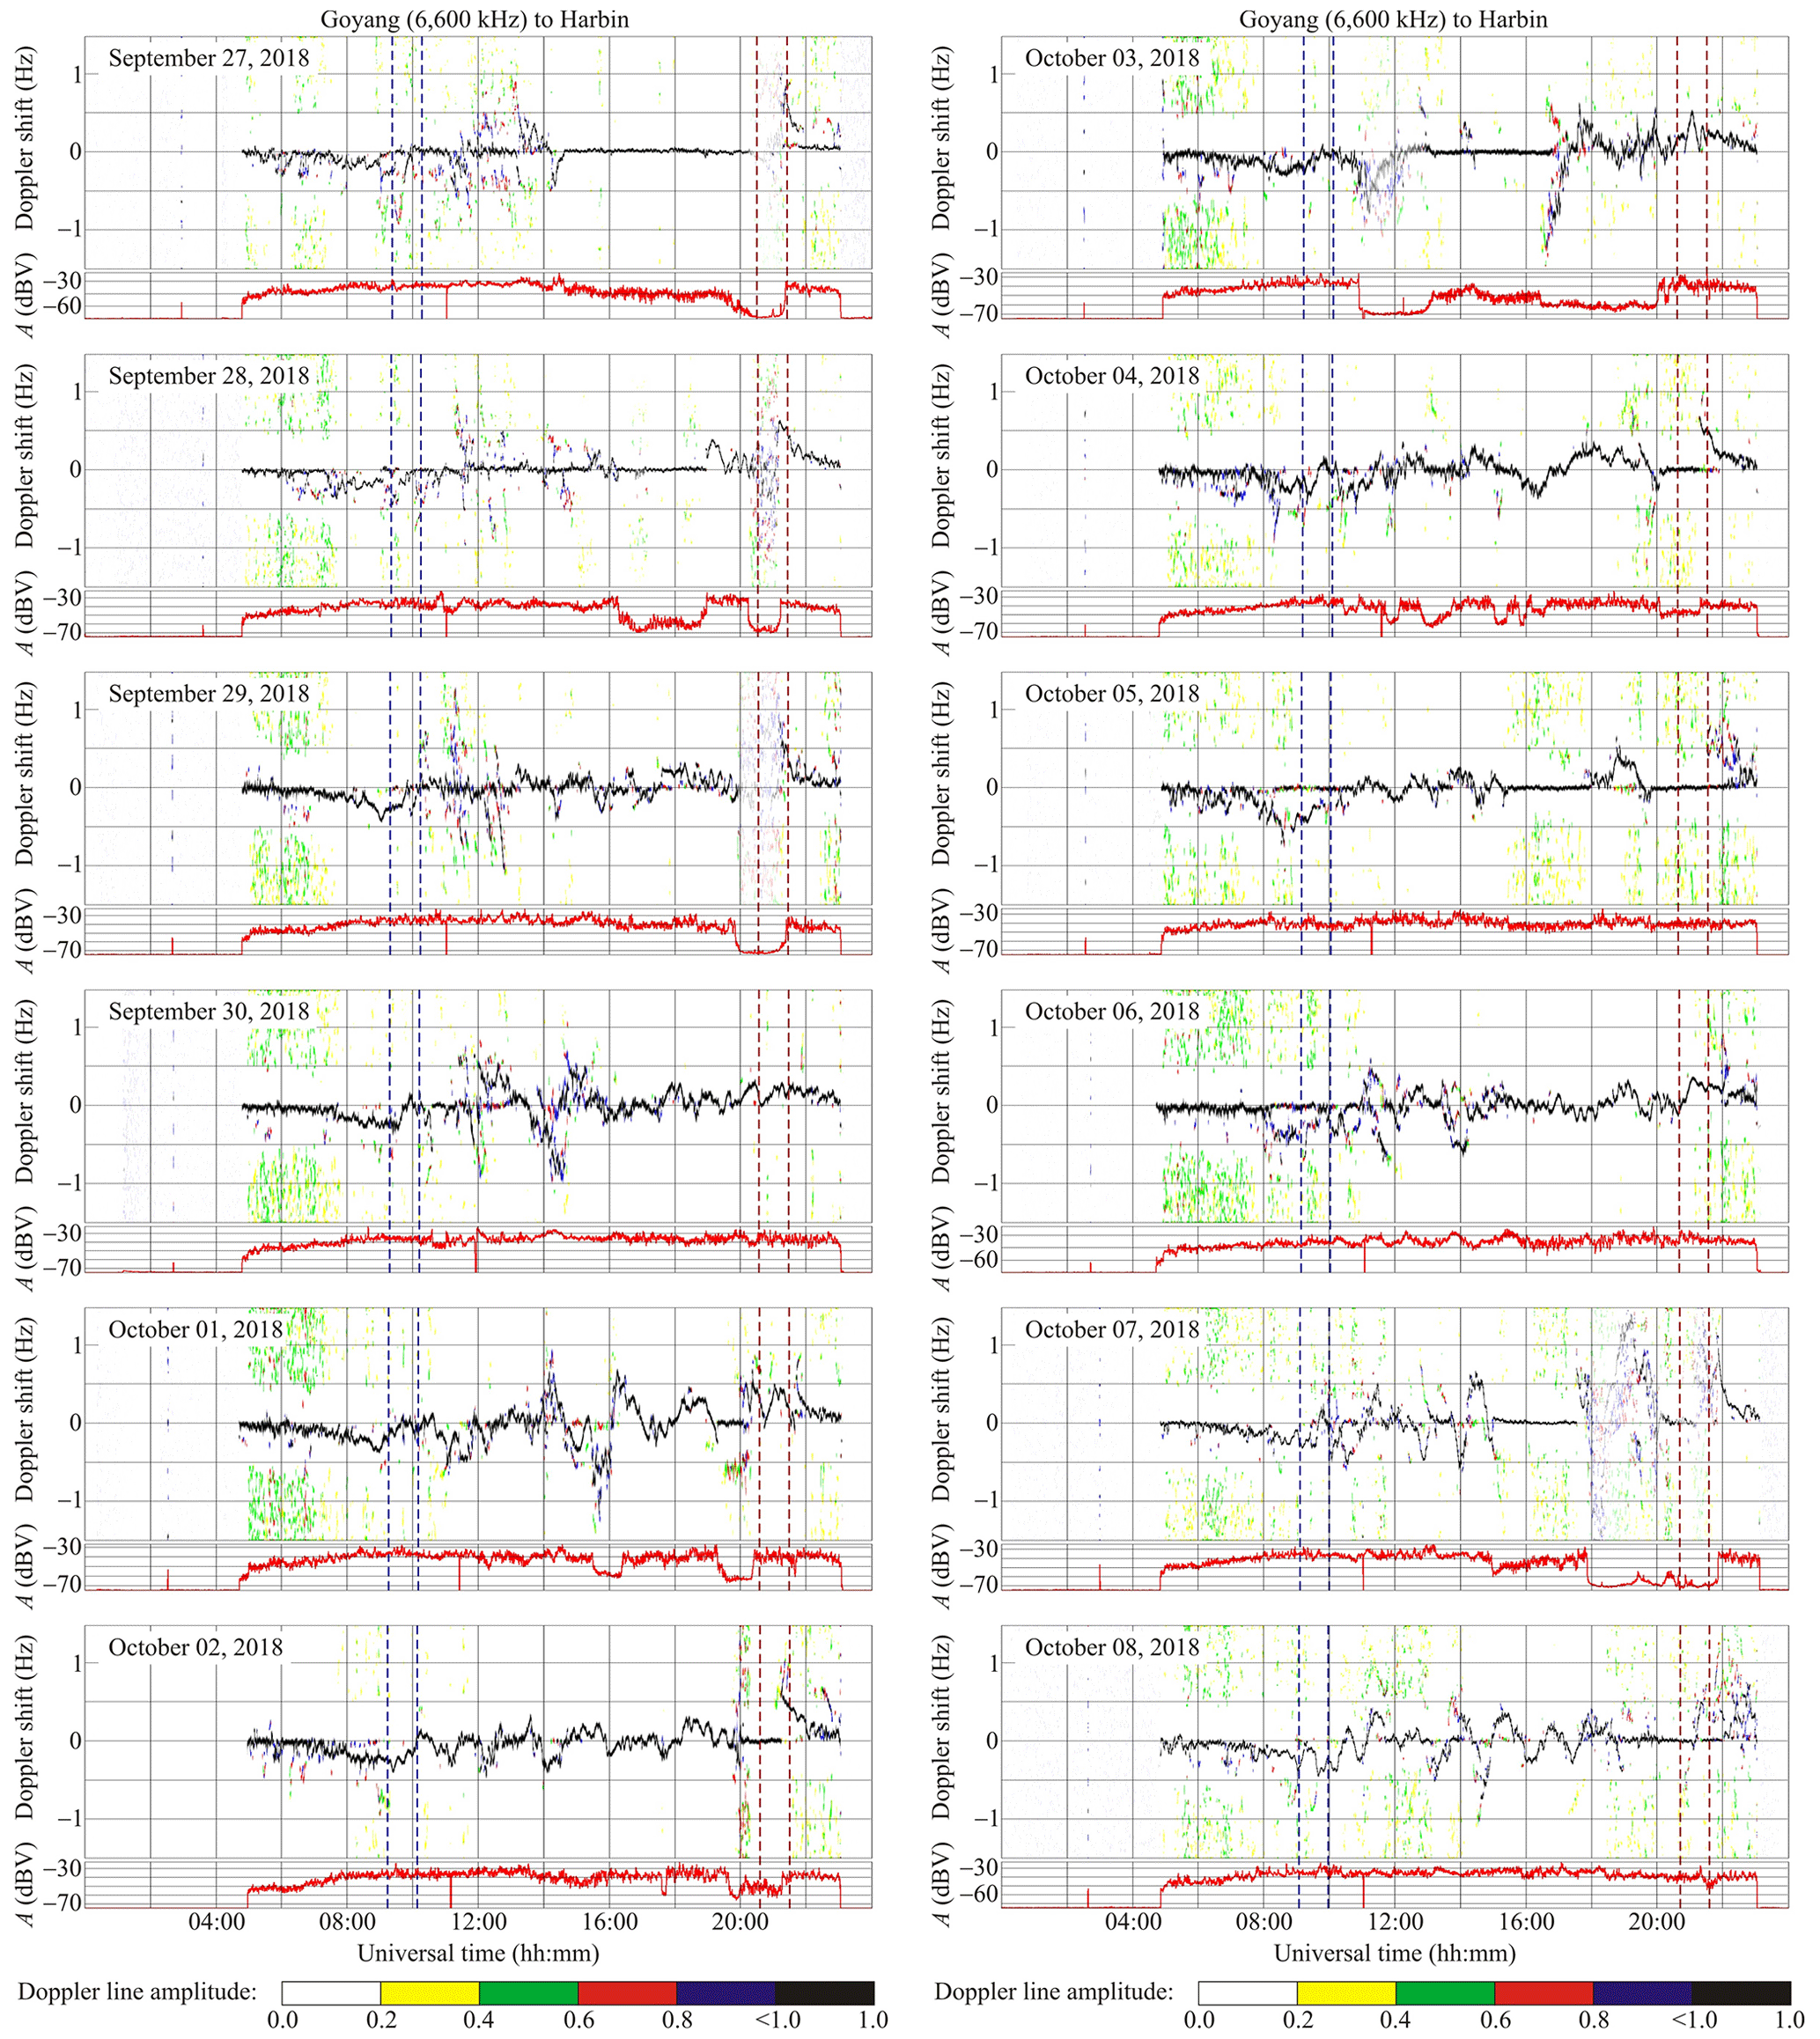
Figure 10Same as in Fig. 6 but for the Goyang to Harbin radio-wave propagation path at 6600 kHz for the 27 September–2 October and 3–8 October 2018 periods.
6.5 Goyang to Harbin radio-wave propagation path
This transmitter operating at 6600 kHz is located in the Republic of Korea at a great-circle range of ∼910 km from the receiver; it was switched off from 00:00 to 05:00 UT and from 22:20 to 24:00 UT.
On 29 September 2018, the Doppler shift showed fluctuations within the ±(0.2–0.3) Hz limits (Fig. 10). Over the next day, the Doppler spectrum broadening was observed to occur from 12:00 to 16:00 UT, whereas the Doppler shift exhibited quasi-sinusoidal variations with a period, T, of ∼20–24 min and amplitude, fDa, of 0.1–0.2 Hz.
The Doppler ±0.6 Hz spectrum broadening was observed to occur on 1 October 2018, while the Doppler spectra exhibited variations with a period, T, of ∼20–120 min and amplitude, fDa, of ∼0.1–0.7 Hz; considerable variations, of up to 20 dBV, were noted in the signal amplitude.
On 2 October 2018, the Doppler shift exhibited significant variations of ±(0.2–0.3) Hz, with a quasi-period, T, of 24 min and amplitude, fDa, of ∼0.2 Hz. Considerable fluctuations in the Doppler spectra, the Doppler shift, and the signal amplitude were noted on 3 October 2018. On 4 October 2018, from 14:00 to 20:00 UT, the Doppler shift showed changes within the −0.3 to 0.3 Hz limits, the quasi-sinusoidal processes were expressed weakly, and the signal amplitude fluctuated wildly, by 30 dBV. On 5 October 2018, the variations in the Doppler shift did not exceed ±0.2 Hz; the fluctuations in the signal amplitude were also insignificant. The Doppler shift was observed to increase up to ±(0.3–0.5) Hz during the 6 October 2018 11:00–14:00 UT period, whereas from 15:00 to 18:00 UT, the quasi-sinusoidal oscillations in the Doppler shift were observed to occur with a period, T, of ∼20 min and amplitude, fDa, of ∼0.1 Hz, while quasi-sinusoidal variations in the signal amplitude, A(t), were observed to occur with a period, T, of ∼55–80 min and amplitude of ∼7–8 dBV.
6.6 Shijiazhuang to Harbin radio-wave propagation path
This radio station operating at 9500 kHz is located in the PRC at a great-circle range, R, of ∼1310 km from the receiver.
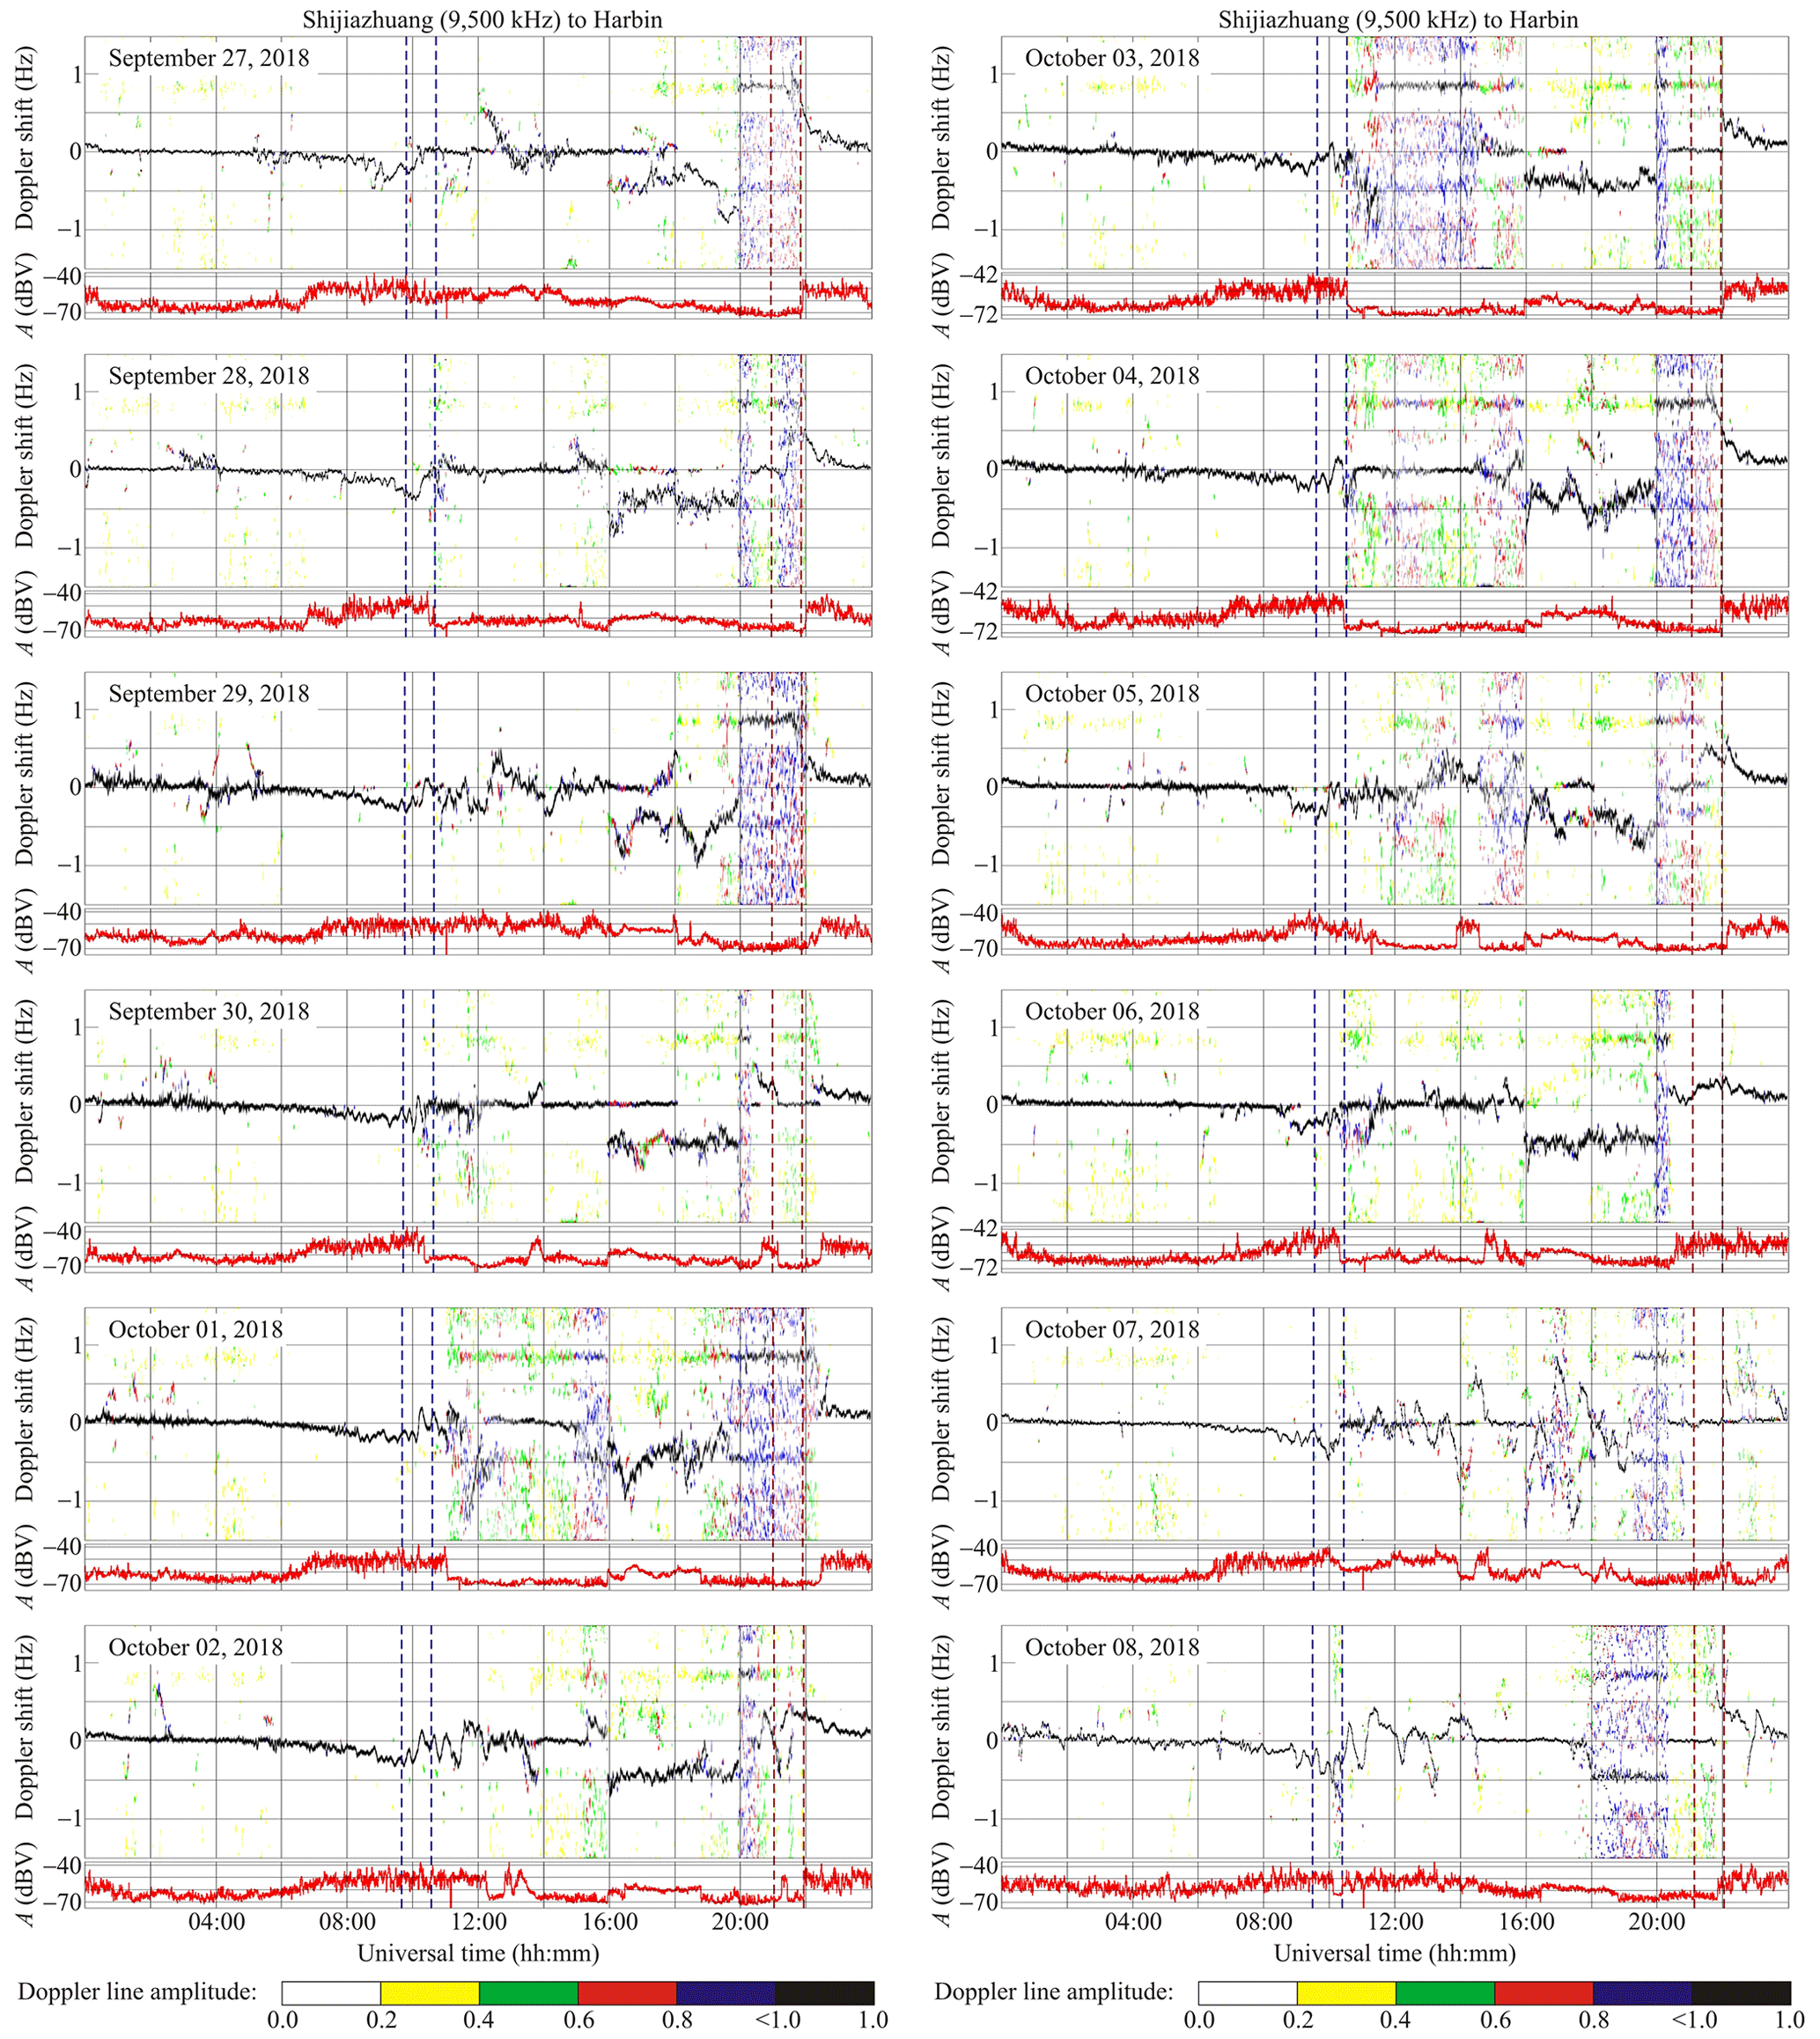
Figure 11Same as in Fig. 6 but for the Shijiazhuang to Harbin radio-wave propagation path at 9500 kHz for the 27 September–2 October and 3–8 October 2018 periods.
Figure 11 shows that the value of Doppler shift, fD(t), was close to zero on each night. The Doppler shift was observed to be negative, attaining a minimum of −(0.20–0.25) Hz, 2–3 h before sunset at the ground. During the night of 29 September 2018 UT, the signal amplitude was observed to fluctuate wildly within the 20 dBV limits and to be accompanied by fluctuations in the Doppler shift. A second ray that shifted by −0.5 Hz with respect to the main ray was observed to appear during the 16:00–20:00 UT period. During the nights from 30 September through 6 October 2018 UT, the signal frequency approached the maximum usable frequency, and ionospheric signal was about to penetrate the ionosphere, which resulted in a 10–20 dBV decrease in the signal amplitude, whereas the Doppler spectra became low informative. These circumstances have significantly hampered the search for the ionospheric response to the super-typhoon activity. Nevertheless, the Doppler shift exhibited considerable variations on 1 October 2018, attaining −1 Hz. Significant variations in the Doppler shift were noted at the beginning of the night of 2 October 2018 UT and after midnight UT on 3, 4, 5, and 6 October 2018; in particular, the ray that shifted by −0.5 Hz was recorded.
6.7 Hohhot to Harbin radio-wave propagation path
This transmitter operating at 9520 kHz is located in the PRC at a great-circle range, R, of ∼1340 km; it was switched off from 16:00 to ∼22:00 UT.
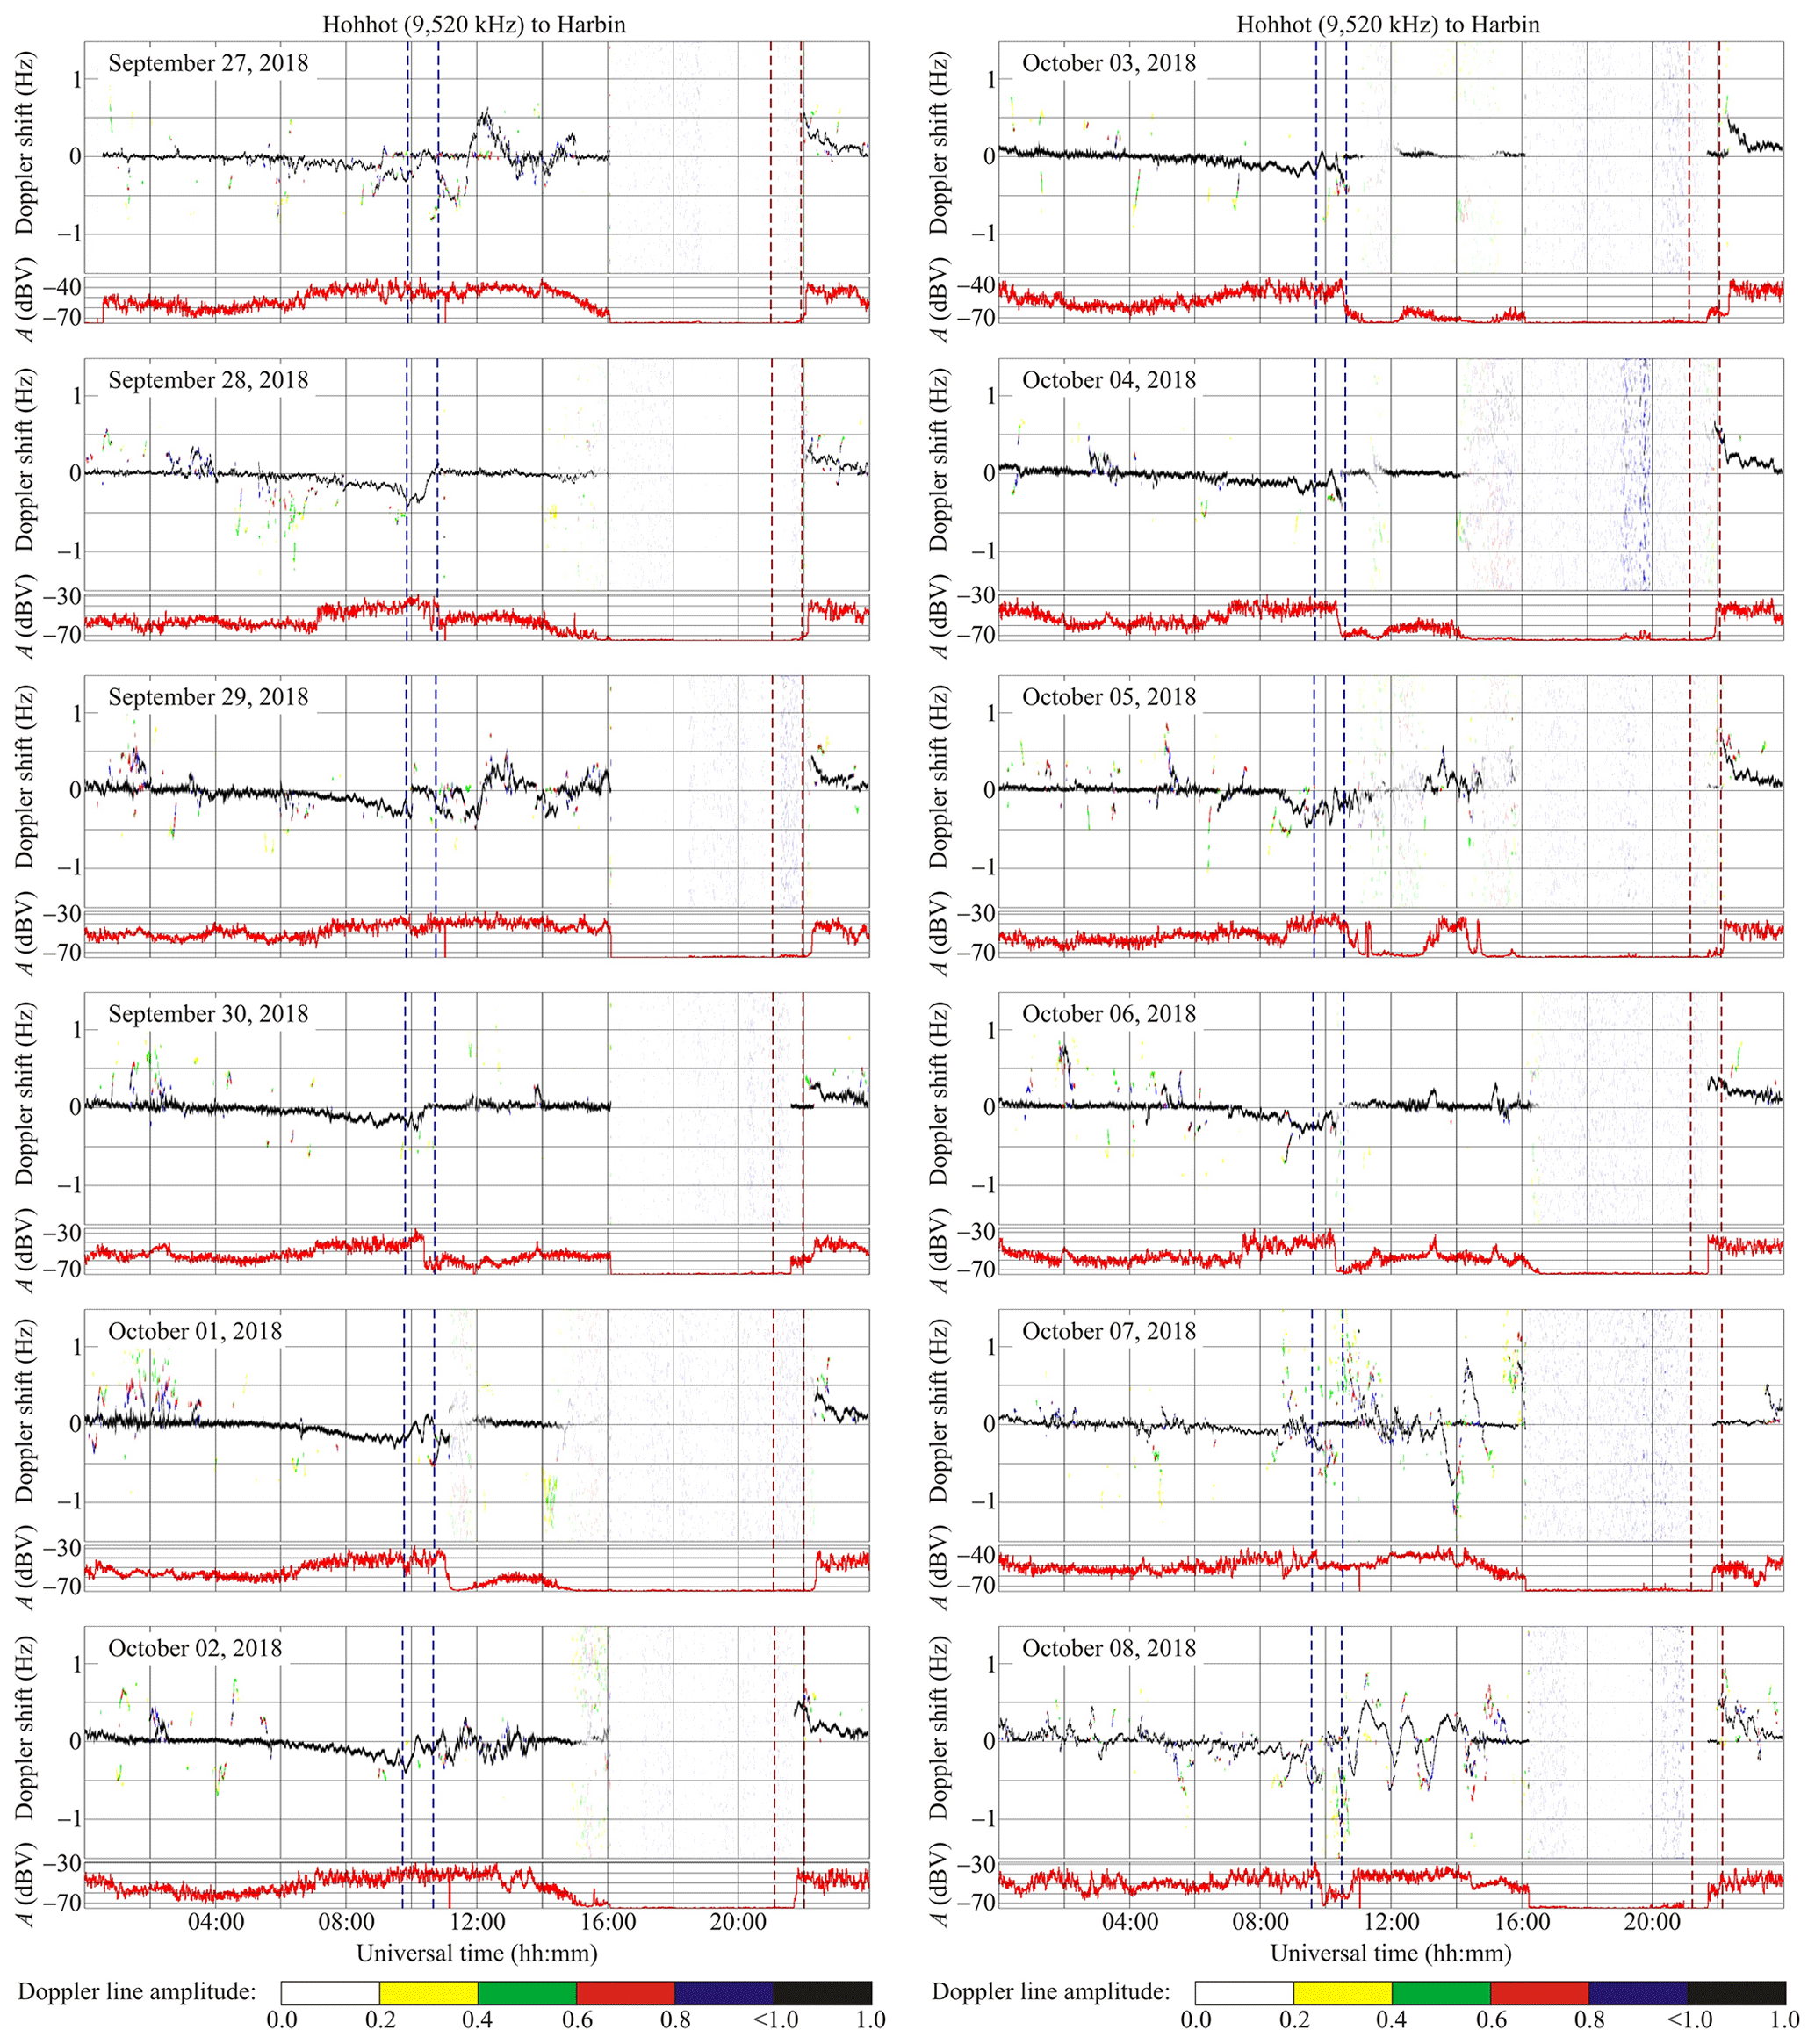
Figure 12Same as in Fig. 6 but for the Hohhot to Harbin radio-wave propagation path at 9520 kHz for the 27 September–2 October and 3–8 October 2018 periods.
The frequency of this radio wave became greater than the maximum usable frequency, and the radio wave penetrated the ionosphere during the second half of all nights (see Fig. 12). The received signal was absent, and the observation of the ionospheric dynamics became impossible. The Doppler spectra exhibited substantial variations (±0.5 Hz) on 29 September 2018, from 12:00 to 16:00 UT. On the night of 30 September 2018 UT, the reflection of radio waves took place from the sporadic E layer, resulting in fD(t)≈0 Hz, and, during the night of 1 October 2018 UT, the Doppler shift fD(t)≈0 Hz as well. On the night of 2 October 2018 UT, the Doppler shift showed changes from −0.3 to 0.3 Hz, while the signal amplitude exhibited considerable variability, up to 20 dBV. During the nights of 3–6 October 2018 UT, the measurements were ineffective, whereas fD(t)≈0 Hz during sunlit hours.
6.8 Yamata to Harbin radio-wave propagation path
This radio station operating at 9750 kHz is located in Japan at a great-circle range, R, of ∼1570 km. The transmitter was switched off from 16:00 to ∼22:00 UT.
A characteristic feature of these observations is that two signals were received, the Doppler shift of which were shifted by 1 Hz from 29 September through 3 October 2018 and by 0.5 Hz from 4 October through 6 October 2018, as can be seen in Fig. 13.
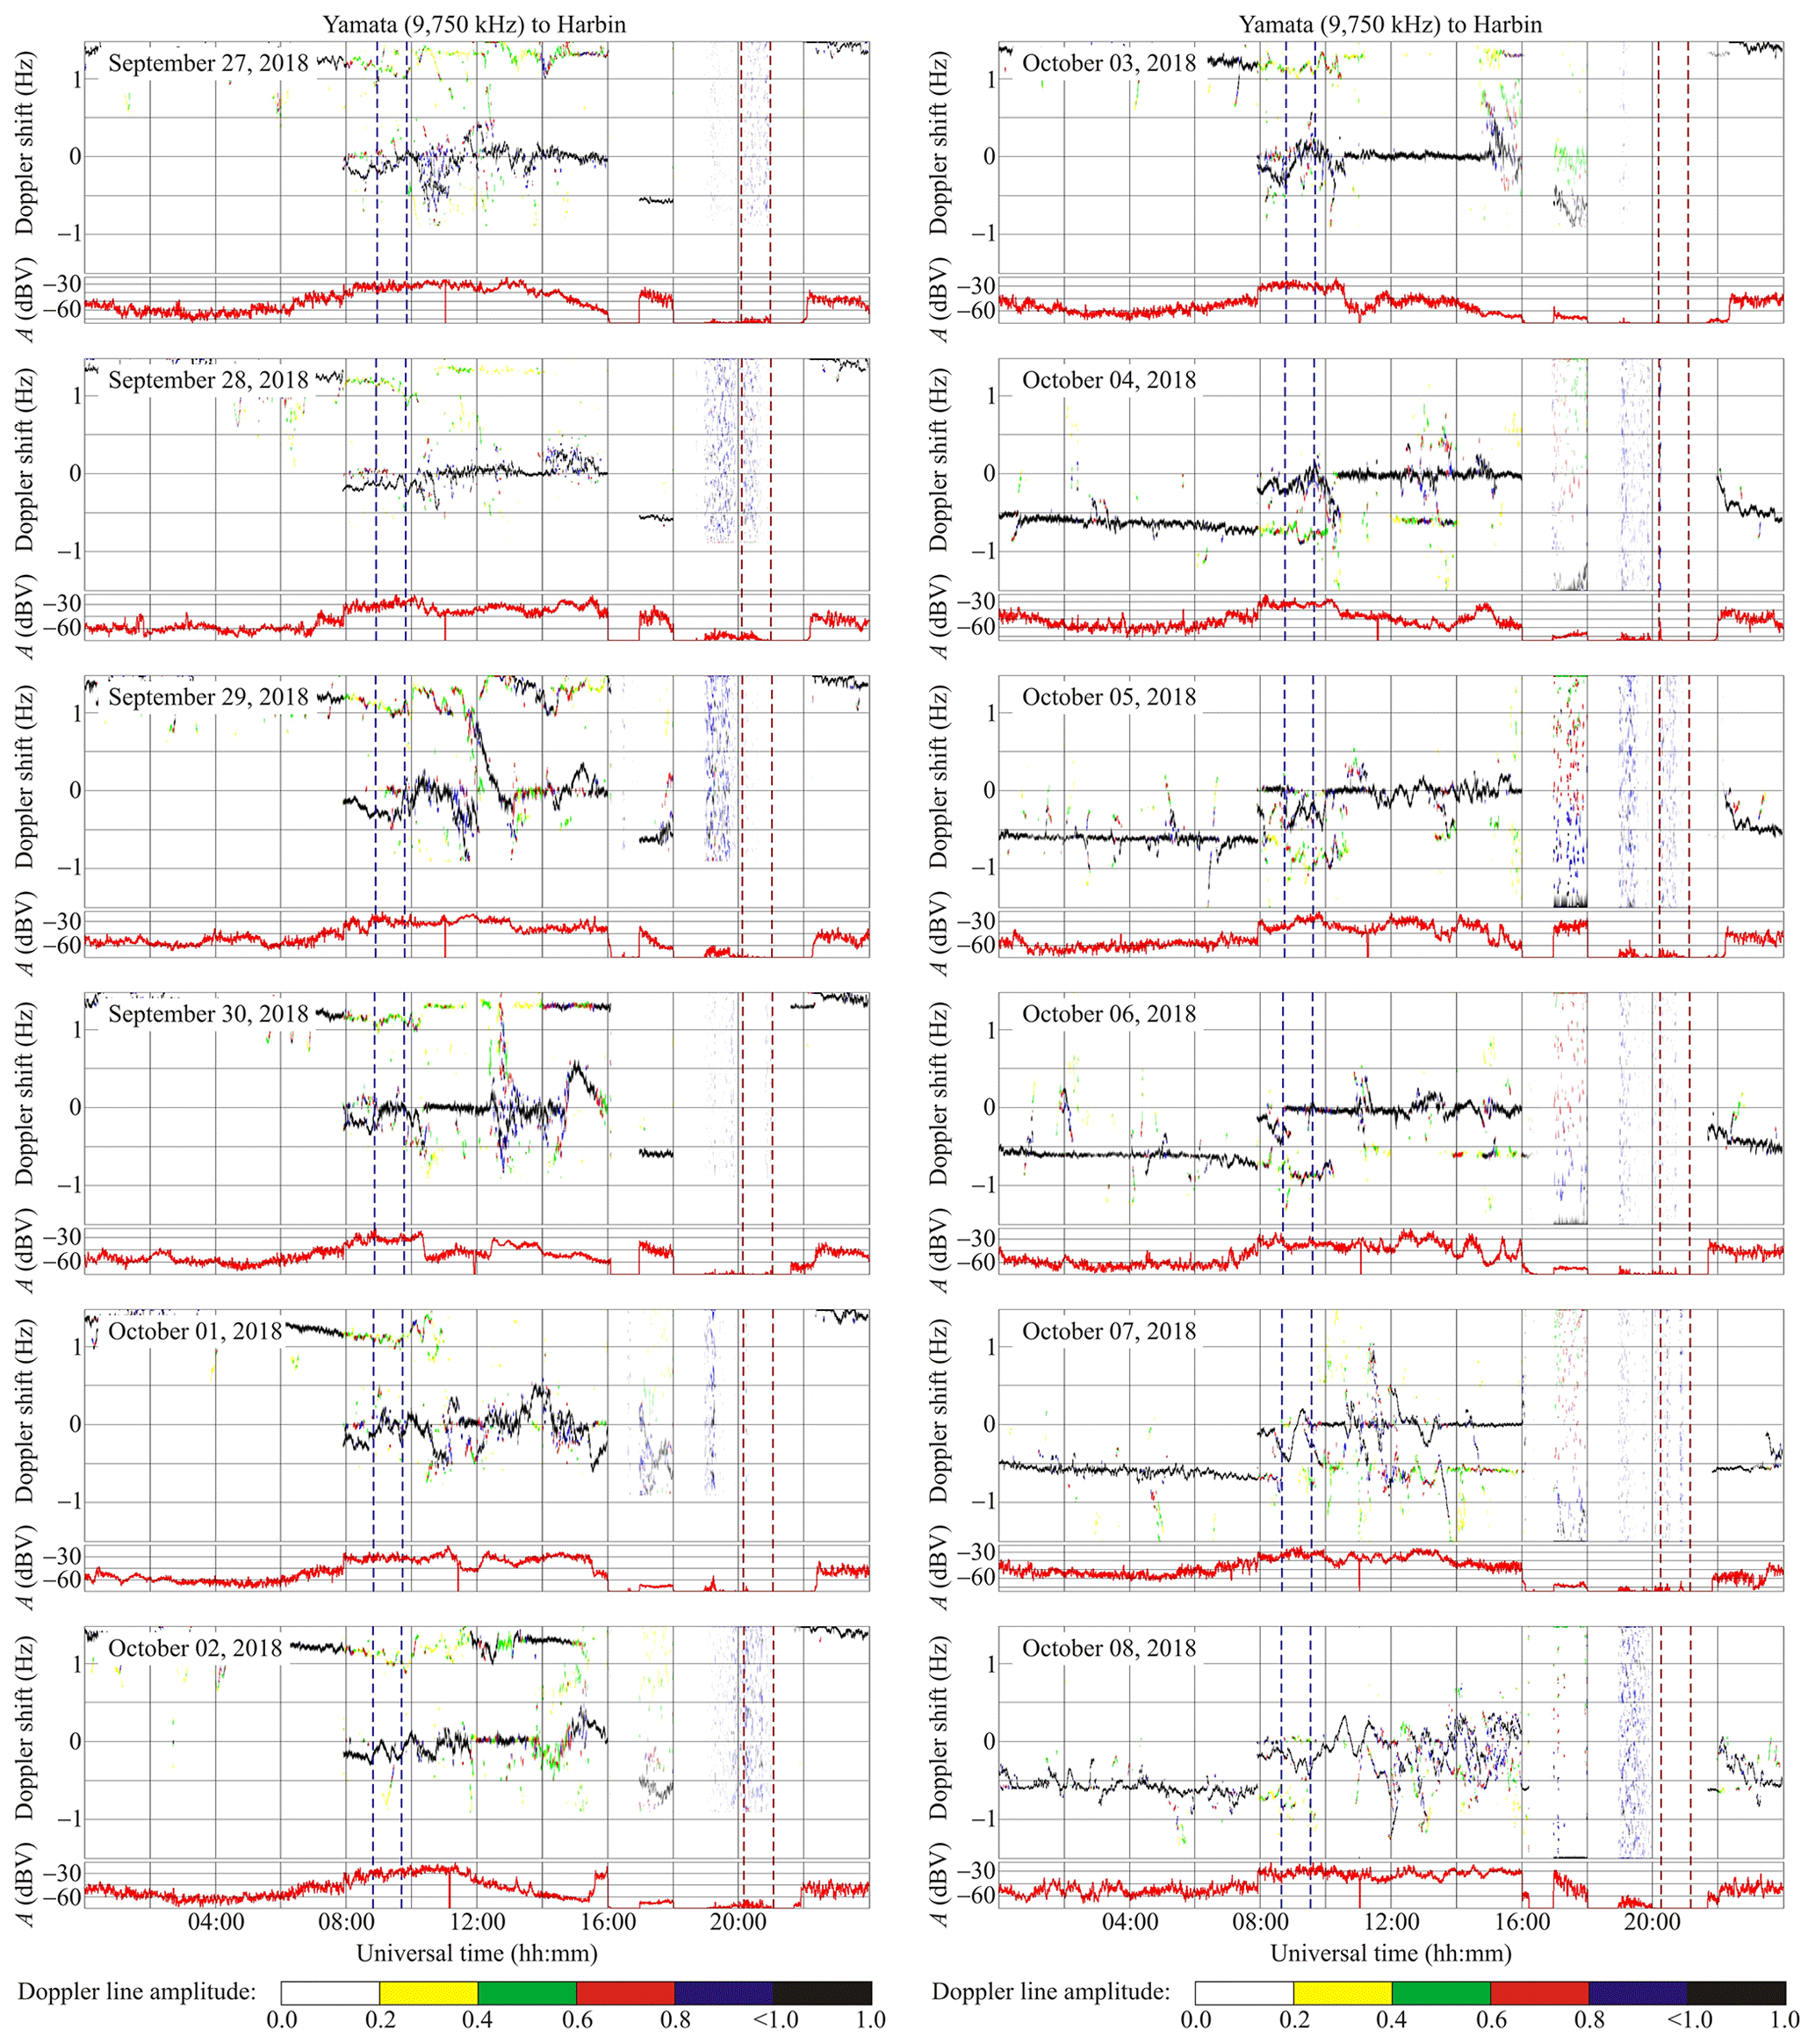
Figure 13Same as in Fig. 6 but for the Yamata to Harbin radio-wave propagation path at 9750 kHz for the 27 September–2 October and 3–8 October 2018 periods.
During all sunlit hours, the Doppler shift exhibited insignificant variations, whereas it became negative in the evening. The Doppler shift and the Doppler spectrum variations were observed to be significant (from −1 to 1 Hz) during the nights of 29 and 30 September 2018 UT. On 1 October 2018, the Doppler spectra exhibited diffuseness, while the signal amplitude A(t) variability was observed to attain 30 dBV. During the night of 2 October 2018 UT, the Doppler shift was observed to vary from −0.4 to 0.4 Hz, while the variations in A(t) also attained 30 dBV. The Doppler spectra and the Doppler shift showed insignificant temporal variability on 3 and 4 October 2018; at the same time the signal amplitude exhibited 20–30 dBV variations.
On 5 and 6 October 2018, the magnitude of the Doppler shift variations attained ±0.2 Hz, while the signal amplitude exhibited considerable changes in amplitude, up to 30 dBV.
7.1 Ionospheric effects from the super typhoon
The Doppler spectra and the Doppler shift observed during sunlit hours exhibited insignificant temporal variability through the course of the typhoon activity, since the radio waves in the ∼6–10 MHz band were reflected from the ionospheric E region or from the sporadic E. At night, the radio waves were reflected from the ionospheric F region, and the Doppler shift was observed to reach maximum values of up to 0.5–1 Hz. The temporal variations in the Doppler shift were also generated by the movement of the solar terminator.
The diurnal variations in the signal amplitude A(t) were observed to attain 30 dBV, while A(t) at night was 3 orders of magnitude greater than A(t) during the daytime, which is due to the disappearance of the absorbing D region.
In order to find out that the observed Doppler shift variations are associated with the typhoon, the Doppler variations were low-pass-filtered, and the Doppler variations, with periods of greater than 40 min, were found to occur during the 2 October 2018 10:00–14:00 UT period, along all propagation paths. A characteristic feature, a fading, which could be traced in all temporal dependences of the identified Doppler variations, was selected for analyzing. The UT moments, t∗, when this feature arrived at each propagation path midpoint are presented in Table 4. At 12:00 UT on 2 October 2018, the typhoon center was located at (18.9∘ N, 131.2∘ E) at the distances d from the propagation path midpoints, with the midpoint of the 9.750 MHz propagation path being closest (2492 km) to the typhoon center, while other midpoints were found to be at (2492+Δd) km ranges, where the characteristic feature arrived with time delays of Δt with respect to the arrival time at the 9.750 MHz midpoint. As can be seen in Table 4, the Δd and Δt yield the values of the apparent speeds, v, quite close to each other. These estimates testify to the adequacy of the assumption that the propagation of the disturbances from the typhoon is the cause of the observed Doppler shift variations. The mean value of the speed of the strongest period component, 60–70 min, estimated to be 205±6 m s−1, corresponds to a TID with a wavelength equal to approximately 800 km. Taking a look at the Kong-rey trajectory in Fig. 1a, one can notice that the TIDs traveled northwestward in this case, contrary to the southwestward direction observed in this area of the world in the climatological study by Shiokawa et al. (2003).
Table 4Distances d over which TIDs traveled at apparent speeds v and arrived at the propagation pass midpoints from the center of Typhoon Kong-rey with relative time delays Δt at the UT moments t∗.

The ionospheric effects from Typhoon Kong-rey are discussed further below. Typhoon Kong-rey's power gained a maximum value during the second half of 1 October 2018, and, consequently, the Doppler shift and the Doppler spectra showed the greatest variations during the night of 1 October 2018 UT, despite the propagation path midpoints being located ∼2800–3300 km away from the super typhoon. As should be expected, the greatest effects were observed to occur at the propagation path midpoints located closest to the typhoon, i.e., in the signals transmitted from the radio stations at Chiba/Nagara, Goyang, Yamata (Japan), and Hwaseong (Republic of Korea). At the same time, the ionospheric effects from Typhoon Kong-rey were absent along the Hohhot to Harbin radio-wave propagation path located at the farthest range to the typhoon on 1 October 2018.
On 2 October 2018, Typhoon Kong-rey moved closer to the propagation path midpoints by only ∼600 km; however, its power reduced by a factor of approximately 2 during the night. As a result, the ionospheric response to the typhoon activity reduced noticeably, and the ionospheric effects were either weak or absent during the daytime of 2 October 2018, as well as during sunlit hours on 3 and 4 October 2018.
Figure 1a shows that a surge in the typhoon's power (marked in red) appeared during the time interval between noon of 5 and 6 October 2018, when the typhoon and the propagation path midpoints were apart by distances of ∼1000–1500 km. Consequently, increases in the amplitude of Doppler shift and, partly, in the signal amplitude variations were observed to occur on 5 October 2018 as well as along a number of propagation paths on 6 October 2018 despite the typhoon's power being reduced by a factor of ∼3, as compared to that observed on 1 October 2018.
7.2 Wavelike disturbances
Wavelike disturbances in the ionosphere can be seen even on 29 and 30 September 2018, whereas on 1–2 and 5–6 October 2018, a noticeable increase (by a factor of ∼2–3) in the amplitude of the Doppler shift and in the signal amplitude variations, in a number of cases, was observed to occur. Based on the periods (from 20 to 120 min), the wavelike disturbances in the ionosphere are caused by atmospheric gravity waves (Gossard and Hooke, 1975).
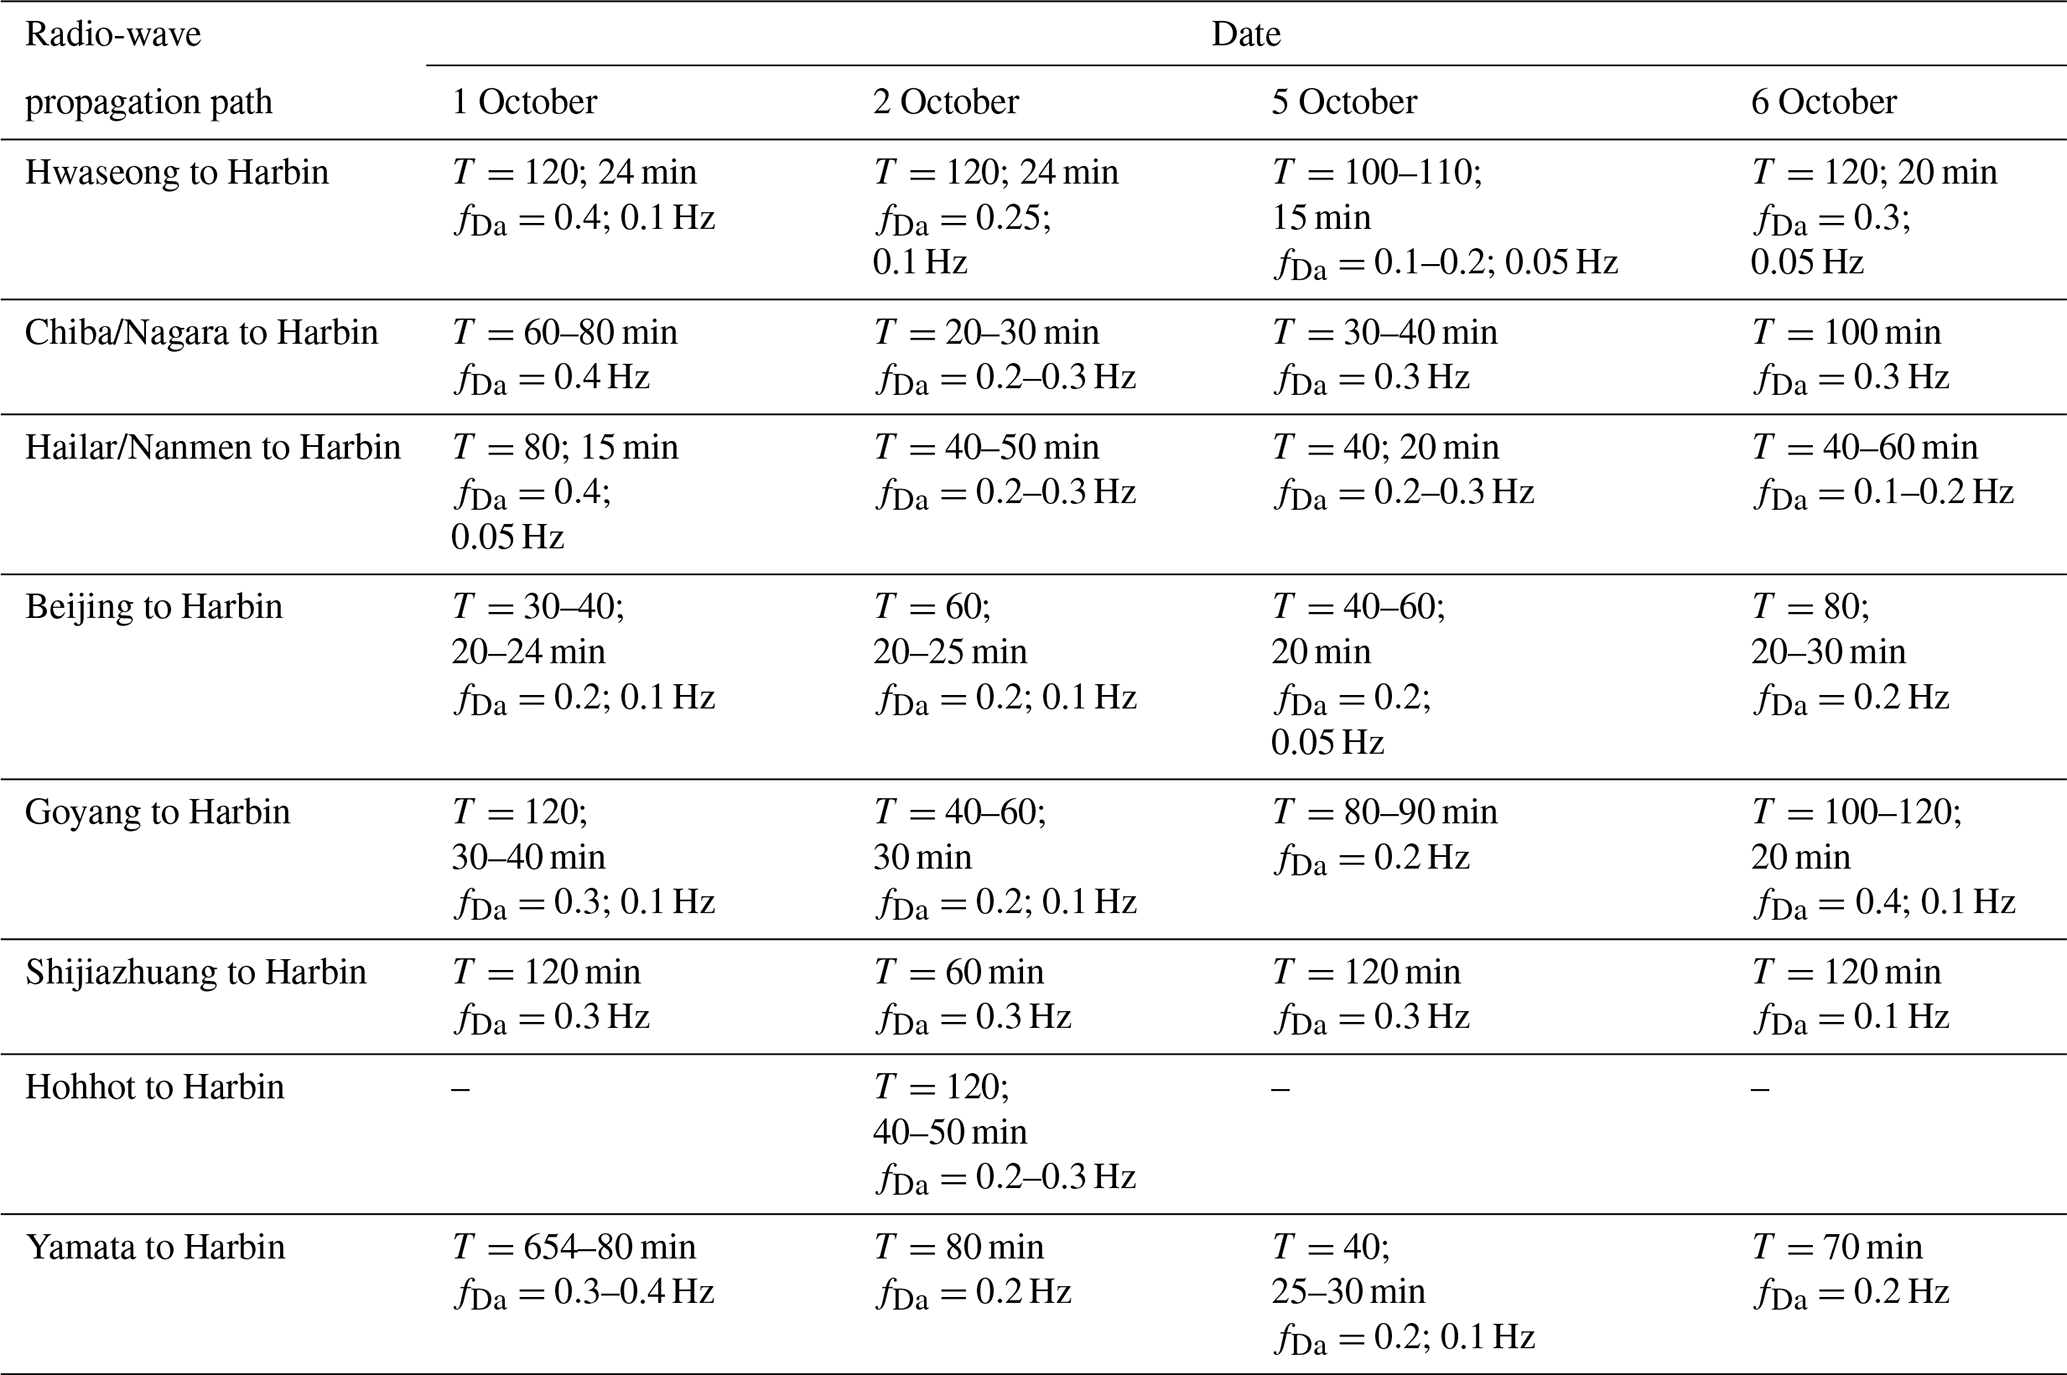
The basic parameters of wave disturbances associated with the activity of Typhoon Kong-rey are presented in Table 5.
Given known fDa and T, the amplitude, δNa, of quasi-sinusoidal variations in the electron density can be estimated on a relative scale. To do this, one can use the following equation (Chernogor et al., 2020; Guo et al., 2020):
where
Here, c is the speed of light, θ is the angle of incidence with respect to the vertical at the basis of the ionosphere, z0 is the altitude of the beginning of the layer giving a contribution to the Doppler shift, zr is the altitude of reflection, r0 is the mean Earth's radius, and L is the thickness of the atmospheric region giving a contribution to the Doppler shift.
Substituting T≈20 min and fDa≈0.1 Hz in Eq. (1) and taking into account Eq. (2) yields δNa≈0.4 %. If T≈30 min and fDa≈0.2 Hz, then δNa≈1.2 %. Also, T≈60 min and fDa≈0.5 Hz give δNa≈6 %. Thus, the super-typhoon activity in the ionosphere leads to an increase in the amplitude of variations in the electron density, depending on the period of quasi-sinusoidal disturbances, by a fraction to several per cent.
In addition, the amplitude of quasi-sinusoidal variations in the Doppler shift is observed to increase along many propagation paths under the joint activity of the super typhoon and dusk terminator passing by. Consequently, the synergistic activity of the dusk terminator and typhoons takes place in the ionosphere. An effect analogous to the one mentioned above was observed earlier by Edemsky and Yasyukevich (2018), who made use of GPS technology for probing wave disturbances. During the dawn terminator, such an effect is not reliably observed.
7.3 Comparison of ionospheric effects from typhoons
A multifrequency multiple-path coherent software-defined radio system developed at the Harbin Engineering University has been in routine use for several years for determining variations in ionospheric parameters and in radio-wave characteristics in the 5–10 MHz band, which accompanied the movement of super typhoons Hagibis (Chernogor et al., 2021), Lingling and Faxai (Chernogor et al., 2022), Lekima (Zheng et al., 2022), and Kong-rey, etc. The response of the ionosphere to typhoon activity has been shown to be dependent not only on the parameters of typhoons but also on the state of atmospheric and space weather, local time, and other geophysical parameters. Not only are common manifestations found in the response but also individual manifestations that are characteristic of a particular super typhoon. The common manifestations include (1) the aperiodic (chaotic) character of the ionospheric response; (2) the magnitude of the response showing an apparent abatement with increasing distance between the typhoon and the propagation path midpoints; (3) the response exhibiting a maximum with distance (between the typhoon and the propagation path midpoint) approaching a minimum; (4) the Doppler shift spectrum broadening up to ±1 Hz due to an increase in the number of rays; (5) the occurrence of quasi-sinusoidal variations in the Doppler shift, with amplitudes of ∼0.1–0.5 Hz and periods of 2–5 and 10–100 min; (6) the generation or enhancement of infrasound (periods, T, of ∼2–5 min) and atmospheric gravity waves (periods, T, of ∼10–100 min); (7) disturbances of the electron density amplitudes in these wave fields attaining ∼1 % and ∼10 %, respectively, and greater; and (8) aperiodic perturbations (for the most part, increases) in the electron density that could attain a few tens of per cent.
The instrument created by the authors of this paper permitted the confirmation of only one mechanism of affecting the ionosphere with a typhoon, i.e., the acoustic–atmospheric gravity waves. To reveal electromagnetic and electric mechanisms, one should employ other instruments.
-
The Harbin Engineering University multifrequency multiple-path coherent software-defined radio system for probing the ionosphere at oblique incidence has been used to detect the ionospheric effects over the People's Republic of China during the 27 September to 8 October 2018 period, encompassing the super-typhoon event, Typhoon Kong-rey. The movement of the super typhoon was accompanied by significant variations in radio-wave characteristics in the 5–10 MHz band.
-
The ionospheric response to the super-typhoon activity was clearly observed to occur on 1–2 October 2018 when the typhoon was 2800–3300 km away from the propagation path midpoints and Typhoon Kong-rey's energy gained a maximum value and on 5–6 October 2018 when the typhoon was 1000–1500 km away from the midpoints and its energy decreased by a factor of approximately 3.
-
The ionospheric effects are more pronounced along the nearest propagation paths, whereas no effect is detected along the propagation path at the greatest distance from the typhoon.
-
The super-typhoon activity on the ionosphere was accompanied by the generation or amplification of quasi-sinusoidal variations in the Doppler shift by a factor of 2–3, as well as by noticeable variations in the signal amplitude. The Doppler spectra were observed to broaden in a number of cases.
-
The period of wave perturbations exhibited variability in the ∼20 to ∼120 min range. This meant that the perturbations in the ionospheric electron density were caused by atmospheric gravity waves (AGWs) generated by the typhoon: the greater the AGW period, the greater the Doppler shift. As the period increased from 20 to 120 min, the Doppler shift amplitudes increased from ∼0.1 to 0.5–1 Hz.
-
As the AGW period increases from 20 to 60 min, the amplitude of quasi-sinusoidal variations in the electron density increases from 0.4 % to 6 %.
-
The most important mechanism affecting the ionosphere has been confirmed to be associated with the generation of the 20–120 min period AGW by the typhoon.
-
The Doppler measurements have shown that dusk terminators and the super typhoon acted synergistically to amplify the ionospheric response to these sources of energy.
Software for passive 14-channel Doppler radar may be obtained from the website at https://doi.org/10.7910/DVN/MTGAVH (Garmash, 2021).
The data sets discussed in this paper may be obtained from the website at https://doi.org/10.7910/DVN/VHY0L2 (Garmash, 2022).
LFC: conceptualization; QG and KPG: data curation; YZ, LFC, KPG, QG, and VTR: formal analysis; QG: funding acquisition; QG and KPG: investigation; LFC: methodology; QG: project administration; QG: resources; KPG: software; LFC: supervision; LFC, KPG, QG, VTR, and YZ: validation; KGP, YZL: visualization; LFC, KG, QG, VTR, and YZ: writing – original draft; LFC, KPG, QG, VTR, and YZ: writing – review and editing.
The contact author has declared that none of the authors has any competing interests.
Publisher' note: Copernicus Publications remains neutral with regard to jurisdictional claims in published maps and institutional affiliations.
This article makes use of data on Typhoon 201825 (Kong-rey) recorded by the Japan Meteorological Agency and published at http://agora.ex.nii.ac.jp/digital-typhoon/summary/wnp/s/201825.html.en (last access: 18 March 2023). The solar wind parameters were retrieved from the Goddard Space Flight Center Space Physics Data Facility https://omniweb.gsfc.nasa.gov/form/dx1.html (last access: 18 March 2023). This research also draws upon data provided by the WK546 URSI code ionosonde in the city of Wakkanai (45.16∘ N, 141.75∘ E), Japan (https://wdc.nict.go.jp/IONO/HP2009/contents/Ionosonde_Map_E.html, last access: 18 March 2023). Ionosonde data are retrieved from http://wdc.nict.go.jp/IONO/HP2009/ISDJ/index-E.html (last access: 18 March 2023). Work by Qiang Guo and Yu Zheng was supported by the National Key R&D Plan Strategic International Science and Technology Cooperation and Innovation (2018YFE0206500). Work by Leonid F. Chernogor was financially supported by the National Research Foundation of Ukraine (project 2020.02/0015, “Theoretical and experimental studies of global disturbances from natural and technogenic sources in the Earth-atmosphere-ionosphere system”).
The work of Qiang Guo and Yu Zheng has been supported by the National Key R & D Program's plan for strategic international science and technology cooperation and innovation (grant no. 2018YFE0206500). The work of Leonid Chernogor has been supported by the National Research Foundation of Ukraine (grant no. 2020.02/0015; “Theoretical and experimental studies of global disturbances from natural and technogenic sources in the Earth-atmosphere-ionosphere system”). The work of Leonid Chernogor and Victor Rozumenko has been supported by a Ukraine state-funded research project (grant no. 0121U109881), and the work of Kostiantyn Garmash has been supported by a Ukraine state-funded research project (grant no. 0121U109882).
This paper was edited by Ana G. Elias and reviewed by Igo Paulino and one anonymous referee.
Afraimovich, E. L., Voeykov, S. V., Ishin, A.B., Perevalova, N. P., and Ruzhin, Y. Y.: Variations in the total electron content during the powerful typhoon of August 5–11, 2006, near the southeastern coast of China, Geomag. Aeron., 48, 674–679, https://doi.org/10.1134/S0016793208050113, 2008.
Bortnik, J., Inan, U. S., and Bell, T. F.: Temporal signatures of radiation belt electron precipitation induced by lightning-generated MR whistler waves: 1. Methodology, J. Geophys. Res., 111, A02204, https://doi.org/10.1029/2005JA011182, 2006.
Boška, J. and Šauli, P.: Observations of gravity waves of meteorological origin in the F-region ionosphere, Phys. Chem. Earth, 26, 425–428, https://doi.org/10.1016/S1464-1917(01)00024-1, 2001.
Chen, J., Zhang, X., Ren, X., Zhang, J., Freeshah, M., and Zhao, Z.: Ionospheric disturbances detected during a typhoon based on GNSS phase observations: a case study for typhoon Mangkhut over Hong Kong, Adv. Space Res., 66, 1743–1753, https://doi.org/10.1016/j.asr.2020.06.006, 2020.
Chernigovskaya, M. A., Shpynev, B. G., and Ratovsky, K. G.: Meteorological effects of ionospheric disturbances from vertical radio sounding data, J. Atmos. Solar-Terr. Phys., 136, 235–243, https://doi.org/10.1016/j.jastp.2015.07.006, 2015.
Chernogor, L. F.: The tropical cyclone as an element of the Earth – atmosphere – ionosphere – magnetosphere system (in Russian), Space Sci. Tech., 12, 16–26, https://doi.org/10.15407/knit2006.02.016, 2006.
Chernogor, L. F.: Advanced Methods of Spectral Analysis of Quasiperiodic Wave-Like Processes in the Ionosphere: Specific Features and Experimental Results, Geomag. Aeron., 48, 652–673, https://doi.org/10.1134/S0016793208050101, 2008.
Chernogor, L. F.: Physics and Ecology of Disasters (in Russian), V. N. Karazin Kharkiv National University Publ., Kharkiv, Ukraine, ISBN 978-966-623-807-1, 2012.
Chernogor, L. F., Garmash, K. P., Guo, Q., Luo, Y., Rozumenko, V. T., and Zheng, Y.: Ionospheric storm effects over the People's Republic of China on 14 May 2019: Results from multipath multi-frequency oblique radio sounding, Adv. Space Res., 66, 226–242, https://doi.org/10.1016/j.asr.2020.03.037, 2020.
Chernogor, L. F., Garmash, K. P., Guo, Q., Rozumenko, V. T., Zheng, Y., and Luo, Y.: Supertyphoon Hagibis action in the ionosphere on 6–13 October 2019: Results from multi-frequency multiple path sounding at oblique incidence, Adv. Space Res., 67, 2439–2469, https://doi.org/10.1016/j.asr.2021.01.038, 2021.
Chernogor, L. F., Garmash, K. P., Guo, Q., Rozumenko, V. T., Zheng, Y., and Luo, Y.: Disturbances in the ionosphere that accompanied typhoon activity in the vicinity of China in September 2019, Radio Sci., 57, e2022RS007431, https://doi.org/10.1029/2022RS007431, 2022.
Chou, M. Y., Lin, C. C. H., Yue, J., Tsai, H. F., Sun, Y. Y., Liu, J. Y., and Chen, C. H.: Concentric traveling ionosphere disturbances triggered by Super Typhoon Meranti (2016), Geophys. Res. Let., 44, 1219–1226, https://doi.org/10.1002/2016GL072205, 2017.
Chum, J., Liu, J.-Y., Šindelářová, K., and Podolská, T.: Infrasound in the ionosphere from earthquakes and typhoons, J. Atmos. Sol.-Terr. Phys., 171, 72–82, https://doi.org/10.1016/j.jastp.2017.07.022, 2018.
Das, B., Sarkar, S., Haldar, P. K., Midya, S. K., and Pal, S.: D-region ionospheric disturbances associated with the Extremely Severe Cyclone Fani over North Indian Ocean as observed from two tropical VLF stations, Adv. Space Res., 67, 75–86, https://doi.org/10.1016/j.asr.2020.09.018, 2021.
Drobyazko, I. N. and Krasil'nikov, V. N.: Generation of acoustic-gravity waves by atmospheric turbulence, Radiophys. Quant. El+, 28, 946–952, https://doi.org/10.1007/bf01040717, 1985.
Edemsky, I. K. and Yasyukevich, A. S.: Observing wave packets generated by solar terminator in TEC during typhoons, Solar-Terr. Phys., 4, 33–40, https://doi.org/10.12737/szf-42201806, 2018.
Fišer, J., Chum, J., and Liu, J.-Y.: Medium-scale traveling ionospheric disturbances over Taiwan observed with HF Doppler sounding, Earth, Planet. Space., 69, 131, https://doi.org/10.1186/s40623-017-0719-y, 2017.
Freeshah, M., Zhang, X., Şentürk, E., Adil, M. A., Mousa, B. G., Tariq, A., Ren, X., and Refaat, M.: Analysis of Atmospheric and Ionospheric Variations Due to Impacts of Super Typhoon Mangkhut (1822) in the Northwest Pacific Ocean, Remote Sens., 13, 661, https://doi.org/10.3390/rs13040661, 2021.
Frissell, N. A., Baker, J. B. H., Ruohoniemi, J. M., Gerrard, A. J., Miller, E. S., Marini, J. P., West, M. L., and Bristow, W. A.: Climatology of medium-scale traveling ionospheric disturbances observed by the midlatitude Blackstone SuperDARN radar, J. Geophys. Res., 119, 7679–7697, https://doi.org/10.1002/2014JA019870, 2014.
Fukushima, D., Shiokawa, K., Otsuka, Y., and Ogawa, T.: Observation of equatorial nighttime medium-scale traveling ionospheric disturbances in 630-nm airglow images over 7 years, J. Geophys. Res., 117, A10324, https://doi.org/10.1029/2012JA017758, 2012.
Garmash, K.: Software for Passive 14-Channel Doppler Radar, Harvard Dataverse, V1, https://doi.org/10.7910/DVN/MTGAVH, 2021.
Garmash, K.: RAW Data on Parameters of Ionospheric HF Radio Waves Propagated Over China During the September 29–6 October 2018 Typhoon Activity in the Vicinity of China, Harvard Dataverse, https://doi.org/10.7910/DVN/VHY0L2, 2022.
Gavrilov, N. M. and Kshevetskii, S. P.: Dynamical and thermal effects of nonsteady nonlinear acoustic-gravity waves propagating from tropospheric sources to the upper atmosphere, Adv. Space Res., 56, 1833–1843, https://doi.org/10.1016/j.asr.2015.01.033, 2015.
Gossard, E. E. and Hooke, W. H.: Waves in the Atmosphere: Atmospheric Infrasound and Gravity Waves, Their Generation and Propagation, Elsevier Scientific Publ. Co., Amsterdam, Netherlands, ISBN-10 0444411968, 1975.
Guo, Q., Zheng, Y., Chernogor, L. F., Garmash, K. P., and Rozumenko, V. T.: Ionospheric processes observed with the passive oblique-incidence HF Doppler radar, Visnyk of V.N. Karazin Kharkiv National University, series “Radio Physics and Electronics”, 30, 3–15, https://doi.org/10.26565/2311-0872-2019-30-01, 2019a.
Guo, Q., Chernogor, L. F., Garmash, K. P., Rozumenko, V. T., and Zheng, Y.: Dynamical processes in the ionosphere following the moderate earthquake in Japan on 7 July 2018, J. Atmos. Solar-Terr. Phys., 186, 88–103, https://doi.org/10.1016/j.jastp.2019.02.003, 2019b.
Guo, Q., Chernogor, L. F., Garmash, K. P., Rozumenko, V. T., and Zheng, Y.: Radio Monitoring of Dynamic Processes in the Ionosphere Over China During the Partial Solar Eclipse of 11 August 2018, Radio Sci., 55, e2019RS006866, https://doi.org/10.1029/2019RS006866, 2020.
Hickey, M. P., Schubert, G., and Walterscheid, R. L.: Acoustic wave heating of the thermosphere, J. Geophys. Res., 106, 21543–21548, https://doi.org/10.1029/2001JA000036, 2001.
Hickey, M. P., Walterscheid, R. L., and Schubert, G.: Gravity wave heating and cooling of the thermosphere: Roles of the sensible heat flux and viscous flux of kinetic energy, J. Geophys. Res., 116, A12326, https://doi.org/10.1029/2011JA016792, 2011.
Hung, R. J. and Kuo, J. P.: Ionospheric observation of gravity-waves associated with Hurricane Eloise, J. Geophys., 45, 67–80, https://journal.geophysicsjournal.com/JofG/article/view/173, 1978.
Hocke, K. and Schlegel, K.: A review of atmospheric gravity waves and travelling ionospheric disturbances: 1982–1995, Ann. Geophys., 14, 917–940, https://doi.org/10.1007/s00585-996-0917-6, 1996.
Inan, U., Piddyachiy, D., Peter, W., Sauvaud, J., and Parrot, M.: DEMETER satellite observations of lightning-induced electron precipitation, Geophys. Res. Lett., 34, L07103, https://doi.org/10.1029/2006GL029238, 2007.
Isaev, N. V., Sorokin, V. M., Chmyrev, V. M., and Serebryakova, O. N.: Ionospheric electric fields related to sea storms and typhoons, Geomag. Aeron., 42, 638–643, 2002.
Isaev, N. V., Kostin, V. M., Belyaev, G. G., Ovcharenko, O. Y., and Trushkina, E. P.: Disturbances of the topside ionosphere caused by typhoons, Geomag. Aeron., 50, 243–255, https://doi.org/10.1134/S001679321002012X, 2010.
Karpov, I. V. and Kshevetskii, S. P.: Numerical study of heating the upper atmosphere by acoustic-gravity waves from local source on the Earth's surface and influence of this heating on the wave propagation conditions, J. Atmos. Solar-Terr. Phys., 164, 89–96, https://doi.org/10.1016/j.jastp.2017.07.019, 2017.
Ke, F. Y., Qi, X. M., Wang, Y., and Liu, X. W.: Statistics of ionospheric responses to Southeast Asia's typhoons during 2006–2018 using the rate of change in the TEC index, Adv. Space Res., 66, 1724–1742, https://doi.org/10.1016/j.asr.2020.06.003, 2020.
Kong, J., Yao, Y., Xu, Y., Kuo, C., Zhang, L., Liu, L., and Zhai, C.: A clear link connecting the troposphere and ionosphere: ionospheric reponses to the 2015 Typhoon Dujuan, J. Geod., 91, 1087–1097, https://doi.org/10.1007/s00190-017-1011-4, 2017.
Krishnam Raju, D. G., Rao, M. S., Rao, B. M., Jogulu, C., Rao, C. P., and Ramanadham, R.: Infrasonic oscillations in the F2 region associated with severe thunderstorms, J. Geophys. Res., 86, 5873–5880, https://doi.org/10.1029/JA086iA07p05873, 1981.
Kubota, M., Shiokawa, K., Ejiri, M. K., Otsuka, Y., Ogawa, T., Sakanoi, T., Fukunishi, H., Yamamoto, M., Fukao, S., Saito, A.: Traveling ionospheric disturbances observed in the OI 630-nm nightglow images over Japan by using a Multipoint Imager Network during the FRONT Campaign, Geophys. Res. Lett., 27, 4037–4040, https://doi.org/10.1029/2000GL011858, 2000.
Kuester, M. A., Alexander, M. J., and Ray, E. A.: A model study of gravity waves over Hurricane Humberto (2001), J. Atmos. Sci., 65, 3231–3246, https://doi.org/10.1175/2008JAS2372.1, 2008.
Li, W., Yue, J., Yang, Y., Li, Z., Guo, J., Pan, Y., and Zhang, K.: Analysis of ionospheric disturbances associated with powerful cyclones in East Asia and North America, J. Atmos. Solar-Terr. Phys., 161, 43–54, https://doi.org/10.1016/j.jastp.2017.06.012, 2017.
Li, W., Yue, J., Wu, S., Yang, Y., Li, Z., Bi, J., and Zhang, K.: Ionospheric responses to typhoons in Australia during 2005–2014 using GNSS and FORMOSAT-3/COSMIC measurements, GPS Solut., 22, 61, https://doi.org/10.1007/s10291-018-0722-1, 2018. Luo, Y., Chernogor, L. F., Garmash, K. P., Guo, Q., Rozumenko, V. T., Shulga, S. N., and Zheng, Y.: Ionospheric effects of the Kamchatka meteoroid: Results from multipath oblique sounding, J. Atmos. Solar-Terr. Phys., 207, 105336, https://doi.org/10.1016/j.jastp.2020.105336, 2020.
Marple Jr., S. L.: Digital spectral analysis: with applications, Inc, Englewood Cliffs, Prentice-Hall, N. J., 492 pp., https://doi.org/10.1121/1.398548, 1987.
Mikhailova, G. A., Mikhailov, Yu. M., and Kapustina, O. V.: Variations of ULF-VLF electric fields in the external ionosphere over powerful typhoons in Pacific Ocean, Adv. Space Res., 30, 2613–2618, https://doi.org/10.1016/S0273-1177(02)80358-1, 2002.
Nickolaenko, A. P. and Hayakawa, M.: Heating of the lower ionosphere electrons by electromagnetic radiation of lightning discharges, Geophys. Res. Lett., 22, 3015–3018, https://doi.org/10.1029/95gl01982, 1995.
Okuzawa, T., Shibata, T., Ichinose, T., Takagi, K., Nagasawa, C., Nagano, I., Mambo, M., Tsutsui, M., and Ogawa, T.: Short-period disturbances in the ionosphere observed at the time of typhoons in September 1982 by a network of HF Doppler receivers, J. Geomag. Geoelectr., 38, 239–266, https://doi.org/10.5636/jgg.38.239, 1986.
Otsuka, Y., Tani, T., Tsugawa, T., Ogawa, T., and Saito, A.: Statistical study of relationship between medium-scale traveling ionospheric disturbance and sporadic E layer activities in summer night over Japan, J. Atmos. Solar-Terr. Phys., 70, 2196–2202, https://doi.org/10.1016/j.jastp.2008.07.008, 2008.
Paulino, I., Medeiros, A. F., Vadas, S. L., Wrasse, C. M., Takahashi, H., Buriti, R. A., Leite, D., Filgueira, S., Bageston, J. V., Sobral, J. H. A., and Gobbi, D.: Periodic waves in the lower thermosphere observed by OI630 nm airglow images, Ann. Geophys., 34, 293–301, https://doi.org/10.5194/angeo-34-293-2016, 2016.
Paulino, I., Moraes, J. F., Maranhão, G. L., Wrasse, C. M., Buriti, R. A., Medeiros, A. F., Paulino, A. R., Takahashi, H., Makela, J. J., Meriwether, J. W., and Campos, J. A. V.: Intrinsic parameters of periodic waves observed in the OI6300 airglow layer over the Brazilian equatorial region, Ann. Geophys., 36, 265–273, https://doi.org/10.5194/angeo-36-265-2018, 2018.
Perkins, F. W.: Spread F and ionospheric currents, J. Geophys. Res. 78, 218–226, https://doi.org/10.1029/JA078i001p00218, 1973
Polyakova, A. S. and Perevalova, N. P.: Investigation into impact of tropical cyclones on the ionosphere using GPS sounding and NCEP/NCAR reanalysis data, Adv. Space Res., 48, 1196–1210, https://doi.org/10.1016/j.asr.2011.06.014, 2011.
Polyakova, A. S. and Perevalova, N. P.: Comparative analysis of TEC disturbances over tropical cyclone zones in the north-west Pacific Ocean, Adv. Space Res., 52, 1416–1426, https://doi.org/10.1016/j.asr.2013.07.029, 2013.
Prasad, S. S., Schneck, L. J., and Davies, K.: Ionospheric disturbances by severe tropospheric weather storms, J. Atmos. Terr. Phys., 37, 1357–1363, https://doi.org/10.1016/0021-9169(75)90128-2, 1975.
Pulinets, S. and Davidenko, D.: Ionospheric precursors of earthquakes and global electric circuit, Adv. Space Res., 53, 709–723, https://doi.org/10.1016/j.asr.2013.12.035, 2014.
Shiokawa, K., Ihara, C., Otsuka, Y., and Ogawa, T.: Statistical study of nighttime medium-scale traveling ionospheric disturbances using midlatitude airglow images, J. Geophys. Res., 108, 1052, https://doi.org/10.1029/2002JA009491, 2003.
Šindelářova, T., Burešová, D., Chum, J., and Hruška, F.: Doppler observations of infrasonic waves of meteorological origin at ionospheric heights, Adv. Space Res., 43, 1644–1651, https://doi.org/10.1016/j.asr.2008.08.022, 2009.
Song, Q., Ding, F., Zhang, X., Liu, H., Mao, T., Zhao, X., and Wang, Y.: Medium-scale traveling ionospheric disturbances induced by Typhoon Chan-hom over China, J. Geophys. Res., 124, 2223–2237, https://doi.org/10.1029/2018JA026152, 2019.
Sorokin, V. M., Isaev, N. V., Yaschenko, A. K., Chmyrev, V. M., and Hayakawa, M.: Strong DC electric field formation in the low latitude ionosphere over typhoons, J. Atmos. Sol.-Terr. Phy., 67, 1269–1279, https://doi.org/10.1016/j.jastp.2005.06.014, 2005.
Suzuki, S., Vadas, S. L., Shiokawa, K., Otsuka, Y., Karwamura, S., and Murayama, Y.: Typoon-induced concentric airglow structures in the mesopause region, Geophys. Res. Lett., 40, 5983–5987, https://doi.org/10.1002/2013GL058087, 2013.
Vadas, S. L. and Crowley, G.: Sources of the traveling ionospheric disturbances observed by the ionospheric TIDDBIT sounder near Wallops Island on 30 October 2007, J. Geophys. Res., 115, A07324, https://doi.org/10.1029/2009JA015053, 2010.
Vadas, S. L., Fritts, D. C., and Alexander, M. J.: Mechanism for the Generation of Secondary Waves in Wave Breaking Regions, J. Atmos. Sci., 60, 194–214, 2003.
Vanina–Dart, L. B., Pokrovskaya, I. V., and Sharkov, E. A.: Studying the interaction between the lower equatorial ionosphere and tropical cyclones according to data of remote and rocket sounding, Izvestiya, Atmos. Ocean. Phys., 2, 19–27, 2007.
Voss, H. D., Imhof, W. L., Walt, M., Mobilia, J., Gaines, E. E., Reagan, J. B., Inan, U. S., Helliwell, R. A., Carpenter, D. L., Katsufrakis, J. P., and Chang, H. C.: Lightning-induced electron precipitation, Nature, 312, 740–742, https://doi.org/10.1038/312740a0, 1984.
Voss, H. D., Walt, M., Imhof, W. L., Mobilia, J., and Inan, U. S.: Satellite observations of lightning-induced electron precipitation, J. Geophys. Res., 103, 11725–11744, https://doi.org/10.1029/97JA02878, 1998.
Wen, Y. and Jin, S.: Traveling Ionospheric Disturbances Characteristics during the 2018 Typhoon Maria from GPS Observations, Remote Sens., 12, 746, https://doi.org/10.3390/rs12040746, 2020.
Xiao, Z., Xiao, S.-G., Hao, Y.-Q., and Zhang, D.-H.: Morphological features of ionospheric response to typhoon, J. Geophys. Res., 112, A04304, https://doi.org/10.1029/2006JA011671, 2007.
Yiğit, E., Knížová, P. K., Georgieva, K., and Ward, W.: A review of vertical coupling in the Atmosphere–Ionosphere system: Effects of waves, sudden stratospheric warmings, space weather, and of solar activity, J. Atmos. Sol.-Terr. Phy., 141, 1–12, https://doi.org/10.1016/j.jastp.2016.02.011, 2016.
Zakharov, V. I. and Kunitsyn, V. E.: Regional features of atmospheric manifestations of tropical cyclones according to ground-based GPS network data, Geomagn. Aeron., 52, 533–545, https://doi.org/10.1134/S0016793212040160, 2012.
Zakharov, V. I., Pilipenko, V. A., Grushin, V. A., and Khamidullin, A. F.: Impact of typhoon Vongfong 2014 on the Ionosphere and Geomagnetic Field According to Swarm Satellite Data: 1. Wave Disturbances of Ionospheric Plasma, Solar-Terr. Phys., 5, 101–108, https://doi.org10.12737/stp-52201914, 2019.
Zakharov, V. I. and Sigachev, P. K.: Ionospheric disturbances from tropical cyclones, Adv. Space Res., 69, 132–141, https://doi.org/10.1016/j.asr.2021.09.025, 2022.
Zhao, Y., Deng, Y., Wang, J.-S., Zhang, S.-R., and Lin, C. Y.: Tropical cyclone-induced gravity wave perturbations in the upper atmosphere: GITM-R simulations, J. Geophys. Res., 125, e2019JA027675, https://doi.org/10.1029/2019JA027675, 2020.
Zhao, Y. X., Mao, T., Wang, J. S., and Chen, Z.: The 2D features of tropical cyclone Usagi's effects on the ionospheric total electron content, Adv. Space Res., 62, 760–764, https://doi.org/10.1016/j.asr.2018.05.022, 2018.
Zheng, Y., Chernogor, L. F., Garmash, K. P., Guo, Q., Rozumenko, V. T., Luo, Y.: Disturbances in the ionosphere and distortion of radio wave characteristics that accompanied the super typhoon Lekima event of 4–12 August 2019, J. Geophys. Res., 127, e2022JA030553, https://doi.org/10.1029/2022JA030553, 2022.
- Abstract
- Introduction
- General information on Typhoon Kong-rey
- Analysis of the state of space weather
- Analysis of the state of the ionosphere
- Instrumentation and techniques
- Ionospheric results from oblique incidence sounding
- Discussion
- Conclusions
- Code availability
- Data availability
- Author contributions
- Competing interests
- Disclaimer
- Acknowledgements
- Financial support
- Review statement
- References