the Creative Commons Attribution 4.0 License.
the Creative Commons Attribution 4.0 License.
 | 31 Jan 2022
Snow cover variability and trend over the Hindu Kush Himalayan region using MODIS and SRTM data
Nirasindhu Desinayak
Hesham El-Askary
Menas Kafatos
Ghassem R. Asrar
Snow cover changes have a direct bearing on the regional and global energy and water cycles and the change in the Earth's climate conditions. We studied the relatively long-term (2000–2017) altitudinal spatiotemporal changes in the coverage of snow and glaciers in one of the world's largest mountainous regions, the Hindu Kush Himalayan (HKH) region, including Tibet, using remote sensing data (5 km grid resolution) from the Moderate Resolution Imaging Spectroradiometer (MODIS) on board the Terra satellite. This dataset provided a unique opportunity to study zonal and hypsographic changes in the intra-annual (accumulating season and melting season) and interannual variations in snow and glacial cover over the HKH region. The zonal and altitudinal (hypsographic) analyses were carried out for the melting season and accumulating season. The altitude-wise linear trend analysis (Pearson's) of snow cover, shown as a hypsographic curve, clearly indicates a major decline in snow cover (average of 5 % or more at 100 m interval aggregates) between 4000–4500 and 5500–6000 m altitudes, which is consistent with the median trend (Theil–Sen – TS) and the monotonic trend (Mann–Kendall – MK; statistics) analysis. This analysis also revealed the regions and altitudes where major and statistically significant increases (10 % to 30 %) or decreases (−10 % to −30 %) in snow cover are identified. The extrapolation of the altitude-wise linear trend shows that it may take between ∼ 74 and 7900 years, for 3001–6000 and 6000–7000 m altitude zones respectively, for mean snow cover to decline approximately 25 % in the HKH. More detailed analysis based on longer observational records and model simulations is warranted to better understand the underlying factors, processes, and feedbacks that affect the dynamic of snow cover in HKH. These preliminary results suggest a need for continued monitoring of this highly sensitive region to climate variability and change that depends on snow as a major source of freshwater for all human activities.
- Article
(13067 KB) - Full-text XML
- BibTeX
- EndNote


Understanding the impact of snow cover variability with respect to altitude and temperature in the Hindu Kush Himalayan region (HKH; Immerzeel et al., 2010; Shrestha et al., 2015) is of great importance for regional water availability and understanding of climate change in this highly populated region of the world. The meltwater from snow and ice contribute to all three rivers (Indus, Ganga, and Brahmaputra), with the highest meltwater fraction in the Indus and the lowest in the Ganga (Bookhagen and Burbank, 2010; Immerzeel et al., 2010; Siderius et al., 2013). The HKH region is projected to show a substantial loss of glacial mass and area in the coming decades (Bolch et al., 2012). The snow cover and glaciers of the high-altitude regions of HKH, including Tibet, are likely to be one of the regions most affected by the projected rise in global temperatures by about 1–2 ∘C on an average in this decade, which could be significantly higher (reaching 4–5 ∘C) in mountainous terrains (Bolch et al., 2012; Prasad et al., 2009; Shrestha et al., 1999). The assessment of glacier shrinkage over the high mountain regions of Himalaya and the Tibetan Plateau (1960 to 2010), based on a 0.5∘ grid resolution published data on glacier shrinkage, shows large uncertainties in the rate of shrinkage due to various factors (Cogley, 2016) such as rate of snowfall, accumulation, and melt.
Studies related to the elevation dependency of climate change recommends further research into this important aspect (Chen et al., 2021). Using vegetation data and derived parameters, Chen et al. (2021) investigated the elevation dependency of climate change in the Arctic, spanning five main Arctic mountain regions. With one exception, the study discovered significant elevation dependency of vegetation phenology using a moderate-resolution AVHRR (Advanced Very High Resolution Radiometer) time series from 1985 to 2013. The study found that the start of the growing season (SOS), the end of the growing season (EOS), and the length of the growing season (GSL) all changed more at higher elevations.
Snow cover variability is considered to be a direct indicator of regional and global climate change in the terrestrial domain (Frei et al., 2012; Shrestha et al., 2015). Snow cover and the change in its contribution to surface albedo are listed as essential climate variables (ECVs) by the Global Climate Observing System (GCOS). Long-term changes in the thinly snow-covered areas, especially in the mountainous region, affect the albedo and the global radiation budget. GCOS emphasizes that the study of snow cover changes is one of the priority areas that can be achieved using long-term satellite observations, especially in remote areas not accessible to any other types of measurement and monitoring. Snow cover fluctuations in HKH regions are highly variable temporally because of various types of controlling factors, including topographic effects, glacier dynamics, various types of geomorphological parameters (Shrestha et al., 2015), and, as of late, due to anthropogenic emissions of soot and other air pollutants (Gautam et al., 2013; Kang et al., 2019; Prasad et al., 2011). Data from CALIPSO (vertical profiles), MODIS, and photographs taken from aircraft show the impact of dust storms and anthropogenic pollution on the snow cover in the foothill regions reaching up to 4–6 km altitudes (Prasad et al., 2011). Data from global MODIS snow products at relatively coarser temporal and spatial resolutions (5 km; monthly) are also known as the climate-modeling grid (CMG) products (Hall et al., 2006). This snow cover product provides an opportunity for a rapid and quantitative examination of seasonal variability, altitude-wise variability, and temporal trends (both spatial and altitude-wise) over the Himalayan region.
1.1 Regional warming and decrease in snow cover
The Earth's mean temperature has increased by 0.85±0.2 ∘C from 1880 to 2012 (Pachauri, 2014). The temperature trends in Nepal (central Himalayas) for the period of 1971–1994 show continuous warming at an average rate of 0.06 ∘C per year, varying spatially and seasonally (Shrestha et al., 1999). In contrast, the global average surface temperature rise of the last century was 0.6±0.2 ∘C (IPCC, 2007). Regional warming is affecting the mountain region's hydrology due to accelerated cryosphere thawing (Tang and Wang, 2014). Many glacier and snow-covered areas are reportedly decreasing around the world, thereby making the glaciers one of the fastest-changing landforms in the world. The snow cover anomaly over the Himalayan region is of the opposite sign to that over northern Eurasia (Bamzai and Shukla, 1999). A comparative assessment of the Himalayan and Eurasian regions shows that the northernmost regions of both continents are mostly snow-covered during winter and exhibit minimal interannual variability. Eurasian snow cover was high only for 1 year, 1985, and low for 3 years, 1975, 1989, and 1990 (Bamzai and Shukla, 1999).
By 2080, the mean warming over India is projected to be 3.3–4.8 ∘C higher relative to preindustrial times (Chaturvedi et al., 2012). Prasad et al. (2009) reported statistically significant mean month-to-month warming (up to 0.048±0.026 ∘C per year) of the mid-troposphere that is the near-surface atmosphere over the high-altitude Himalayas and Tibetan Plateau. Thus, a 2–3 times higher warming trend (positive and statistically significant) was observed from December to May (accumulation period of snow) compared to the mean positive annual warming trend over the Himalayas (0.016±0.005 ∘C per year) and Tibetan Plateau (0.008±0.006 ∘C per year). The Himalayan and Tibetan Plateau glacier shows, during this period, a substantial decrease in snow cover and an extensive glacial retreat (Prasad and Singh, 2007). Recent studies elaborated on the rapid warming and climate change over the HKH region (You et al., 2017). The effect of cloud amount and level on the surface temperature and diurnal temperature range has been studied by Duan and Wu (2006) to explain the warming trend over the Tibetan Plateau.
1.2 Seasonal changes in snow cover
The snow-covered area (SCA), derived from MODIS observations, over the Tibetan Plateau, shows not only a decline in the coverage over the period 2003–2010 but also a decreasing tendency in the persistent SCA (SCA > 350 d). It is also marked by the increase in temperature (+0.09 ∘C per year) and precipitation (+0.26 mm/yr). However, a slightly increasing tendency was also observed in the maximum SCA over the study area (Wang et al., 2015). The seasonal snow cover distribution over Bhutan shows maximum monthly mean snow cover in February and minimum snow cover in July (Gurung et al., 2011). The time series of QuikSCAT radar observations, reported by Panday et al. (2011), indicate the beginning of melt onset in late March to early April at elevations of ∼ 4000 m and a delay of approximately 1 month at higher elevations (> 5500 m). Freezing begins at the highest elevations (> 5500 m) around late September and later on with decreasing elevation, with lower elevations (3500–4000 m) experiencing freezing around mid-October (Panday et al., 2011). Using RADARSAT-2 C-band Synthetic Aperture Radar (SAR) images and mapping of the seasonal variation in the polarized fraction (PF), the multitemporal snow cover mapping was carried out over the Manali–Dhundi region in the western Hindu Kush Himalayas, Himachal Pradesh (Muhuri et al., 2018).
Over the Tibetan Plateau, the minimum snow cover area occurs from July to August, and the SCA increases rapidly from September, reaching the maximum in March. On average, the years 2002, 2005, and 2008 received the largest amount of snow, whereas the years 2001, 2003, 2007, and 2010 received the smallest amount of snow (Duo et al., 2014). The mid-Northern Hemisphere, especially over the Tibetan Plateau, shows a decrease in the number of snow-covered days. Persistent snow was reported to be present in the areas of elevation ≥ 4500 m, indirectly indicating that the area of persistent snow has decreased over Tibetan Plateau below 4500 m (Wang et al., 2015).
1.3 Temporal trend in snow cover
Recent studies of the temporal trend analysis of snow cover across the Himalayas and the Tibetan Plateau show considerable variation. For instance, a significant negative snow cover trend was reported in the Upper Indus Basin during the winter for the other seasons. The glaciers across the Himalaya were found to be retreating at a rate of 15.5±11.8 m/yr and have lost an overall area of 13.6±7.9 % during the last 4 decades (Immerzeel, 2008; Pratibha and Kulkarni, 2018). In recent studies, a conspicuous variation in the trend from west to east over the HKH has been observed. The annual melting rate is conservatively estimated at 1 % of the total ice reserve (Immerzeel, 2008).
1.4 Changes in snow cover with altitude
Recent studies indicate that the trend of snow cover also shows large variations with altitude. For instance, using satellite data, Rikiishi and Nakasato (2006) found that the mean annual snow cover area in the Himalaya and the Tibetan Plateau has decreased by ∼1 %/yr during 1966–2001. The rate of decrease is the largest (1.6 %) at the lowest elevations (0–500 m). On the other hand, the length of the snow cover season is declining at all elevations, with the highest rate of decline occurring in the 4000–6000 m altitude range. On the Tibetan Plateau (4000–6000 m), the length of snow cover season has decreased by 23 d, and the end date for snow cover has advanced by 41 d during the last 35 years (Rikiishi and Nakasato, 2006). A systematic, relatively long-term study of 19 selected glaciers in the Chandra–Bhaga basin, Himachal Pradesh (1980–2007), revealed that the snow line altitude (SLA) increased from 5009±61 to 5401±21 m during this period (Pandey et al., 2013). According to the Coupled Model Intercomparison Project Phase 5 (CMIP5), snowmelt is projected to occur earlier, while the ice melt component is expected to increase, with considerable ice thinning, and snow cover may disappear below 4000 m altitude by the end of the 21st century (Soncini et al., 2015).
1.5 Reported analysis of MODIS snow cover data
One of the most useful products for snow cover analysis is the MOD10 snow product developed by the MODIS science team under NASA sponsorship and archived and distributed by the National Snow and Ice Data Center (NSIDC; Hall et al., 2006; Hall and Riggs, 2007). Several previous studies have evaluated the performance of these snow products based on field measurements and have been reporting less than 10 % error for the snow presence (Hall and Riggs, 2007) and 10 % positive bias for the albedo product (Tang et al., 2013). Recent studies show that the MODIS snow cover product overestimates the snow cover areas for the Mount Everest region, with the absolute error ranging from 20.1 % to 55.7 %, whereas the improved algorithm estimates the snow cover for the HKH region with an absolute accuracy greater than 90 % (Tang et al., 2013). The cloud cover and topographic shading in the mountainous regions are known to be the major factors affecting the accuracy of snow cover products (Muhuri et al., 2021). Parajka et al. (2010) developed and validated a regional snow line method (SNOWL) for estimating snow cover from the MODIS daily product, especially during cloudy conditions (up to 90 %) over Austria. The methodology provided robust estimates of snow cover over a range of cloudy conditions (10 %–90 %) for snow line mapping. Based on the MODIS data, Wang and Xie (2009) proposed a snow cover index (SCI) that can quantify snow cover duration and extent. The SCI analysis for the Tian Shan mountains, with the least snow cover in the 6 hydrologic years, was reported in August 2005, which affected the perennial snow/glacier cover extent of 2380 km2 area with an elevation of more than 4000 m.
The key to understanding the connection between the variation in snow cover and global climate change, especially in the mountainous regions, is the analysis of relatively long-term MODIS snow cover data (Wang and Xie, 2009). As the effect of regional warming increases with altitude, understanding the snow cover change with altitude is equally important. Therefore, one of the primary objectives of this current study is to create hypsographic curves to understand the seasonal distribution (snow accumulation and melting season) and the temporal trend in snow-covered regions with altitude over the HKH region, in addition to the detailed zonal analysis using long-term MODIS-derived snow cover product. The study area comprises the entire HKH region that covers eight countries, namely Afghanistan, Bangladesh, Bhutan, China, India, Myanmar, Nepal, and Pakistan (https://www.icimod.org/, last access: 30 January 2017).
2.1 MODIS snow cover
The NASA National Snow and Ice Data Center (NSIDC) Distributed Active Archive Center (DAAC) has provided snow-cover-related data since the launch of the Moderate Resolution Imaging Spectroradiometer (MODIS) on board Terra. In this study, snow cover derived from the MODIS sensor on board Terra at a spatial resolution of 5 km (in the gridded form) and as a monthly (MOD10CM) composite (version 6) were used to analyze the spatial, temporal, and altitude-wise variation in snow cover. The snow cover detection and snow cover fraction are based on the normalized difference snow index (NDSI) algorithm (Hall and Riggs, 2007; Salomonson and Appel, 2004), taking advantage of the contrasting reflectance of snow in the visible and shortwave infrared bands. The snow albedo is estimated using a radiative transfer model (Klein and Barnett, 2003). Several previous studies have evaluated the performance of these snow products compared to field measurements and reported an error of less than 10 % for snow cover presence (Hall et al., 2006; Hall and Riggs, 2007).
2.2 Shuttle Radar Topography Mission (SRTM) digital elevation model (DEM)
The Shuttle Radar Topography Mission (SRTM) 90 m gridded digital elevation model (DEM) version 4.1 was obtained from the CGIAR Consortium for Spatial Information (CGIAR-CSI) geoportal (https://srtm.csi.cgiar.org/, last access: 30 January 2017). These data were resampled to 5 km resolution over the study region and used for the hypsographic analysis of snow cover. The corresponding value of snow cover was extracted from MODIS Terra at 5 km to analyze the spatial, hypsographic variability, and temporal trends.
2.3 Methodology
Monthly average snow cover in 5 km resolution (collection 6; product MOD10CM) was obtained in the Hierarchical Data Format – Earth Observing Systems (HDF-EOS) format from the NSIDC DAAC. The data were processed in a gridded form, known as a Climate Modeling Grid (CMG), from March 2000 to February 2017, and used to extract average snow cover and basic quality assurance (QA) in a Geographic lat/long projection. The Scientific DataSet (SDS) layer that contains the monthly snow cover is Snow_Cover_Monthly_CMG. This layer contains valid values between 0 and 100 (snow cover percentage). However, the Antarctica region is deliberately mapped as snow and filled with a percent value of 100. MODIS pixels were assigned a numeric code for the night (211), cloud (250), no decision (253), water mask (254), and other fill values (255). All the snow cover monthly CMG datasets were extracted for the HKH region, as demarcated by ICIMOD (International Center for Integrated Mountain Development; https://www.icimod.org/, last access: 30 January 2017). The snow cover extent in each pixel (range in value from 0 to 100) was determined, formatted (American Standard Code for Information Interchange – ASCII), and archived and later on were used for the geospatial analysis. The altitude data for the study region were extracted from SRTM DEM and used for generating hypsographic curves and for an analysis of snow cover change with altitude and trends. The HKH region was further divided into five different longitudinal zones (west to east) named Zone 1 (60–70∘ E), Zone 2 (70–80∘ E), Zone 3 (80–90∘ E), Zone 4 (90–100∘ E), and Zone 5 (100–105∘ E). For seasonal analysis, the data were categorized into two seasons, i.e., the melting season from March to August and the accumulating season from September to February. The seasonal hypsographic analysis for accumulating and melting seasons were also carried out. For the purpose of comparison, the hypsographic chart also shows the months of February, in the melting season, and August, in the accumulation season, as a dotted line. The snow cover distribution maps (monthly, yearly, and seasonal) and the trend maps illustrating the increase or decrease in snow cover have been prepared. The spatial maps include a geographic location with their hypsographic curve to emphasize snow cover changes with increasing altitude.
Linear trend estimation is a statistical technique assisting with dataset interpretation. The linear trend analysis (LIN) is based on one of the most commonly used trend analyses. The values of each pixel (grid point) over time, using the Pearson product–moment correlation, allows us to measure the strength of a linear association between the value (dependent variable) and time (independent variable). However, in shorter series, this approach is known to be sensitive to noise. To determine the rate of change in a short or noisy series, a reliable approach for assessment of temporal trend is known as median trend analysis (TS). TS is computed by calculating the median value after determining the slope between each pairwise combination (Hoaglin et al., 2000). The z score was obtained from the monotonic trend (Mann–Kendall – MK) statistics, which provides an assessment of the trend significance in image time series (Neeti and Eastman, 2011). MK statistics are commonly used in conjunction with the median trend analysis (TS) for an assessment of significance in a time series data analysis.
3.1 Spatial snow cover changes
The mean snow cover (in percent) derived from monthly composites of MODIS Terra and its spatial distribution over the HKH region during 17 years (March 2000 to February 2017) are shown in Fig. 1a. The average long-term snow cover is found to be 35.9 % (Table 1); however, the northwestern region (particularly Zone 2) shows much higher snow cover as some of the largest glaciers (such as the Siachen Glacier) and permanent snow-covered areas are within this zone.
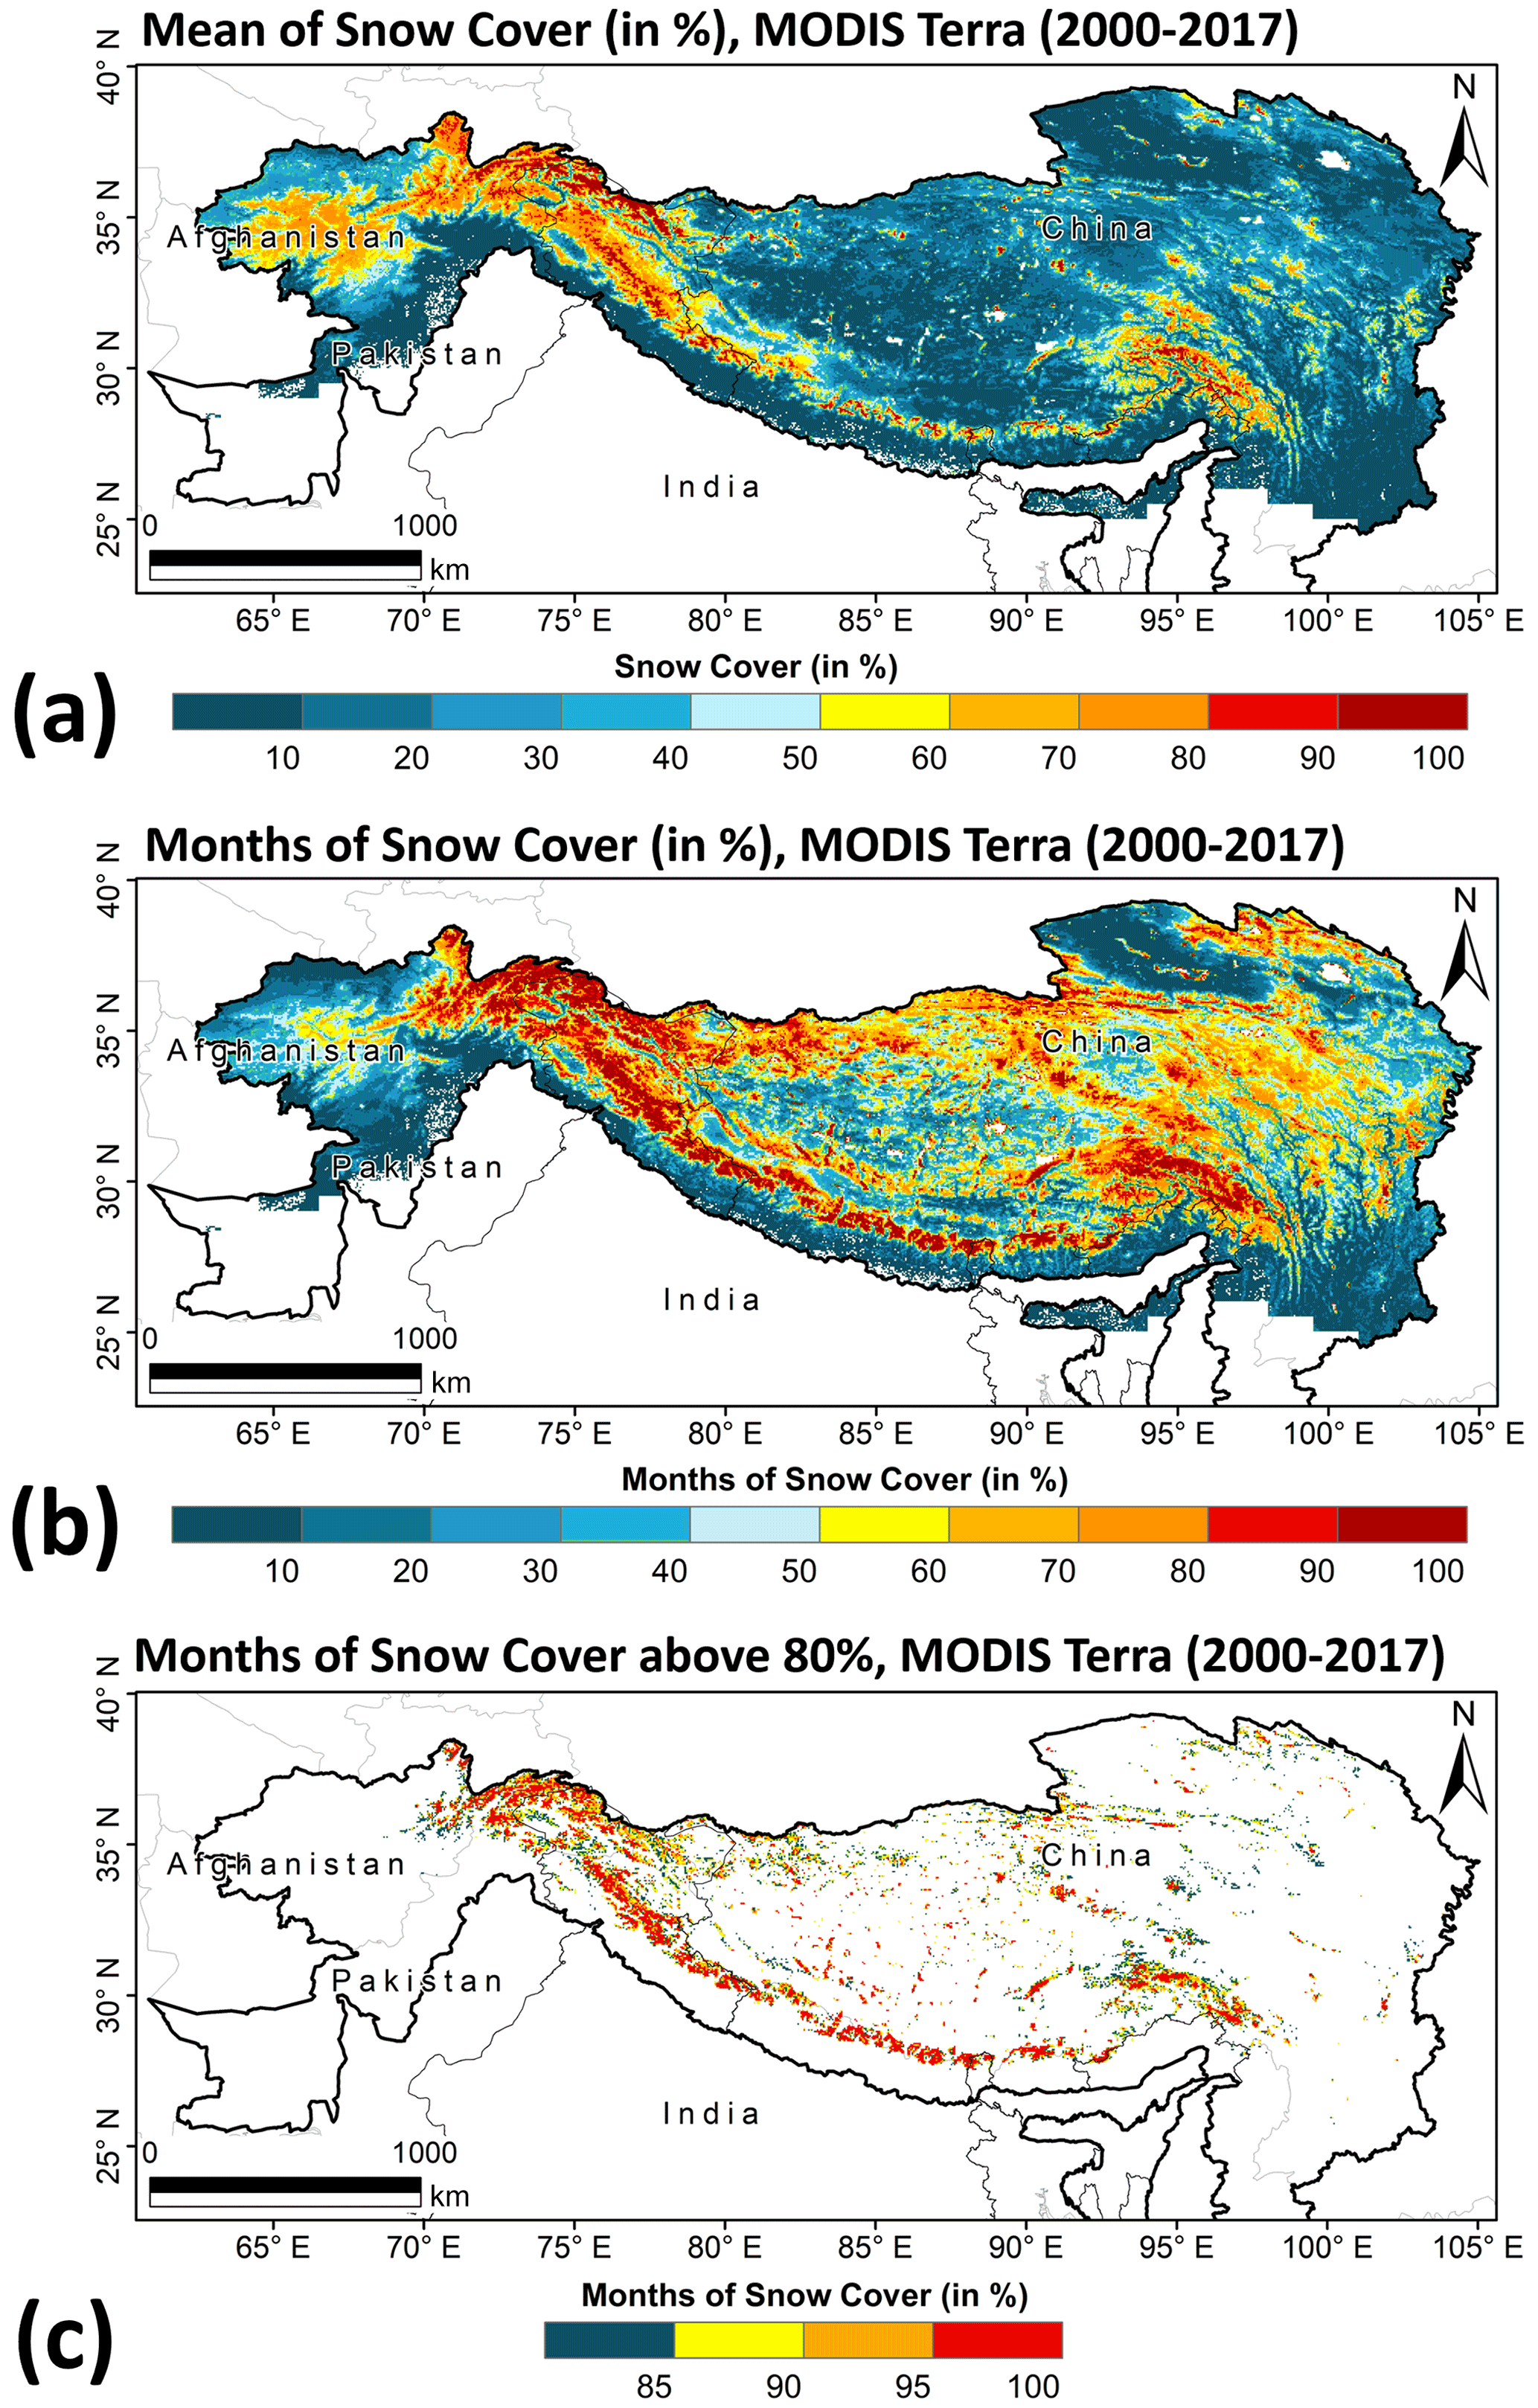
Figure 1The spatial distribution of MODIS–Terra-derived (a) monthly mean snow cover (in percent), (b) the total duration of the presence of snow cover (in percent) out of 204 months, and (c) the presence of snow cover above 80 % (total months out of 204 months) during March 2000 to February 2017 over the HKH region.
Table 1Mean snow cover (percent) for different altitudes, derived from composites of individual months for the study period (March 2000 to February 2017) over the HKH region.
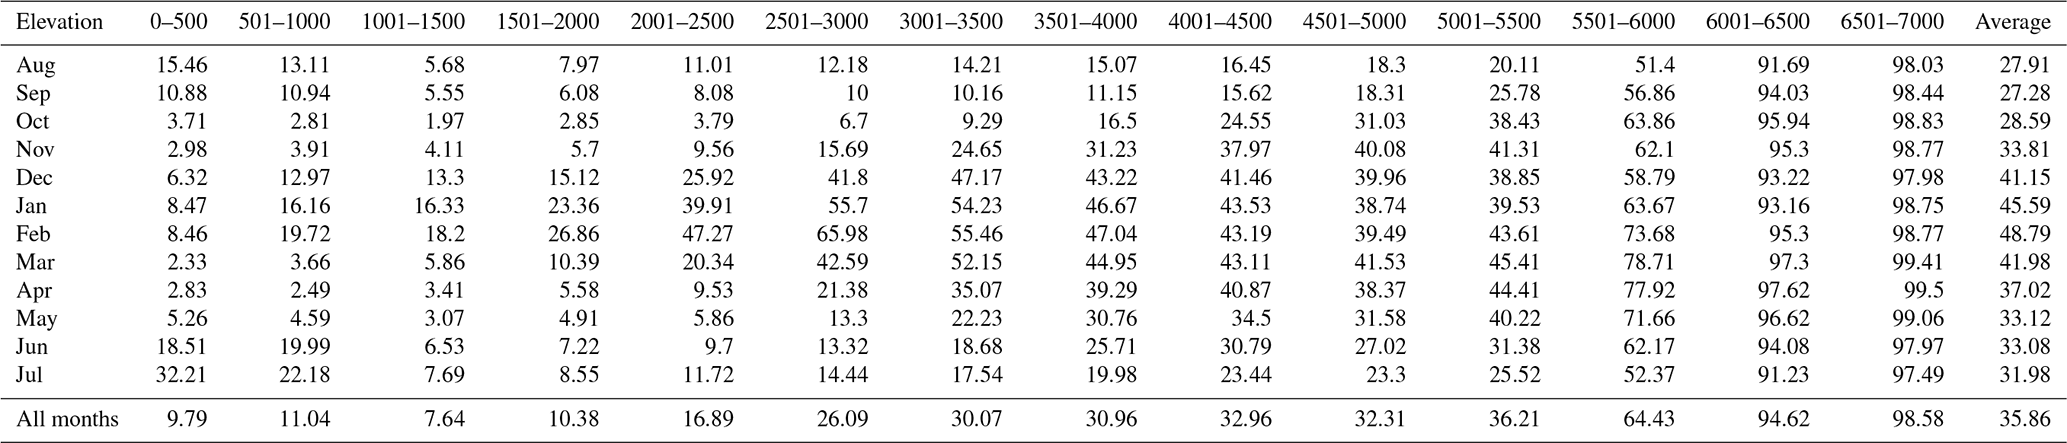
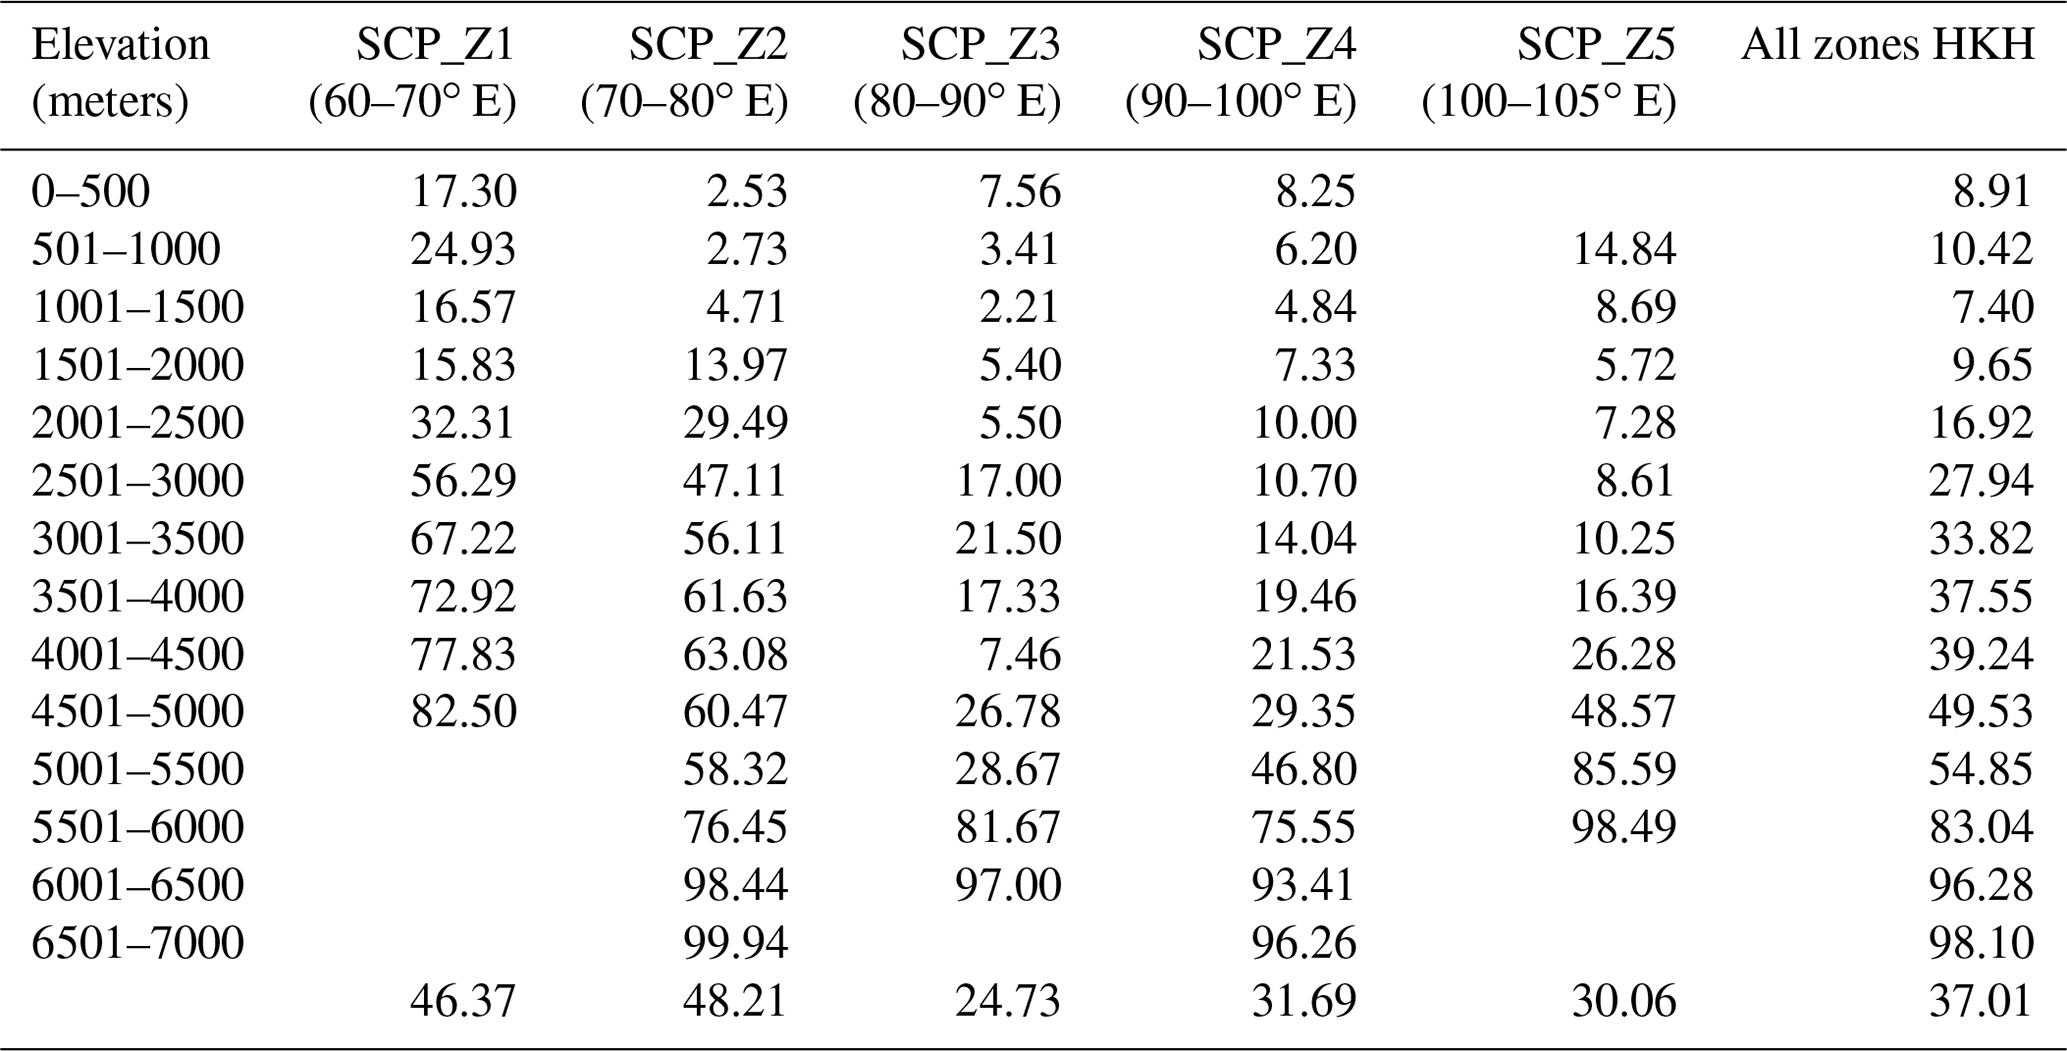
The peak in snow cover is observed during February (48.8 %), and the lows are observed during August–September (27.9 %, and 27.3 %, respectively; Table 1). The statistics for mean snow cover change with altitude, at an interval of 500 m, for individual months, and the entire study period (March 2000 to February 2017) is shown in Table 1. The highest mean snow cover is found to be above an altitude of 6000 m (96.6 %). The long-term average zonal snow cover is found to be 14.4 %, 38.7 %, 13.5 %, 17.2 %, and 7.9 % for Zones 1–5 (west to east), respectively (Table 2). The zonal and the altitudinal breakup of the mean snow cover show the highest value (99.1 %) over the Zone 2 (70–80∘ E). The Zone 4 (100–105∘ E) also shows a higher mean snow cover (> 96 %), even at a relatively lower altitude (5500–6000 m), compared to other zones (Table 3). The white patches in Fig. 1a represent some of the major lakes and reservoirs, such as Qinghai, Cedo Caka, Selin Co, Nam Co, and Yamzhog Yumco.
Table 2Zonal analysis of yearly mean snow cover (percent) for 2000 to 2016 period.
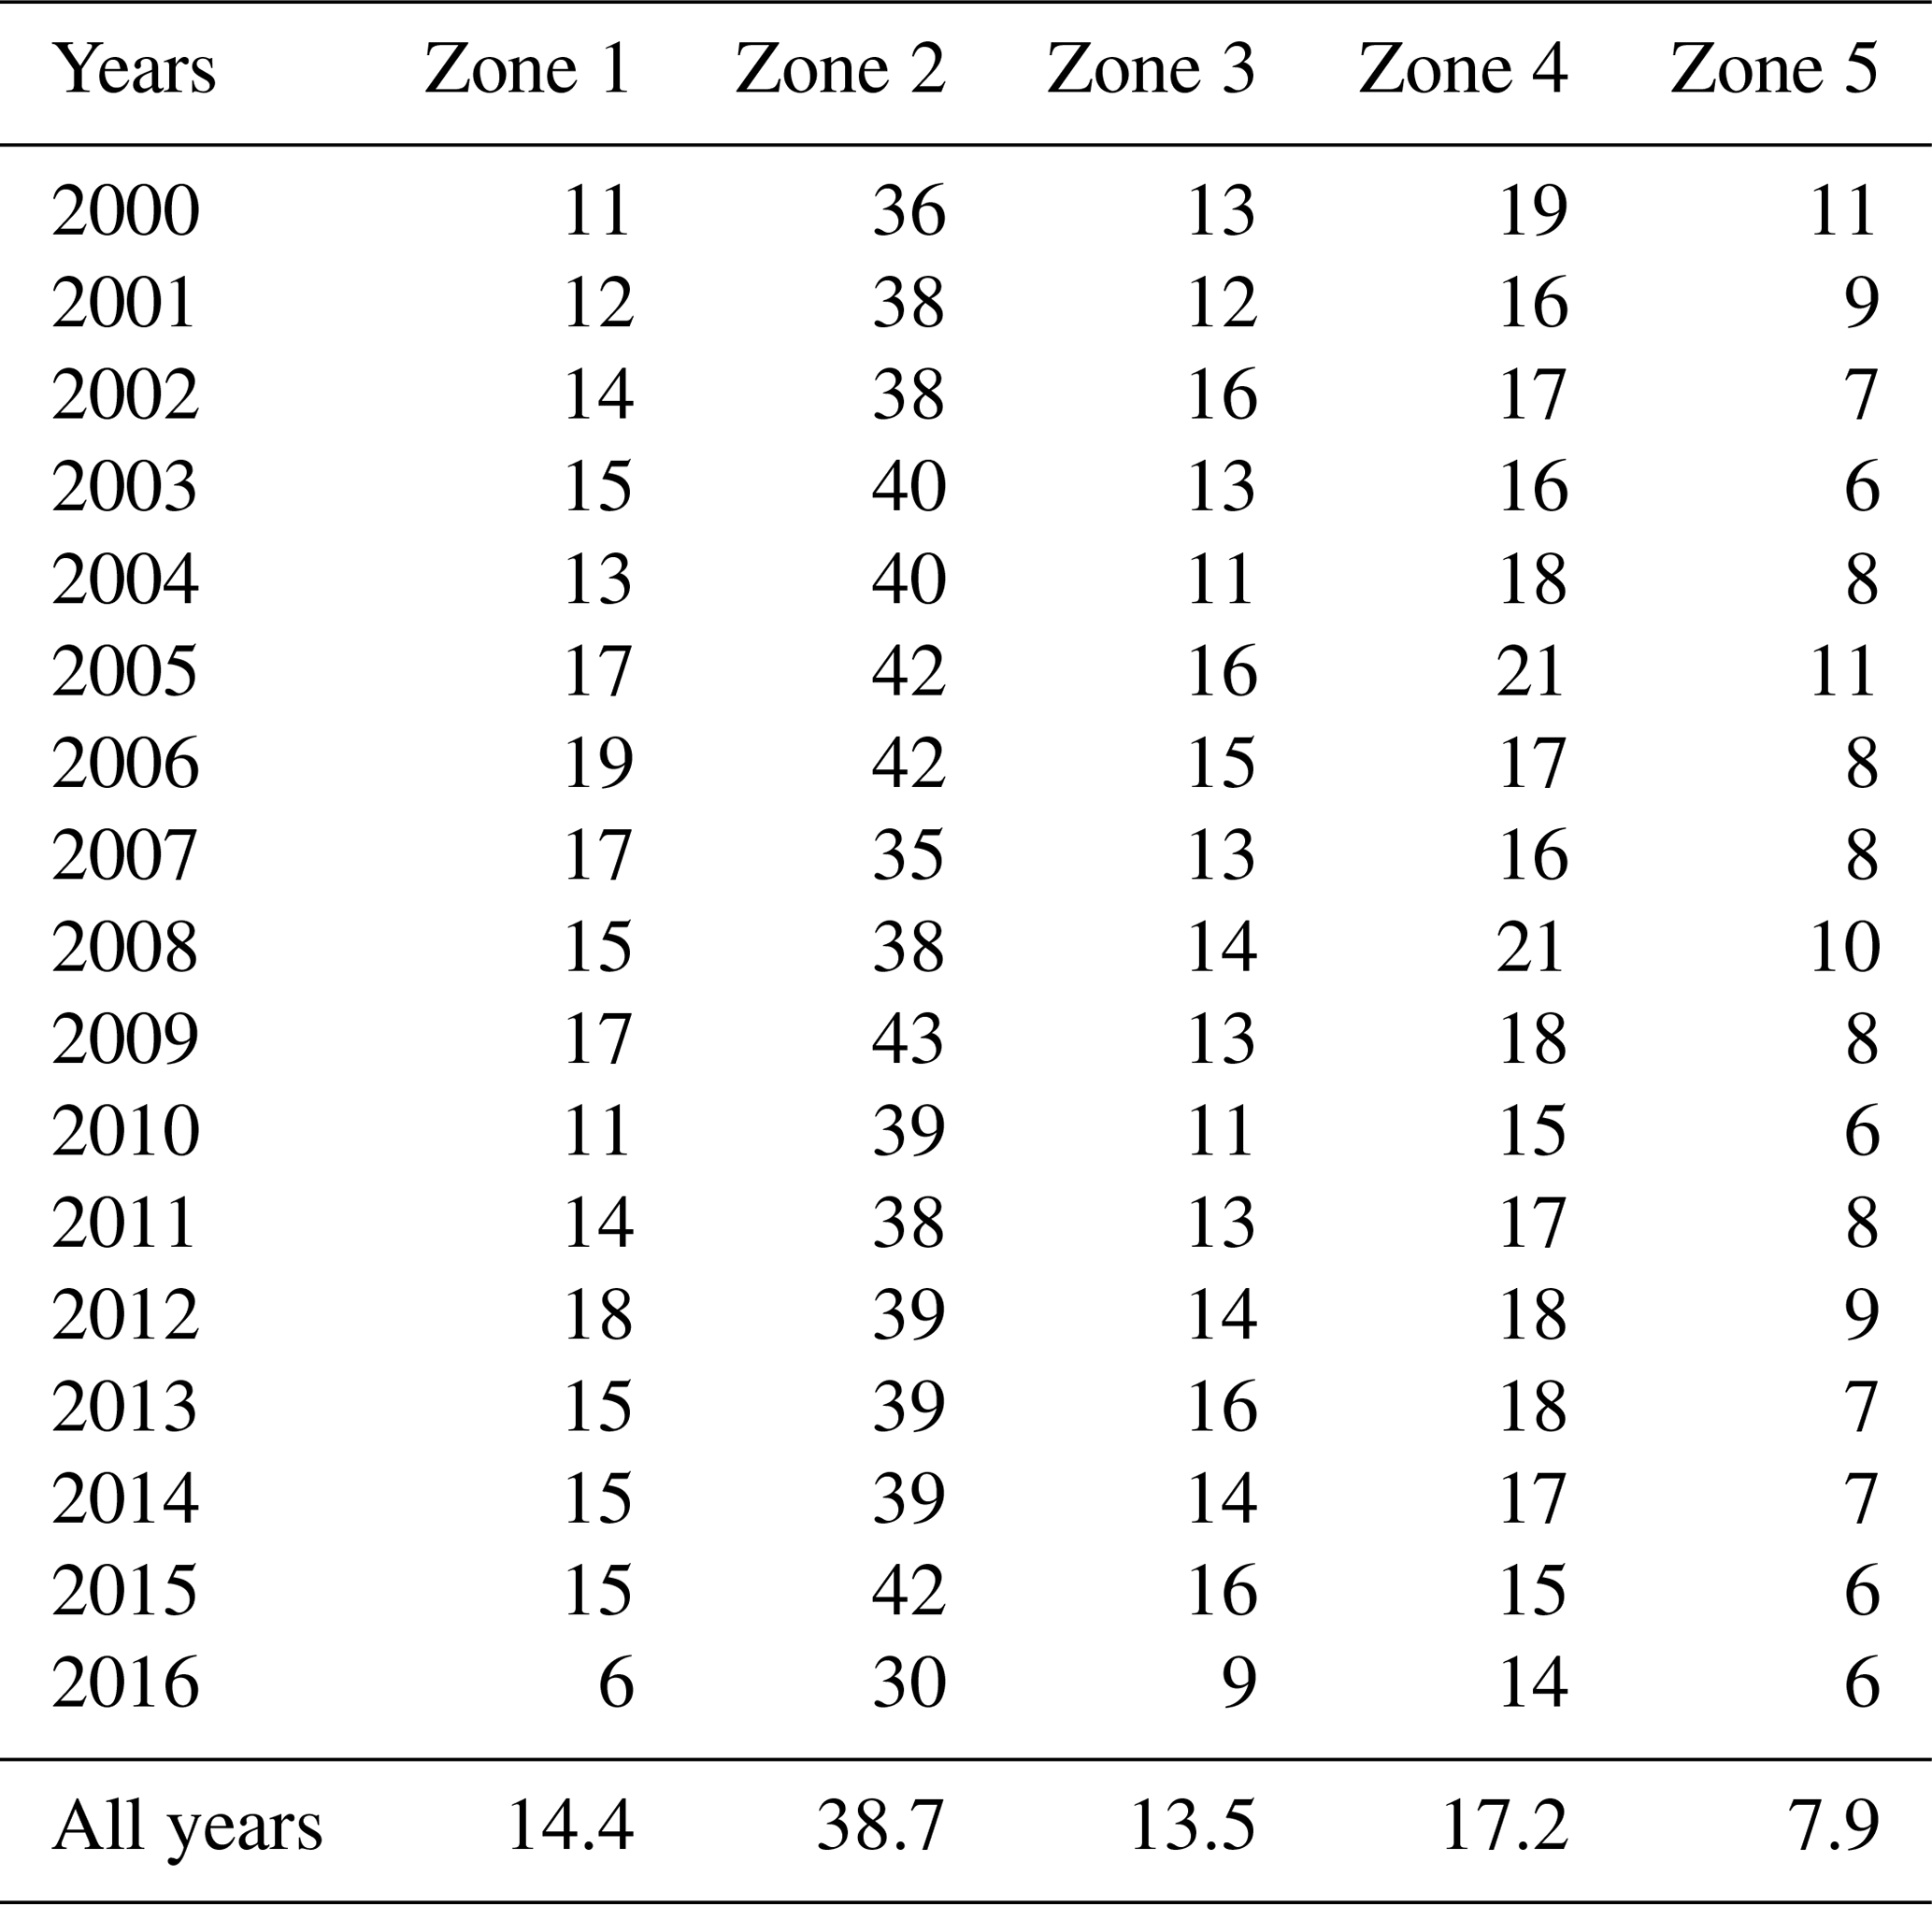
Table 3Zonal and altitudinal (at 500 m intervals) distribution of snow cover (percent) over the HKH region. Note: SCP is the snow cover percentage.
The frequency of snow cover (i.e., snow cover persistence) is essential for understanding the temporal variability in snow cover and its spatial distribution. Using the monthly snow cover images, we obtained the frequency of the presence of snow cover (for each pixel) for the entire study duration (204 months) from March 2000 to February 2017. Figure 1b depicts the total number of snow-covered months for the HKH region. The monthly snow cover clearly depicts the high-altitude Himalayan mountain range with permanent snow cover and also other regions of the Tibetan Plateau with relatively permanent snow cover (Fig. 1c). Figure 1c shows the regions with persistent snow cover above 80 % for the entire study duration, i.e., the permanent snow cover regions in the HKH region based on MODIS observations.
The monthly spatial distribution of MODIS-derived mean snow cover (Fig. 2a) shows that the maximum and minimum is observed during February and August–September, respectively (Table 1). The monthly average snow cover maps also show that there is an overall gradual increase in the mean snow cover from September to February, which is known as the accumulating season (Fig. 2b). Similarly, there is an overall decline from March to August, which is known as the melting season (Fig. 2b). The monthly variability over the early phase (2003–2004 and 2004–2005) and later phase (2011–2012 and 2015–2016) compared to the average snow cover over the entire study period (2000–2017) suggests a gradual decline in snow cover from 2004–2005 to 2015–2016. However, specific anomalous years (2003–2004 or 2011–2012) compared to the entire study period need to be further investigated in detail. In addition to monthly variability, zonal and altitudinal variability should be considered in explaining some of these trends and observed anomalies.
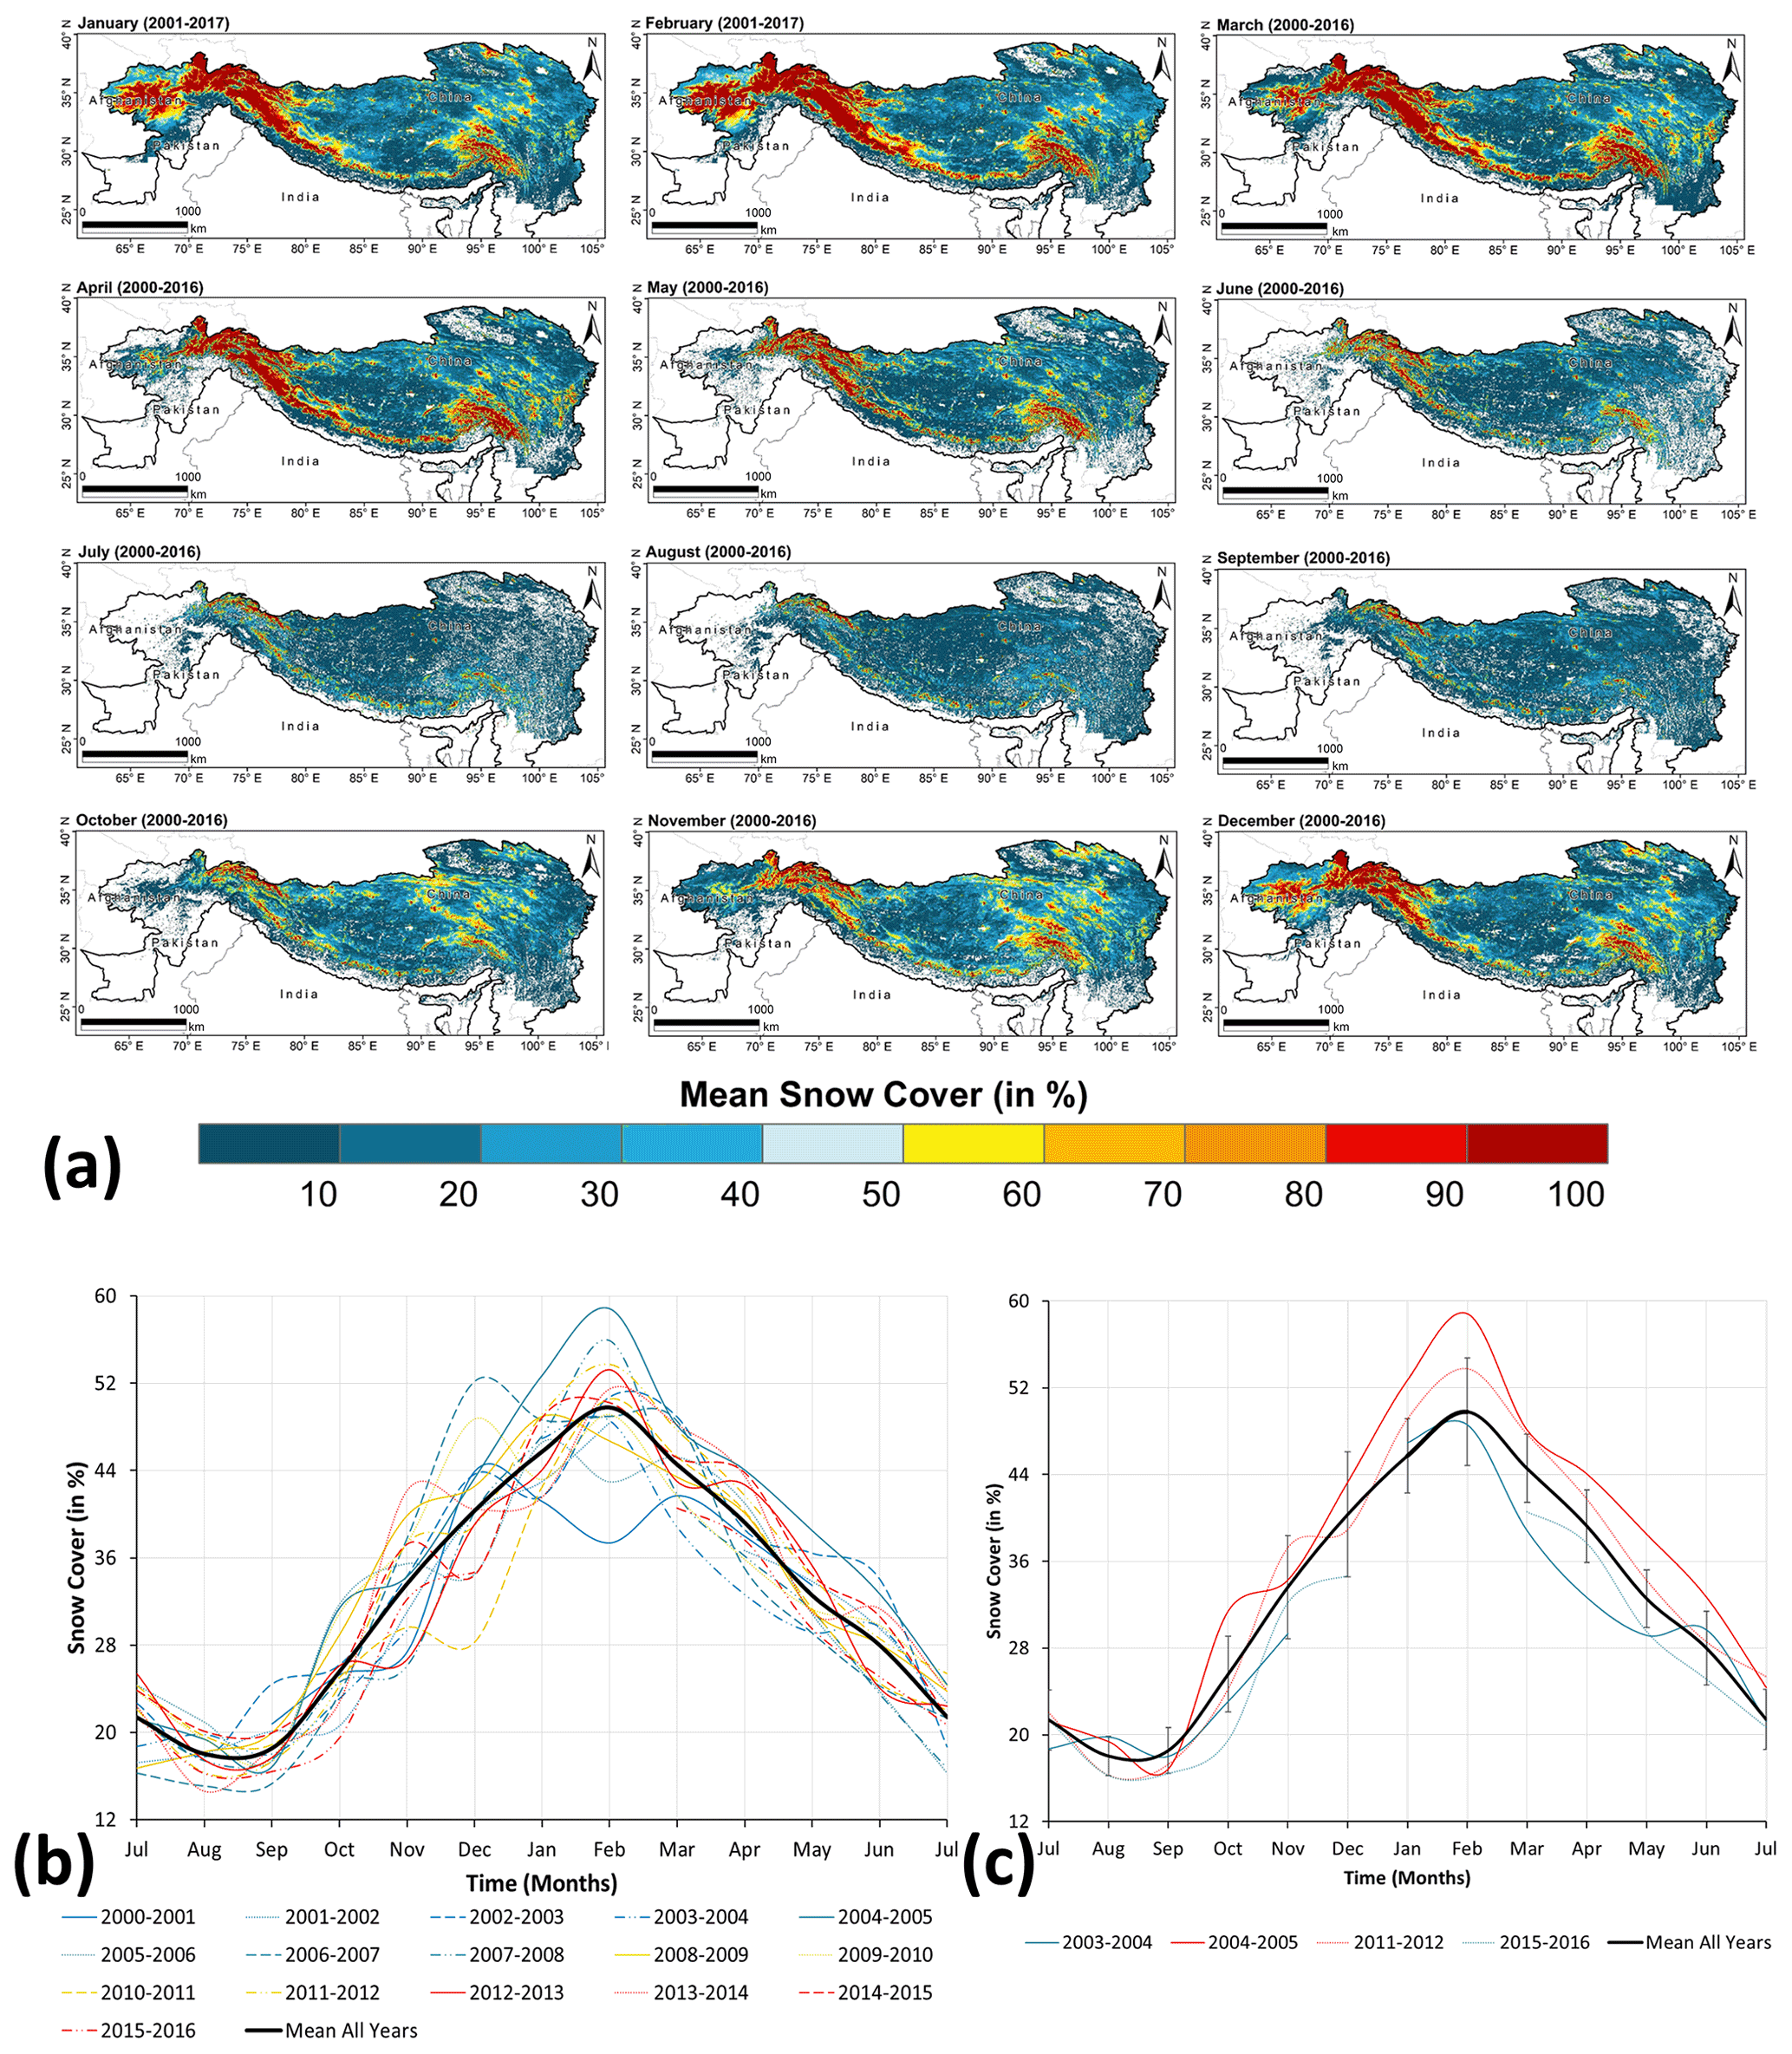
Figure 2The monthly spatial distribution of MODIS-derived snow cover (in percent) over the HKH region during 2000–2017. (a) Monthly maps, (b) monthly variability over the years, and (c) monthly variability over the early phase (2003–2004 and 2004–2005) and later phase (2011–2012 and 2015–2016), compared to the average for the entire study period (2000–2017).
3.2 Temporal changes in snow cover with altitude
The hypsographic curves of annual mean snow cover for 2000–2016 and the seasonal (March to February) snow cover for 2000–2017 for the HKH region are shown in Fig. 3. The mean snow cover is shown as a solid black line (base), and annual lines clearly depict the anomalous years compared to the long-term average snow cover. The change in snow cover with altitude clearly shows that there is a sharp jump in snow cover percent between 5001 and 6400 m in elevation. Above 6400 m altitude, the snow cover is usually very high (> 96 %) and does not show a large interannual variability compared to the range of altitude from 3001 to 5000 m, with ∼ 30 %–35 % snow cover overall. Below 3000 m, the snow cover percent gradually declines from ∼ 30 % to ∼ 10 % up to 1000 m altitude. Below 1000 m altitude, there is a slight increase in the snow cover (about ∼ 15 %), with an increase in interannual variability (compared to 1001–3000 m). This increase in interannual variability at lower altitudes may be attributed to known issues such as topographic shadows in the snow cover retrieval algorithm. The relatively lower seasonal snow cover for 2016 is due to missing data for the months of January and February, which represent the peak of the snow accumulating season.
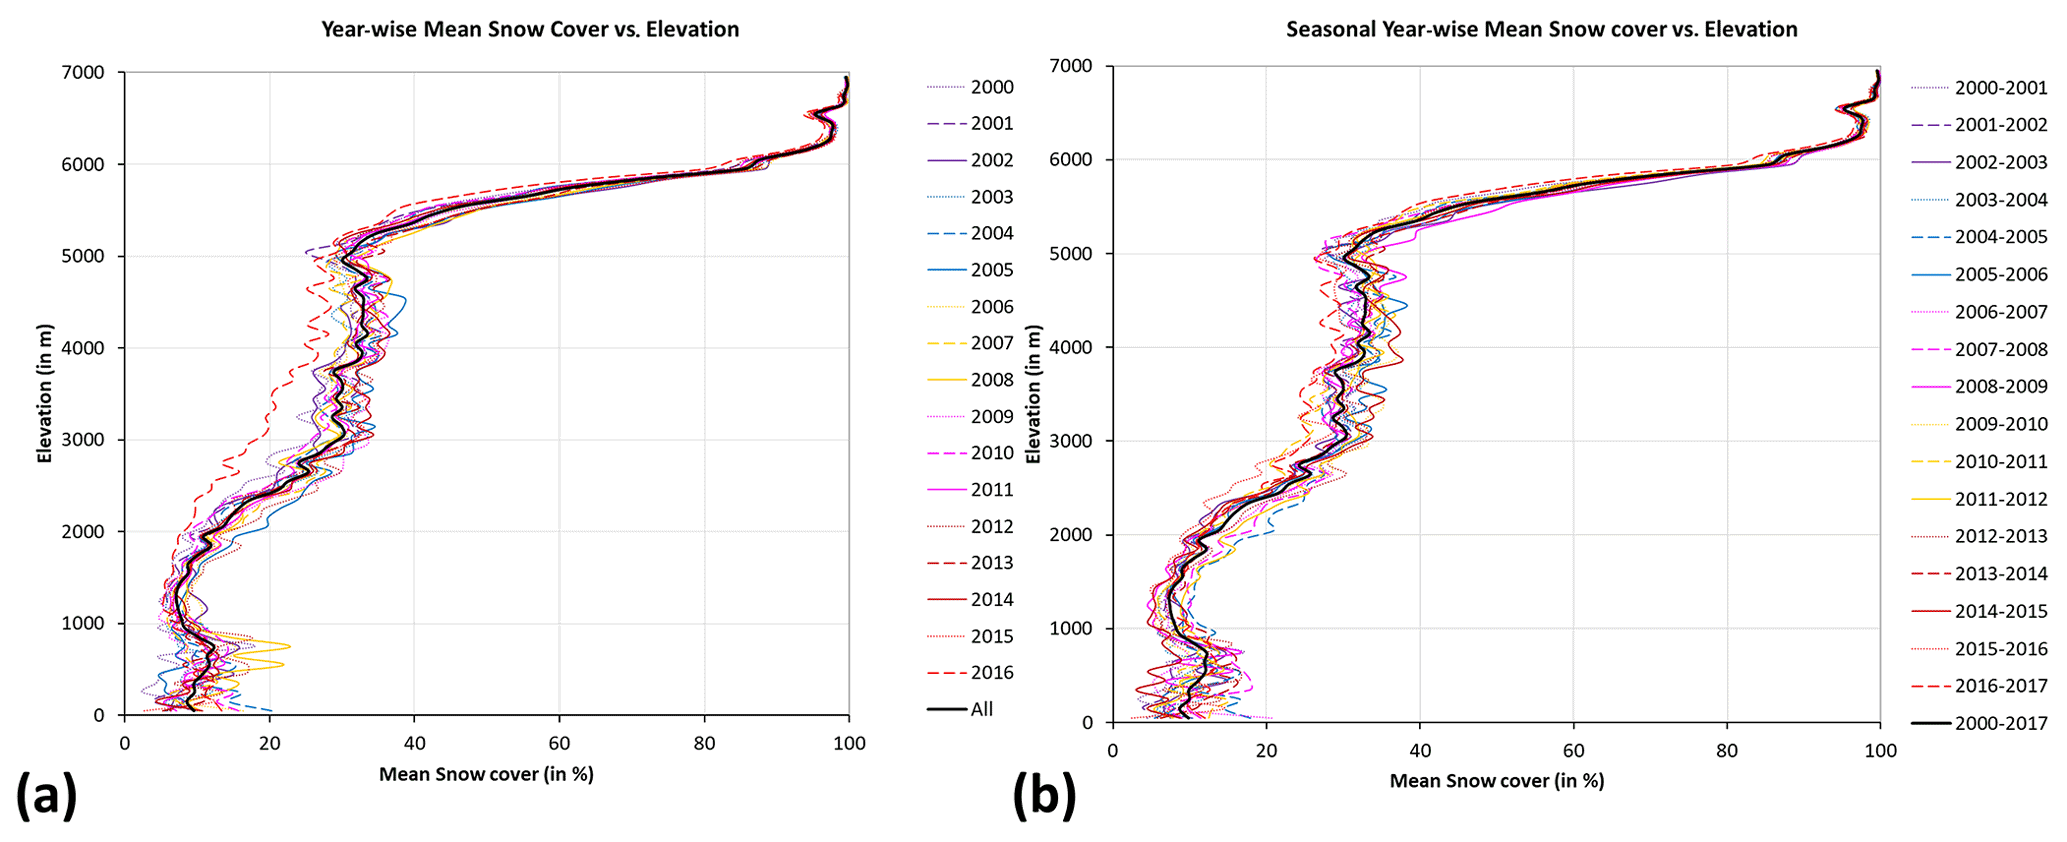
Figure 3The hypsographic curves of the (a) year-wise mean snow cover (in percent) for 2000–2016 and (b) seasonal year-wise (March to February) snow cover (in percent) for 2000–2017, respectively, over the HKH region. Note that the seasonal average of snow cover for year 2016 is lower because of missing data for the months of January and February.
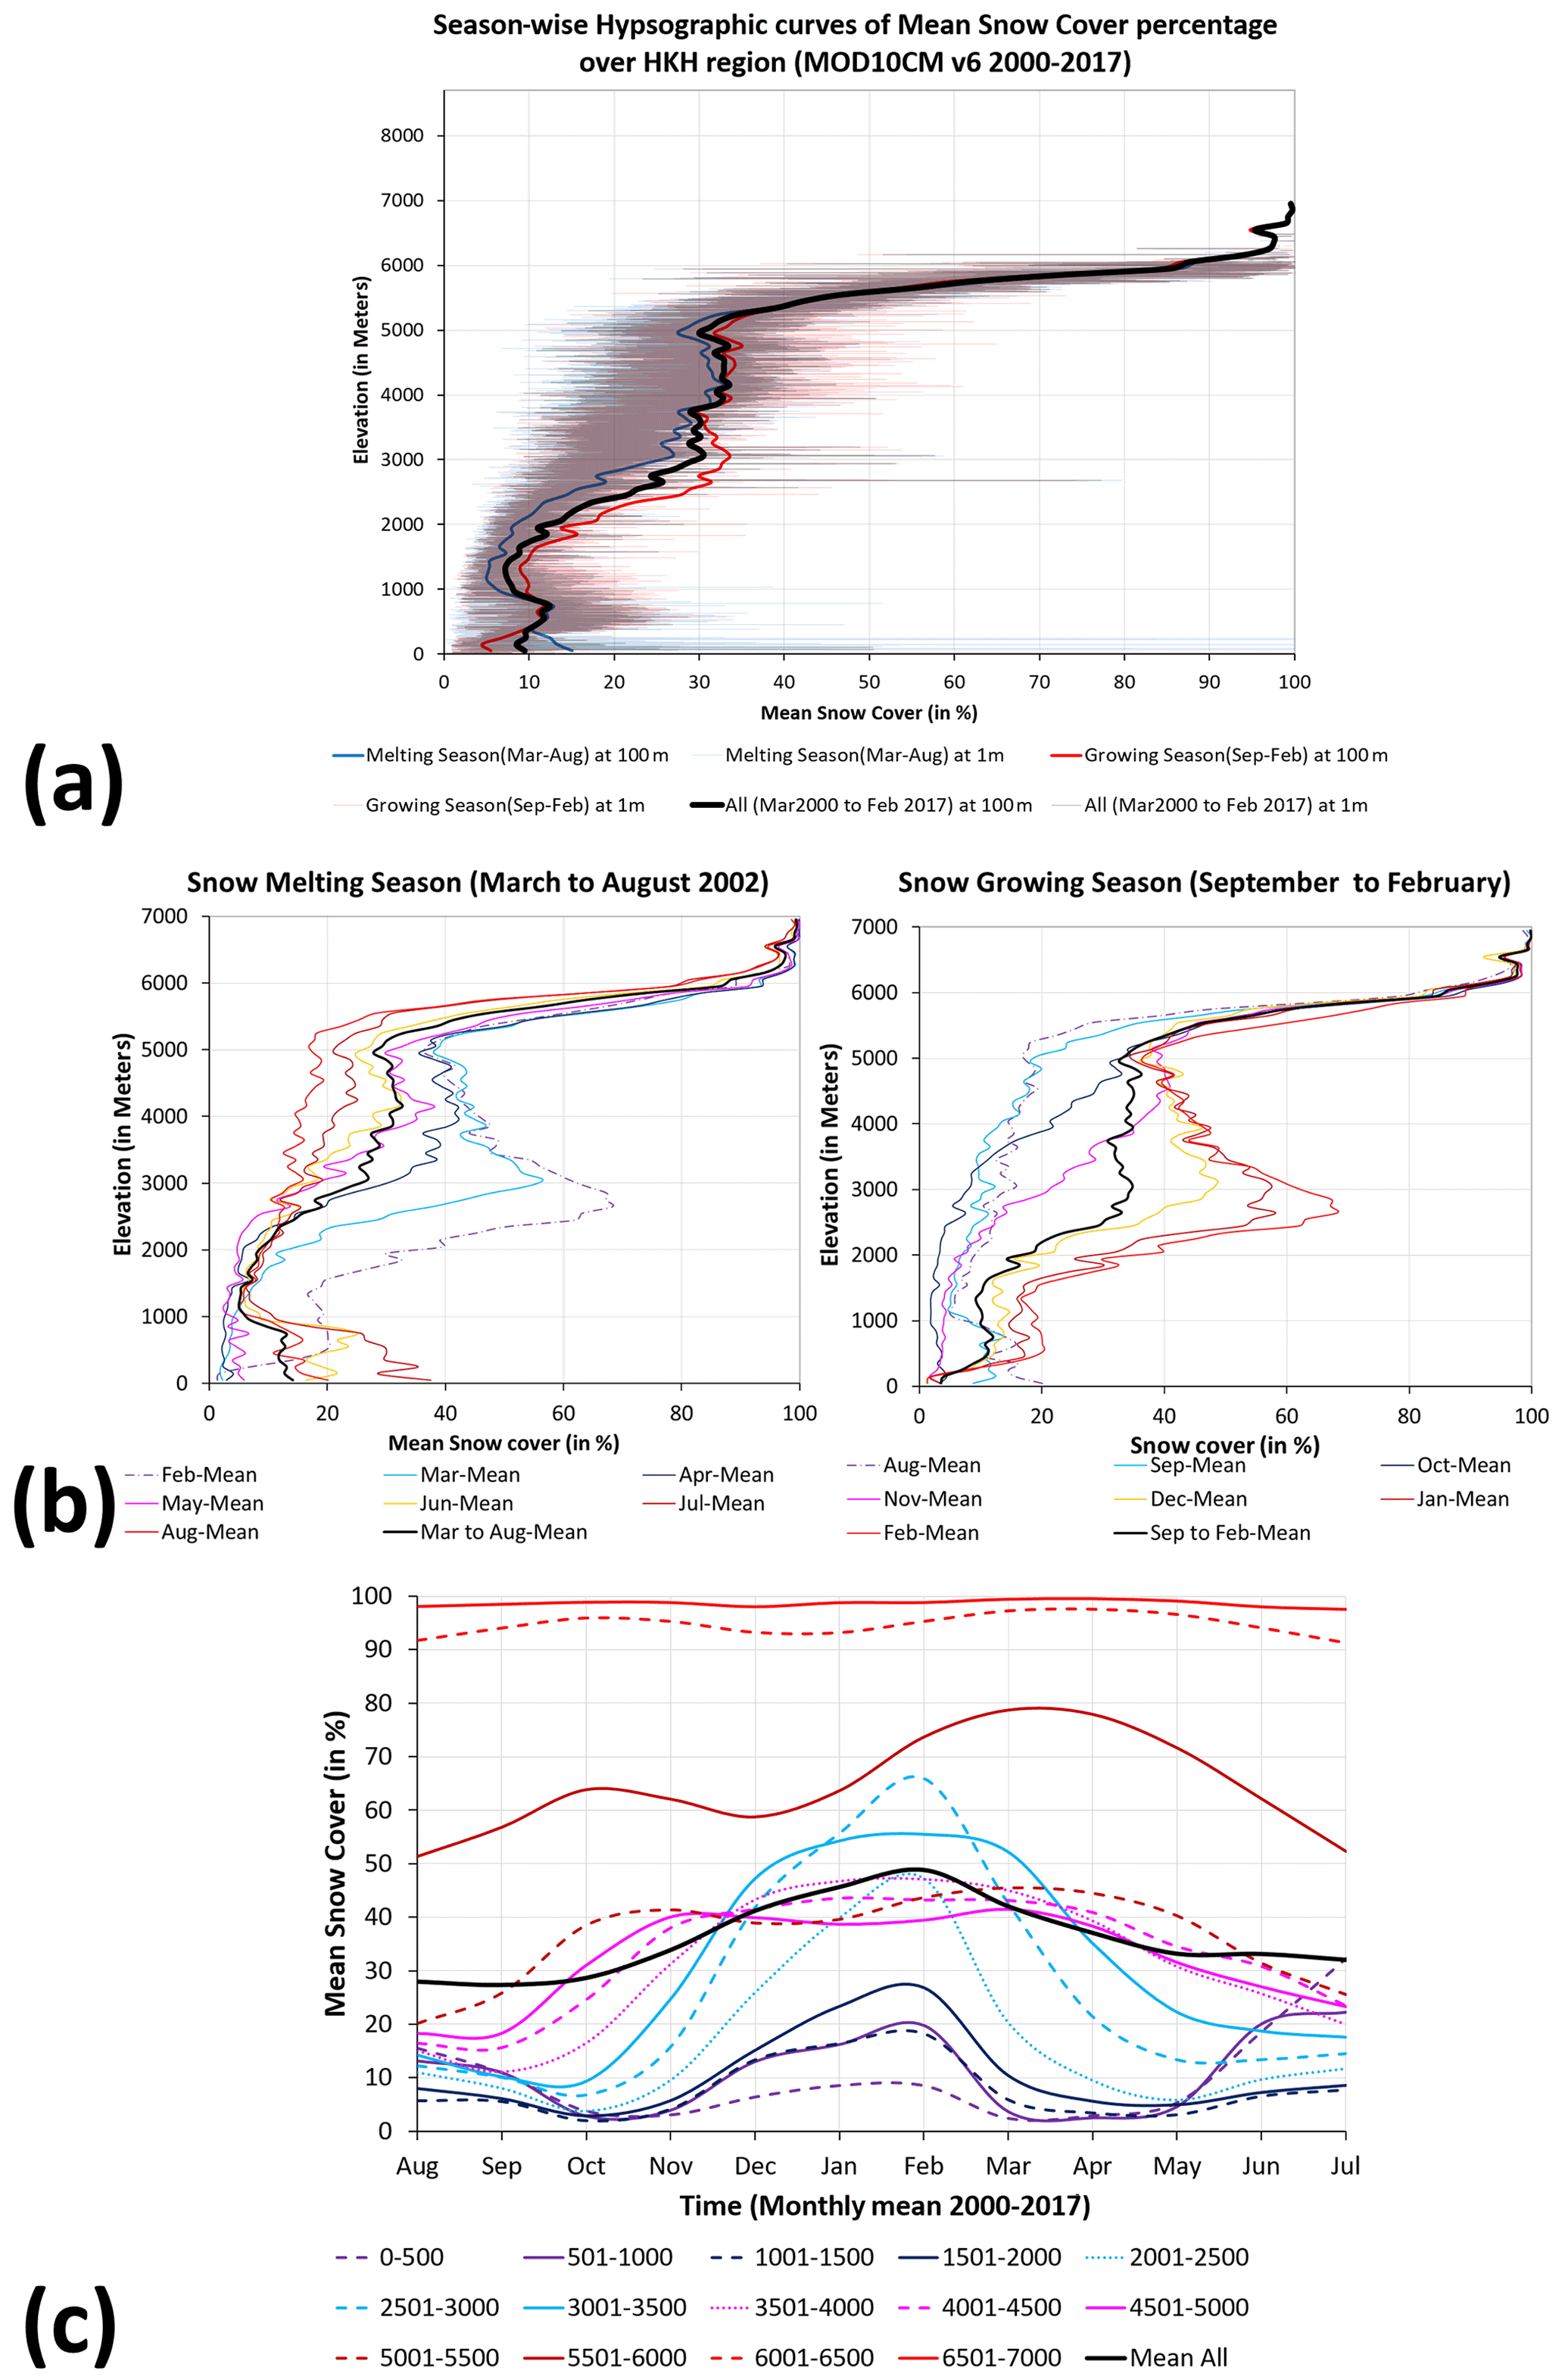
Figure 4(a) The mean snow cover hypsographic curves during 2000–2017 over the HKH region. (a) Seasonal curves for the accumulating season (red line), melting season (blue line), and all seasons (black line). (b) Monthly composites (in percent) during the snow melting and accumulating seasons. (c) The variability in mean snow cover over the months (at different altitudes; < 5500 m) shows the start of the decline in snow cover from the month of March onwards (black line is the average).
Figure 4a shows the hypsographic curves of seasonal average snow cover during the accumulating (red line), melting (blue line), and all (black line) seasons for the 2000–2017 period over the HKH region. It clearly shows that, above 5500 m altitude, the difference in snow cover between the accumulating and melting season decreases with altitude, depicting permanent snow- and glacier-covered regions (> 90 % snow cover). However, between ∼ 1001 and 5000 m altitude, the accumulating and melting seasons and overall data (composites of 100 m intervals depicted by red, blue, and black solid lines, respectively) show conspicuous differences in the average snow cover (∼ 30 % between 3001 and 5000 m and ∼ 10 % between 1000 and 2000 m). The shaded region (numerous fine lines of red and blue) indicates individual observations and their very large range and fluctuations between 1001 and 5000 m that gradually decreases at higher altitudes (6000–7000 m). The accumulating season usually has a higher mean snow cover percentage, compared to melting season at the elevations between 800 and 5400 m, but below 800 m, the hypsographic curve behaves oppositely, underlining the issues such as topographic shadows in the snow cover retrieval algorithm.
The hypsographic curve depicting monthly composites of average snow cover during the snow melting and accumulating seasons over the HKH region (2000–2017) is shown in Fig. 4b. In general, the curve is shifting towards the lower mean snow cover from March to August (snow melting season), whereas shifts towards the higher mean snow cover percentage from September to February (snow accumulating season). For comparison, the maxima are observed in February (in the melting season chart), and the minima are observed in August (in the accumulating season chart), which is highlighted by dashed line to mark the end of the previous season. The gradual variation in the monthly mean snow cover with the passage of season, especially between 1001 and 5000 m altitude, is clearly visible. The mean snow cover for the accumulating and melting season is depicted by a solid black line. Above 3000 m altitude, the July–August period consistently shows the lowest snow cover during a melting season. Similarly, in the accumulating season, the month of February clearly marks the highest snow cover between 501 and 6000 m altitude. A zonal construction of such hypsographic curves may allow the detection of anomalous years that vary significantly from the normal seasonal cycle. Overall, the snow cover for the months of December, January, February, March, and April shows higher mean values compared to other months. Above the altitude of 5000 m, the variability in mean snow cover is found to be minimum. A hypsographic analysis (Fig. 4b and c) shows a notable change from March onwards, where a substantial decline in snow cover is found (0–5500 m altitude; average is the black line), and an increase in snow cover is observed from September onwards (0–5500 m altitude). The melting season is considered to be from March onwards and the growing season from September onwards for such an analysis. This is expected, as the areal extent of the snow cover below 5500 m is higher, and regions with thin and seasonal snow cover are generally found at relatively lower altitudes which are affected much earlier during the change of season than the thick snow cover/glaciers at higher altitudes. The higher-altitude snow cover (5500–7000 m) shows a lag (approx. 1 month) in the starting of the melting and accumulation phases.
3.3 Trend analysis
In general, the overall time series analysis presented here (Fig. 5a) shows a very weak and statistically insignificant negative trend (or decline) of snow cover over the entire study area. This in contrast to several studies and databases, based on ground and satellite observations, over the last 2–3 decades (Berthier et al., 2007; Bolch, 2007; Kulkarni, 2006; Raup et al., 2007) which show contrasting changes in snow cover over the Himalayas. This implies that regional and altitudinal analyses are required to capture the variability (Fig. 5a). The line chart with a linear fit shows the time series analysis of the monthly mean MODIS snow cover over the HKH region (2000–2016; Fig. 5a). The variation in the pixel count (area) is shown as histograms. The snow cover is usually found to be lowest in the months of July or August and highest in January or February, respectively.
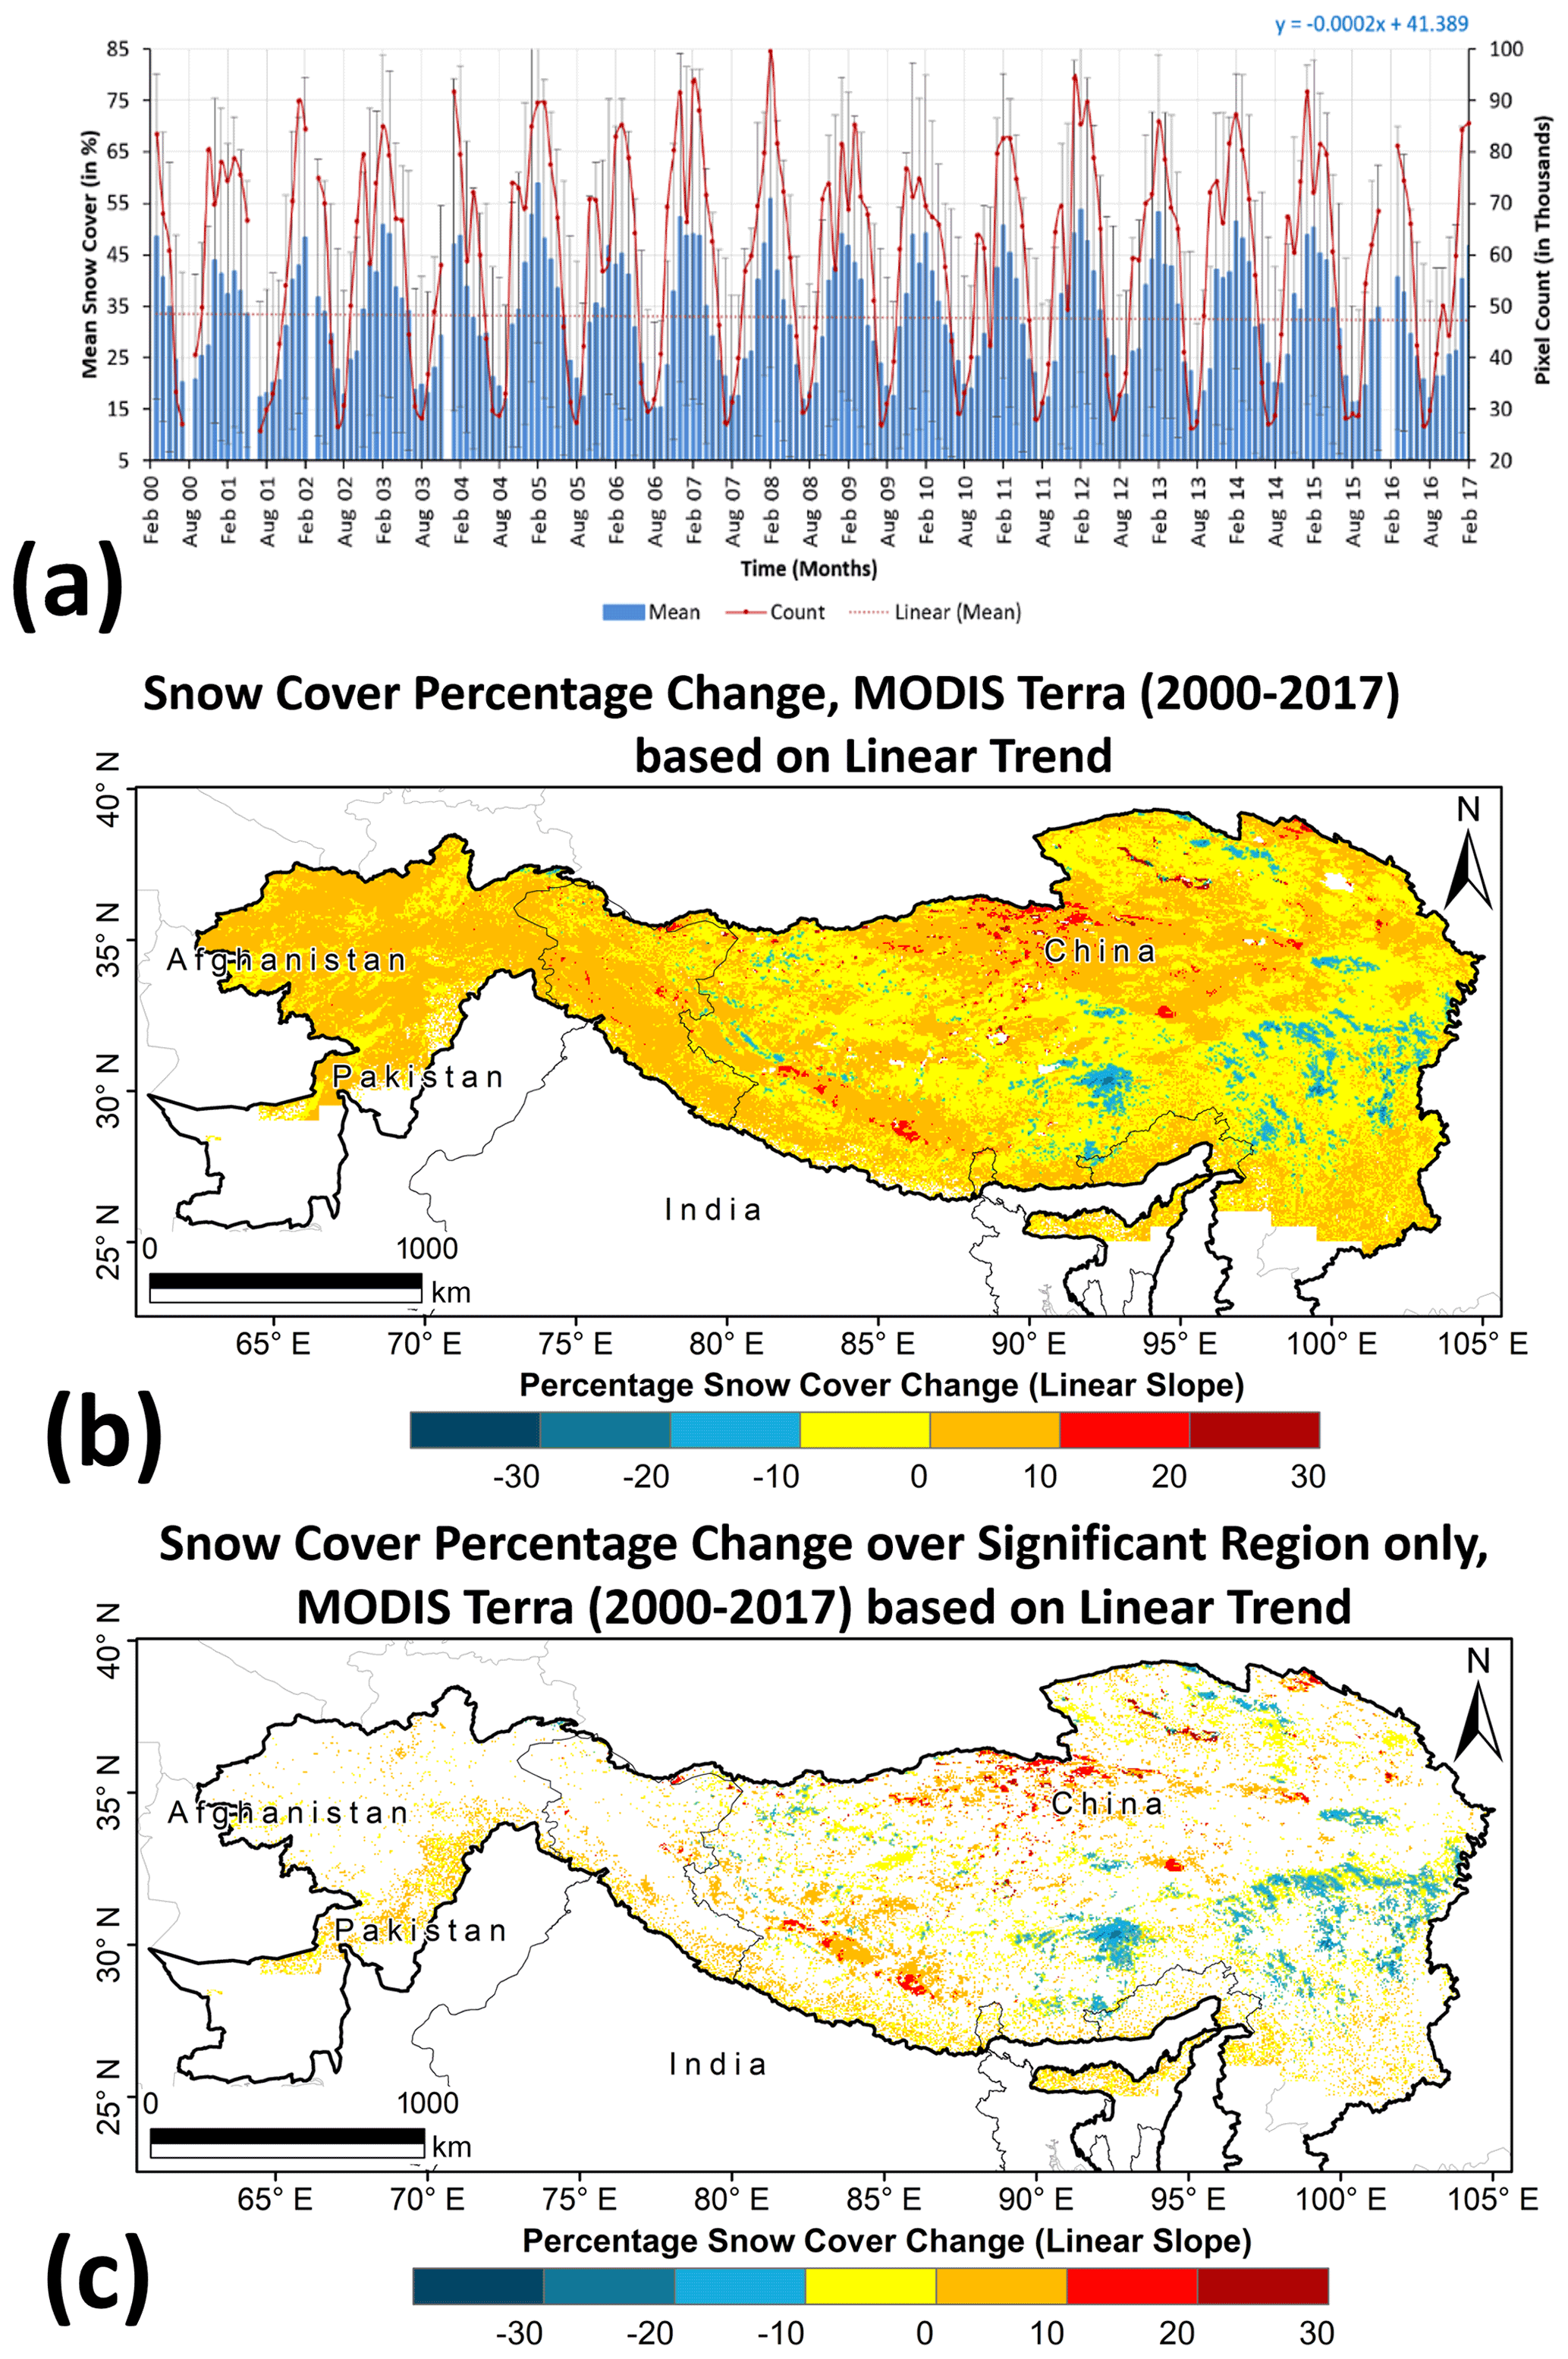
Figure 5(a) The time series analysis of monthly mean MODIS snow cover during 2000–2016 over the HKH region. The snow cover variability (percentage change) was derived from monthly MODIS Terra data during 17 years (March 2000 to February 2017) for (b) the entire HKH region and (c) statistically significant subregions of the HKH region only.
The pixel-level trend analysis (linear fit) at 5 km grid resolution, based on the monthly time series of mean snow cover for the entire HKH region (Fig. 5b), shows large spatial variability, as calculated from the slope of the linear fit. Figure 5c presents the statistically significant (95 % confidence interval – CI) pixels or aggregates of pixels (regions) where the linear trend is strongly positive or negative (−30 % to 30 %). The central Himalayan mountains and northern parts of Nepal show a significant increase in snow cover (red and brown zones; 10 % to 30 %), whereas parts of Arunachal Pradesh and the eastern Himalayan and Tibetan Plateau show a significant and large decline in the snow cover (green zones; −10 % to −30 %). Snow and glacier images from Arunachal Pradesh show a large decline in snow cover and signs of glacier melting (Prasad and Singh, 2007). For example, a recent study (Basnett et al., 2013) of the changes in the area of glaciers in the Teesta basin occupying ∼ 200 km2, Sikkim, Eastern Himalayas, show a loss of 3.3±0.08 % in the area and an increase in the debris-covered area by 6.5±1.4 km2 during 1989–1990 and 2010 time frame. The light yellow regions in Fig. 5c represent statistically significant regions where the linear trend is found to be negative (up to −10 %).
The hypsographic curve depicting total changes in snow cover for the entire HKH region for the 2000–2017 period, obtained from a linear (LIN) fit, is shown in Fig. 6a. The thick solid line (red/black) represents the aggregates of values at 100 m intervals, and the thin red/black horizontal bars represent percentage changes at 1 m intervals. The red color is the altitudinal variation in the total changes in snow cover for statistically significant regions only, whereas the black line is for the entire region (including both statistically significant and insignificant areas). The red line, for statistically significant regions, shows larger variability and clearly indicates an overall loss in snow cover with altitude. The total change in snow cover (100 m aggregates) is found to be about −5 % for altitudes of 4001–4500 and 5501–6000 m. However, the thin horizontal red lines indicate that the statistically significant loss for specific regions can vary and be even higher, i.e., −5 % to −15 % (Fig. 6a).
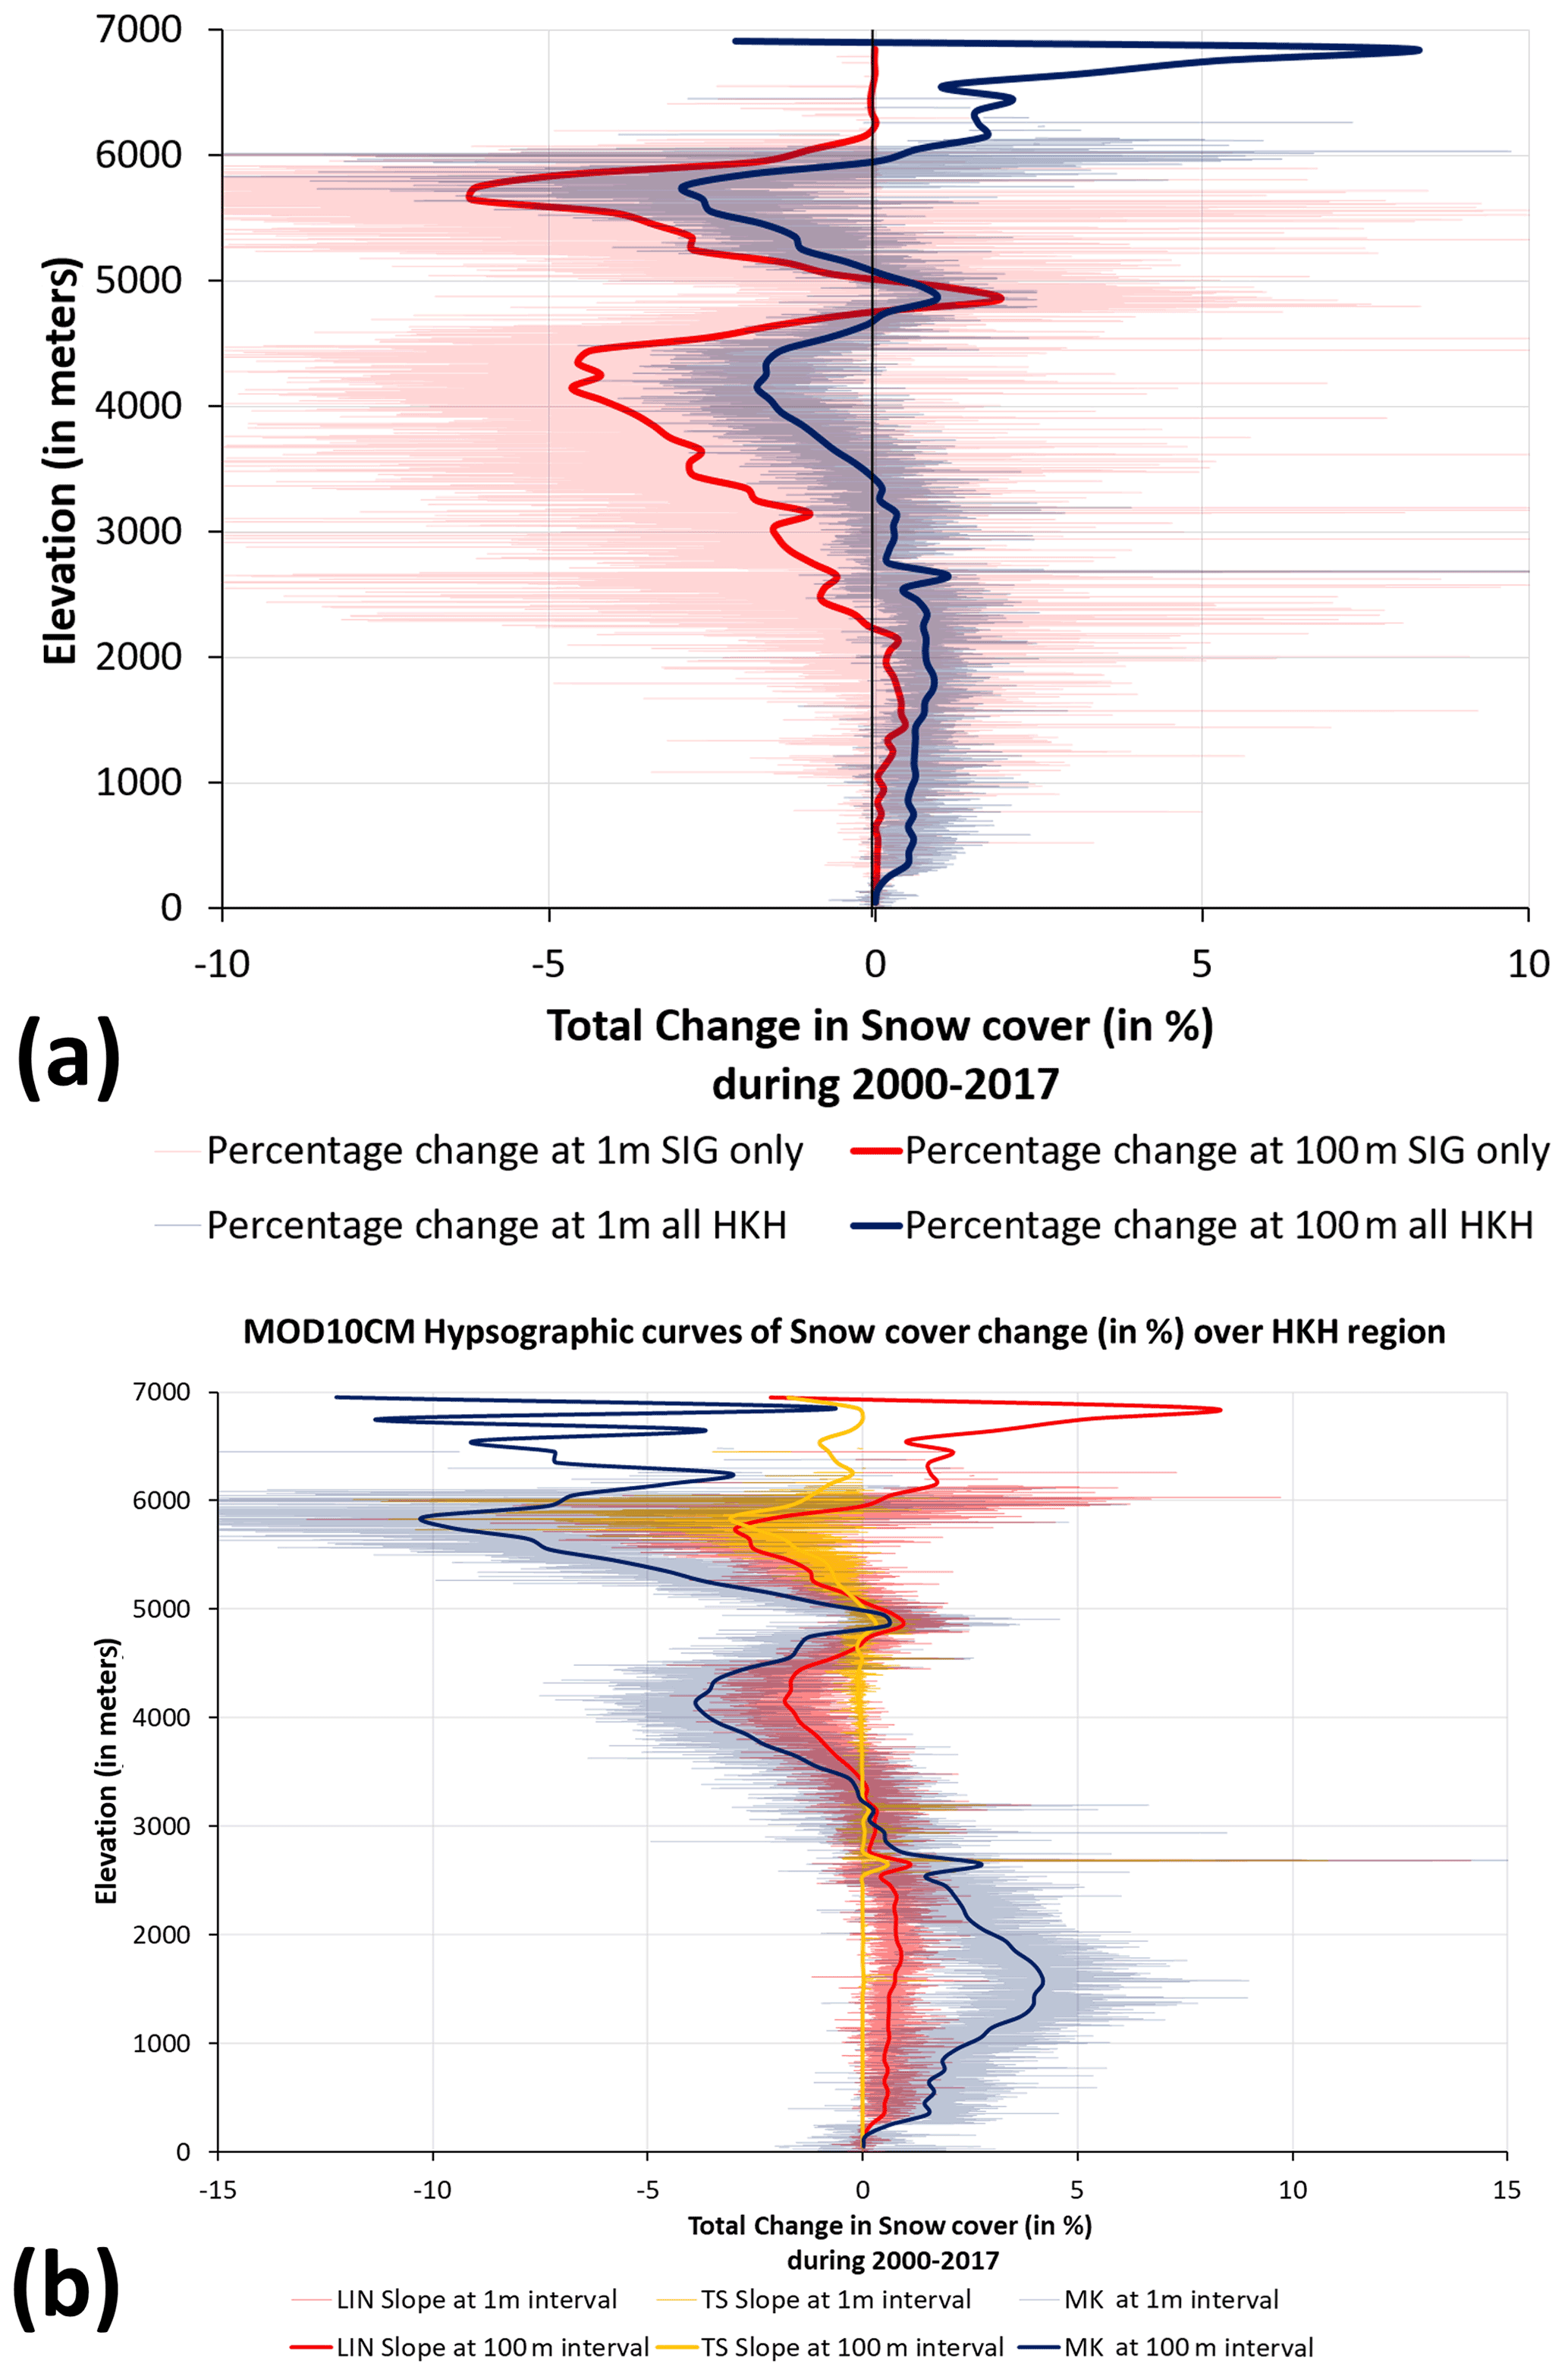
Figure 6The altitude-wise trend analysis (hypsographic curves) for the (a) snow cover change (in percent) derived from the linear fit (Pearson product–moment correlation; LIN) over the entire HKH region (black curve) and statistically significant trend regions only (red curve). (b) The linear fit model (red curve) over the HKH region (LIN) is compared with the median trend (Theil–Sen – TS) and the monotonic trend (Mann–Kendall statistics, MK; z score) analysis.
Figure 6c presents the hypsographic curve depicting the total changes in snow cover over for the entire HKH region during 2000–2017, obtained from the linear trend (LIN; Pearson product–moment linear correlation) and the median trend (TS – Theil–Sen). The variability in rate of change of snow cover, based on these analyses, are largely similar over the range of altitude for relatively long time series (17 years). The mean rate of change (LIN method) shows a peak between altitudes of 4001–4500 m (about −2.5 %) and 5501–6000 m (about −3 %). We obtained a similar linear trend from median trend analysis (TS) and the monotonic trend (MK statistics). The z score is shown in the same scale as LIN and TS, for comparison in Fig. 6b. Overall, the trend analysis (LIN, TS, and MK; Fig. 6b) clearly shows a large reduction in the glacier cover area only for 4001–4500 m and very high altitude regions (5501–6000 m). The statistically significant regions, as in a linear trend analysis (Fig. 6a), clearly show a large decline in snow cover (average of 5 % or more; at 100 m intervals) between altitudes of 4001–4500 and 5501–6000 m. The mean snow cover percent change is found to be −1.0 % and −2.0 % in Zones 4 and 5, respectively (Table 4). The altitudinal change in snow cover shows that only a limited part of the HKH region located in the 6001–7000 m elevation (between Zones 2 and 4 and between 70–100∘ E; Table 5) is found to be positive, thereby implying that no decline in snow cover is observed in very high altitude regions (above 6000 m).
Table 4The zonal changes in snow cover (in percent) derived from the linear fit (LIN). Note: SCP is the snow cover percentage; SD is the standard deviation.
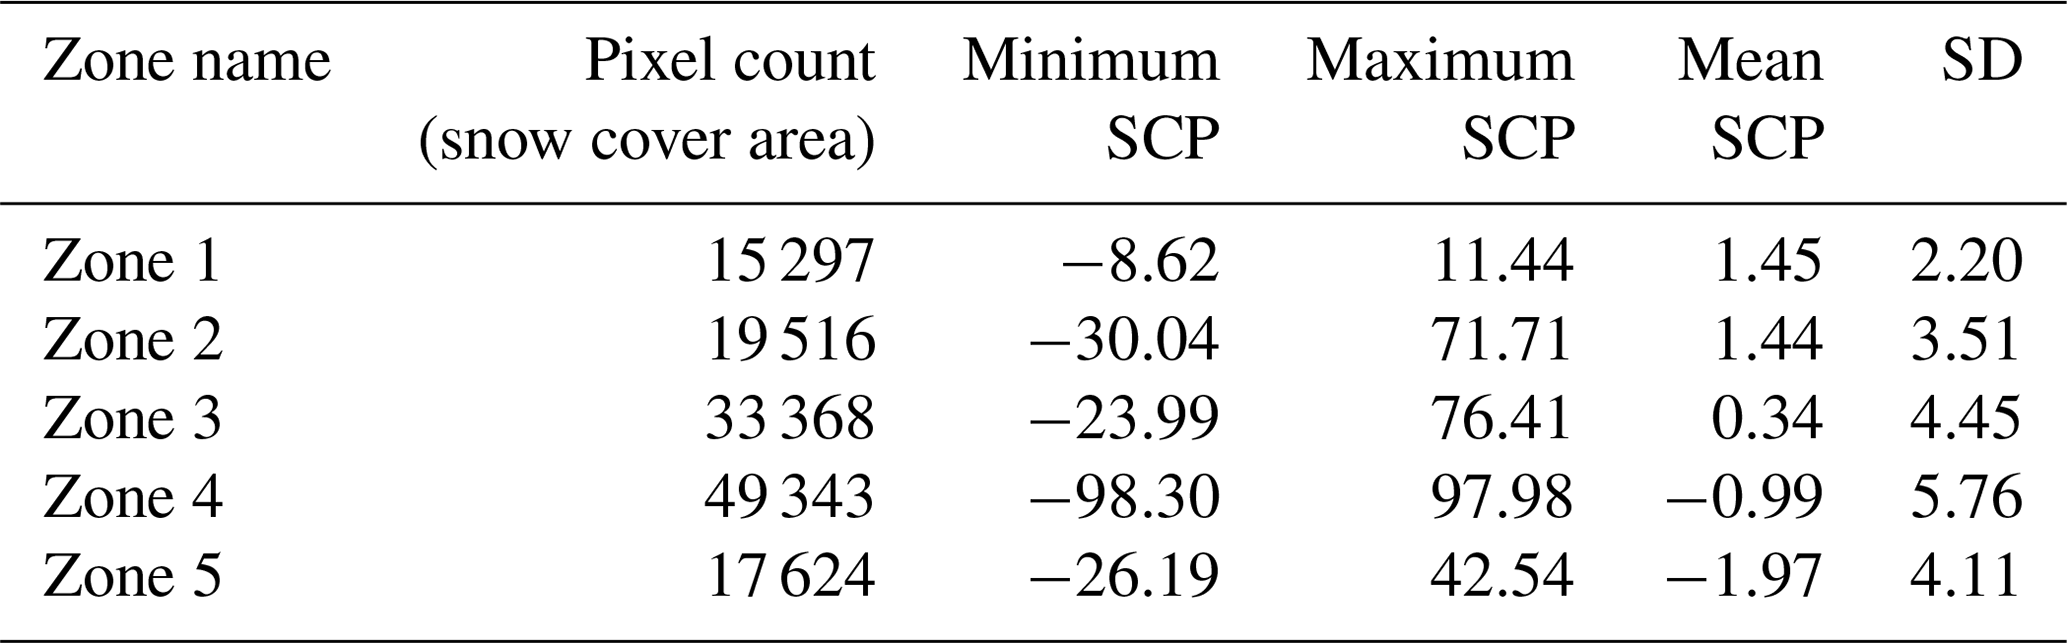
Table 5The zonal changes in snow cover (in percent) at 500 m elevation intervals derived from the linear fit (LIN).
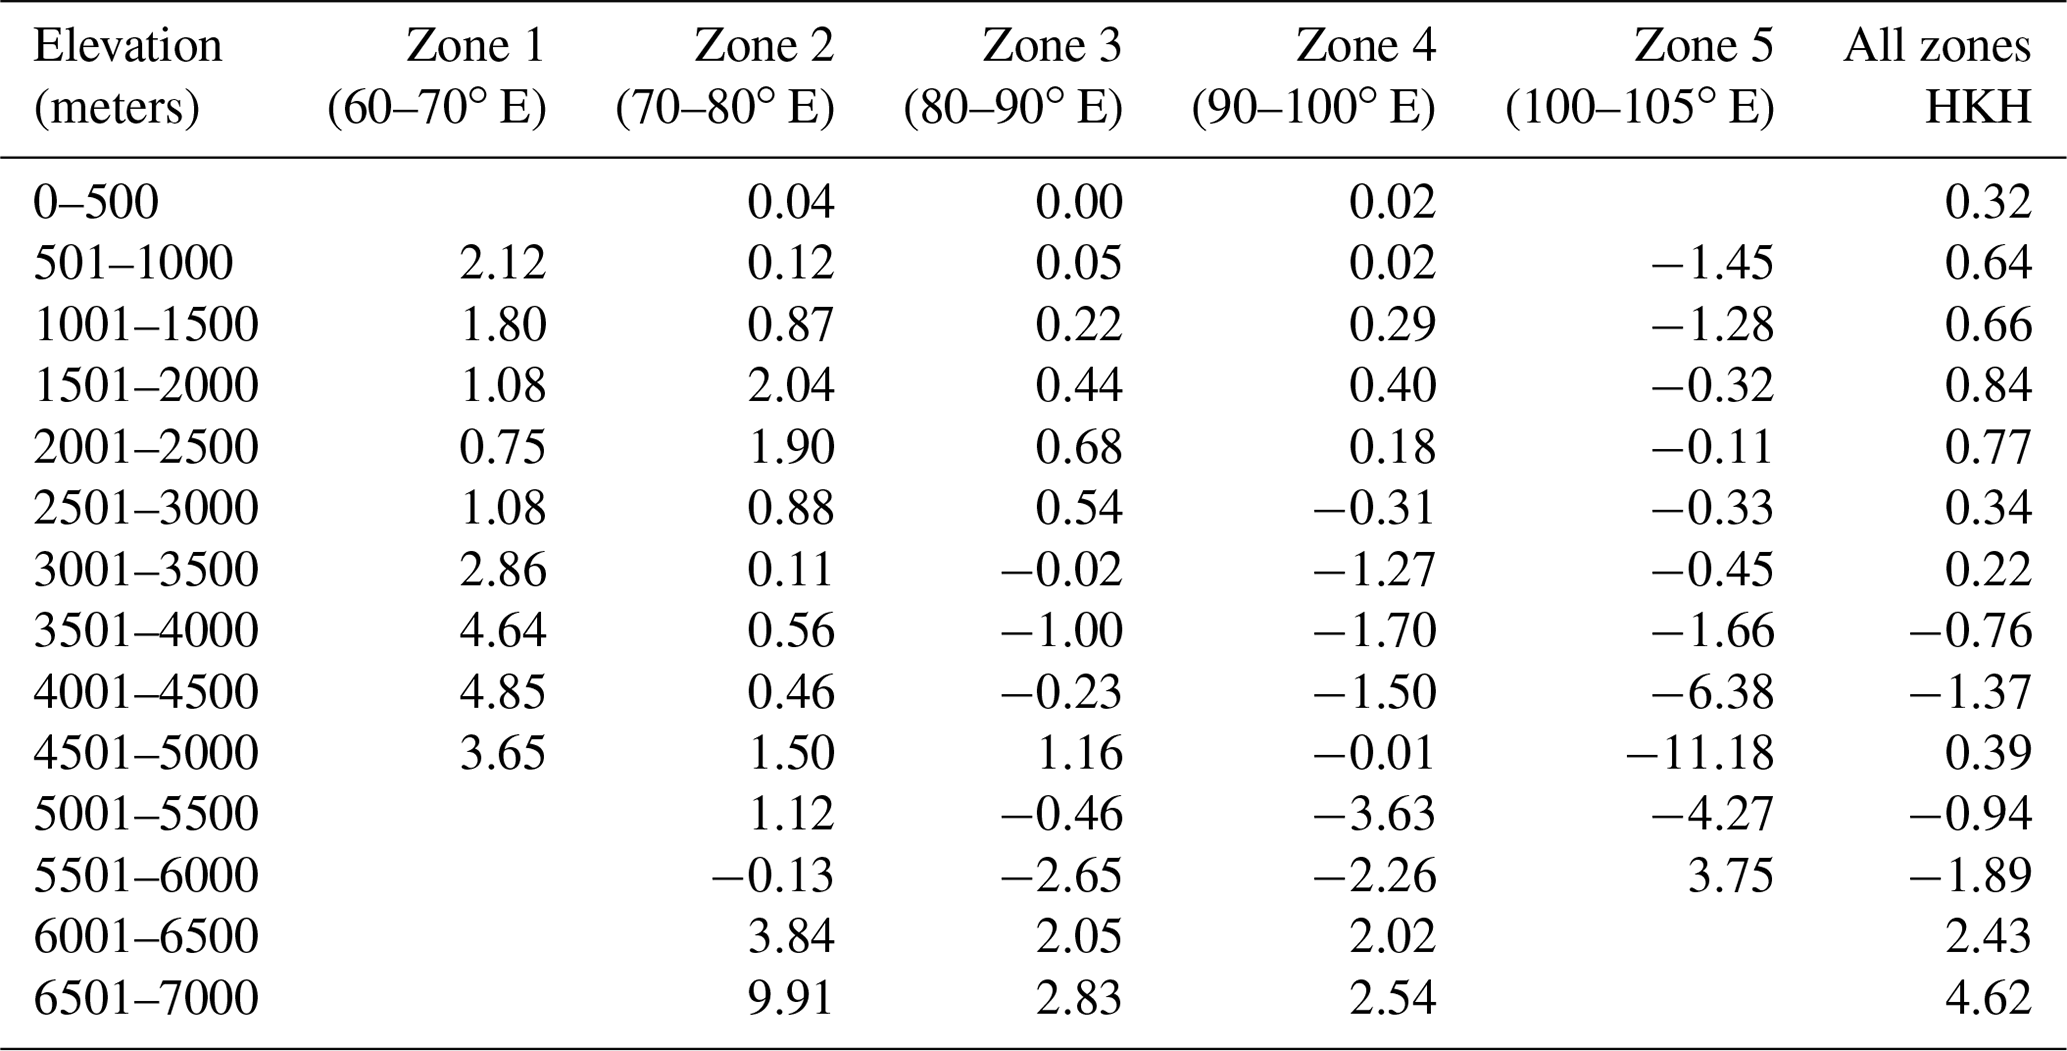
Table 5 is the summary of the overall zonal trend analysis for the entire study period (2000–2017). The change in snow cover is presented as an average at 500 m intervals. The regions at altitudes of 3501–4500 and 5001–6000 m show a decline in snow cover, but this decline varies widely for different altitudes and zones (west to east). For example, the westernmost zone (Zone 1; 60–70∘ E) extends up to 5000 m altitude but does not show any decline in snow cover. The adjacent Zone 2 (70–80∘ E) shows a decline in snow cover (−0.13 %) between 5501 and 6000 m altitude, whereas no such decline is observed at very high altitudes (6001–7000 m). The central region (Zone 3; 80–90∘ E), extending up to 7000 m altitude, shows more signs of decline in snow cover between 3001–4500 and 5001–6000 m elevations, whereas no such decline is observed at higher altitudes (6001–7000 m). Further east, Zone 4 (90–100∘ E) shows greater signs of the overall decline in snow cover from 2501 to 6000 m in elevation, whereas no such decline is observed at higher altitudes (6001–7000 m). The eastern zone (Zone 5) is the most affected, showing a decline in snow cover at all altitudes (501–5500 m), except at the highest altitude in this region (5501–6000 m). The largest decline is found to be around −11.2 %, between 4501 and 5000 m altitude, in Zone 5.
The observed linear trend, for altitudes between 3001 and 7000 m at an interval of 500 m, suggests that it may take hundreds of years for any drastic change in the mean snow and glacier cover, especially at higher altitudes (6001–7000 m; Fig. 7). The altitudinal linear trend for 3001–7000 m, at 500 m intervals for the study period (2000–2017), shows that it may take 76–94 years for approximately 25 % decline in the mean snow cover for altitudes of 3001–4500 and 5501–6000 m, and hundreds or thousands of years for 4501–5500 and 6001–7000 m altitudes, over the HKH region (Fig. 7).
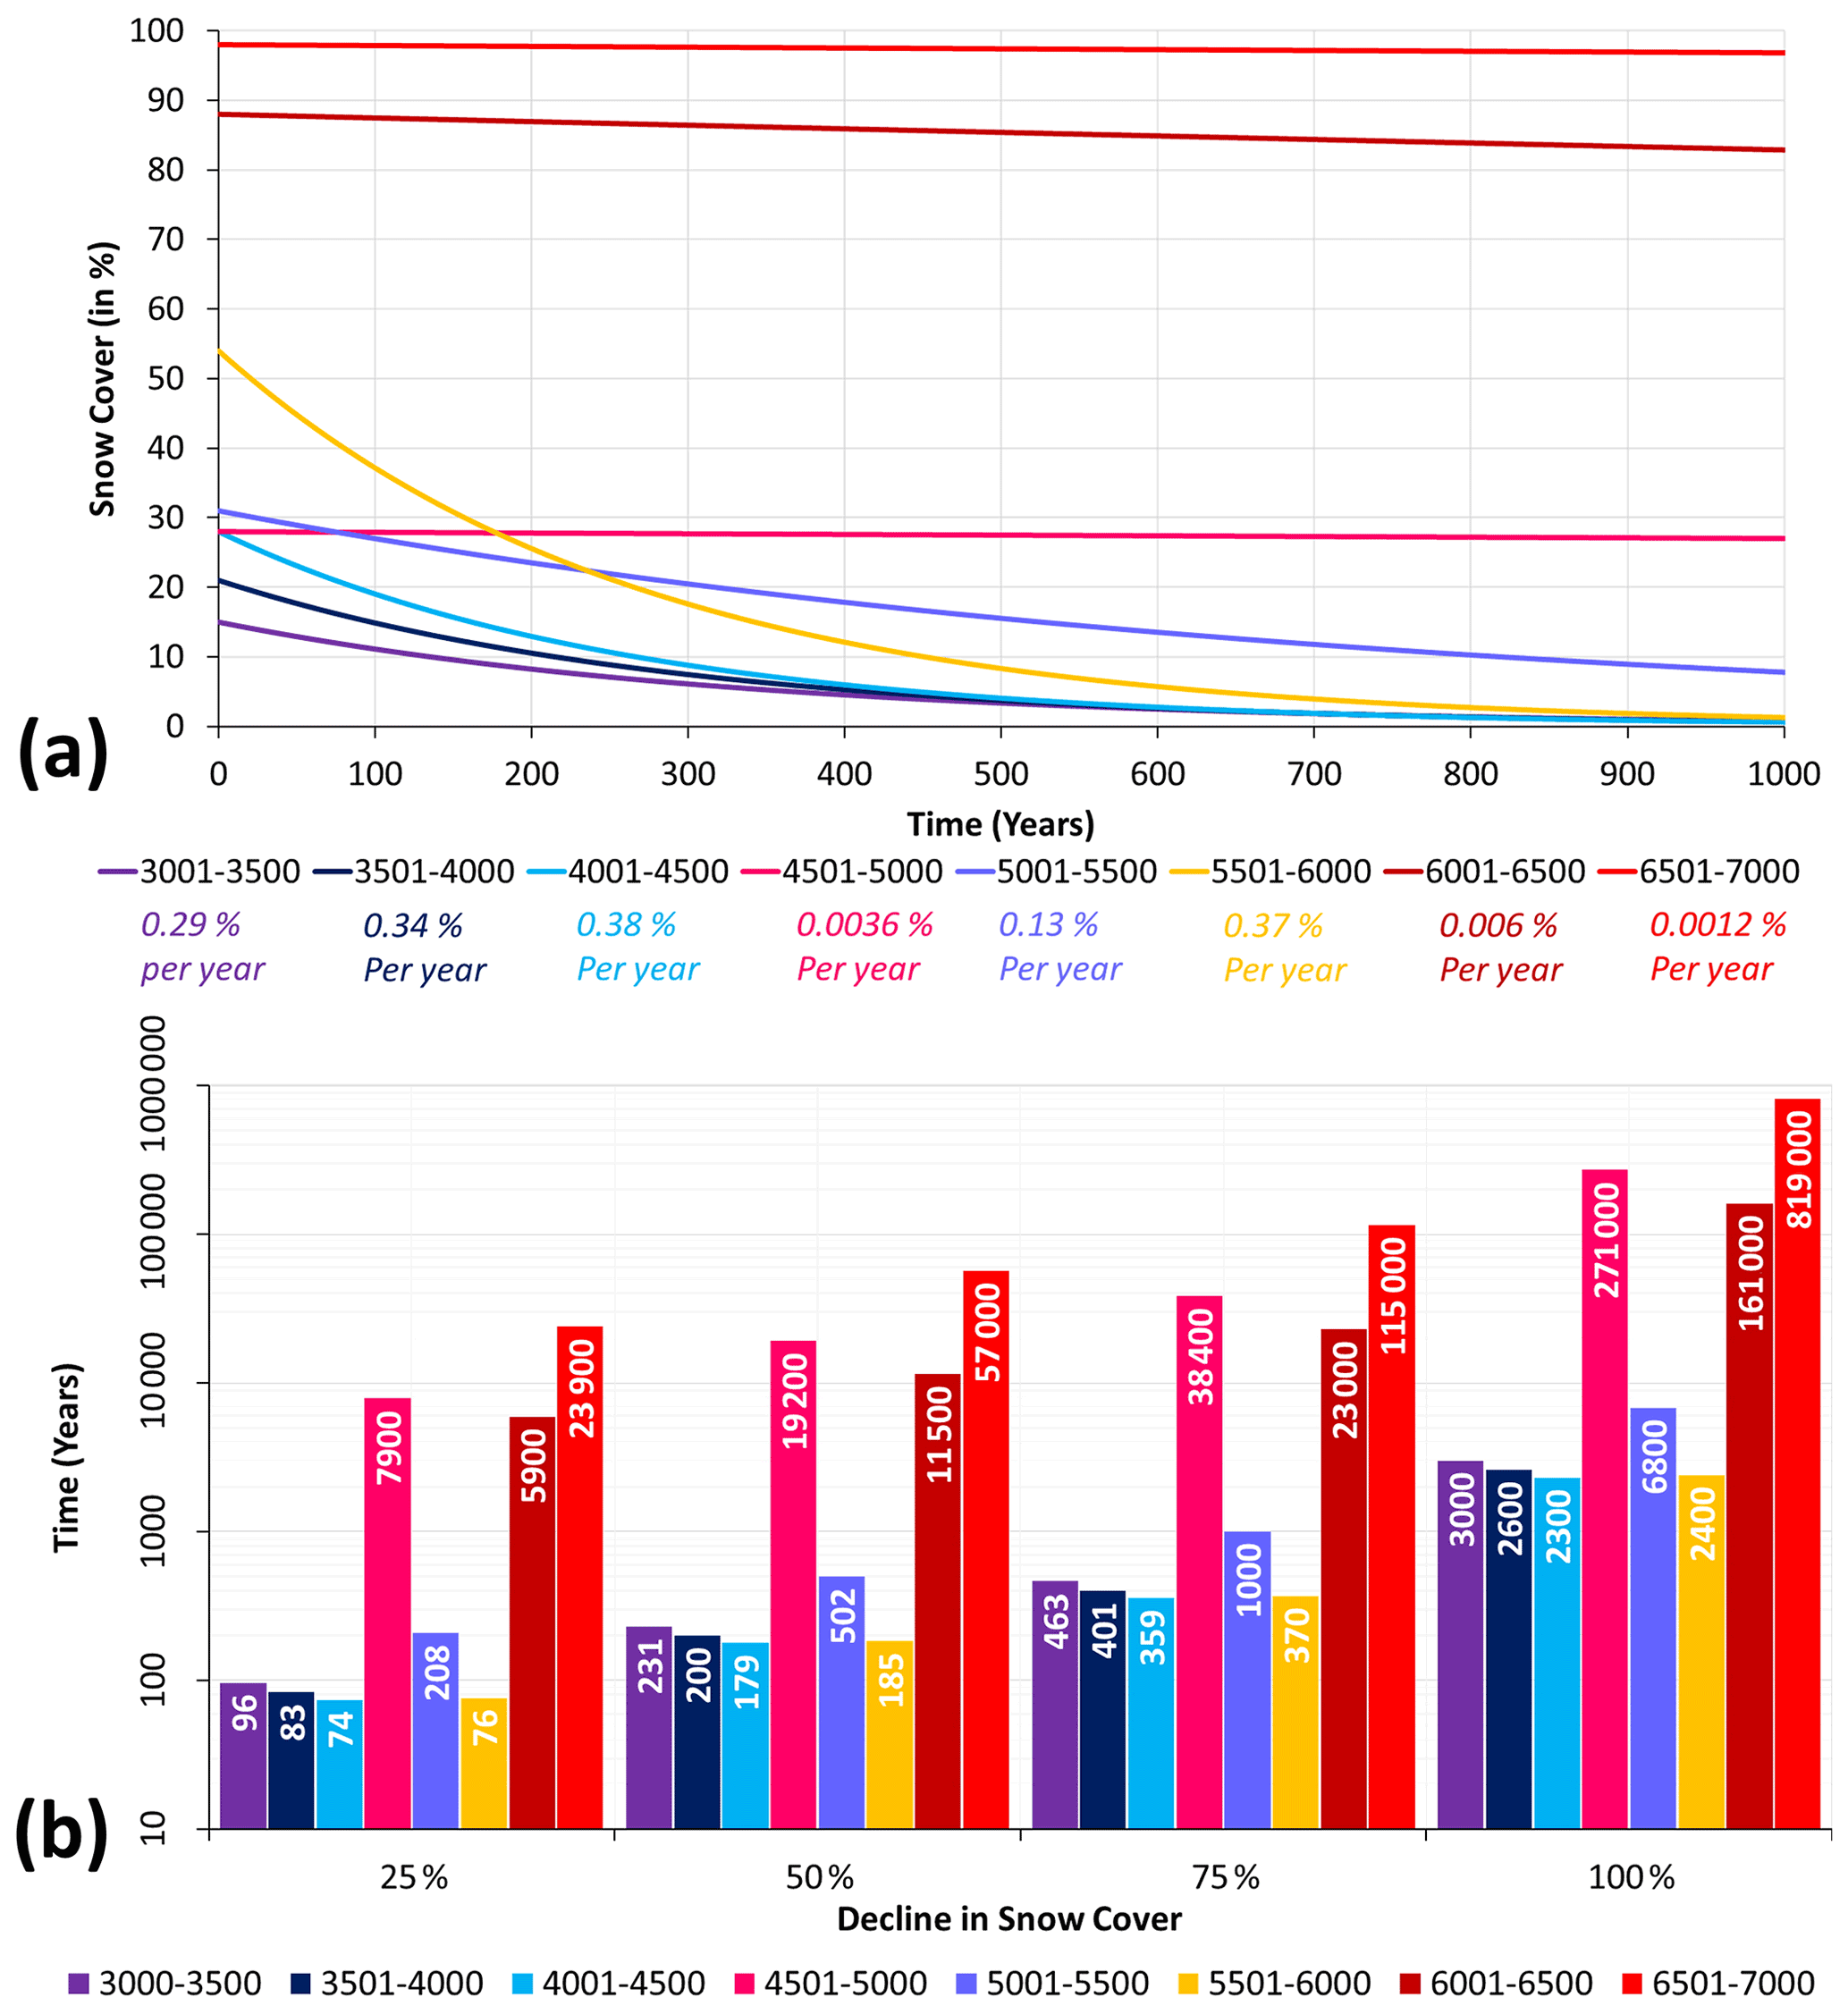
Figure 7The results from the linear trend analysis of the snow cover change (mainly reduction) during 2000–2017 and in the subsequent years over the HKH region and where the trend was found to be statistically significant (95 % CI).
We found spatial and altitudinal changes in the snow and glacier cover during 2000–2017 for the Hindu Kush Himalayan (HKH) region. There is significant heterogeneity and variability in these changes due to the vast area that this region covers. We conducted a zonal and altitudinal analysis of these changes using a variety of statistical analyses. We found the following:
-
Zonal (western, central, and eastern) variations in snow cover are prominent where the highest snow and glacier cover is found in the western zones. Zones 1 and 2, located between 60 and 80∘ E, show snow cover at 46.4 % and 48.2 %, respectively.
-
The variation in snow cover with altitude, calculated at 500 m intervals, is not uniform across the HKH region. Zones 2–5, located between 70 and 100∘ E, show snow cover greater than 93 % between 6001 and 7000 m altitude and between 5501 and 6000 m in Zone 5.
-
The mean snow cover for the study period (2000–2017) during melting or accumulating seasons generally remains below 40 %, up to ∼ 5500 m in altitude, but rapidly increases to > 90 % at higher altitudes (6000–7000 m).
-
In general, the mean snow cover during the study period (2000–2017) was found to be below 30 % for 3001–5000 m altitude during the melting season (March to August), but it is greater than 30 % during the accumulating season (September to February).
-
The average decreasing rate of snow cover or glacier area is very low (−0.0024 % per year or −0.024 % per decade), based on a linear trend analysis (LIN), and is insignificant for the entire region. However, the HKH region shows large and contrasting regional variations both across the zones (west to east) and also with altitude.
-
The central and eastern zones (Zones 3–5; 80–105∘ E) of the HKH show a more prominent decline in snow cover compared to Zones 1 and 2 (60–80∘ E). In contrast, the western zones (Zones 1 and 2) contain specific regions where the snow cover trend is found to be positive (increased during the study period).
-
At higher altitudes, particularly between 6001 and 7000 m, all zones (Zones 2–4) show an increasing trend compared to a contrasting declining trend at relatively lower altitudes (5501–6000 m).
-
The declining trend of snow cover is observed at increasingly lower altitudes and is moving eastwards from Zones 3–5. Zone 5 shows a negative trend at all altitudes, except at the highest altitude (5501–6000 m).
-
The linear trend analysis for altitudinal changes suggests that it may take 76–94 years for a 25 % decline in the mean snow cover for 3001–4500 and 5501–6000 m altitudes, and perhaps hundreds of years for 4501–5500 m and 6001–7000 m altitudes, over the HKH region.
-
Though the increasing trend is observed over specific regions, a substantial decline in some specific zones/regions that were observed from a temporal trend analysis is a cause for concern.
It is observed that the long-term datasets, with higher spatial and temporal resolution, will provide greater insight for regions that show major anomalies and rapid changes. The current work is an attempt to offer analysis across this extremely sensitive region in order to establish a case for increased attention to the influence of climate on snow cover globally. As the satellite-derived dataset expands, future studies can utilize even longer-term datasets to evaluate the validity of the findings and conclusions of this study.
The code, algorithms, tools, and/or modules required for data analysis are available from the NASA National Snow and Ice Data Center (NSIDC; https://nsidc.org/data/tools/analysis-and-imaging, National Snow & Ice Data Center, 2017), Microsoft Excel, ArcGIS, TerrSet, and QGIS.
The MODIS snow cover data used in this study can be downloaded from the NASA National Snow and Ice Data Center (NSIDC) Distributed Active Archive Center (DAAC; https://doi.org/10.5067/MODIS/MOD10CM.006, Hall and Riggs, 2015). The Shuttle Radar Topography Mission (SRTM) 90 m gridded digital elevation model (DEM) version 4.1 can be obtained from the CGIAR Consortium for Spatial Information (CGIAR-CSI) geoportal (http://srtm.csi.cgiar.org, Jarvis et al., 2008).
AKP and ND initiated the work on the subject, in discussion with HEA, MK, and GRA. ND downloaded and processed all the data and created the first draft of the tables and figures, in consultation with AKP. ND created the first draft of the paper. GRA and MK carried out the revision of the first draft and the subsequent versions. All authors participated in the scientific discussions, development, and revision and approved the final draft.
The contact author has declared that neither they nor their co-authors have any competing interests.
Publisher's note: Copernicus Publications remains neutral with regard to jurisdictional claims in published maps and institutional affiliations.
The authors are grateful to the NASA National Snow and Ice Data Center (NSIDC) Distributed Active Archive Center (DAAC) for providing snow-cover-related data since the launch of Moderate Resolution Imaging Spectroradiometer (MODIS) on board Terra. The authors are thankful to the CGIAR Consortium for Spatial Information (CGIAR-CSI) geoportal for providing the Shuttle Radar Topography Mission (SRTM) 90 m gridded digital elevation model (DEM) version 4.1 used in this study.
This paper was edited by Petr Pisoft and reviewed by Sebastian Roessler and two anonymous referees.
Bamzai, A. and Shukla, J.: Relation between Eurasian snow cover, snow depth, and the Indian summer monsoon: An observational study, J. Climate, 12, 3117–3132, https://doi.org/10.1175/1520-0442(1999)012<3117:RBESCS>2.0.CO;2, 1999.
Basnett, S., Kulkarni, A. V., and Bolch, T.: The influence of debris cover and glacial lakes on the recession of glaciers in Sikkim Himalaya, India, J. Glaciol., 59, 1035–1046, https://doi.org/10.3189/2013JoG12J184, 2013.
Berthier, E., Arnaud, Y., Kumar, R., Ahmad, S., Wagnon, P., and Chevallier, P.: Remote sensing estimates of glacier mass balances in the Himachal Pradesh (Western Himalaya, India), Remote Sens. Environ., 108, 327–338, https://doi.org/10.1016/j.rse.2006.11.017, 2007.
Bolch, T.: Climate change and glacier retreat in northern Tien Shan (Kazakhstan/Kyrgyzstan) using remote sensing data, Global Planet. Change, 56, 1–12, https://doi.org/10.1016/j.gloplacha.2006.07.009, 2007.
Bolch, T., Kulkarni, A., Kääb, A., Huggel, C., Paul, F., Cogley, J. G., Frey, H., Kargel, J. S., Fujita, K., Scheel, M., Bajracharya, S., and Stoffel, M.: The state and fate of himalayan glaciers, Science, 336, 310–314, https://doi.org/10.1126/science.1215828, 2012.
Bookhagen, B. and Burbank, D. W.: Toward a complete Himalayan hydrological budget: Spatiotemporal distribution of snowmelt and rainfall and their impact on river discharge, J. Geophys. Res.-Earth, 115, 1–25, https://doi.org/10.1029/2009JF001426, 2010.
Chaturvedi, R. K., Joshi, J., Jayaraman, M., Bala, G., and Ravindranath, N. H.: Multi-model climate change projections for India under representative concentration pathways, Curr. Sci. India, 103, 791–802, 2012.
Chen, W., White, L., Leblanc, S. G., Latifovic, R., and Olthof, I.: Elevation-Dependent Changes to Plant Phenology in Canada's Arctic Detected Using Long-Term Satellite Observations, Atmosphere, 12, 1133, https://doi.org/10.3390/atmos12091133, 2021.
Cogley, J. G.: Glacier shrinkage across High Mountain Asia, Ann. Glaciol., 57, 41–49, https://doi.org/10.3189/2016AoG71A040, 2016.
Duan, A. and Wu, G.: Change of cloud amount and the climate warming on the Tibetan Plateau, Geophys. Res. Lett., 33, L22704, https://doi.org/10.1029/2006GL027946, 2006.
Duo, C., Xie, H., Wang, P., Guo, J., La, J., Qiu, Y., and Zheng, Z.: Snow cover variation over the Tibetan Plateau from MODIS and comparison with ground observations, J. Appl. Remote Sens., 8, 084690, https://doi.org/10.1117/1.jrs.8.084690, 2014.
Frei, A., Tedesco, M., Lee, S., Foster, J., Hall, D. K., Kelly, R., and Robinson, D. A.: A review of global satellite-derived snow products, Adv. Space Res., 50, 1007–1029, https://doi.org/10.1016/j.asr.2011.12.021, 2012.
Gautam, R., Hsu, N. C., Lau, W. K.-M., and Yasunari, T. J.: Satellite observations of desert dust-induced Himalayan snow darkening: DUST-INDUCED HIMALAYAN SNOW DARKENING, Geophys. Res. Lett., 40, 988–993, https://doi.org/10.1002/grl.50226, 2013.
Gurung, D. R., Kulkarni, A. V., Giriraj, A., Aung, K. S., and Shrestha, B.: Monitoring of seasonal snow cover in Bhutan using remote sensing technique, Curr. Sci. India, 101, 1364–1370, 2011.
Hall, D. K. and Riggs, G. A.: Accuracy assessment of the MODIS snow products, Hydrol. Process., 21, 1534–1547, https://doi.org/10.1002/hyp.6715, 2007.
Hall, D. K. and Riggs, G. A.: MODIS/Terra Snow Cover Monthly L3 Global 0.05Deg CMG, Version 6, [MOD10CM], Boulder, Colorado USA, NASA National Snow and Ice Data Center Distributed Active Archive Center [data set], https://doi.org/10.5067/MODIS/MOD10CM.006, 2015.
Hall, D. K., Riggs, G. A., and Salomonson, V. V.: MODIS snow and sea ice products, in: Earth Science Satellite Remote Sensing: Science and Instruments, Earth Science Satellite Remote Sensing: Science and Instrument, 154–181, ISBN 978-3-642-42154-9, 2006.
Hoaglin, D. C., Mosteller, F., and Tukey, J. W.: Understanding Robust and Exploratory Data Analysis, Wiley, ISBN 978-0-471-38491-5, 2000.
Immerzeel, W.: Historical trends and future predictions of climate variability in the Brahmaputra basin, Int. J. Climatol., 28, 243–254, https://doi.org/10.1002/joc.1528, 2008.
Immerzeel, W. W., van Beek, L. P. H., and Bierkens, M. F. P.: Climate Change Will Affect the Asian Water Towers, Science, 328, 1382–1385, https://doi.org/10.1126/science.1183188, 2010.
IPCC: Impacts, Adaptation and Vulnerability : Contribution of Working Group II to the Fourth Assessment Report of the Intergovernmental Panel on Climate Change, Cambridge University Press, Cambridge, UK, New York, ISBN 978-0-521-88010-7, 2007.
Jarvis, A., Reuter, H. I., Nelson, A., and Guevara, E.: Hole-filled SRTM for the globe Version 4, available from the CGIAR-CSI SRTM 90m Database, available at: http://srtm.csi.cgiar.org (last access: 30 January 2017), 2008.
Kang, S., Zhang, Q., Qian, Y., Ji, Z., Li, C., Cong, Z., Zhang, Y., Guo, J., Du, W., Huang, J., You, Q., Panday, A. K., Rupakheti, M., Chen, D., Gustafsson, Ö., Thiemens, M. H., and Qin, D.: Linking atmospheric pollution to cryospheric change in the Third Pole region: current progress and future prospects, Nat. Sci. Rev., 6, 796–809, https://doi.org/10.1093/nsr/nwz031, 2019.
Klein, A. G. and Barnett, A. C.: Validation of daily MODIS snow cover maps of the Upper Rio Grande River Basin for the 2000–2001 snow year, Remote Sens. Environ., 86, 162–176, https://doi.org/10.1016/S0034-4257(03)00097-X, 2003.
Kulkarni, A. V.: Glacial retreat in Himalaya using Indian remote sensing satellite data, Asia-Pacific Remote Sensing Symposium, Goa, India, 12 December 2006, 641117, https://doi.org/10.1117/12.694004, 2006.
Muhuri, A., Manickam, S., Bhattacharya, A., and Snehmani: Snow Cover Mapping Using Polarization Fraction Variation With Temporal RADARSAT-2 C-Band Full-Polarimetric SAR Data Over the Indian Himalayas, IEEE J. Sel. Top. Appl., 11, 2192–2209, https://doi.org/10.1109/JSTARS.2018.2817687, 2018.
Muhuri, A., Gascoin, S., Menzel, L., Kostadinov, T., Harpold, A., Sanmiguel-Vallelado, A., and Lopez Moreno, J. I.: Performance Assessment of Optical Satellite Based Operational Snow Cover Monitoring Algorithms in Forested Landscapes, IEEE J. Sel. Top. Appl., 14, 1–1, https://doi.org/10.1109/JSTARS.2021.3089655, 2021.
National Snow & Ice Data Center: GPD Viewer, available at: https://nsidc.org/data/tools/analysis-and-imaging, last access: 30 January 2017.
Neeti, N. and Eastman, J. R.: A Contextual Mann-Kendall Approach for the Assessment of Trend Significance in Image Time Series: A Novel Method for Testing Trend Significance, T. GIS, 15, 599–611, https://doi.org/10.1111/j.1467-9671.2011.01280.x, 2011.
Pachauri, R. K.: Climate Change 2014 Synthesis Report, ISBN 9789291691432, 9291691437, 2014.
Panday, P. K., Frey, K. E., and Ghimire, B.: Detection of the timing and duration of snowmelt in the Hindu Kush-Himalaya using QuikSCAT, Environ. Res. Lett., 2000–2008, 6, https://doi.org/10.1088/1748-9326/6/2/024007, 2011.
Pandey, P., Kulkarni, A. V., and Venkataraman, G.: Remote sensing study of snowline altitude at the end of melting season, Chandra-Bhaga basin, Himachal Pradesh, 1980–2007, Geocarto International, 28, 311–322, https://doi.org/10.1080/10106049.2012.705336, 2013.
Parajka, J., Pepe, M., Rampini, A., Rossi, S., and Blöschl, G.: A regional snow-line method for estimating snow cover from MODIS during cloud cover, J. Hydrol., 381, 203–212, https://doi.org/10.1016/j.jhydrol.2009.11.042, 2010.
Prasad, A. K. and Singh, R.: Changes in Himalayan snow and glacier cover between 1972 and 2000, EOS T. Am. Geophys. Un., 88, 326, https://doi.org/10.1029/2007EO330002, 2007.
Prasad, A. K., Yang, K.-H. S., El-Askary, H. M., and Kafatos, M.: Melting of major Glaciers in the western Himalayas: evidence of climatic changes from long term MSU derived tropospheric temperature trend (1979–2008), Ann. Geophys., 27, 4505–4519, https://doi.org/10.5194/angeo-27-4505-2009, 2009.
Prasad, A. K., Elaskary, H. M., Asrar, G. R., Kafatos, M., and Jaswal, A.: Melting of Major Glaciers in Himalayas: Role of Desert Dust and Anthropogenic Aerosols, in: Planet Earth 2011, edited by: Carayannis, E. G., IntechOpen, Rijeka, https://doi.org/10.5772/23235, 2011.
Pratibha, S. and Kulkarni, A. V.: Decadal Change in Supraglacial Debris Cover in Baspa Basin, Western Himalaya, Curr. Sci. India, 114, 792, https://doi.org/10.18520/cs/v114/i04/792-799, 2018.
Raup, B., Racoviteanu, A., Khalsa, S. J. S., Helm, C., Armstrong, R., and Arnaud, Y.: The GLIMS geospatial glacier database: A new tool for studying glacier change, Global Planet. Change, 56, 101–110, https://doi.org/10.1016/j.gloplacha.2006.07.018, 2007.
Rikiishi, K. and Nakasato, H.: Height dependence of the tendency for reduction in seasonal snow cover in the Himalaya and the Tibetan Plateau region, 1966–2001, Ann. Glaciol., 43, 369–377, https://doi.org/10.3189/172756406781811989, 2006.
Salomonson, V. V. and Appel, I.: Estimating fractional snow cover from MODIS using the normalized difference snow index, Remote Sens. Environ., 89, 351–360, https://doi.org/10.1016/j.rse.2003.10.016, 2004.
Shrestha, A., Agrawal, N., Alfthan, B., Bajracharya, S., Maréchal, J., and van Oort, B.: the Himalayan Climate and Water Atlas, 1000 pp., ISBN 978-92-9115-356-5, 978-92-9115-357-2, 2015.
Shrestha, A. B., Wake, C. P., Mayewski, P. A., and Dibb, J. E.: Maximum Temperature Trends in the Himalaya and Its Vicinity: An Analysis Based on Temperature Records from Nepal for the Period 1971–94, J. Climate, 12, 2775–2786, 1999.
Siderius, C., Biemans, H., Wiltshire, A., Rao, S., Franssen, W. H. P., Kumar, P., Gosain, A. K., Vliet, M. T. H. V., and Collins, D. N.: Science of the Total Environment Snowmelt contributions to discharge of the Ganges, Sci. Total Environ., 468–469, S93–S101, https://doi.org/10.1016/j.scitotenv.2013.05.084, 2013.
Soncini, A., Bocchiola, D., Confortola, G., Bianchi, A., Rosso, R., Mayer, C., Lambrecht, A., Palazzi, E., Smiraglia, C., and Diolaiuti, G.: Future Hydrological Regimes in the Upper Indus Basin: A Case Study from a High-Altitude Glacierized Catchment, J. Hydrometeorol., 16, 306–326, https://doi.org/10.1175/jhm-d-14-0043.1, 2015.
Tang, B., Shrestha, B., Li, Z., Liu, G., Ouyang, H., and Raj, D.: Determination of snow cover from MODIS data for the Tibetan Plateau region, Int. J. Appl. Earth Obs., 21, 356–365, https://doi.org/10.1016/j.jag.2012.07.014, 2013.
Tang, Z. and Wang, X.: Extraction and assessment of snowline altitude over the Tibetan plateau using MODIS fractional snow cover data (2001 to 2013), J. Appl. Remote Sens., 8, 084689, https://doi.org/10.1117/1.JRS.8.084689, 2014.
Wang, W., Huang, X., Deng, J., Xie, H., and Liang, T.: Spatio-temporal change of snow cover and its response to climate over the Tibetan Plateau based on an improved daily cloud-free snow cover product, Remote Sensing, 7, 169–194, https://doi.org/10.3390/rs70100169, 2015.
Wang, X. and Xie, H.: New methods for studying the spatiotemporal variation of snow cover based on combination products of MODIS Terra and Aqua, 371, J. Hydrol., 192–200, https://doi.org/10.1016/j.jhydrol.2009.03.028, 2009.
You, Q. L., Ren, G. Y., Zhang, Y. Q., Ren, Y. Y., Sun, X. B., Zhan, Y. J., Shrestha, A. B., and Krishnan, R.: An overview of studies of observed climate change in the Hindu Kush Himalayan (HKH) region, Advances in Climate Change Research, 8, 141–147, https://doi.org/10.1016/j.accre.2017.04.001, 2017.