the Creative Commons Attribution 4.0 License.
the Creative Commons Attribution 4.0 License.
 | 02 Nov 2022
Multi-instrument observations of polar cap patches and traveling ionospheric disturbances generated by solar wind Alfvén waves coupling to the dayside magnetosphere
Robert G. Gillies
David R. Themens
James M. Weygand
Evan G. Thomas
Shibaji Chakraborty
During minor to moderate geomagnetic storms, caused by corotating interaction regions (CIRs) at the leading edge of high-speed streams (HSSs), solar wind Alfvén waves modulated the magnetic reconnection at the dayside magnetopause. The Resolute Bay Incoherent Scatter Radars (RISR-C and RISR-N), measuring plasma parameters in the cusp and polar cap, observed ionospheric signatures of flux transfer events (FTEs) that resulted in the formation of polar cap patches. The patches were observed as they moved over the RISR, and the Canadian High-Arctic Ionospheric Network (CHAIN) ionosondes and GPS receivers. The coupling process modulated the ionospheric convection and the intensity of ionospheric currents, including the auroral electrojets. The horizontal equivalent ionospheric currents (EICs) are estimated from ground-based magnetometer data using an inversion technique. Pulses of ionospheric currents that are a source of Joule heating in the lower thermosphere launched atmospheric gravity waves, causing traveling ionospheric disturbances (TIDs) that propagated equatorward. The TIDs were observed in the SuperDual Auroral Radar Network (SuperDARN) high-frequency (HF) radar ground scatter and the detrended total electron content (TEC) measured by globally distributed Global Navigation Satellite System (GNSS) receivers.
- Article
(23127 KB) - Full-text XML
- BibTeX
- EndNote


Solar wind coupling to the dayside magnetosphere (Dungey, 1961, 1995) generates variable electric fields that map to the cusp ionosphere, driving the ionospheric convection and currents. The magnetic reconnection on the dayside magnetopause leads to open magnetic flux carried over the polar cap to the magnetotail (Dungey, 1961; Tsurutani and Meng, 1972; Russell and Elphic, 1978, 1979; Provan et al., 1998). The transient nature of magnetic reconnection at the dayside magnetopause is exemplified by flux transfer events (FTEs; Russel and Elphic, 1978) and their ionospheric signatures have been extensively studied (Van Eyken et al., 1984; Goertz et al., 1985; Southwood, 1987; Pinnock et al., 1995; Rodger and Pinnock, 1997; Provan et al., 1998, and references therein). Provan et al. (1998) observed a series of quasiperiodic pulsed azimuthal flow transients poleward of the convection reversal boundary (CRB), which they identified as the ionospheric signatures of FTEs.
The FTE signatures in the cusp ionospheric flows were proposed to be studied with the incoherent scatter radar (ISR; Cowley et al., 1990), and were later observed by the coherent scatter radars of the SuperDual Auroral Radar Network (SuperDARN; Pinnock et al., 1993; Provan et al., 1998), as well as the ISR in Svalbard (Oksavik et al., 2006). The Resolute Bay Incoherent Scatter Radars (RISRs), measuring ionospheric plasma parameters in the cusp and polar cap, are well suited to observing the FTE signatures (Gillies et al., 2016, 2018).
Cowley and Lockwood (1992) proposed that time-dependent magnetic reconnection and the resulting convection produce polar cap patches from dayside-enhanced ionospheric density of a tongue of ionization (TOI) that is drawn through the cusp into the polar cap. Ionospheric flow channels, primarily in the F-region ionosphere, produce depletions in the ionospheric plasma, segmenting a TOI into patches (Pinnock et al., 1993; Rodger et al., 1994; Valladares et al., 1994, 1996). These flow channels are ionospheric signatures of magnetic reconnection events (FTEs). The ionospheric signatures of the coupling include pulsed ionospheric flows (PIFs) in the cusp, which have been observed by high-frequency (HF) radars (Walker et al., 1986; Prikryl et al., 1998; McWilliams et al., 2000). These PIFs can be modulated by solar wind Alfvén waves (Prikryl et al., 1999, 2002). Solar wind Alfvén waves (Belcher and Davis, 1971) that couple to the magnetosphere–ionosphere system are associated with high-intensity long-duration continuous auroral activity (HILDCAA; Tsurutani and Gonzalez, 1987; Tsurutani et al., 1990). Spacecraft observations of the polar cap and auroral zone noted auroral patches during HILDCAA intervals due to the southward component of Alfvén waves causing reconnection (Guarnieri, 2006). The durations of the southward component of Alfvén waves influence the geo-effectiveness, and the substorm and magnetic storm developments. However, in this paper we focus on the immediate dayside ionospheric response to the interplanetary magnetic field (IMF) during the impact of corotating interaction regions (CIRs) at the leading edge of high-speed streams (HSSs).
The ionospheric currents, including auroral electrojets, have long been recognized as sources of atmospheric gravity waves (AGWs; Chimonas and Hines, 1970) propagating globally in the neutral atmosphere (Richmond, 1978; Hunsucker, 1982; Mayr et al., 1984a, b, 1990, 2013). The AGWs have been observed as traveling ionospheric disturbances (TIDs) in both the dayside and nightside ionosphere using various techniques, including HF radars, ionosondes, and GPS-derived total electron content (TEC) measurements (Hunsucker, 1982; Crowley and Williams, 1987; Crowley and McCrea, 1988; Samson et al., 1989; Bristow and Greenwald, 1996; Afraimovich et al., 2000; Hayashi et al., 2010; Cherniak and Zakharenkova, 2018; Nishitani et al., 2019). Large-scale TIDs (LSTIDs) generally propagate at speeds between 400 and 1000 ms−1, have wavelengths greater than 1000 km, and periods of 30–180 min, while medium-scale TIDs (MSTIDs) tend to propagate at speeds of 250–1000 ms−1, and have wavelengths of several hundred kilometers and periods of 15–60 min (Francis, 1975; Hunsucker, 1982; Zhang et al., 2019).
On the dayside, in addition to polar cap patches, the generation of AGWs can be pulsed by the solar wind Alfvén waves (Prikryl et al., 2005, 2019). In this paper, we present a case study of polar cap patches and TIDs generated in the dayside ionosphere during minor to moderate geomagnetic storms.
The Resolute Bay Incoherent Scatter Radars (RISRs) covering latitudes from 75 to 81∘ N (RISR-N) and from 69 to 75∘ N (RISR-C) are located at a geographic latitude of 74.70∘ N and geographic longitude of 94.83∘ W. The electronically steerable phased array radars, which are effectively capable of sampling in multiple beam directions simultaneously, measure electron density, electron and ion temperature, and flow velocities in the cusp and polar cap ionosphere (Gillies et al., 2016, 2018).
The Super Dual Auroral Radar Network (SuperDARN; Chisham et al., 2007; Nishitani et al., 2019) is used to measure the line-of-sight (LoS) velocities, to map ionospheric convection, and observe TIDs in the ground scatter (http://vt.superdarn.org, last access: 25 September 2022). Ground-based magnetometers from the Geophysical Institute Magnetometer Array (GIMA) (https://www.gi.alaska.edu/monitors/magnetometer/archive, last access: 25 September 2022), the Geomagnetic Laboratory of the Natural Resources Canada (NRCan) (https://www.spaceweather.ca, last access: 25 September 2022), and the Canadian Array for Realtime Investigations of Magnetic Activity (CARISMA) (https://www.carisma.ca/, last access: 25 September 2022) are used to identify ionospheric currents as sources of AGWs. The magnetometer data were also accessed through SuperMAG (http://supermag.jhuapl.edu/mag, last access: 25 September 2022) (Gjerloev, 2012) and INTERMAGNET (https://www.intermagnet.org, last access: 25 September 2022).
The horizontal equivalent ionospheric currents (EICs) and vertical current amplitudes are estimated using the spherical elementary current system (SECS) inversion technique. We applied the SECS inversion technique (Amm and Viljanen, 1999; Weygand, 2009a, b; Weygand et al., 2011) to obtain horizontal EICs and vertical current amplitudes from 11 different arrays of ground magnetometers in the North American sector with stations in western Greenland included. Following Weygand et al. (2011), for each of these stations the quiet-time background is subtracted from the measured field to give the disturbance component which determines the EICs.
The Canadian High-Arctic Ionospheric Network (CHAIN; Jayachandran et al., 2009) consists of ionosondes and GPS Ionospheric Scintillation and TEC Monitors (GISTMs) that are configured to record the power and phase of the L1 frequency (1575.42 MHz) and L2 frequency (1227.6 MHz) signals. In this study, both scintillation indices (S4 and σΦ) and TEC are used. The TEC used in this study is determined using the phase leveling and cycle slip correction method outlined in Themens et al. (2013), with satellite biases acquired from the Center for Orbit Determination in Europe (CODE, ftp://ftp.aiub.unibe.ch/, last access: 25 September 2022) and receiver biases determined as detailed in Themens et al. (2015).
In addition to the CHAIN data, Madrigal LoS TEC data were also gathered from http://cedar.openmadrigal.org/ (last access: 25 September 2022) and used in this study to examine large scale TEC variations over North America. To characterize the TID structures using this data, LoS TEC data from each satellite-receiver pair was detrended by first projecting the LoS TEC to vertical TEC (vTEC) and removing the sliding 60 min average. For more details on this method, full details can be found in Themens et al. (2022). The vTEC anomalies are mapped along the SuperDARN radar beams to be compared with the TIDs observed in the mapped ground scatter (Bristow et al., 1994).
The solar wind data are obtained from the Goddard Space Flight Center Space Physics Data Facility (https://spdf.gsfc.nasa.gov/index.html, last access: 25 September 2022) and the National Space Science Data Center OMNIWeb (http://omniweb.gsfc.nasa.gov, last access: 25 September 2022) (King and Papitashvili, 2005). Specifically, the interplanetary magnetic field (IMF) data obtained by the NASA Advanced Composition Explorer (ACE) (Smith et al., 1999) and Geotail spacecraft (Kokubun et al., 1994) are used.
Solar wind high-speed streams (HSSs) are permeated with solar wind Alfvén waves (Belcher and Davis, 1971) known to cause substorms and geomagnetic storms (Tsurutani et al., 1990, 2006), particularly when associated with significant southward IMF Bz. Figure 1a and b show the hourly OMNI data of solar wind plasma variables and the geomagnetic storm Dst index for 2 periods in 2016 and 2018. Arrivals of corotating interaction regions (CIRs) at the leading edge of HSSs on 6 and 14–15 March 2016, and on 5 May 2018, triggered minor to moderate geomagnetic storms (Gonzalez et al., 1994) with the Dst index reaching maximum negative values of −110, −60 and −64 nT, respectively. The HSS/CIRs were closely preceded by heliospheric current sheets (HCS; Smith et al., 1978) that are associated with high-density plasma leading to the magnetic field compression (Smith and Wolfe, 1976; Tsurutani et al., 1995a). Solar wind Alfvén waves are characterized by the Walén relation between velocity V and magnetic field B (e.g., Yang et al., 2020, and references therein). The corresponding components of the IMF fluctuations and solar wind velocity are (anti)correlated (Prikryl et al., 2002), and this was the case for the events studied here using observations by the ACE and Geotail spacecraft in the upstream solar wind. While the Alfvén waves are also observed in the HSS proper following the CIRs, the ionospheric response that is the subject of this paper is limited to CIRs where the Alfvén wave amplitudes are higher due to the compression (Tsurutani et al., 1995b), which likely plays a role in the magnetic reconnection at the dayside magnetosphere resulting in polar cap patches and TIDs.
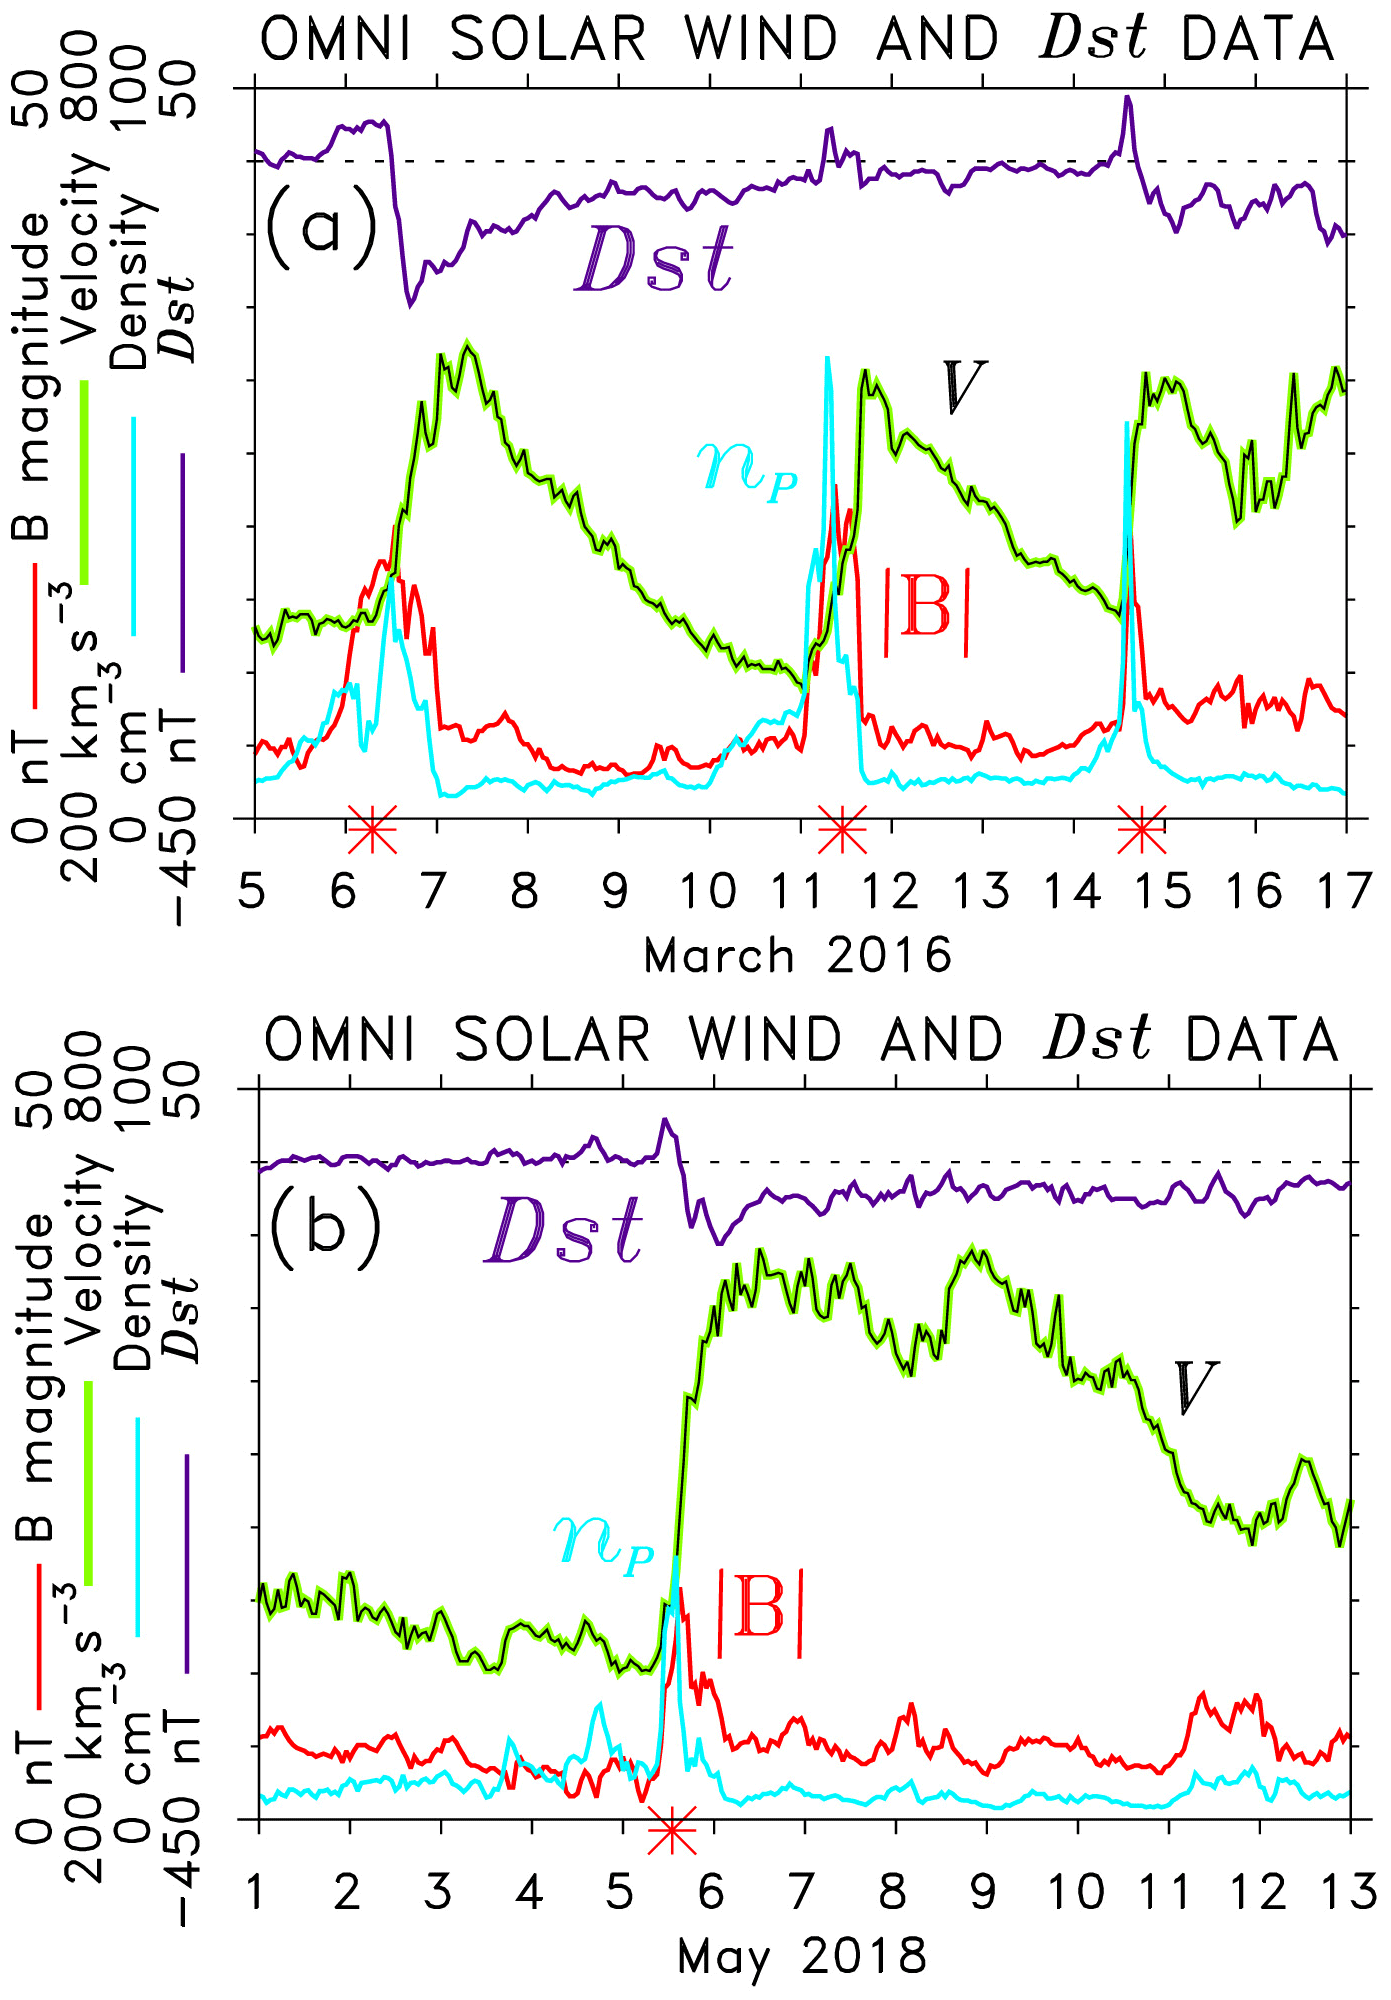
Figure 1The hourly OMNI solar wind velocity, V, magnetic field, B, proton density, np, and the Dst index for 2 periods in (a) 2016 and (b) 2018. Major HSS/CIRs (red asterisks) are shown.
3.1 Ionospheric signatures of flux transfer events (FTEs) and polar cap patches
The RISR measurements of electron density, Ne, and flow velocities, Ve, in the cusp and polar cap ionosphere are used to study four events of the solar wind Alfvén waves coupling to the dayside magnetopause generating polar cap patches. This is supported by observations of HF radar line-of-sight (LoS) ionospheric velocities and convection maps by SuperDARN, of polar patches over the CHAIN ionosondes, and of GPS scintillation receivers measuring phase-variation (scintillation) index σΦ. The horizontal equivalent ionospheric currents (EICs) that are estimated from the ground-magnetometer data using the SECS inversion technique provide a broader context of the coupling process to ionospheric currents, including the auroral electrojets.
3.1.1 Event of 6 March 2016
Figure 2a shows Ne and anti-sunward Ve averaged over the longitude span of the RISR-N beams (from 75 to 100∘ W) and RISR-C beams (from 93 to 107∘ W) (Gillies et al., 2016; see, their Fig. 1) and altitudes between 250 and 450 km. The poleward-propagating enhancements in Ne are due to polar cap patches entering and exiting the RISR field of view (FoV). The time series of the ACE IMF By and Bz are superposed, time-shifted for the best correlation (correspondence) with patches and anti-sunward flows, respectively, to approximately account for the propagation delay between the spacecraft and the ionosphere. This indicates that the duskward deflections of the predominantly dawnward IMF By (<0) resulted in a series of poleward-convecting polar patches that are correlated with the IMF By. The southward IMF was followed by anti-sunward flows that were diminished or stopped when the IMF Bz switched back to northward. While the sustained southward IMF Bz is the condition for the continuous (quasi-steady) magnetic reconnection, it is the impulsive reconnection that leads to the formation of polar cap patches.
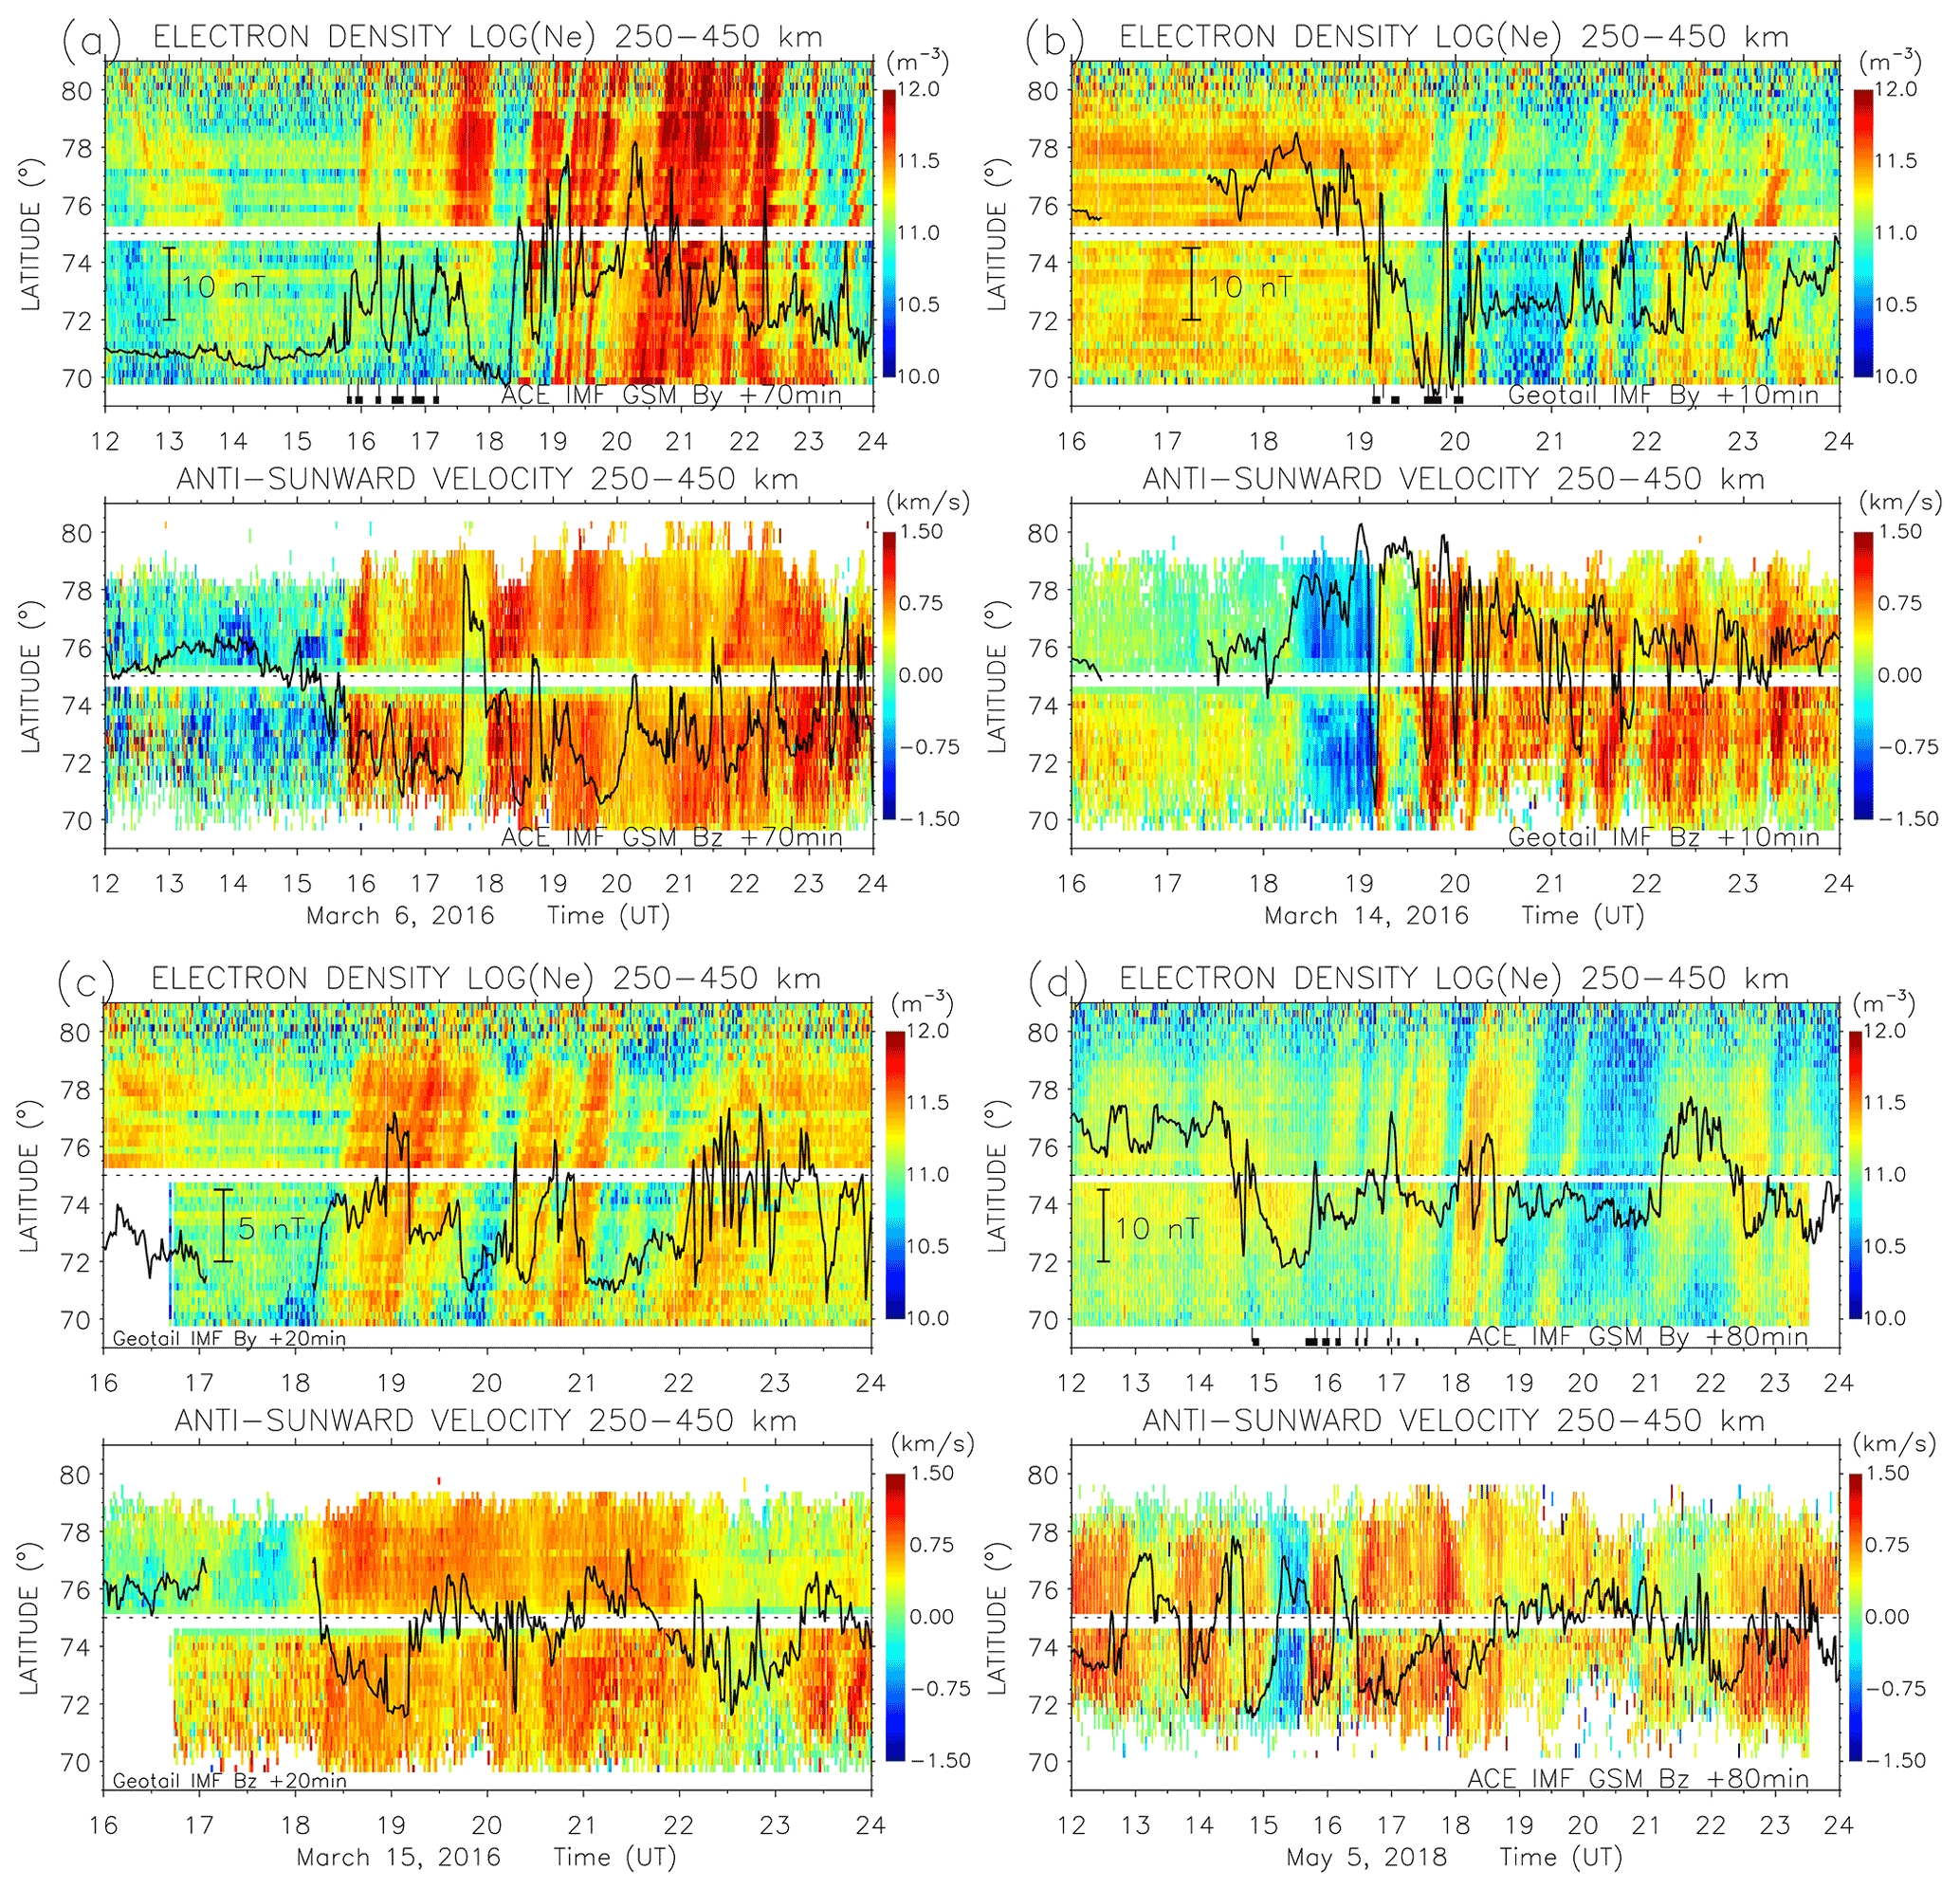
Figure 2The RISR measurements at altitudes between 250 and 450 km of electron density, Ne, and anti-sunward flow velocities, Ve, on (a) 6 March, (b) 14 March, (c) 15 March 2016, and (d) 5 May 2018. The time-shifted IMF By and Bz observed by ACE (GSM) and Geotail (GSE) spacecraft are superposed.
The first few patches (enhancements in Ne) were first observed by RISR-N north of 75∘ N between 16:00 and 17:00 UT but were not detected by RISR-C (Fig. 2a). This implies that the cusp was in the RISR-C FoV since polar patches are known to be produced by flow channels in the cusp. The very first density patch starting at ∼ 16:00 UT followed the first IMF By duskward deflection after the onset of anti-sunward flows due to the southward Bz. The FTE signatures of the impulsive magnetic reconnection at the dayside magnetopause were observed by RISR-C in the cusp ionosphere.
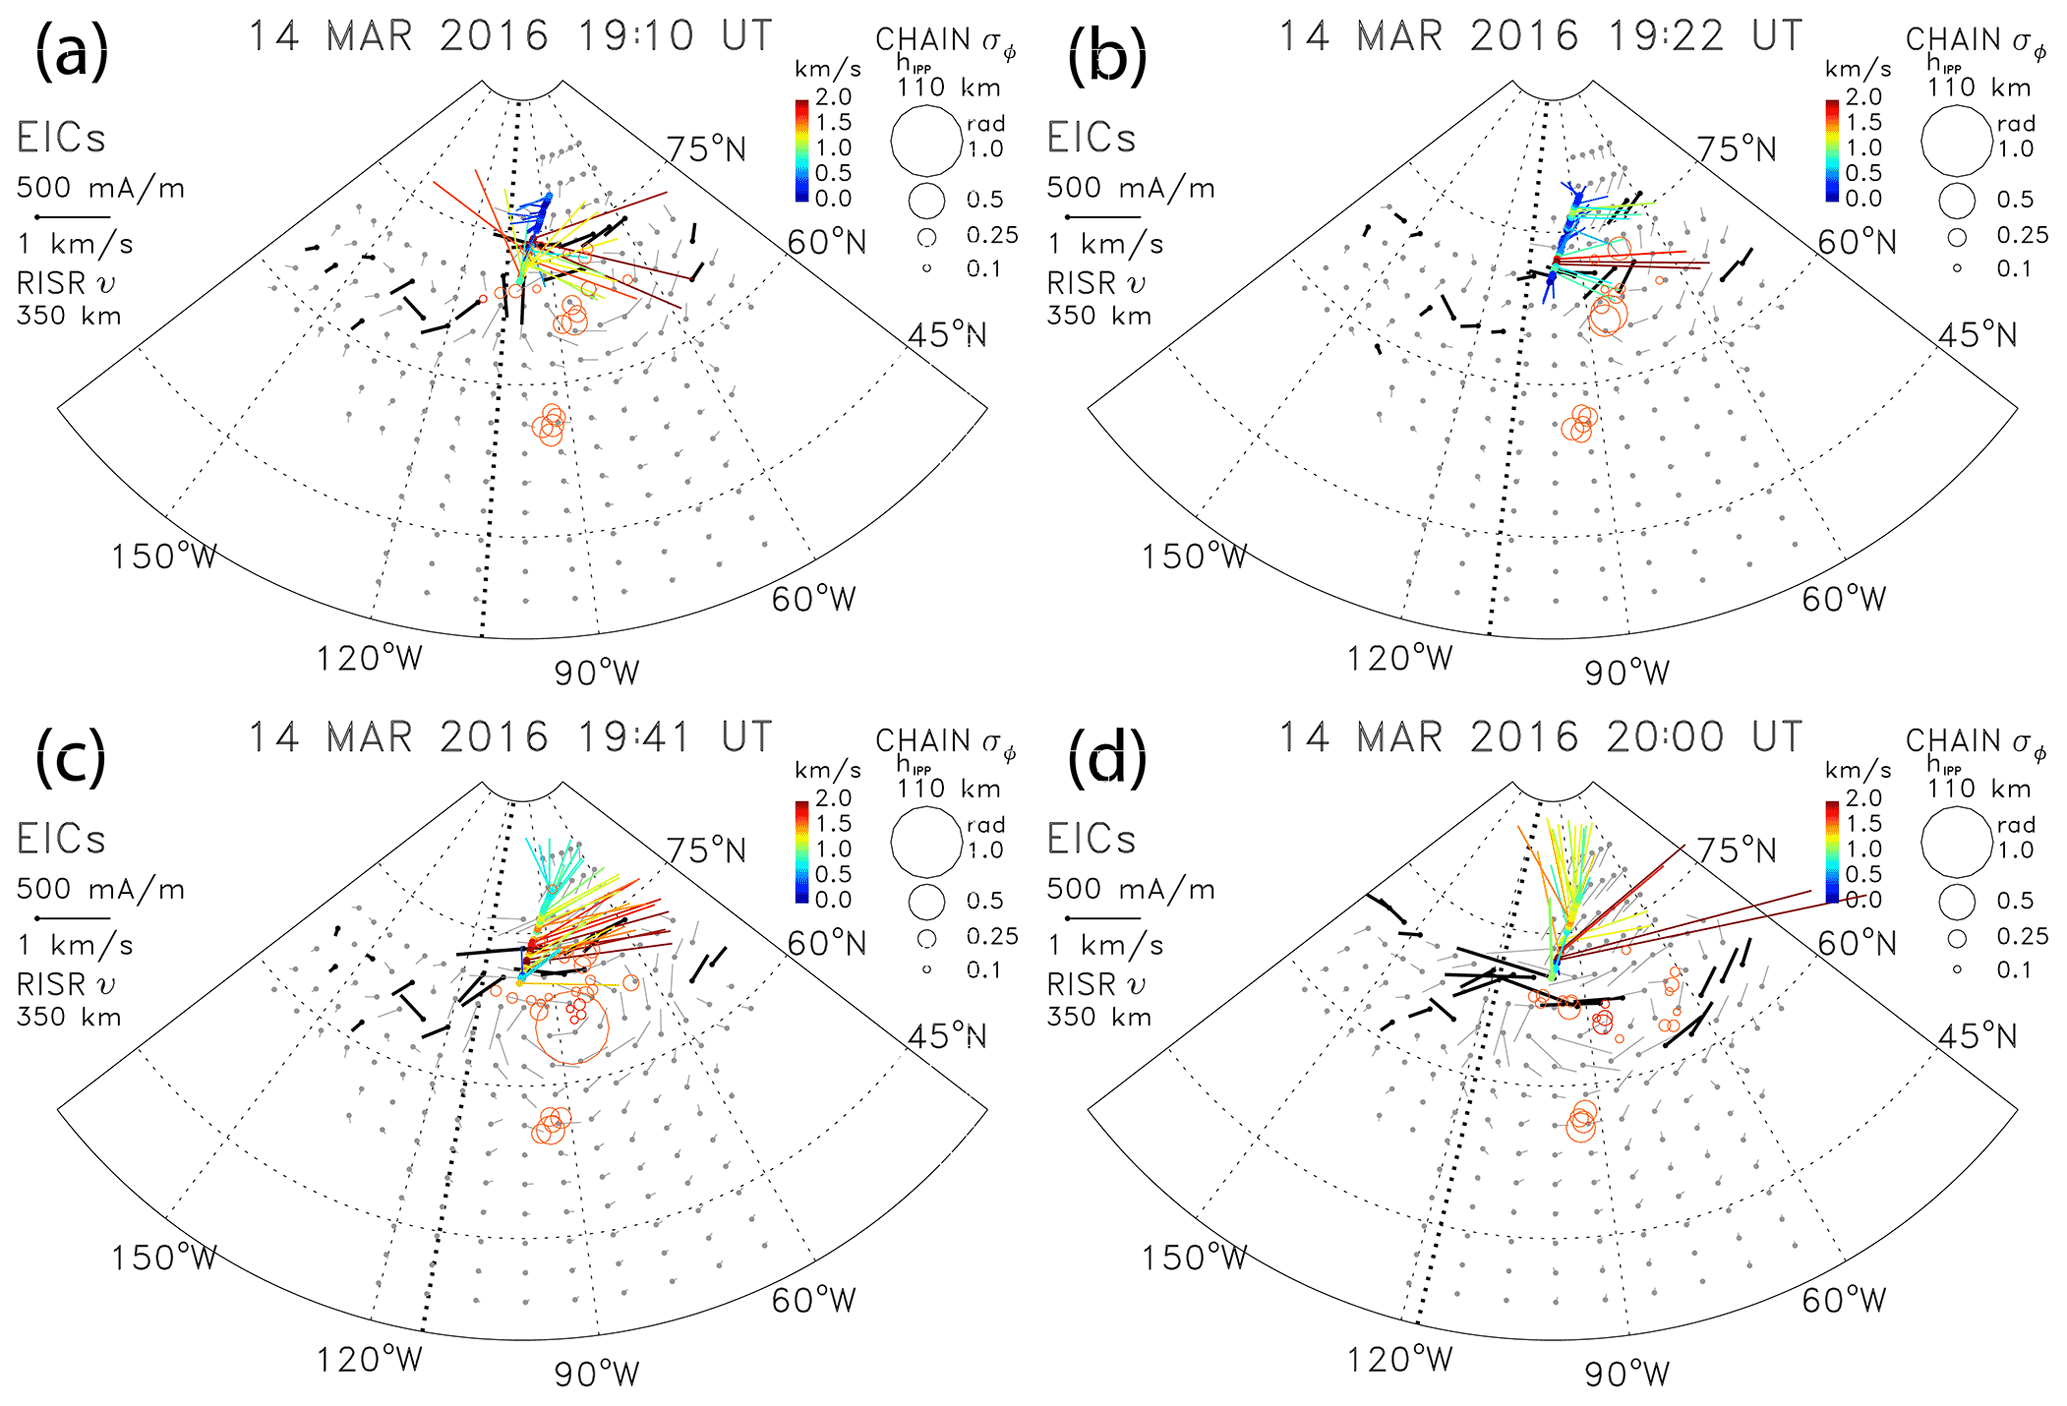
Figure 3 shows the equivalent ionospheric currents (EICs) at 110 km mapped in geographic coordinates with the latitudinal maxima of EICs at each longitude grid, highlighted in bold, indicating the locations of westward and eastward electrojets. The flow vectors measured by RISR are coded in color. The GPS ionospheric pierce points (IPPs) at 110 km are shown as circles scaled by the CHAIN GPS phase-variation values, σΦ. It has been shown (Prikryl et al., 2016, 2021a) that, in the auroral zone, IPPs of strong GPS phase scintillation are largely collocated with the electrojet currents. During the period between 15:40 and 17:40 UT of anti-sunward flows driven by the southward Bz before it reversed to northward (Fig. 2a), frequent transient azimuthal westward flows were observed by RISR-C in the cusp that were associated with the IMF By duskward deflections (Fig. 2a). The first two azimuthal flow channels intensified and faded between 15:47 to 15:51 UT (Fig. 3a) and between 15:54 and 16:01 UT. More transient azimuthal flows occurred during periods of 16:14–16:16, 16:29–16:39, 16:48–17:00, 17:07–17:12 UT (black rectangles in Fig. 2a) that are associated with duskward deflections of the time-shifted IMF By at ∼ 16:15, 16:35, 16:50, and 17:10 UT (black bars above the rectangles in Fig. 2a). These transient azimuthal flows, some of which are shown in Fig. 3, occurred poleward of the CRB identified in the EICs that show a reversal of currents just equatorward of the flow transients at the geographic latitude of ∼ 68∘ N. In some cases when there was ionospheric backscatter, the CRB is detectable in the LoS velocities observed by the Kapuskasing (KAP) radar (not shown).
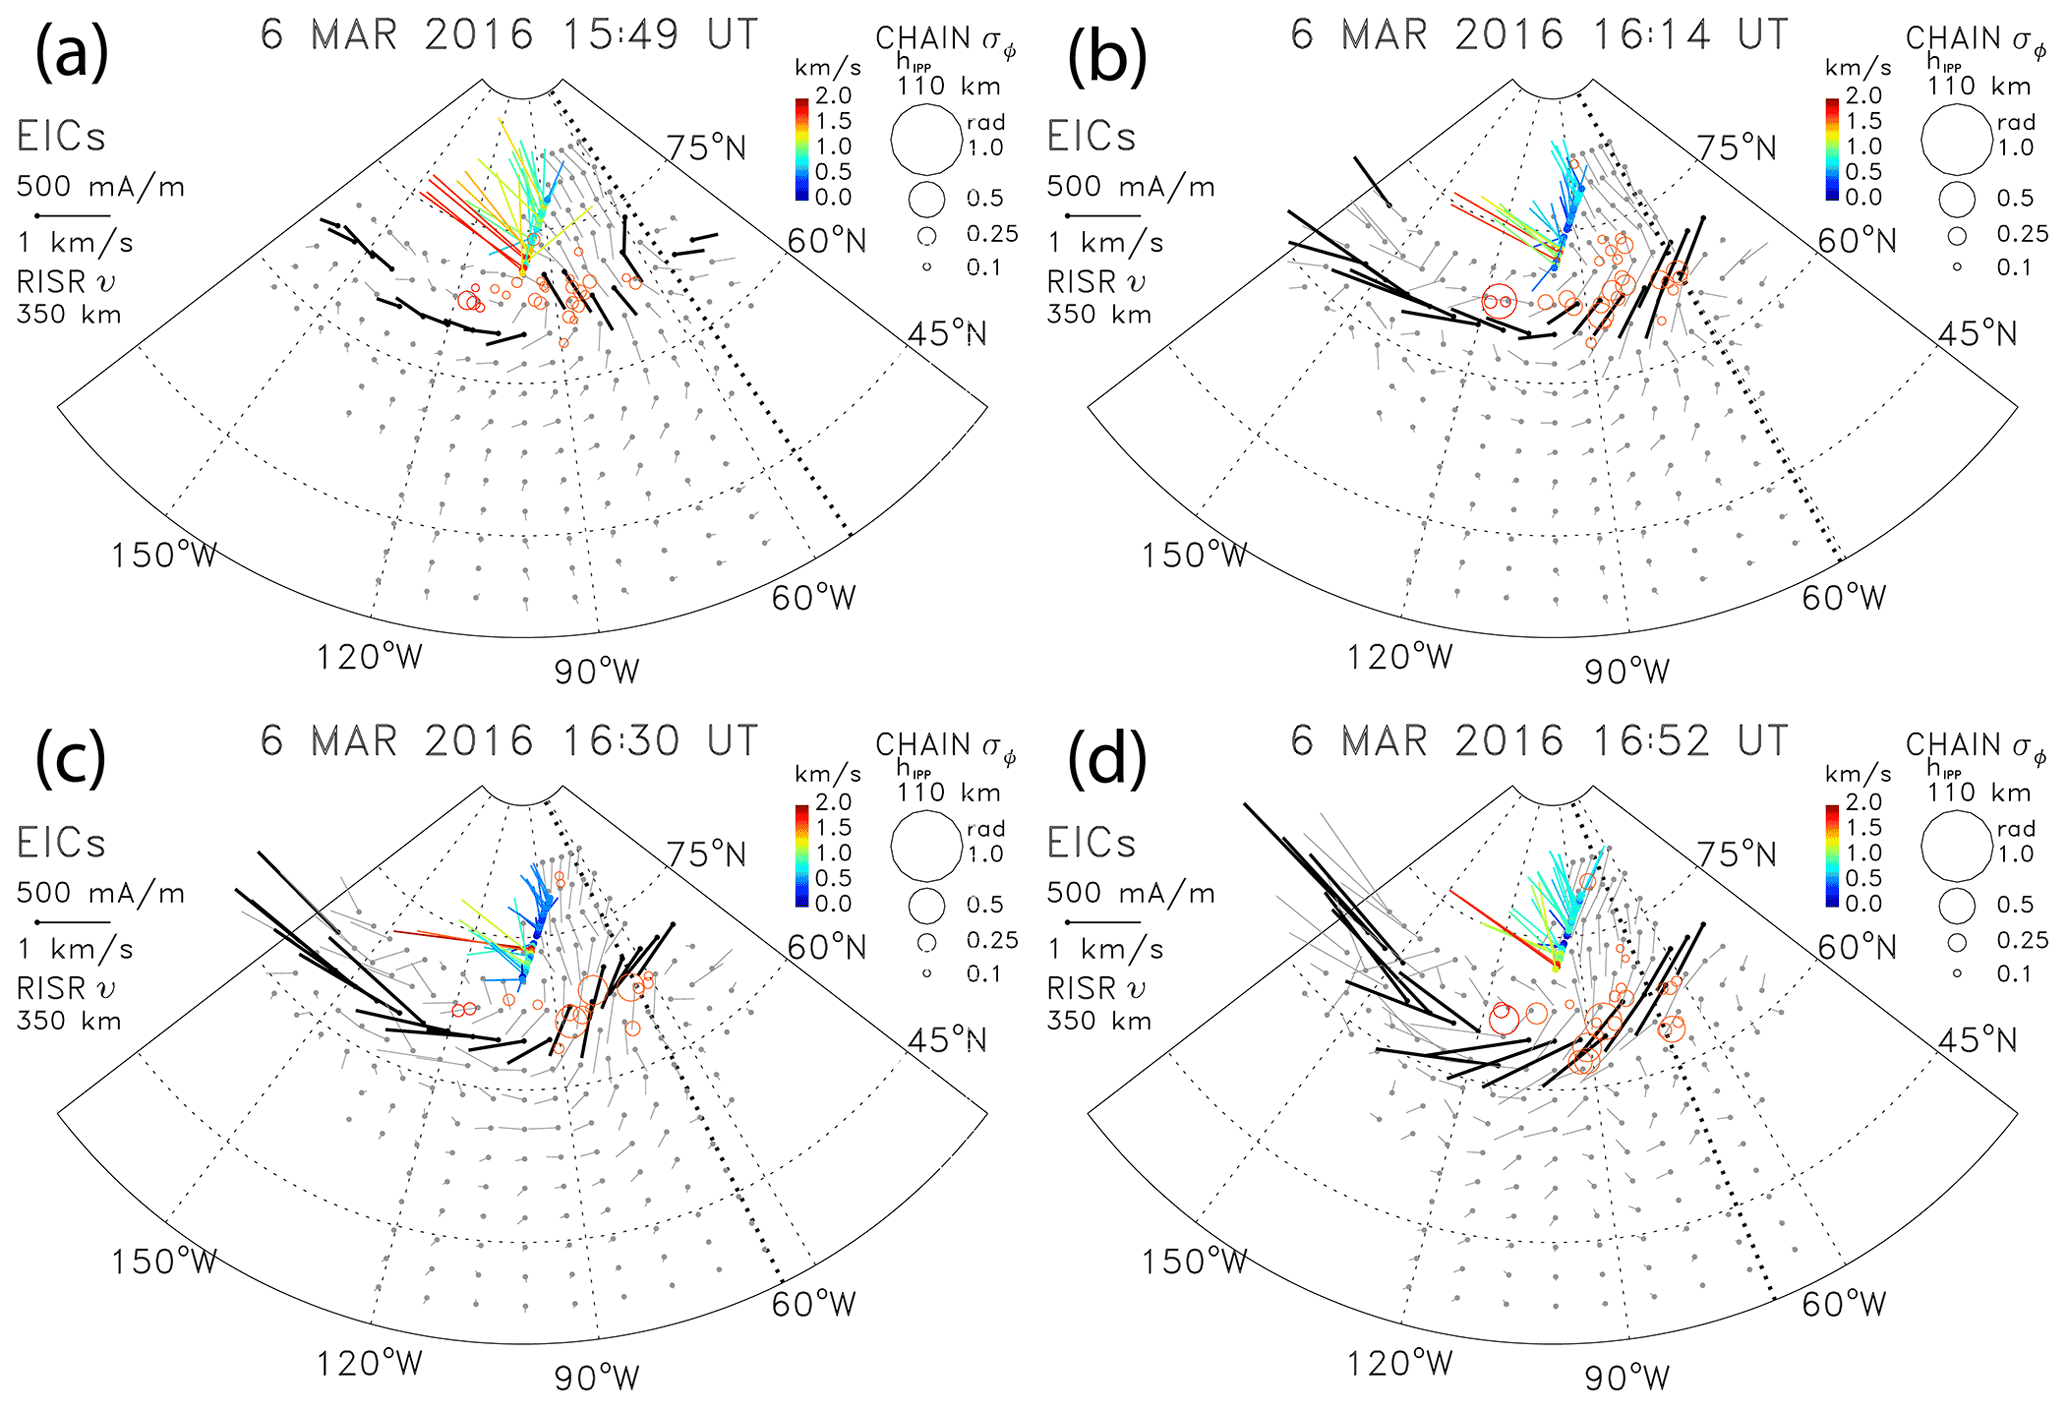
Figure 3The horizontal EICs with their latitudinal maxima at each longitude grid, plasma flows observed by RISR (in color-coded velocities), and the CHAIN GPS IPPs with enhanced phase-variation values, σΦ, (scaled circles). The bold dotted line shows the longitude of local noon.
The large-amplitude swing of the IMF Bz northward stopped the anti-sunward flow for about 30 min (Fig. 2a). After the IMF Bz reversed back to southward, the anti-sunward flow was restored and intensified. As the cusp shifted further equatorward after the steep southward reversal of the IMF, azimuthal flow channels in the cusp were not observed any longer by RISR that continued to observe anti-sunward flows and poleward-convecting density patches. The patches that followed the duskward IMF By deflections must have been produced in the cusp south of RISR. Although the SuperDARN radars in Kapuskasing (KAP) and Saskatoon (SAS; operating in a special mode) observed some of the anti-sunward flows, the FTE signatures of transient azimuthal flows could not be identified because of insufficient ionospheric backscatter, which was often mixed with ground scatter.
The RISR observed copious density patches propagating in the polar cap. The SuperDARN global ionospheric convection map (Fig. 4a) shows an expanded convection zone with intense flows from the dayside portions of the dawn and dusk cells through the cusp and into the polar cap, where the anti-sunward flows and patches were observed by RISR. The corresponding GPS TEC map (Fig. 4b), as a function of the Altitude-Adjusted Corrected Geomagnetic (AACGM) latitude and magnetic local time (MLT), shows a TOI broken into patches. For the GPS phase-variation values σΦ>0.1 rad, the IPPs at 350 km altitude that are superposed on the TEC map are collocated with the TOI fragmented into patches (further discussed in Sect. 3.3).
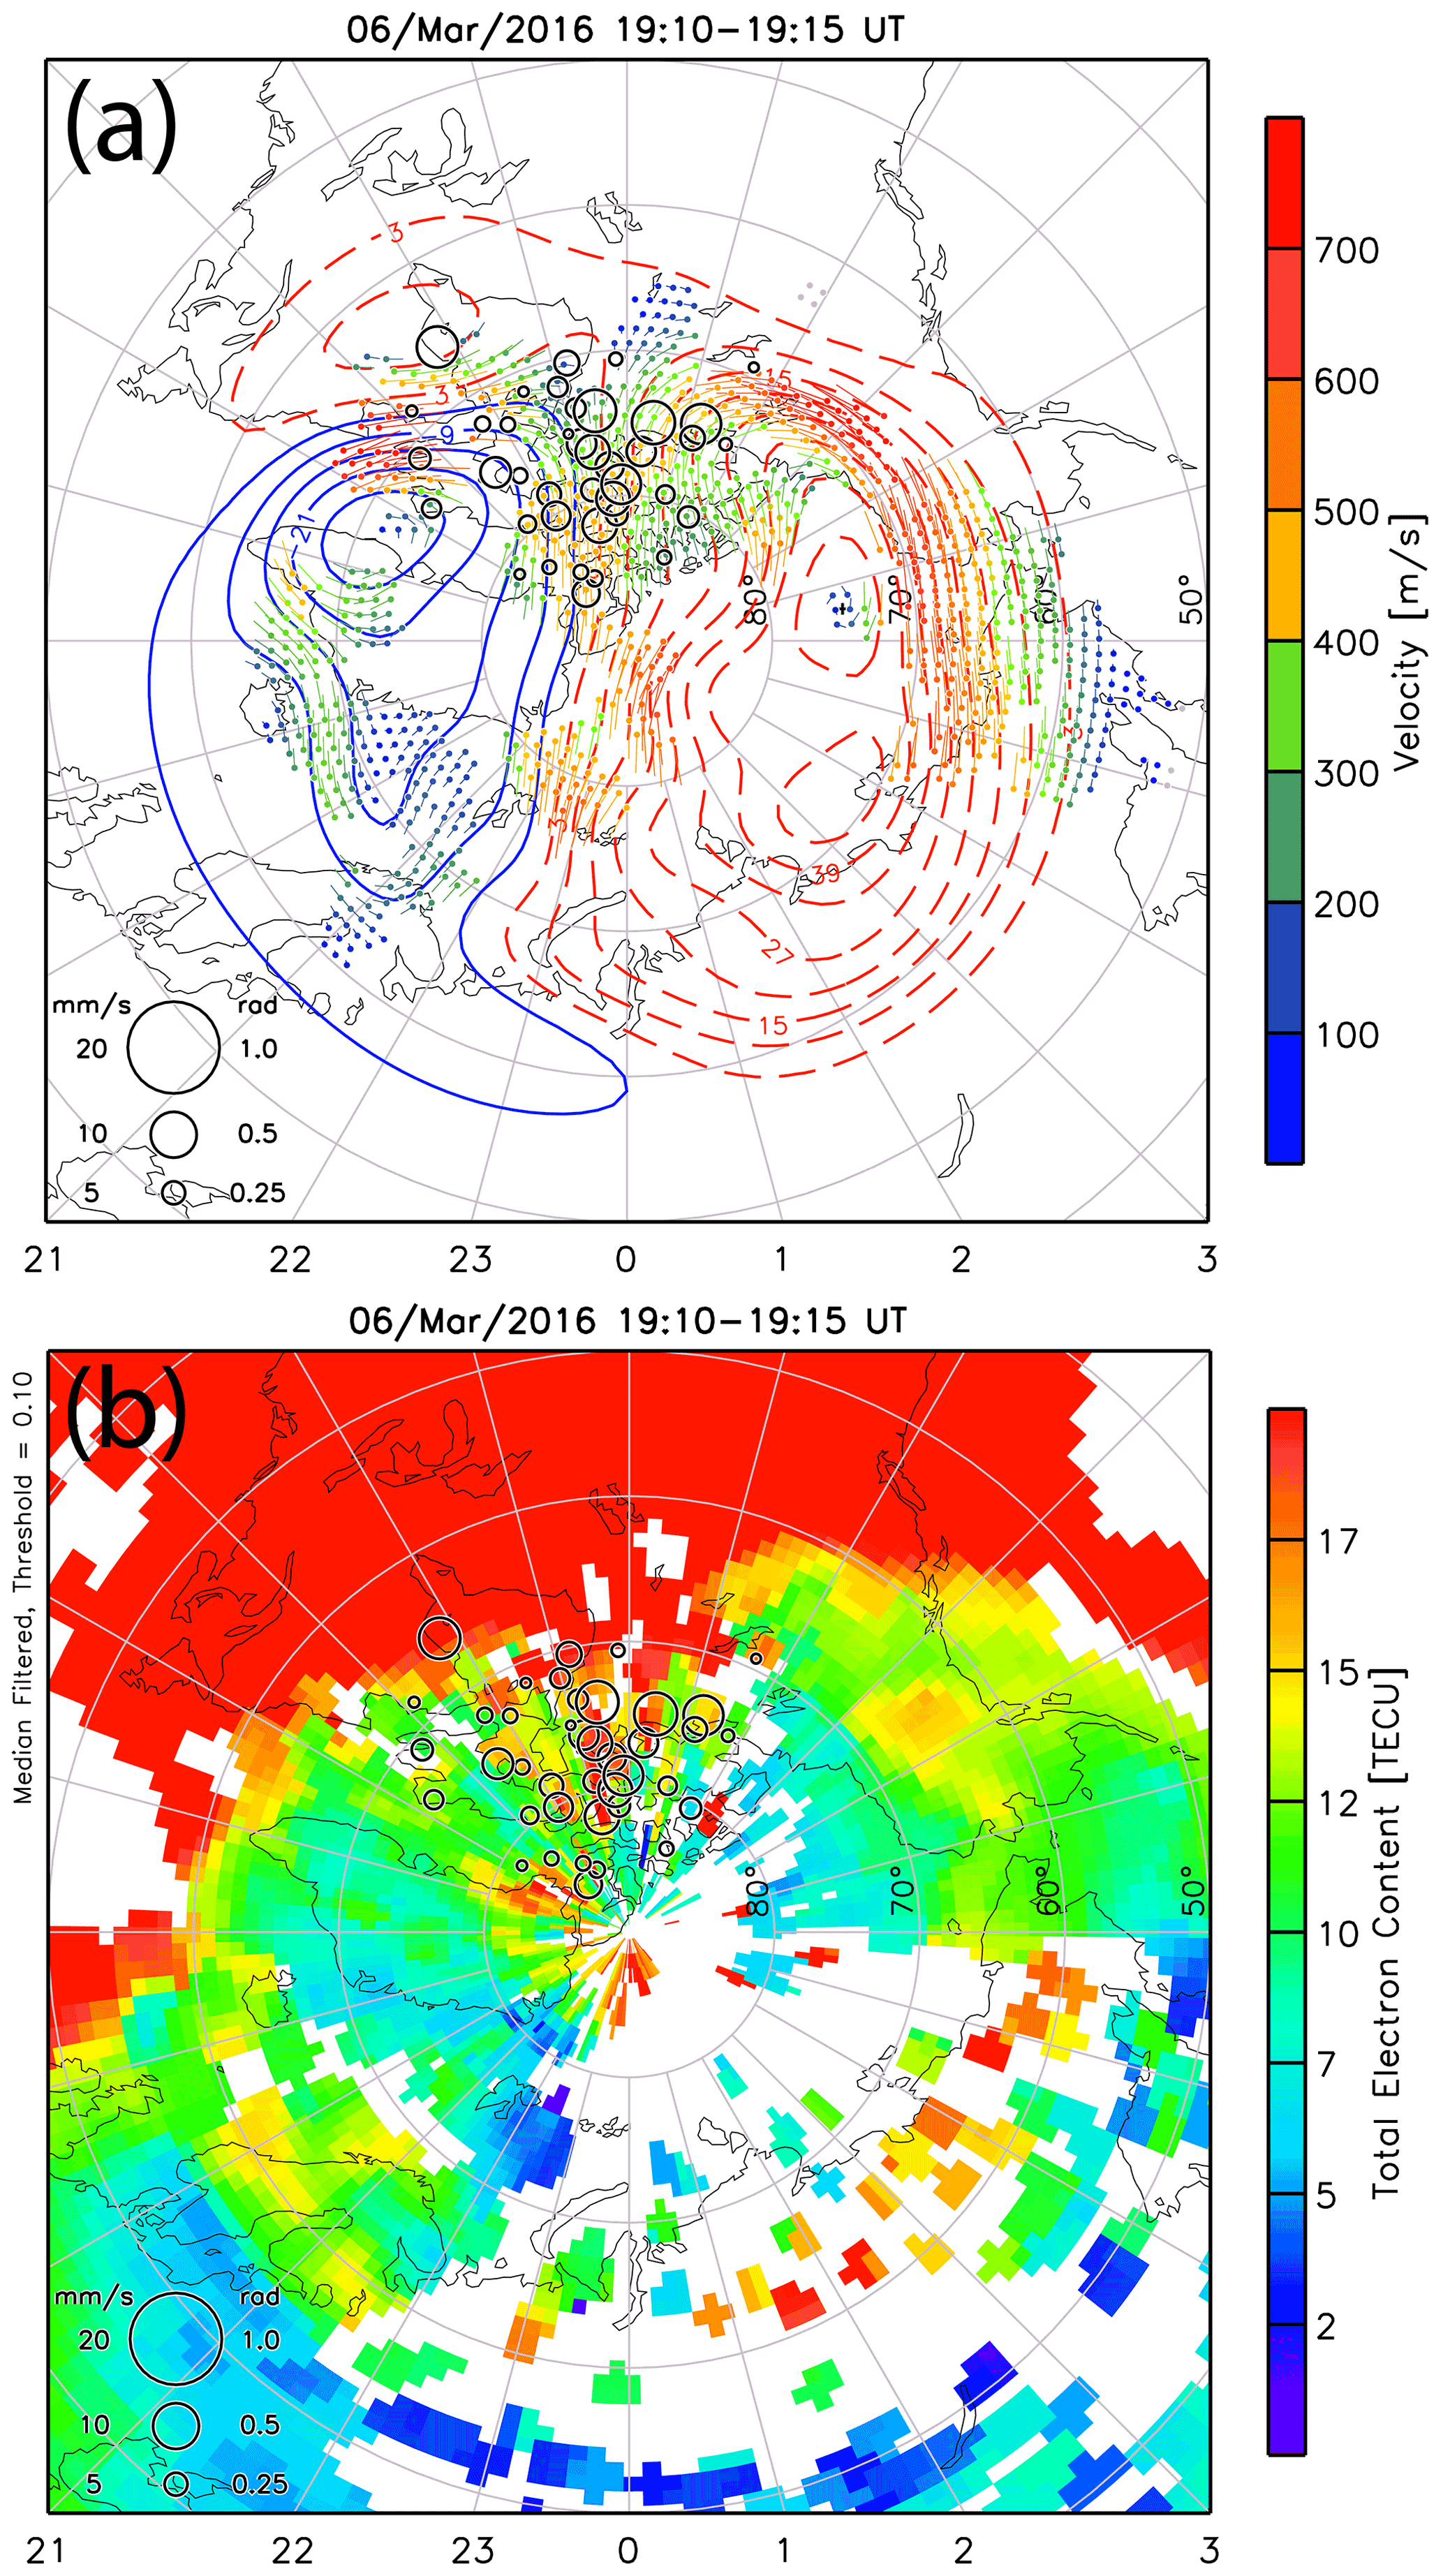
Figure 4Panel (a) depicts the SuperDARN ionospheric convection and potential maps showing expanded convection zone and (b) the GPS TEC as a function of magnetic latitude and magnetic local time (MLT). The CHAIN GPS IPPs at 350 km shown as circles scaled by the GPS phase variation values, σΦ, are superposed.
3.1.2 Events of 14–15 March 2016
Following the arrival of HSSs/CIRs that caused a minor geomagnetic storm (Fig. 1a), a series of polar cap patches were generated by solar wind Alfvén waves coupling to the dayside magnetosphere on 14 and 15 March. Anti-sunward flows and density patches convecting poleward were observed by RISR (Fig. 2b and c). Similar to the event discussed in the previous section, the patches are approximately correlated with the IMF By duskward deflections of the time-shifted and predominantly dawnward IMF By (<0) observed by the Geotail spacecraft passing in front of the subsolar bow shock.
On 14 March, the main difference is that the IMF Bz remained predominantly northward (>0) but underwent frequent reversals to the south. The large northward Bz before 19:10 UT resulted in a reduced ionospheric convection zone that was, due to duskward By (>0), dominated by the dusk convection cell but also a reverse (two-)cell convection in the noon sector (see, e.g., Gosling et al., 1990; Crooker et al., 1992; Provan et al., 2005; Lu et al., 2011). With the reverse convection (lobe) cell over Resolute Bay, RISR observed sunward and duskward flows, a signature of the lobe reconnection. At this time, the RISR observed electron densities, which were not segmented into poleward-propagating patches.
At ∼ 19:10 UT, the flows reversed from sunward to anti-sunward following the IMF Bz reversal southward that resulted in a magnetic reconnection pulse at the dayside magnetopause and the convection settled into a regular two-cell pattern. At the same time, as the IMF By was reversing from duskward (>0) to dawnward, it oscillated and rebounded briefly duskward. At 19:10 UT, RISR observed a complex mixture of dawnward and duskward (westward and eastward) transient azimuthal flows (Fig. 5a) that could be a mixture of lobe and subsolar FTE signatures in the cusp ionosphere. This was followed by anti-sunward flows and by a density patch that convected poleward in the RISR-N FoV (Fig. 2b). Another azimuthal flow channel occurred at 19:22–19:23 UT (Fig. 5b), but the IMF Bz reversed northward and the anti-sunward flows ceased.
After the IMF turned southward for the second time, the anti-sunward flows were restored, a duskward deflection of the IMF By followed, a strong azimuthal flow channel was observed by RISR-C (Fig. 5c), and a density patch convected poleward with the anti-sunward flow (Fig. 2b). Following the next southward Bz dip accompanied by a duskward deflection of By, RISR-C observed intense azimuthal flows, RISR-N observed enhanced anti-sunward flows (Fig. 5d), and the next density patch convected poleward just after 20:00 UT (Fig. 2b). Although the propagation delay used in Fig. 2 is only approximate and may vary with time, the same arguments can be applied to density patches observed after 21:00 UT, except that the cusp moved south of the RISR FoV. The anti-sunward flows appear to have intensified with each southward swing of the IMF Bz associated with a duskward deflection of By, and the patches were produced.
The southward Bz is known to drive pulsed ionospheric flows (PIFs) (McWilliams et al., 2000). Starting with the first IMF southward turning, PIFs were observed by the SuperDARN Saskatoon (SAS) radar in the LoS ionospheric velocities (negative is away from the radar) (Fig. 6). Even though the ionospheric backscatter was relatively sparse, there is an approximate correspondence between the southward swings of the IMF Bz and PIFs.

Figure 6The Saskatoon radar line-of-sight velocities as a function of geographic latitude and time (UT). The time-shifted IMF By and Bz observed by Geotail are superposed.
Polar cap patches observed by RISR on 15 March are also approximately correlated with the IMF By duskward deflections of the time-shifted and predominantly dawnward IMF By (<0) observed by the Geotail spacecraft (Fig. 2c) that was located in front of the post-noon bow shock. The anti-sunward flows started at ∼ 18:20 UT following the southward IMF Bz and continued for another 3 h until RISR moved out from the convection throat and deeper into the post-noon sector. Following the southward Bz and duskward By turning at ∼ 18:10 UT, the cusp rapidly shifted equatorward of the RISR FoV, a brief transient azimuthal flow was observed (not shown), and the first density patch convected poleward and reached 75.5∘ N latitude at 18:30 UT (Fig. 2c). The production of polar patches was inhibited, or reduced, when Bz became positive or near zero.
The density patches that followed were produced while the cusp was equatorward of RISR. At ∼ 19:30 UT, when the IMF Bz reached zero and became mildly positive, the cusp re-entered the RISR-C FoV. The next weak patch that was not observed by RISR-C started to be seen by RISR-N (75.5∘ N the cusp) at 19:45 UT. With the IMF Bz fluctuating around zero and following the duskward By deflection, a brief transient azimuthal flow burst was observed at 19:40 UT (not shown). The rest of the density patches after 20:00 UT all started to be observed at 70∘ N when the cusp again moved equatorward, or to the southern edge, of the RISR FoV. The latter was likely the case for the dense patch observed starting at ∼ 20:40 UT, following the onset of anti-sunward flow associated with the southward Bz, when an azimuthal eastward flow channel was observed in the southern edge of RISR (not shown).
3.1.3 Event of 5 May 2018
Similar to 6 March 2016, fast anti-sunward flows but weaker polar cap patches (Fig. 2d) were approximately correlated with the time-shifted large amplitude Alfvénic fluctuations of the IMF Bz and By components, respectively. After the IMF By reversed from duskward (>0), it remained predominantly dawnward (<0) but was undergoing frequent duskward deflections. The large-amplitude southward turnings of the IMF were followed by anti-sunward flows that were reversed or diminished when the IMF Bz switched back to the north. In the cusp, a series of PIFs were observed by the Kapuskasing radar. Figure 7 shows the LoS ionospheric velocities with the ground scatter coded in gray color. Despite the ground-scatter interference and sparse ionospheric backscatter, an approximate correspondence can be made between the time-shifted IMF By and PIFs prior to 19:00 UT that is similar to the correlation with polar cap patches observed by RISR (Fig. 2d). Most of the PIFs appear to have been driven by the duskward IMF By deflections. This is consistent with the transient flows observed by Provan et al. (1998), except in their case, the IMF By was predominantly duskward (>0).
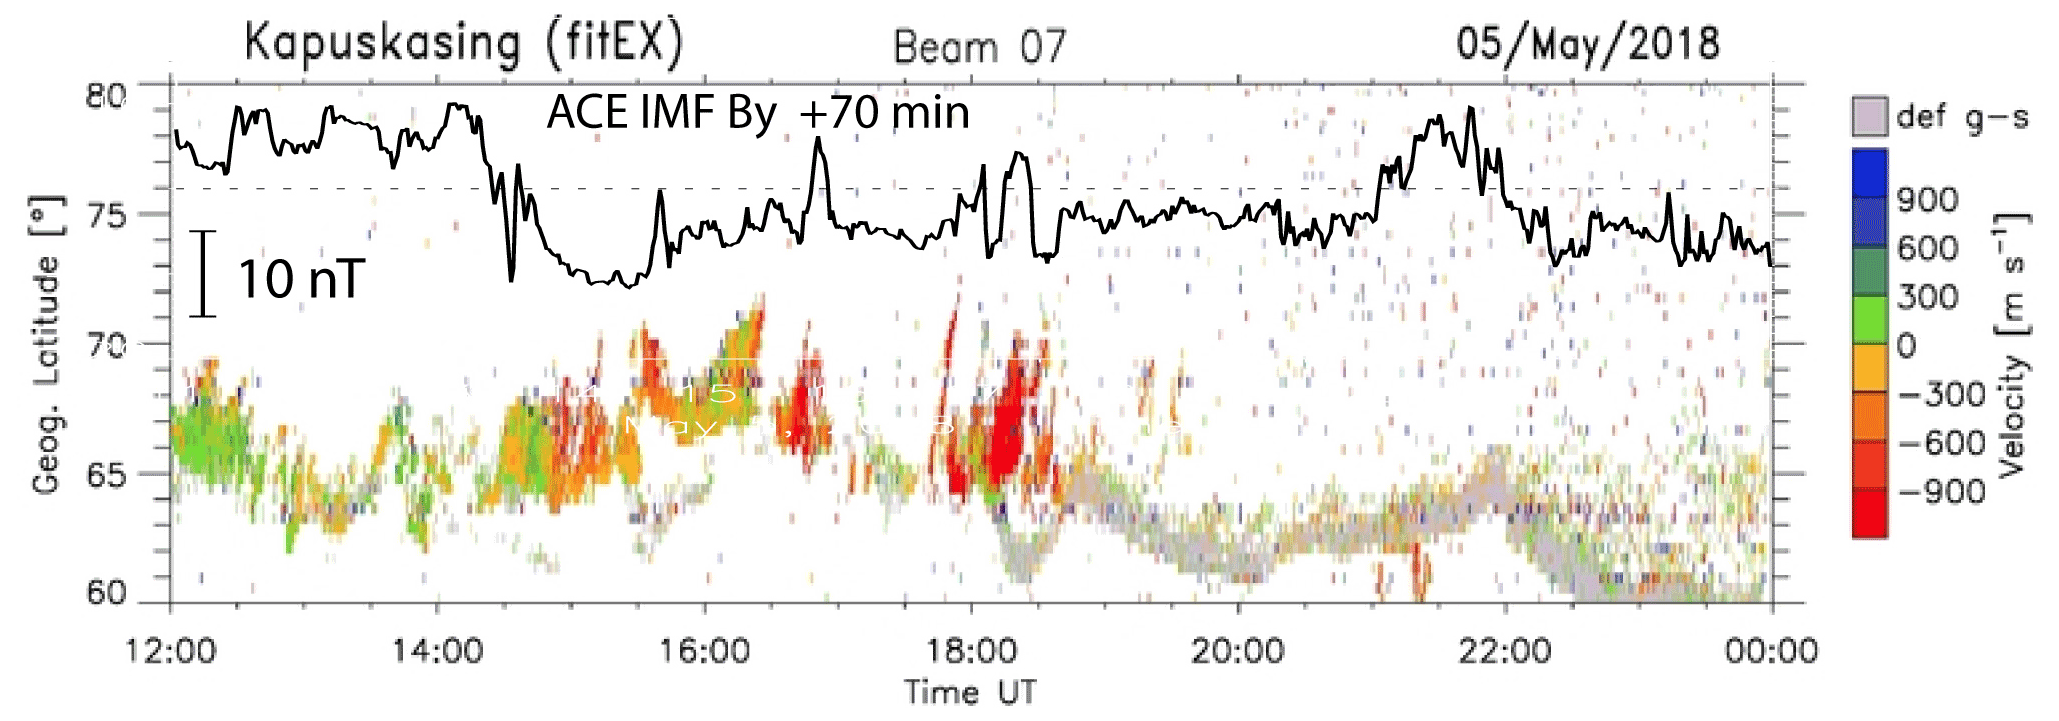
Figure 7The Kapuskasing radar line-of-sight velocities as a function of geographic latitude and time (UT). The time-shifted IMF By observed by ACE are superposed.
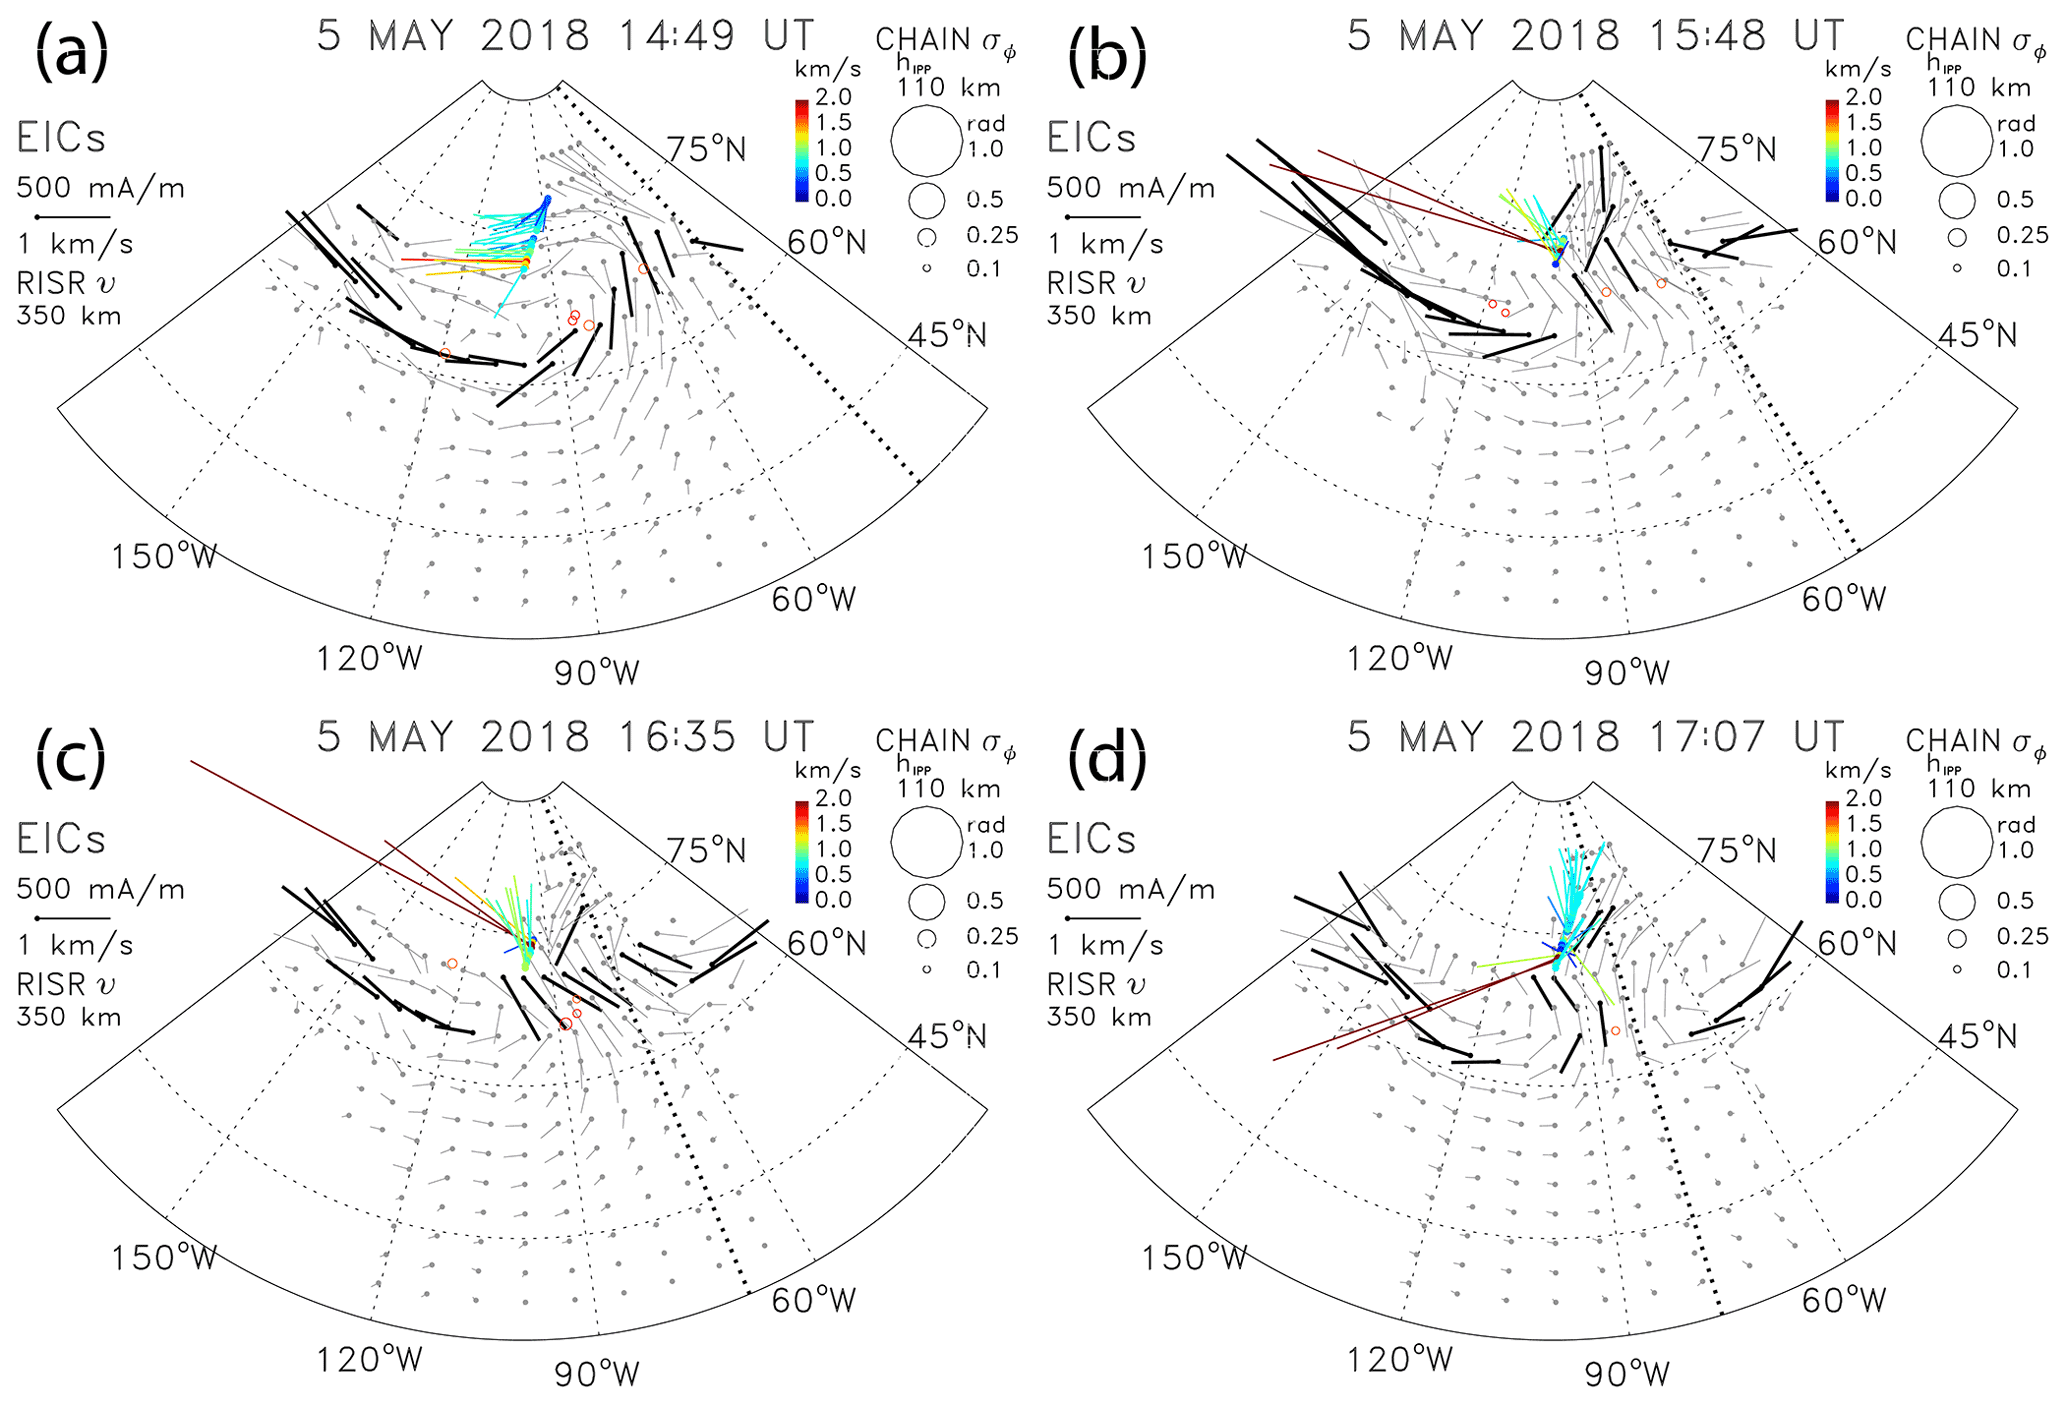
Before 17:00 UT, when the polar cap patches were observed by RISR-N, the cusp was in the RISR-C FoV. The first poleward-propagating weak-density enhancement appeared in the RISR-N FoV (75.5∘ N) at ∼ 14:50 UT following the onset of anti-sunward flow due to the southward Bz and the first duskward deflection of the IMF By before it remained predominantly dawnward (Fig. 2d). More density patches started to be observed from 16:00 UT. While the cusp was in the RISR-C FoV, transient azimuthal flows occurred during periods of 14:49–14:56, 15:39–15:50, 15:55–16:01, 16:09–16:11, 16:28–16:29, 16:35–16:36, 16:54, 17:07, and 17:25–17:27 UT (black rectangles in Fig. 2d) that are associated with duskward deflections of the time-shifted IMF By at ∼ 14:47, 15:46, 16:00, 16:11, 16:29, 16:35, and 17:00 UT (black bars above the rectangles in Fig. 2d). Figure 8 shows four examples of azimuthal transient flows that occurred poleward of the CRB, which is consistent with observations of FTE signatures (Provan et al., 1998).
Following the intensification of the anti-sunward flow caused by the southward Bz turning at 17:50 UT, the highest density patch convected across the whole RISR FoV starting just before 18:00 UT (Fig. 2d). The cusp has shifted equatorward and RISR could not observe azimuthal flows, but a narrow PIF was observed by the Kapuskasing radar at lower latitudes (Fig. 7). While most of the density patches were associated with a significant southward IMF Bz, the next patch was observed between 19:10 and 20:00 UT (Fig. 2d) when the IMF Bz fluctuated around zero. Nevertheless, brief azimuthal flows were observed at the southern edge of RISR-C FoV at 19:04–19:05 UT (not shown).
In comparison with the March events, the electron densities of the patches were lower and did not result in any significant GPS phase variation σΦ, which is discussed in Sect. 3.3.
3.2 Traveling ionospheric disturbances
The electric fields that drive the E×B ionospheric convection in the F-region map to the E-region driving ionospheric currents, including auroral electrojets. The ionospheric currents are sources of Joule heating in the lower thermosphere launching atmospheric gravity waves (AGWs), which in turn cause traveling ionospheric disturbances (TIDs). In this section, we examine the observations of AGWs/TIDs generated by solar wind Alfvén waves coupling to the dayside magnetosphere during the four events discussed above. Figure 9a–d show TIDs observed in the detrended vertical vTEC and the radar ground-scatter power focused and defocused by TIDs moving equatorward. In the case of LSTIDs with a wavelength of more than 1000 km, the tilted isopycnic surfaces divert the refracted radio waves back and forth, thus modulating the range of the ground scatter. The time-shifted time series of the IMF Bz observed by ACE or Geotail are superposed.
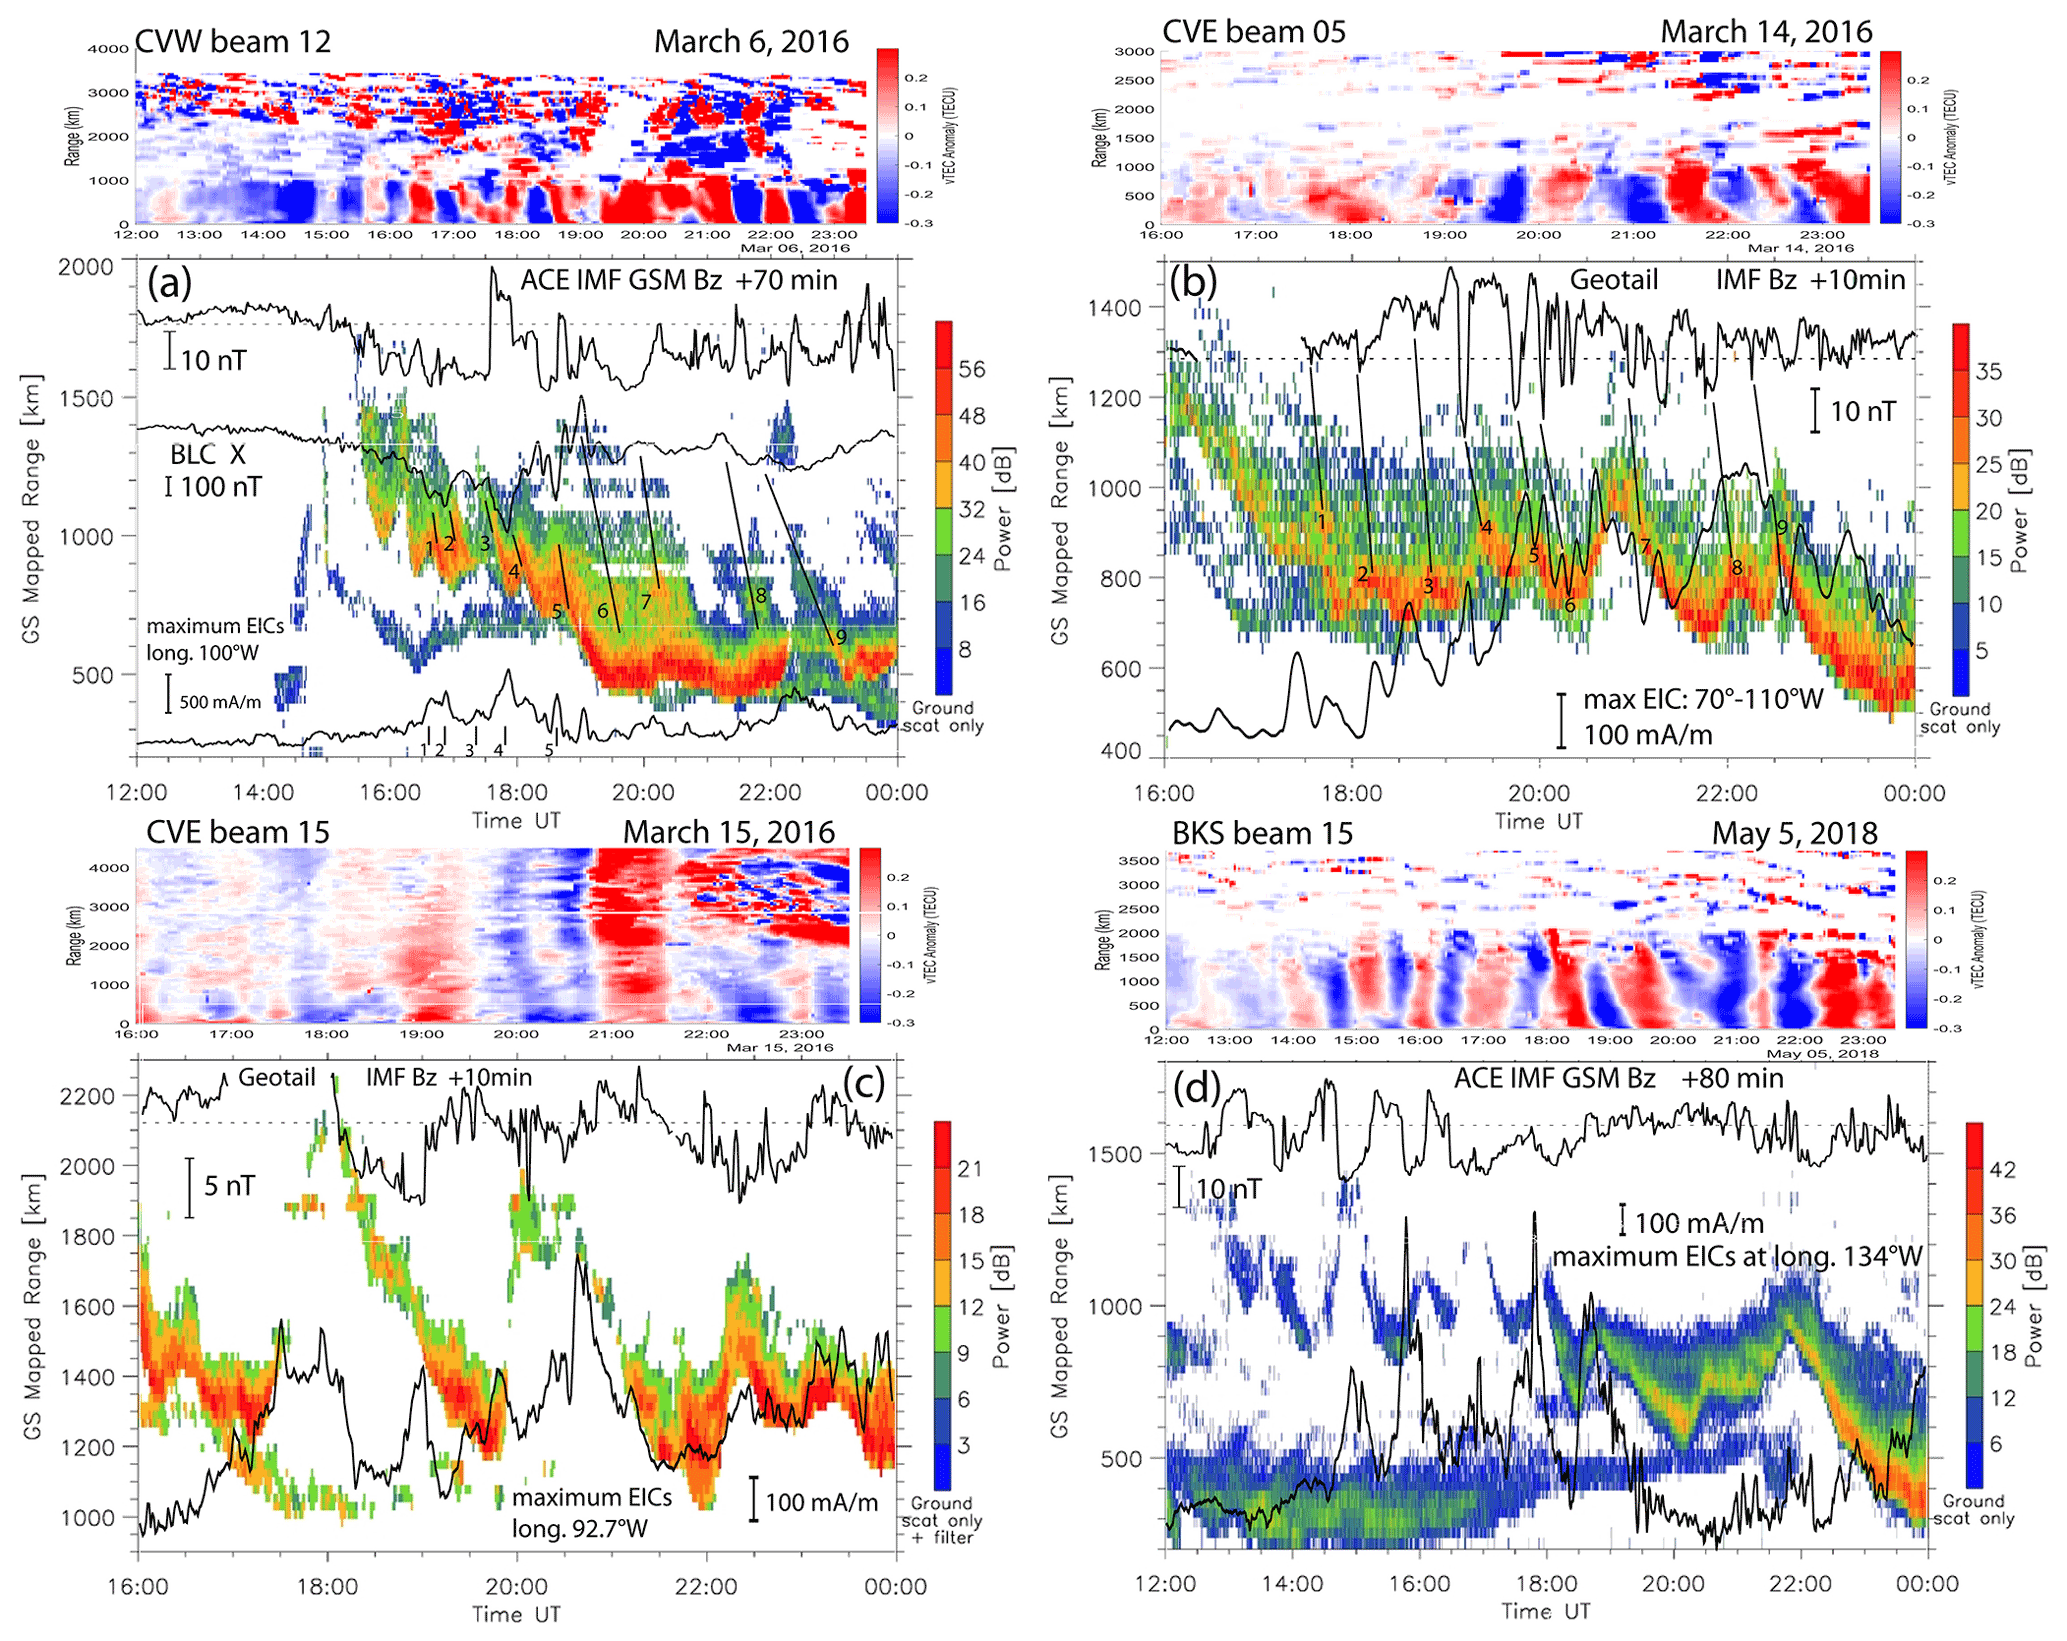
Figure 9TIDs observed in the radar ground-scatter power and the detrended TEC along (a) the Christmas Valley West (CVW) radar beam 12 on 6 March 2016, (b) the Christmas Valley East (CVE) radar beam 5 looking northeast over western and central Canada on 14 March 2016, (c) the CVE radar beam 15 on 15 March 2016, and (d) the Blackstone (BKS) radar beam 15 on 5 May 2018. The time-shifted IMF Bz, the time series of the latitudinal maxima in EICs at given longitudes, and in (a), the X component of the ground magnetic field measured in Baker Lake (BLC), are superposed.
3.2.1 TIDs on 6 March 2016
Figure 9a shows TIDs observed in the ground-scatter power and in the vTEC anomaly mapped at range gates along the Christmas Valley West (CVW) radar beam 12 (Fig. 10a) looking northwest over western Canada on 6 March 2016. Rather than showing the ground-scatter slant range, the ground-scatter range mapping discussed by Bristow et al. (1994) and Frissell et al. (2014) is applied to reflect the TID location in the ionosphere. The IMF Bz, the X component of the ground magnetic field measured in Baker Lake (BLC), and time series of the latitudinal maxima in EICs at the longitude of 99.6∘ W, are superposed. As the fluctuating IMF started to turn southward, fluctuating ionospheric currents sensed by magnetometers launched AGWs.
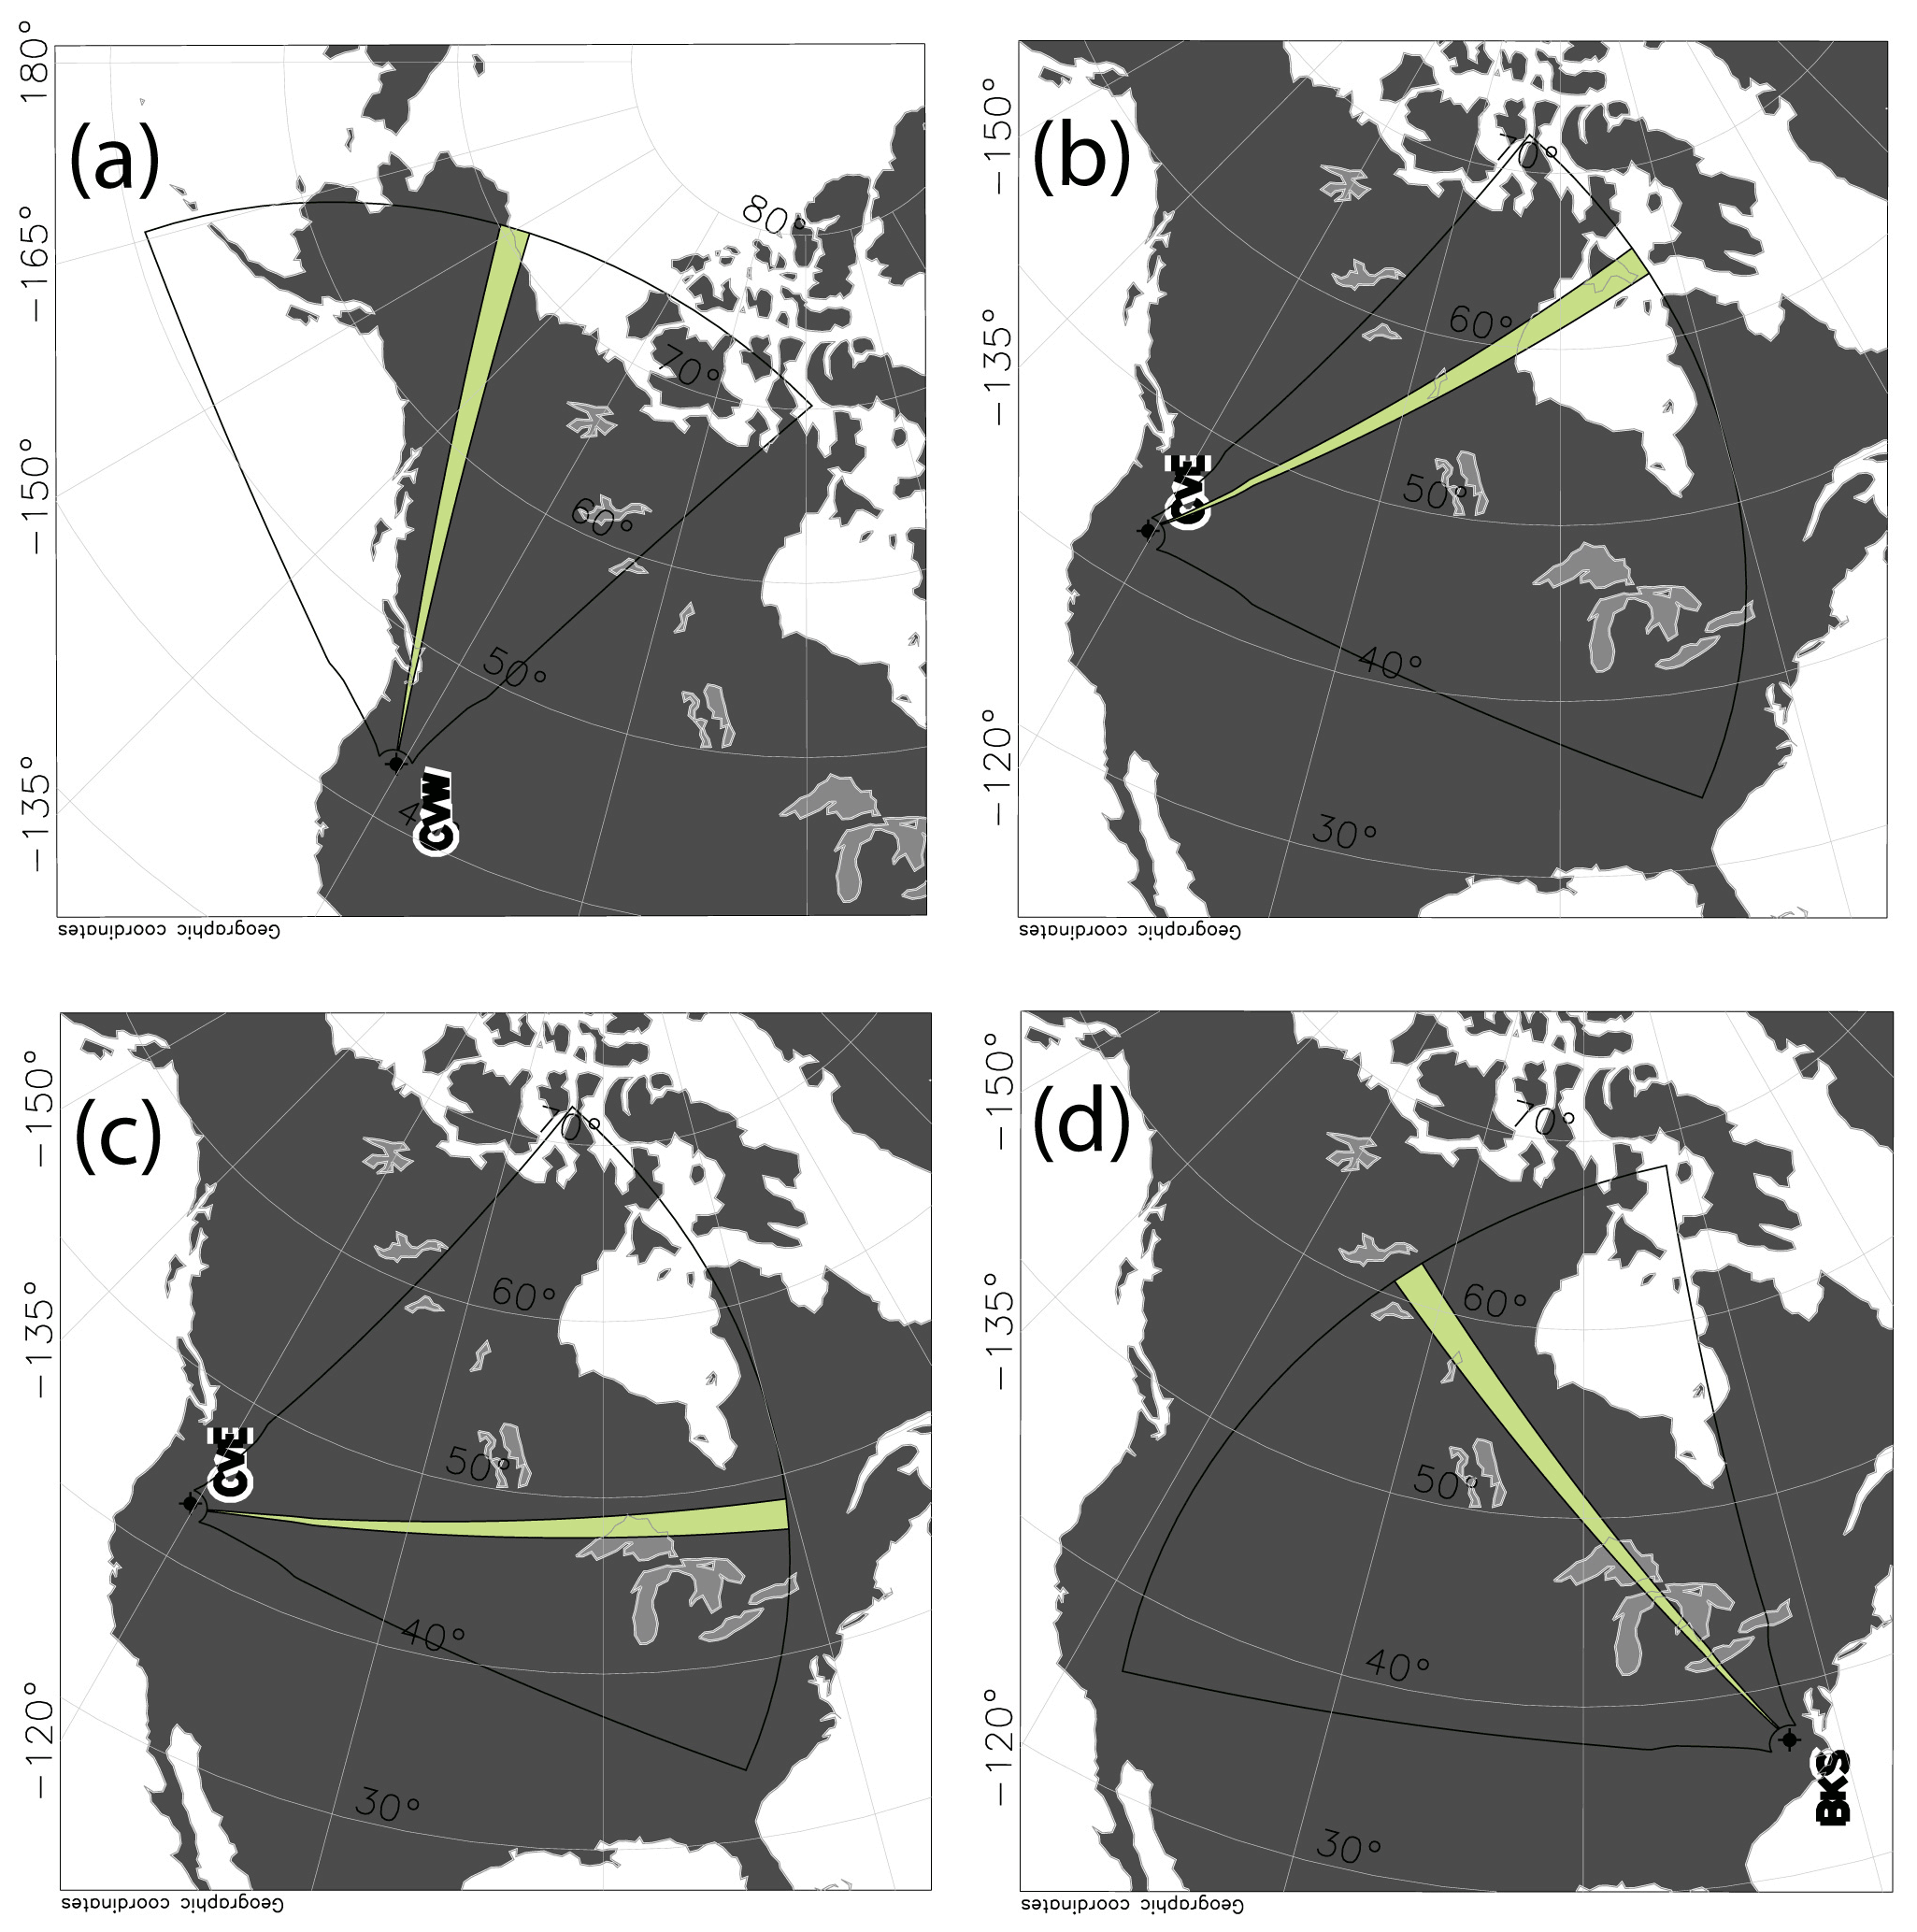
Figure 10Radar FoVs and selected beams of (a) the Christmas Valley West (CVW) radar beam 12, (b) the Christmas Valley East (CVE) radar beam 5 (c) the CVE radar beam 15, and (d) the Blackstone (BKS) radar beam 15 used in Fig. 9.
While the HF propagation may introduce some uncertainty to the radar observations of TIDs, there is a one-to-one correspondence between the BLC X-component fluctuations due to westward currents inverted to EICs and the TIDs (marked 1 to 5 in Fig. 9a). After ∼ 19:00 UT, it was the eastward electrojet intensifications that launched TIDs (marked 6 to 9). Along the radar beam at near ranges, there is an approximate one-to-one correspondence between the vTEC anomaly variations due to TIDs that propagated to midlatitudes and the TIDs observed in the ground scatter, although TIDs 1 and 2 are not resolved in the vTEC anomaly. At far ranges, MSTIDs and LSTIDs before and after ∼ 19:00 UT, respectively, are observed propagating from their sources – the ionospheric currents at high latitudes. The LSTIDs are correlated with the long-period fluctuations of the IMF Bz, while the MSTIDs appear to be consistent with shorter period IMF fluctuations.
Figures 3c and d were selected to show transient azimuthal flows observed by RISR at 16:30 and 16:52 UT. These times approximately correspond to the times of EICs maxima (Fig. 9a) due to the westward electrojet spanning from Alaska across northern Canada that likely launched TIDs 1 and 2. Because of the limited coverage by GPS receivers at high latitudes, the MSTIDs could only be detected over Alaska/Yukon, but LSTIDs were observed at midlatitudes after ∼ 19:00 UT. Figure 11a shows intense westward and eastward electrojets that launched the LSTID 5 (Fig. 9a) that was observed in the detrended vTEC maps an hour later (Fig. 11b). The LSTID 7 that was launched at ∼ 20:00 UT by an intensification of eastward electrojet (Fig. 11c) later propagated to midlatitudes. Figure 11d shows it stretching from the western coast. The non-propagating, enhanced vTEC region at higher latitudes stretching from central to eastern Canada is due to storm-enhanced density discussed in Sect. 3.3.
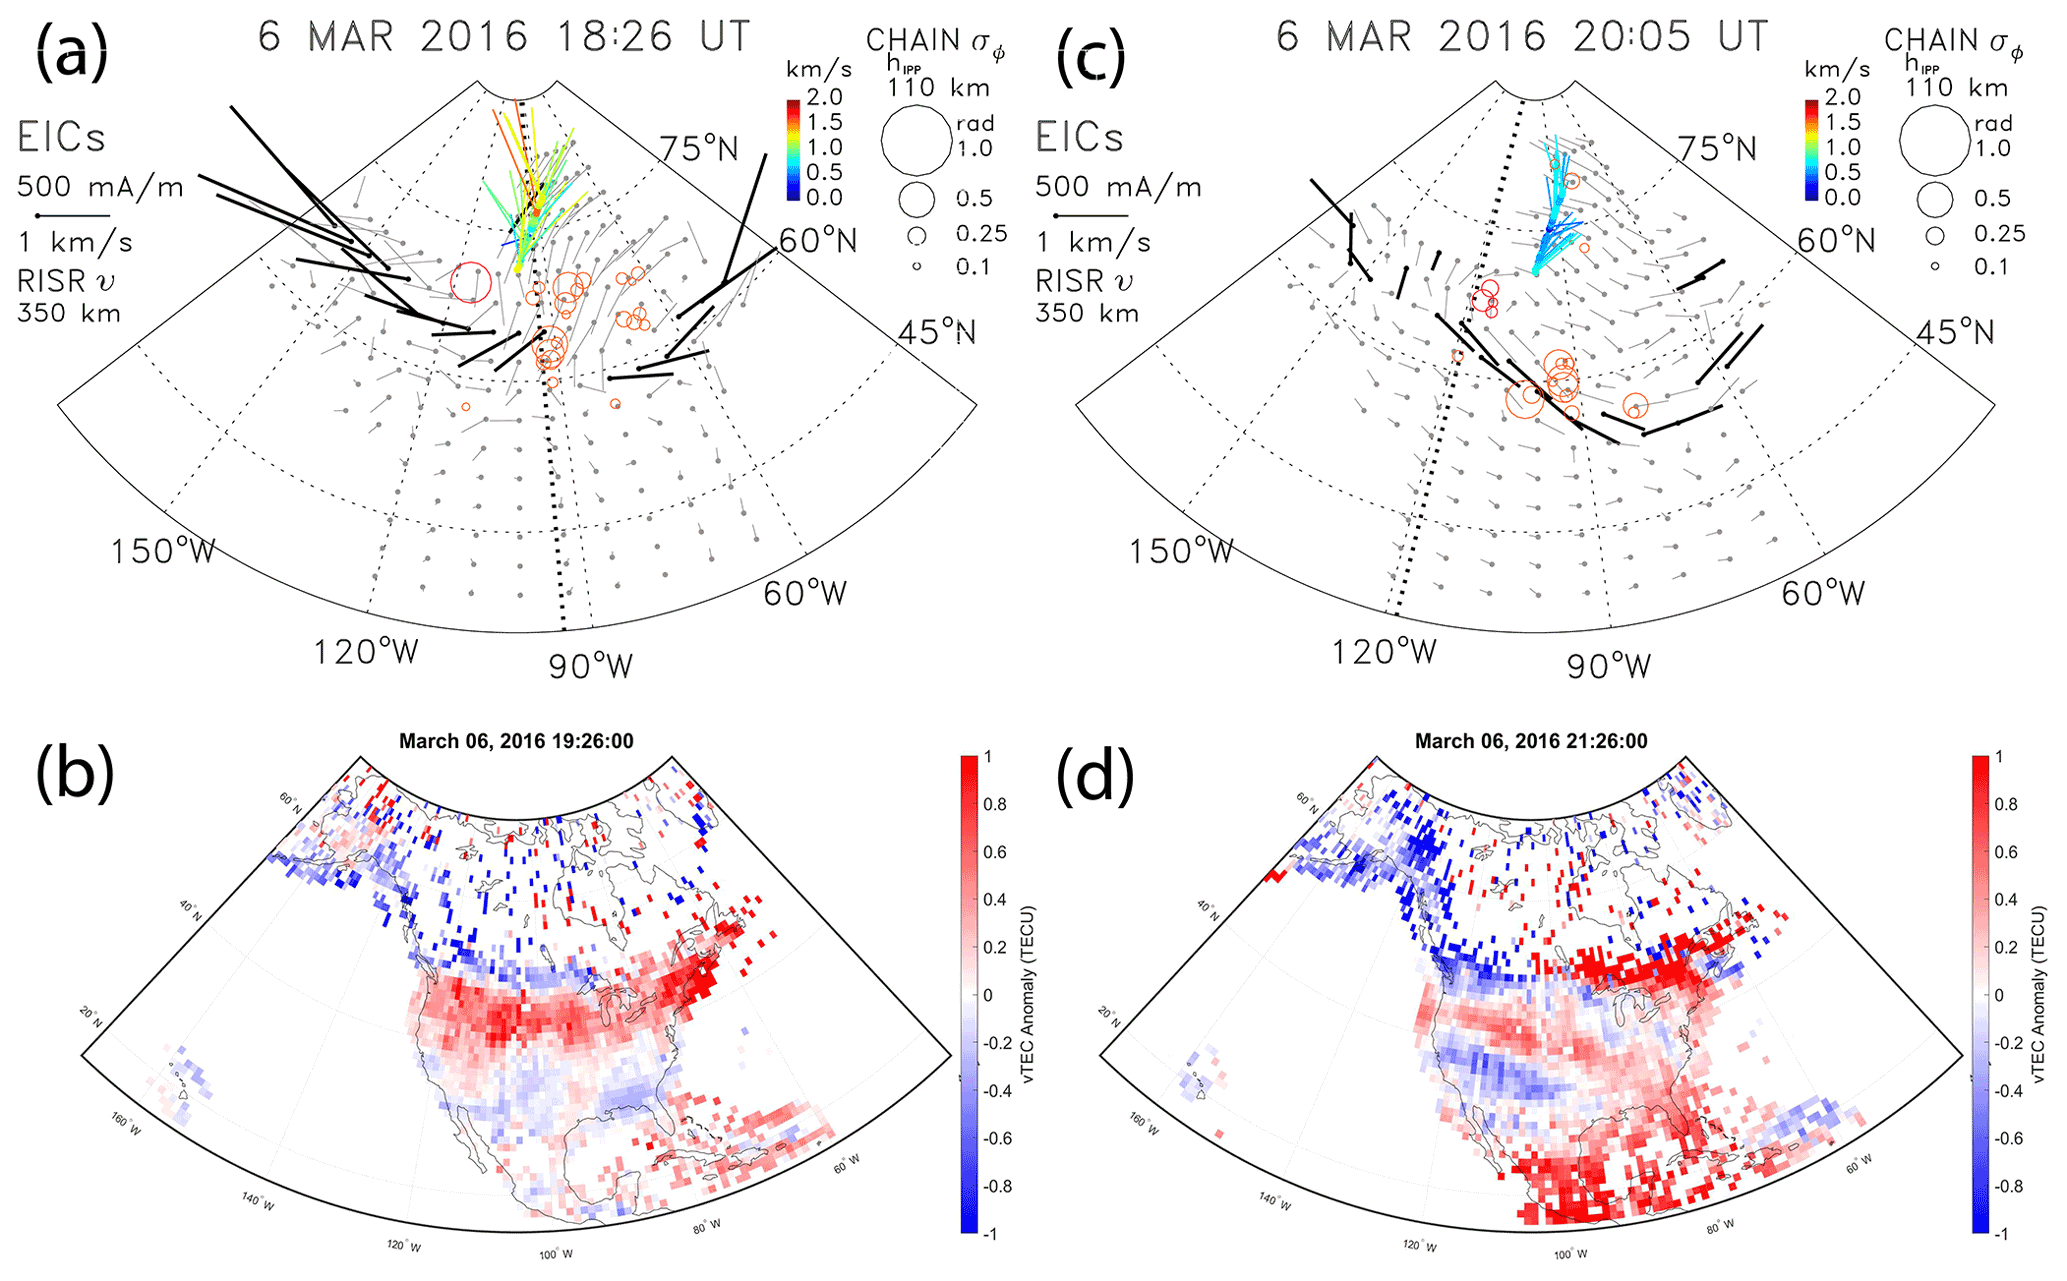
Figure 11Panels (a, c) show the horizontal EICs with the latitudinal maxima highlighted in bold and the CHAIN GPS IPPs with enhanced phase-variation values, σΦ, (scaled circles). Panels (b, d) show the detrended vTEC maps at later times on 6 March 2016.
The one-to-one correspondence between the IMF Bz fluctuations and auroral currents that launched the TIDs is less evident, but the IMF Bz fluctuations were similar to the X component measured by another magnetometer further west in Barrow (BRW), Alaska, between ∼ 16:30 and 19:00 UT (not shown). However, the coupling of solar wind ultra-low frequency (ULF) waves to the magnetosphere is a complex process that can involve pressure pulses, mode conversion to fast mode waves, and field-line resonances on closed magnetic field lines (e.g., Prikryl et al., 1998, and references therein). There were large proton densities (up to ∼ 35 cm−3) and dynamic pressure fluctuations (up to 13 nPa) observed in the solar wind (not shown) that likely contributed to modulating the ionospheric currents.
3.2.2 TIDs on 14–15 March 2016
Figure 9b shows TIDs (1–9) observed by the CVE radar beam 5 (Fig. 10b) looking northeast over western and central Canada on 14 March 2016. The detrended vTEC along the beam appears to have detected MSTIDs at ranges between ∼ 500 and 1000 km before ∼ 19:30 UT, and LSTIDs thereafter, but MSTIDs 5–6 and the structure preceding the LSTID 7 that can be seen in the ground scatter are not resolved in the vTEC anomaly.
Superposed time series of the latitudinal maxima in EICs are averages over longitudes between 70 and 110∘ W. The southward IMF Bz dips of the IMF that modulated the anti-sunward flows and produced polar cap patches (Fig. 2b) also played a role in driving intensifications of ionospheric currents launching AGWs/TIDs. The latitudinal maxima in EICs indicate the initiation (launch) times of AGWs that approximately correspond with TIDs observed by the CVE radar.
There is an approximate correspondence between the southward turning of the IMF Bz and EICs/TIDs 1–6. This becomes less clear after 20:00 UT, partly because of westward and eastward electrojet intensifications at different latitudes. The fluctuating EIC that peaked at 20:34 UT due to westward current at high latitudes was associated with a fluctuation of the ground-scatter power, but the corresponding fluctuation in the vTEC anomaly at close range (∼ 200 km) is poorly resolved. The southward turning of the IMF Bz at ∼ 21:00 UT (Fig. 9b) coincided with the launch of LSTID 7. The next southward turning of the IMF is associated with a peak in EIC at 21:10 UT, but this time due to the eastward electrojet at significantly lower latitudes (Fig. 12a). Beam 5 does not reveal a distinct TID signature, except for the ground-scatter power increase. However, another TID (7+) initiation superposed on the TID 7 was observed by beams 0 and 1 (not shown). The LSTID 7+ was later observed in the detrended vTEC maps (Fig. 12b).
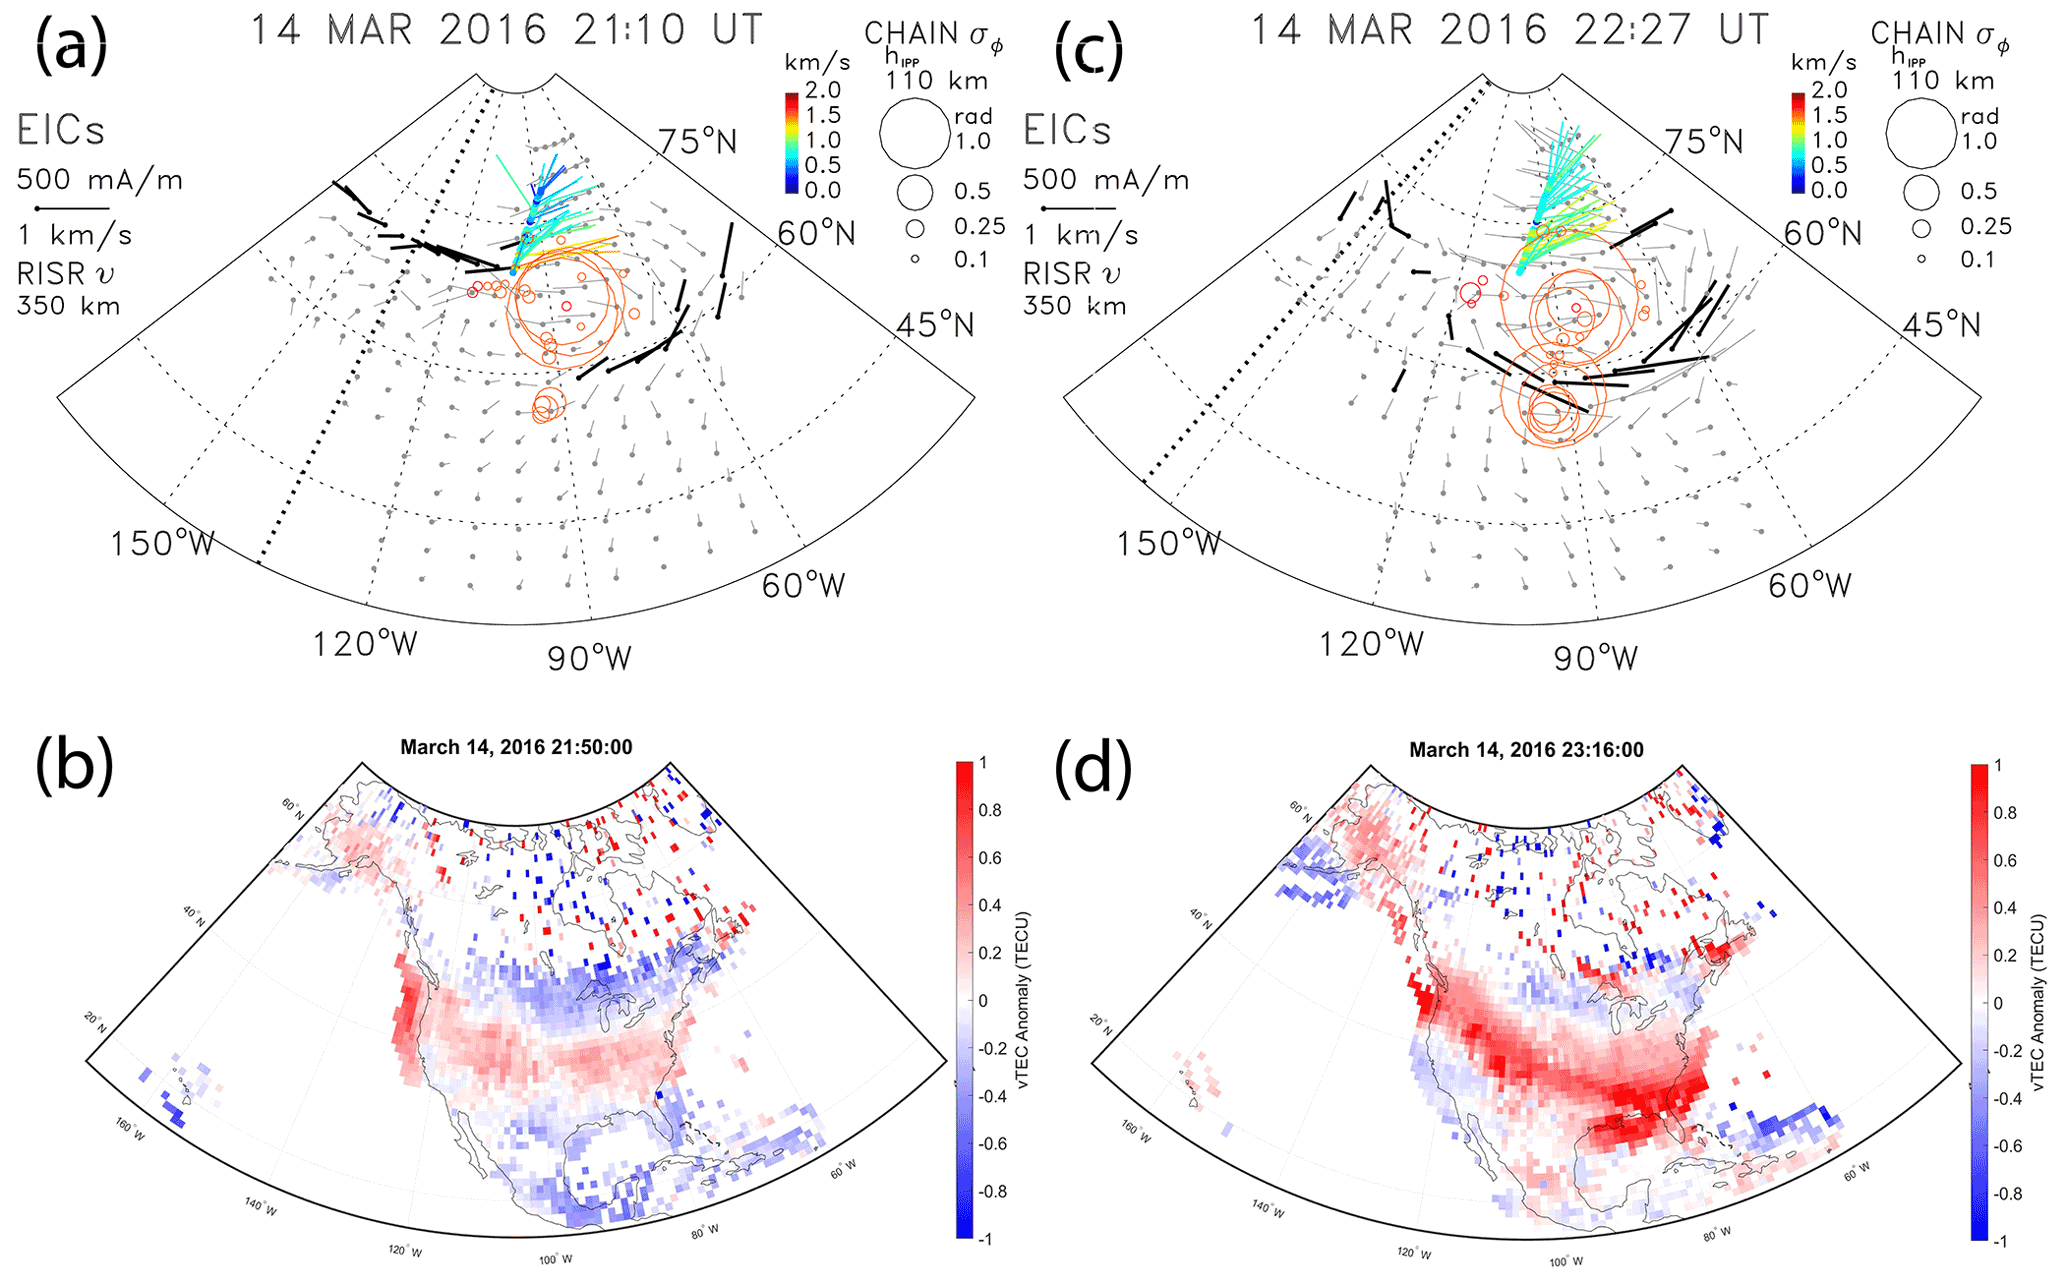
Figure 12Panels (a, c) show the horizontal EICs with the latitudinal maxima highlighted in bold and the CHAIN GPS IPPs with enhanced phase-variation values, σΦ (scaled circles). Panels (b, d) show the detrended vTEC maps at later times on 14 March 2016.
The LSTIDs 8 and 9 were observed by the CVE radar starting at ∼ 22:00 and 22:30 UT, respectively. Although two peaks in the averaged eastward EICs are not well resolved, the LSTIDs that are associated with southward turnings of the IMF Bz were launched by intensifications of the eastward electrojet (Fig. 12c). The stronger LSTID 9 was later observed overtaking the weaker LSTID 8 ahead of it over the southern United States (Fig. 12d).
On 15 March 2016, the CVE radar beam 15 (Fig. 10c) looking northeast across the northwestern United States and eastern Canada observed LSTIDs in the ground scatter (Fig. 9c) at far ranges on the second HF propagation hop between the ground and ionosphere, which introduces some uncertainty in the HF propagation. These LSTIDs were launched by intense westward and eastward electrojet currents modulated by long-period variations of the IMF Bz observed by Geotail. The time series of the latitudinal maxima in EICs at the longitude of 92.7∘ W show long-period EIC variations that are associated with the LSTIDs and correspond with the vTEC anomaly variations mapped along the beam. The equatorward-propagating LSTIDs were observed in the detrended vTEC maps as they started to appear along the border between the United States and Canada. Figure 13a and b show intensifications of the westward and eastward electrojets that launched the LSTIDs observed later in the detrended vTEC maps (Fig. 13c–d).

Figure 13Panels (a–b) show the horizontal EICs with the latitudinal maxima at each longitude grid highlighted in bold and the CHAIN GPS IPPs with enhanced phase-variation values, σΦ (scaled circles). Panels (c–d) represent the detrended vTEC maps showing LSTIDs at later times on 15 March 2016.
3.2.3 TIDs on 5 May 2018
Figure 9d shows TIDs observed by the BKS radar beam 15 (Fig. 10d) looking northwest over central Canada on 5 May 2018. There is a one-to-one correspondence between the large-amplitude IMF Bz due to solar wind Alfvén waves and TIDs observed in the ground scatter and the vTEC anomaly mapped along the beam. Also, the peaks in the time series of the maximum EICs at a longitude of 134∘ W are correlated with the southward IMF Bz and the TIDs. While the first two latitudinal maxima of EICs associated with TIDs are weak at this longitude, these peaks are more pronounced and coincide with the first two TIDs and the time-shifted IMF Bz negative peaks at longitudes of 148 and 155∘ W (not shown). The peaks of the latitudinal maxima of EICs indicate approximate times when the AGWs that caused the TIDs were launched.
The southward IMF turnings due to large-amplitude Alfvén waves (12:00–18:00 UT) were followed by intensifications of the auroral electrojets each launching a TID (Fig. 9d). The next EIC intensification at ∼ 18:30 UT launched another strong TID. As the Geotail IMF Bz turned from southward to mildly northward and fluctuated, weaker TIDs followed between 20:00 and 21:30 UT. After the IMF turned southward again, strong TIDs were observed again. Figure 14a and b show intensifications of the westward and eastward electrojets that launched the LSTIDs observed later in the detrended vTEC maps (Fig. 14c–d).
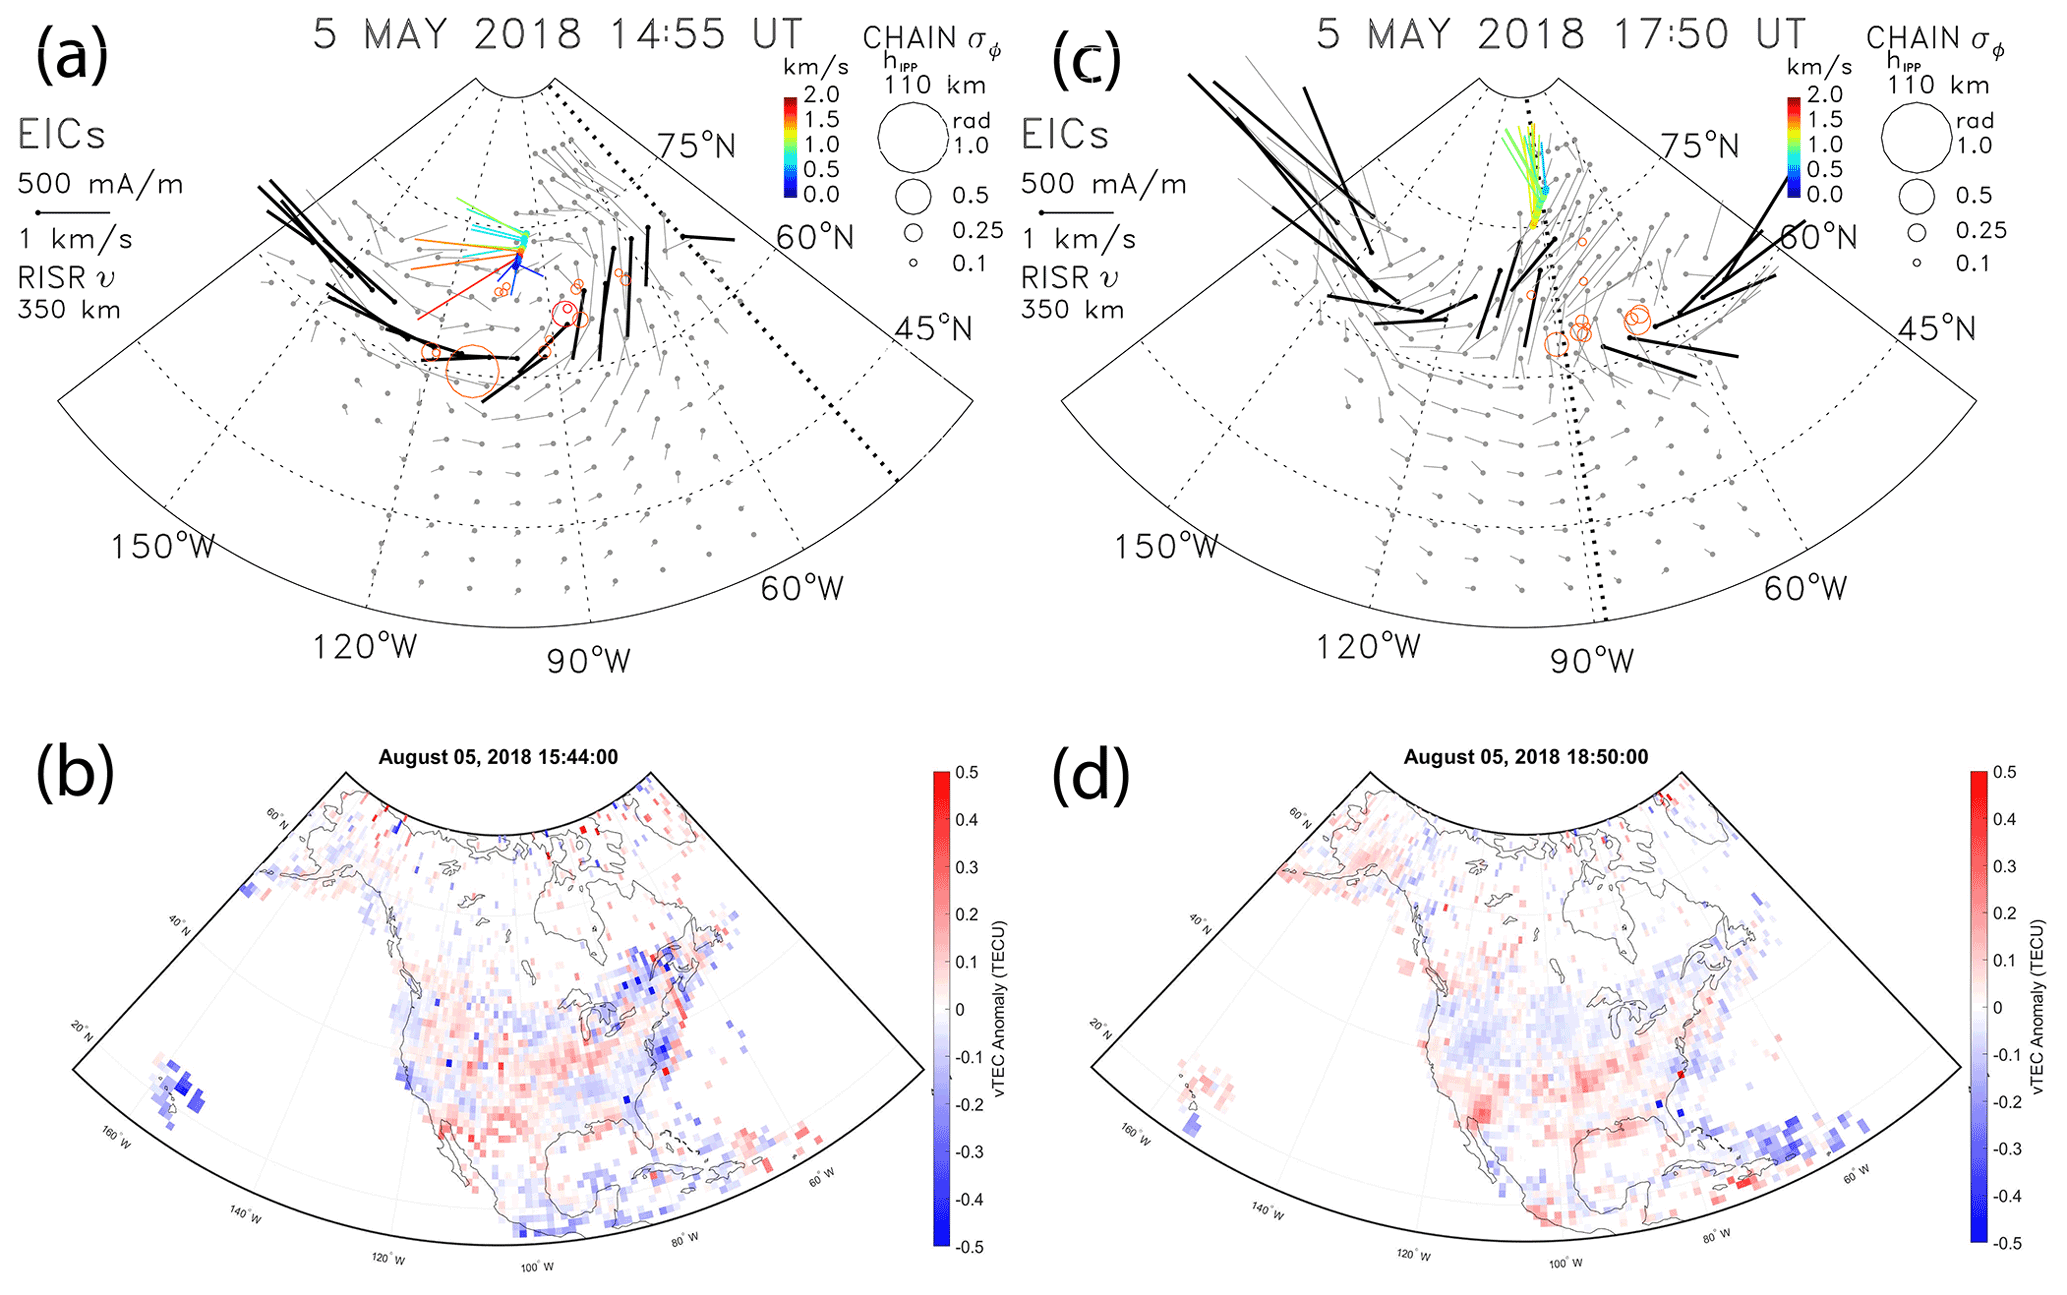
Figure 14Panels (a–b) show the horizontal EICs with the latitudinal maxima at each longitude grid highlighted in bold and the CHAIN GPS IPPs with enhanced phase-variation values, σΦ (scaled circles). Panels (c–d) represent the detrended vTEC maps showing LSTIDs at later times on 5 May 2018.
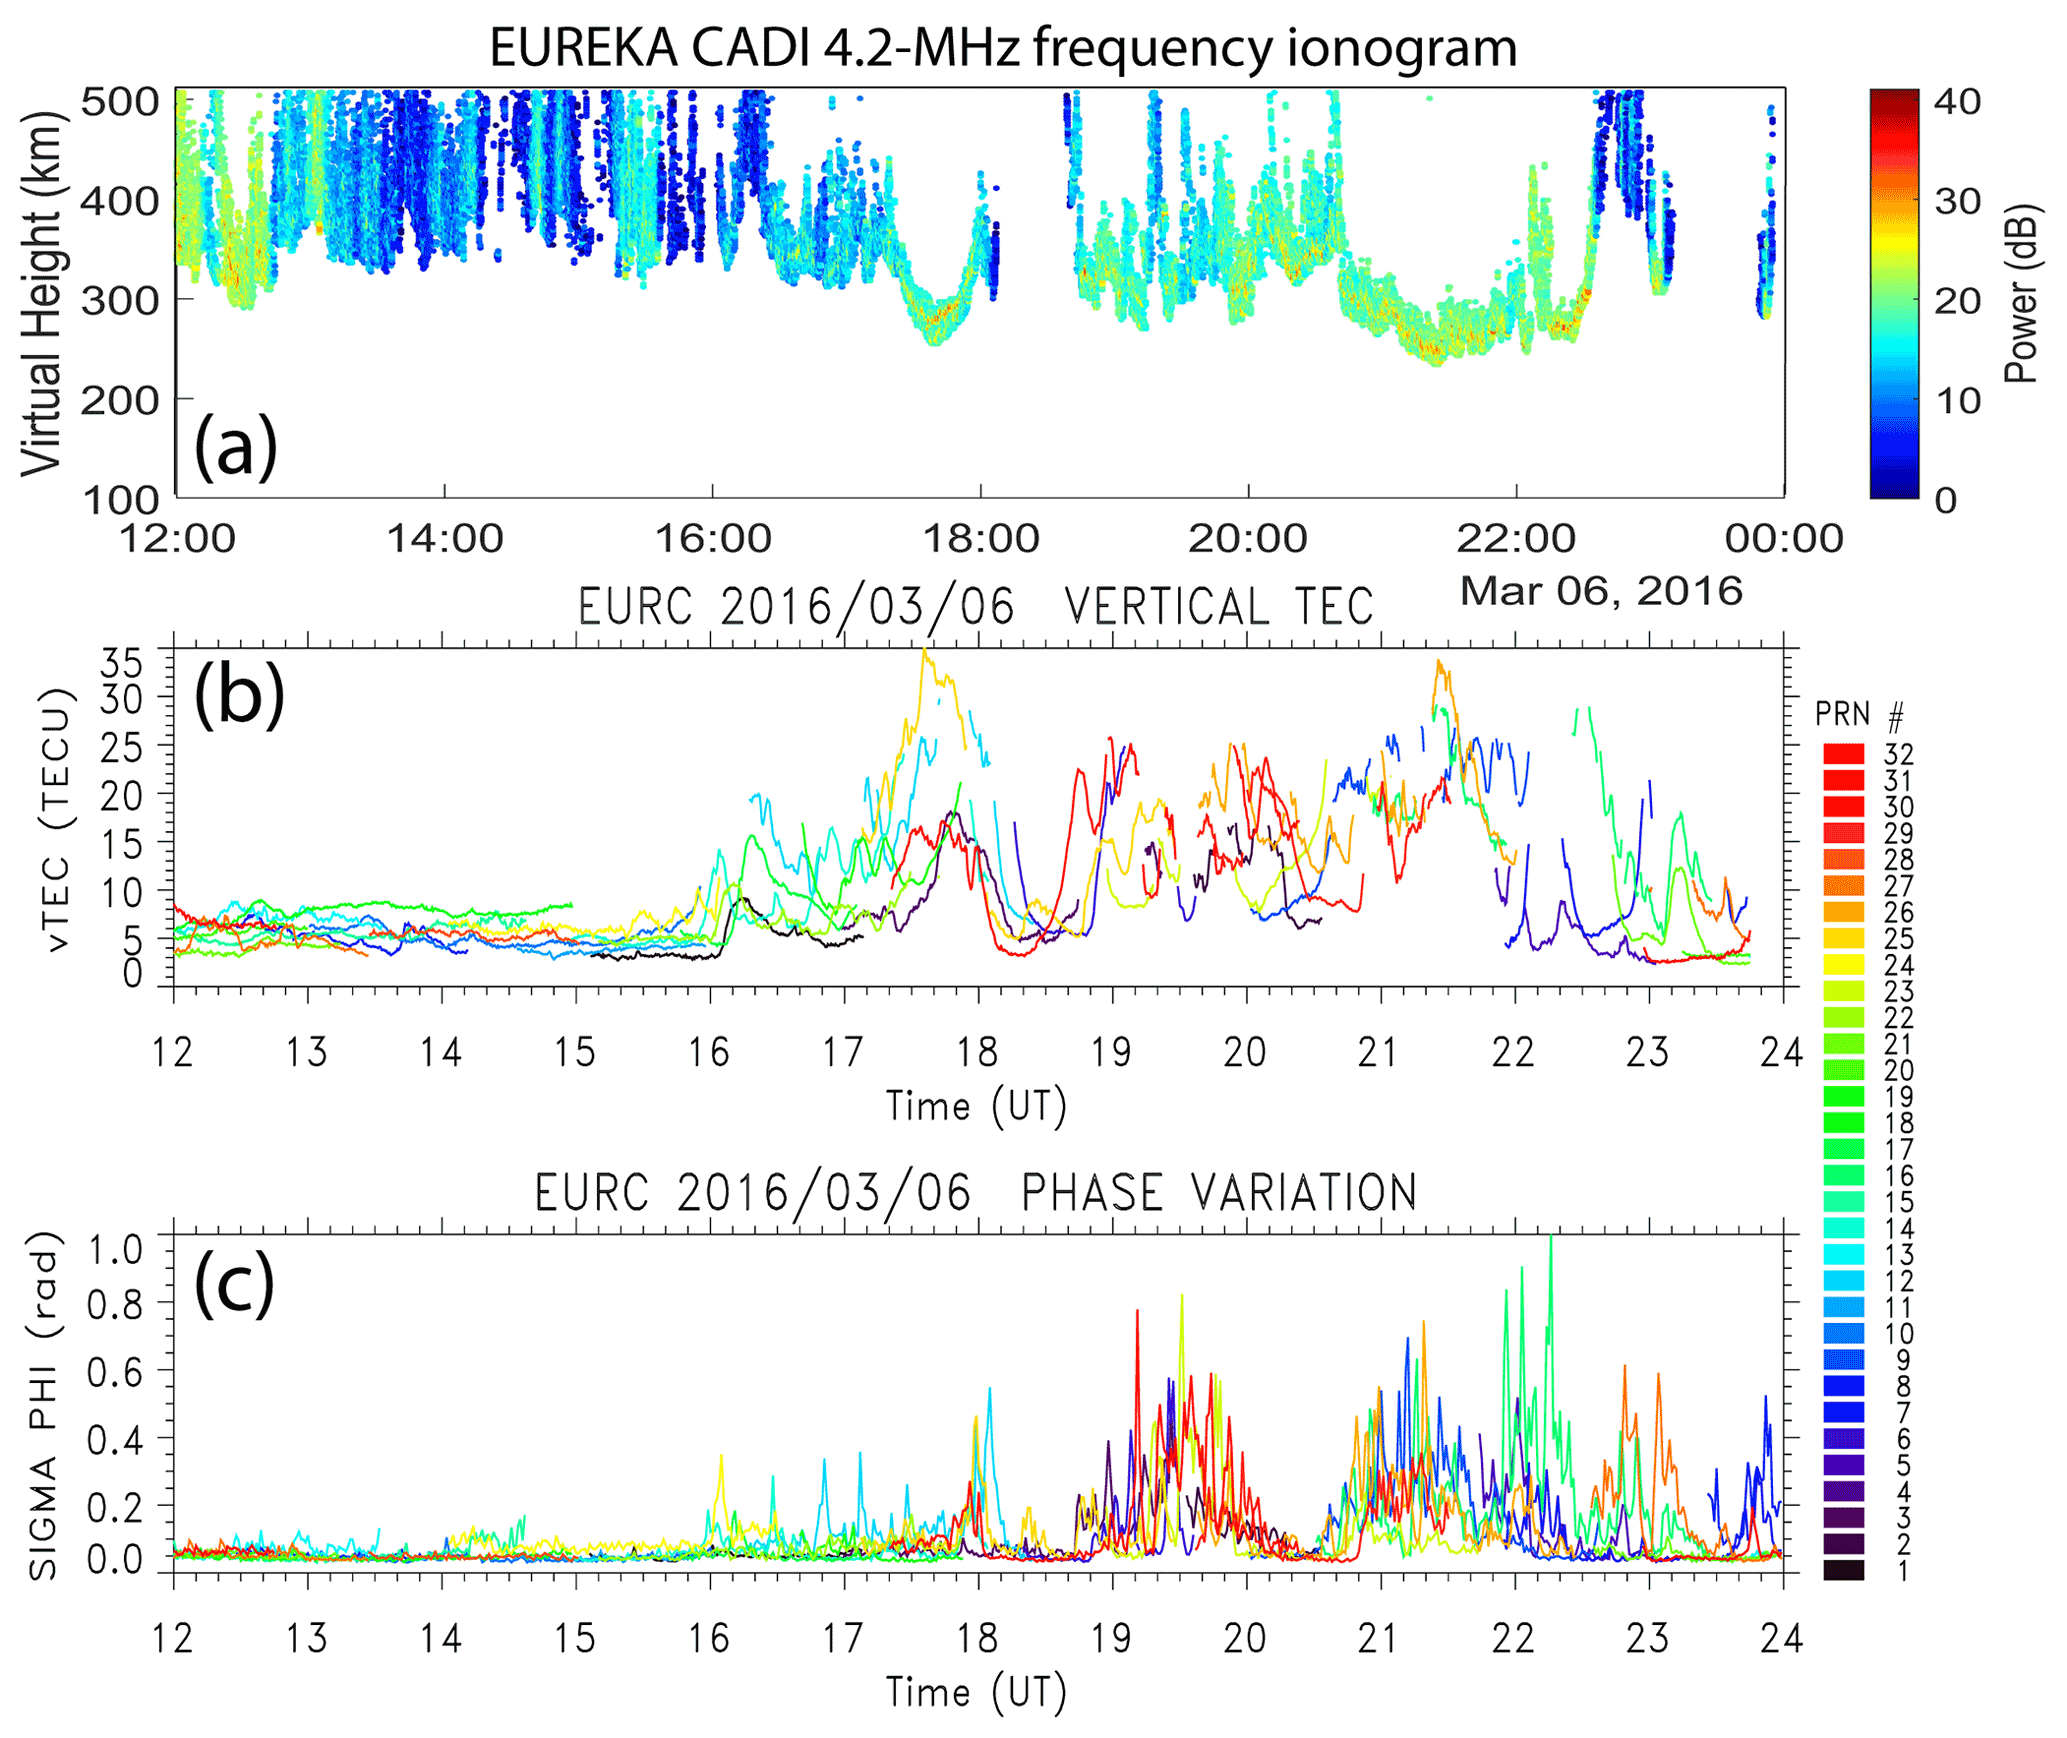
Figure 15Panel (a) displays the fixed 4.2 MHz frequency ionogram, the GPS (b) vTec, and (c) phase variation observed from Eureka on 6 March 2016.
3.3 GPS phase variation in the cusp, polar cap, and auroral oval
The CHAIN GPS phase variation has been linked to polar cap patches, cusp, and auroral precipitation/currents (Prikryl et al., 2011, 2016, 2021a). While this is not the focus of the present paper, it is of interest to compare the above events in terms of the temporal and spatial occurrence of the GPS TEC and phase variation.
The strongest polar cap patches that were observed by RISR (Fig. 2a) convected over the Canadian Advanced Digital Ionosonde (CADI) ionosondes in Resolute Bay and Eureka. The fixed-frequency ionogram from Eureka (Fig. 15a) shows the passing density patches in the zenith over the ionosonde as the U-shaped structures. The calibrated GPS vTEC corrected for biases shows a good correspondence with the patches observed by the ionosonde. The relative variations of the slant TEC resulted in GPS phase variation, σΦ, reaching up to 1 rad (Fig. 5c). In comparison, on 14–15 March 2016 and 5 May 2018, the patches observed by ionosondes were significantly weaker and caused only weak to moderate GPS phase variations.
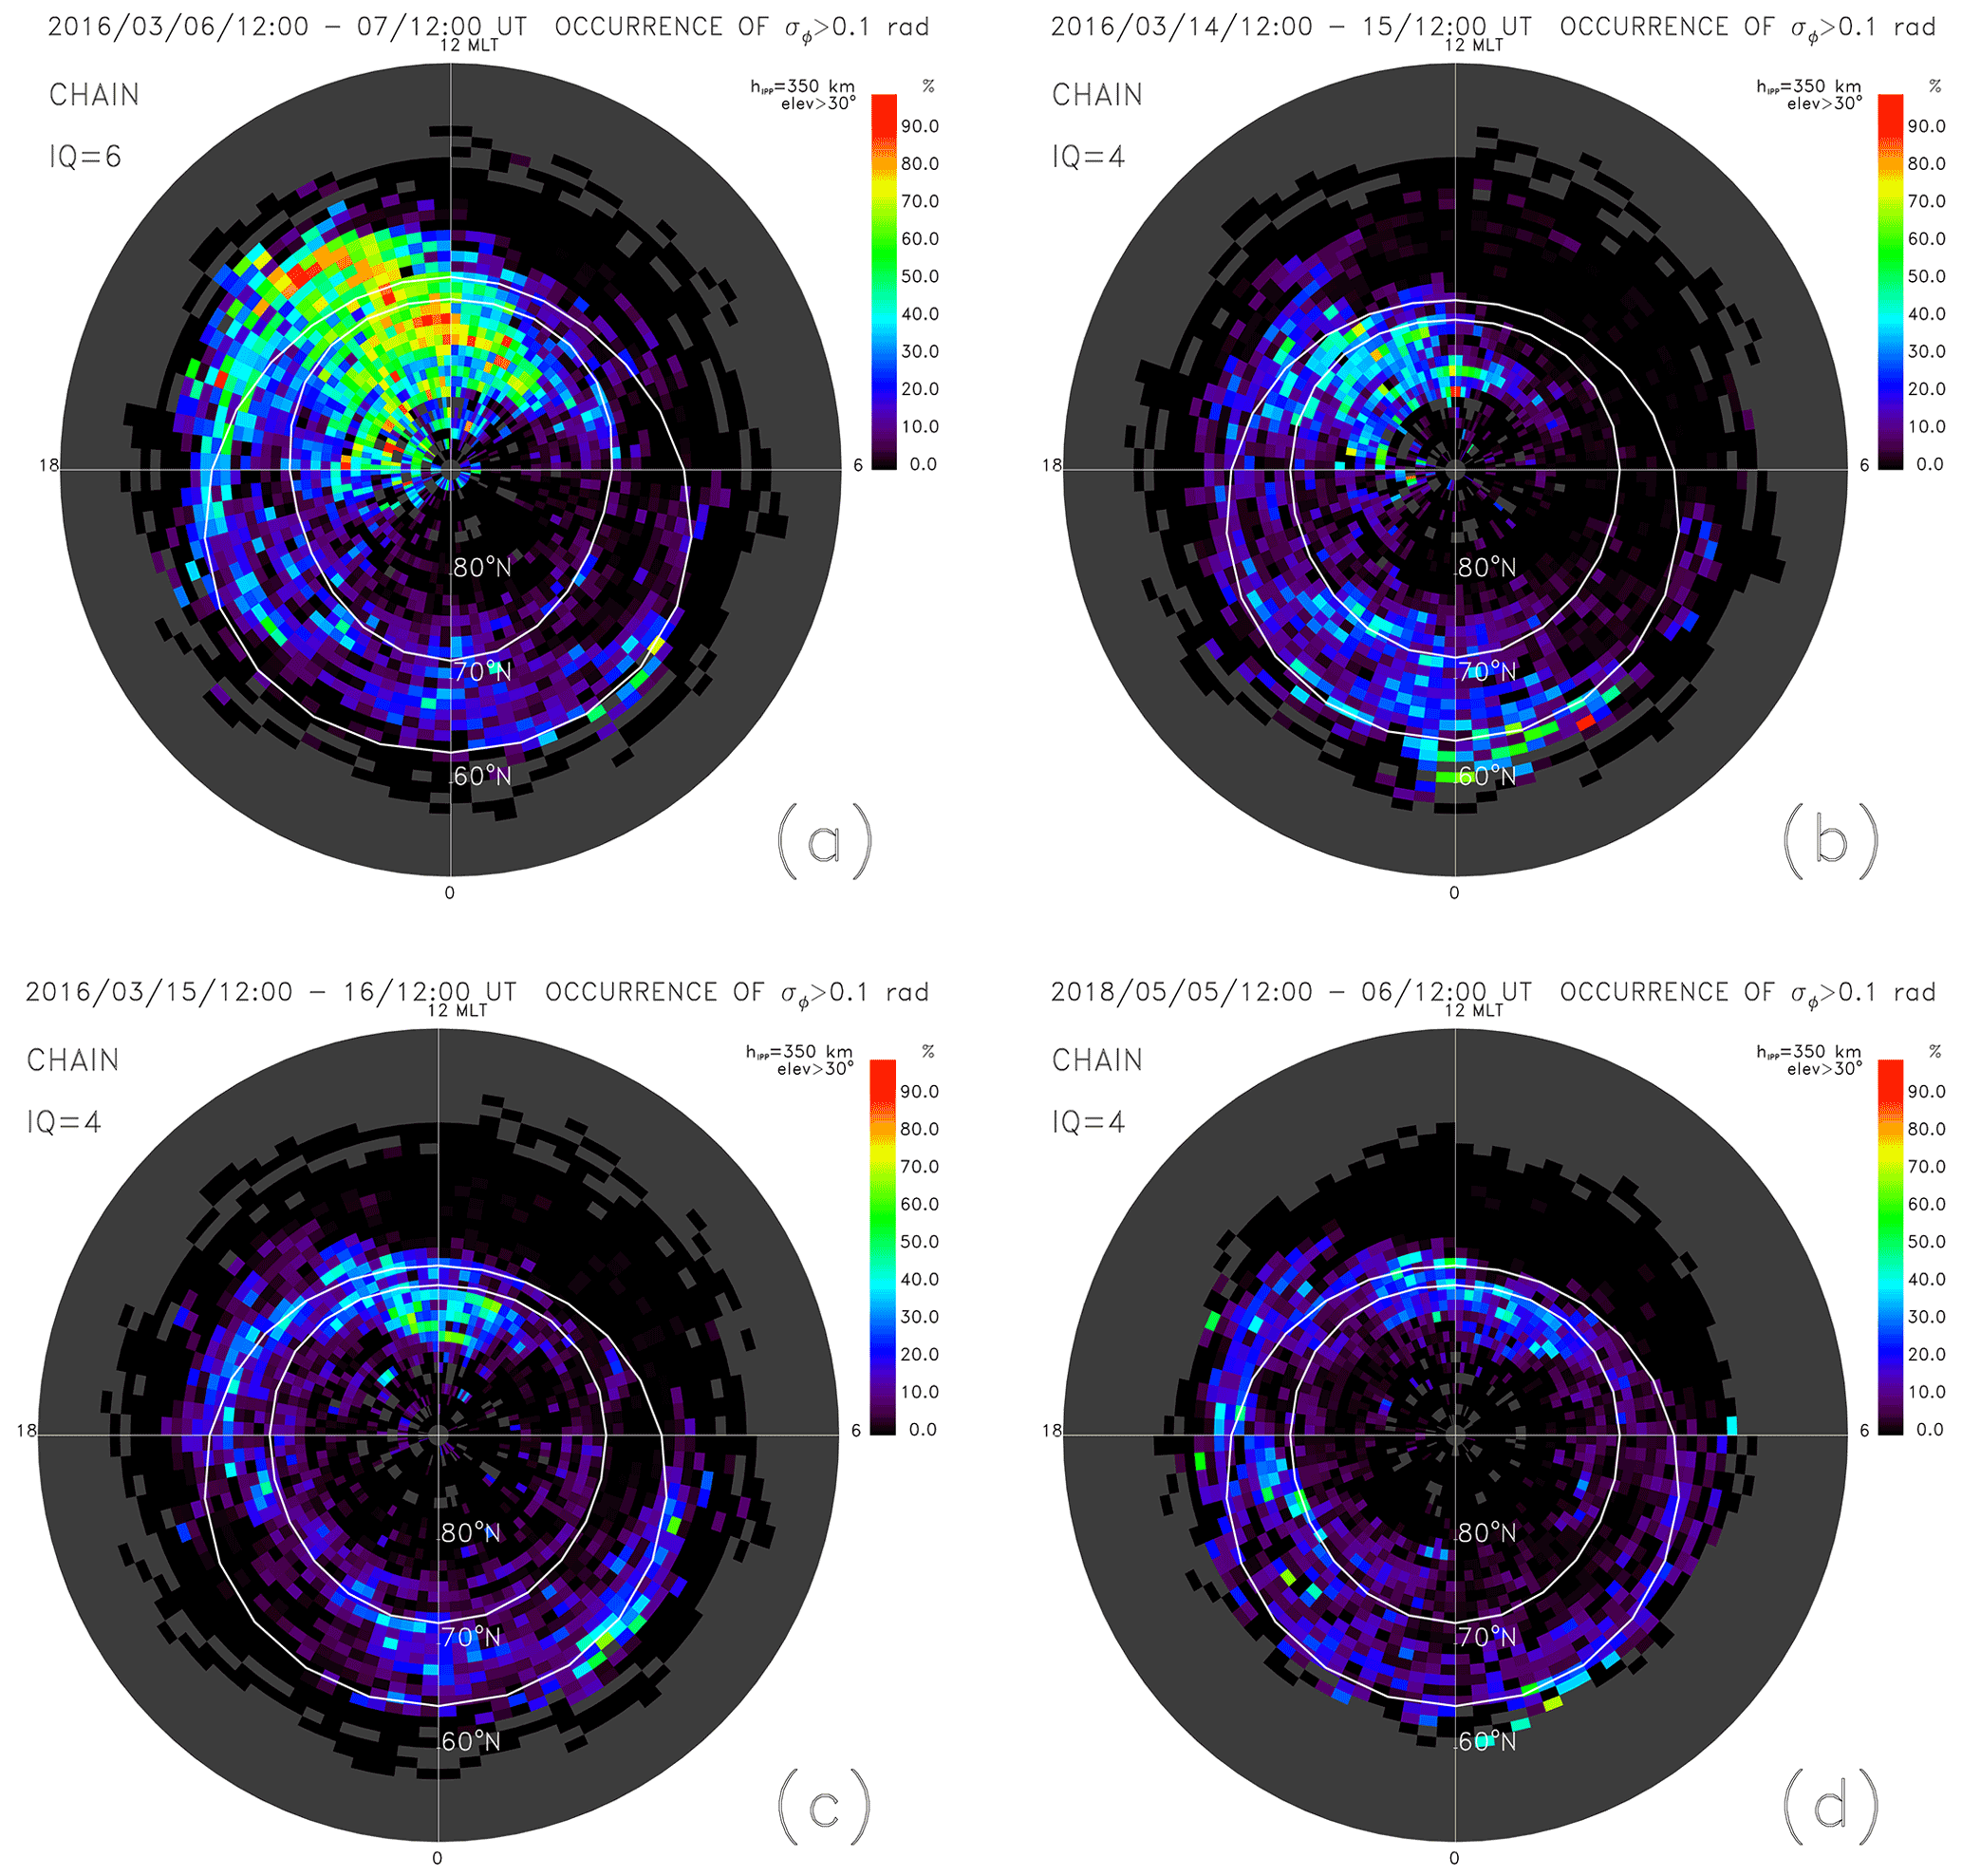
Figure 16The percentage occurrence of the GPS phase variation σΦ>0.1 rad mapped in coordinates of AACGM latitude and MLT during geomagnetic storms on (a) 6 March, (b) 14 March, (c) 15 March 2016, and (d) 5 May 2018. Boundaries of the statistical auroral oval are shown.
Figure 16a–d shows the percentage occurrence of phase variation, σΦ, above a given threshold as a function of the Altitude-Adjusted Corrected Geomagnetic (AACGM) latitude and magnetic local time (MLT). The percentage occurrence is determined for the grid bins of 0.25 h MLT × 1∘ AACGM latitude assuming the IPP height of 350 km (Prikryl et al., 2016). The moderate geomagnetic storm on 6 March 2016 (Fig. 16a) resulted in the highest occurrence of GPS phase variation caused by the fast convection of the storm enhanced density (SED) plasma irregularities from the dayside ionosphere through the cusp where the TOI was segmented into polar cap patches. In Fig. 4 discussed in Sect. 3.1.1, the CHAIN GPS IPPs are superposed on the ionospheric convection and GPS TEC maps as a function of magnetic latitude and MLT. The IPPs shown as circles scaled by the GPS phase-variation values, σΦ, are collocated with the TOI fragmented into patches.
In relation to the auroral electrojets, Fig. 17 shows the GPS phase-variation occurrence as a function of AAGCM latitude and universal time overlaid with contours of the east component of the EIC Jy current averaged over the longitude grids between 86 and 93∘ W with the EICs transformed to geomagnetic coordinates using the magnetic declination at each grid cell. To conform to the 15 min grid span used for the scintillation occurrence map, the west-to-east Jy current component is averaged over 15 min. Consistent with the previous results (Prikryl et al., 2016), the highest occurrence of GPS phase scintillation in the auroral zone is associated with the westward electrojet and the poleward edge of the eastward electrojet. At high latitudes, the highest occurrence of σΦ>0.1 rad is in the cusp and polar cap during times of dense polar cap patches observed by RISR (Fig. 2a).
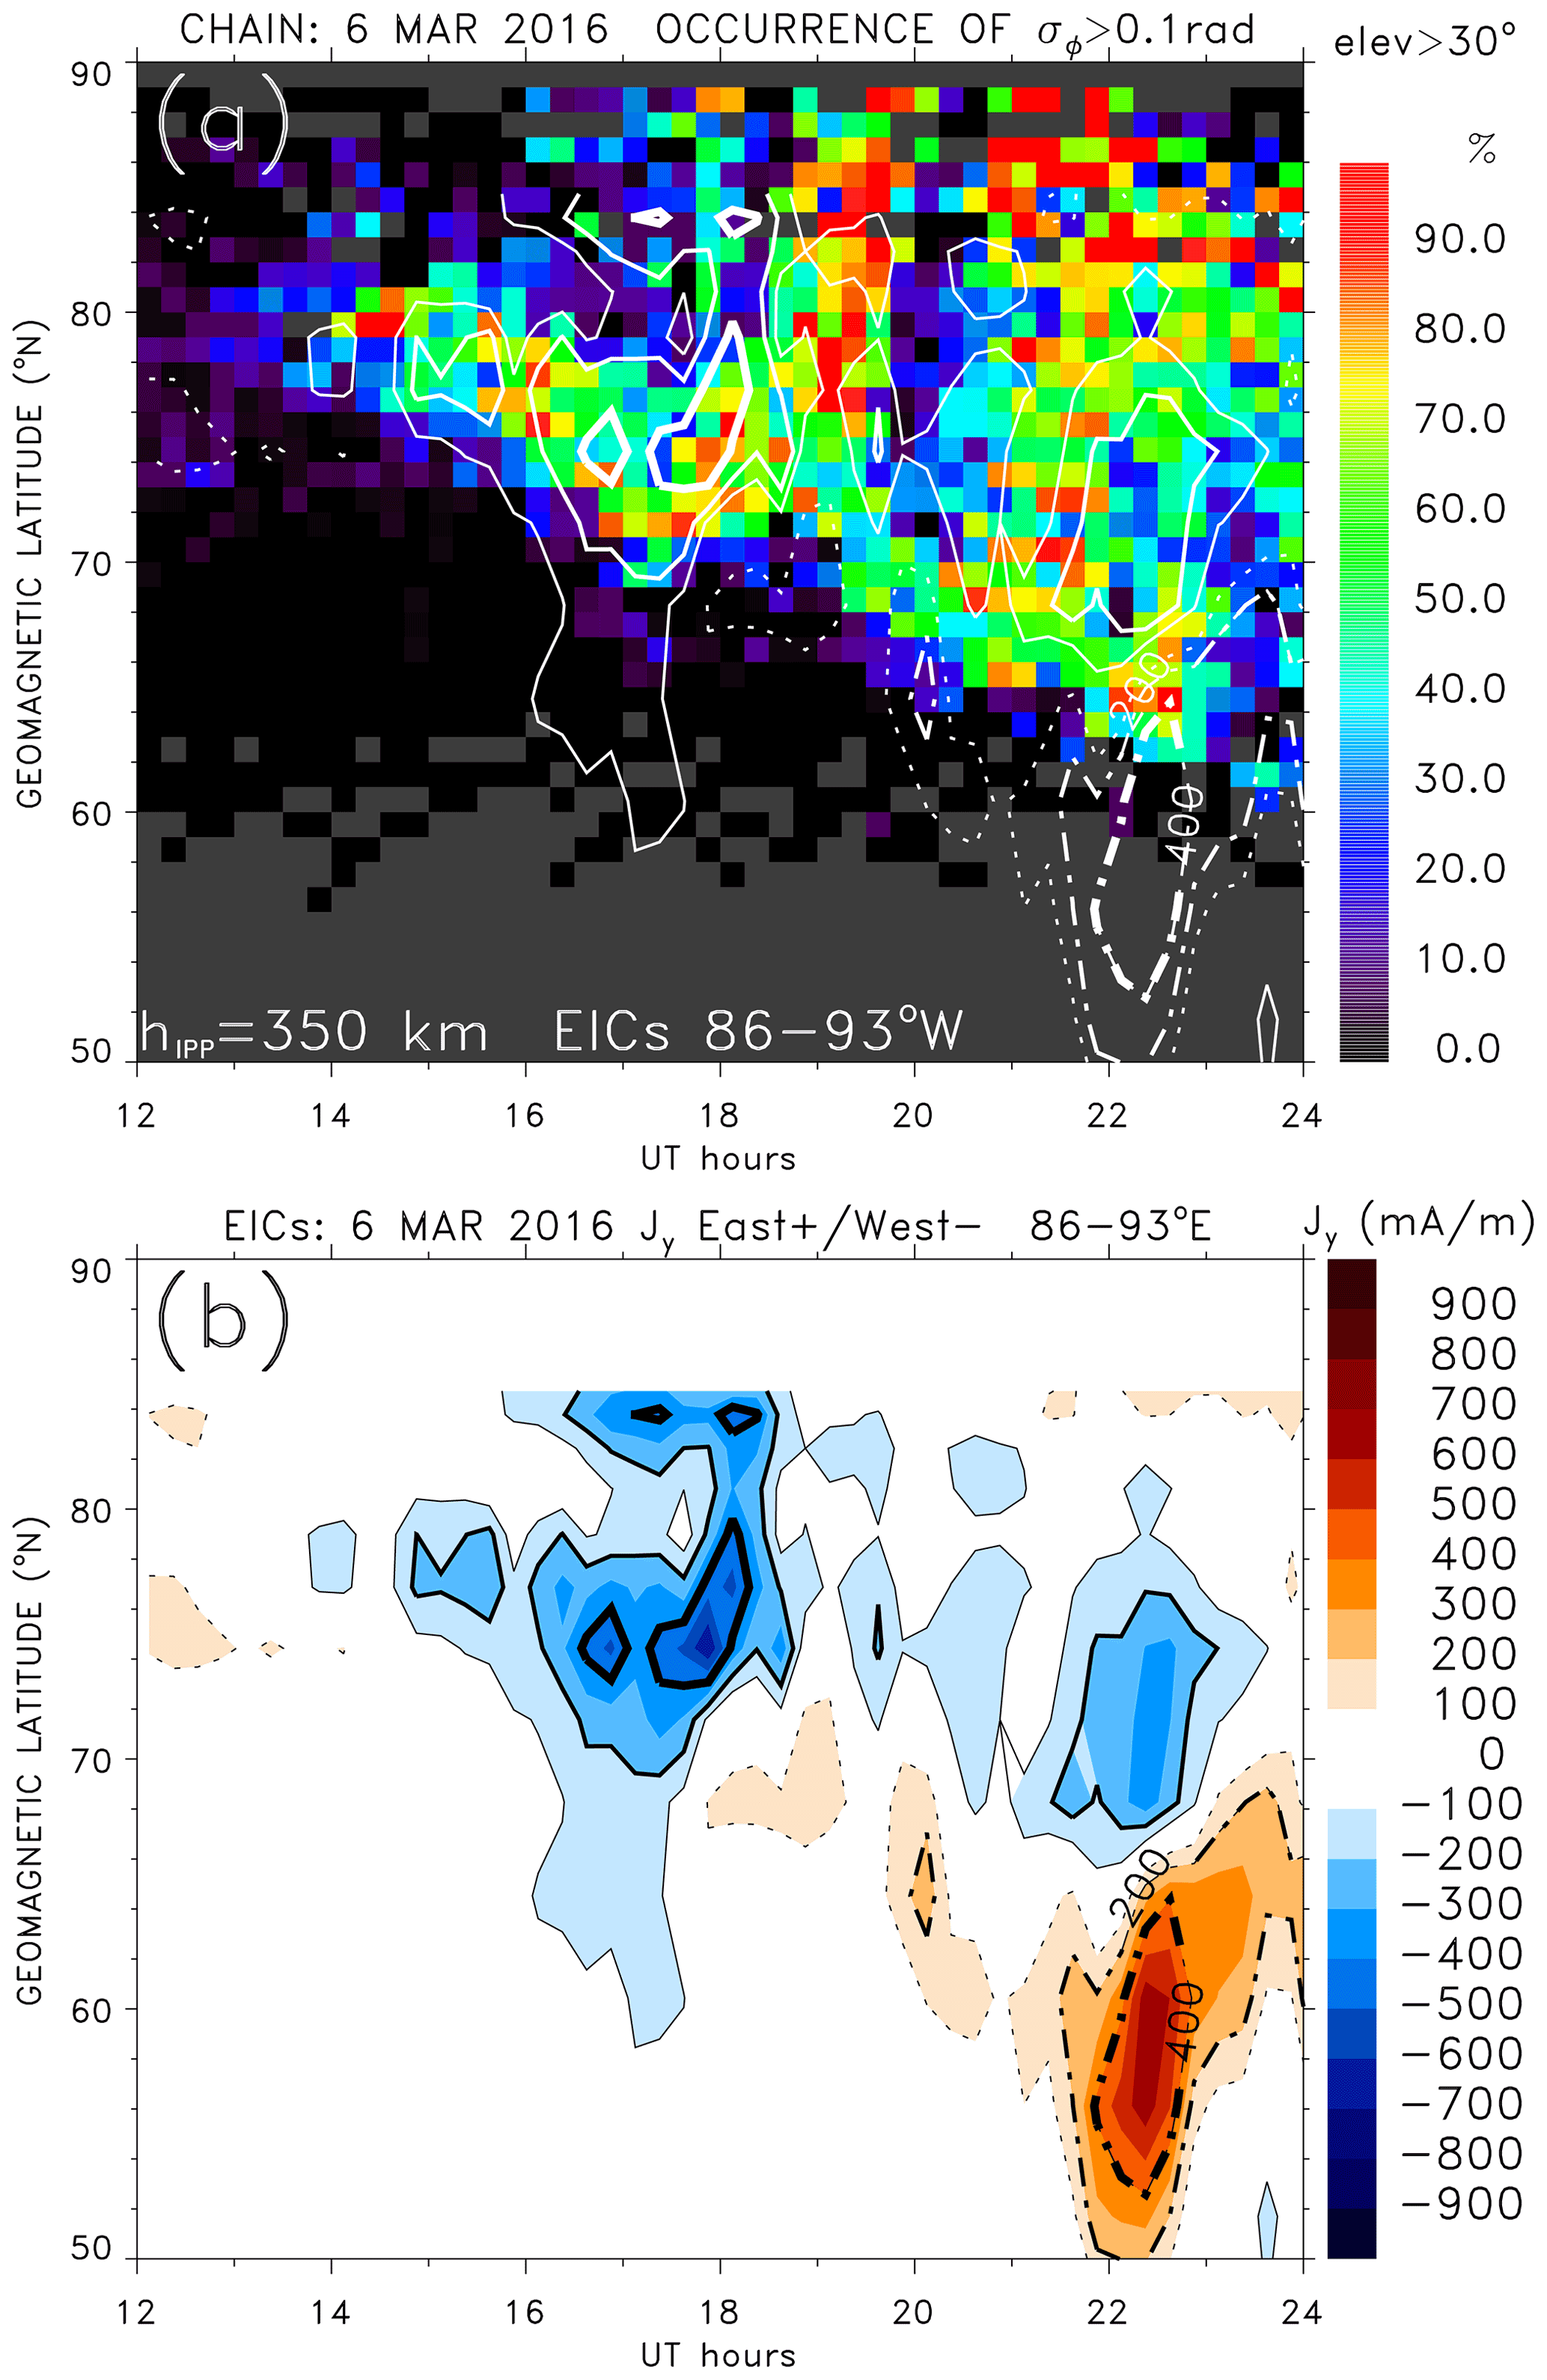
Figure 17Panel (a) shows the GPS phase-variation occurrence as a function of AAGCM latitude and universal time (UT) on 6 March 2016. Contours of the westward and eastward EICs are shown in white solid and broken lines, respectively. Panel (b) shows the westward and eastward EICs in blue and brown shades.
For specific times, the GPS IPPs of enhanced phase variation are shown in Figs. 3 and 11 as discussed in the previous sections. The IPPs are found to be collocated with the CRB and the westward electrojet (Fig. 3), and the poleward edge of the eastward electrojet (Fig. 11a). At high latitudes, even when fast azimuthal flows were observed by RISR, they were not collocated with above-threshold values of σΦ (Fig. 3a and b). It was only when dense polar cap patches convected over the RISR FoV that IPPs with moderate values of σΦ were collocated with the fast anti-sunward flows (Fig. 4).
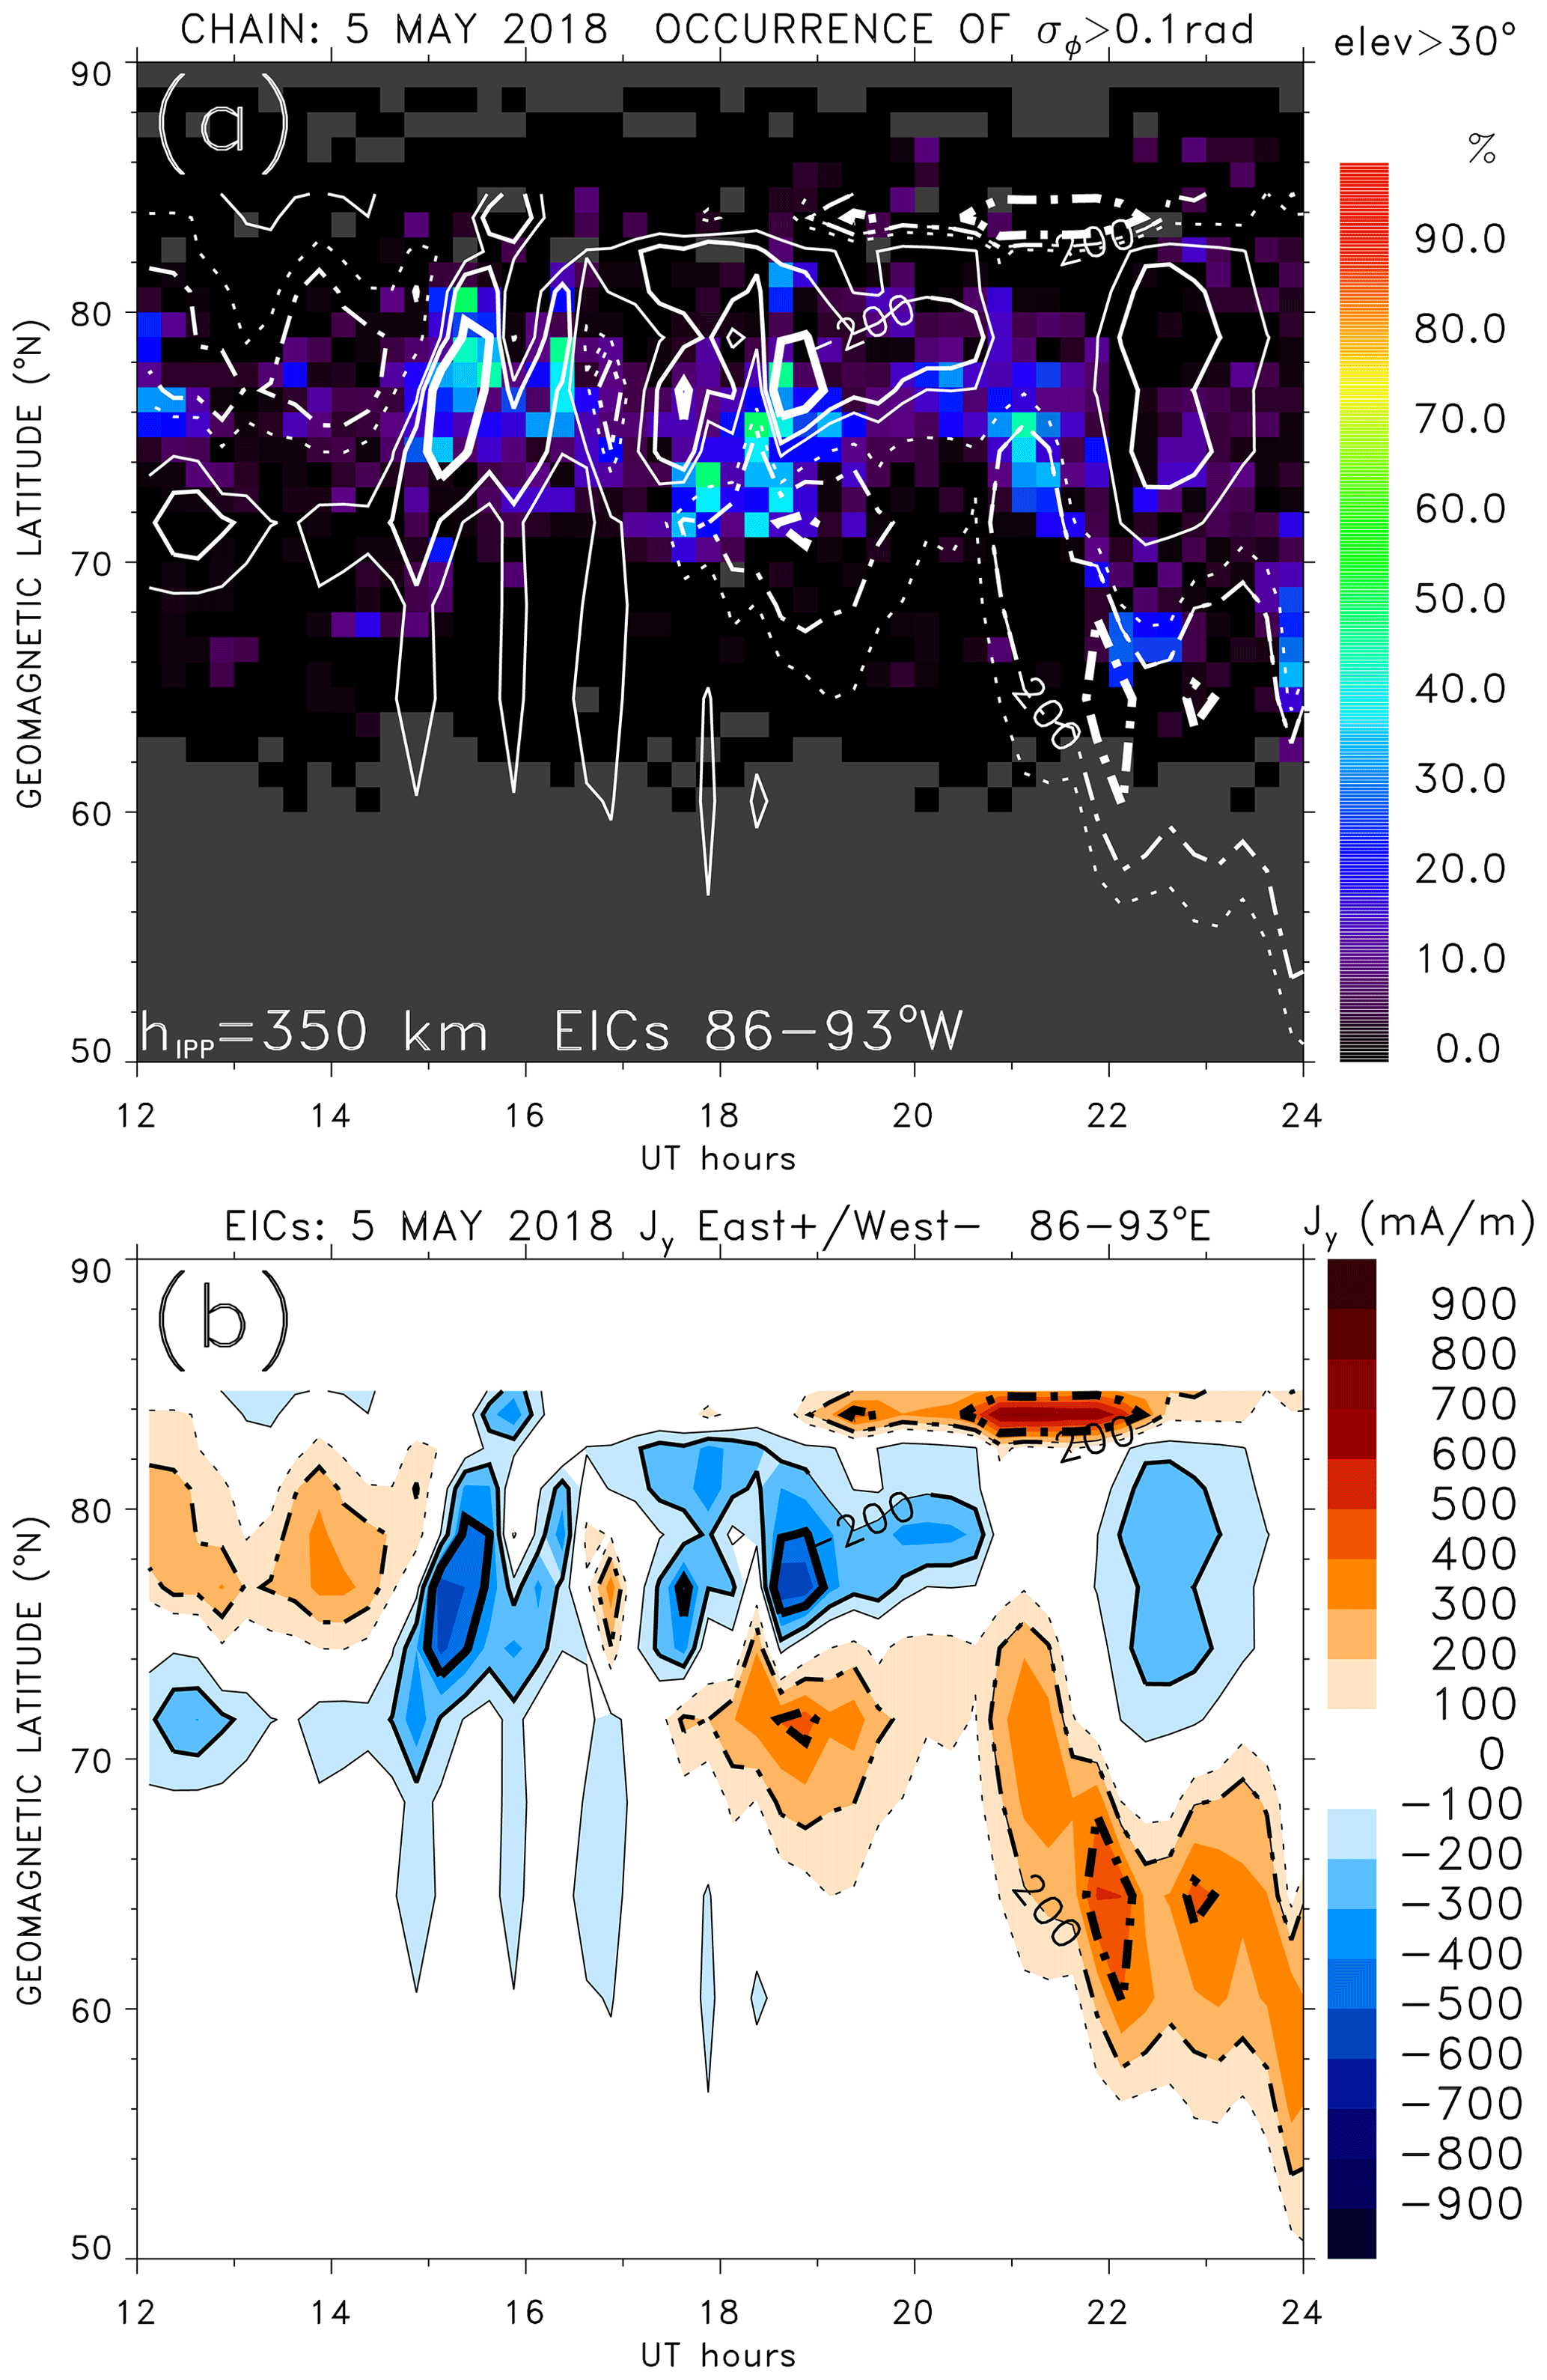
The minor geomagnetic storms caused significantly less GPS phase variation (Fig. 16c–d). Although large GPS phase variations were collocated with auroral electrojets (Figs. 5 and 14), and some were caused by polar cap patches on 14–15 March 2016, there was very little or no significant GPS phase variation associated with the weak polar cap patches in the polar cap on 5 May 2018 (Figs. 8, 16d and 18a). However, even during the latter event (Fig. 18a), the highest occurrence of GPS phase variation in the auroral zone was associated with the westward electrojet and boundaries between the westward and eastward electrojets. A similar association of the GPS phase-variation occurrence with the electrojets is found during the minor geomagnetic storm on 14–15 March 2016 (not shown). The highest occurrence was during the growth phase of the storm (Fig. 16b) when the GPS phase variation was observed mainly in the cusp and polar cap, but also in the post-noon auroral zone (dusk convection cell and SED), nightside auroral zone, and possibly a subauroral polarization stream (Prikryl et al., 2016).
The presented multi-instrument observations of polar cap patches in the Canadian Arctic are consistent with previously published results (e.g., Provan et al., 1998) that support the accepted model of polar patch formation (Cowley and Lockwood, 1992). Transient azimuthal flows in the cusp that resulted in the formation of polar cap patches were associated with the IMF By fluctuations due to solar wind Alfvén waves. Pulsed ionospheric flows modulated by solar wind Alfvén waves and followed by polar cap patches were previously observed (Prikryl et al., 1999, 2002).
The large-amplitude solar wind Alfvén waves in the CIRs at the leading edge of HSSs also modulated the ionospheric currents that were estimated from the ground-based magnetometer data using an inversion technique. The ionospheric currents have been recognized as sources of AGWs causing TIDs. Of course, AGWs/TIDs can be generated by various other sources, including tropospheric weather systems (Bertin et al., 1975, 1978; Waldock and Jones, 1987; Oliver et al., 1997; Nishioka et al., 2013), polar vortex (Frissell et al., 2016), volcanic eruptions, earthquakes, and tsunamis (e.g., Nishitani et al., 2019; Themens et al., 2022), as well as phenomena associated with ion-neutral interactions (Nishitani et al., 2019). However, the case studies of equatorward-propagating TIDs observed by SuperDARN and GNSS receivers presented in this paper clearly point to dayside ionospheric currents modulated by solar wind Alfvén waves. This is consistent with the previously published results (Prikryl et al., 2005).
Milan et al. (2017; see, their Fig. 2) reviewed the morphology and dynamics of the electrical current systems of the terrestrial magnetosphere and ionosphere that include DP1, DP2, and DPY currents. The patch formation has been associated with the By-modulated DPY currents (Hall currents associated with FCEs) (Friis-Christensen and Wilhjelm, 1975; Clauer et al., 1995; Stauning et al., 1994, 1995; Prikryl et al., 1999). In the high-conductance auroral zone, Hall currents form the eastward and westward auroral electrojets, and the corresponding magnetic perturbations on the ground associated with these Hall currents are known as the DP1 and DP2 patterns. However, this paper is concerned with the dayside currents, so the TIDs were caused primarily by the DP2 current intensifications.
Finally, it is noted that solar wind coupling to the dayside magnetosphere–ionosphere–atmosphere generating globally propagating gravity waves has been proposed to play a role in the occurrence of extreme weather (Prikryl et al., 2018, 2019, 2021b).
Production of polar cap density patches and traveling ionospheric disturbances during minor to moderate geomagnetic storms caused by corotating interaction regions at the leading edge of high-speed streams is studied using incoherent scatter radars and networks of high-frequency radars, ionosondes and magnetometers, and GPS receivers. Solar wind Alfvén waves modulated the magnetic reconnection at the dayside magnetopause. The ionospheric signatures of flux transfer events that resulted in formation of polar cap patches were observed in the cusp. The coupling process also modulated the ionospheric convection and the intensity of ionospheric currents, including the auroral electrojets. The horizontal equivalent ionospheric currents were estimated from the ground-based magnetometer data using an inversion technique. Intensifications of ionospheric currents launched atmospheric gravity waves causing traveling ionospheric disturbances that were observed in the high-frequency ground scatter and detected in the detrended GPS-derived vertical total electron content maps. The GPS phase scintillation index obtained by specialized GPS scintillation receivers was highest during the moderate geomagnetic storm. The GPS phase variation was caused by intense convection of storm-enhanced density plasma through the cusp into a dense tongue of ionization segmented into patches. In the auroral zone, the highest occurrence of GPS phase variation was collocated with the westward electrojet and boundaries between the westward and eastward electrojets.
The solar wind data can be obtained from the NSSDC OMNIWeb http://omniweb.gsfc.nasa.gov (NASA, 2022). The ground-based magnetometer data can be accessed from the Geophysical Institute Magnetometer Array (GIMA) (https://www.gi.alaska.edu/monitors/magnetometer/archive, University of Alaska Fairbanks, 2022), the Geomagnetic Laboratory of the Natural Resources Canada (NRCan) (https://www.spaceweather.ca, last access: 25 September 2022), and the Canadian Array for Realtime Investigations of Magnetic Activity (CARISMA) (https://www.carisma.ca/, University of Alberta, 2022), SuperMAG (https://supermag.jhuapl.edu/mag/, Gjerloev, 2012) and INTERMAGNET (https://www.intermagnet.org, British Geological Survey, 2022). RISR-C data are available at http://data.phys.ucalgary.ca/ (University of Calgary, 2022a) and https://madrigal.phys.ucalgary.ca/ (University of Calgary, 2022b). The Resolute Bay Incoherent Scatter Radar (RISR-N) is operated by SRI International on behalf of the US National Science Foundation under NSF Cooperative Agreement AGS-1133009. RISR-N data are available at http://amisr.com/database/ (SRI International, 2022). SuperDARN data are available at https://www.frdr-dfdr.ca/repo/collection/superdarn (FRDR, 2022). Line-of-Sight TEC data were acquired from the Madrigal database http://cedar.openmadrigal.org/ (CEDAR, 2022). CHAIN GNSS data are available at http://chain.physics.unb.ca/chain/pages/data_download (CHAIN, 2022). Equivalent Ionospheric Currents (EICs) derived using the Spherical Elementary Currents Systems (SECS) technique are available through http://vmo.igpp.ucla.edu/data1/SECS/ (SECS, 2022) and https://cdaweb.gsfc.nasa.gov/pub/data/aaa_special-purpose-datasets/spherical-elementary-and-equivalent-ionospheric-currents-weygand/ (last access: 25 September 2022; https://doi.org/10.21978/P8D62B, Weygand, 2009a; https://doi.org/10.21978/P8PP8X, Weygand, 2009b).
PP conceptualized the project, led the formal analysis and investigation, developed the methodology, administered the project, acquired the resources, developed the software, supervised, validated, and visualized the project, wrote the original draft, and reviewed and edited the paper. RGG acquired the resources and developed the software to process and validate the RISR data. DRT acquired the resources, developed the software for detrending GNSS TEC data, processed the CHAIN and GNSS data, and reviewed and edited the paper. JMW developed and applied the spherical elementary current system (SECS) inversion technique to derive equivalent ionospheric currents. SC contributed to the effort of detrending the GNSS TEC data and accessed the Madrigal data. EGT acquired the resources, developed the software, processed, validated, and visualized SuperDARN data along with GNSS TEC mapping, and reviewed and edited the paper.
The contact author has declared that none of the authors has any competing interests.
Publisher’s note: Copernicus Publications remains neutral with regard to jurisdictional claims in published maps and institutional affiliations.
Infrastructure funding for CHAIN was provided by the Canada Foundation for Innovation and the New Brunswick Innovation Foundation. CHAIN operation is conducted in collaboration with the Canadian Space Agency (CSA). Contributions by the ACE (Norman F. Nees at Bartol Research Institute, David J. McComas at SWRI), Geotail (Susumu Kokubun at STELAB Nagoya University), Wind spacecraft teams, NASA's SPDF/CDAWeb, and the NSSDC OMNIWeb are acknowledged. RISR-C is funded by the Canada Foundation for Innovation and led by the University of Calgary, University of Saskatchewan, Athabasca University, and SRI International. The authors acknowledge the use of SuperDARN data. SuperDARN is a collection of radars funded by the national scientific funding agencies of Australia, Canada, China, France, Italy, Japan, Norway, South Africa, United Kingdom, and the United States of America. The Christmas Valley SuperDARN radars are maintained and operated by Dartmouth College under support by NSF grant AGS-1934997. Operations of the Goose Bay, Kapuskasing, and Blackstone SuperDARN radars are supported by the National Science Foundation under award AGS-1935110. The operation of the Saskatoon radar is supported by the Canada Foundation for Innovation, the Canadian Space Agency, and the Province of Saskatchewan. We thank the many different groups operating magnetometer arrays for providing data for this study, including the THEMIS UCLA magnetometer network (Ground-based Imager and Magnetometer Network for Auroral Studies). The AUTUMNX magnetometer network is funded through the Canadian Space Agency/Geospace Observatory (GO) Canada program, Athabasca University, Centre for Science/Faculty of Science and Technology. The Magnetometer Array for Cusp and Cleft Studies (MACCS) array is supported by the US National Science Foundation grant ATM-0827903 to Augsburg College. The Solar and Terrestrial Physics (STEP) magnetometer file storage is at the Department of Earth and Planetary Physics, University of Tokyo and maintained by Kanji Hayashi (hayashi@grl.s.u-tokyo.ac.jp). The McMAC Project is sponsored by the Magnetospheric Physics Program of National Science Foundation through grant AGS-0245139. The ground magnetic stations are operated by the Technical University of Denmark, National Space Institute (DTU Space). The Canadian Space Science Data Portal is funded in part by the Canadian Space Agency contract numbers 9 F007-071429 and 9 F007-070993. The Canadian Magnetic Observatory Network (CANMON) is maintained and operated by the Geological Survey of Canada. David R. Themens's contribution to this work is supported in part through CSA grant no. 21SUSTCHAI and through the United Kingdom Natural Environment Research Council (NERC) EISCAT3D: Fine-scale structuring, scintillation, and electrodynamics (FINESSE) (NE/W003147/1) and DRivers and Impacts of Ionospheric Variability with EISCAT-3D (DRIIVE) (NE/W003368/1) projects. James M. Weygand acknowledges NASA grant: 80NSSC18K0570, 80NSSC18K1220, NASA contract: 80GSFC17C0018 (HPDE), NAS5-02099(THEMIS). Shibaji Chakraborty thanks the National Science Foundation for support under grant AGS-1935110.
This paper was edited by Dalia Buresova and reviewed by two anonymous referees.
Afraimovich, E. L., Kosogorov, E. A., Leonovich, L. A., Palamartchouk, K. S., Perevalova, N. P., and Pirog, O. M.: Determining parameters of large-scale traveling ionospheric disturbances of auroral origin using GPS-arrays, J. Atmos. Sol.-Terr. Phy., 62, 553–565, https://doi.org/10.1016/S1364-6826(00)00011-0, 2000.
Amm, O. and Viljanen, A.: Ionospheric disturbance magnetic field continuation from the ground to the ionosphere using spherical elementary currents systems, Earth Planet. Space, 51, 431–440, https://doi.org/10.1186/BF03352247, 1999.
Belcher, J. W. and Davis Jr., L.: Large-amplitude Alfvén waves in the interplanetary medium, 2, J. Geophys. Res., 76, 3534–3563, https://doi.org/10.1029/JA076i016p03534, 1971.
Bertin, F., Testud, J., and Kersley, L.: Medium-scale gravity waves in the ionospheric F-region and their possible origin in weather disturbances, Planet. Space Sci., 23, 493–507, https://doi.org/10.1016/0032-0633(75)90120-8, 1975.
Bertin, F., Testud, J., Kersley, L., and Rees, P. R.: The meteorological jet stream as a source of medium scale gravity waves in the thermosphere: an experimental study, J. Atmos. Terr. Phys., 40, 1161–1183, https://doi.org/10.1016/0021-9169(78)90067-3, 1978.
British Geological Survey: INTERMAGNET, https://www.intermagnet.org, last access: 25 September 2022.
Bristow, W. A. and Greenwald, R. A.: Multiradar observations of medium-scale acoustic gravity waves using the Super Dual Auroral Radar Network, J. Geophys. Res., 101, 24499–24511, https://doi.org/10.1029/96JA01494, 1996.
Bristow, W. A., Greenwald, R. A., and Samson, J. C.: Identification of high-latitude acoustic gravity wave sources using the Goose Bay HF radar, J. Geophys. Res., 99, 319–331, https://doi.org/10.1029/93JA01470, 1994.
CEDAR: Madrigal Database, http://cedar.openmadrigal.org/, last access: 25 September 2022.
CHAIN: GNSS data, http://chain.physics.unb.ca/chain/pages/data_download, last access: 25 September 2022.
Cherniak, I. and Zakharenkova, I.: Large-scale traveling ionospheric disturbances origin and propagation: Case study of the December 2015 geomagnetic storm, Space Weather, 16, 1377–1395, https://doi.org/10.1029/2018SW001869, 2018.
Chimonas, G. and Hines, C. O.: Atmospheric gravity waves launched by auroral currents, Planet. Space Sci., 18, 565–582, https://doi.org/10.1016/0032-0633(70)90132-7, 1970.
Chisham, G., Lester, M., Milan, S. E., Freeman, M. P., Bristow, W. A., Grocott, A., McWilliams, K. A., Ruohoniemi, J. M., Yeoman, T. K., Dyson, P. L., Greenwald, R. A., Kikuchi, T., Pinnock, M., Rash, J. P. S., Sato, N., Sofko, G. J., Villain, J.-P., and Walker, A. D. M.: A decade of the super dual auroral radar network (SuperDARN): scientific achievements, new techniques and future directions, Surv. Geophys., 28, 33–109, https://doi.org/10.1007/s10712-007-9017-8, 2007.
Clauer, C. R., Stauning, P., Rosenberg, T. J., Friis-Christensen, E., Miller, P. M., and Sitar, R. J.: Observations of a solar-wind-driven modulations of the dayside ionospheric DPY current system, J. Geophys. Res., 100, 7697–7713, https://doi.org/10.1029/94JA01193, 1995.
Cowley, S. W. H. and Lockwood, M.: Excitation and decay of solar wind driven flows in the magnetosphere-ionosphere system, Ann. Geophys., 10, 103–115, 1992.
Cowley, S. W. H., van Eyken, A. P., Thomas, E. C., Williams, P. J. S., and Wlllis, D. M.: Studies of the cusp and auroral zone with incoherent scatter radar: the scientific and technical case for a polar-cap radar, J. Atmos. Sol.-Terr. Phy., 52, 645–663, https://doi.org/10.1016/0021-9169(90)90059-V, 1990.
Crooker, N. U.: Reverse convection, J. Geophys. Res., 97, 19363–19372, https://doi.org/10.1029/92JA01532, 1992.
Crowley, G. and McCrea, I. W.: A synoptic study of TIDs observed in the UK during the first WAGS campaign, October 10–18, 1985, Radio Sci., 23, 905–917, https://doi.org/10.1029/RS023i006p00905, 1988.
Crowley, G. and Williams, P. J. S.: Observations of the source and propagation of atmospheric gravity waves, Nature, 328, 231–233, https://doi.org/10.1038/328231a0, 1987.
Dungey, J. W.: Interplanetary Magnetic Field and the Auroral Zones, Phys. Rev. Lett., 6, 47–48, https://doi.org/10.1103/PhysRevLett.6.47, 1961.
Dungey, J. W.: Origin of the concept of reconnection and its application to the magnetopause: A historical view, Physics of the Magnetopause, Geophys. Monogr. Ser., Vol. 90, edited by: Song, P., Sonnerup, B. U. O., and Thomsen, M. F., 17–19, AGU, Washington, D.C., 1995.
FRDR: SuperDARN, https://www.frdr-dfdr.ca/repo/collection/superdarn, last access: 25 September 2022.
Francis, S. H.: Global propagation of atmospheric gravity waves: A review, J. Atmos. Terr. Phys., 37, 1011–1054, https://doi.org/10.1016/0021-9169(75)90012-4, 1975.
Friis-Christensen, E. and Wilhjelm, J.: Polar cap currents for different directions of the interplanetary magnetic field in the Y-Z plane, J. Geophys. Res., 80, 1248–1260, https://doi.org/10.1029/JA080i010p01248, 1975.
Frissell, N. A., Baker, J. B. H., Ruohoniemi, J. M., Gerrard, A. J., Miller, E. S., Marini, J. P., West, M. L., and Bristow, W. A.: Climatology of medium-scale traveling ionospheric disturbances observed by the midlatitude Blackstone SuperDARN radar, J. Geophys. Res.-Space, 119, 7679–7697, https://doi.org/10.1002/2014JA019870, 2014.
Frissell, N. A., Baker, J. B. H., Ruohoniemi, J. M., Greenwald, R. A., Gerrard, A. J., Miller, E. S., and West, M. L.: Sources and characteristics of medium-scale traveling ionospheric disturbances observed by high-frequency radars in the North American sector, J. Geophys. Res.-Space, 121, 3722–3739, https://doi.org/10.1002/2015JA022168, 2016.
Gillies, R. G., van Eyken, A., Spanswick, E., Nicolls, M., Kelly, J., Greffen, M., Knudsen, D., Connors, M., Schutzer, M., Valentic, T., and Malone, M.: First observations from the RISR-C incoherent scatter radar, Radio Sci., 51, 1645–1659, https://doi.org/10.1002/2016RS006062, 2016.
Gillies, R. G., Perry, G. W., Koustov, A. V., Varney, R. H., Reimer, A. S., Spanswick, E., St.-Maurice, J.-P., and Donovan, E.: Large-scale comparison of polar cap ionospheric velocities measured by RISR-C, RISR-N, and SuperDARN, Radio Sci., 53, 624–639, https://doi.org/10.1029/2017RS006435, 2018.
Gjerloev, J. W.: The SuperMAG data processing technique, J. Geophys. Res., 117, A09213, https://doi.org/10.1029/2012JA017683, 2012 (data available at: https://supermag.jhuapl.edu/mag/, last access: 25 September 2022).
Goertz, C. K., Nielsen, E., Korth, A., Glassmeier, K.-H., Haldoupis, C., Hoeg, P., and Hayward, D.: Observations of a possible signature of flux transfer events, J. Geophys. Res., 90, 4069–4078, https://doi.org/10.1029/JA090iA05p04069, 1985.
Gonzalez, W. D., Joselyn, J. A., Kamide, Y., Kroehl, H. W., Rostoker, G., Tsurutani, B. T., and Vasyliunas, V. M.: What is a Geomagnetic Storm?, J. Geophys. Res., 99, 5771–5792, https://doi.org/10.1029/93JA02867, 1994.
Gosling, J. T., Thomsen, M. F., Bame, S. J., Elphic, R. C., and Russell, C. T.: Plasma flow reversals at the dayside magnetopause and the origin of the asymmetric polar cap convection, J. Geophys. Res., 95, 8073, https://doi.org/10.1029/JA095iA06p08073, 1990.
Guarnieri, F. L.: The Nature of Auroras During High-Intensity Long-Duration Continuous AE Activity (HILDCAA) Events: 1998 to 2001, in: Recurrent Magnetic Storms: Corotating Solar Wind Streams, edited by: Tsurutani, B. T., McPherron, R. L., Gonzalez, W. D., Lu, G., Sobral, J. H. A., and Gopalswamy, N., Amer. Geophys. U. Monograph, Wash. D.C., 167, 235–243, https://doi.org/10.1029/167GM19, 2006.
Hayashi, H., Nishitani, N., Ogawa, T., Otsuka, Y., Tsugawa, T., Hosokawa, K., and Saito, A.: Large-scale traveling ionospheric disturbance observed by superDARN Hokkaido HF radar and GPS networks on 15 December 2006, J. Geophys. Res., 115, A06309, https://doi.org/10.1029/2009JA014297, 2010.
Hunsucker, R. D.: Atmospheric gravity waves generated in the highlatitude ionosphere: a review, Rev. Geophys. Space Ge., 20, 293–315, https://doi.org/10.1029/RG020i002p00293, 1982.
King, J. H. and Papitashvili, N. E.: Solar wind spatial scales in and comparisons of hourly Wind and ACE plasma and magnetic field data, J. Geophys. Res.-Space, 110, A02104, https://doi.org/10.1029/2004JA010649, 2005.
Kokubun, S., Yamamoto, T., Acuna, M. H., Hayashi, K., Shiokawa, K., and Kawano, H.: The GEOTAIL magnetic field experiment, J. Geomagn. Geoelectr., 46, 7–21, 1994.
Lu, G., Li, W. H., Raeder, J., Deng, Y., Rich, F., Ober, D., Zhang, Y. L., Paxton L., Ruohoniemi, J. M., Hairston, M., and Newell, P.: Reversed two-cell convection in the Northern and Southern hemispheres during northward interplanetary magnetic field, J. Geophys. Res., 116, A12237, https://doi.org/10.1029/2011JA017043, 2011.
Mayr, H. G., Harris, I., Varosi, F., and Herrero, F. A.: Global excitation of wave phenomena in a dissipative multiconstituent medium 1. Transfer function of the Earth's thermosphere, J. Geophys. Res., 89, 10929–10959, https://doi.org/10.1029/JA089iA12p10929, 1984a.
Mayr, H. G., Harris, I., Varosi, F., and Herrero, F. A.: Global excitation of wave phenomena in a dissipative multiconstituent medium 2. Impulsive perturbations in the Earth's thermosphere, J. Geophys. Res., 89, 10961–10986, https://doi.org/10.1029/JA089iA12p10961, 1984b.
Mayr, H. G., Harris, I., Herrero, F. A., Spencer, N. W., Varosi, F., and Pesnell, W. D.: Thermospheric gravity waves: Observations and interpretation using the transfer function model, Space Sci. Rev., 54, 297–375, https://doi.org/10.1007/BF00177800, 1990.
Mayr, H. G., Talaat, E. R., and Wolven, B. C.: Global propagation of gravity waves generated with the whole atmosphere transfer function model, J. Atmos. Sol.-Terr. Phy., 104, 7–17, https://doi.org/10.1016/j.jastp.2013.08.001, 2013.
McWilliams, K. A., Yeoman, T. K., and Provan, G.: A statistical survey of dayside pulsed ionospheric flows as seen by the CUTLASS Finland HF radar, Ann. Geophys., 18, 445–453, https://doi.org/10.1007/s00585-000-0445-8, 2000.
Milan, S. E., Clausen, L. B. N., Coxon, J. C., Carter, J. A., Walach, M.-T., Laundal, K., Østgaard, N., Tenfjord, P., Reistad, J., Snekvik, K., Korth, H., and Anderson, B. J.: Overview of Solar Wind–Magnetosphere–Ionosphere–Atmosphere Coupling and the Generation of Magnetospheric Currents, Space Sci. Rev., 206, 547–573, https://doi.org/10.1007/s11214-017-0333-0, 2017.
NASA: OMNIWeb, http://omniweb.gsfc.nasa.gov, last access: 25 September 2022.
Nishioka, M., Tsugawa, T., Kubota, M., and Ishii, M.: Concentric waves and short-period oscillations observed in the ionosphere after the 2013 Moore EF5 tornado, Geophys. Res. Lett., 40, 5581–5586, https://doi.org/10.1002/2013GL057963, 2013.
Nishitani, N., Ruohoniemi, J.M., Lester, M., Baker, J. B. H., Koustov, A. V., Shepherd, S. G., Chisham, G., Hori, T., Thomas, E. G., Makarevich, R. A., Marchaudon, A., Ponomarenko, P., Wild, J. A., Milan, S. E., Bristow, W. A., Devlin, Miller, J. E., Greenwald, R. A., Ogawa, T., and Kikuchi, T.: Review of the accomplishments of mid-latitude Super Dual Auroral Radar Network (SuperDARN) HF radars, Prog. Earth Planet. Sc., 6, 1–52, https://doi.org/10.1186/s40645-019-0270-5, 2019.
Oksavik, K., Ruohoniemi, J. M., Greenwald, R. A., Baker, J. B. H., Moen, J., Carlson, H. C., Yeoman, T. K., and Lester, M.: Observations of isolated polar cap patches by the European Incoherent Scatter (EISCAT) Svalbard and Super Dual Auroral Radar Network (SuperDARN) Finland radars, J. Geophys. Res., 111, A05310, https://doi.org/10.1029/2005JA011400, 2006.
Oliver, W. L., Otsuka, Y., Sato, M., Takami, T., and Fukao, S.: A climatology of F region gravity waves propagation over the middle and upper atmosphere radar, J. Geophys. Res., 102, 14449–14512, https://doi.org/10.1029/97JA00491, 1997.
Pinnock, M., Rodger, A. S., Dudeney, J. R., Baker, K. B., Newell, P. T., Greenwald, R. A., and Greenspan, M. E.: Observations of an enhanced convection channel in the cusp ionosphere, J. Geophys. Res., 98, 3767–3776, https://doi.org/10.1029/92JA01382, 1993.
Pinnock, M., Rodger, A. S., Dudeney, J. R., Rich, F., and Baker, K. B.: High spatial and temporal resolution observations of the ionospheric cusp, Ann. Geophys., 13, 919–925, https://doi.org/10.1007/s00585-995-0919-9, 1995.
Prikryl, P., Greenwald, R. A., Sofko, G. J., Villain, J. P., Ziesolleck, C. W. S., and Friis-Christensen, E.: Solar-wind driven pulsed magnetic reconnection at the dayside magnetopause, Pc5 compressional oscillations, and field line resonances, J. Geophys. Res., 103, 17307–17322, https://doi.org/10.1029/97JA03595, 1998.
Prikryl, P., MacDougall, J. W., Grant, I. F., Steele, D. P., Sofko, G. J., and Greenwald, R. A.: Observations of polar patches generated by solar wind Alfvén wave coupling to the dayside magnetosphere, Ann. Geophys., 17, 463–489, https://doi.org/10.1007/s00585-999-0463-0, 1999.
Prikryl, P., Provan, G., McWilliams, K. A., and Yeoman, T. K.: Ionospheric cusp flows pulsed by solar wind Alfvén waves, Ann. Geophys., 20, 161–174, https://doi.org/10.5194/angeo-20-161-2002, 2002.
Prikryl, P., Muldrew, D. B., Sofko, G. J., and Ruohoniemi, J. M.: Solar wind Alfvén waves: a source of pulsed ionospheric convection and atmospheric gravity waves, Ann. Geophys., 23, 401–417, https://doi.org/10.5194/angeo-23-401-2005, 2005.
Prikryl, P., Jayachandran, P. T., Mushini, S. C., and Chadwick, R.: Climatology of GPS phase scintillation and HF radar backscatter for the high-latitude ionosphere under solar minimum conditions, Ann. Geophys., 29, 377–392, https://doi.org/10.5194/angeo-29-377-2011, 2011.
Prikryl, P., Ghoddousi-Fard, R., Weygand, J. M., Viljanen, A., Connors, M., Danskin, D. W., Jayachandran, P. T., Jacobsen, K. S., Andalsvik, Y. L., Thomas, E. G., Ruohoniemi, J. M., Durgonics, T., Oksavik, K., Zhang, Y., Spanswick, E., Aquino, and Sreeja, V. M.: GPS phase scintillation at high latitudes during the geomagnetic storm of 17–18 March 2015, J. Geophys. Res.-Space, 121, 10448–10465, https://doi.org/10.1002/2016JA023171, 2016.
Prikryl, P. Bruntz, R., Tsukijihara, T., Iwao, K., Muldrew, D. B., Rušin, V., Rybanský, M., Turna, M., and Šťastný, P.: Tropospheric weather influenced by solar wind through atmospheric vertical coupling downward control, J. Atmos. Sol.-Terr. Phy., 171, 94–110, https://doi.org/10.1016/j.jastp.2017.07.023, 2018.
Prikryl, P., Nikitina, L., and Rušin, V.: Rapid Intensification of Tropical Cyclones in the Context of the Solar Wind-Magnetosphere-Ionosphere-Atmosphere Coupling, J. Atmos. Sol.-Terr. Phy., 183, 36–60, https://doi.org/10.1016/j.jastp.2018.12.009, 2019.
Prikryl, P., Weygand, J. M., Ghoddousi-Fard, R., Jayachandran, P. T., Themens, D. R., McCaffrey, A. M., Kunduri, B. S. R., and Nikitina, L.: Temporal and spatial variations of GPS TEC and phase during auroral substorms and breakups, Polar Sci., 28, 100602, https://doi.org/10.1016/j.polar.2020.100602, 2021a.
Prikryl, P., Rušin, V., Prikryl, E. A., Šťastný, P., Turňa, M., and Zeleňáková, M.: Heavy rainfall, floods, and flash floods influenced by high-speed solar wind coupling to the magnetosphere–ionosphere–atmosphere system, Ann. Geophys., 39, 769–793, https://doi.org/10.5194/angeo-39-769-2021, 2021b.
Provan, G., Yeoman, T. K., and Milan, S. E.: CUTLASS Finland radar observations of the ionospheric signatures of flux transfer events and the resulting plasma flows, Ann. Geophys., 16, 1411–1422, https://doi.org/10.1007/s00585-998-1411-0, 1998.
Provan, G., Lester, M., Grocott, A., and Cowley, S. W. H.: Pulsed flows observed during an interval of prolonged northward IMF, Ann. Geophys., 23, 1207–1225, https://doi.org/10.5194/angeo-23-1207-2005, 2005.
Richmond, A. D.: Gravity wave generation, propagation, and dissipation in the thermosphere, J. Geophys. Res., 83, 4131–4145, https://doi.org/10.1029/JA083iA09p04131, 1978.
Rodger, A. S. and Pinnock, M.: The ionospheric response to flux transfer events: the first few minutes, Ann. Geophys., 15, 685–691, https://doi.org/10.1007/s00585-997-0685-y, 1997.
Rodger, A. S., Pinnock, M., Dudeney, J. R., Baker, K. B., and Greenwald, R. A.: A new mechanism for polar patch formation, J. Geophys. Res., 99, 6425–6436, https://doi.org/10.1029/93JA01501, 1994.
Russell, C. T. and Elphic, R. C.: Initial ISEE magnetometer results: magnetopause observations, Space Sci. Rev., 22, 681–715, https://doi.org/10.1007/BF00212619, 1978.
Russell, C. T. and Elphic, R. C.: ISEE observations of flux transfer events at the dayside magnetopause, Geophys. Res. Lett., 6, 33–36, https://doi.org/10.1029/GL006i001p00033, 1979.
Samson, J. C., Greenwald, R. A., Ruohoniemi, J. M., and Baker, K. B.: High-frequency radar observations of atmospheric gravity waves in the high latitude ionosphere, Geophys. Res. Lett., 16, 875–878, https://doi.org/10.1029/GL016i008p00875, 1989.
SECS: Spherical Elementary Currents Systems, http://vmo.igpp.ucla.edu/data1/SECS/, last access: 25 September 2022.
Southwood, D. J.: The ionospheric signature of flux transfer events, J. Geophys. Res., 92, 3207–3213, https://doi.org/10.1029/JA092iA04p03207, 1987.
Smith, C. W., Acuna, M. H., Burlaga, L. F., L'Heureux, J., Ness, N. F., and Scheifele, J.: The ACE Magnetic Field Experiment, Space Sci. Rev., 86, 613–632, https://doi.org/10.1023/A:1005092216668, 1999.
Smith, E. J. and Wolfe, J. H.: Observations of interaction regions and corotating shocks between one and five au: Pioneers 10 and 11, Geophys. Res. Lett., 3, 137–140, https://doi.org/10.1029/GL003i003p00137, 1976.
Smith, E. J., Tsurutani, B. T., and Rosenberg, R. L.: Observations of the interplanetary sector structure up to heliographic latitudes of 16∘: Pioneer 11. J. Geophys. Res.-Space, 83, 717–724, https://doi.org/10.1029/JA083iA02p00717, 1978.
SRI International: ISR Database, http://amisr.com/database/, last access: 25 September 2022.
Stauning, P., Friis-Christensen, E., Rasmussen, O., and Vennerstrom, S.: Progressing polar convection disturbances: signature of an open magnetosphere, J. Geophys. Res., 99, 11303–11317, https://doi.org/10.1029/93JA03584, 1994.
Stauning, P., Clauer, C. R., Rosenberg, T. J., Friis-Christensen, E., and Sitar, R.: Observations of solar-wind-driven progression of interplanetary magnetic field By-related dayside ionospheric disturbances, J. Geophys. Res., 100, 7567–7585, https://doi.org/10.1029/94JA01825, 1995.
SuperMAG: Data Download, https://supermag.jhuapl.edu/mag/, last access: 25 September 2022.
Themens, D. R., Jayachandran, P. T., Langley, R. B., MacDougall, J. W., and Nicolls, M. J.: Determining receiver biases in GPS-derived total electron content in the auroral oval and polar cap region using ionosonde measurements, GPS Solut., 17, 357–369, https://doi.org/10.1007/s10291-012-0284-6, 2013.
Themens, D. R., Jayachandran, P. T., and Langley, R. B.: The nature of GPS differential receiver bias variability: An examination in the polar cap region, J. Geophys. Res.-Space, 120, 8155–8175, https://doi.org/10.1002/2015JA021639, 2015.
Themens, D. R., Watson, C., Žagar, N., Vasylkevych, S., Elvidge, S., McCaffrey, A., Prikryl, P., Reid, B., Wood, A., and Jayachandran, P. T.: Global propagation of ionospheric disturbances associated with the 2022 Tonga Volcanic Eruption, Geophys. Res. Lett., 49, e2022GL098158, https://doi.org/10.1029/2022GL098158, 2022.
Tsurutani, B. T. and Gonzalez, W. D.: The cause of High-Intensity, Long-Duration Continuous AE Activity (HILDCAAs): Interplanetary Alfvén wave trains, Planet Space Sci., 35, 405–412, https://doi.org/10.1016/0032-0633(87)90097-3, 1987.
Tsurutani, B. T. and Meng, C.-I.: Interplanetary magnetic-field variations and substorm activity, J. Geophys. Res., 77, 2964–2970, https://doi.org/10.1029/JA077i016p02964, 1972.
Tsurutani, B. T., Gould, T., Goldstein, B. E., Gonzalez, W. D., and Sugiura, M.: Interplanetary Alfvén waves and auroral (substorm) activity: IMP-8, J. Geophys. Res., 95, 2241–2252, https://doi.org/10.1029/JA095iA03p02241, 1990.
Tsurutani, B. T., Gonzalez, W. D., Gonzalez, A. L. C., Tang, F., Arballo, J. K., and Okada, M.: Interplanetary origin of geomagnetic activity in the declining phase of the solar cycle, J. Geophys. Res., 100, 21717–21733, https://doi.org/10.1029/95JA01476, 1995a.
Tsurutani, B. T., Ho, C. M., Arballo, J. K., Goldstein, B. E., and Andre Balogh, A.: Large Amplitude IMF Fluctuations in Corotating Interaction Regions: Ulysses at Midlatitudes, Geophys. Res. Lett., 22, 3397–3400, https://doi.org/10.1029/95GL03179, 1995b.
Tsurutani, B. T., McPherron, R. L., Gonzalez, W. D., Lu, G., Gopalswamy, N., and Guarnieri, F. L.: Magnetic Storms Caused by Corotating Solar Wind Streams, in: Recurrent Magnetic Storms: Corotating Solar Wind, AGU monograph 167, 1–17, https://doi.org/10.1029/167GM03, 2006.
University of Alaska Fairbanks: Magnetometer Archive, https://www.gi.alaska.edu/monitors/magnetometer/archive, last access: 25 September 2022.
University of Alberta: CARISMA, https://www.carisma.ca/, last access: 25 September 2022.
University of Calgary: RISR-C data, http://data.phys.ucalgary.ca/, last access: 25 September 2022a.
University of Calgary: Madrigal Database, https://madrigal.phys.ucalgary.ca/, last access: 25 September 2022b.
Valladares, C. E., Basu, S., Buchau, J., and Friis-Christensen, E.: Experimental evidence for the formation and entry of patches into the polar cap, Radio Sci., 29, 167–194, https://doi.org/10.1029/93RS01579, 1994.
Valladares, C. E., Decker, D. T., Sheehan, R., and Anderson, D. N.: Modeling the formation of polar cap patches using large plasma flows, Radio Sci., 31, 573–593, https://doi.org/10.1029/96RS00481, 1996.
Van Eyken, A. P., Risbeth, H., and Saunders, M. A.: Initial observations of plasma convection at invariant latitudes of 70–77∘, J. Atmos. Terr. Phys., 46, 635–641, https://doi.org/10.1016/0021-9169(84)90081-3, 1984.
Waldock, J. A. and Jones, T. B.: Source regions of medium scale traveling ionospheric disturbances observed at mid-latitudes, J. Atmos. Terr. Phys., 49, 105–114, https://doi.org/10.1016/0021-9169(87)90044-4, 1987.
Walker, A. D. M., Greenwald, R. A., and Baker, K. B.: HF radar observations of pulsations near the magnetospheric cusp, J. Geophys. Res., 91, 8919–8928, https://doi.org/10.1029/JA091iA08p08919, 1986.
Weygand, J. M.: Equivalent Ionospheric Currents (EICs) derived using the Spherical Elementary Currents Systems (SECS) technique at 10 sec Resolution in Geographic Coordinates, UCLA [data set], https://doi.org/10.21978/P8D62B, 2009a.
Weygand, J. M.: Spherical Elementary Current (SEC) Amplitudes derived using the Spherical Elementary Currents Systems (SECS) technique at 10 sec Resolution in Geographic Coordinates, UCLA [data set], https://doi.org/10.21978/P8PP8X, 2009b.
Weygand, J. M., Amm, O., Viljanen, A., Angelopoulos, V., Murr, D., Engebretson, M. J., Gleisner, H., and Mann, I.: Application and validation of the spherical elementary currents systems technique for deriving ionospheric equivalent currents with the North American and Greenland ground magnetometer arrays, J. Geophys. Res., 116, A03305, https://doi.org/10.1029/2010JA016177, 2011.
Yang, Y.-H., Chao, J.-K., and Lee, L.-C.: On the Walén Relation for Alfvénic Fluctuations in Interplanetary Space, Astrophys. J., 904, 195, https://doi.org/10.3847/1538-4357/abbf55, 2020.
Zhang, S.-R., Erickson, P. J., Coster, A. J., Rideout, W., Vierinen, J., Jonah, O. F., and Goncharenko, L. P.: Subauroral and polar traveling ionospheric disturbances during the 7–9 September 2017 storms, Space Weather, 17, 1748–1764, https://doi.org/10.1029/2019SW002325, 2019.
- Abstract
- Introduction
- Data sources and methods
- Generation of polar cap patches and traveling ionospheric disturbances modulated by solar wind Alfvén waves
- Discussion
- Summary and conclusions
- Data availability
- Author contributions
- Competing interests
- Disclaimer
- Acknowledgements
- Review statement
- References