the Creative Commons Attribution 4.0 License.
the Creative Commons Attribution 4.0 License.
 | 06 Oct 2022
Ionospheric effects of the 5–6 January 2019 eclipse over the People's Republic of China: results from oblique sounding
Leonid F. Chernogor
Kostyantyn P. Garmash
Qiang Guo
Victor T. Rozumenko
This paper deals with the variations in the Doppler spectra and in the relative amplitudes of the signals observed at oblique incidence over the People's Republic of China (PRC) during the partial solar eclipse of 5–6 January 2019 and on reference days. The observations were made using the multifrequency multipath radio system for sounding the ionosphere at oblique incidence. The receiver system is located at the Harbin Engineering University, PRC, and 14 HF broadcasting station transmitters are used for taking measurements along the following radio-wave propagation paths: Lintong/Pucheng to Harbin, Hwaseong to Harbin, Chiba/Nagara to Harbin, Hailar/Nanmen to Harbin, Beijing to Harbin (three paths), Goyang to Harbin, Ulaanbaatar/Khonkhor to Harbin, Yakutsk to Harbin (two paths), Shijiazhuang to Harbin, Hohhot to Harbin, and Yamata to Harbin. The specific feature of this partial solar eclipse was that it occurred during the local morning with a geomagnetic disturbance (Kp ≈ 3−) in the background. The response of the ionosphere to the solar eclipse has been inferred from temporal variations in the Doppler spectra, the Doppler shift, and the signal relative amplitude. The partial solar eclipse was found to be associated with broadening of the Doppler spectrum, up to ± 1.5 Hz, alternating sign Doppler-shift variations, up to ± 0.5 Hz, in the main ray, and quasi-periodic Doppler-shift changes. The relative amplitude of electron density disturbances in the 15 min period of atmospheric gravity wave field and in the 4–5 min period of infrasound wave field is estimated to be 1.6 %–2.4 % and 0.2 %–0.3 %, respectively. The estimates of a maximum decrease in the electron density are in agreement with the observations.
- Article
(15769 KB) - Full-text XML
- BibTeX
- EndNote


-
The solar eclipse was accompanied by up to ± 1.5 Hz Doppler-spectrum broadening and ± 0.5 Hz variations in the Doppler shift, fD.
-
Atmospheric gravity waves excited 15 min period variations in fD and 1.6 %–2.4 % perturbations in N.
-
Infrasound excited 4–5 min period variations in fD and 0.2 %–0.3 % perturbations in N.
-
The greatest decrease in the ionospheric electron density, N, attains −15 %, whereas the theoretical estimate is −13 %.
A solar eclipse is quite a rare natural phenomenon. The maximum phase of a total eclipse can persist for a fraction of 1 s to a maximum of 7 min 32 s, whereas a partial solar eclipse persists for about 2–3 h. The umbra's path width varies from ∼ 150 km at the Equator to 1000 km at the poles, and the Moon's shadow travels at a speed of about 500 to 1000 m s−1, depending on the geographic latitude (Chernogor, 2013a).
A solar eclipse acts to significantly modify energy influx; it is capable of producing variations in all geophysical fields, changes in the parameters of the processes acting in the subsystems of the Earth (internal spheres)–atmosphere–ionosphere–magnetosphere (EAIM) system, and disrupting the existing couplings between the subsystems (Chernogor, 2003, 2011; Chernogor and Rozumenko, 2008). The processes caused by a solar eclipse in the EAIM system resemble the processes observed at the morning–evening meridian, but they differ from the latter, both quantitatively and qualitatively. First, the changes in the solar energy flux during a solar eclipse occur at an almost unchanging zenith angle (it changes by only 8 %–12 %). Second, the effects of a solar eclipse in the EAIM system significantly depend on season, local time, the state of atmospheric and space weather, etc. Moreover, unlike the terminator, the Moon's shadow moves at supersonic speed. All these factors make each eclipse unique. The study of the EAIM system's response to a solar eclipse permits the establishment of direct and reverse, positive and negative couplings between the subsystems, the specification of physical and chemical processes operating in the subsystems, and the determination of a number of parameters of these processes, etc. (Chernogor, 2003, 2011; Chernogor and Rozumenko, 2008).
Astronomers have been studying solar eclipses for thousands of years. The study of the upper atmosphere and ionosphere began in the twentieth century, encompassing the effects of a solar eclipse on these media. First attempts to observe the effects arising during a solar eclipse date back to the 1930–1940s (see, e.g., Chapman, 1932; Higgs, 1942). An eclipse-related distortion of the radio-wave characteristics was used first, and then the ionosonde technique. The first collection of papers dealing with ionospheric effects of solar eclipses was published during the 1950s (Beynon and Brown, 1956).
The investigation of processes caused by solar eclipses became especially active with the advent of the space age when a broad spectrum of rocket and satellite measurements found applications in the field. The incoherent scatter radar, the single most powerful ground-based technique for probing geospace, appeared at the same time. During the 1970s and later, the study of processes caused by eclipses became more active. Astronomical, radio, satellite, and other techniques were used for this purpose, which were described in books (see, e.g., Anastassiades, 1970).
The study of the ionospheric response to solar eclipses has advanced dramatically over the past 40 years. One should acknowledge that the manifestation of the ionospheric effects is dependent on many factors, including the measurement techniques. Thus, the involvement of techniques other than the conventional techniques (ionosonde, incoherent scatter radar, satellite radio beacon receivers, etc.) would be appropriate, including the technique used in this study. The important feature of the ionospheric response to note is that no two identical reactions are similar to two solar eclipses. Therefore, the authors have restricted their review to only listing the main works in the field. The studies conducted by Chandra et al. (1980), Sen Gurta et al. (1980), Deshpande et al. (1982), Rama Rao et al. (1982), Roble et al. (1986), Salah et al. (1986), and Liu et al. (1998) during the 1980–1990s should be noted. Results obtained in the recent 2 decades are presented in the studies by Uryadov et al. (2000), Akimov et al. (2005), Burmaka et al. (2006a, b), Founda et al. (2007), Afraimovich et al. (2007), Šauli et al. (2007), Jakowski et al. (2008), Grigorenko et al. (2008), Lyashenko and Chernogor (2008), Akimov and Chernogor (2010), Chernogor (2010a, b, 2012a, b, 2013b, 2016a, b), Garmash et al. (2011), Marlton et al. (2016), Uryadov et al. (2016), Verhulst et al. (2016), Stankov et al. (2017), Chernogor and Garmash (2017), Coster et al. (2017), Chernogor et al. (2019).
Some eclipses attracted particular attention. Recent work (Chernogor, 2012a, b, 2013b, 2016a, b; Marlton et al., 2016; Uryadov et al., 2016; Verhulst et al., 2016; Chernogor and Garmash, 2017; Stankov et al., 2017; Chernogor et al., 2019; Panasenko et al., 2019) describes ionospheric effects of the solar eclipse of 29 March 2015 in Europe. Coster et al. (2017) analyze effects of the solar eclipse of 21 August 2017. Guo et al. (2020) discuss the effects of the partial solar eclipse of 11 August 2018 in the ionosphere over the People's Republic of China (PRC). The observations have been made with the coherent multifrequency multipath radio system, the receiver of which is located at the Harbin Engineering University, and 14 transmitters are situated in the PRC, Japan, Mongolia, the Republic of Korea, and the Russian Federation. In the ionosphere, aperiodic and quasi-periodic perturbations in the electron density, N, have been detected with a 1 %–10 % amplitude and a ∼ 10 min period, T, whereas the decrease in the electron density of the ionospheric E region attains 26 %, agreeing well with the theoretical estimate (24 %). The solar eclipse of 21 June 2020 that occurred in the equatorial ionosphere was observed by Le et al. (2020), Zhang et al. (2020), Huang et al. (2020, 2021), Dang et al. (2020), Patel and Singh (2021), J. Wang et al. (2021), X. Wang et al. (2021), Şentürk et al. (2021), Sun et al. (2021), Shagimuratov et al. (2021), Aa et al. (2021), Chen et al. (2021), and Tripathi et al. (2022); the ionospheric effects were observed to occur with the South Atlantic Anomaly in the background. Zhang et al. (2020) detected effects from the solar eclipse in the magnetically conjugate region. Chernogor and Mylovanov (2022) describe the ionospheric effects of the annular solar eclipse of 10 June 2021 that occurred in high latitudes. The atmospheric, ionospheric, and magnetic effects of this eclipse are analyzed by Chernogor (2021a, b, 2022), Chernogor and Mylovanov (2022), and Chernogor and Garmash (2022).
More recently, increasingly sophisticated models have been developed. Based on the observations of two eclipses, Verhulst and Stankov (2020) analyzed the altitude dependence of the ionospheric effects from solar eclipses. Based on the solar eclipse of 21 August 2017, Mrak et al. (2022) studied the contribution of the ultraviolet emissions from the solar corona to the ionization of the atmosphere and determined that the value of this contribution could attain a factor of 0.2 of the total rate of ionization.
The regular effects, such as a decrease in the electron density, and in the electron and ion temperatures, variations in the ion composition, and vertical plasma movements, have been studied quite well to date (see, e.g., Akimov et al., 2005; Burmaka et al., 2006a, b; Grigorenko et al., 2008; Lyashenko and Chernogor, 2008; Chernogor, 2012a, b, 2013a, b, 2016a, b; Chernogor et al., 2019; Panasenko et al., 2019). The irregular effects, which may differ for different eclipses, have been studied significantly less (Akimov et al., 2005; Burmaka et al., 2006a, b; Grigorenko et al., 2008; Lyashenko and Chernogor, 2008; Akimov and Chernogor, 2010; Chernogor, 2010a, b, 2012a, b, 2013b; Garmash et al., 2011; Marlton et al., 2016; Chernogor and Garmash, 2017; Stankov et al., 2017; Coster et al., 2017). The generation of wave perturbations, which was foretold by Chimonas and Hines (1970), also belong to these effects. At present, the problem of studying the response of all the Earth's spheres to solar eclipses has become an interdisciplinary subject. In addition to astronomers and physicists, meteorologists, medical doctors (ophthalmologists, optometrists, and even psychiatrists), sociologists, biologists, ecologists, etc. have joined the study of the subject.
Thus, many observations have been made regarding the effects that solar eclipses have on the ionosphere over 100 years of eclipse subject history. Nevertheless, the study of these effects remains an urgent problem. There are a few reasons for this. First, solar eclipses take place in different regions of the world, whereas the physical processes operating in the low- and high-latitude ionospheres differ considerably, and consequently, the responses to solar eclipses in the low-, mid-, and high-latitude ionospheres also differ from place to place. Second, the response mentioned above is largely dependent on the state of atmospheric and space weather. Third, the ionospheric response is notably dependent on the eclipse onset. Fourth, the ionospheric response depends on the phase of the eclipse and on its duration. Finally, the application of different techniques for probing the ionosphere permits the addition of extra information about the ionospheric effects of solar eclipses and allows the revelation of new details in these effects. All these factors indicate the specific features of each solar eclipse. Along with regular features, the ionospheric response has specific features that are characteristic of the given solar eclipse, which explain the urgency of this paper. The purpose of this paper is to present the observations of variations in the Doppler spectra and in the amplitudes of radio waves that traveled along oblique propagation paths over the PRC during the course of the partial solar eclipse of 5–6 January 2019 UT and on the previous and next days. The description of the experiment is followed by the theoretical estimates of variations in the electron density during the solar eclipse and a comparison with the observations.
A preliminary analysis of the state of space weather is needed to correctly select the effects from the solar eclipse. The proton density, nsw, in the solar wind plasma exhibited a gradual increase from 2 × 10⁶ m−3 on 3 January 2019 to 30 × 106 m−3 at 20:00 UT on 4 January 2019 (Fig. 1), whereas during 4–5 January 2019, it showed a gradual decrease to the initial level of approximately 2 × 10⁶ m−3 (retrieved from https://omniweb.gsfc.nasa.gov/form/dx1.html, last access: 20 September 2022). The flow speed, Vsw, of the solar wind plasma showed a gradual increase from 300 km s−1 on 4 January 2019 to 552 km s−1 at 17:00 UT on 6 January 2019. The proton temperature in the solar wind plasma exhibited the greatest changes during 4–5 January 2019, when it showed an increase from 104 K on 4 January 2019 to 2.9 × 10⁵ K at 08:00 UT on 5 January 2019. The increases in nsw and Vsw observed on 4 January 2019 resulted in an increase in the dynamic pressure, psw, from 0.2–0.3 to 6–7 nPa (see Fig. 1).
The interplanetary magnetic field By component showed variability within the ± 5 nT limits during 4–5 January 2019. The Bz component exhibited variations from 0 to −5 nT after approximately 04:00 UT on 4 January 2019 until the end of the day, whereas the Akasofu function showed an increase to 8 GJ s−1, which triggered a moderate magnetic storm that persisted from 16:00 UT on 4 January 2019 to the end of 5 January 2019, when the geomagnetic Kp index attained a maximum (Kpmax) of 5, and the equatorial Dst index attained a minimum (Dstmin) of −23 nT at approximately 16:00 UT on 5 January 2019. The magnetic field perturbation, Kp ≈ 3, took place on 6 January 2019, when the value of the Dst index did not exceed −10 nT.
Table 1 presents the daily 10.7 cm solar flux, which is used as a measure of solar activity.
In general, the states of solar activity and space weather were favorable for the observations of ionospheric effects from the partial solar eclipse of 6 January 2019 local time over the PRC.
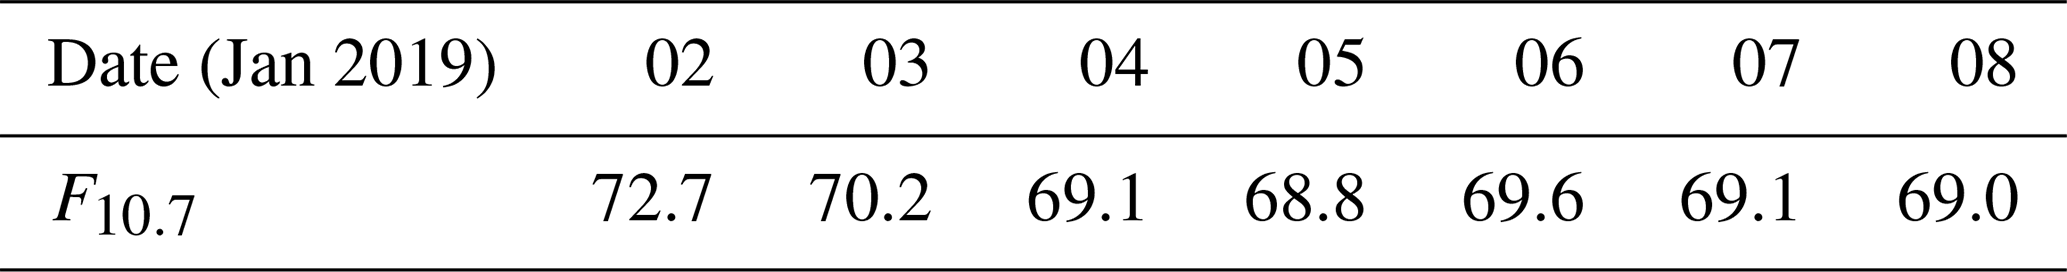
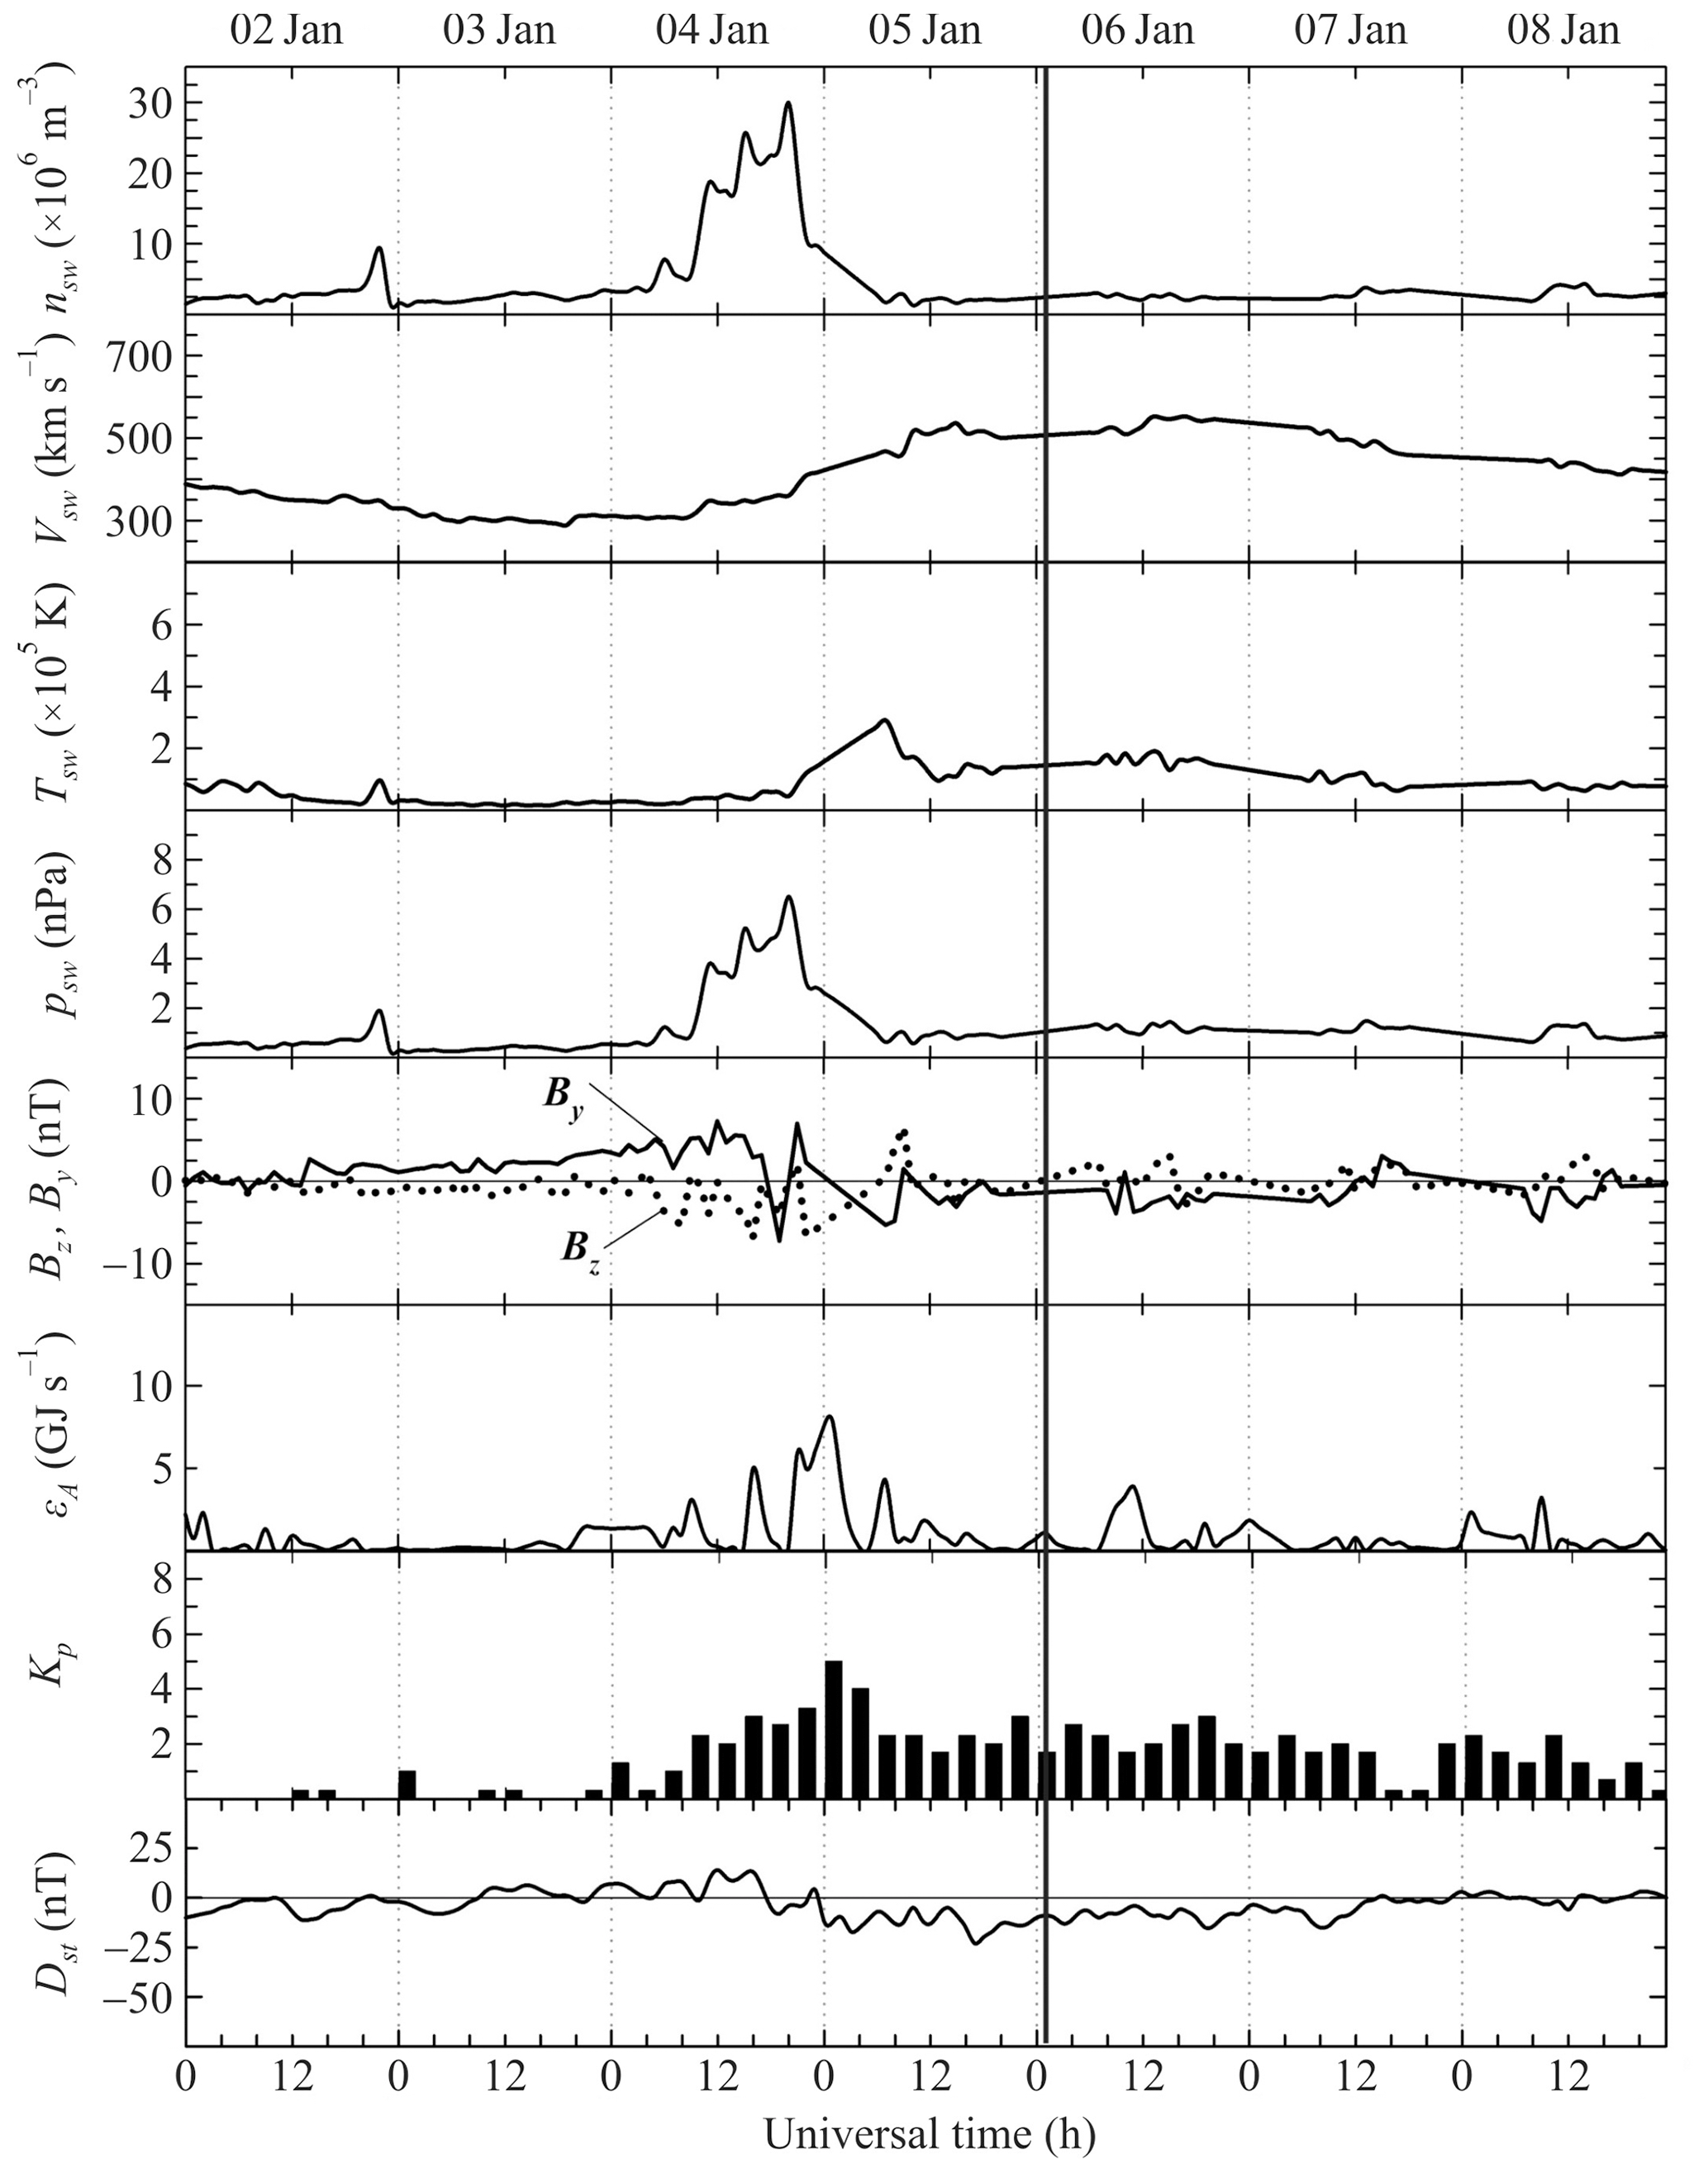
Figure 1Universal time dependencies of the solar wind parameters: observed proton number density (nsw), plasma speed (Vsw), and temperature (Tsw); calculated dynamic pressure (psw); measured components of the interplanetary magnetic field (Bz and By); estimated energy input (εA) into the Earth's magnetosphere from the solar wind per unit time; and Kp- and Dst-indices for the 2–8 January 2019 period. Dates are shown along the upper abscissa axis. Experimental data are retrieved from https://omniweb.gsfc.nasa.gov/form/dx1.html, last access: 20 September 2022.
The observations of the effects from the solar eclipse were made with the multifrequency multipath radio system, designed to probe the ionosphere obliquely. The system developed in collaboration between researchers from the V. N. Karazin Kharkiv National University (Ukraine) and the Harbin Engineering University (PRC) consists of the receiver system located at the Harbin Engineering University (45.78∘ N, 126.68∘ E) and 14 broadcasting stations in the PRC, Japan, Mongolia, the Republic of Korea, and the Russian Federation. The system continuously monitored dynamic processes operating in the ionosphere since May 2018 (Guo et al., 2019, 2020; Luo et al., 2020; Chernogor et al., 2021, 2022).
The receiver system is comprised of the active antenna operating in the 10 kHz–30 MHz frequency range, the USRP N210 software-defined radio using the LFRX/LRTX daughter boards, and the personal computer, for which a sophisticated software package has been developed.
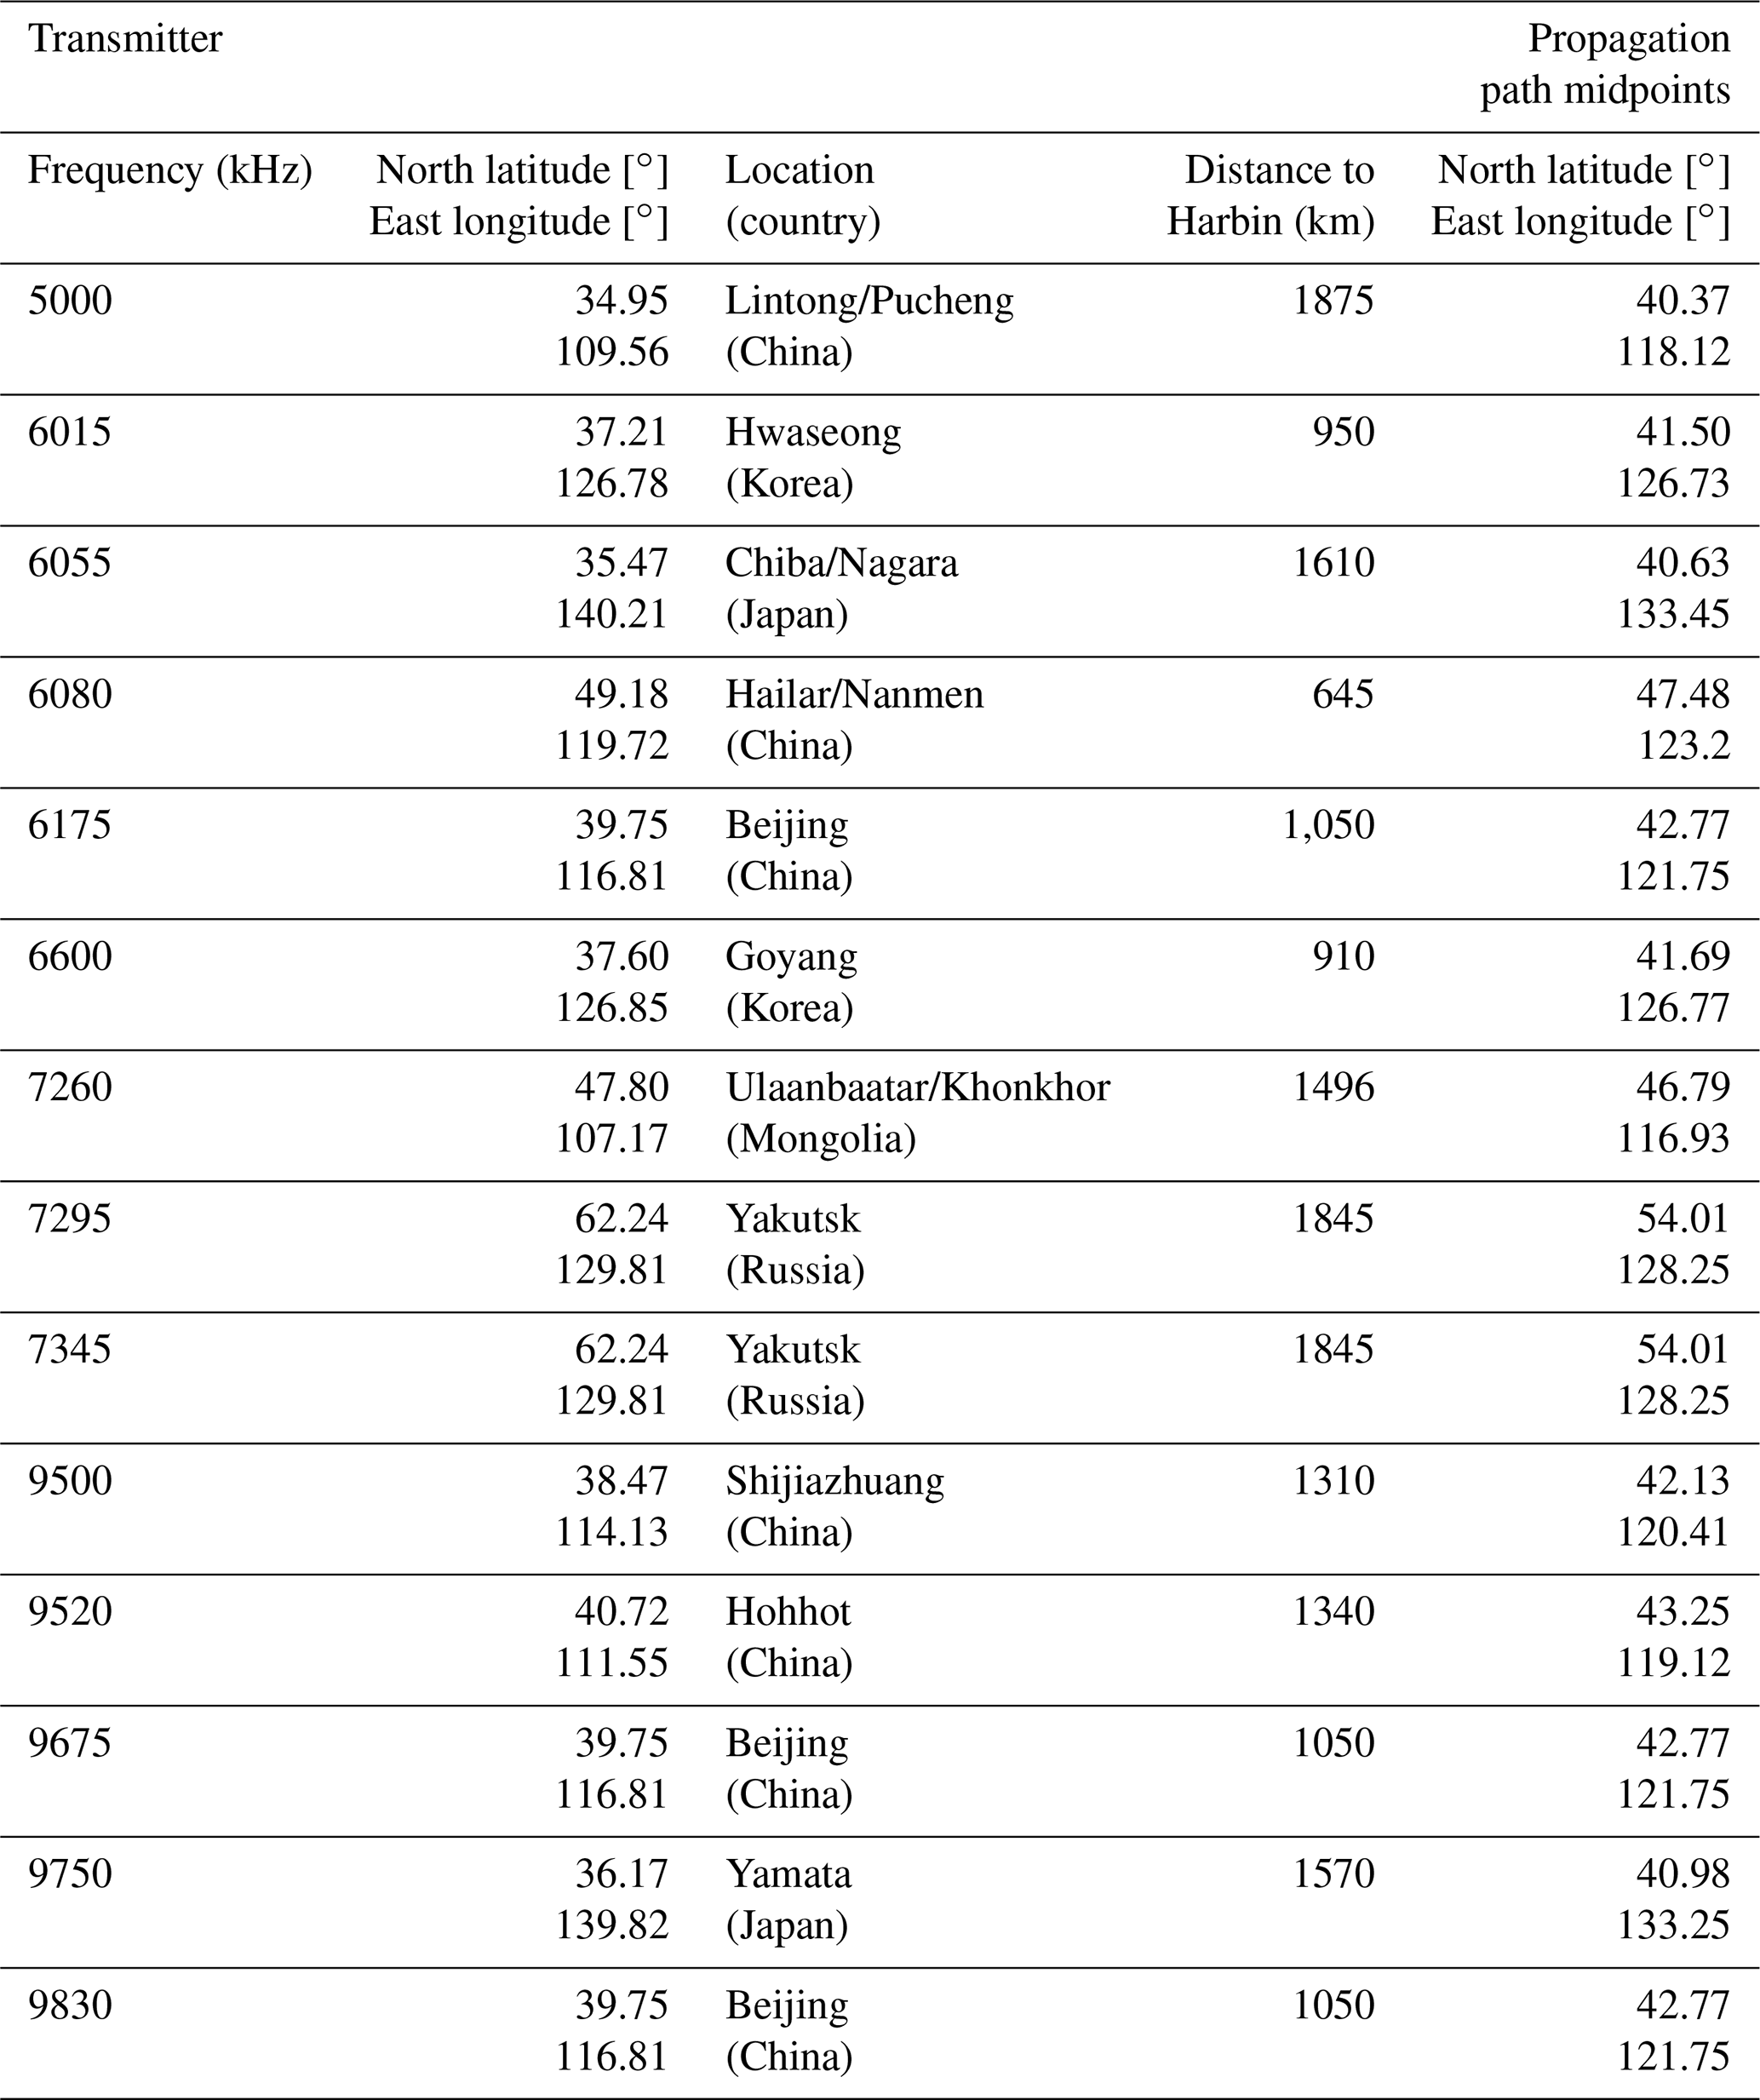
This study makes use of signals that were transmitted by the broadcasting stations at Lintong/Pucheng, Hailar/Nanmen, Beijing, Shijiazhuang and Hohhot (PRC); Hwaseong and Goyang (Republic of Korea); Chiba/Nagara and Yamata (Japan); Ulaanbaatar/Khonkhor (Mongolia); and Yakutsk (Russian Federation), i.e., 14 propagation paths altogether and their specifications are presented in Table 2. The orientation of the propagation paths in Fig. 2 shows that each propagation path midpoint was in the ionospheric region from which Moon was seen to cover a different Sun’s surface area. The radio system is described in more detail by Guo et al. (2019, 2020), Luo et al. (2020), and Chernogor et al. (2020, 2021).
The information on ionospheric processes has been inferred from analysis of the temporal dependencies of the Doppler spectra and the relative amplitudes of the radio waves received from all propagation paths. The spectrum content was determined over time intervals of 20.48 s by employing the autoregressive spectrum analysis of Marple (1987) which yields a Doppler resolution of 0.01 Hz and a temporal resolution of 7.5 s. The information is derived from temporal variations in the Doppler shift, fD(t), in the main ray, from the relative amplitudes, A(t), of the signals, and from Doppler-spectrum broadening. Further, the Doppler shifts, fD(t), are plotted vs. time for the main ray. Next, the fD(t) time series are processed in order to determine long-term trends, short-term fluctuations, spectral content, etc.
The solar eclipse of 6 January 2019 LT was observed in Asia, viz., the PRC, Japan, the Russian Federation, the Republic of Korea, and in the North Pacific Ocean (EclipseWise.com, http://www.eclipsewise.com/solar/SEprime/2001-2100/SE2019Jan06Pprime.html/, last access: 2 May 2022).
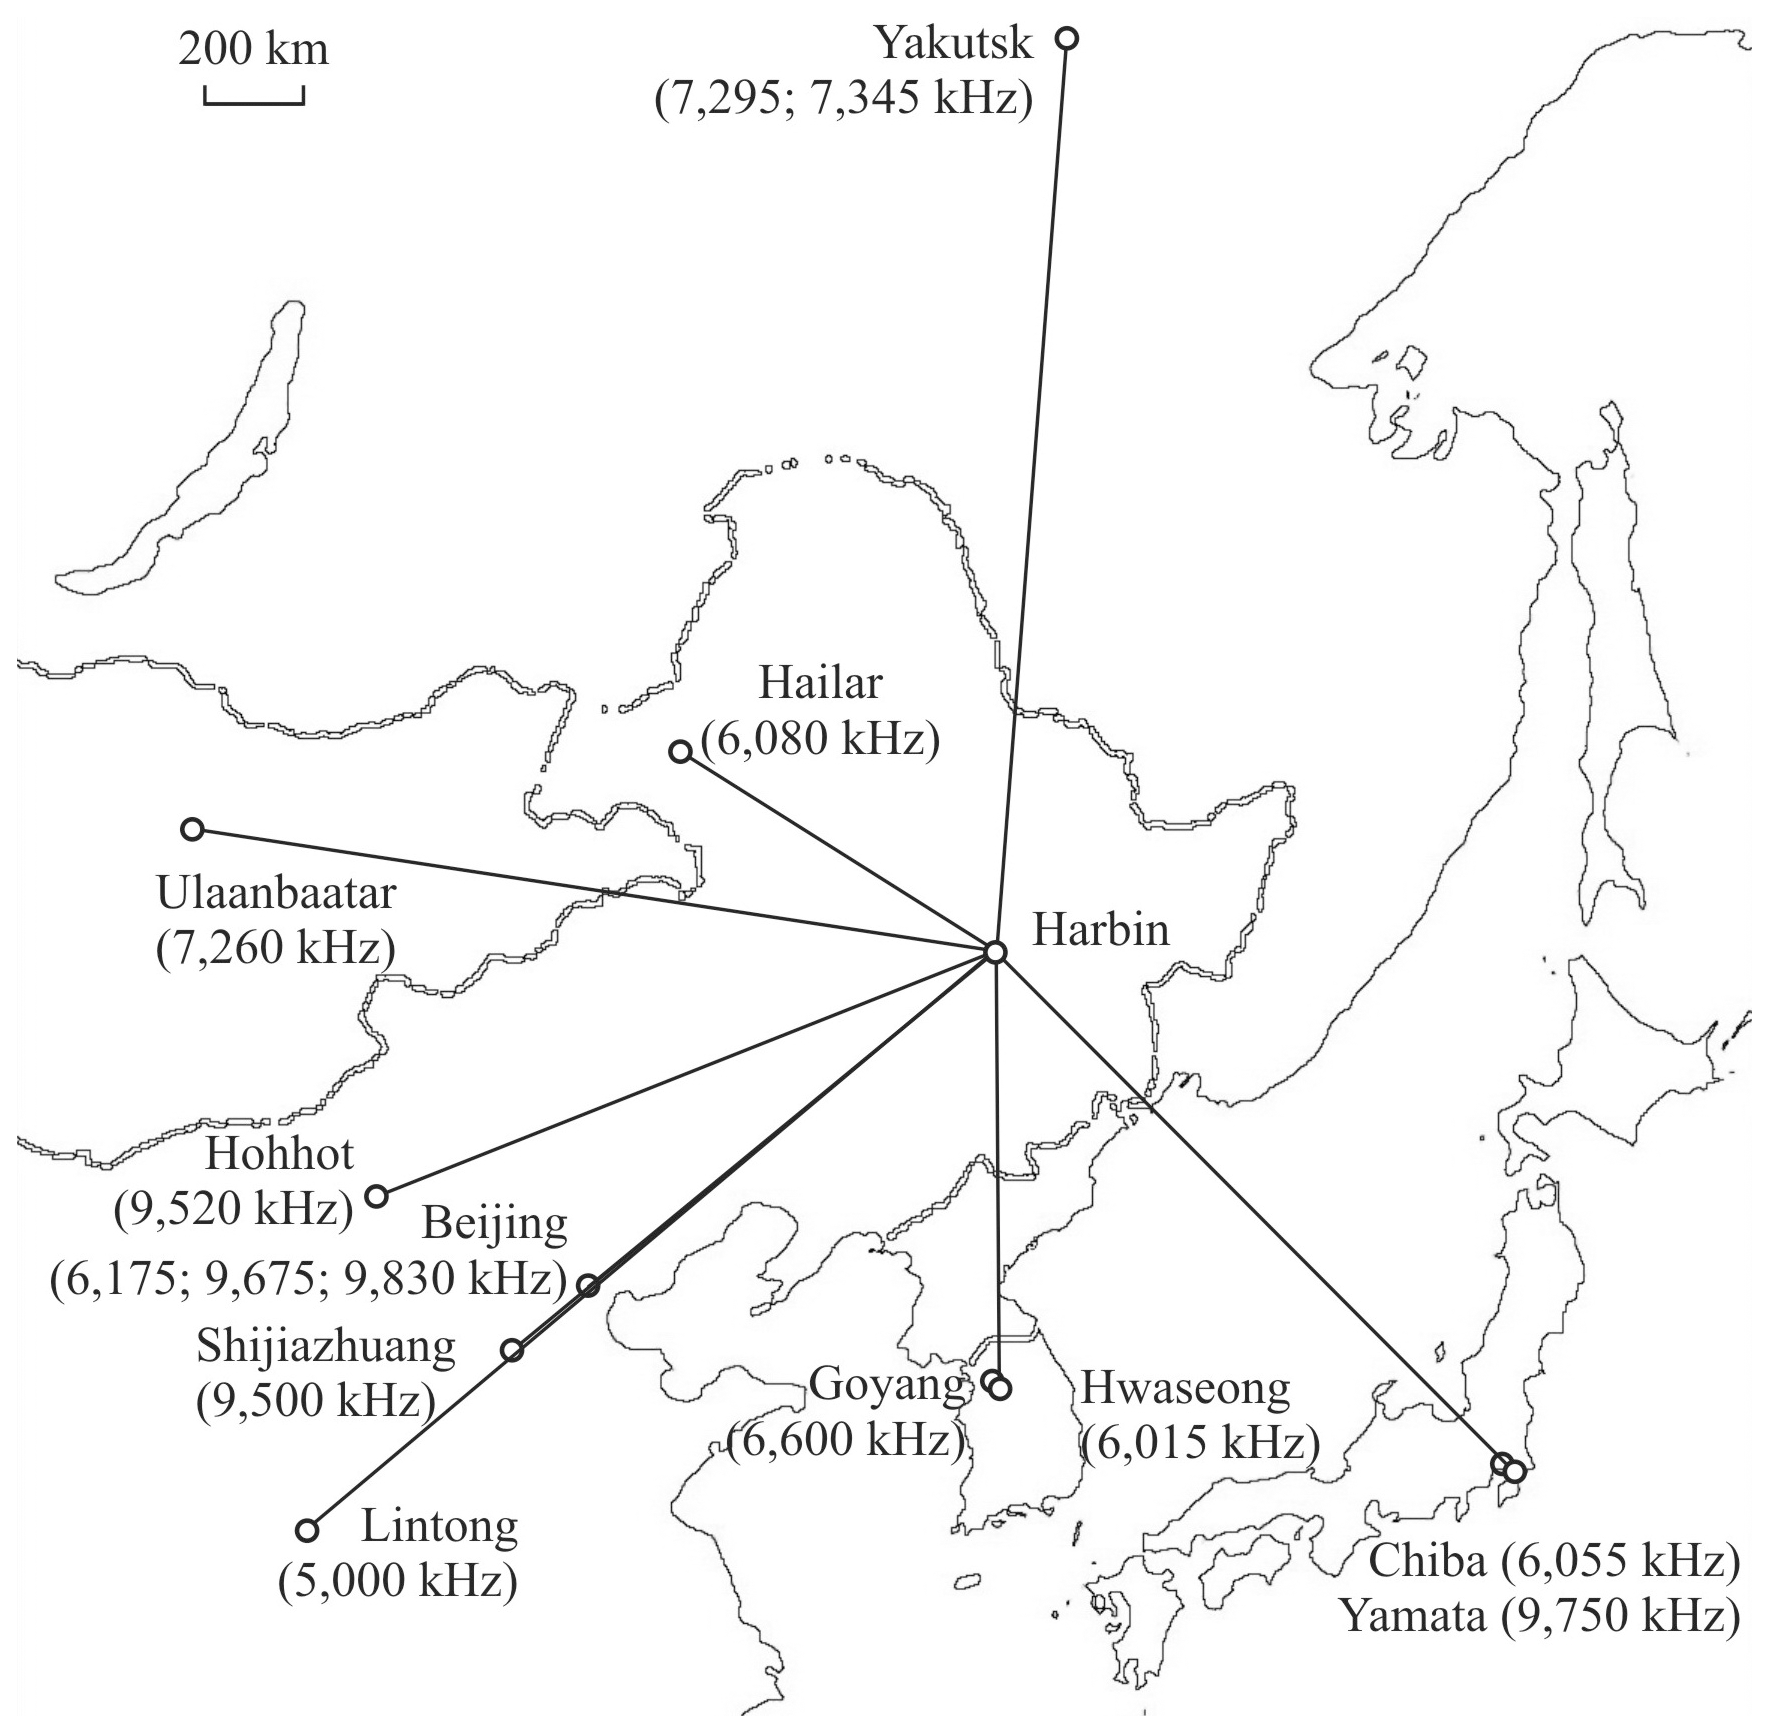
Figure 2Schematic diagram showing the locations of the transmitters and the receiver (Harbin) connected by the great-circle propagation paths, which were used for the observation of solar eclipse effects.
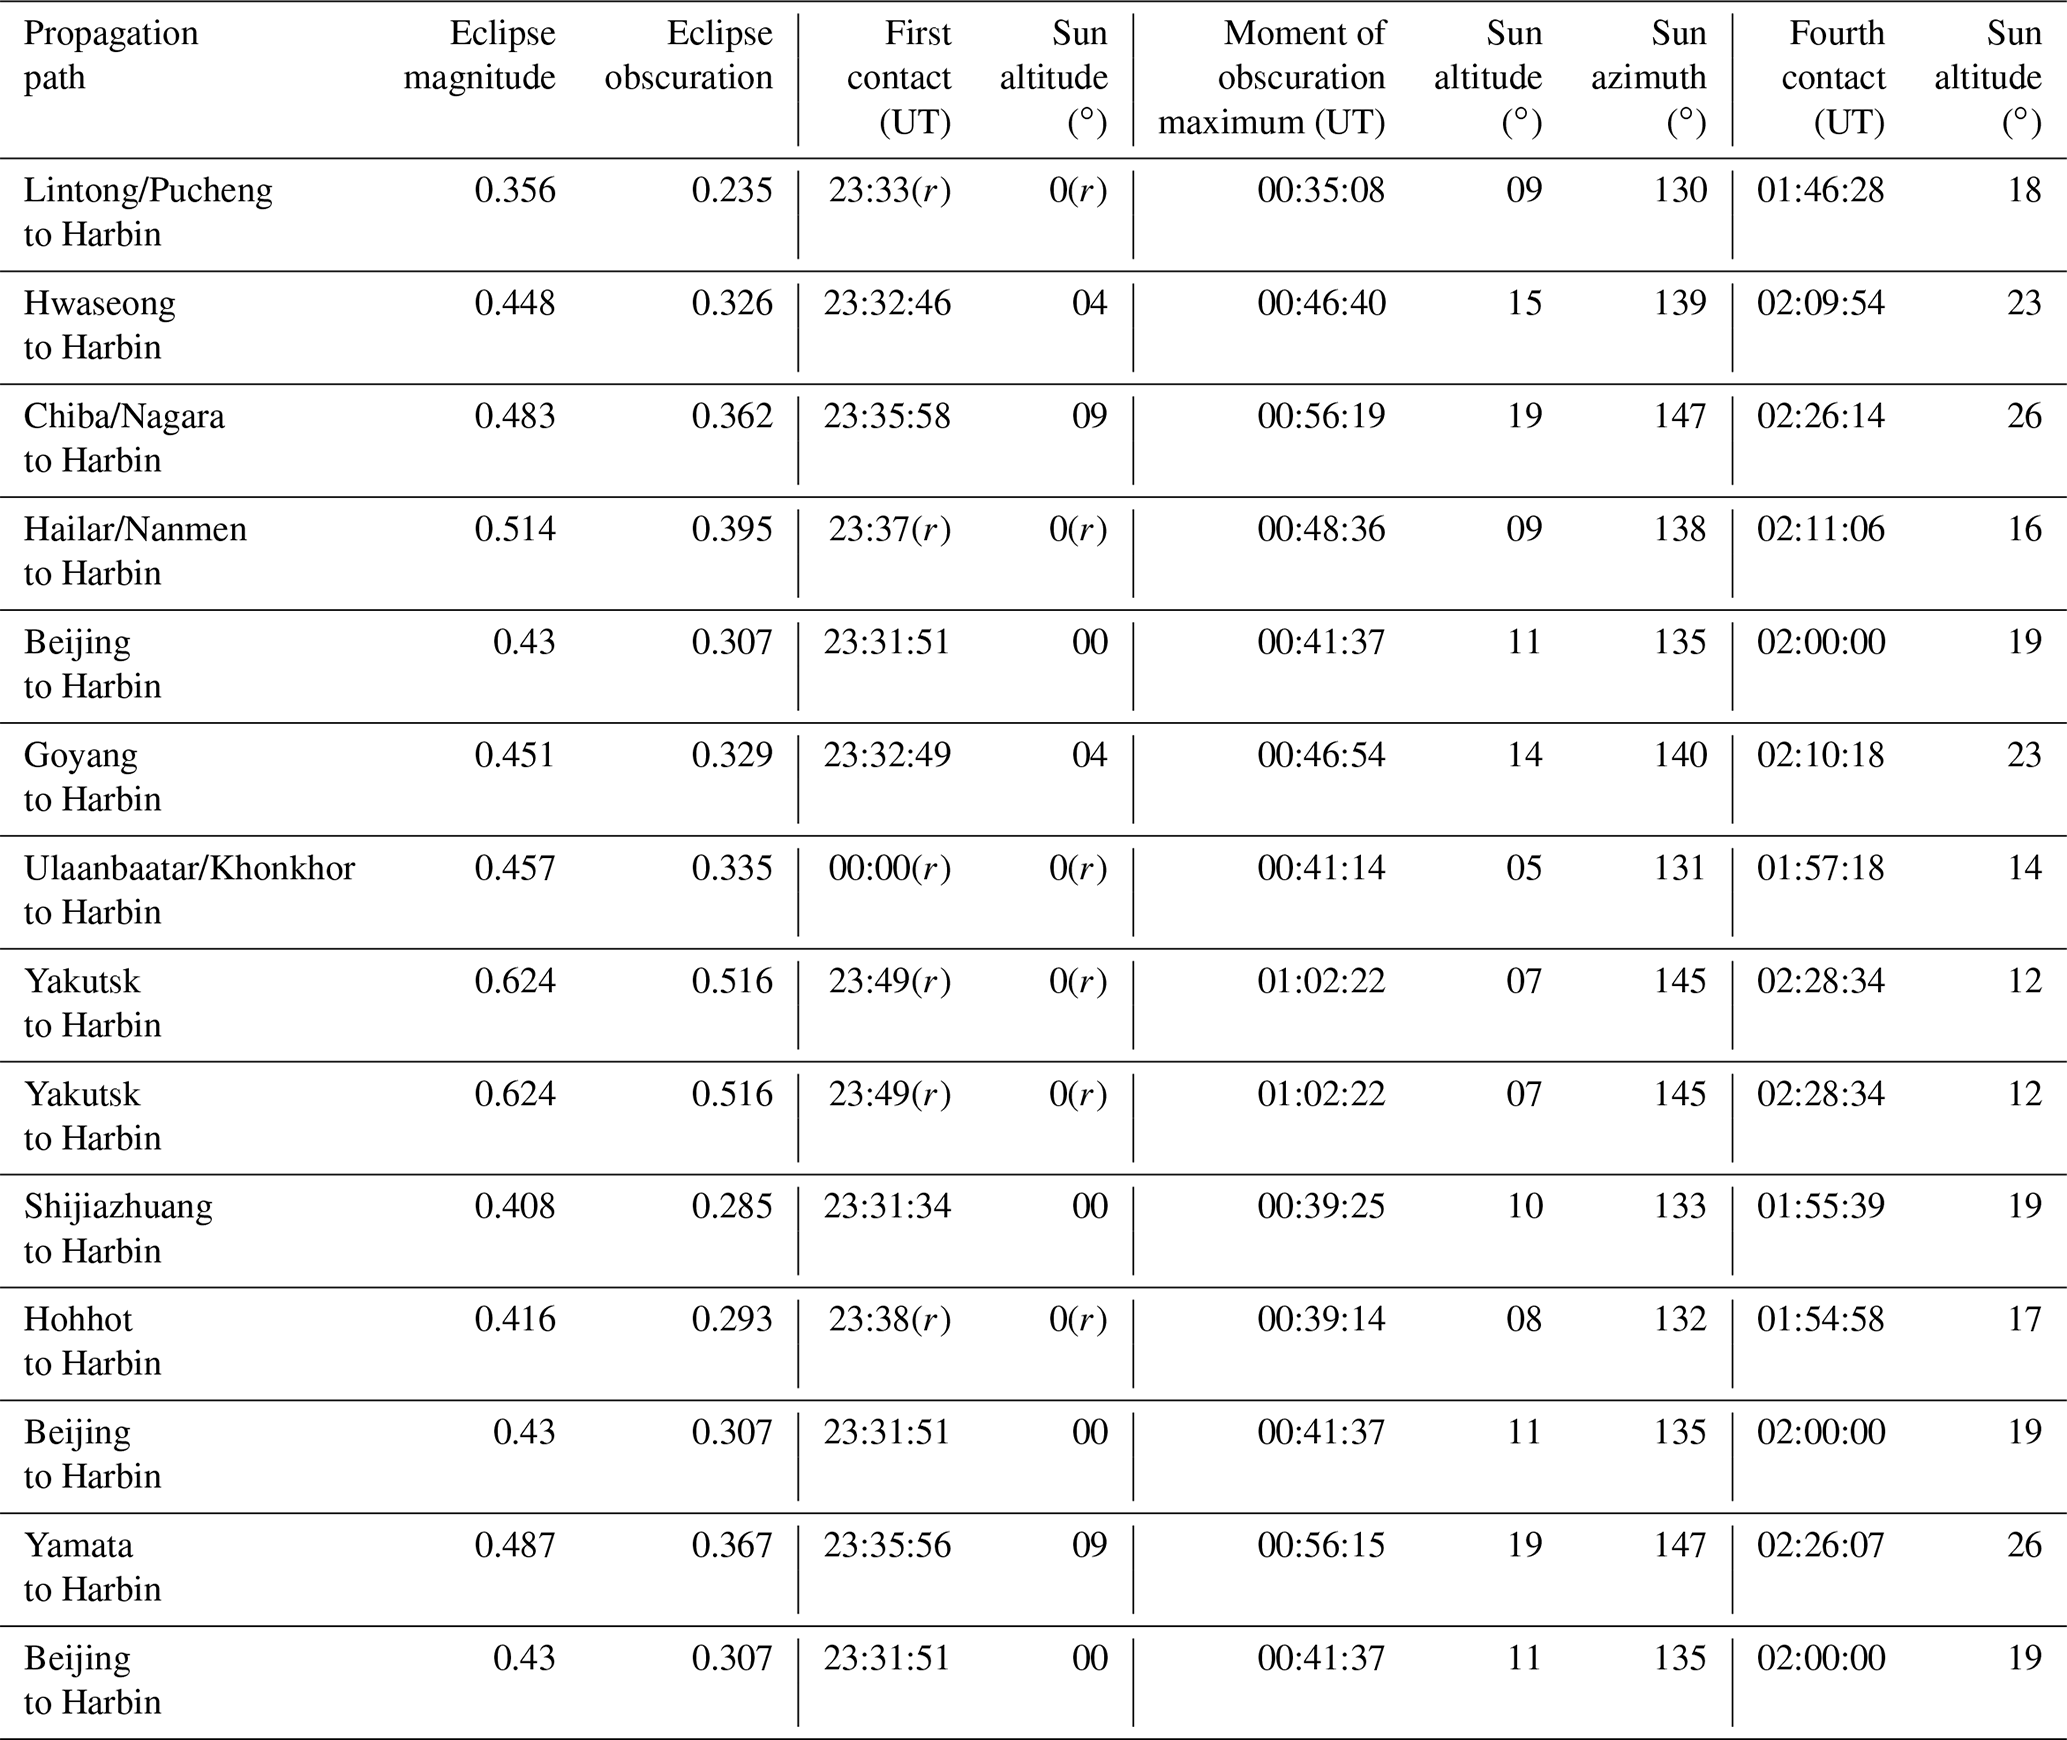
In the PRC, the solar eclipse was observed to be partial (Fig. 3). The eclipse magnitude, M, at an altitude of 100 km under the propagation path midpoints varied from 0.356 to 0.614, whereas the eclipse obscuration varied from 23.5 % to 51.6 % (see Table 3 where a time followed by “(r)” means the event is already in progress at sunrise). The eclipse duration changed from 133 to 160 min. In a number of regions of the PRC, the solar eclipse began before sunrise. The vertical lines in the middle panels of Figs. 4–10 presenting the experimental data indicate the onset, the instant of the greatest eclipse, and the end of the solar eclipse. Generally, the effects of the solar eclipse in the ionosphere were observed during the local morning with the transient processes acting in the background.
Table 2Basic parameters of radio paths. Retrieved from https://fmscan.org/index.php, last access: 20 September 2022.
The 4/5 and 6/7 January 2019 UT nights have been used as a reference for selecting the ionospheric perturbations caused by the solar eclipse. It should be noted that the ionosphere on 4 and 5 January 2019 was partially disturbed because the recovery phase of the moderate magnetic storm proceeded during the latter days.
The measurements were made along 14 propagation paths; however, the modes of operation of only 7 transmitters provided the measurements suitable for further processing. Consider the observations and analysis in more detail.
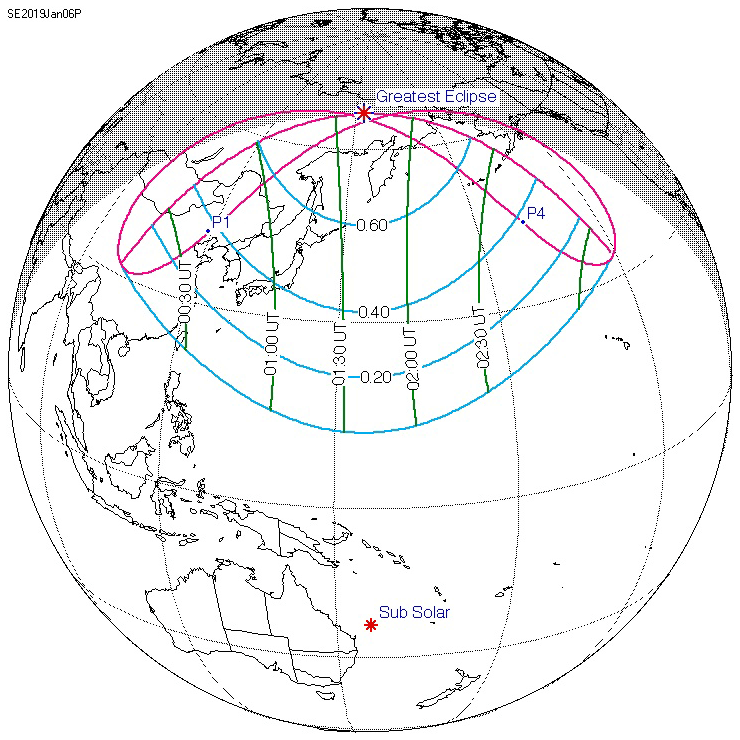
Figure 3Schematic display of the Moon's shadow during the course of the partial solar eclipse of 5–6 January 2019. Retrieved from https://eclipse.gsfc.nasa.gov/JSEX/JSEX-AS.html, last access: 20 September 2022.
Table 3Basic information on the solar eclipse parameters at 100 km altitude over the propagation path midpoints. Retrieved from https://eclipse.gsfc.nasa.gov/JSEX/JSEX-AS.html, last access: 20 September 2022.
6.1 Lintong/Pucheng to Harbin radio-wave propagation path
This radio station, operating at 5000 kHz, is located in the PRC at a great-circle distance (R) of 1875 km from Harbin. The eclipse magnitude (Mmax) at an altitude of 100 km under the propagation path midpoint was estimated to be 0.356, while the eclipse obscuration (Bm) was predicted to be 0.235.
Figure 4 shows that universal time dependencies of the Doppler spectra exhibiting diffuseness and occupying the frequency range from zero to 1.5–2.5 Hz were observed during the local morning on both the reference days and the day when the solar eclipse occurred. On 5 January 2019, the Doppler shift in the main (maximum energy) ray first increased, fluctuating from zero to 0.6 Hz at 00:30 UT, and then decreased to zero. The Doppler shift exhibited ∼ 4–5 min period (T) and 0.1 Hz amplitude (fDa) quasi-periodic variations over the 00:50–01:45 UT period. The Doppler spectra showed that virtually one ray was reflected from the ionosphere over the 01:00–03:00 UT period.
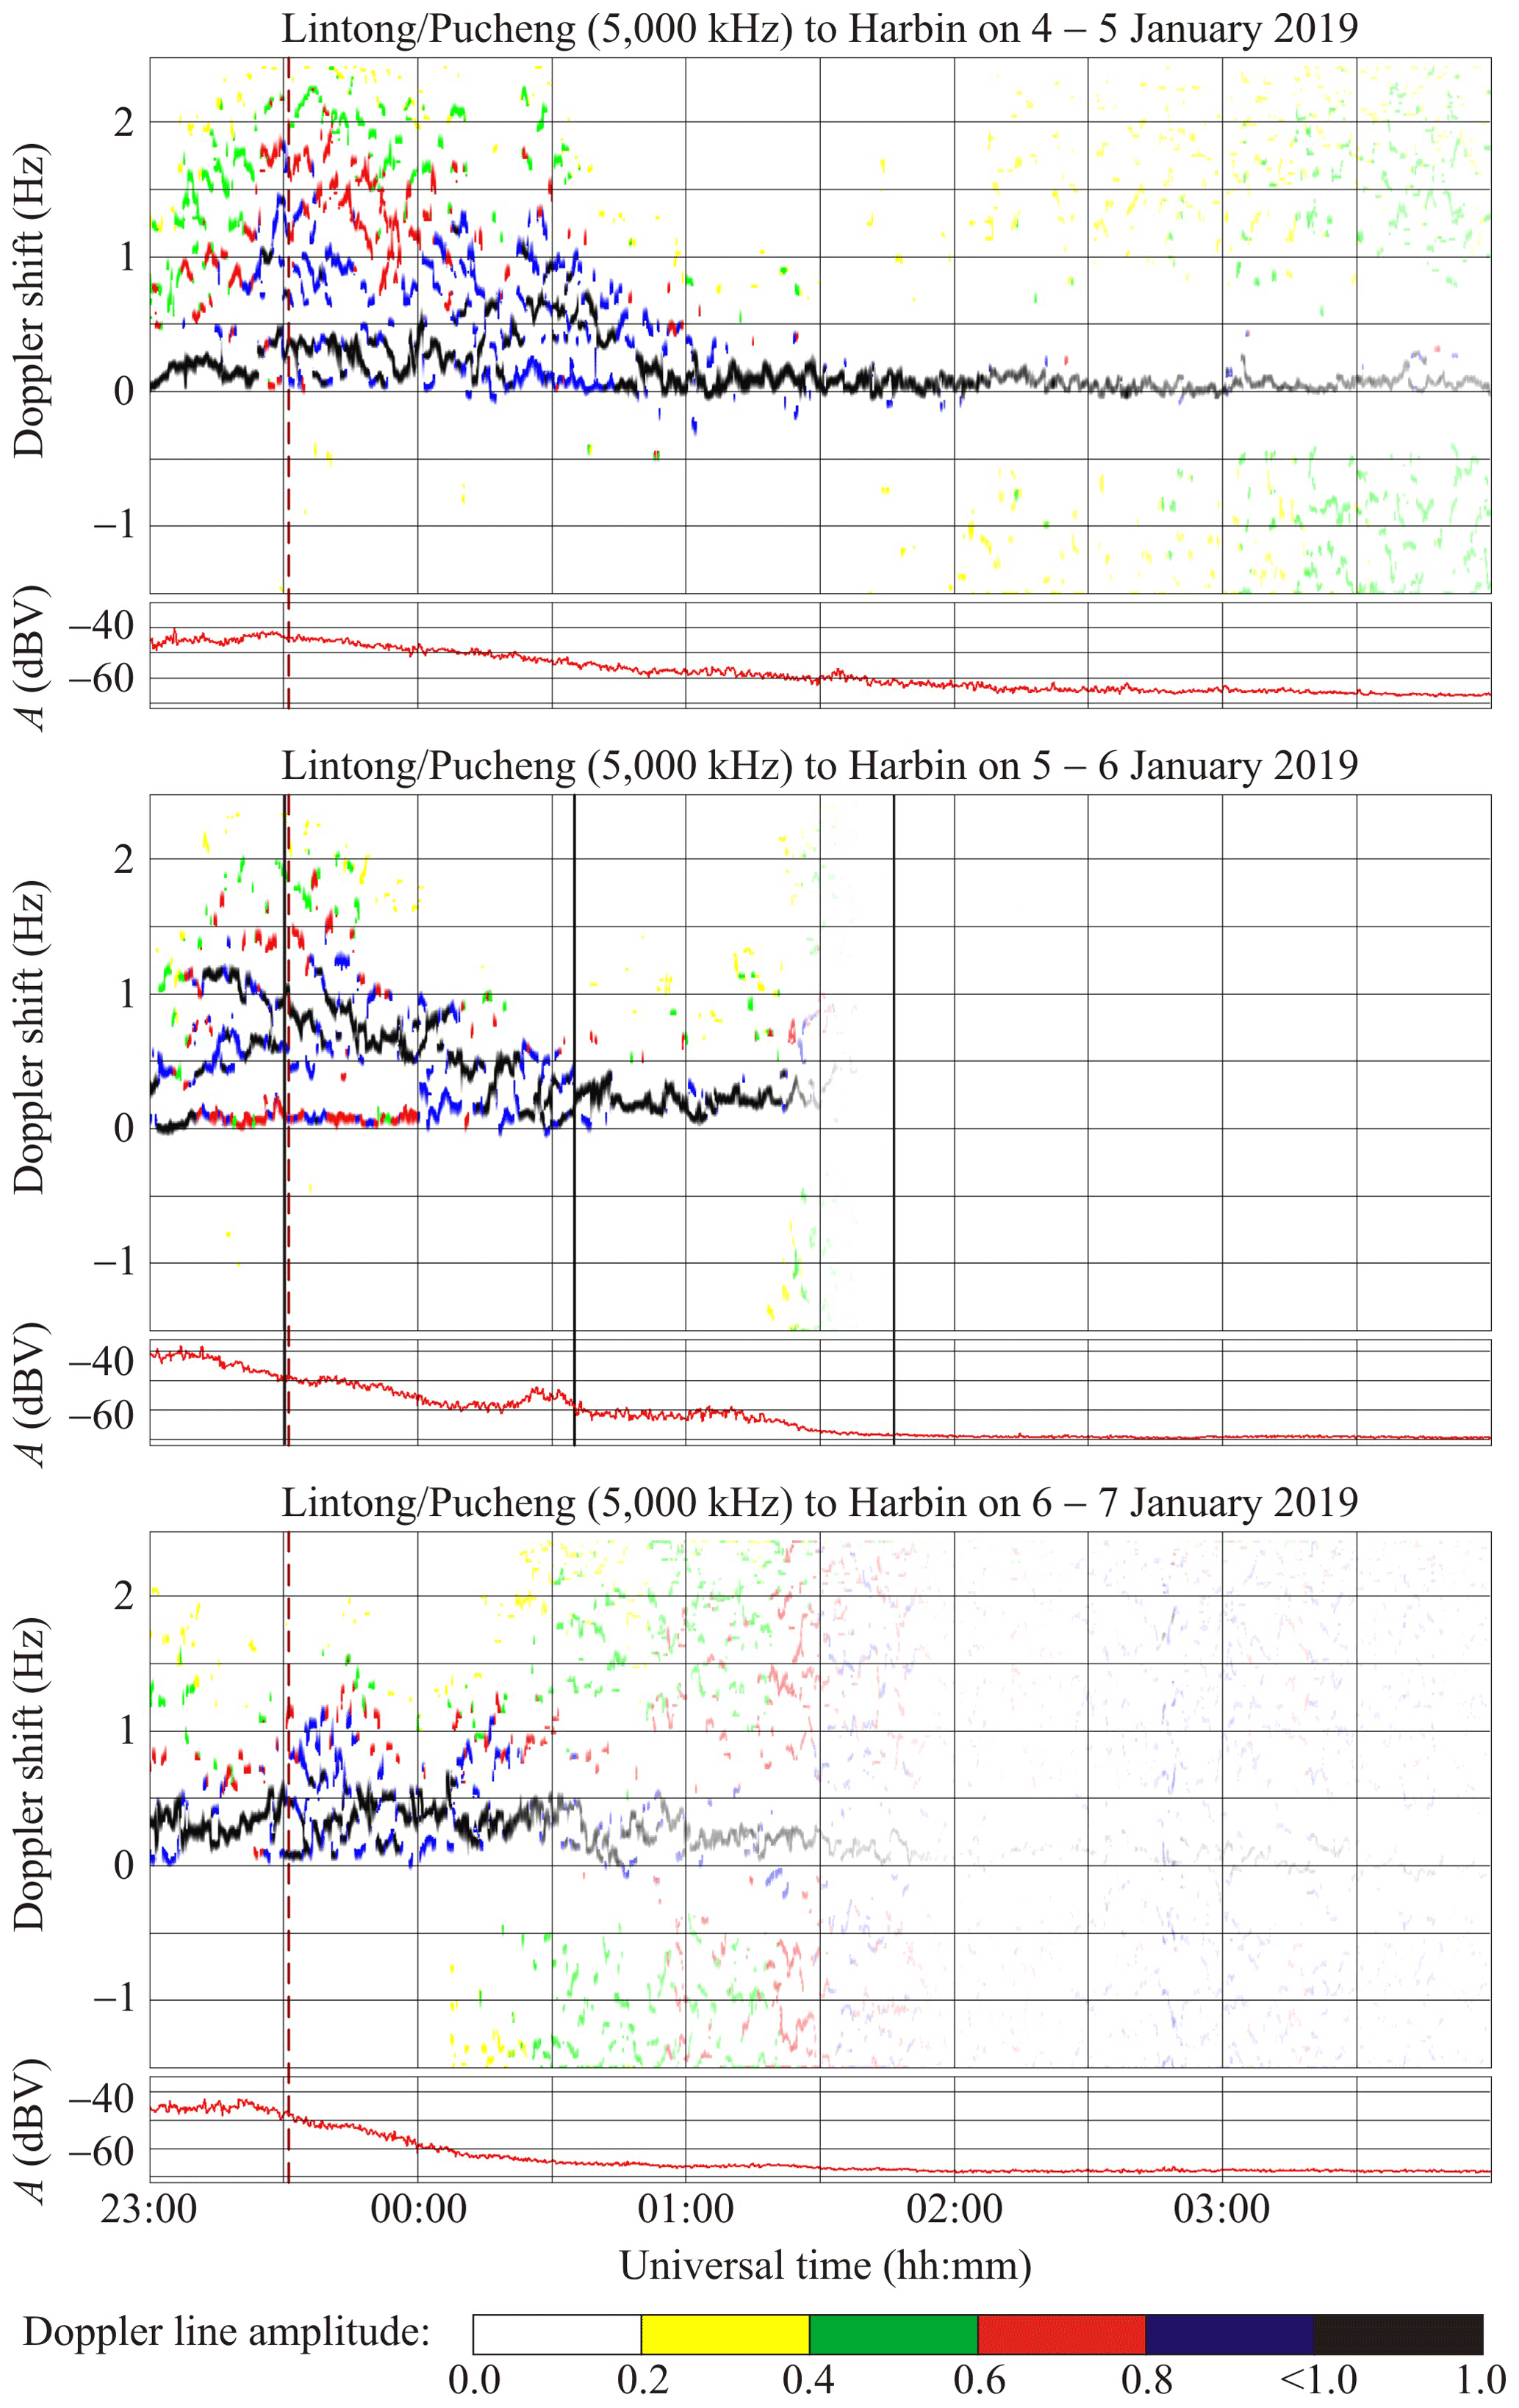
Figure 4Universal time variations of Doppler spectra and signal amplitude (A) along the Lintong/Pucheng to Harbin propagation path. The black–blue–red–green–yellow colors show the relative amplitude of 1, 0.8, 0.6, 0.4, and 0.2, respectively. The vertical solid lines indicate, hereafter, the beginning, maximum phase, and the end of the solar eclipse at 100 km altitude, while dashed lines indicate sunrise at ground level because the sunrise at 100 km altitude occurred beyond the UT axis range, i.e., before 23:00 UT.
On 7 January 2019, the Doppler-spectrum broadening did not exceed 1.5 Hz until 00:30 UT, and diffuseness exhibited an increase over the 00:30–02:00 UT period. The Doppler shift in the main ray exhibited variations from 0.3 to 0.5 Hz, with a quasi-period (T) of ∼ 25 min and amplitude (fDa) of 0.1 Hz.
On 5 January 2019, during the 23:00–23:45 UT period, the Doppler-spectrum broadening attained 2 Hz, while it did not exceed 1 Hz during the time interval from 23:45 UT on 5 January 2019 to 00:15 UT on 6 January 2019. After this time interval, the Doppler spectra showed that one ray was reflected from the ionosphere until 01:30 UT on 6 January 2019.
Before the solar eclipse onset, i.e., before approximately 23:30 UT on 5 January 2019, the mean () of the Doppler shift in the main ray was observed to be approximately 1.2 Hz. Over the time interval from 23:30 UT on 5 January 2019 to 00:35 UT on 6 January 2019, the mean () showed a tendency to decrease from 1 to 0.1 Hz, whereas –0.2 Hz to the end of the eclipse. The spectrum of fluctuations in fD(t) showed oscillations with a period (T) of ∼ 10–15 min and amplitude (fDa) of 0.1 Hz.
On the reference days, the signal amplitude (A) exhibited monotonous changes, viz., the amplitude decreased by 25 dBV as the ionosphere went out of and into sunlight. On 6 January 2019, from 00:22 UT until 00:37 UT, i.e., around the maximum phase of the eclipse, the signal amplitude first showed an increase by 7 dBV and then a decrease close to the previous value.
6.2 Chiba/Nagara to Harbin radio-wave propagation path
This radio station, operating at 6055 kHz, is situated in Japan at a great-circle distance (R) of ∼ 1610 km from Harbin. At the middle of the propagation path, Mmax ≈ 0.483 and Bm ≈ 0.362.
During the night of 4–5 January 2019 from 23:00 to 01:30 UT, the Doppler spectra exhibited diffuseness (Fig. 5), whereas the spectrum width attained 1.3 Hz. During the 01:30–03:40 UT period, the Doppler spectra showed a single ray reflecting from the ionosphere, and the Doppler shift in the main ray exhibited variations from zero to 0.6 Hz. During the reference period of 6–7 January 2019, the Doppler spectra showed the following behavior: from 23:00 to 01:30 UT, the Doppler-spectrum diffuseness was observed, whereas spectrum broadening attained 1 Hz, and the spectra showed that virtually a single ray was reflected from the ionosphere after 01:30 UT. The ∼ 5–7 min period (T) and ∼ 0.10–0.15 Hz amplitude (fDa) oscillations were observed in the spectrum of fD(t) in the main ray.
During the night of 5–6 January 2019, from 23:00 to 01:50 UT, the Doppler spectra showed diffuseness, whereas the fD values exhibited high temporal variability from −(1–1.5) Hz to (1–1.2) Hz. After the solar eclipse onset, the width of the Doppler spectrum varied within the 0.5 Hz limits. From 01:00 UT, it occupied the range from −1.5 to 1.2 Hz again, whereas the temporal dependence of the Doppler shift in the main ray showed gaps. The showed a tendency to decrease from 0.5 to −0.3 Hz within the interval of 23:00 to 00:30 UT. It then fluctuated around zero over the period 00:30–01:00 UT, after which the exhibited a tendency to increase from 0 to 0.6 Hz over a 30 min interval, i.e., until 01:30 UT. Around the maximum phase of the eclipse, the ∼ 10 min period (T) and ∼ 0.10–0.15 Hz amplitude (fDa) oscillations were observed, while the signal amplitude exhibited an increase up to 5 dBV over about a 20 min interval. Similar effects were absent on the reference days.
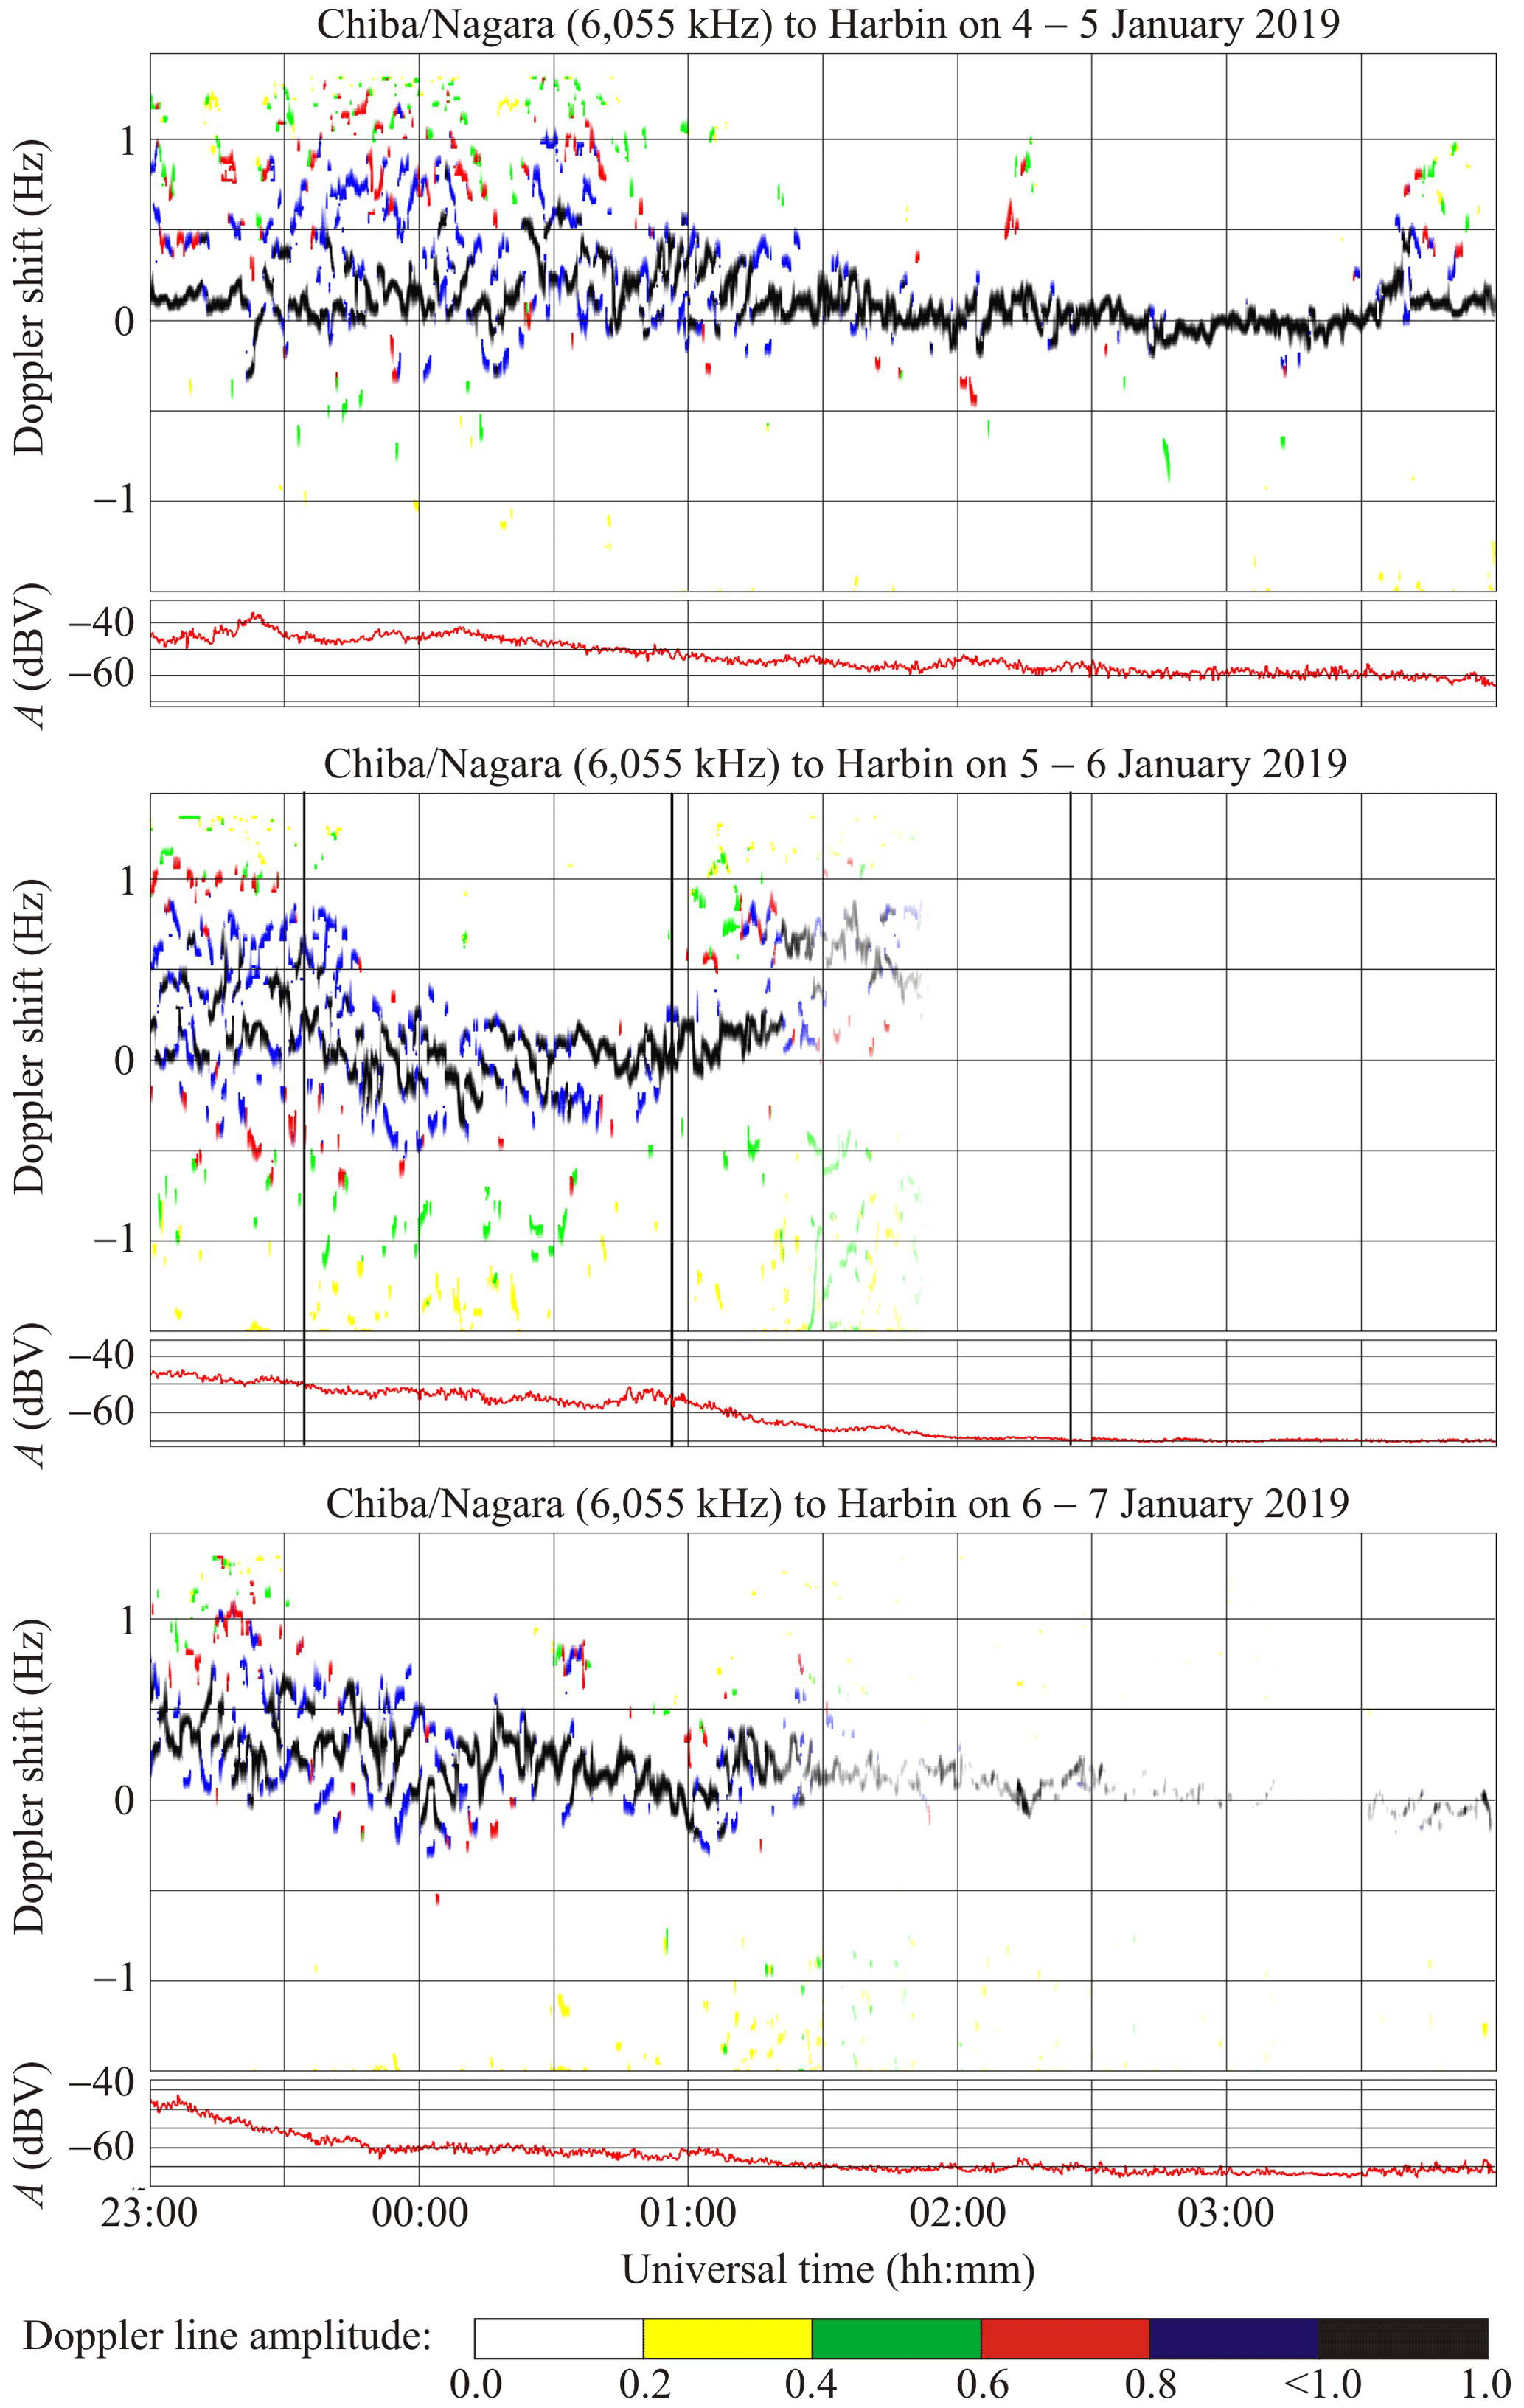
Figure 5The same as in Fig. 4 but for the Chiba/Nagara to Harbin radio-wave propagation path.
6.3 Ulaanbaatar to Harbin radio-wave propagation path
This radio station, operating at 7260 kHz, is located in Mongolia at a great-circle range (R) of ∼ 1496 km from Harbin. The solar eclipse magnitude (Mmax) at an altitude of 100 km under the midpoint of this propagation path is estimated to be ∼ 0.457, while the eclipse obscuration (Bm) is predicted to be ∼ 0.335.
During the night of 4–5 January 2019, from 23:00 to 01:00 UT and from 01:50 to 02:50 UT, the Doppler spectra exhibited considerable broadening, from −1.5 to 1.5 Hz (see Fig. 6). The Doppler shift in the main ray showed a time-fluctuating decrease from 1 Hz observed at the end of 4 January 2019 to zero on 5 January 2019, while the range of fluctuations attained 0.20–0.25 Hz.
Consider the behavior of the Doppler spectra during the transition from 6 to 7 January 2019. On 6 January 2019, from about 23:20 to 24:00 UT, the spectra showed diffuseness and occupied the band of frequency from −(1–1.5) to 1.5 Hz, while the main ray showed fluctuations around −1 Hz. On 7 January 2019, after 00:00 UT, a sharp increase in the Doppler shift took place from −1 to 0.5 Hz, a decrease in fD(t) was then noted from 0.5 to 0 Hz while the fD(t) exhibited fluctuations within the 0.2 Hz limits.
The Doppler spectra showed broadening before the solar eclipse onset, whereas the range of fluctuations in fD(t) was observed to be close to 0.2 Hz. The transmitter was out of operation over the 00:05–00:50 UT period on 6 January 2019; after 00:50 UT, the Doppler spectra showed that virtually a single ray was reflected from the ionosphere, and the fD(t) showed a tendency of first increasing to 01:15 UT and then decreasing from 0.8 to 0.2 Hz at 03:00 UT.
During all days, the signal amplitude exhibited fluctuations within the 10 dBV limits. Effects of the solar eclipse were not observed reliably in the signal amplitude.
6.4 Shijiazhuang to Harbin radio-wave propagation path
This transmitter, operating at 9500 kHz, is situated in the PRC at a great-circle range (R) of ∼ 1310 km from the receiver at Harbin. The solar eclipse magnitude (Mmax) at an altitude of 100 km under the midpoint of this propagation path is estimated to be ∼ 0.408, while the eclipse obscuration (Bm) is predicted to be ∼ 0.285.
During the night of 4–5 January 2019, from 23:20 to 00:30 UT, the Doppler spectra were observed to broaden, from 0 to 1.5 Hz (see Fig. 7), while from 23:40 to 01:00 UT, the Doppler shift in the main ray showed a decrease from 0.25 to 0 Hz. During the night of 6–7 January 2019, from 23:30 to 04:00 UT, the Doppler spectra showed that a single ray was reflected from the ionosphere, while the fD(t) exhibited a decrease, fluctuating from 0.3 to 0.1 Hz.
During the local day, when the solar eclipse occurred, the Doppler spectra and the Doppler shifts were notably different from those observed on the reference days. During the night of 5–6 January 2019, until 23:30 UT, the fluctuations in fD(t) were insignificant since the radio waves were reflected from the sporadic E layer, whereas from 23:30 to 01:00 UT the radio waves were reflected from the F region, and consequently, the fD(t) were observed to fluctuate widely, from 0.4 to −0.2 Hz. The showed a tendency to decrease quasi-periodically from 0.4 to 0.2 Hz over the 23:30–24:00 UT period, with the ∼ 10–15 min period (T) and ∼ 0.1 Hz amplitude (fDa) variations being superimposed on the .
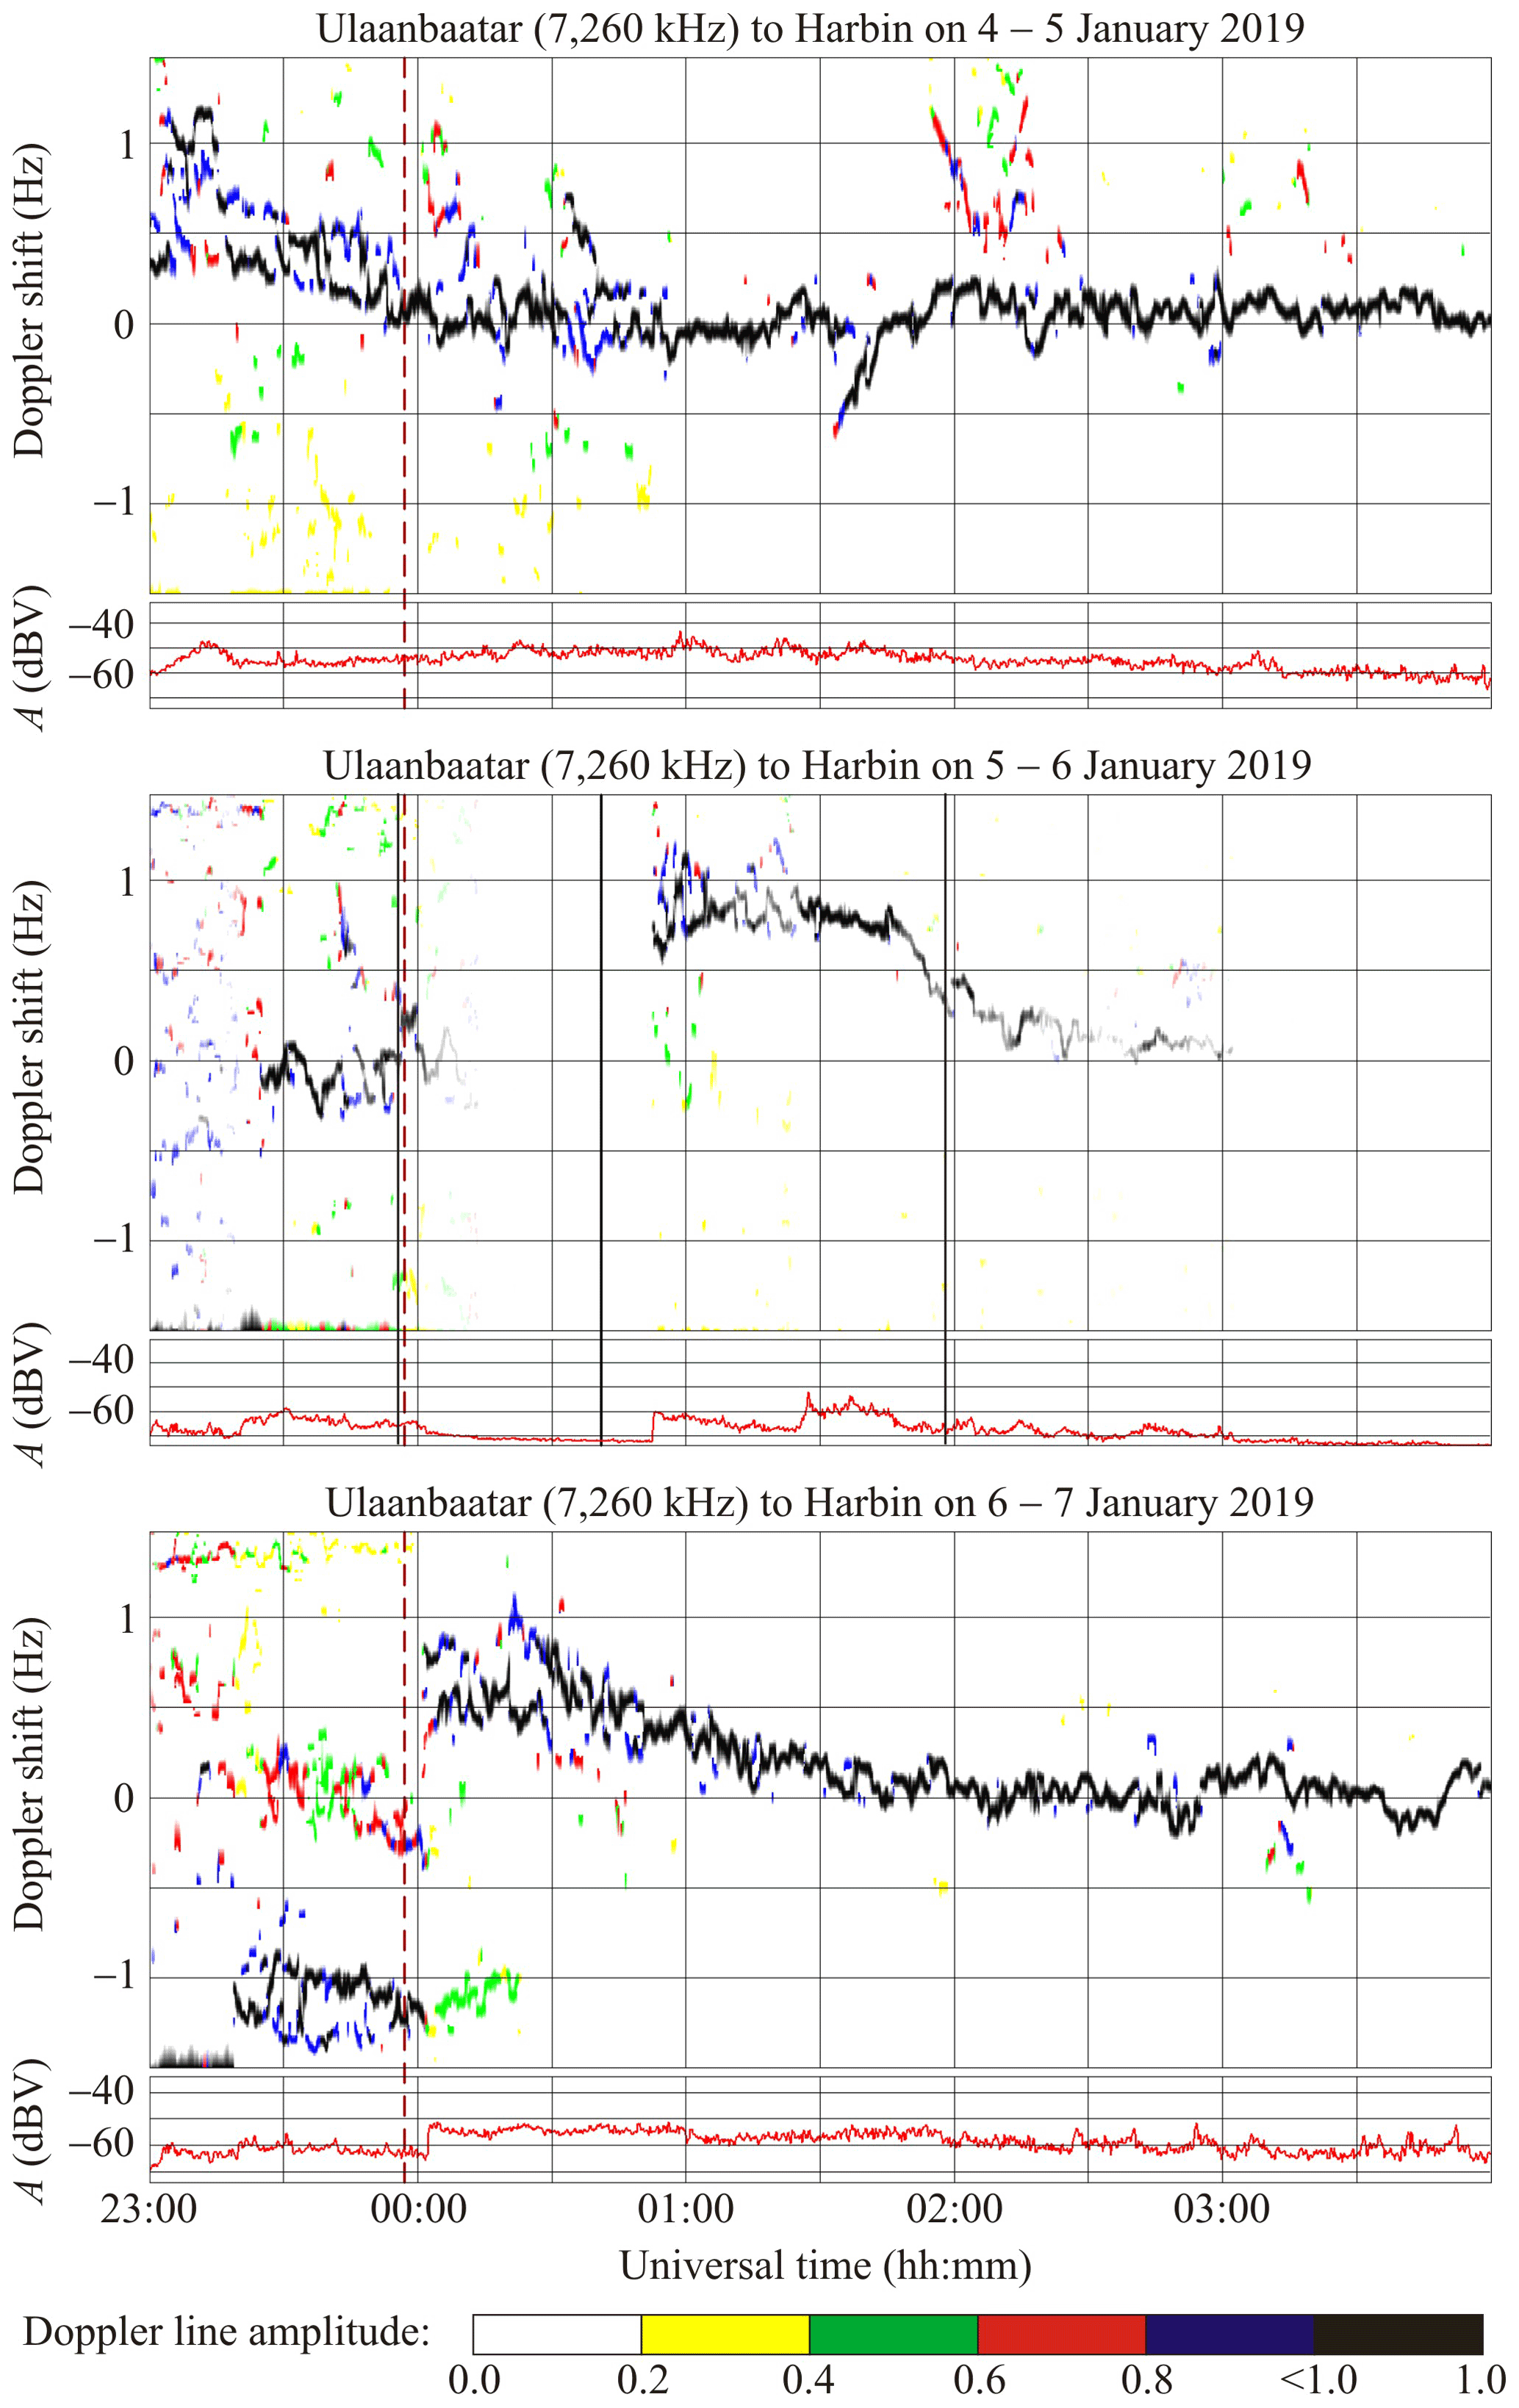
Figure 6The same as in Fig. 4 but for the Ulaanbaatar to Harbin radio-wave propagation path.
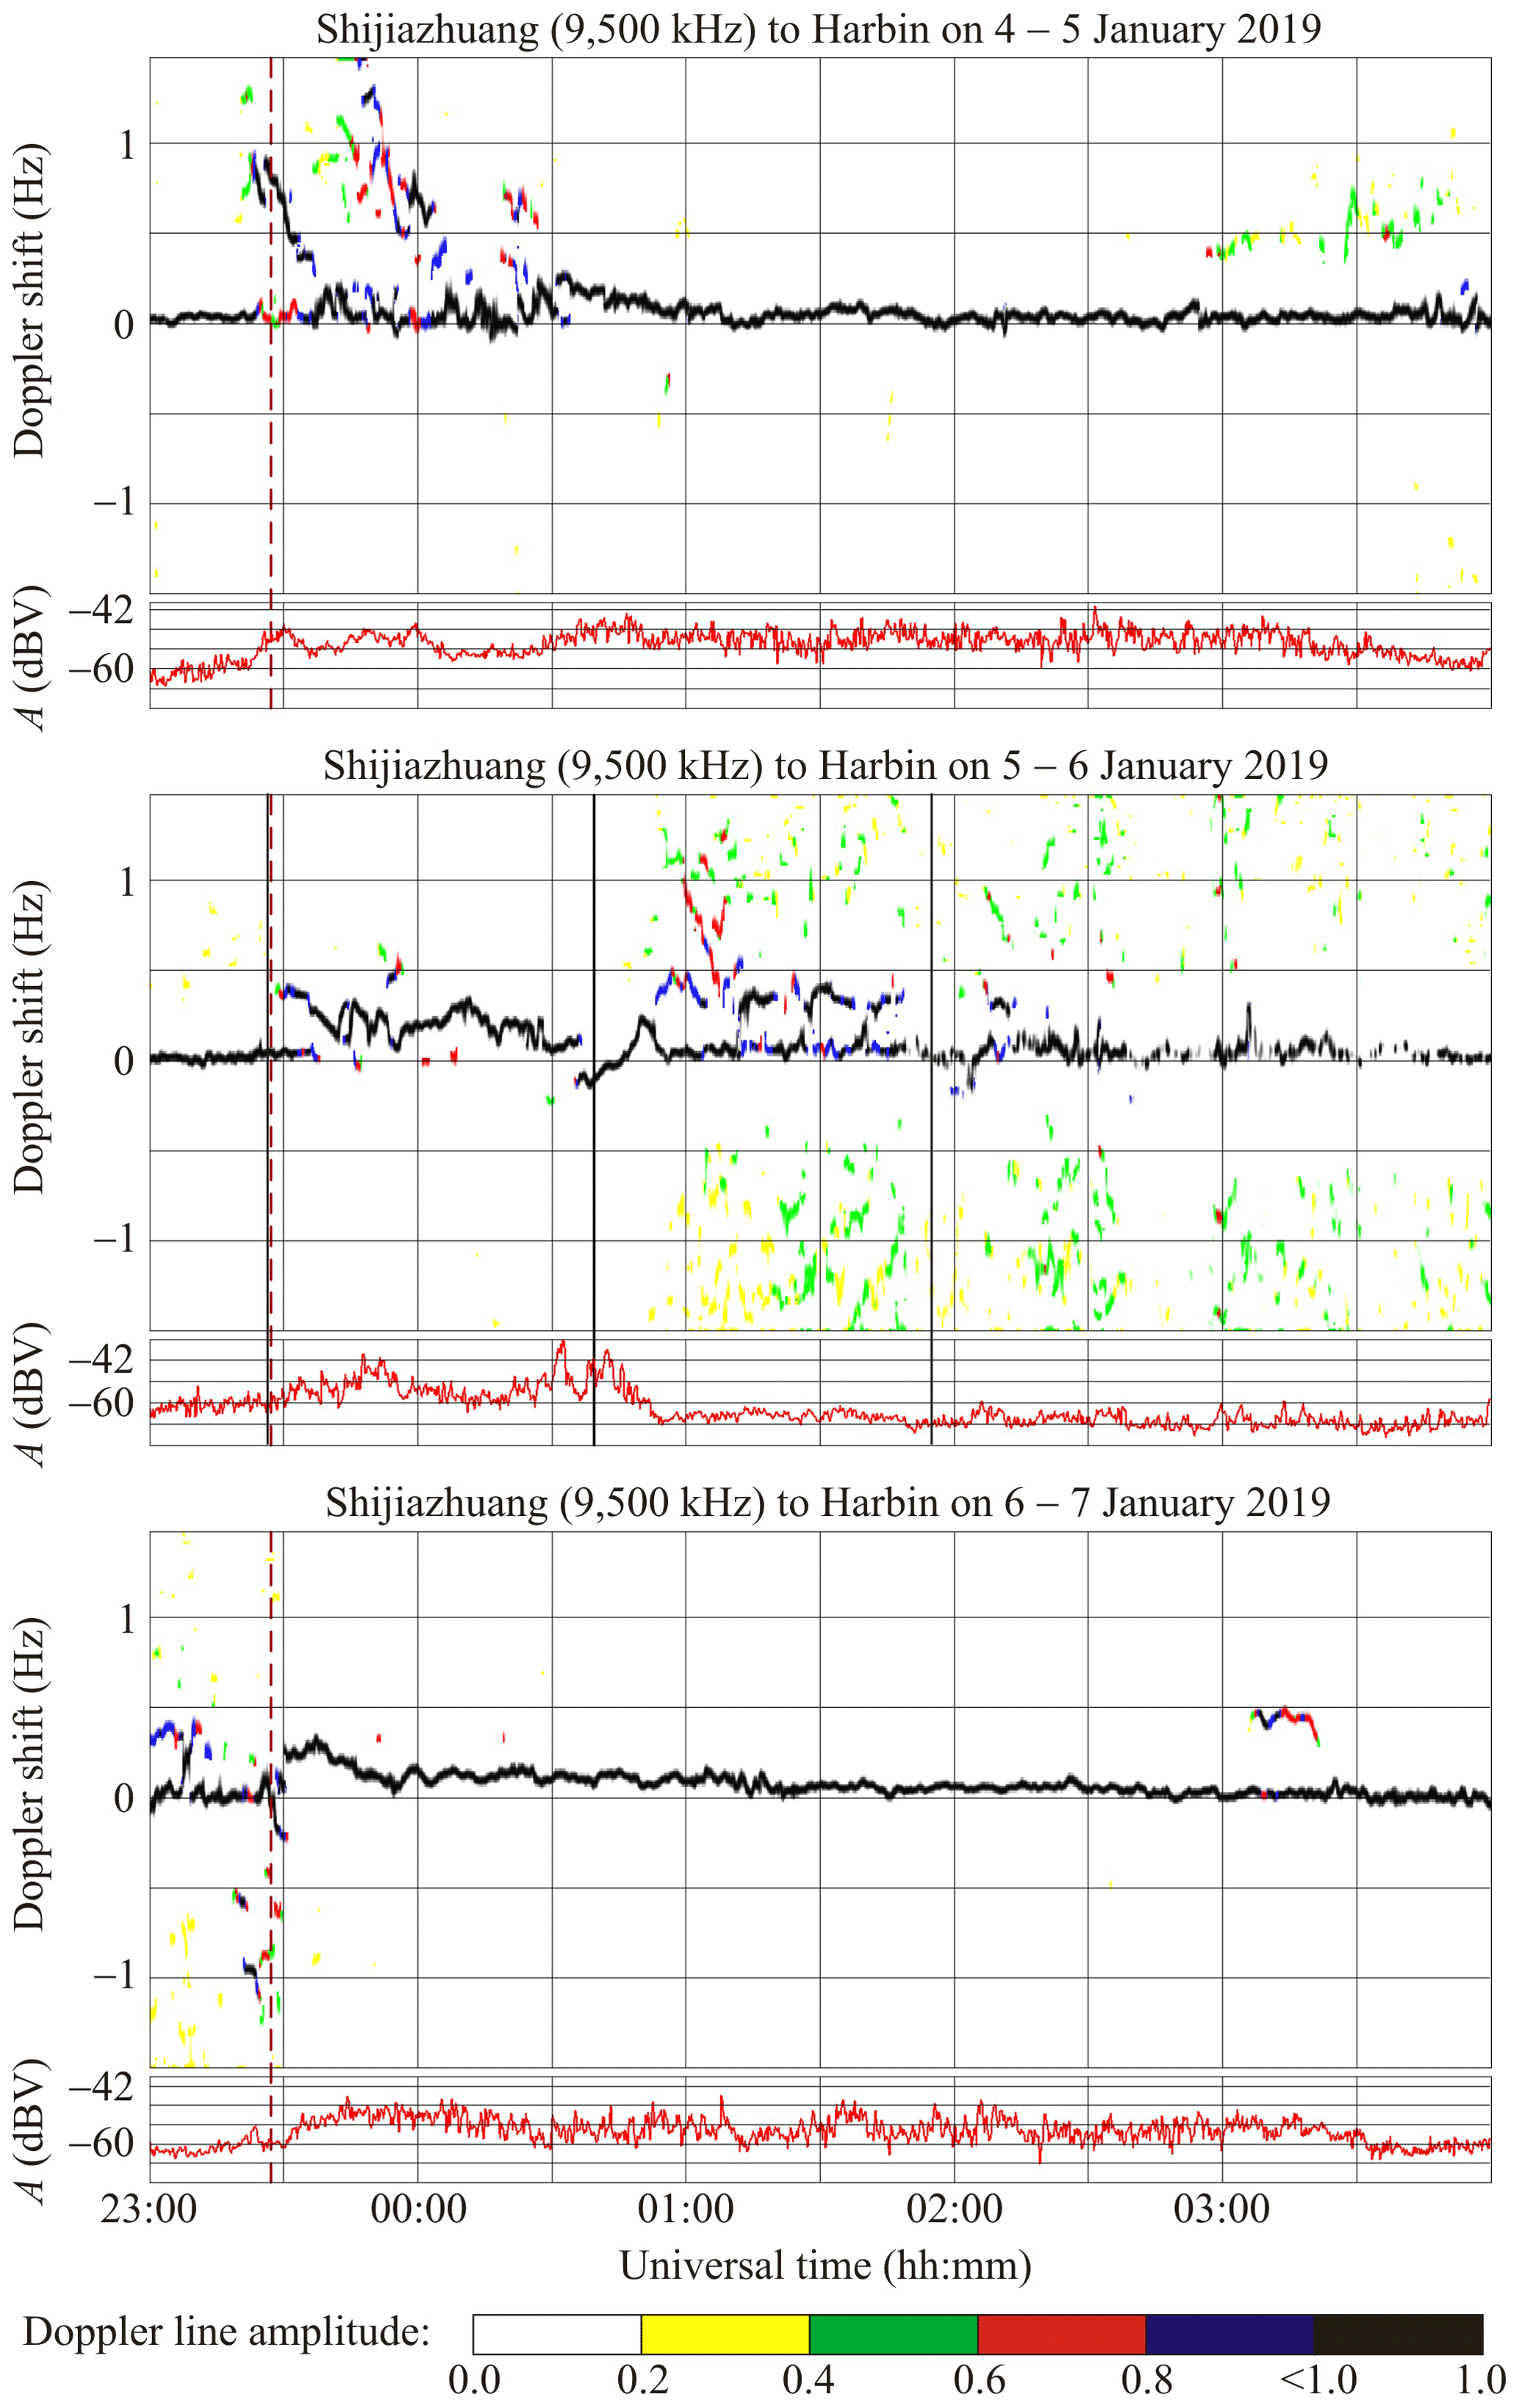
Figure 7The same as in Fig. 4 but for the Shijiazhuang to Harbin radio-wave propagation path.
On 6 January 2019, from 00:00 to 00:30 UT, Hz. Around the instant of the greatest occultation of the Sun's area, Hz, after which the was observed to grow from nearly zero to 0.25 Hz in 15 min; thereafter the exhibited a decrease from 0.25 Hz to zero. A partial screening of reflections from the F layer by the sporadic E layer was noted after about 00:55 UT on 6 January 2019, whereas a significant (from −1.5 to 1.5 Hz) broadening appeared in the Doppler spectra. Two Doppler lines, with Hz and Hz, were the more conspicuous lines in the Doppler spectrum within the 00:50–01:45 UT period on 6 January 2019.
The signal strengths exhibited high temporal variability (up to 12 dBV) along this propagation path during the reference days, whereas during the night 5–6 January 2019, from 23:35 to 00:40 UT, i.e., around the instant of greatest eclipse, variations in A(t) attained 18 dBV.
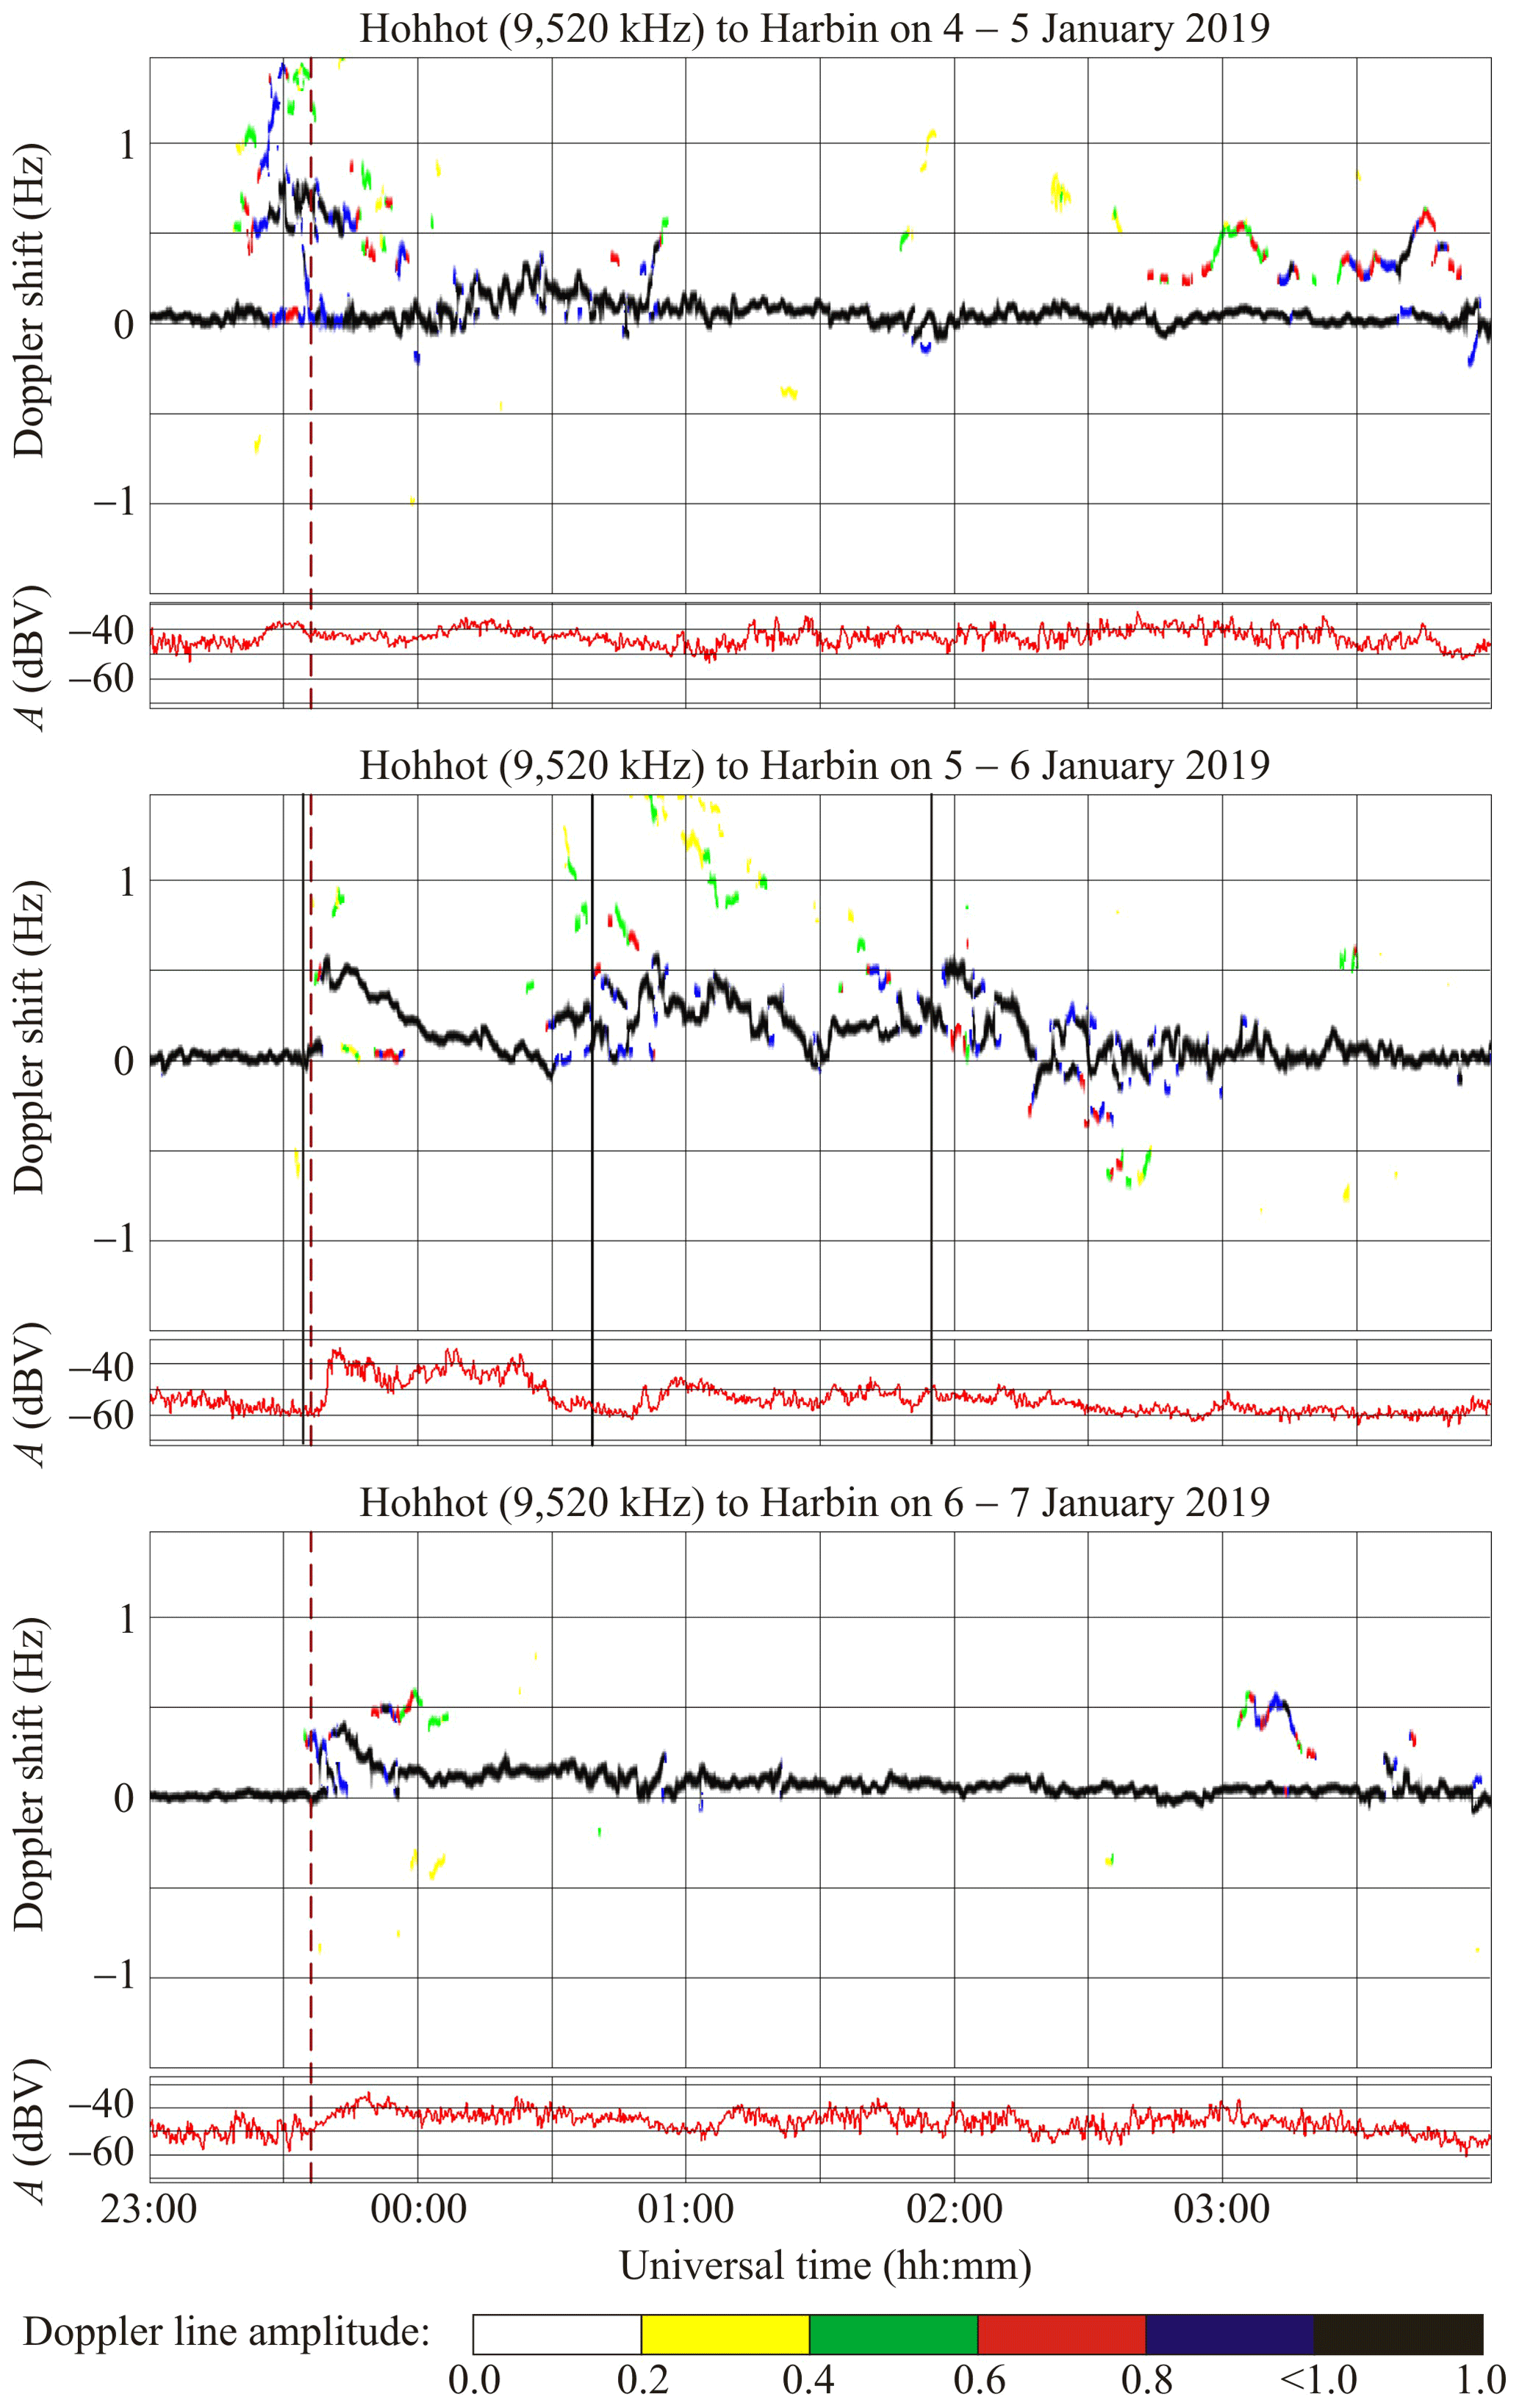
6.5 Hohhot to Harbin radio-wave propagation path
This propagation path at ∼ 9520 kHz passes in the PRC over the great-circle path length (R) of ∼ 1340 km. At the transmitter location, Mmax ≈ 0.416 and Bm ≈ 0.293.
During the course of the 4–5 January 2019 night, the Doppler spectra showed that a single ray was reflected almost all the time from 23:40 to 04:00 UT (Fig. 8). The spectrum broadening from 0.5 to 1.5 Hz was only observed over the 23:20–23:55 UT period. The Doppler spectra showed that two rays were reflected from the ionosphere over the 02:45–03:50 UT period, whereas the fD(t) was observed to exhibit high temporal variability from 00:00 to 01:00 UT. During the night of 6–7 January 2019, the Doppler spectra showed that only a single ray was reflected from the ionosphere virtually all the time from 23:00 to 04:00 UT, whereas the fD(t) exhibited high temporal variability over the 23:40–01:00 UT period.
The equality ( Hz) was observed to hold during the night of 5–6 January 2019 before the solar eclipse, when the radio wave began reflecting from the ionospheric F region. The Doppler shift exhibited a decrease from 0.5 to 0.1 Hz during the following 30 min, and during the time interval until 00:30 UT, the showed a decrease from 0.1 to 0 Hz. The fD(t) exhibited high (from 0.5 to 0 Hz) temporal variability over the 00:30–02:30 UT period, after which the range of fluctuations did not exceed 0.2 Hz. The ∼ 15 min period (T) and ∼ 0.10–0.15 Hz amplitude (fDa) Doppler lines were noted during the solar eclipse.
During the course of the solar eclipse on the night of 5–6 January 2019 at 23:40–00:25 UT, the signal amplitude exhibited an increase by 20–25 dBV, whereas the increase shown by A on the reference days did not exceed 10–15 dBV.
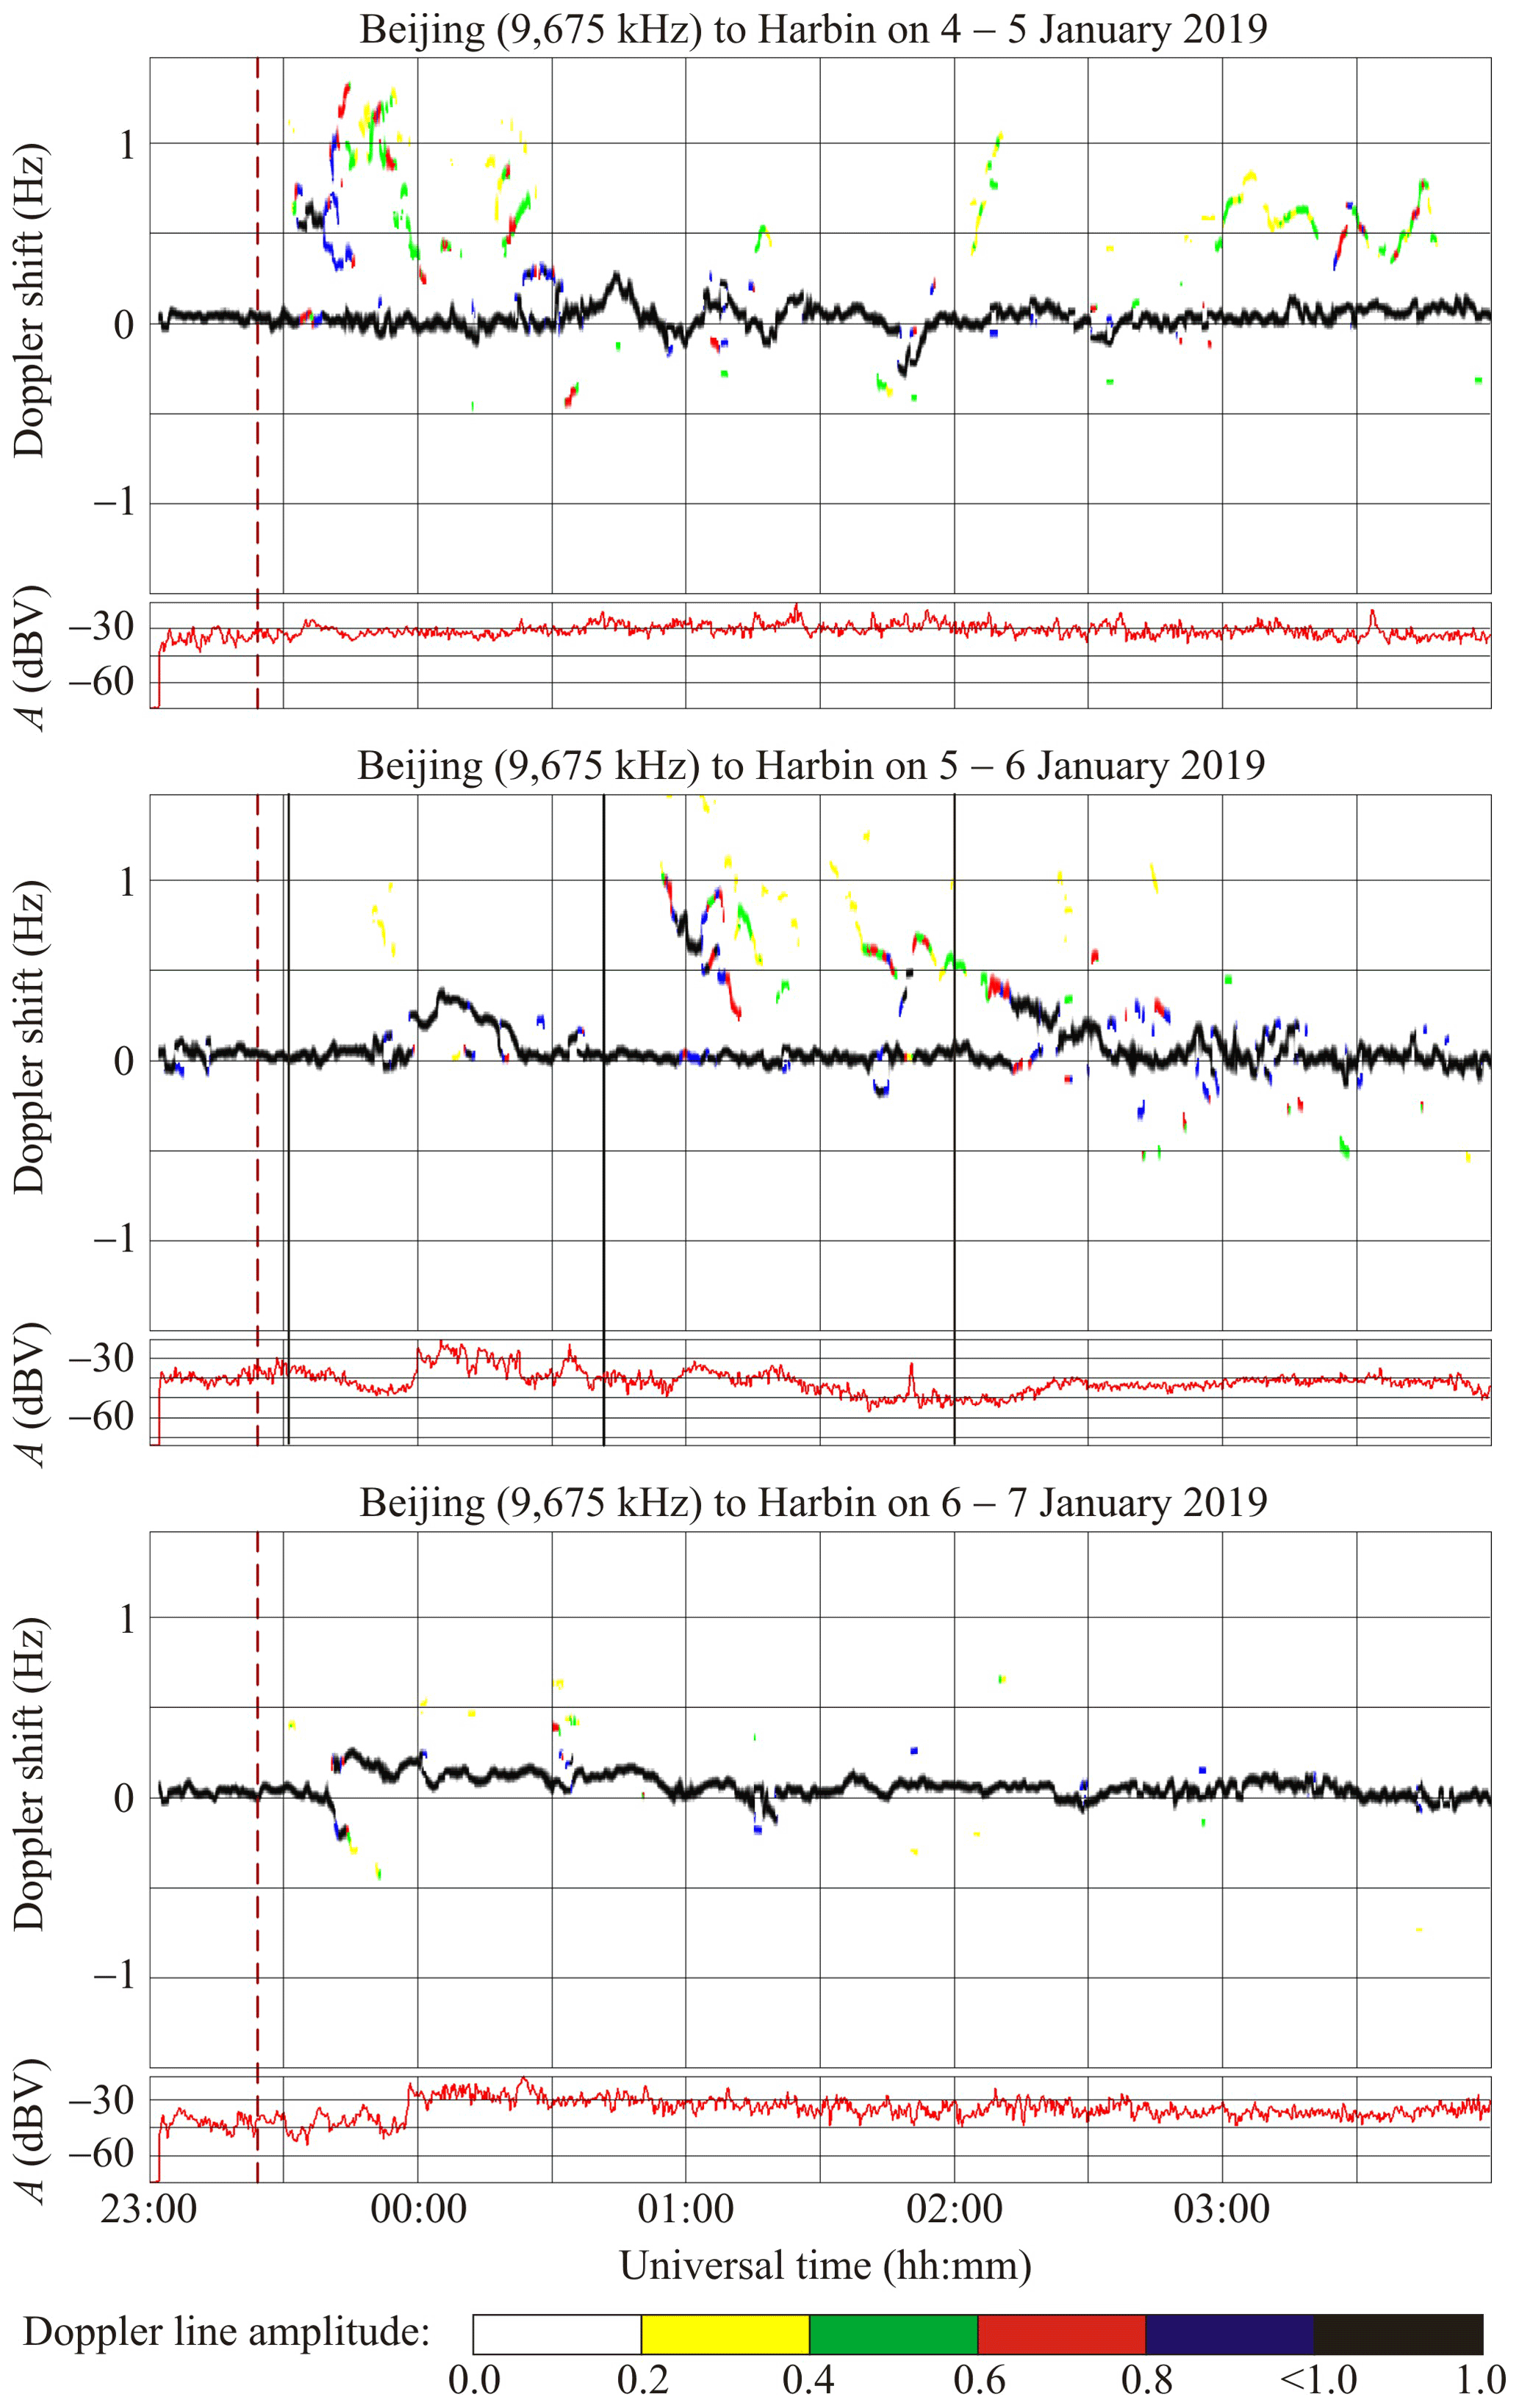
6.6 Beijing to Harbin radio-wave propagation path
This radio station operates at 9675 kHz and is located in the PRC at a great-circle range (R) of ∼ 1050 km from the receiver at Harbin. The solar eclipse magnitude (Mmax) at the location of the transmitter is estimated to be ∼ 0.430, while the eclipse obscuration (Bm) is predicted to be ∼ 0.307.
Figure 9 shows that the Doppler shift trend until 00:30 UT on the night of 4–5 January 2019. The Doppler shift exhibits quasi-periodic variations with an ∼ 20 min period (T) and an ∼ 0.15 Hz amplitude (fDa) over the 00:30–02:00 UT period. The Doppler spectra show that single rays are reflected from the ionosphere almost all the time, whereas the Doppler spectra exhibited broadening only during the periods of 23:35 and 00:25 UT. During the night of 6–7 January 2019, the Doppler spectra showed that single rays were reflected from the ionosphere. The fD(t) exhibited quasi-periodic variations with an amplitude of about 0.1 Hz and a period changing from 15 to 20 min over the 23:45–01:45 UT period.
Consider the time interval around the solar eclipse on the night of 5–6 January 2019 night. The trend until 23:50 UT. It then showed an increase from zero to 0.4 Hz, followed by a decrease to zero over the 23:50–00:20 UT period. The ∼ 4–5 min period (T) and ∼ 0.05 Hz amplitude quasi-periodic variations were noted in fD(t) over the 00:42–02:15 UT period. In addition, other Doppler lines (0.5–1 Hz) apart from the main line were observed over the 00:55–03:00 UT period.
The signal amplitude showed variability within the 3–5 dBV limits on the reference days, whereas it exhibited an increase to 10–20 dBV during the course of the solar eclipse.
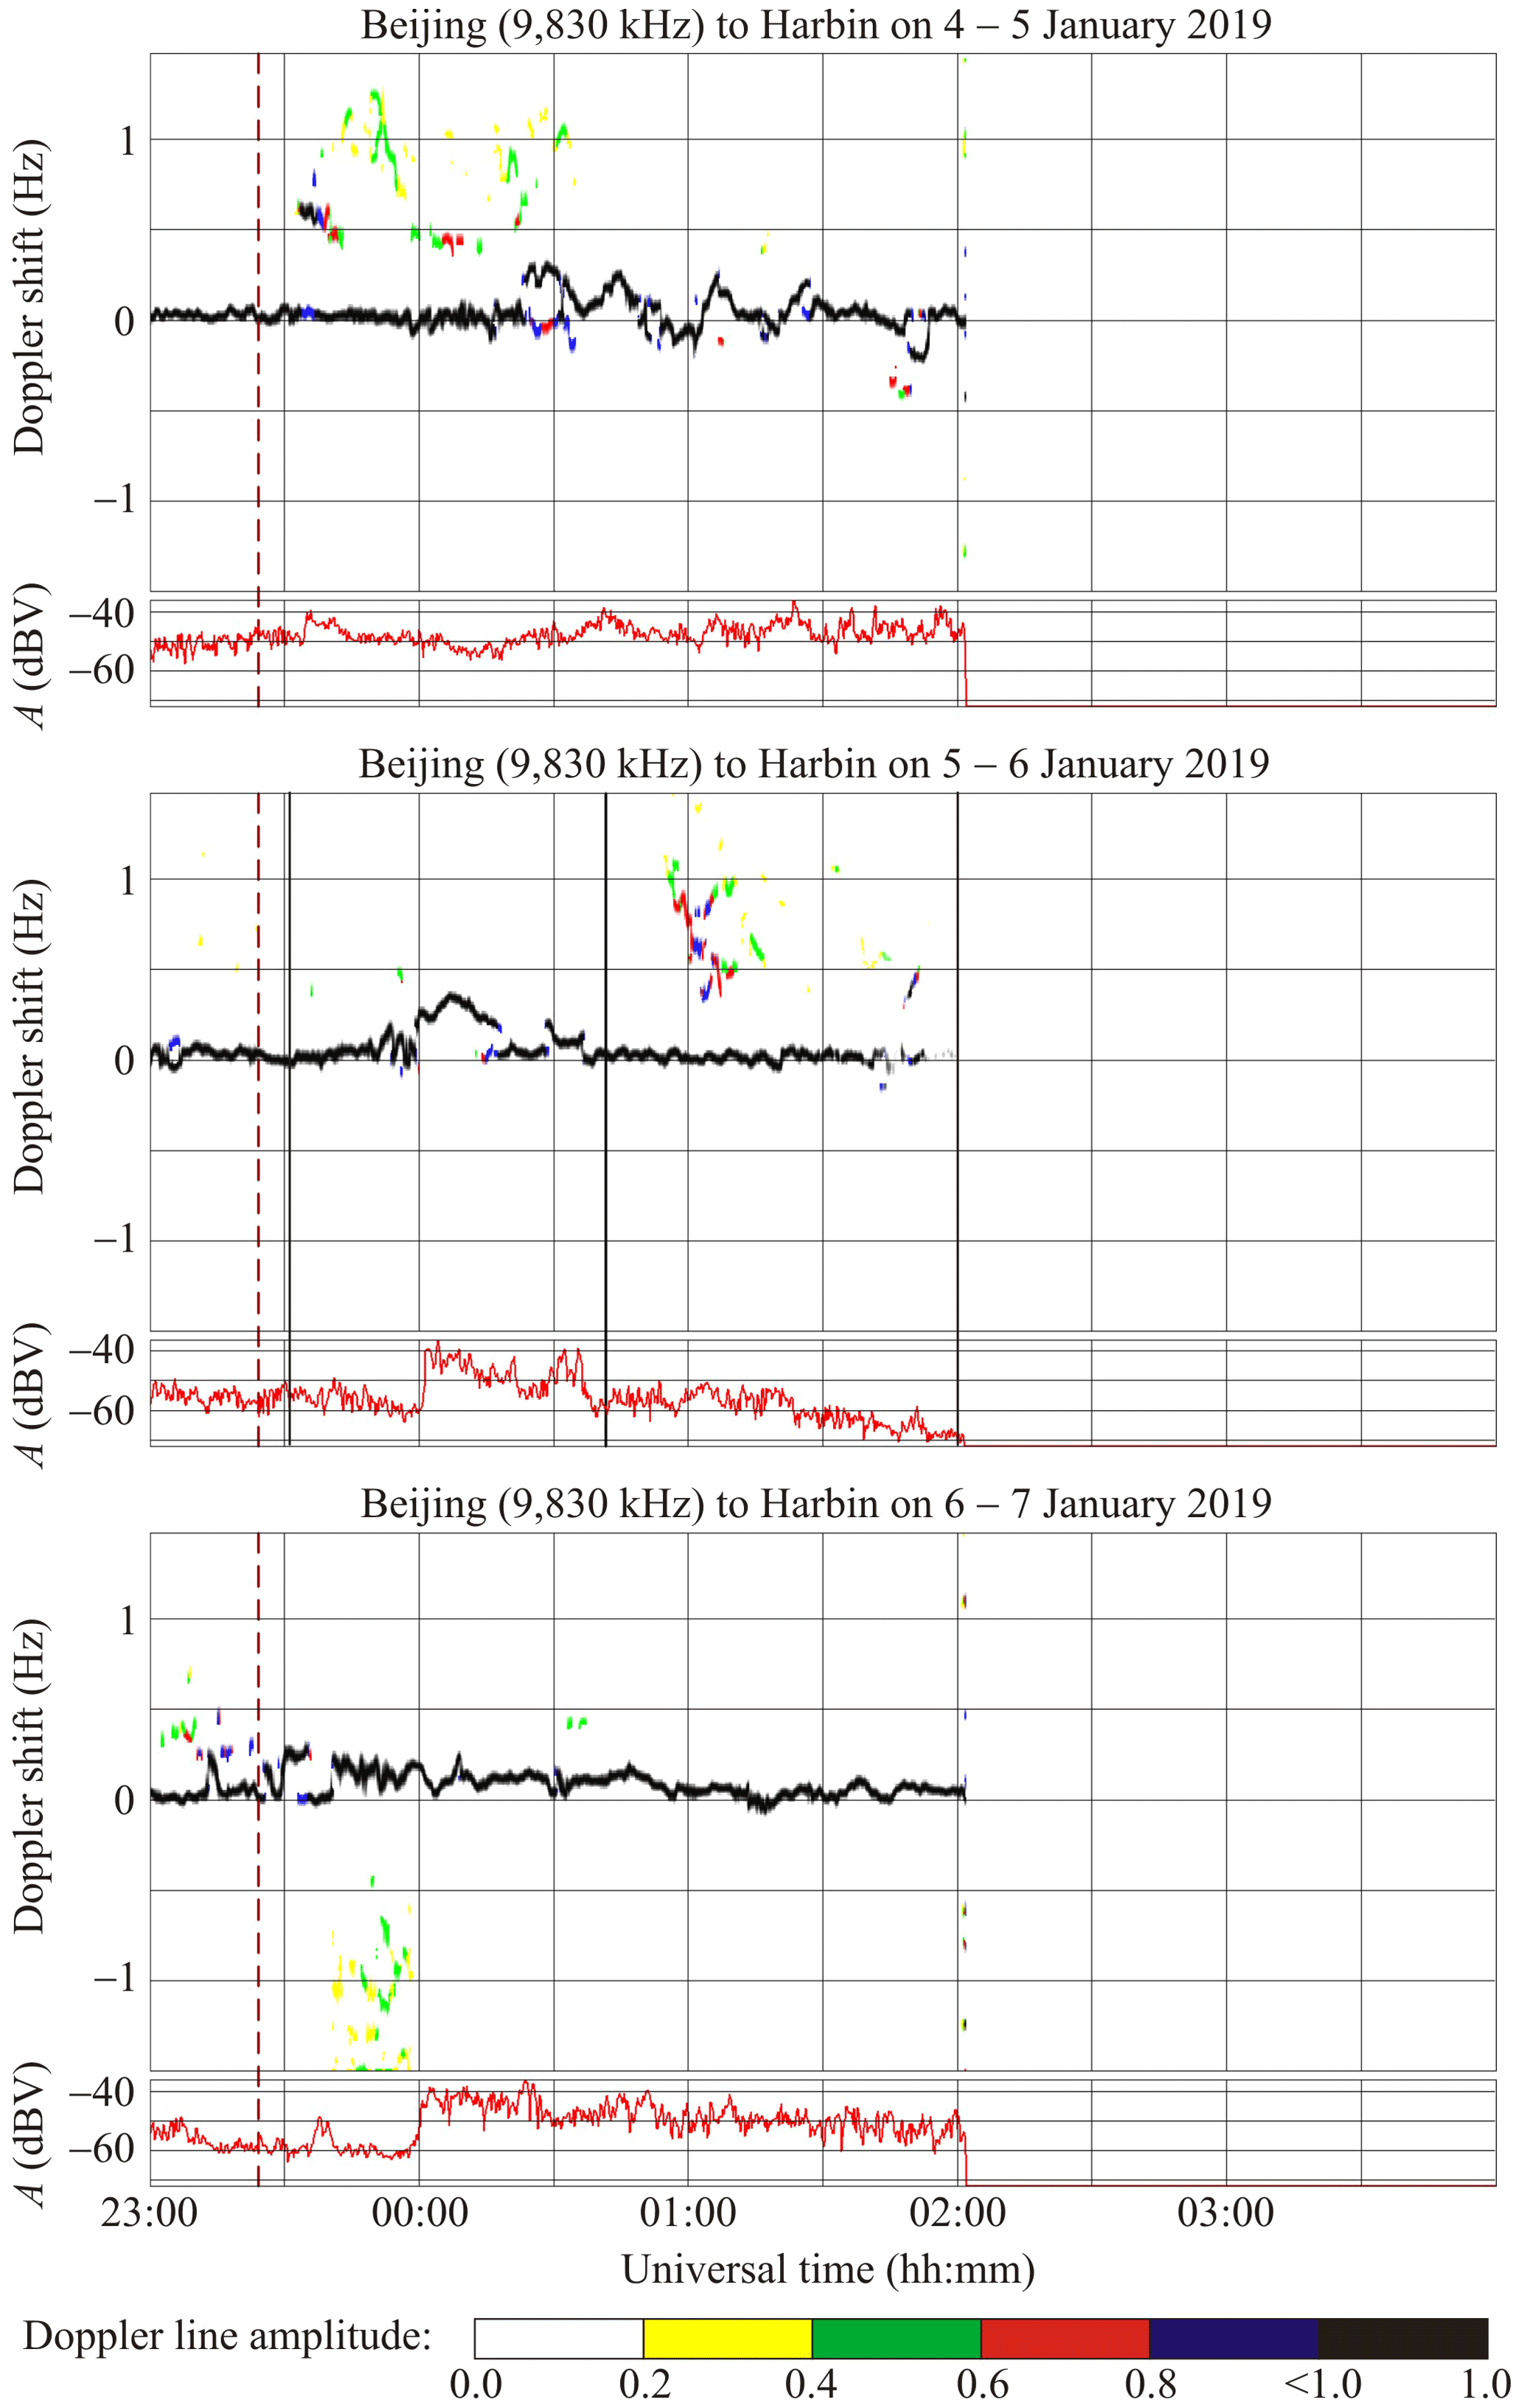
6.7 Beijing to Harbin radio-wave propagation path
This radio station, broadcasting at 9830 kHz, occupies the same site as the radio station broadcasting at 9675 kHz; since the operating frequencies are close to each other, all effects observed at these two frequencies are similar, as can be seen in Fig. 10.
7.1 Effects from solar eclipses
Solar eclipses are well known for having the capability to cause significant variations in the parameters of both the medium and geophysical fields in all subsystems of the EAIM system (see, e.g., Chernogor, 2003, 2011, 2013a; Chernogor and Rozumenko, 2008). Solar eclipses act to notably cool the air and ground surface, to decrease the air pressure, etc. The plasma parameters and dynamics in the ionosphere show significant changes: the electron density decreases, the ion and electron temperatures reduce, the rates of chemical reactions alter, the settled coupling between the ionosphere and the plasmasphere becomes disturbed, the precipitation of energetic electrons is made possible from the magnetosphere into the atmosphere causing additional ionization (Chernogor, 2013a). Özcan and Aydoğdu (2004), and Chernogor (2012, 2013a) also describe the effects of solar eclipses in the geomagnetic field.
The regular effects of solar eclipses may be regarded as quite well known, whereas irregular effects and their influence on the propagation of radio waves in various frequency bands have been studied to a lesser degree. On the one hand, the irregular effects in the EAIM system are associated with the generation of different kinds of instability in the atmosphere and in its ionized components, turbulence production in these media, and the amplification and generation of the waves of various nature (infrasound, atmospheric gravity waves, magnetohydrodynamic waves, etc.). On the other hand, the irregular effects significantly depend on the subsystem perturbation in the EAIM system, the state of atmospheric and space weather, season, local time, the phase of the solar eclipse, and on the geographic coordinates of the observation site. The scientific studies conducted for many years have shown that the responses of the subsystems in the EAIM system to the solar eclipses, occurring over the period from the end of the twentieth century to the beginning of the twenty-first century, have never been the same (Chernogor, 2013a).
7.2 Basics of the variations in the Doppler shift during solar eclipses
It is known that for a plane stratified isotropic ionosphere, the Doppler shift is given by (see, e.g., Davies, 2008)
where f is the frequency, c is the speed of light, t is time, n is the refractive index, ds=sec ϑdz is the path element, ϑ(z) is the angle that the ray makes with the vertical, and zr is the altitude of reflection.
Taking into account the dependence
in Eq. (1) yields
where N is the electron density, χ(t) is the solar zenith angle, B = is eclipse obscuration, S0 is the Sun's surface area, S(t) is the Sun's surface area occulted by the Moon. Equation (2) suggests that the behavior of fD(t) depends on the rate of change of , , and with time. It should be noted that for a plasma. Additionally, , . During the morning hours, , whereas during the course of the afternoon hours.
First, consider the classical picture of the behavior of the Doppler shift fD(t), which takes place around the local noon, , in the absence of fluctuations in the parameters of the medium. In this case, the magnitude and sign of fD(t) is dependent only on the multiplier .
The equality = 0 holds before the solar eclipse onset (t = t1), at the moment (tm) when the coverage of the Sun's surface area by the Moon is a maximum, and after the solar eclipse ceases to exist (t = t2). If t is less than tm, then is greater then zero, whereas if t is greater than tm, then is less than zero. Note that the fD(t) is a two-lobe symmetric dependence about the moment (tm) of maximum coverage of the Sun's surface area by the Moon. Within the first lobe t<tm and fD(t)<0; within the second lobe t>tm and fD(t)>0. At t = tm, the value of fD(tm) vanishes. It is important that = .
Away from the local noon, the magnitude and sign of fD(t) is determined by the relation between the expressions and and by the signs of , . At the stage when the occultation of the solar disk is increasing, fD<0, whereas at t = tm, fD = 0. At the stage when the occultation of the solar disk is decreasing, fD>0. The Doppler shift, fD(t), shows a minimum () at the moment t = tmin, which is found within the interval t1<tmin<tm; whereas the Doppler shift, fD(t), shows a maximum () at the moment t = tmax, which is found within the interval tm<tmax<t2. It is important that ≠ .
If a solar eclipse begins during the morning hours, the first term in the integrand of Eq. (2) is positive, and its value can become equal to or greater than the value of the second term, which is negative if t1<t<tm. As a result, the effect of suppression arises in the response of the Doppler shift to the solar eclipse when an increase in N during the morning partially or totally compensates a decrease in N due to covering the solar disk. During the tm<t<t2 interval, , and both the terms in the integrand of Eq. (2) are positive, and consequently, an increase in the Doppler shift occurs.
If a solar eclipse begins, t1<t<tm, during the local noon when , and both the terms in the integrand of Eq. (2) are negative, the Doppler shift exhibits the effect of amplification. If a solar eclipse ceases to exist, tm<t<t2, during the local noon, the terms in the integrand of Eq. (2) have different signs (the first one is negative, and the second one is positive), the Doppler shift shows the effect of suppression.
Thus, the real fD(t) dependence may significantly differ from the classical one. In addition, the fluctuations and quasi-periodic variations in the Doppler shift are superimposed on the aperiodic changes in the trend .
7.3 Influence of the solar terminator on the Doppler shift
This solar eclipse took place before and immediately after the sunrise and morning period, which is one of its features. Therefore, the effects of the dawn terminator could be significant. The Doppler spectra show that the movement of the solar terminator was accompanied by significant diffuseness along virtually all propagation paths, whereas the broadening of the Doppler spectra attained 1.5–2.5 Hz. In addition, the Doppler shift exhibited noticeable variations in the main ray. The above-mentioned effects were absent along both propagation paths of Beijing to Harbin. Most probably, sporadic E propagation took place along these propagation paths, where fD(t)≈0 Hz and diffuseness in the Doppler spectra was absent.
The analysis of universal time dependencies of Doppler spectra has shown that the effects of the terminator ceased to exist either before the beginning of the solar eclipse or soon thereafter, making the detection of the solar eclipse effects easier to perform. At the same time, an increase in N(t) that followed the terminator made the response to the solar eclipse harder to find.
7.4 Relation between the variations observed in the Doppler spectra and the solar eclipse
7.4.1 Lintong/Pucheng to Harbin radio-wave propagation path
Figure 4 shows that the Doppler shift in the main ray exhibits a tendency to decrease from 0.8 to 0.2 Hz after the solar eclipse onset. After t>tm, the fD is noted for an increase from 0.2 to 0.4 Hz and then for its reduction to the initial value. The absence of the analogous variations on the reference days, may be attributed to the solar eclipse; an increase of 6 dBV in the signal amplitude is most probably associated with the solar eclipse as well.
7.4.2 Chiba/Nagara to Harbin radio-wave propagation path
The Doppler shift of frequency showed a tendency to decrease from 0.2–0.4 Hz to −(0.2–0.4) Hz immediately after the solar eclipse onset, which was followed by an increase to zero during the course of about 1 h (see Fig. 5). After the moment (tm) when the coverage of the Sun's surface area by the Moon was a maximum, i.e., when t>tm, the fD showed a tendency to increase during 30 min. In addition, the Doppler spectra exhibited a considerable increase, from −1.5 to 1.2 Hz, in broadening over the 6 January 2019 01:00–01:50 UT period, whereas similar effects were absent on the reference days. The effects described above may be due to the solar eclipse.
7.4.3 Ulaanbaatar/Khonkhor to Harbin radio-wave propagation path
The rise followed by the fall in the Doppler shift observed on 6 January 2019 at 00:50–03:00 UT could be caused by the solar eclipse (see Fig. 6), since analogous behavior of fD(t) was not observed within this time interval on the reference days. The diffuseness shown by the Doppler spectra from 00:50 to 01:25 UT on 6 January 2019 is probably also associated with the solar eclipse.
7.4.4 Shijiazhuang to Harbin radio-wave propagation path
Figure 7 shows that fD≈0 Hz prior to the solar eclipse onset, while at about 23:30 UT on 5 January 2019, the fD exhibits an abrupt increase of 0.4 Hz, and then a tendency for 0.2 Hz reduction; this persists for about 30 min. During the following 40 min, the trend Hz. Around t≈tm, Hz, whereas after 00:45 UT (on 6 January 2019), the fD exhibits an increase from 0 to 0.25 Hz, and then a reduction to zero; this continues for about 12 min. The Doppler spectra show diffuseness, and the Doppler shift exhibits temporal variability from −1.5 to 1.5 Hz over the period 00:50–04:00 UT on 6 January 2019. From 00:50 to 02:13 UT on 6 January 2019, the second ray was powerful enough, appearing sporadically with the ∼ 0.3 Hz trend, , whereas Hz for the first ray. Some radio-wave energy was most probably leaked through the screening of the sporadic E layer.
The signal amplitude increased by 12–18 dBV during the night of 5–6 January 2019, from 23:35 to 00:50 UT; whereas on the reference days, the variations in A(t) do not exceed 12 dBV. There are reasons to consider that the effects described above are due to the solar eclipse.
7.4.5 Hohhot to Harbin radio-wave propagation path
Prior to the solar eclipse onset, the Doppler shift (fD) was nearly zero, since the radio waves were apparently reflected from the sporadic E layer (see Fig. 8). At 03:40 UT on 5 January 2019, the radio wave penetrated into the ionospheric F region, and the trend Hz. This moment virtually coincided with the sunrise and onset of the observable solar eclipse. Afterwards, a gradual decrease in to zero was noted to persist during a 40 min interval. Around 00:20 UT on 6 January 2019, Hz, which was followed by an increase in to 0.4 Hz and a decrease to zero at 01:30 UT on 6 January 2019. The quasi-periodic ∼ 15 min period (T) and ∼ 0.10–0.15 Hz amplitude (fDa) variations were superimposed on the regular temporal variation in . Other, weaker, rays were noted during the course of the solar eclipse and during a 1 h interval after the solar eclipse.
Thus, the Doppler spectra observed on the day when the solar eclipse occurred were significantly different from those observed on the reference days. The behaviors of the signal amplitudes were also significantly different. All these features support the idea that the effects described above are most probably associated with the solar eclipse. At the same time, the fD(t) dependencies along all propagation paths exhibit behaviors that are significantly different from the classical behavior.
7.4.6 Beijing to Harbin radio-wave propagation path
Figures 9 and 10 show that universal time dependencies of the Doppler spectra and signal amplitudes at 9675 and 9830 kHz were observed to be virtually the same. Therefore, the use of only the first frequency is enough for the description of the effects.
Prior to the solar eclipse onset and during intervals of 1 h after it, the trend Hz; the radio waves were most probably reflected from the sporadic E layer. The reflection from the ionospheric F region took place only during the night of 5–6 January 2019 from 23:50 to 00:20 UT, when Hz. For this reason, the effect of the solar eclipse was masked. The appearance of rays showing the ∼ 0.2–1 and ∼ 0.2–0.7 Hz trends, , over the 00:55–01:15 and 01:42–02:30 UT periods, respectively, are most probably associated with the solar eclipse. In addition, the fD(t) exhibited weak quasi-periodic ∼ 4–5 min period (T) and ∼ 0.05 Hz amplitude (fDa) variations during the entire course of the solar eclipse, whereas the ∼ 20 min period (T) and ∼ 0.2 Hz amplitude (fDa) oscillations were predominant on the reference days.
The signal amplitude exhibited an increase of 10–20 dBV during the course of the solar eclipse, while the increase did not exceed 5–10 dBV on the reference days.
7.5 Results of calculations
7.5.1 Decrease in the electron density during the solar eclipse
Making use of the continuity equation for the electron density in the altitude range where the molecular ions are dominant, and considering the production rate that is due only to photoionization by photons from the solar disk, the following equation is yielded:
where N0 is the electron density in the absence of the solar eclipse. The value B(tm) = Bm yields the maximum effect:
Substituting the values Bm ≈ 0.235–0.362 observed at the propagation path midpoints into the latter formula yields ≈ 0.88–0.80 and ≈ −(12–20) %, where ΔNmax = Nmin−N0.
The relations presented above could be specified by considering the ionization of atmospheric molecules with the ultraviolet emissions from the solar corona (Chernogor, 2013a), which yields
where ξ is a fraction giving the relative contribution of the solar corona to the ionization of the atmosphere. According to Mrak et al. (2018), the value of ξ does not exceed 0.2, giving ≈ −(10–16) %.
7.5.2 Estimates of a decrease in the electron density from observational data
Guo et al. (2019, 2020), Luo et al. (2020), and Chernogor et al. (2020) have replaced the actual trajectory by two straightened line segments intersecting at the height of reflection zr, ignored the geomagnetic field, and obtained the following relation for estimating , if the trend changes from to during the time interval Δt:
where Ln = zr−z0, zr is the reflection height, and z0 is the altitude of the beginning of the layer contributing to the Doppler shift:
where r0 ≈ 6400 km is the Earth's radius, θ is the angle of incidence with respect to the vertical at the basis of the ionosphere.
Consider, for example, the propagation path of Hohhot to Harbin at 9520 kHz. The Doppler shift exhibited a maximum shift, , of ∼ −0.4 Hz at 23:40–00:10 UT and a minimum shift, , of 0.4 Hz at 00:30–01:00 UT on the night of 5–6 January 2019. Assuming zr ≈ 220 and z0 ≈ 100 km yields θ ≈ 70.3∘, Ln ≈ 140 km, whereas substituting these numbers in Eqs. (5) and (6) gives κ2 ≈ 0.63, κθ = 0.175, and finally putting the latter values in Eq. (4) now yields
This experimental estimate can be compared with the theoretical estimate. Substituting the eclipse obscuration (Bm) of ∼ 0.293, which is estimated to be at the Hohhot to Harbin propagation path midpoint, into Eq. (3) yields ≈ 0.87 and ( ≈ −0.13; hence, this theoretical value shows a good agreement with the experimental estimate of −0.15 obtained as described above.
7.5.3 Estimates of wave perturbation amplitudes in the atmospheric gravity wave range
Most of the solar eclipses are well known for their capability to generate or amplify atmospheric gravity waves in the period range of 10–120 min (see, e.g., Burmaka et al., 2006a, b; Šauli et al., 2007; Chernogor, 2010, 2012, 2016a, b). These waves act to excite traveling ionospheric disturbances of the same periods. Within the data segment under the study in this piece of research, oscillations in fD(t) with a period (T) of ∼ 15–20 min are also observed along a number of the propagation paths.
The estimate of the relative disturbance (δNa) in the electron density at the reflection height (zr) can be obtained from the expression analogous to Eq. (4) (Guo et al., 2019, 2020; Luo et al., 2020; Chernogor et al., 2020):
where
where H is the scale height of the atmosphere. Assuming 2H ≈ 80 km, Ln ≈ 140 km around the reflection height zr, in Eq. (8) yields L ≈ 50 km. Substituting T ≈ 15 min and fDa ≈ 0.10–0.15 Hz, observed along the Hohhot to Harbin propagation path, into Eq. (7) yields δN(zr) ≈ 1.6 %–2.4 %.
7.5.4 Estimates of wave-disturbance amplitudes in the infrasound period range
Infrasound waves of periods that are great enough (1–5 min) reach the ionospheric F region altitudes, modulate the electron density N, and consequently, fD(t) (see, e.g., Gossard and Hooke, 1975; Guo et al., 2019, 2020; Chernogor et al., 2020).
Consider, for example, the Beijing to Harbin radio-wave propagation path. Assuming zr ≈ 220 km yields ζ = , θ ≈ 67.3∘, and ≈ 3.59. Substituting L ≈ 50 km and fDa ≈ 0.05 Hz into Eq. (7) gives δN ≈ 0.2 %–0.3 % for T = 4–5 min.
7.5.5 Comparisons with the effects of the solar eclipse on 11 August 2018 that took place in the PRC
The solar eclipses on 11 August 2018 and 5–6 January 2019 took place in the PRC. Both eclipses had close magnitudes (M) and obscuration (Bm). The effects of both eclipses were revealed with the multifrequency multiple path radio system at the Harbin Engineering University.
The difference is as follows. The solar eclipse on 11 August 2018 occurred in the evening hours, whereas the solar eclipse on 5–6 January 2019 was observed in the morning hours. The effects from both eclipses were partially suppressed by the processes acting at sunset or sunrise. In both cases, the solar eclipse was accompanied by Doppler-spectrum broadening, alternating sign Doppler-shift variations in the main rays, and the generation of infrasound and atmospheric gravity waves. The amplitudes of the generated waves were comparable, while the reductions in the electron density on a relative scale near the moment of the maximum occultation of the solar disk were observed to be 26 % and 15 %, respectively.
The results may be summarized as follows:
-
Temporal variations in the Doppler spectra and Doppler shift in the main rays, as well as in the signal amplitudes observed along seven radio-wave propagation paths, with various orientations of these paths, have been studied with the multifrequency multipath radio system from the Harbin Engineering University on the day when the solar eclipse occurred and on the reference days. The transmitters located in Japan, Mongolia, and the PRC are sounding the ionosphere at 5000 to 9830 kHz frequencies.
-
The solar eclipse was accompanied by Doppler-spectrum broadening, up to ± 1.5 Hz, by alternating sign Doppler-shift variations, up to ± 0.5 Hz, in the main ray, and by quasi-periodic Doppler-shift changes.
-
Using alternating sign Doppler-shift variations during the period of the maximum occultation of the Sun's surface area, the greatest decrease in the electron density has been estimated to be about −15 %, whereas the theoretical model has shown that it is −13 %; this may be considered as being in good agreement.
-
The atmospheric gravity waves launched by the solar eclipse acted to excite quasi-periodic, 15 min period variations in the Doppler shift, while the amplitude of the perturbations in the electron density has been estimated to be 1.6 %–2.4 %.
-
The infrasound waves launched by the solar eclipse acted to excite quasi-periodic, 4–5 min period variations in the Doppler shift, whereas the amplitude of the perturbations in the electron density has been estimated to be about 0.2 %–0.3 %.
Software for Passive 14-Channel Doppler radar may be obtained from the website at https://doi.org/10.7910/DVN/MTGAVH (Garmash, 2021).
The data sets discussed in this paper may be obtained from the website at https://doi.org/10.7910/DVN/RMFBRN (Garmash, 2022).
LCh conceptualized the piece of research presented in this paper; QG and KP acquired observational data sets and performed data reduction. All authors (LCh, KP, QG, VR, YZ) performed analysis of the results obtained within the scope of their investigations. The research is conducted under the auspices of QG whose enthusiasm plays a decisive role for the funding of this study; QG and KP performed a holistic investigation of all the data involved in the study; LCh explored observational and systems-theoretical methodologies needed for advancing the study; QG planned, organized, and ran the study; QG consolidated resources to attack the problems under consideration; KP developed software needed for data acquisition and processing, for hardware control, for storing the complex amplitudes of the maximum Doppler lines, for displaying the data, etc.; LCh supervised the research project. All authors (LCh, KP, QG, VR, YZ) validated the products they have contributed to the study within the scope of their investigations; KP and YZ developed and ran visualization software. All authors (LCh, KP, QG, VR, YZ) wrote the original drafts of their contributions to the study within the scope of their investigations. All authors (LCh, KP, QG, VR, YZ) reviewed and edited their contributions to the paper.
The contact author has declared that none of the authors has any competing interests.
Publisher’s note: Copernicus Publications remains neutral with regard to jurisdictional claims in published maps and institutional affiliations.
This article makes use of data on the solar eclipse of 5–6 January 2019 retrieved from NASA Goddard Space Flight Center Eclipse Websites https://eclipse.gsfc.nasa.gov/SEsaros/SEsaros.html (last access: 20 September 2022) and https://eclipse.gsfc.nasa.gov/JSEX/JSEX-AS.html (last access: 23 September 2022). The solar wind parameters were retrieved from the Goddard Space Flight Center Space Physics Data Facility https://omniweb.gsfc.nasa.gov/form/dx1.html (last access: 20 September 2022). Work by Qiang Guo and Yu Zheng was supported by the National Key R&D Plan Strategic International Science and Technology Cooperation and Innovation (2018YFE0206500). Work by Leonid F. Chernogor was supported by the National Research Foundation of Ukraine for financial support (project 2020.02/0015, “Theoretical and experimental studies of global disturbances from natural and technogenic sources in the Earth–atmosphere–ionosphere system”). Work by Leonid F. Chernogor was supported by the Ukraine state research projects #0121U109881 and #0121U109882. Work by Kostyantyn P. Garmash was supported by the Ukraine state research project #0121U109882. Work by Victor T. Rozumenko was supported by the Ukraine state research project #0121U109881.
This research has been supported by the National Key Research and Development Program of China (grant no. 2018YFE0206500), the National Research Foundation of Ukraine (grant no. 2020.02/0015), the State Fund for Fundamental Research of Ukraine (grant no. 0121U109882), and the State Fund for Fundamental Research of Ukraine (grant no. 0121U109881).
This paper was edited by Ana G. Elias and reviewed by two anonymous referees.
Aa, E., Zhang, S.-R., Shen, H., Liu, S., and Li, J.: Local and conjugate ionospheric total electron content variation during the 21 June 2020 solar eclipse, Adv. Space Res., 68, 3435–3454, https://doi.org/10.1016/j.asr.2021.06.015, 2021.
Afraimovich, E. L., Voeykov, S. V., Perevalova, N. P., Vodyannikov, V. V., Gordienko, G. I., Litvinov, Y. G., and Yakovets, A. F.: Ionospheric effects of the March 29, 2006, solar eclipse over Kazakhstan, Geomag. Aeron., 47, 461–469, https://doi.org/10.1134/S0016793207040068, 2007.
Akimov, A. L. and Chernogor, L. F.: Effects of the Solar Eclipse of August 1, 2008 on the Earth's Lower Atmosphere, Kinemat. Phys. Celest. Bodies, 26, 135–145, https://doi.org/10.3103/S0884591310030050, 2010.
Akimov, L. A., Bogovskii, V. K., Grigorenko, E. I., Taran, V. I., and Chernogor, L. F.: Atmospheric–Ionospheric Effects of the Solar Eclipse of May 31, 2003, in Kharkov, Geomag. Aeron., 45, 494–518, 2005 (in Russian).
Anastassiades, M. (Ed): Solar Eclipses and the Ionosphere, Plenum Press, New York, ISBN 978-1-4684-1839-2, 1970.
Burmaka, V. P., Taran, V. I., and Chernogor, L. F.: Wave-Like Processes in the Ionosphere under Quiet and Disturbed Conditions, 1. Kharkov Incoherent Scatter Radar Observations, Geomag. Aeron., 46, 183–198, https://doi.org/10.1134/S0016793206020071, 2006a.
Burmaka, V. P., Taran, V. I., and Chernogor, L. F.: Wave-Like Processes in the Ionosphere under Quiet and Disturbed Conditions, 2. Analysis of Observations and Simulation, Geomag. Aeron., 46, 199–208, https://doi.org/10.1134/S0016793206020083, 2006b.
Beynon, W. J. G., and Brown, G. M. (Eds.): Solar Eclipses and the Ionosphere, Pergamon Press, London, UK, ISBN 978-0080090467, 1956.
Chandra, H., Sethia, G., Vyas, G. D., Deshpande, M. R., and Vats, H. O.: Ionospheric effects of the total solar eclipse of 16 Feb. 1980, P. Indian. Natl. Acad. Sci., 47, 57–60, 1980.
Chapman, S.: The influence of a solar eclipse upon the upper atmospheric ionization, Mon. Not. R. Astron. Soc., 92, 413–420, 1932.
Chen, Y., Feng, P., Liu, C., Chen, Y., Huang, L., Duan, J., Hua, Y., and Li, X.: Impact of the annular solar eclipse on June 21, 2020 on BPL time service performance, AIP Adv., 11, 115003, https://doi.org/10.1063/5.0064445, 2021.
Chernogor, L. F.: Physics of Earth, Atmosphere, and Geospace from the Standpoint of System Paradigm, Radio Phys. Radio Astron., 8, 59–106, http://rpra-journal.org.ua/index.php/ra/article/view/797 (last access: 22 September 2022), 2003 (in Russian).
Chernogor, L. F.: Variations in the Amplitude and Phase of VLF Radiowaves in the Ionosphere during the August 1, 2008, Solar Eclipse, Geomag. Aeron., 50, 96–106, https://doi.org/10.1134/S0016793210010111, 2010a.
Chernogor, L. F.: Wave Response of the Ionosphere to the Partial Solar Eclipse of August 1, 2008, Geomag. Aeron., 50, 346–361, https://doi.org/10.1134/S0016793210030096, 2010b.
Chernogor, L. F.: The Earth–atmosphere–geospace system: main properties and processes, Int. J. Rem. Sens., 32, 3199–3218, https://doi.org/10.1080/01431161.2010.541510, 2011.
Chernogor, L. F.: Effects of solar eclipses in the ionosphere: Results of Doppler sounding: 1. Experimental data, Geomag. Aeron., 52, 768–778, https://doi.org/10.1134/S0016793212050039, 2012a.
Chernogor, L. F.: Effects of Solar Eclipses in the Ionosphere: Doppler Sounding Results: 2. Spectral Analysis, Geomag. Aeron., 52, 779–792, https://doi.org/10.1134/S0016793212050040, 2012b.
Chernogor, L. F.: Physical Effects of Solar Eclipses in Atmosphere and Geospace: monograph, V. N. Karazin Kharkiv National University Publ., Kharkiv, Ukraine, https://karazinbook.com/knyga/fizicheskie-effekty-solnechnyh-zatmeniy-v-atmosfere-i-geokosmose (last access: 22 September 2022), 2013a (in Russian).
Chernogor, L. F.: Physical Processes in the Middle Ionosphere Accompanying the Solar Eclipse of January 4, 2011, in Kharkov, Geomag. Aeron., 53, 19–31, https://doi.org/10.1134/S0016793213010052, 2013b.
Chernogor, L. F.: Atmosphere–Ionosphere response to Solar Eclipse over Kharkiv on March 20, 2015, Geomag. Aeron., 56, 592–603, https://doi.org/10.1134/S0016793216050030, 2016a.
Chernogor, L. F.: Wave Processes in the Ionosphere over Europe that Accompanied the Solar Eclipse of March 20, 2015, Kinemat. Phys. Celest. Bodies, 32, 196–206, https://doi.org/10.3103/S0884591316040024, 2016b.
Chernogor, L. F.: Convection Effect in the Surface Atmosphere of Solar Eclipses of March 20, 2015, and June 10, 2021, Kinemat. Phys. Celest. Bodies, 37, 284–292, https://doi.org/10.3103/S0884591321060039, 2021a.
Chernogor, L. F.: Thermal Effect in Surface Atmosphere of the Solar Eclipse on June 10, 2021, Kinemat. Phys. Celest. Bodies, 37, 293–299, https://doi.org/10.3103/S0884591321060040, 2021b.
Chernogor, L. F.: Geomagnetic Effect of the Solar Eclipse of June 10, 2021, Kinemat. Phys. Celest. Bodies, 38, 11–24, https://doi.org/10.3103/S0884591322010020, 2022.
Chernogor, L. F. and Garmash, K. P.: Magneto-Ionospheric Effects of the Solar Eclipse of March 20, 2015, over Kharkov, Geomag. Aeron., 57, 72–83, https://doi.org/10.1134/S0016793216060062, 2017.
Chernogor, L. F. and Garmash, K. P.: Ionospheric Processes during the Partial Solar Eclipse above Kharkiv on June 10, 2021, Kinemat. Phys. Celest. Bodies, 38, 61–72, 2022.
Chernogor, L. F. and Mylovanov, Y. B.: Ionospheric Effects from the June 10, 2021 Solar Eclipse in the Polar Region, Kinemat. Phys. Celest. Bodies, 38, 197–209, 2022.
Chernogor, L. F. and Rozumenko, V. T.: Earth – Atmosphere – Geospace as an Open Nonlinear Dynamical System, Radio Phys. Radio Astron., 13, 120–137, http://rpra-journal.org.ua/index.php/ra/article/view/563 (last access: 22 September 2022), 2008.
Chernogor, L. F., Domnin, I. F., Emelyanov, L. Y., and Lyashenko, M. V.: Physical processes in the ionosphere during the solar eclipse on March 20, 2015 over Kharkiv, Ukraine (49.6∘ N, 36.3∘ E), J. Atmos. Solar-Terr. Phys., 182, 1–9, https://doi.org/10.1016/j.jastp.2018.10.016, 2019.
Chernogor, L. F., Garmash, K. P., Guo, Q., Luo, Y., Rozumenko, V. T., and Zheng, Y.: Ionospheric storm effects over the People's Republic of China on 14 May 2019: Results from multipath multi-frequency oblique radio sounding, Adv. Space Res., 66, 226–242, https://doi.org/10.1016/j.asr.2020.03.037, 2020.
Chernogor, L. F., Garmash, K. P., Guo, Q., Rozumenko, V. T., Zheng, Y., and Luo, Y.: Supertyphoon Hagibis action in the ionosphere on 6–13 October 2019: Results from multi-frequency multiple path sounding at oblique incidence, Adv. Space Res., 67, 2439–2469, https://doi.org/10.1016/j.asr.2021.01.038, 2021.
Chernogor, L. F., Garmash, K. P., Guo, Q., Rozumenko, V. T., Zheng, Y., and Luo, Y.: Disturbances in the Ionosphere That Accompanied Typhoon Activity in the Vicinity of China in September 2019, Radio Sci., 57, e2022RS007431, https://doi.org/10.1029/2022RS007431, 2022.
Chimonas, G. and Hines, C. O.: Atmospheric gravity waves induced by a solar eclipse, J. Geophys. Res., 75, 875–876, https://doi.org/10.1029/JA075i004p00875, 1970.
Coster, A. J., Goncharenko, L., Zhang, S. R., Erickson, P. J., Rideout, W., and Vierinen, J.: GNSS observations of ionospheric variations during the 21 August 2017 solar eclipse, Geophys. Res. Lett., 44, 12041–12048, https://doi.org/10.1002/2017GL075774, 2017.
Dang, T., Lei, J. H., Wang, W. B., Yan, M. D., Ren, D. X., and Huang, F. Q.: Prediction of the thermospheric and ionospheric responses to the 21 June 2020 annular solar eclipse, Earth Planet. Phys, 4, 231–237, https://doi.org/10.26464/epp2020032, 2020.
Davies, K.: Ionospheric Radio, Peter Peregrinus Ltd., London, UK, ISBN 1-84919-387-8, 2008.
Deshpande, M. R., Chandra, H., Sethia, G., Vats, Hari Om, Vyas, G. D., Iyer, K. N., and Janve, A. V.: Effects of the total solar eclipse of 16 February 1980 on TEC at low latitudes, P. Indian. Natl. Acad. Sci., 48, 427–433, 1982.
Founda, D., Melas, D., Lykoudis, S., Lisaridis, I., Gerasopoulos, E., Kouvarakis, G., Petrakis, M., and Zerefos, C.: The effect of the total solar eclipse of 29 March 2006 on meteorological variables in Greece, Atmos. Chem. Phys., 7, 5543–5553, https://doi.org/10.5194/acp-7-5543-2007, 2007.
Garmash, K.: Software for Passive 14-Channel Doppler Radar, Harvard Dataverse [software code], V1, https://doi.org/10.7910/DVN/MTGAVH, 2021.
Garmash, K.: RAW Data for Solar Eclipse of January 5–6, 2019 over China, Harvard Dataverse [data set], V1, https://doi.org/10.7910/DVN/RMFBRN, 2022.
Garmash, K. P., Leus, S. G., and Chernogor, L. F.: January 4, 2011 Solar Eclipse Effects over Radio Circuits at Oblique Incidence, Radio Phys. Radio Astron., 16, 164–176, http://rpra-journal.org.ua/index.php/ra/article/view/442 (last access: 22 September 2022), 2011 (in Russian).
Gossard, E. E. and Hooke, W. H.: Waves in the Atmosphere, Vol. 456, Elsevier, New York, ISBN 9978-0444411969, 1975.
Grigorenko, E. I., Lyashenko, M. V., and Chernogor, L. F.: Effects of Solar Eclipse of March 29, 2006, in the Ionosphere and Atmosphere, Geomag. Aeron., 48, 337–351, https://doi.org/10.1134/S0016793208030092, 2008.
Guo, Q., Chernogor, L. F., Garmash, K. P., Rozumenko, V. T., and Zheng, Y.: Dynamical processes in the ionosphere following the moderate earthquake in Japan on 7 July 2018, J. Atmos. Sol.-Terr. Phys., 186, 88–103, https://doi.org/10.1016/j.jastp.2019.02.003, 2019.
Guo, Q., Chernogor, L. F., Garmash, K. P., Rozumenko, V. T., and Zheng, Y.: Radio Monitoring of Dynamic Processes in the Ionosphere Over China During the Partial Solar Eclipse of 11 August 2018, Radio Sci., 55, e2019RS006866, https://doi.org/10.1029/2019RS006866, 2020.
Higgs, A. J.: Ionospheric measurements made during the total Solar eclipse of 1940, October 1-st, South Africa, Monthly Not. Roy. Astron. Soc., 102, 24–34, https://doi.org/10.1093/mnras/102.1.24, 1942.
Huang, L., Liu, C., Chen, Y., Wang, X., Feng, P., and Li, X.: Observations and analysis of the impact of annular eclipse on 10 MHz short-wave signal in Sanya area on June 21, 2020, AIP Adv., 11, 115317, https://doi.org/10.1063/5.0068778, 2021.
Huang, F., Li, Q., Shen, X., Xiong, C., Yan, R., Zhang, S.-R., Wang, W., Aa, E., Zhong, J., Dang, T., and Lei, J.: Ionospheric responses at low latitudes to the annular solar eclipse on 21 June 2020, J. Geophys. Res., 125, e2020JA028483, https://doi.org/10.1029/2020JA028483, 2020.
Jakowski, N., Stankov, S. M., Wilken, V., Borries, C., Altadill, D., Chum, J., Buresova, D., Boska, J., Sauli, P., Hruska, F., and Cander, L. R.: Ionospheric behavior over Europe during the solar eclipse of 3 October 2005, J. Atmos. Sol.-Terr. Phys., 70, 836–853, https://doi.org/10.1016/j.jastp.2007.02.016, 2008.
Le, H., Liu, L., Ren, Z., Chen, Y., and Zhang, H.: Effects of the 21 June 2020 solar eclipse on conjugate hemispheres: A modeling study, J. Geophys. Res., 125, e2020JA028344, https://doi.org/10.1029/2020JA028344, 2020.
Liu, J. Y., Hsiao, C. C., Tsai, L. C., Liu, C. H., Kuo, F. S., Lue, H. Y., and Huang, C. M.: Vertical phase and group velocities of internal gravity waves derived from ionograms during the solar eclipse of 24 October 1995, J. Atmos. Sol.-Terr. Phys., 60, 1679–1686, https://doi.org/10.1016/S1364-6826(98)00103-5, 1998.
Luo, Y., Chernogor, L. F., Garmash, K. P., Guo, Q., Rozumenko, V. T., Shulga, S. N., and Zheng, Y.: Ionospheric effects of the Kamchatka meteoroid: Results from multipath oblique sounding, J. Atmos. Sol.-Terr. Phys., 207, 105336, https://doi.org/10.1016/j.jastp.2020.105336, 2020.
Lyashenko, M. V. and Chernogor, L. F.: Tropospheric-ionospheric effects of the 3 October 2005 partial solar eclipse in Kharkiv, 2. Modeling and discussion, Space Sci. Tech., 14, 57–64, https://doi.org/10.15407/knit2008.01.057, 2008 (in Russian).
Marlton, G. J., Williams, P. D., and Nicoll, K. A.: On the detection and attribution of gravity waves generated by the 20 March 2015 solar eclipse, Philos. T. R. Soc. A, 374, 20150222, https://doi.org/10.1098/rsta.2015.0222, 2016.
Marple Jr., S. L.: Digital Spectral Analysis: with Applications, Prentice-Hall, Inc, Englewood Cliffs, N. J., https://doi.org/10.1121/1.398548, 1987.
Mrak, S., Semeter, J. L., Drob, D., and Huba, J. D.: Direct EUV/X-ray modulation of the ionosphere during the August 2017 total solar eclipse, Geophys. Res. Let., 45, 3820–3828, https://doi.org/10.1029/2017GL076771, 2018.
Özcan, O. and Aydoğdu, M.: Possible effects of the total solar eclipse of August 11, 1999 on the geomagnetic field variations over Elaziğ-Turkey, J. Atmos. Sol.-Terr. Phys., 66, 997–1000, https://doi.org/10.1016/j.jastp.2004.03.009, 2004.
Panasenko, S. V., Otsuka, Y., van de Kamp, M., Chernogor, L. F., Shinbori, A., Tsugawa, T., and Nishioka, M.: Observation and characterization of traveling ionospheric disturbances induced by solar eclipse of 20 March 2015 using incoherent scatter radars and GPS networks, J. Atmos. Sol.-Terr. Phys., 191, 105051, https://doi.org/10.1016/j.jastp.2019.05.015, 2019.
Patel, K. and Singh, A. K.: Changes in atmospheric parameters due to annular solar eclipse of June 21, 2020, over India, Indian J. Phys., 96, 1613–1624, https://doi.org/10.1007/s12648-021-02112-2, 2021.
Rama Rao, P. V. S., Rao, B. V. P. S., Nru, D., and Niranjan, K.: TEC observations at Waltair during the total solar eclipse of 16 Februrary 1980, P. Indian Natl. Acad. Sci., 48, 434–438, 1982.
Roble, R. G., Emery, B. A., and Ridley, E. C.: Ionospheric and thermospheric response over Millstone Hill to the May 30, 1984, annular solar eclipse, J. Geophys. Res., 91, 1661–1670, https://doi.org/10.1029/JA091iA02p01661, 1986.
Salah, J. E., Oliver, W. L., Foster, J. C., Holt, J. M., Emery, B. A., and Roble, R. G.: Observations of the May 30, 1984, annular solar eclipse at Millstone Hill, J. Geophys. Res., 91, 1651–1660, https://doi.org/10.1029/JA091iA02p01651, 1986.
Šauli, P., Roux, S. G., Abry, P., and Boška, J.: Acoustic–gravity waves during solar eclipses: Detection and characterization using wavelet transforms, J. Atmos. Sol.-Terr. Phys., 69, 2465–2484, https://doi.org/10.1016/j.jastp.2007.06.012, 2007.
Sen Gurta, A., Goel, G. K., and Mathur, B. S.: Effect of the 16 February 1980 solar eclipse on VLF propagation, J. Atmos. Terr. Phys., 42, 907–909, https://doi.org/10.1016/0021-9169(80)90107-5, 1980.
Şentürk, E., Arqim Adil, M., and Saqib, M.: Ionospheric total electron content response to annular solar eclipse on June 21, 2020, Adv. Space Res., 67, 1937–1947, https://doi.org/10.1016/j.asr.2020.12.024, 2021.
Shagimuratov, I. I., Zakharenkova, I. E., Tepenitsyna, N. Y., Yakimova, G. A., and Efishov, I. I.: Features of the Ionospheric Total Electronic Content Response to the Annular Solar Eclipse of June 21, 2020, Geomagn. Aeron., 61, 756–762, https://doi.org/10.1134/S001679322105011X, 2021.
Stankov, S. M., Bergeot, N., Berghmans, D., Bolsée, D., Bruyninx, C., Chevalier, J. M., Clette, F., De Backer, H., De Keyser, J., D'Huys, E., Dominique, M., Lemaire, J. F., Magdalenić, J., Marqué, C., Pereira, N., Pierrard, V., Sapundjiev, D., Seaton, D. B., Stegen, K., Linden, R. V., Verhulst, T. G. W., and West, M. J.: Multi-instrument observations of the solar eclipse on 20 March 2015 and its effects on the ionosphere over Belgium and Europe, J. Space Weather Space Clim., 7, A19, https://doi.org/10.1051/swsc/2017017, 2017.
Sun, Y.-Y., Chen, C.-H., Qing, H., Xu, R., Su, X., Jiang, C., Yu, T., Wang, J., Xu, H., and Lin, K.: Nighttime ionosphere perturbed by the annular solar eclipse on June 21, 2020, J. Geophys. Res., 126, e2021JA029419, https://doi.org/10.1029/2021JA029419, 2021.
Tripathi, G., Singh, S. B., Kumar, S., Ashutosh, K., Singh Singh, R., and Singh, A. K.: Effect of 21 June 2020 solar eclipse on the ionosphere using VLF and GPS observations and modeling, Adv. Space Res., 69, 254–265, https://doi.org/10.1016/j.asr.2021.11.007, 2022.
Uryadov, V. P., Leonov, A. M., Ponyatov, A. A., Boiko, G. N., and Terent'ev, S. P.: Variations in the Characteristics of a HF Signal over an Oblique Sounding Path during the Solar Eclipse on August 11, 1999, Radiophys. Quant. El., 43, 614–618, https://doi.org/10.1023/A:1004801201847, 2000.
Uryadov, V. P., Kolchev, A. A., Vybornov, F. I., Shumaev, V. V., Egoshin, A. I., and Chernov, A. G.: Ionospheric effects of a solar eclipse of March 20, 2015 on oblique sounding paths in the Eurasian longitudinal sector, Radiophys. Quantum Electron., 59, 431–441, https://doi.org/10.1007/s11141-016-9711-9, 2016.
Verhulst, T. G. W. and Stankov, S. M.: Height dependency of solar eclipse effects: the ionospheric perspective, J. Geophys. Res.-Space, 125, e2020JA028088, https://doi.org/10.1029/2020JA028088, 2020.
Verhulst, T. G. W., Sapundjiev, D., and Stankov, S. M.: High-resolution ionospheric observations and modeling over Belgium during the solar eclipse of 20 March 2015 including first results of ionospheric tilt and plasma drift measurements, Adv. Space Res., 57, 2407–2419, https://doi.org/10.1016/j.asr.2016.03.009, 2016.
Wang, J., Zuo, X., Sun, Y.-Y., Yu, T., Wang, Y., Qiu, L., Mao, T., Yan, X., Yang, N., Qi, Y., Lei, J., Sun, L., and Zhao, B.: Multilayered sporadic-E response to the annular solar eclipse on June 21, 2020, Space Weather, 19, e2020SW002643, https://doi.org/10.1029/2020SW002643, 2021.
Wang, X., Li, B., Zhao, F., Luo, X., Huang, L., Feng, P., and Li, X.: Variation of Low-Frequency Time-Code Signal Field Strength during the Annular Solar Eclipse on 21 June 2020, Observ. Anal. Sens., 21, 1216, https://doi.org/10.3390/s21041216, 2021.
Zhang, R., Le, H., Li, W., Ma, H., Yang, Y., Huang, H., Li, Q., Zhao, X., Xie, H., Sun, W., Li, G., Chen, Y., Zhang, H., and Liu, L.: Multiple technique observations of the ionospheric responses to the 21 June 2020 solar eclipse, J. Geophys. Res., 125, e2020JA028450, https://doi.org/10.1029/2020JA028450, 2020.
- Abstract
- Highlights
- Introduction
- The state of space weather
- Instrumentation
- Signal-processing techniques
- Background information on the solar eclipse
- Measurements and analysis
- Discussion
- Conclusions
- Code availability
- Data availability
- Author contributions
- Competing interests
- Disclaimer
- Acknowledgements
- Financial support
- Review statement
- References