the Creative Commons Attribution 4.0 License.
the Creative Commons Attribution 4.0 License.
 | 25 Jan 2022
Quantifying the non-linear dependence of energetic electron fluxes in the Earth's radiation belts with radial diffusion drivers
Adnane Osmane
Mikko Savola
Emilia Kilpua
Hannu Koskinen
Joseph E. Borovsky
Milla Kalliokoski
In this study, we use mutual information to characterise statistical dependencies of seed and relativistic electron fluxes in the Earth's radiation belts on ultra-low-frequency (ULF) wave power measured on the ground and at geostationary orbit. The benefit of mutual information, in comparison to measures such as the Pearson correlation, lies in the capacity to distinguish non-linear dependencies from linear ones. After reviewing the property of mutual information and its relationship with the Pearson correlation for Gaussian bivariates, we present a methodology to quantify and distinguish linear and non-linear statistical dependencies that can be generalised to a wide range of solar wind drivers and magnetospheric responses. We present an application of the methodology by revisiting the case events studied by Rostoker et al. (1998). Our results corroborate the conclusions of Rostoker et al. (1998) that ULF wave power and relativistic electron fluxes are statistically dependent upon one another. We also estimate that the Pearson correlation is missing between 20 % and 30 % of the statistical dependency between ULF wave power and relativistic electron fluxes. Thus, the Pearson correlation underestimates the impact of ULF waves on energetic electron fluxes. However, we find that observed enhancements in relativistic electron fluxes correlate modestly, both linearly and non-linearly, with the ULF power spectrum when compared with values found in previous studies (Simms et al., 2014) and with correlational values found between seed electrons and ULF wave power for the same case events. Our results are indicative of the importance of incorporating data analysis tools that can quantify linear and non-linear interdependencies of various solar wind drivers.
- Article
(3336 KB) - Full-text XML
- BibTeX
- EndNote


The Earth's radiation belts are non-linearly driven and weakly collisional plasma environments in which deposited energy and momentum leads to the energisation of electrons to relativistic energies (Van Allen et al., 1958; Walt, 2005). From a fundamental physics perspective, the acceleration of charged particles to supra-thermal energies is ubiquitous to astrophysical plasma environments. As the closest astrophysical accelerator of particles to the Earth, the radiation belts are amenable to detailed in situ measurements of electromagnetic fields' distribution functions. Their studies are therefore relevant to other astrophysical environments with comparable thermodynamical properties in which particles are confined by large-scale inhomogeneous magnetic fields (Kulsrud, 2005). From an applied perspective, a wide range of satellites' orbits overlap with the Earth's radiation belts, with the undesirable consequence that the energetic particles can damage the onboard electronics and shorten the lifespan of communication systems (Baker et al., 2018). Thus, the main focus of Earth's radiation belts' studies is to quantify the processes scaling from electron kinetic scales to planetary scales that enhance and deplete the plasma (Ukhorskiy and Sitnov, 2012; Thorne et al., 2013; Lejosne and Kollmann, 2020).
It has been known for several decades that the Earth's radiation belts were driven far from thermodynamical equilibrium as a result of variable solar wind conditions (McCormac, 1965). This departure from thermodynamical equilibrium results in kinetic distribution functions that are unstable and the production of fluctuations that can thermalise the plasma and accelerate particles. A growing number of in situ measurements and observational studies in the last 2 decades have demonstrated that the Earth's radiation belts' response to solar wind driving and fluctuations can also be non-linear and that non-linearity ought to be accounted for in order to improve prediction capabilities (Wing et al., 2016; Simms et al., 2018). From a theoretical perspective, every self-consistent set of equations describing fluid- and kinetic-scale plasma physics is inherently non-linear. The departure of linearity in a dynamically evolving plasma translates into the appearance, and therefore measurements, of non-Gaussian fluctuations (Papoulis and Pillai, 2002). Even if a non-linear system is initialised with Gaussian fluctuations, non-Gaussian fluctuations would eventually emerge. It is therefore not surprising that non-Gaussian fluctuations are commonly found across a wide range of astrophysical plasma environments (Dudok de Wit and Krasnosel'skikh, 1996; Marsch and Tu, 1997; Stepanova et al., 2003; Osman et al., 2014; Osmane et al., 2015b). Taking into account the above theoretical constraints and observational results, one quickly recognises that in order to quantify non-linearity in the Earth's radiation belts, one has to use measures that can be sensitive to non-linear dependencies and are capable of distinguishing them from linear ones.
In this study, we present an application of information theory to the search of dependencies between energetic electron fluxes measured in the Earth's radiation belts and ultra-low-frequency (ULF) wave power measured both at geostationary orbit and on the ground. Unlike more commonly used measures like the Pearson correlation, information-theoretic tools, such as mutual information, have the benefit to distinguish non-linear dependencies from linear ones. In order to demonstrate the value in the use of information-theoretic methods, we revisit the highly cited case studies of Rostoker et al. (1998). In their study, it was suggested that ULF pulsations can provide energy for acceleration of electrons to relativistic energies based on visual inspection of relativistic electron fluxes at geostationary orbit and ground ULF wave power. It should be stressed that Rostoker et al. (1998) conclusions are cautiously stated and that a value for a correlation or any other measure is not provided. Nonetheless, it is not too uncommon to find citing authors describing their results as compelling and evidence of strong correlation between ULF wave power and relativistic electron fluxes. The impact of ULF fluctuations in the enhancement and loss of energetic electron fluxes also forms the basis of radial diffusion formalisms and is, as of today, understood as one of the two dominant transport mechanisms in planetary radiation belts (see Lejosne and Kollmann, 2020, and references therein).
The application of information-theoretic measures to space plasma problems is not new, but it has recently shown its utility for a wide range of methodologies and problems (see De Michelis et al., 2011; Wing et al., 2016; Runge et al., 2018; Johnson et al., 2018; Wing et al., 2018; Osmane et al., 2019; Wing and Johnson, 2019; Cameron et al., 2019, and references therein). Of particular relevance to our study, Wing et al. (2016) presented an application of information-theoretic measures to quantify the dependence of relativistic electron fluxes measured on geostationary orbits to a wide range of solar wind drivers. In their study, Wing et al. (2016) demonstrate that the solar wind speed is the main driver and that the effect of the solar wind density, sometimes suggested as a dominant driver for relativistic electron fluxes (Balikhin et al., 2011), holds 30 % lesser information content and operates on a different timescale. The main departure between the work presented hereafter and the study of Wing et al. (2016) lies in our introduction of a quantity called information-adjusted correlation and the use of a dataset that has a 1 h resolution of geostationary-measured seed and relativistic electron fluxes. The information-adjusted correlation is defined as the correlation value that would be obtained from the mutual information under the assumption that the dependence between the two variables can be represented as a Gaussian bivariate. The choice of a Gaussian bivariate to distinguish linear and non-linear dependences as hinted above stems from the fact that non-linear equations produce non-Gaussian statistics, even in the instance where a system is initialised with Gaussian-distributed random variables (Papoulis and Pillai, 2002). We therefore present a methodology that allows us to provide clear answers to the following two questions:
-
Are the events studied by Rostoker et al. (1998) evidence of statistical dependence between ULF wave power and electron fluxes?
-
Are non-linearities present in the instance where the dependence between ULF wave power and electron fluxes is statistically significant?
Our report is presented as follows. Section 2 presents a brief summary of the tools of information theory used for the analysis. We put a particular emphasis on the application of mutual information to the case of Gaussian random variables of arbitrary correlation, which serves as a benchmark for linear dependencies. In Sect. 3 we describe the dataset used and the associated instruments' specificities relevant to our study. In Sect. 4, we present our results for geostationary-measured seed and relativistic electron fluxes measured during the events presented by Rostoker et al. (1998). In Sect. 5, we interpret and compare our results in light of previous studies and then conclude with suggestions for future studies and improvement of our methodologies for instances where statistical dependencies are difficult to extract.
In this section we present a definition of mutual information in terms of the Shannon entropy and the specific mutual information of Gaussian bivariate random variables. The Gaussian bivariate case with arbitrary Pearson correlation ρ is used as a toy model to benchmark the numerical estimate of mutual information and to distinguish linear from non-linear statistical dependencies. A detailed description and derivation of mutual information for Gaussian bivariates is provided in the Appendix for the interested reader.
2.1 Mutual information
It is preferable to introduce mutual information by first defining the Shannon entropy H(X) for a discrete random variable X (Cover, 1999). The Shannon entropy is a measure of the uncertainty contained in a random variable. In communication theory it is the number of bits on average required to describe a message X∈𝒳, in which 𝒳 denotes the alphabet, or equivalently the discrete states that can be assigned for the random variable X. Practically speaking, if Nadia wants to send a message to Jorge, the Shannon entropy is the average number of binary questions (e.g. yes or no) one ought to ask in order to accurately decode a message X written in terms of a given alphabet 𝒳. Mathematically, it is written in terms of the probability mass function p(x) as
The Shannon entropy is a positive definite quantity H(X)≥0 and is bounded by with equality if and only if the random variable X is distributed uniformly over 𝒳. Since the entropy is a measure of uncertainty (or equivalently knowledge), it is convenient to ask what happens to the amount of uncertainty if we are given additional information encoded in terms of Y∈𝒴. In other words, do we gain or lose information about the likelihood of event X given Y? Intuitively, one can assume that if X and Y are entirely independent, knowing one says nothing about the other1. On the other hand, if X and Y are contingent to one another, or share a causal relationship, it can then be shown that conditioning effectively reduces entropy and therefore uncertainty. In the instance where X and Y are independent, the conditional entropy H(X|Y), which should be read as the entropy of X given Y, reduces to H(X). On the other hand, if X and Y are statistically dependent, the entropy will be reduced, with . For two random variables X and Y, this reduction in uncertainty is quantified by the mutual information:
The mutual information is symmetric in X and Y and is a measure of the dependence between two random variables. It is always non-negative and only equal to zero if X and Y are independent or equivalently if the joint distribution is the product of the marginals; i.e. . In our analysis the variable we use (i.e. electron fluxes and ULF wave power) are continuous; however, the use of Eq. (2) requires binning and therefore discretisation. Thus, Eq. (2) has been used to compute an estimator of mutual information for the dataset described in Sect. 3.
Even though probability distribution functions of electromagnetic fields and particle velocity distributions in space plasmas often depart from Gaussianity, it is useful to refer to the Gaussian bivariate case to develop an appreciation of mutual information for linear systems and as a benchmark to test numerical estimates. Conveniently, there is an exact analytical relationship between the Pearson correlation and mutual information of a Gaussian bivariate in terms of the Pearson correlation ρ:
The interested reader can find a definition of mutual information for continuous random variables and the derivation of Eq. (3) for Gaussian bivariates in the Appendix. Since the mutual information is a measure of how much we know from X given Y and vice versa, the non-linear relationship between mutual information and the correlation is an indication that the Pearson correlation should not be interpreted linearly. Indeed, the difference in information between random variables of 0.75 and 0.5 correlation is not of order 50 % () but rather 187 %. Thus, two random variables with Pearson correlation of 0.75 carry a much larger amount of information upon one another than one with correlation of 0.5. An additional constraint with the Pearson correlation resides with fat-tailed random variables. For Gaussian bivariates, independence is synonymous with being uncorrelated. However, for fat-tailed random variables, as commonly measured in space and astrophysical plasmas, strongly dependent random variables can have zero correlation (Taleb, 2020). Unlike the Pearson correlation, mutual information is able to quantify the dependence of random variables in the absence of correlation. As a simple example the reader can test for themself, consider two random variables X and Z. is a Gaussian random variable with zero mean and a standard deviation of 1. Z is the square of X; i.e. Z=X2. Thus the relationship between Z and X is non-linear, and there is no doubt that Z and X are statistically dependent on one another. However, computing the Pearson correlation is inconclusive as it gives a value of zero, whereas mutual information computed with the code described below indicates a large statistical dependence with a value of 1.42.
2.2 Numerical computation of mutual information
The procedure we follow to compute the mutual information for two time series consists in binning the data according to the Freedman–Diaconis rule (Freedman and Diaconis, 1981). Thus, even though the electron fluxes and ULF wave power are continuous, our procedure has the consequence to discretise the variables. This discretisation leads to biases in the estimation of mutual information that are dependent on the number of measurement points N and statistical dependence of the two variables. For instance, two Gaussian random variables with a high correlation would require fewer measurement points to estimate the mutual information than two Gaussian random variables with a low correlation or two fat-tailed random variables with some arbitrary correlation. Using numerically produced Gaussian bivariates with N points and the analytical relationship between mutual information and correlation in Eq. (3), one can therefore test mutual information estimators and quantify the error due to binning.
In Fig. 1 we plotted the numerical estimate and analytical solution for 106 points extracted from Gaussian bivariates with correlations ranging between −1 and 1. Figure 1 is provided to show the correspondence between the Pearson correlation and mutual information and give an estimate of what values of mutual information are considered large. Figure 1 shows that values greater than 0.5 are considered large.
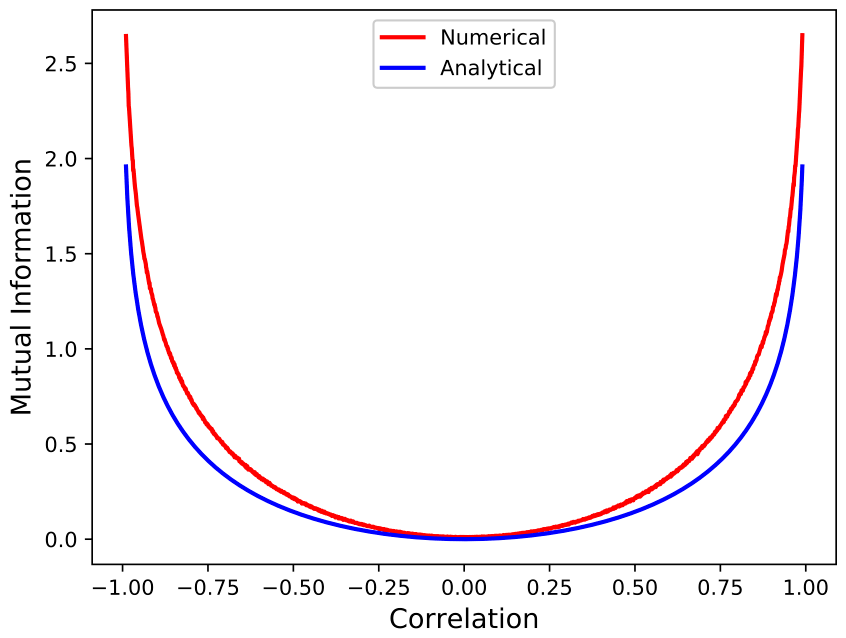
Figure 1Mutual information estimator for bivariate Gaussian random variables with and zero mean as a function of the correlation . The numerical value is traced in red and the analytical in blue. The estimator is computed for N=105 points and 46 bins according to the Freedman–Diaconis rule.
Comparing the theoretical and numerical value of mutual information in Fig. 1, we note that our estimator does well for low correlation values, though it gains a discrepancy as large as 10 % for correlation absolute values greater than 0.5. In order to estimate the error introduced by discretisation, we apply a shuffle test to the two time series and compute the average value of mutual information and its standard deviation for 100 shuffles. We find that the error computed with the shuffling procedure is Gaussian-distributed, and we interpret the average mutual information obtained from shuffling as the zero baseline level. This baseline for each events is plotted as a bold orange line in Figs. 4–11 for panels (a) and (c). The shaded orange area represents the 3 standard deviation range from the mean. Estimates of mutual information for electron fluxes and ULF wave power above the shaded area are therefore interpreted as significant with ± 3 standard deviation. More sophisticated methods to compute mutual information through non-parametric methodologies are possible (Kraskov et al., 2004), but for our dataset, the statistical dependence between variables and the number of points is sufficient for us to answer the questions stated in the Introduction.
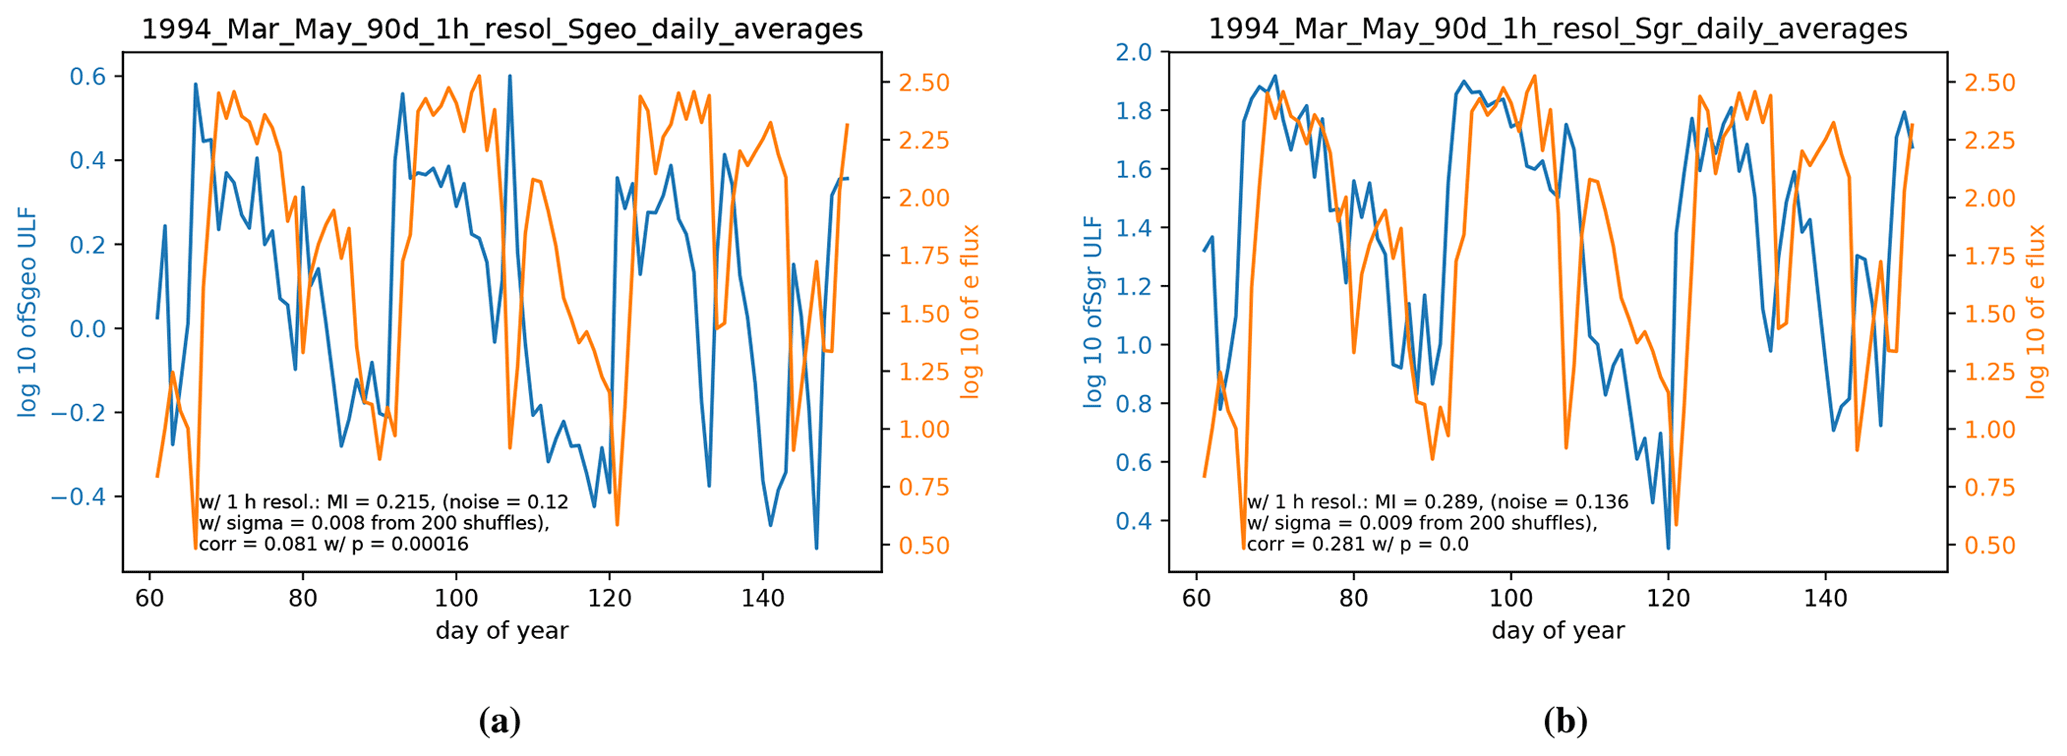
Figure 2(a) The 24 h average of relativistic electron flux index Fe1.2 and geosynchronous ULF index Sgeo for the 1994 event from the Rostoker et al. (1998) study. (b) Same as for panel (a) but with ground ULF index Sgr for the 1994 event. We note that visually the ground index Sgr follows the relativistic electron flux index more closely for the duration of the event.
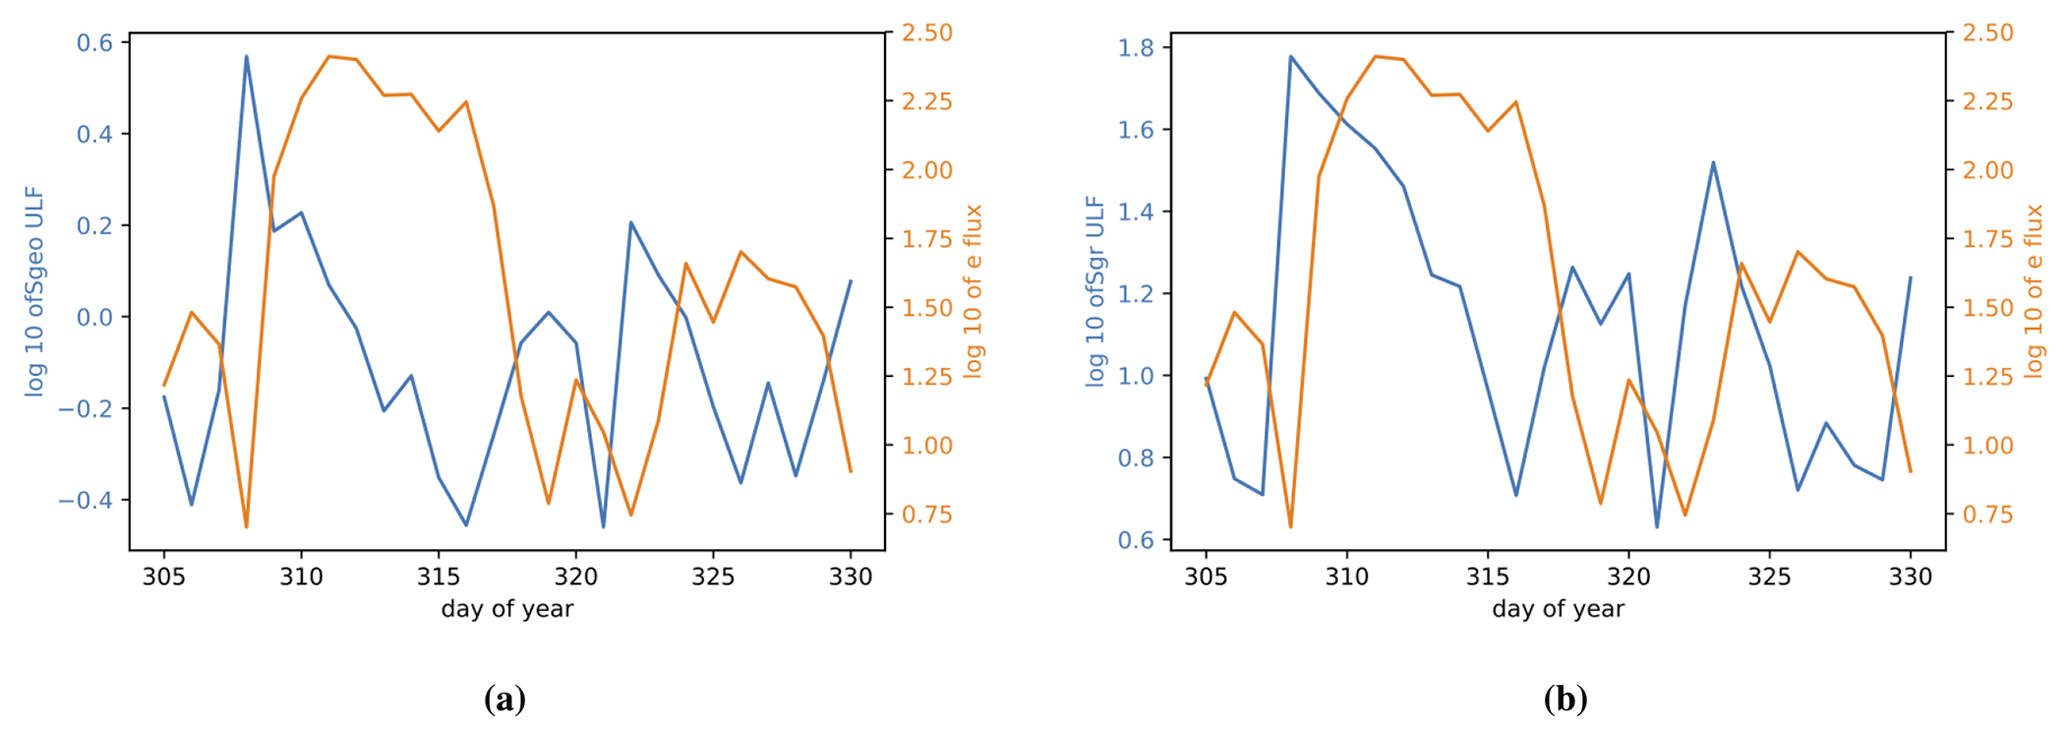
Figure 3(a) The 24 h average of relativistic electron flux index Fe1.2 and geosynchronous ULF index Sgeo for the 1993 event from the Rostoker et al. (1998) study. (b) Same as for panel (a) but with ground ULF index Sgr for the 1993 event.
The data used in this study correspond to the two events analysed by Rostoker et al. (1998). The first period extends from 2 to 31 May 1994 (91 d in total), and the second one spans from 1 to 26 November 1993. During the first period a big geomagnetic storm occurred on 17 April with minimum Dst of −201 nT, and the period featured also several moderate and intense storms. During the second period an intense storm peaked on 4 November with minimum Dst −119 nT. Another significant storm during this latter period was a moderate storm on 18 November with minimum Dst −82 nT. Both periods were thus geomagnetically active. Our choice to revisit the work of Rostoker et al. (1998) through mutual information stems from the fact that such methodology has not been used before and that their study, highly cited in the literature as evidence that radial diffusion is a leading mechanism for the energisation of relativistic electrons, can serve as a benchmark for more involved methodologies. Additionally, we have access to a comparable dataset with better resolution (1 h resolution instead of 1 d), so we cannot only revisit the results of Rostoker et al. (1998) with information theory but find a more accurate time lag for the electron's response to ULF wave power. In Rostoker et al. (1998) the Pc5 ULF measurements were from the Gillam measurement station of the Canadian Auroral Network for the OPEN Program Unified Study Project (CANOPUS), and the electron fluxes (>2 MeV) were from Geostationary Operational Environmental Satellite 7 (GOES 7). The GOES data are the daily average flux, and the ULF data are the average over a 6 h period from dawn to noon.
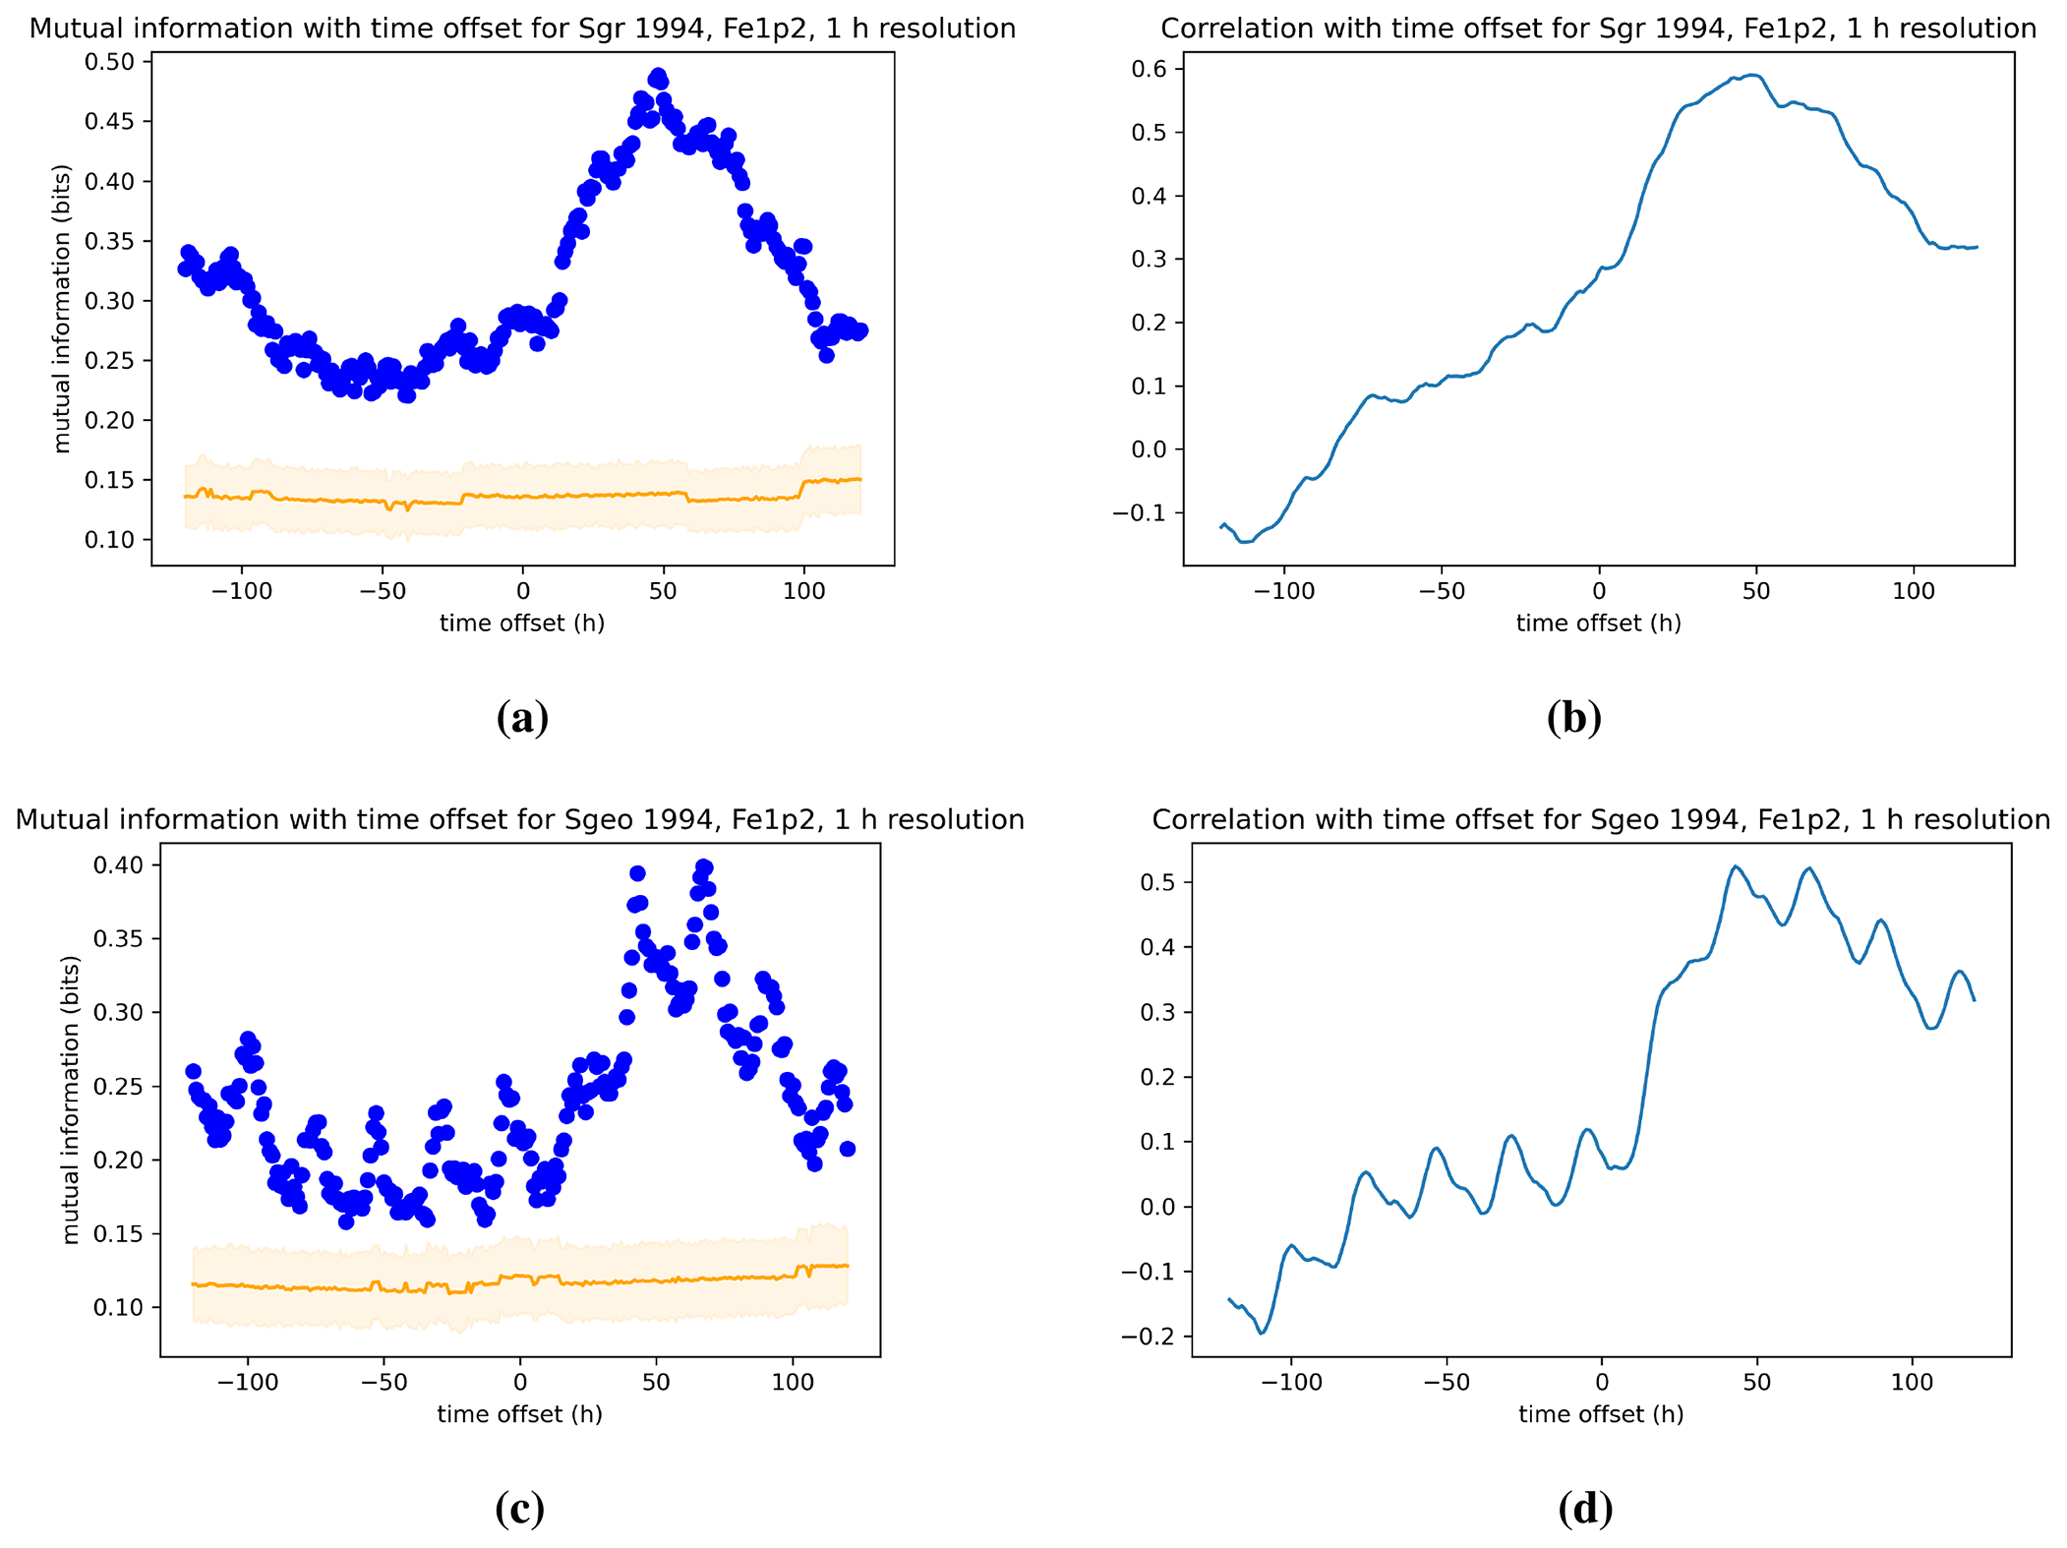
Figure 4Dependence of the mutual information and Pearson correlation for ground (a, b) and geosynchronous (c, d) ULF power with the relativistic electron index Fe1.2 for the 1994 event. The data for both indices are processed with 1 h resolution. See Sect. 4.1 for a description of the figures.

3.1 ULF power spectrum
The ULF data used in this analysis were from National Aeronautics and Space Administration's (NASA) Virtual Radiation Belt Observatory (ViRBO) and the ULF indices used, Sgr and Sgeo, both describing ULF spectral power from which noise has been removed, are derived in Kozyreva et al. (2007) The ULF data are for a Pc5 frequency range of 2–10 mHz. The ULF indices used in this work are the logarithm in base 10 of the signal spectral power. The signal spectral power is the integral over the power spectral density above the noise level (Kozyreva et al., 2007). The index values of signal spectral power are 1 h averages from measurements done in 1 min resolution by a global network of measuring stations. The measurements of each station are averaged separately, and the index value is the maximum of those hourly averages. The in situ geosynchronous index Sgeo has been calculated from the measurements of GOES spacecraft, and the ground ULF index Sgr is based on measurements from stations in the Northern Hemisphere. The ULF measurements from ground stations for any hour of universal time have been done in the magnetic local time (MLT) sector from 3 to 18 h and between the CGM (corrected geomagnetic) latitudes 60 and 70∘. For the ground index, omitting the stations outside the MLT sector from 5 to 15 h has little effect on the measurement results, since the cross-correlation between the ULF measurements in the MLT interval of 3 to 1 h and those that span the MLT interval 0 to 24 h is about 0.95 (Kozyreva et al., 2007). It is interesting to compare both ground and geostationary ULF activity since toroidal ULF waves with small azimuthal mode number m waves can transmit to the ground, whereas poloidal ULF waves with high azimuthal mode number m are confined to the inner magnetosphere. Azimuthal mode number affects the electron energies that can resonate with these waves, and a discrepancy in correlational measures for ground and geostationary ULF measurements can be indicative of certain wave mode dominance.
3.2 Seed and relativistic electron fluxes indices
In order to quantify the electron fluxes we use the indices Fe1.2 and Fe130 described in Borovsky and Yakymenko (2017) for electrons with energies near 1.2 and 130 keV, respectively. The indices are computed as the base 10 logarithm of the maximum geostationary-measured electron fluxes by any of the SOPA instruments on board the Los Alamos National Laboratory (LANL) spacecraft for a given energy channel at the outer radiation belts. For every hour of universal time, the maximum of 6 min median values over all satellites is recorded as the flux value during that hour. The median values for each satellite are calculated from measurements done at a 10 s sampling rate2. Fe130 is a measure of the intensity of substorm-injected electrons in the dipolar magnetosphere: Fe130 rises rapidly at the onset of a magnetospheric substorm and subsequently decays over the timescale of a few hours. Fe1.2 is a measure of the intensity of the outer electron radiation belt: Fe1.2 grows slowly during very active times and decays over the timescale of a few days during quiet times. Fe1.2 can also exhibit sudden dropouts at the onsets of geomagnetic storms.
Figures (2) and (3) show the 24 h average of relativistic electron flux indices and ULF power indices as a function of time for the two events studied by Rostoker et al. (1998). In each figure the panel on the left has the geosynchronous ULF index plotted, whereas the panel on the right has the ground ULF index plotted. We remind the reader that our datasets have different time resolutions from those used by Rostoker et al. (1998) with 24 h resolution, whereas we use 1 h resolution and 24 h moving averages. However, the visual comparison of Figs. 2 and 3 to Figs. 1 and 2 in Rostoker et al. (1998) shows that they are very similar 3. In the following we will look at each event separately and compare the values obtained for the mutual information and the Pearson correlation. The reader can also skip Sect. 4.1 to 4.4 and consult Table 1 which contains a summary of our results. Table 1 is extracted from the information found in Figs. 4–11, and while the shape of the statistical dependencies shown in Figs. 4–11 is similar, differences between the events are significant.
Table 1Maximum values in correlation and mutual information for positive lags and associated adjusted correlation.
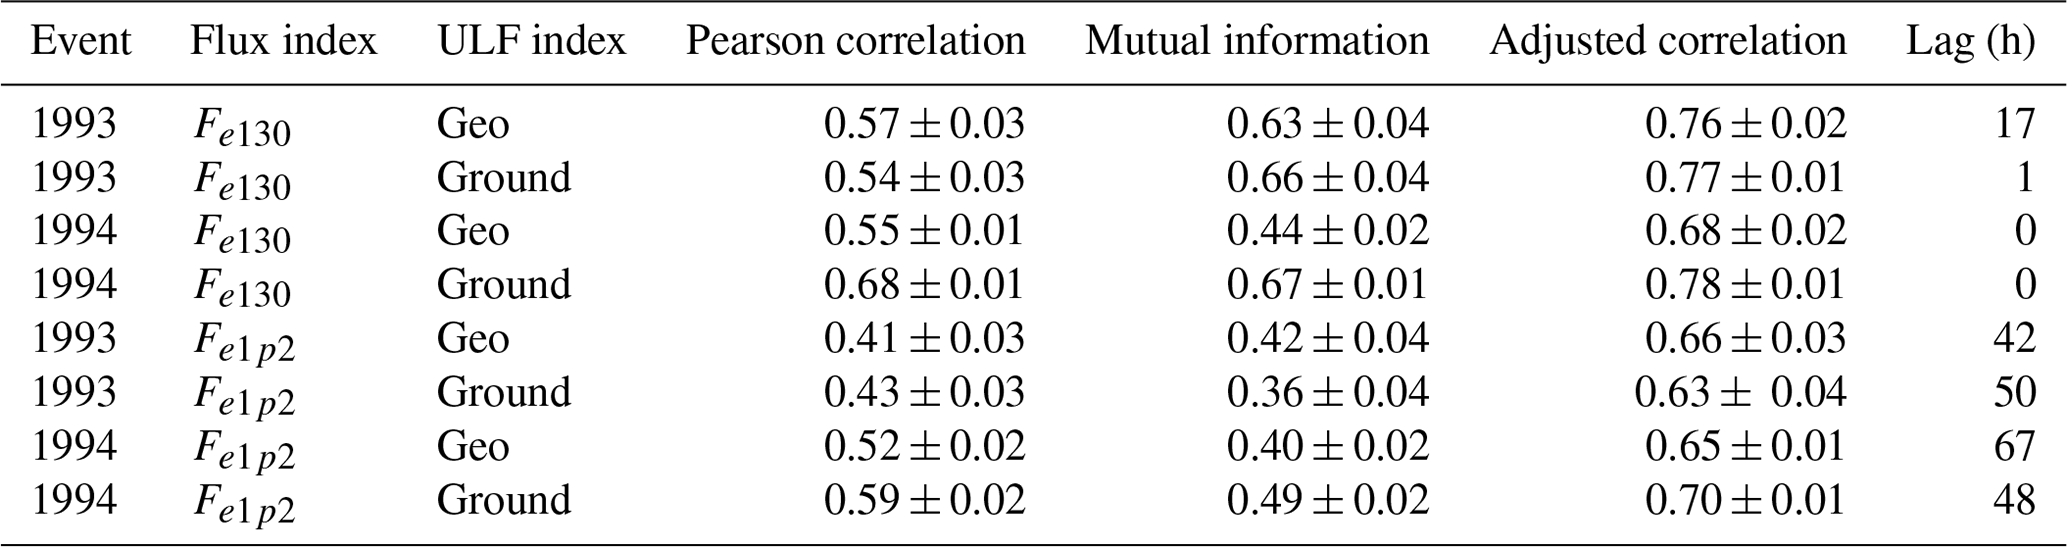
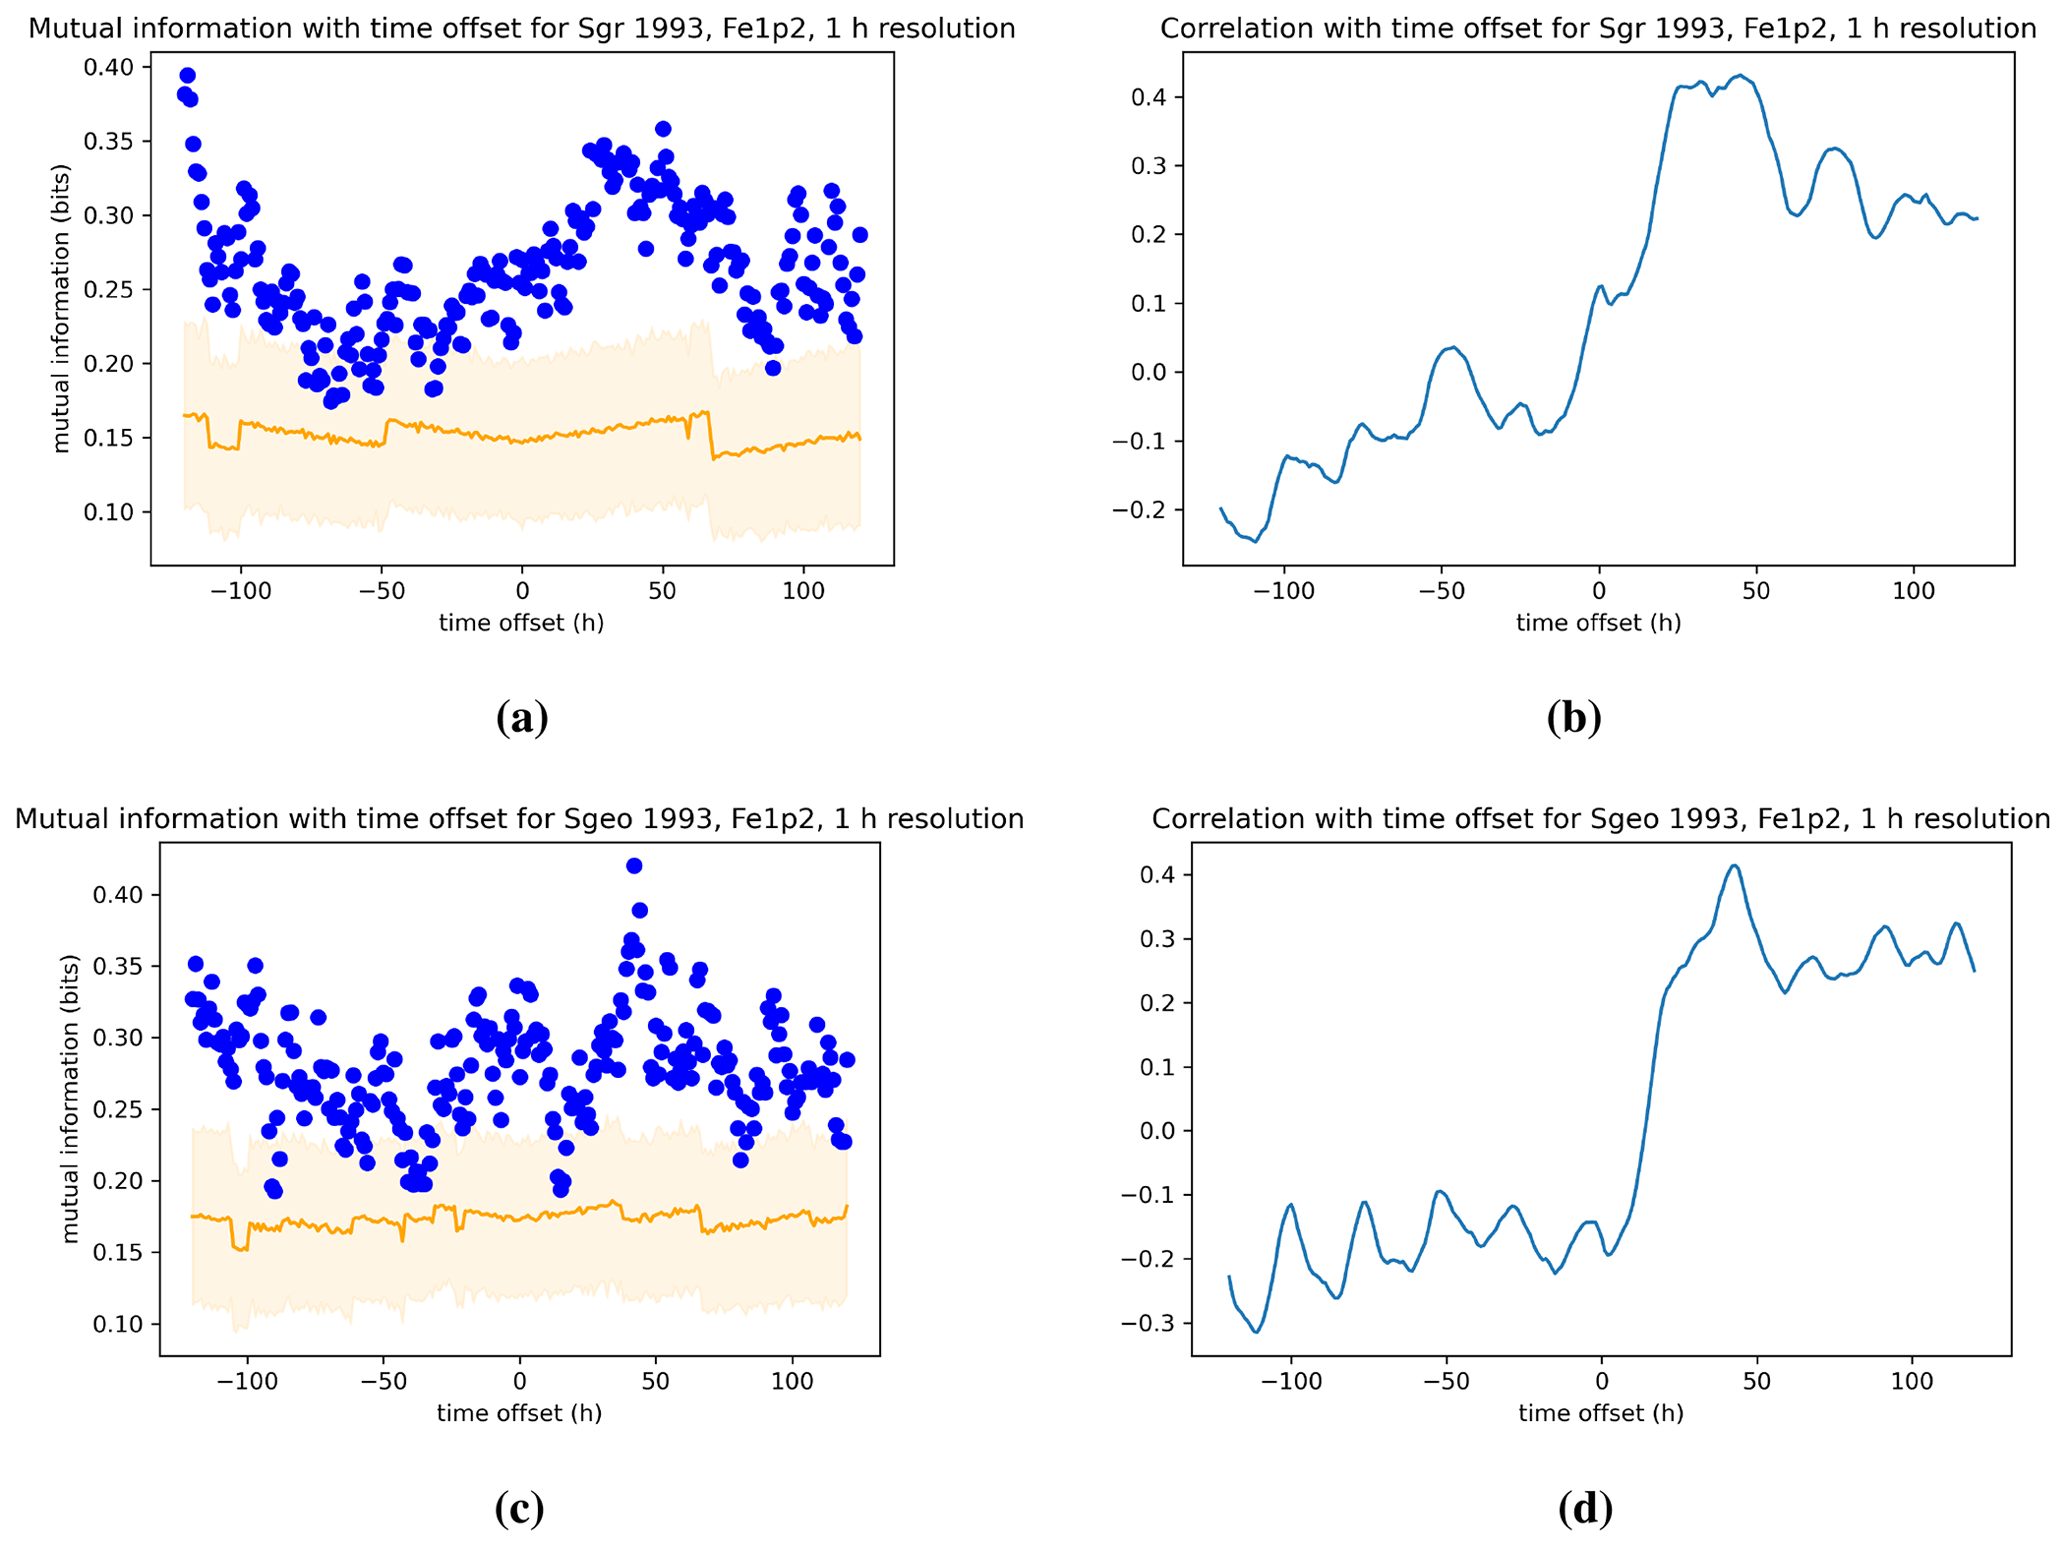
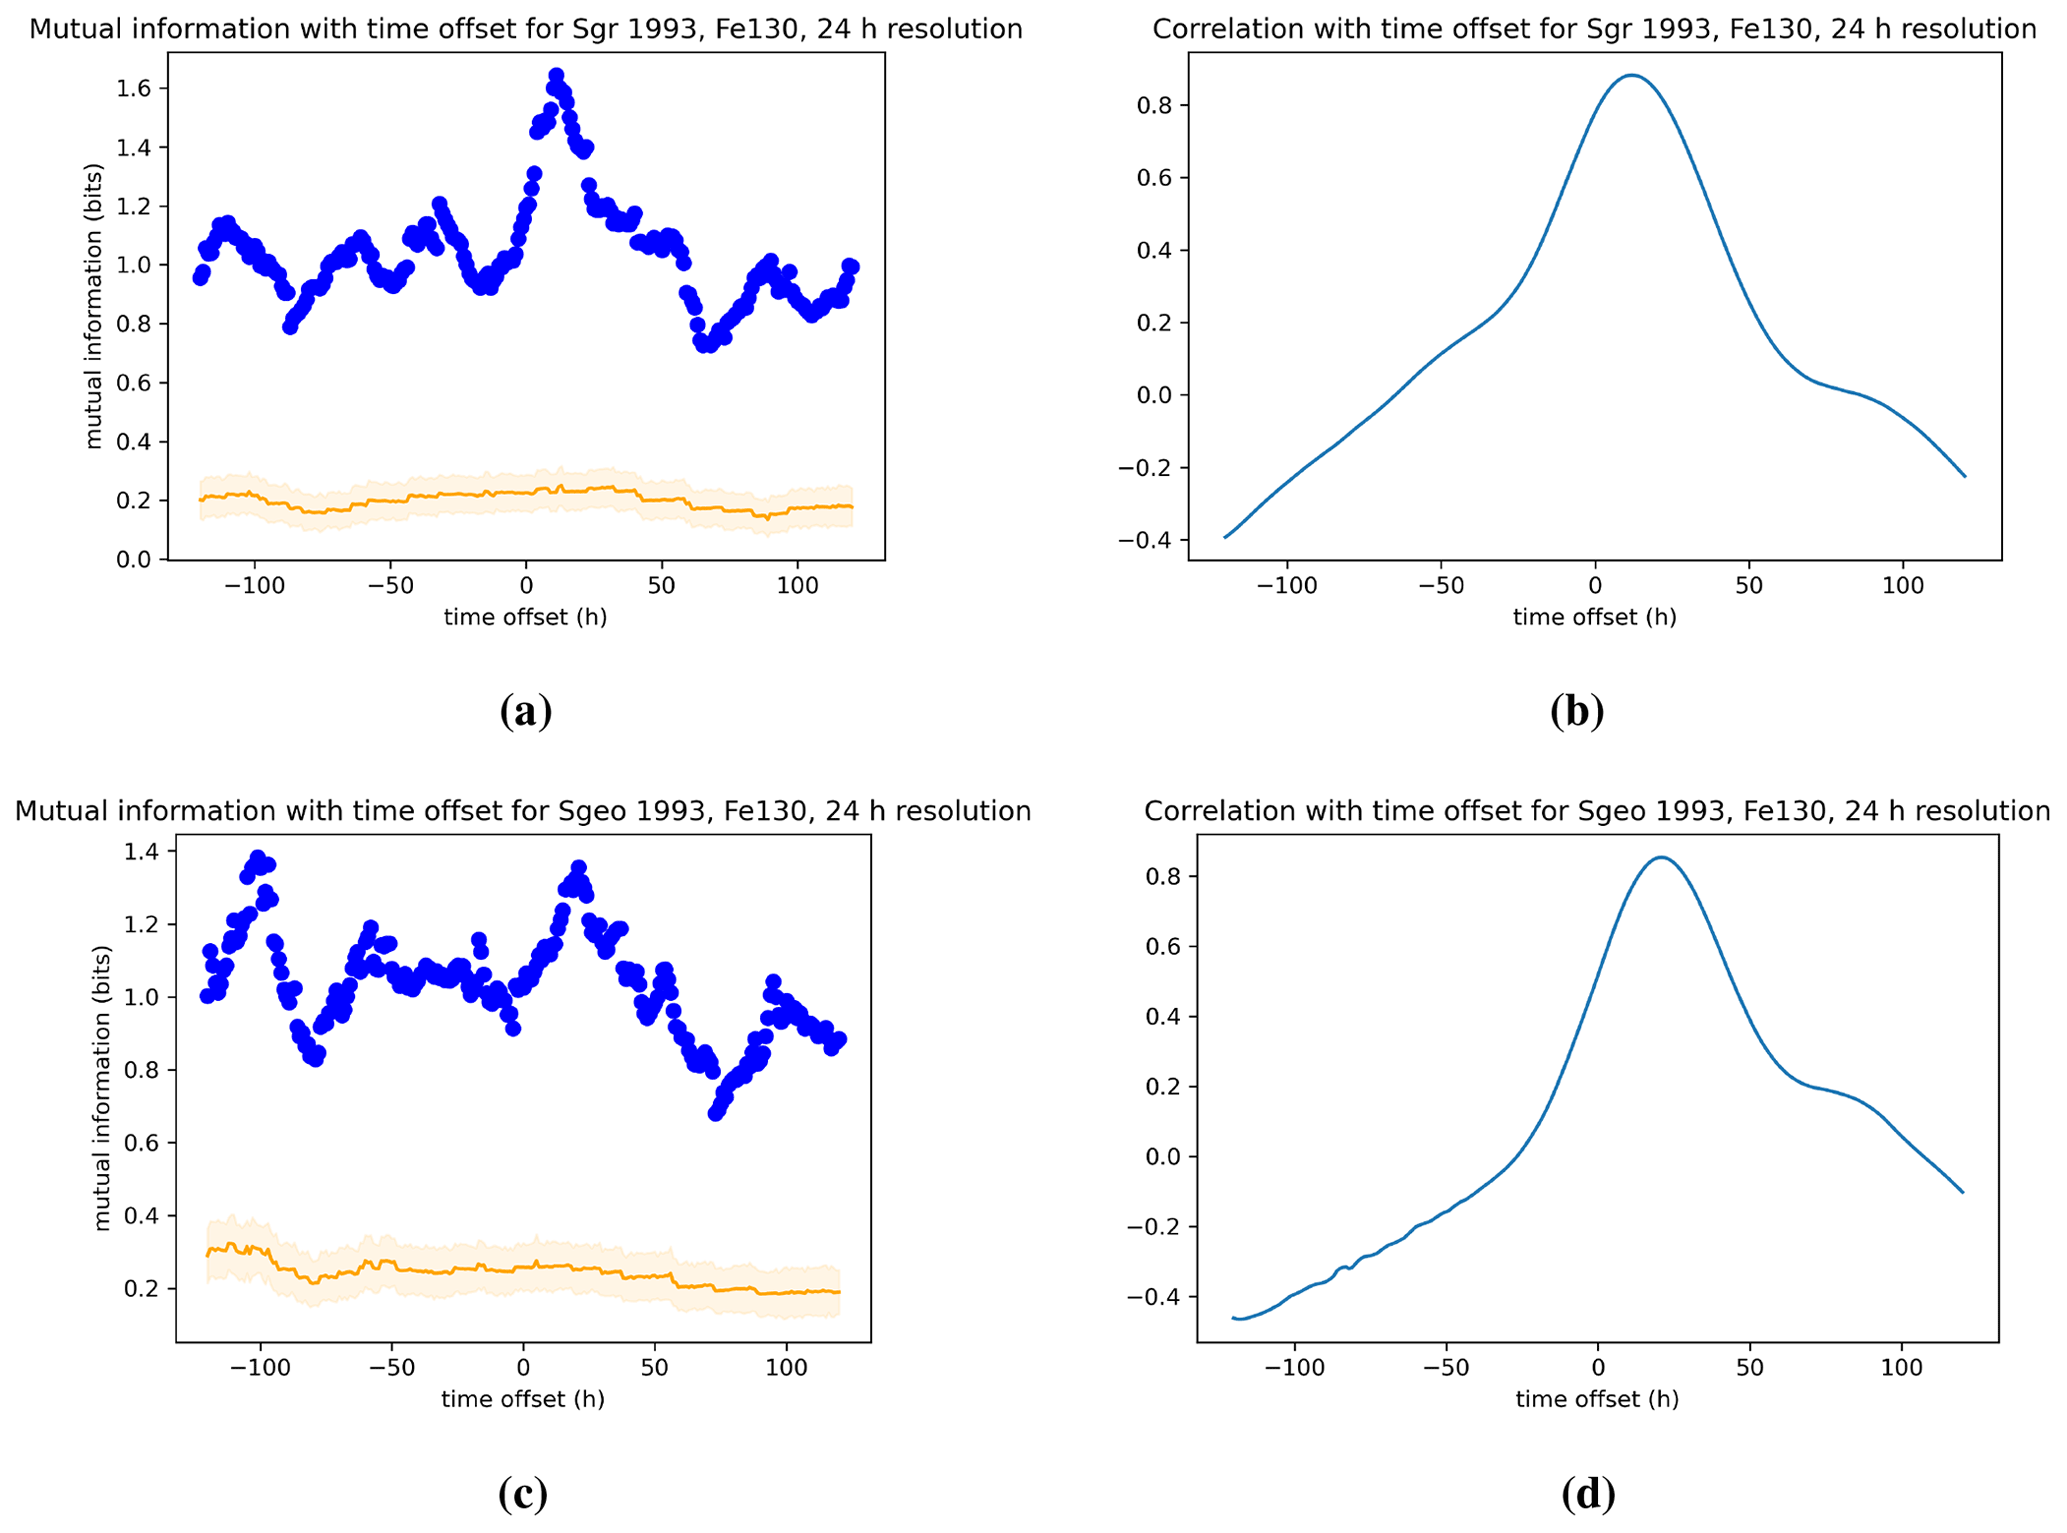
Figure 6Same as in Fig. 4 but for the 1993 event of Rostoker et al. (1998).

Figure 7Same as in Fig. 5 but for the 1993 event of Rostoker et al. (1998).
4.1 Event 1 for the electron index Fe1.2
Figure 4 shows the mutual information and correlation of the relativistic electron flux index Fe1.2 with ULF wave power as a function of time lag for Event 1 from 1 March to 31 May 1994 of Rostoker et al. (1998). The increment in time lag is of 1 h. A positive time lag indicates that changes in ULF wave power precede those in the electron flux, and the opposite is true for a negative time lag. Panels (a) and (b) in each figure show the dependence on ULF ground index Sgr, whereas panels (c) and (d) are for the dependence on ULF geostationary index Sgeo. The orange line in the panels with mutual information represents the zero value on the basis of the shuffling procedure described in the Methodology section. The shaded area overlapping the zero curve for mutual information represents the 3 standard deviation spread. Thus a value above the shaded area represents a measurement of mutual information that has at least 6σ significance.
We note that the peaks in mutual information and Pearson correlation occur between 48 and 50 h time lag and have maximum values of Imax≃0.5 and ρmax≃0.55–0.6. The mutual information and correlation of electron fluxes with geostationary ULF power Sgeo show a prominent 24 h modulation. As is typical for an index that measures magnetospheric quantities, Fe1.2, Fe130, Sgr, and Sgeo have 24 h periodicities in them caused by dipole wobble and longitudinal station coverage, etc. These 24 h periodicities show up as 24 h peaks in their autocorrelation functions (see Fig. 2a of Borovsky and Yakymenko, 2017, for Fe1.2 and Fe130, and see Fig. 4a and b of Borovsky and Denton, 2014, for Sgr and Sgeo). These 24 h periodicities will also show up in the cross-correlations between magnetospheric variables. Another main difference between mutual information and correlation in Figs. 4 and 5 is that mutual information consistently has very pronounced secondary peaks at time offset around −100 h, whereas the secondary peaks in the Pearson correlations appear to be less pronounced or less significant. In the Discussion section we show that the Pearson correlation is missing out about 20 %–30 % of the statistical dependence due to its inability to capture non-linearities and that differences in peaks between mutual information and Pearson correlation might be at least partially explained by the inability of the latter to measure non-linear statistical dependencies.

Figure 8Dependence of the mutual information and Pearson correlation for ground (a, b) and geosynchronous (c, d) ULF power on the 130 keV electron index Fe130 for the 1994 event. The data for both indices are processed with 1 h resolution.
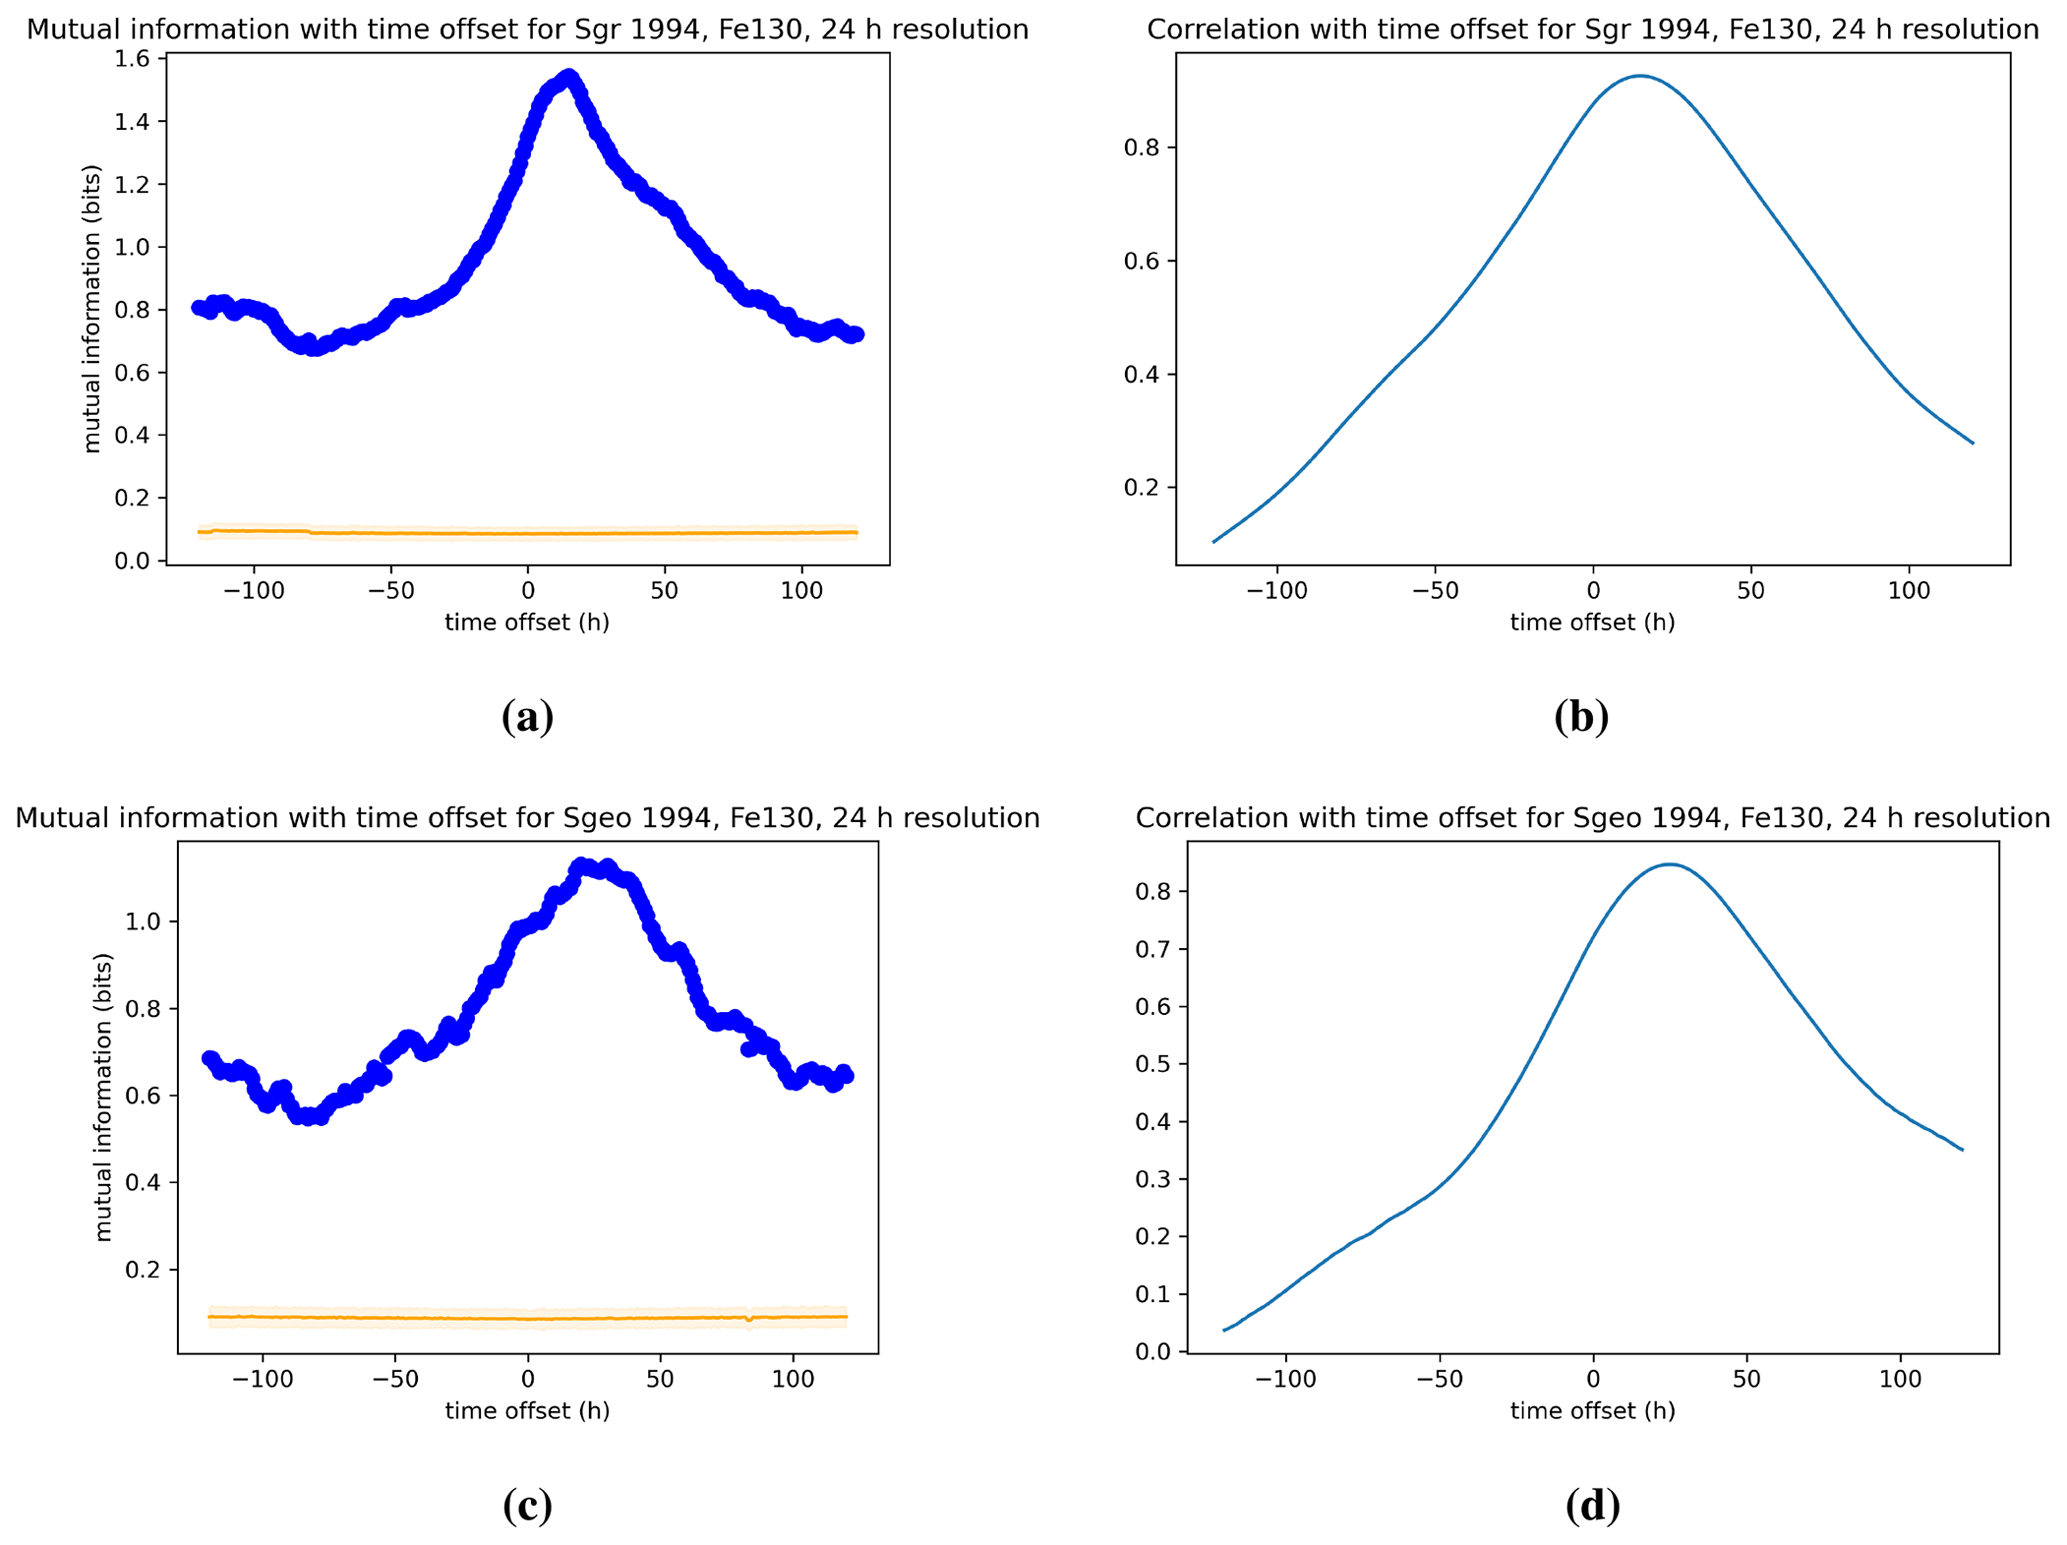
Figure 5 looks at the same dependence as in Fig. 4 but for a 24 h time moving average of the indices. Using a time moving average introduces statistical dependence between points less than 12 h lag apart but is useful to denote long-term trends. The mutual information and correlation in Fig. 5 have the same peaks and shape as in Fig. 4 for the 1 h resolution, but because of the averaging the modulation present in the high-resolution data is lost.
4.2 Event 2 for the electron index Fe1.2
Figure 6 shows the mutual information and correlation of the relativistic electron flux index with ULF wave power as a function of time lag for Event 2 from 2 to 26 November 1993 of Rostoker et al. (1998). Similarly to Fig. 4, indices are plotted with a 1 h time lag increment. The panels (a) and (b) in each figure show the dependence on ULF ground index Sgr, whereas panels (c) and (d) are for the dependence on ULF geostationary index Sgeo. We note that for Event 2 local peaks occurs for 24–48 h lag time, but both the mutual information and Pearson correlation, for comparable resolution, are significantly weaker than for Event 1 with Imax<0.4 ρmax<0.5. Unlike for Event 1, Event 2 shows different dependence on the time lag between the mutual information and correlation. This discrepancy between the two measures could be indicative of time-dependent non-linearity of relativistic electron fluxes with ULF wave power.
Figure 7 looks at the same dependence as in Fig. 6 but for a 24 h time moving average of the indices. A 24 h running average removes the 24 h periodicity in the indices and hence removes the 24 h peaks in the cross-correlations. We note that the value of the mutual information is once again significantly enhanced since the averaging introduces statistical dependencies between two points less than 12 h apart, but we also notice that there is a different dependence than for the Pearson correlation. These differences between the two measures and their potential origin in non-linear phenomena are discussed in the Discussion section.

4.3 Event 1 for the electron index Fe130
Figure 8 shows the mutual information and correlation of 130 keV electron flux index Fe130 with ULF wave power as a function of time lag for Event 1 of Rostoker et al. (1998). The indices are once more plotted with a 1 h resolution and time lag increment. The panels (a) and (b) in each figure show the dependence on ULF ground index Sgr, whereas panels (c) and (d) are for the dependence on ULF geostationary index Sgeo. We note that the time lag dependence of mutual information and correlation is comparable and that the peak in both occurs for a lag of τ=0. The peak in the mutual information between Sgr and Fe130 is , which is significantly greater than the mutual information between Sgr and Fe1.2. On the other hand, the peak in the mutual information between Sgeo and Fe130 is , which is comparable to the peak value we found for the mutual information between Sgeo and Fe1.2. As observed in Fig. 4 we also note a modulation in the mutual information and correlation of electron fluxes with geostationary ULF power Sgeo not present in the dependence on the ground power index Sgr. Figure 9 shows the same dependence as in Fig. 8 but for a 24 h time moving average of the indices.
4.4 Event 2 for the electron index Fe130
Figure 10 has the same description as Fig. 8, but the mutual information and Pearson correlation are computed for Event 2 of Rostoker et al. (1998). Similarly to Event 1, Event 2 shows that the time lag dependence of mutual information and correlation is comparable and that the peak in both occurs around a lag of τ=0 and values of –0.68. Figure 11 looks at the same dependence as in Fig. 10 but for a 24 h time moving average of the indices. A comparison of Event 1 and Event 2 shows a similar time response and dependence of 130 keV electron flux index Fe130 with ULF wave power.
We are now ready to answer the two questions stated in the Introduction. (1) Are the events studied by Rostoker et al. (1998) examples of strong ULF wave power and energetic electron dependence? (2) Is the statistical dependence between ULF wave power and electron fluxes non-linear? In order to answer these two questions, we have tabulated the values of the maximum Pearson correlation and maximum mutual information for all events in Table 1. The columns denote, from the left to the right, the event year, the flux index, the ULF index, the maximum Pearson correlation, the maximum mutual information, the information-adjusted correlation, and the lag for the maximum mutual information, respectively. The information-adjusted correlation is defined as the correlation value that would be obtained from the mutual information under the assumption that the dependence between the two variables can be represented as a Gaussian bivariate (cf. Eq. 3). The choice of a Gaussian bivariate to distinguish linear and non-linear dependences stems from the fact that non-linear equations produce non-Gaussian statistics, even in the instance where a system is initialised with Gaussian-distributed random variables (Papoulis and Pillai, 2002). Mathematically, the information-adjusted correlation can be defined by applying the inverse of Eq. (3):
The information-adjusted correlation ρadj allows us to determine whether the Pearson correlation has underestimated the dependence between the random variables due to the presence of non-linearity. The instance in which the adjusted correlation is statistically comparable to the Pearson correlation denotes that a linear dependence between the fluxes and ULF power dominates and that non-linear dependencies are either too weak or non-existent. In the opposite case, an adjusted correlation larger than the Pearson correlation indicates that non-linear dependencies between fluxes and ULF power are statistically significant.
Are the events evidence of strong ULF wave power and energetic electron dependence? For the two events studied, the Pearson correlation and the mutual information are both statistically significant and well above the noise level. However, the maximum correlation values for relativistic electrons range between 0.41 and 0.59, and the maximum mutual information values range between 0.36 and 0.49. For comparisons, the analyses by Simms et al. (2014) from 219 storms show values of correlation of 0.65 for ground ULF and 0.50 for GOES ULF with relativistic electron fluxes. Thus, the values for correlation of the 1993 event are showing weaker linear and non-linear statistical dependence, whereas the 1994 event has correlation values on par with events found over 11 years of data (Simms et al., 2014). The methodology of Simms et al. (2014) separates variables in terms of storm phases and defines a predictor variable, for example, ULF wave power, as an average over an appropriate time period for a given storm phase. Since we are studying case events, the statistical methodology of Simms et al. (2014) cannot be explicitly reproduced, but we find comparisons with our results useful in that it gives us a point of reference to judge the strength of the correlation values we found. For another comparison, for all times during the years 1995–2006, Borovsky (2017) found a Pearson correlation coefficient of 0.34 between Fe1.2 and Sgr, whereas they found a higher correlation coefficient of 0.54 between Fe1.2 and the 123 h time integral of Sgr. Similarly, it was found that the correlation coefficient between Fe1.2 and Sgeo was 0.21, whereas the correlation coefficient was 0.25 between Fe1.2 and the 138 h time integral of Sgeo. For all times during the years 1995–2004 Borovsky and Denton (2014) explored correlation coefficients between Sgr and Sgeo and a relativistic electron flux F that was calculated differently from Fe1.2. They found correlations between F and Sgr of 0.36 (with a time lag of 56 h) and between F and the 126 h time integral of Sgr of 0.55. Likewise they found correlations between F and Sgeo of 0.28 (with a time lag of 71 h) and between F and the 156 h time integral of Sgr of 0.32. Our results demonstrate that even though the events appear, at least visually, to show strong correlation between ULF waves and relativistic electron fluxes, quantitatively the dependence is comparable to other values found in the literature but nonetheless modest when compared with the correlation between ULF waves and seed electrons.
Comparing between seed and relativistic electrons, the statistical dependence on ULF wave power of the 130 keV flux is significantly larger than for relativistic fluxes and ranges between 0.54 and 0.68 for the maximum Pearson correlation and 0.44 and 0.67 for the maximum mutual information. We also note that the time lag for the maximum values is comparable whether one uses the mutual information or the Pearson correlation. The 130 keV fluxes have a maximum dependence with time lags of less than a day, whereas the relativistic electrons see a maximum for time lags considerably longer between 42 and 67 h. Moreover, the ground ULF wave power gives a larger dependence than geostationary measured ULF wave power for the 1994 event. For the 1993 event the statistical dependence is the same whether one uses ground or geostationary indices. The ground ULF index spans local daylight hours between 05:00 and 15:00, whereas the GOES ULF covers the full 24 h period. This local time difference between ground and geostationary sampling of wave power makes the latter more susceptible to be influenced by substorm activity and the former by viscous processes and pressure pulses on the dayside magnetosphere during moderate geomagnetic activity (Borovsky and Funsten, 2003; Osmane et al., 2015a). However, and as pointed out by Simms et al. (2014), the most notable difference between ground and GOES data is that the ground magnetometers are better positioned to catch ULF wave activity that would result in radial diffusion transport (Lejosne and Kollmann, 2020).
To address the second question, we compare the values of the information-adjusted correlation with the Pearson correlation. We note that the adjusted correlation is significantly larger than the Pearson correlation for all instances. In other words, though constrained to two case studies, our results demonstrate the presence of non-linear statistical dependencies between energetic electron fluxes and ULF wave power. By using information theory we make no assumptions about the functional form of the non-linear dependence between the variables, but we can nonetheless state that non-linearities have to be accounted for. Our results are consistent with the study of Simms et al. (2018), in which they built regression models that assumed a quadratic dependence in the ULF wave power with a 1 d lag. Their results indicate that the response of relativistic electron fluxes can be a combination of linear and non-linear dependence and that incorporating a quadratic term might provide better predictions. Based on the values for the information-adjusted correlation, the Pearson correlation might be missing between 20 % and 30 % of the statistical dependencies between ULF wave power and relativistic electron fluxes.
The Earth's inner magnetosphere is a non-linearly driven plasma environment in which electrons can be collectively energised to relativistic energies by ULF fluctuations (Lejosne and Kollmann, 2020). The emergence of non-linear processes translates into non-Gaussian fluctuations in the electromagnetic fields and particle distribution functions. Thus, in order to quantify the processes at play to model the Earth's radiation belts accurately, one needs to determine whether non-linear statistical dependencies between drivers, such as the solar wind speed and the ULF wave power, and quantities in which energy and momentum is deposited, such as electron fluxes, have to be accounted for.
In this study, we described the use of mutual information to characterise statistical dependencies of relativistic electron fluxes on ULF wave power. The benefit of mutual information, in comparison to the Pearson correlation, lies in the capacity to distinguish non-linear dependencies from linear ones. In order to test our methodology, we revisited the case study of Rostoker et al. (1998), in which two events were shown, from a visual perspective, to indicate strong correlation between the rise of relativistic electron fluxes and ULF wave power. Our application of mutual information to the events presented by Rostoker et al. (1998) indicates that relativistic electron fluxes are linearly and non-linearly dependent on ULF wave power. However, the values that we found for both the Pearson correlation and mutual information of relativistic electron fluxes and ULF wave power are modest when compared to previous statistical results (Simms et al., 2014) and consistently smaller than the correlational measures found between seed electrons and ULF wave power. This result is counter-intuitive since seed electrons with long azimuthal periods cannot experience drift–orbit resonance with ULF wave fluctuations and should therefore not be correlated with radial diffusion drivers more strongly than relativistic electron fluxes. However, our results do not indicate a necessary causal physical relationship between seed electrons and ULF wave power, but they do point out the necessity of not over-interpreting correlational measures, whether linear or non-linear. The modest dependence of energetic electron fluxes with ULF wave power could also originate in a shared dependence on solar wind drivers, such as the solar wind speed for relativistic electrons and solar wind density for seed electrons. Our results are therefore indicative of the need to incorporate data analysis tools that can distinguish between interdependencies of various solar wind drivers. In the framework of information theory, conditional mutual information is specifically built for that purpose and has been successfully used to resolve a long-standing question about the relative role of solar wind speed and density in driving relativistic electron fluxes (Wing et al., 2016). In future studies, we will also apply a comparable methodology presented in Simms et al. (2014) to seek dependencies of relativistic electron fluxes on solar wind drivers for given storm phases and build non-parametric estimators for the probability density of random variables that do not require binning (Kraskov et al., 2004).
For a random variable X, if the cumulative distribution function F(x) is continuous, then X is said to be continuous as well. Let us denote the probability distribution function . The differential entropy of a continuous random variable X is defined as
where S is the support set where f(x)>0. Differential entropy h(X), as in the discrete case with the Shannon entropy H, is also a measure of the uncertainty for a random variable X. However, unlike in the discrete case, the differential entropy can be negative. Consider, for instance, a random variable distributed uniformly from 0 to L, so that its density is . Then its differential entropy is
Thus, for L<1, log L<0, and the differential entropy is negative. The mutual information I(X;Y) can be extended to continuous variables as
We consider a bivariate with a mean vector
and a covariance matrix given by
for means E[X]=μx, E[Y]=μy, variances , , and correlation coefficient ρ defined as
The probability density function of the X–Y bivariate is
For the sake of simplicity we focus on the case where and , in which case the joint bivariate distribution takes the form
and the marginals for . Using Eq. (A3), we can compute the mutual information between X and Y. For h(xi) we find
in which the logarithm is in base 2. And now for the joint differential entropy of a Gaussian bivariate,
Therefore, the mutual information of a Gaussian bivariate is a non-linear function of the correlation ρ:
Data for the relativistic electron fluxes can be requested from Joe Borovsky. Data for ULF wave power can be found on the Augsburg website http://virbo.org/Augsburg/ULF, last access: 21 January 2022. The permanently updating database is freely available via anonymous FTP at the following site for testing and validation: http://space.augsburg.edu; see the folder labelled /MACCS/ULF_Index/. The code to compute the mutual information is publicly available on a GitHub repository (Savola, 2021).
AO designed the study, wrote most of the article, and participated in the interpretation of results. MS wrote the code and the Methodology section, performed the data analysis, and participated in the interpretation of results. EK, HK, JEB, and MK participated in the interpretation of results and literature review.
The contact author has declared that neither they nor their co-authors have any competing interests.
Publisher’s note: Copernicus Publications remains neutral with regard to jurisdictional claims in published maps and institutional affiliations.
The results presented herein have been achieved under the framework of the Finnish Centre of Excellence in Research of Sustainable Space, which we gratefully acknowledge. Adnane Osmane is grateful for the enlightening conversations with Simon Wing, Jay Johnson, and Solene Lejosne on the topics of information theory and radial diffusion transport of radiation belts.
Adnane Osmane and Mikko Savola acknowledge funding from the Academy of Finland by the profiling action on Matter and Materials (grant no. 318913). Emilia Kilpua and Milla Kalliokoski acknowledge funding from FORESAIL at the Academy of Finland (grant nos. 312390 and 336809). Joseph E. Borovsky has been supported at the Space Science Institute as part of the NSF GEM Program (grant no. AGS-2027569) and by the NASA HERMES Interdisciplinary Science Program (grant no. 80NSSC21K1406).
Open-access funding was provided by the Helsinki University Library.
This paper was edited by Yoshizumi Miyoshi and reviewed by two anonymous referees.
Baker, D., Erickson, P., Fennell, J., Foster, J., Jaynes, A., and Verronen, P.: Space weather effects in the Earth's radiation belts, Space Sci. Rev., 214, 1–60, 2018. a
Balikhin, M. A., Boynton, R. J., Walker, S. N., Borovsky, J. E., Billings, S. A., and Wei, H. L.: Using the NARMAX approach to model the evolution of energetic electrons fluxes at geostationary orbit, Geophys. Res. Lett., 38, L18105, https://doi.org/10.1029/2011GL048980, 2011. a
Borovsky, J. E.: Time-Integral Correlations of Multiple Variables With the Relativistic-Electron Flux at Geosynchronous Orbit: The Strong Roles of Substorm-Injected Electrons and the Ion Plasma Sheet, J. Geophysical Res.-Space, 122, 11961–11990, https://doi.org/10.1002/2017JA024476, 2017. a
Borovsky, J. E. and Denton, M. H.: Exploring the cross correlations and autocorrelations of the ULF indices and incorporating the ULF indices into the systems science of the solar wind-driven magnetosphere, J. Geophys. Res.-Space, 119, 4307–4334, https://doi.org/10.1002/2014JA019876, 2014. a
Borovsky, J. E. and Funsten, H. O.: Role of solar wind turbulence in the coupling of the solar wind to the Earth's magnetosphere, J. Geophys. Res.-Space, 108, 1246, https://doi.org/10.1029/2002JA009601, 2003. a
Borovsky, J. E. and Yakymenko, K.: Systems science of the magnetosphere: Creating indices of substorm activity, of the substorm-injected electron population, and of the electron radiation belt, J. Geophys. Res.-Space, 122, 10012–10035, 2017. a, b
Cameron, T. G., Jackel, B., and Oliveira, D. M.: Using Mutual Information to Determine Geoeffectiveness of Solar Wind Phase Fronts With Different Front Orientations, J. Geophys. Res.-Space, 124, 1582–1592, https://doi.org/10.1029/2018JA026080, 2019. a
Cayton, T. E. and Belian, R.: Numerical modeling of the synchronous orbit particle analyzer (SOPA, Version 2) that flew on S/C 1990-095, Los Alamos Report, Los Alamos, N.M., LA-14335, 2007. a, b
Cover, T. M.: Elements of information theory, John Wiley & Sons, ISBN 0-471-06259-6, online ISBN 0-471-20061-1, New York, 542 pp., 1999. a
De Michelis, P., Consolini, G., Materassi, M., and Tozzi, R.: An information theory approach to the storm-substorm relationship, J. Geophys. Res.-Space, 116, A08225, https://doi.org/10.1029/2011JA016535, 2011. a
Dudok de Wit, T. and Krasnosel'skikh, V. V.: Non-Gaussian statistics in space plasma turbulence: fractal properties and pitfalls, Nonlinear Proc. Geoph., 3, 262–273, https://doi.org/10.5194/npg-3-262-1996, 1996. a
Freedman, D. and Diaconis, P.: On the Histogram as a Density Estimator: L 2 Theory, Probab. Theory Rel., 57, 453–476, 1981. a
Johnson, J. R., Wing, S., and Camporeale, E.: Transfer entropy and cumulant-based cost as measures of nonlinear causal relationships in space plasmas: applications to Dst, Ann. Geophys., 36, 945–952, https://doi.org/10.5194/angeo-36-945-2018, 2018. a
Kozyreva, O., Pilipenko, V., Engebretson, M., Yumoto, K., Watermann, J., and Romanova, N.: In search of a new ULF wave index: Comparison of Pc5 power with dynamics of geostationary relativistic electrons, Planet. Space Sci., 55, 755–769, 2007. a, b, c
Kraskov, A., Stögbauer, H., and Grassberger, P.: Estimating mutual information, Phys. Rev. E, 69, 066138, https://doi.org/10.1103/PhysRevE.69.066138, 2004. a, b
Kulsrud, R.: Plasma physics for astrophysics, Princeton University Press, New Jersey, ISBN 978-0-691-12073-7, 496 pp., 2005. a
Lejosne, S. and Kollmann, P.: Radiation belt radial diffusion at Earth and beyond, Space Sci. Rev., 216, 1–78, 2020. a, b, c, d
Marsch, E. and Tu, C.-Y.: Intermittency, non-Gaussian statistics and fractal scaling of MHD fluctuations in the solar wind, Nonlinear Proc. Geoph., 4, 101–124, 1997. a
McCormac, B. M.: Radiation Trapped in Earth's Magnetic Field, Science, 150, 785–786, https://doi.org/10.1126/science.150.3697.785, 1965. a
Osman, K., Matthaeus, W., Gosling, J., Greco, A., Servidio, S., Hnat, B., Chapman, S. C., and Phan, T.: Magnetic reconnection and intermittent turbulence in the solar wind, Phys. Rev. Lett., 112, 215002, https://doi.org/10.1103/PhysRevLett.112.215002, 2014. a
Osmane, A., Dimmock, A., Naderpour, R., Pulkkinen, T., and Nykyri, K.: The impact of solar wind ULF Bz fluctuations on geomagnetic activity for viscous timescales during strongly northward and southward IMF, J. Geophys. Res.-Space, 120, 9307–9322, 2015a. a
Osmane, A., Dimmock, A., and Pulkkinen, T. I.: Universal properties of mirror mode turbulence in the Earth's magnetosheath, Geophys. Res. Lett., 42, 3085–3092, 2015b. a
Osmane, A., Dimmock, A. P., and Pulkkinen, T. I.: Jensen-Shannon Complexity and Permutation Entropy Analysis of Geomagnetic Auroral Currents, J. Geophys. Res.-Space, 124, 2541–2551, 2019. a
Papoulis, A. and Pillai, S. U.: Probability, Random Variables, and Stochastic Processes, 4th Edn., McGraw-Hill Higher Education, McGraw-Hill, New York, ISBN 9780070486584, 852 pp., 2002. a, b, c
Rostoker, G., Skone, S., and Baker, D. N.: On the origin of relativistic electrons in the magnetosphere associated with some geomagnetic storms, Geophys. Res. Lett., 25, 3701–3704, 1998. a, b, c, d, e, f, g, h, i, j, k, l, m, n, o, p, q, r, s, t, u, v, w, x, y
Runge, J., Balasis, G., Daglis, I. A., Papadimitriou, C., and Donner, R. V.: Common solar wind drivers behind magnetic storm–magnetospheric substorm dependency, Sci. Rep., 8, 1–10, 2018. a
Savola, M.: Mutual Information, GitHub [data set], available at: https://github.com/msavola/Mutual_information (last access: 21 January 2022), 2021. a
Simms, L. E., Pilipenko, V., Engebretson, M. J., Reeves, G. D., Smith, A., and Clilverd, M.: Prediction of relativistic electron flux at geostationary orbit following storms: Multiple regression analysis, J. Geophys. Res.-Space, 119, 7297–7318, 2014. a, b, c, d, e, f, g, h
Simms, L. E., Engebretson, M. J., Clilverd, M. A., Rodger, C. J., and Reeves, G. D.: Nonlinear and synergistic effects of ULF Pc5, VLF chorus, and EMIC waves on relativistic electron flux at geosynchronous orbit, J. Geophys. Res.-Space, 123, 4755–4766, 2018. a, b
Stepanova, M., Antonova, E., and Troshichev, O.: Intermittency of magnetospheric dynamics through non-Gaussian distribution function of PC-index fluctuations, Geophys. Res. Lett., 30, 1127, https://doi.org/10.1029/2002GL016070, 2003. a
Taleb, N. N.: Statistical consequences of fat tails: Real world preasymptotics, epistemology, and applications, arXiv preprint, arXiv:2001.10488, RESEARCHERS.ONE, available at: https://www.researchers.one/article/2020-01-21 (last access: 21 January 2022), 2020. a
Thorne, R. E., Li, W., Ni, B., Ma, Q., Bortnik, J., Chen, L., Baker, D. N., Spence, H. E., Reeves, G. D., Henderson, M. G., and Kletzing, C. A.: Rapid local acceleration of relativistic radiation-belt electrons by magnetospheric chorus, Nature, 504, 411–414, 2013. a
Ukhorskiy, A. and Sitnov, M.: Dynamics of radiation belt particles, Springer, Boston, MA, 34 pp., https://doi.org/10.1007/978-1-4899-7433-4_17, 2012. a
Van Allen, J. A., Ludwig, G. H., Ray, E. C., and McIlwain, C. E.: Observation of high intensity radiation by satellites 1958 Alpha and Gamma, J. Jet Propul., 28, 588–592, 1958. a
Walt, M.: Introduction to geomagnetically trapped radiation, Cambridge University Press, Cambridge, 168 pp., ISBN 0-521-43143-3, 2005. a
Wing, S. and Johnson, J. R.: Applications of information theory in solar and space physics, Entropy, 21, 140, https://doi.org/10.3390/e21020140, 2019. a
Wing, S., Johnson, J. R., Camporeale, E., and Reeves, G. D.: Information theoretical approach to discovering solar wind drivers of the outer radiation belt, J. Geophys. Res.-Space, 121, 9378–9399, 2016. a, b, c, d, e, f
Wing, S., Johnson, J. R., and Vourlidas, A.: Information theoretic approach to discovering causalities in the solar cycle, Astrophys. J., 854, 13 pp., https://doi.org/10.3847/1538-4357/aaa8e7, 2018. a
If X and Y are not dependent on one another, we have not lost information. But if a variable X (e.g. ULF wave power) and Y (MeV electron fluxes) are dependent on one another under some conditions (e.g. large solar wind speed), the removal of the conditions upon which the dependence is strong can result in a loss of information (reduction of mutual information) and thus a loss of knowledge.
The fluxes have been derived in Cayton and Belian (2007) by converting them from count rates. The electron counts also contain incident protons, alpha particles, and gamma rays, which have been treated as additional electrons instead of being removed from the raw data. Changes in processing the measurement data over the years may also have caused systematic errors in the measurement data, but maybe only a few percent of the data records are contaminated (Cayton and Belian, 2007).
Reducing our resolution to 24 h for a strict comparison with (Rostoker et al., 1998) is not useful because the values of mutual information and correlation are low, and reducing the number of points would bring both measures to the noise level.
- Abstract
- Introduction
- Methodology
- Dataset
- Results
- Discussion
- Conclusions
- Appendix A: Mutual information for continuous variables
- Appendix B: Derivation of mutual information for Gaussian bivariates
- Data availability
- Author contributions
- Competing interests
- Disclaimer
- Acknowledgements
- Financial support
- Review statement
- References