the Creative Commons Attribution 4.0 License.
the Creative Commons Attribution 4.0 License.
 | 02 Jun 2022
Determination of tropical belt widening using multiple GNSS radio occultation measurements
Mohamed Darrag
Shuanggen Jin
Andrés Calabia
Aalaa Samy
In the last decades, several studies reported the tropics' expansion, but the rates of expansion are widely different. In this paper, data of 12 global navigation satellite systems radio occultation (GNSS-RO) missions from June 2001 to November 2020 with high resolution were used to investigate the possible widening of the tropical belt along with the probable drivers and impacts in both hemispheres. Applying both lapse rate tropopause (LRT) and cold point tropopause (CPT) definitions, the global tropopause height shows an increase of approximately 36 and 60 m per decade, respectively. The tropical edge latitudes (TELs) are estimated based on two tropopause height metrics, subjective and objective methods. Applying both metrics, the determined TELs using GNSS have expansive behavior in the Northern Hemisphere (NH), while in the Southern Hemisphere (SH) there are no significant trends. In the case of ECMWF Reanalysis v5 (ERA5) there are no considerable trends in both hemispheres. For the Atmospheric Infrared Sounder (AIRS), there is expansion in the NH and observed contraction in the SH. The variability of tropopause parameters (temperature and height) is maximum around the TEL locations in both hemispheres. Moreover, the spatial and temporal patterns of total column ozone (TCO) have good agreement with the TEL positions estimated using GNSS LRT height. Carbon dioxide (CO2) and methane (CH4), the most important greenhouse gases (GHGs) and the main drivers of global warming, have spatial modes in the NH that are located more poleward than that in the SH. Both surface temperature and precipitation have strong correlation with GNSS LRT height. The surface temperature spatial pattern broadly agrees with the GNSS TEL positions. In contrast, the standardized precipitation evapotranspiration index (SPEI) has no direct connection with the TEL behavior. The results illustrate that the tropics' widening rates are different from one dataset to another and from one metric to another. In addition, TEL behavior in the NH is different from that in the SH. Furthermore, the variability of meteorological parameters agrees with GNSS TEL results more than with that of other datasets.
- Article
(16620 KB) - Full-text XML
- BibTeX
- EndNote


Several studies have reported a widening of the tropics in observations, model simulations, and reanalyses. This expansion may lead to profound changes in the global climate system; even a minor expansion of the tropical belt would have significant implications because the shift of the jet streams and subtropical dry zones toward poles has direct effects on weather and precipitation patterns. The widening of the tropical belt is largely considered to be a response to global warming caused by increased greenhouse gas (GHG) concentrations (Davis and Rosenlof, 2012; Davis and Birner, 2013; Staten et al., 2018; Grise et al., 2019; Watt-Meyer et al., 2019; Meng et al., 2021; Pisoft et al., 2021). The reported widening rates, in most previous studies, range from 0.25 to 3.0∘ latitude per decade, and their statistical significance varies by a large amount based on the metrics used to estimate the tropical edge latitude (TEL) as well as the datasets utilized for its derivation. In addition, the used metrics may respond in different ways to the force driving the widening because of their differing physics (Davis and Rosenlof, 2012). Hudson et al. (2006), based on atmospheric ozone concentrations, reported that the Northern Hemisphere (NH) occupied by the tropical region grew at a rate of 1∘ per decade. Using an independent set of satellite-based microwave observations of atmospheric temperature, Fu et al. (2006) inferred tropical belt widening for the period 1979–2005. They estimated a net widening of about 2∘ latitude. Based on radiosonde (RS) and reanalysis data, Seidel and Randel (2007) reported an expansion of 5–8∘ latitude during the period from 1979 to 2005. In addition, Hu and Fu (2007) found a widening of the tropical Hadley circulation system and estimated its magnitude as 2–4.5∘ latitude during the period from 1979 to 2005. Ao and Hajj (2013) used GPS radio occultation (RO) data over the period 2002 to 2011 and analyzed them to examine the possible expansion of the tropical belt due to climate change. Their analysis showed a statistically significant widening trend of 1∘ per decade in the NH, while in the Southern Hemisphere (SH) no significant trend was found.
In astronomy and cartography, the edges of the tropical belt are the Tropic of Cancer and Tropic of Capricorn, at latitudes of ∼ 23.5∘ north and south, where the Sun is directly overhead at solstice. They are determined by the tilt of the Earth's axis of rotation relative to the planet's orbital plane, and their locations vary slowly, predictably, and very slightly by about 2.5∘ latitude over 40 000 years (Gnanadesikan and Stouffer, 2006). In climatology, tropical edges vary seasonally, interannually, and in response to climate forcing. They move poleward in the summer and equatorward in the winter (Davis and Birner, 2013). There are several indicators that define the boundaries of the tropical belt. Generally, three main classes of metrics are employed to estimate the tropical belt borders: circulation-based metrics (e.g., based on the Hadley cells and the subtropical jets), temperature-based metrics (e.g., based on tropopause characteristics), and surface climate metrics (e.g., based on precipitation and surface winds) (Waliser et al., 1999). The common metrics used for TEL determination are discussed in detail in Staten et al. (2018) and Adam et al. (2018). TELs estimated by applying different metrics do not all necessarily yield the same location. Their positions vary by much larger amounts and much more rapidly and unpredictably than the astronomically defined tropics (Lee and Kim, 2003).
Study of tropical belt widening is a challenging task due to the complexity and dynamics of the Earth's atmospheric system and the data limitations. These limitations are the low spatial resolution of RS data, as they only cover land and their distribution is not symmetrical in both hemispheres. For the satellite remote sensing technologies and model analyses, both suffer from low vertical resolution. Furthermore, reanalysis trends can be biased to reflect changes in both the quality as well as quantity of the underlying data, and the expansion rates computed from different reanalyses were considerably different (Schmidt et al., 2004; Ao and Hajj, 2013). Nowadays, global navigation satellite systems (GNSS) provide an exceptional opportunity to retrieve land surface and atmospheric parameters globally (e.g., Jin and Park, 2006; Jin and Zhang, 2016; Wu and Jin, 2014; Jin et al., 2011, 2017), particularly space-borne GNSS radio occultation (GNSS-RO), because GNSS-RO has long-term stability and works in all weather conditions, which makes it a powerful tool for studying climate variability. Since GNSS-RO has uniform global coverage, it covers all locations even in the polar regions and oceans, which are blind zones of other detection systems such as RS and radar. Moreover, GNSS-RO observations are vertically finer resolved than any of the existing satellite temperature measurements available for the upper troposphere lower stratosphere (UTLS), and thus GNSS-RO is well suited for this challenge. Moreover, it is a key component for a broad range of other studies, including equatorial waves, Kelvin waves, gravity waves, Rossby and mixed Rossby–gravity waves, and thermal tides (Bai et al., 2020; Scherllin-Pirscher et al., 2021). A number of studies confirmed the feasibility and excellent eligibility of GNSS-RO measurements for monitoring the atmosphere and for climate change detection (Foelsche et al., 2009; Steiner et al., 2011).
Nowadays, GNSS-RO is a valuable remote sounding technique for the atmosphere. During the GNSS-RO event, the GNSS satellite transmits signals that are received on board a low Earth-orbiting (LEO) satellite. Due to the atmospheric refractivity, these signals suffer time delay and bending. The atmosphere excess propagation (AEP) is the main observable and can be calculated with millimeter accuracy, providing high-quality and global observations (Wickert et al., 2001a). For instance, the AEP estimate is the basis for extracting the profiles of bending angle, refractivity, and temperature (Wickert et al., 2004; Xia et al., 2017). The GNSS-RO technique was first performed within the US GPS/METeorology experiment for the period from 1995 to 1997 (Kursinski et al., 1997). Also, it has been continuously applied on board various LEO satellite missions since 2001.
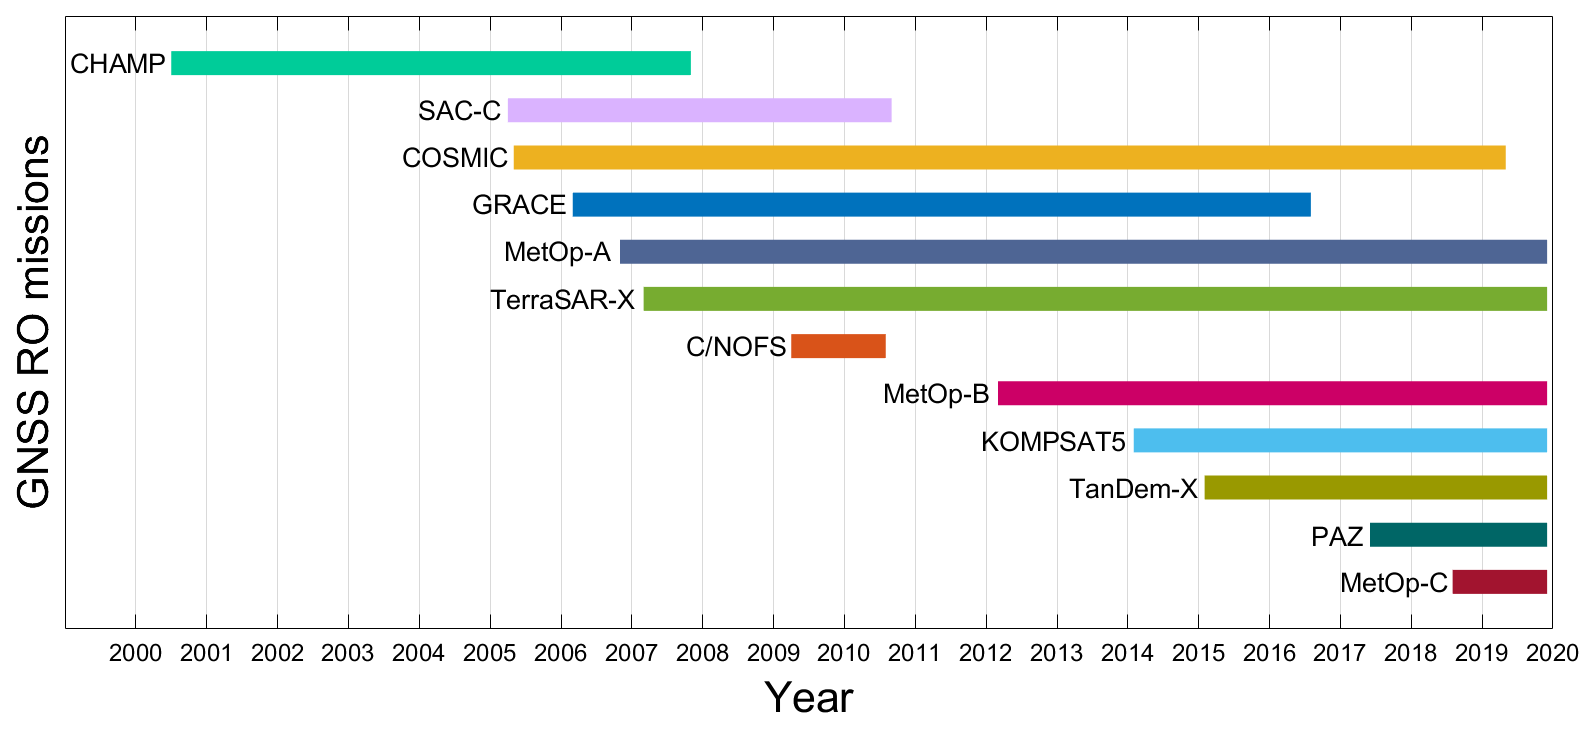
These missions are Challenging Mini-satellite Payload (CHAMP) (Wickert et al., 2004; Wickert et al., 2001b); Gravity Recovery and Climate Experiment (GRACE) also Gravity Recovery and Climate Experiment Follow-on (GRACE-FO) (Wickert et al., 2009); Scientific Application Satellite-C/D (SAC-C/D) (Hajj et al., 2004); TerraSAR-X; TanDEM-X; Constellation Observing System for Meteorology, Ionosphere, and Climate (COSMIC/COSMIC-2, also known as FORMOSAT-3/FO RMOSAT-7); the Meteorological Operational satellite Programme-A/B/C (MetOp-A/B/C); FengYun-3C/D (FY-3C/D) (Sun, 2019); Communications/Navigation Outage Forecasting System(C/NOFS); Korea Multi-Purpose Satellite-5 (KOMPSAT-5); the Indian Space Research Organization spacecraft Ocean Satellite-2 (OceanSat-2); and Spanish PAZ (peace in Spanish). A few missions were retired, such as COSMIC-1, GRACE, CHAMP, and SAC-C/D, and some missions are completed by the end of 2020, such as FY-3C, TanDEM-X/TerraSAR-X, KOMPSAT-5, OceanSat-2, and C/NOFS. More missions are planned for the future like MetOp Second Generation (MetOp-SG), FengYun-3E/F/G/H (FY-3E/F/G/H), TerraSAR-X Next Generation (TSX-NG), Jason Continuity of Service-A/B (JASON-CS-A/B”, also known as Sentinel 6A/6B), and Meteor-MP N1/N2. By 2025, the planned missions will provide around 14,700 RO profiles daily (Jin et al., 2013; Oscar, 2020)
In recent years, monitoring the tropopause has received increased attention for climate change studies. Many studies signified the tropopause rise as a result of the troposphere warming caused by the increase in the GHG emissions in the atmosphere (Davis and Rosenlof, 2012; Davis and Birner, 2013; Staten et al., 2018; Grise et al., 2019; Watt-Meyer et al., 2019; Meng et al., 2021; Pisoft et al., 2021). The tropopause characteristics are important for the understanding of the exchange of the troposphere and stratosphere (Holton et al., 1995). In addition, the chemical, dynamical, and radiative connections between the troposphere and stratosphere are crucial for understanding and predicting climate change worldwide. Exchanges of water, mass, and gases between the troposphere and stratosphere occur through the tropopause. Several studies have investigated the tropopause over the tropics using different data types and have revealed the problem of the TEL shift (Ao and Hajj, 2013; Tegtmeier et al., 2020; Pilch Kedzierski et al., 2020). GNSS-RO provided high-accuracy remote sensing observations of the thermal structure of the tropopause and was used to investigate the trend and variability of the tropopause (Son et al., 2011). Among the most outstanding advantages of GNSS-RO is its high accuracy of 0.2–0.5 K in estimating temperature in the UTLS region and its vertical resolution of 200 m. These advantages make GNSS-RO especially appropriate for detecting the possible tropical belt widening based on the height metrics of the tropopause (Kursinski et al., 1997; Ho et al., 2012). Using tropopause metrics for TEL determination has many advantages because it can be accurately estimated from remotely sensed temperature profiles with sufficient vertical resolution, such as GNSS-RO profiles (Davis and Birner, 2013; Seidel and Randel, 2006).
In this study, we investigate the TEL variability from different sources, mainly GNSS-RO data. In Sect. 2, a description of the GNSS-RO data and other datasets used in our study is presented. In addition, the methods to derive TEL and the data analysis are presented. Section 3 describes and discusses the results of the analysis, and our conclusion and summary are given in Sect. 4.
2.1 Data
In this study we employ the following datasets.
-
The main data used in this study are GNSS-RO atmospheric profile data from 12 LEO missions from June 2001 to November 2020. The data (CDAAC, 2021) are available at the COSMIC Data Analysis and Archive Center (CDAAC). The GNSS-RO data availability and their time span are shown in Fig. 1.
-
ERA5 is the fifth-generation ECMWF reanalysis for the global climate and weather. Monthly averaged temperature data on pressure levels from ERA5 that provide global coverage for the period from June 2001 to November 2020 are used to calculate the LRT tropopause height and temperature. The horizontal resolution of the ERA5 data is , while the vertical coverage covers from 1000 to 1 hPa, with a vertical resolution of 37 pressure levels (Hersbach et al., 2019a).
-
The Atmospheric Infrared Sounder (AIRS) is the spectrometer on board the second Earth Observing System (EOS) polar-orbiting platform, Aqua. In combination with the Advanced Microwave Sounding Unit (AMSU), AIRS constitutes an innovative atmospheric sounding instrument with infrared and microwave sensors. LRT height and temperature data provided by AIRS (AIRX3STM v7.0) are provided monthly and have global coverage, with a horizontal resolution of (Aumann et al., 2003; AIRS, 2019a). In this study we use data for the period from September 2002 to November 2020. The data are available at AIRS (2019a).
-
The Modern-Era Retrospective analysis for Research and Applications version 2 (MERRA-2) provides total column ozone (TCO) at a global scale, monthly, and with a spatial resolution of . In this work, we use data from June 2001 to November 2020. The data are to be compared with the LRT height from GNSS-RO. In addition, TCO can provide information about the tropics' behavior and can help in emphasizing the GNSS-RO outputs (GMAO, 2015).
-
CarbonTracker is a carbon dioxide (CO2) measurement and modeling system developed by NOAA Earth System Research Laboratories (ESRL) to keep track of CO2 sources and sinks throughout the world. Monthly column average CO2 data with a global coverage from June 2001 to March 2019 are used in this study (Jacobson et al., 2020). The data have a spatial resolution of . Here we use these data to study the behavior and trend of CO2, which is the most important GHG and the largest forcing component in climate change.
-
AIRS provides monthly measurements of methane (CH4) at 24 pressure levels and a spatial resolution of (AIRS, 2019b). We employ data from September 2002 to November 2020. CH4 plays a crucial role in global warming as it is one of the main GHGs that drive long-term climate change.
-
Global monthly average surface temperature data from ERA5 reanalysis have a horizontal resolution of (Hersbach et al., 2019b). In this study we utilize data from June 2001 to November 2020. The purpose of using these data is to study the impacts of the variability in the tropics on the global climatological parameters.
-
Monthly average precipitation data are available from the Global Precipitation Climatology Project (GPCP) at a horizonal resolution of (Adler et al., 2016). We use data from June 2001 to November 2020. The purpose of these data is to investigate the relation between the tropical belt width and the corresponding precipitation pattern.
-
Precipitation and potential evapotranspiration (PET): global monthly average precipitation and PET at a horizontal resolution of are available from the Climatic Research Unit (CRU) Time-Series (TS). These data are employed to compute the SPEI, the meteorological drought index. We utilize data from June 2001 to November 2020. The data are available in Harris et al. (2020). The SPEI drought index was calculated following the indications of Vicente-Serrano et al. (2010) and Beguería et al. (2013).
2.2 Methods
Due to the use of 12 GNSS-RO missions together in our analysis, we compared the different missions' profiles to investigate the consistency between data from different sources. After that, the GNSS-RO temperature profiles with a uniform coverage worldwide were used to calculate the tropopause height and the tropopause temperature based on both tropopause definitions LRT and CPT. According to the definition of the World Meteorological Organization (WMO), “The thermal LRT is defined as the lowest level at which the lapse rate decreases to 2 ∘C/km or less, provided also the average lapse rate between this level and all higher levels within 2 km does not exceed 2 ∘C/km” (WMO, 1957), while the CPT is indicated by the minimum temperature in a vertical profile of temperature (Holton et al., 1995). Here, in order to avoid outliers, the tropopause height values of both definitions are limited between 6 and 20 km. The results of LRT and CPT are subsequently gridded into . Finally, the spatial and temporal variability of all climatic parameters is investigated using the principal component analysis (PCA) technique (Calabia and Jin, 2016, 2020). This technique provides a new set of modes that provide the variance through a linear combination of the original variables, based on eigendecomposition. The solution is a couple of matrices containing the eigenvalues and corresponding eigenvectors of the initial dataset. Each eigenvector is regarded as a map, the eigenvalues provide the percentage of the contribution to the total variability, and the temporal coefficients are used to represent the maps at a given epoch. The first PCA mode has the largest variance, and the following modes represent the next level of variance, which usually is a residual variability. For this reason, since the variability of the variables used in this study is mainly driven by the annual variation, we only employ the first PCA component for each case.
The locations of TELs are estimated from the monthly zonal average of LRT height derived from GNSS-RO, ERA5, and AIRS data. The ERA5 and AIRS tropopause parameters are resampled at the same resolution of GNSS-RO. The zonal average LRT height is spline interpolated as a function of latitude (Ao and Hajj, 2013), and the TEL is determined in each hemisphere using two tropopause height metrics. The first method relies on a subjective criterion: according to the first method TEL is defined as the latitude at which the LRT height falls 1.5 km under the tropical average (15∘ S–15∘ N) LRT height (Davis and Rosenlof, 2012). The second method is an objective criterion, in which the TEL is defined as the latitude of the maximum LRT height meridional poleward gradient (Davis and Rosenlof, 2012). Moreover, the rate of expansion and/or contraction of the tropical belt is estimated from both calculation methods, in each hemisphere, independently. In addition, the trend and spatial–temporal variability of CO2 and CH4, as important drivers of global warming, are investigated. Furthermore, the trend and spatial–temporal pattern of TCO that give information about the tropical belt width are investigated. Finally, we broadly examine the surface temperature, precipitation, and drought trends as meteorological parameters which may have a changing behavior as a response to the tropics' expansion.
3.1 Assessment of GNSS-RO temperature profiles
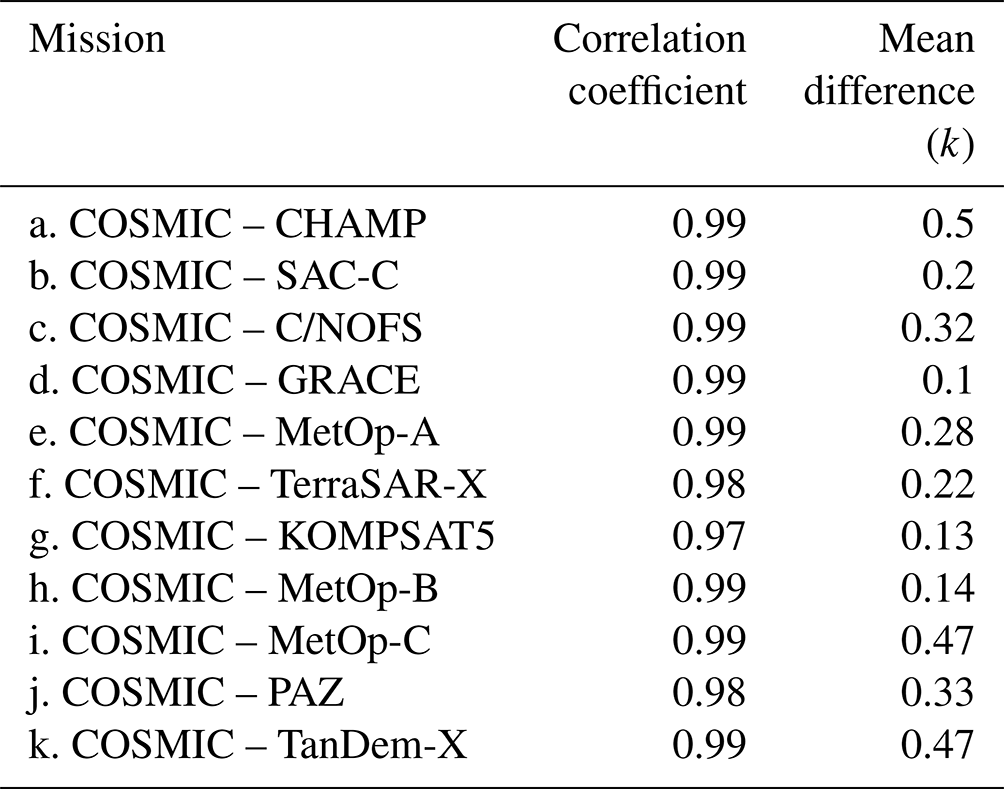
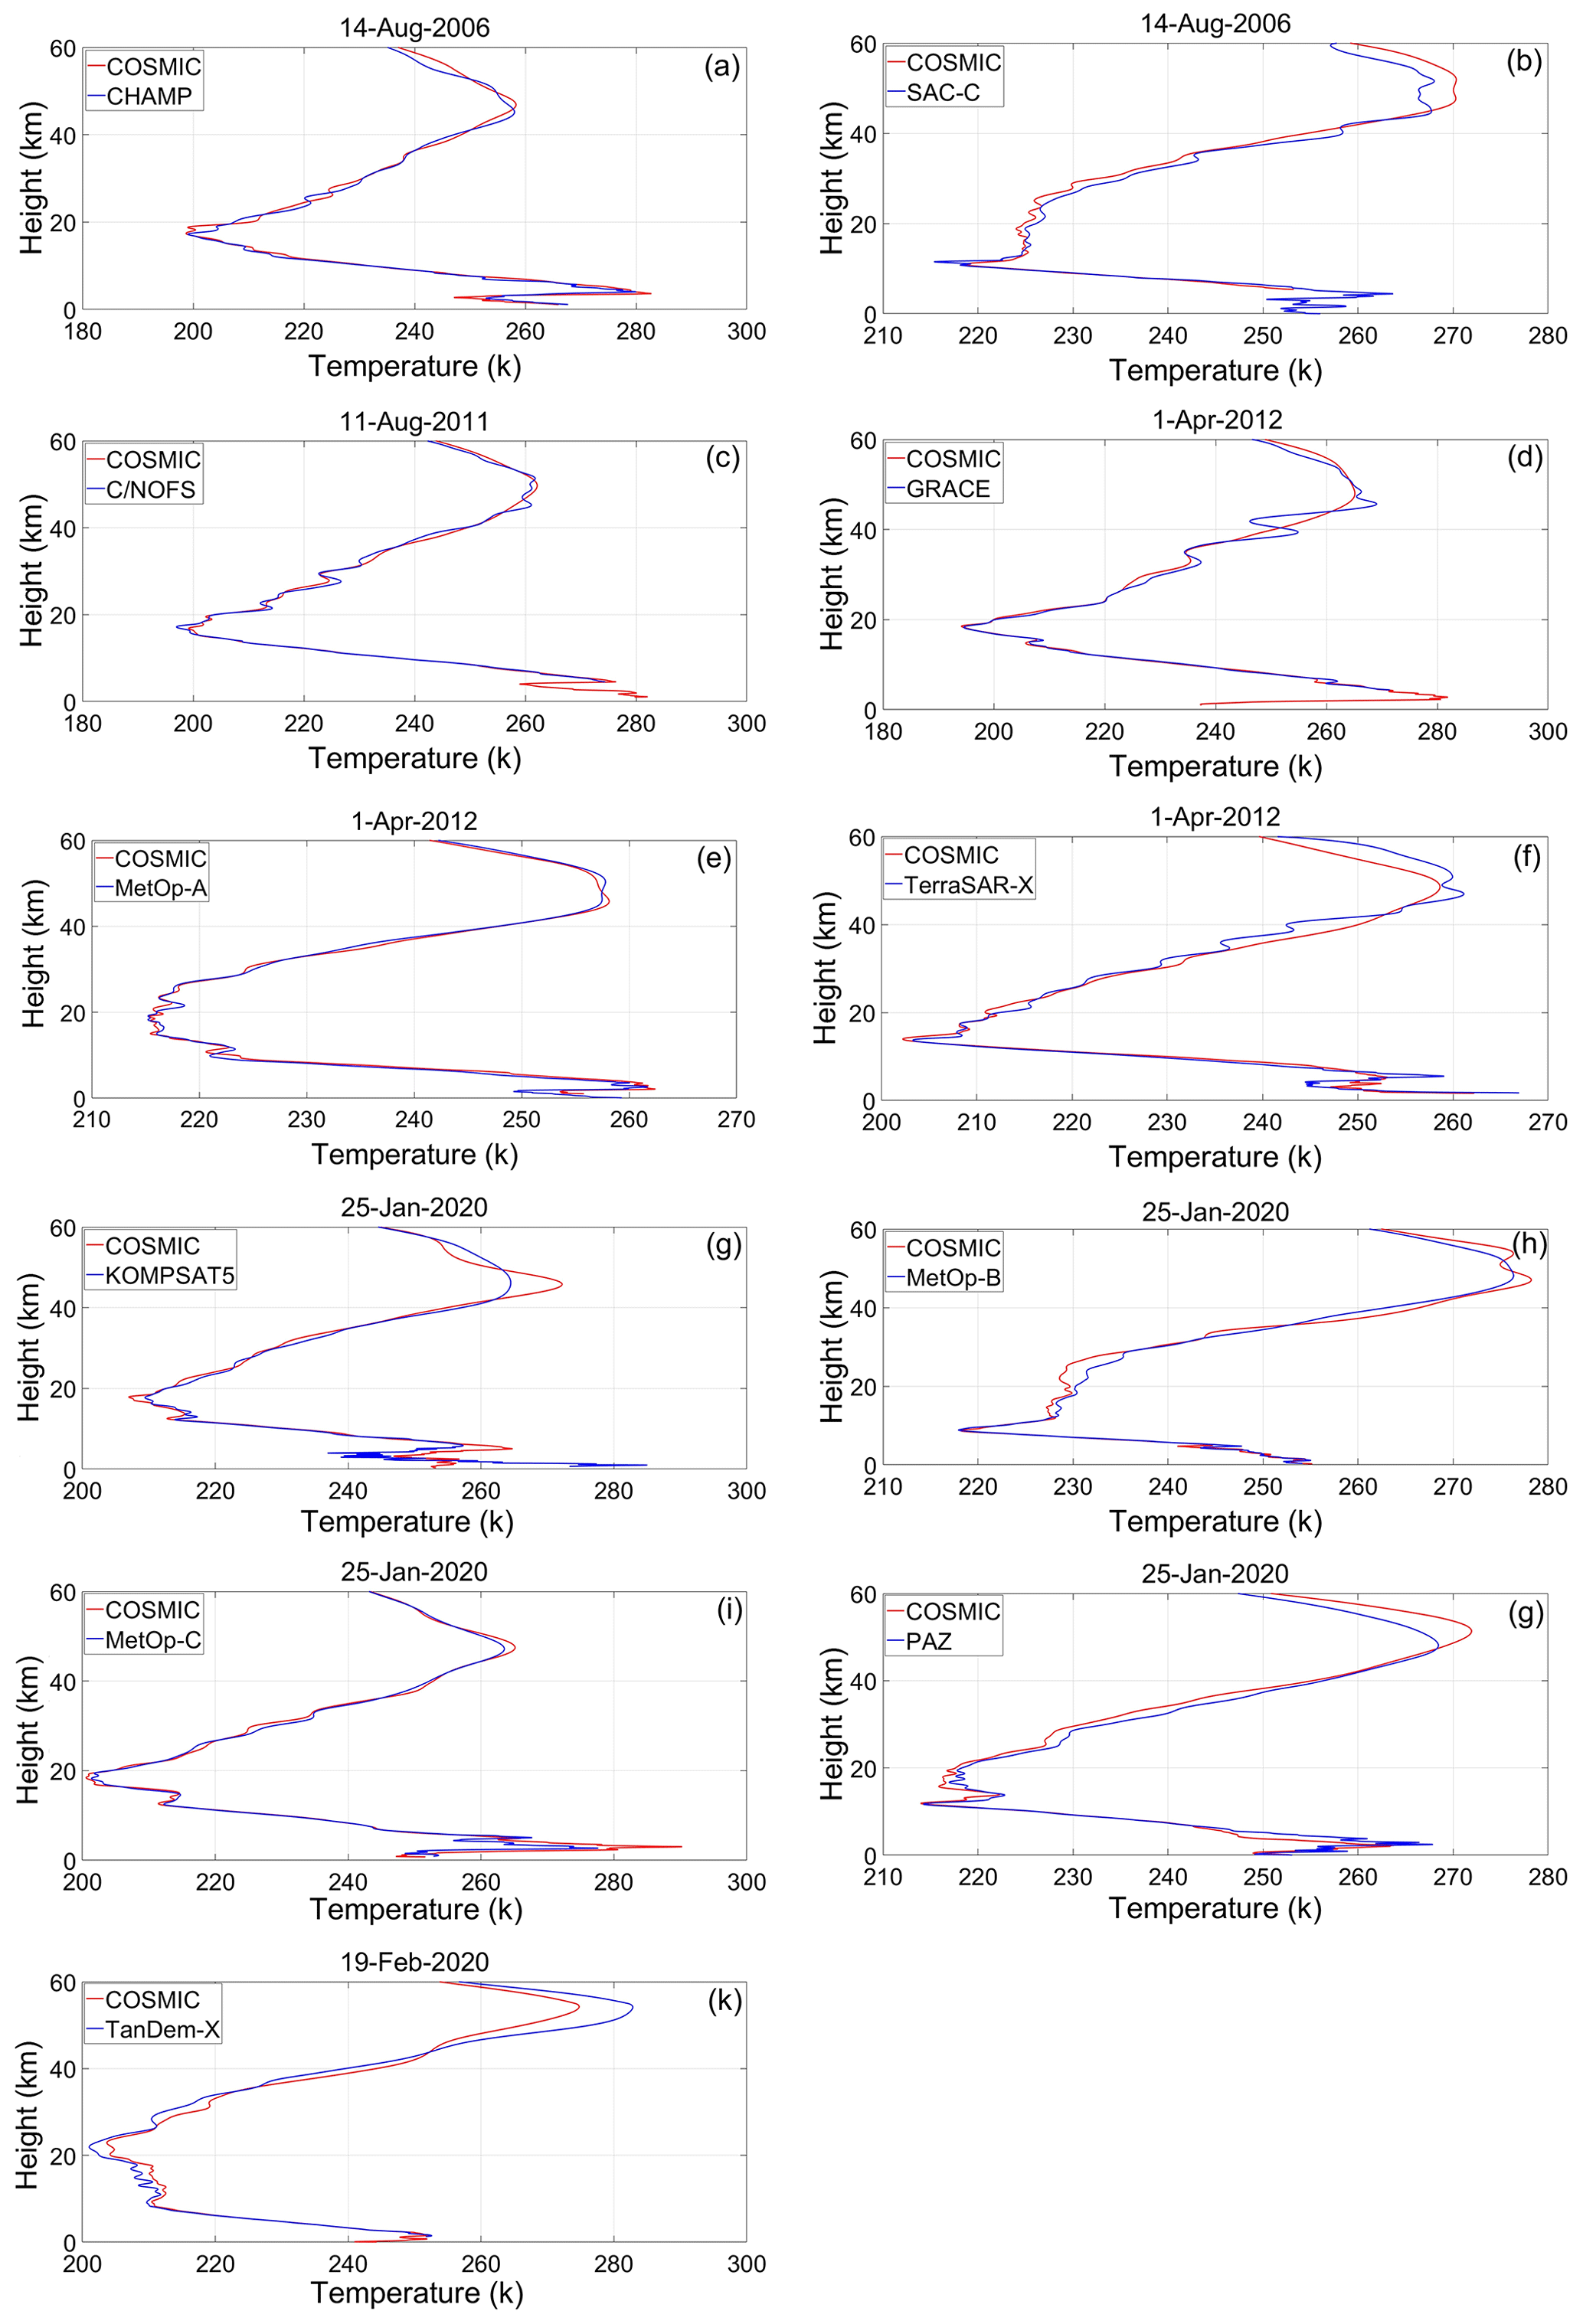
In several previous studies, multiple GNSS-RO missions were utilized together for the purpose of obtaining high spatial resolution. In addition, the assessment of using different GNSS-RO missions together showed a high level of consistency (Hajj et al., 2004; Li et al., 2017; Tegtmeier et al., 2020; Xian et al., 2021). In our study, the atmospheric profiles, from all used GNSS-RO missions, are compared together to signify the high level of consistency and compatibility between RO missions available on the CDAAC web and the ability to merge them together in our study as a single dataset. COSMIC mission profiles are used as a fixed member in the intercomparison of all utilized RO missions as they are the most abundant regarding profile density, and their time span overlaps with all other missions. The results of the conducted intercomparison show high agreement and consistency between profiles of collocated pairs (Fig. 2). Table 1 demonstrates the results of the collocated GNSS profile pairs. The correlation coefficient between the collocated profile pairs ranges from 0.97 to 0.99, and the temperature mean difference ranges from 0.1 to 0.5 K.
3.2 Tropopause characteristics from GNSS-RO
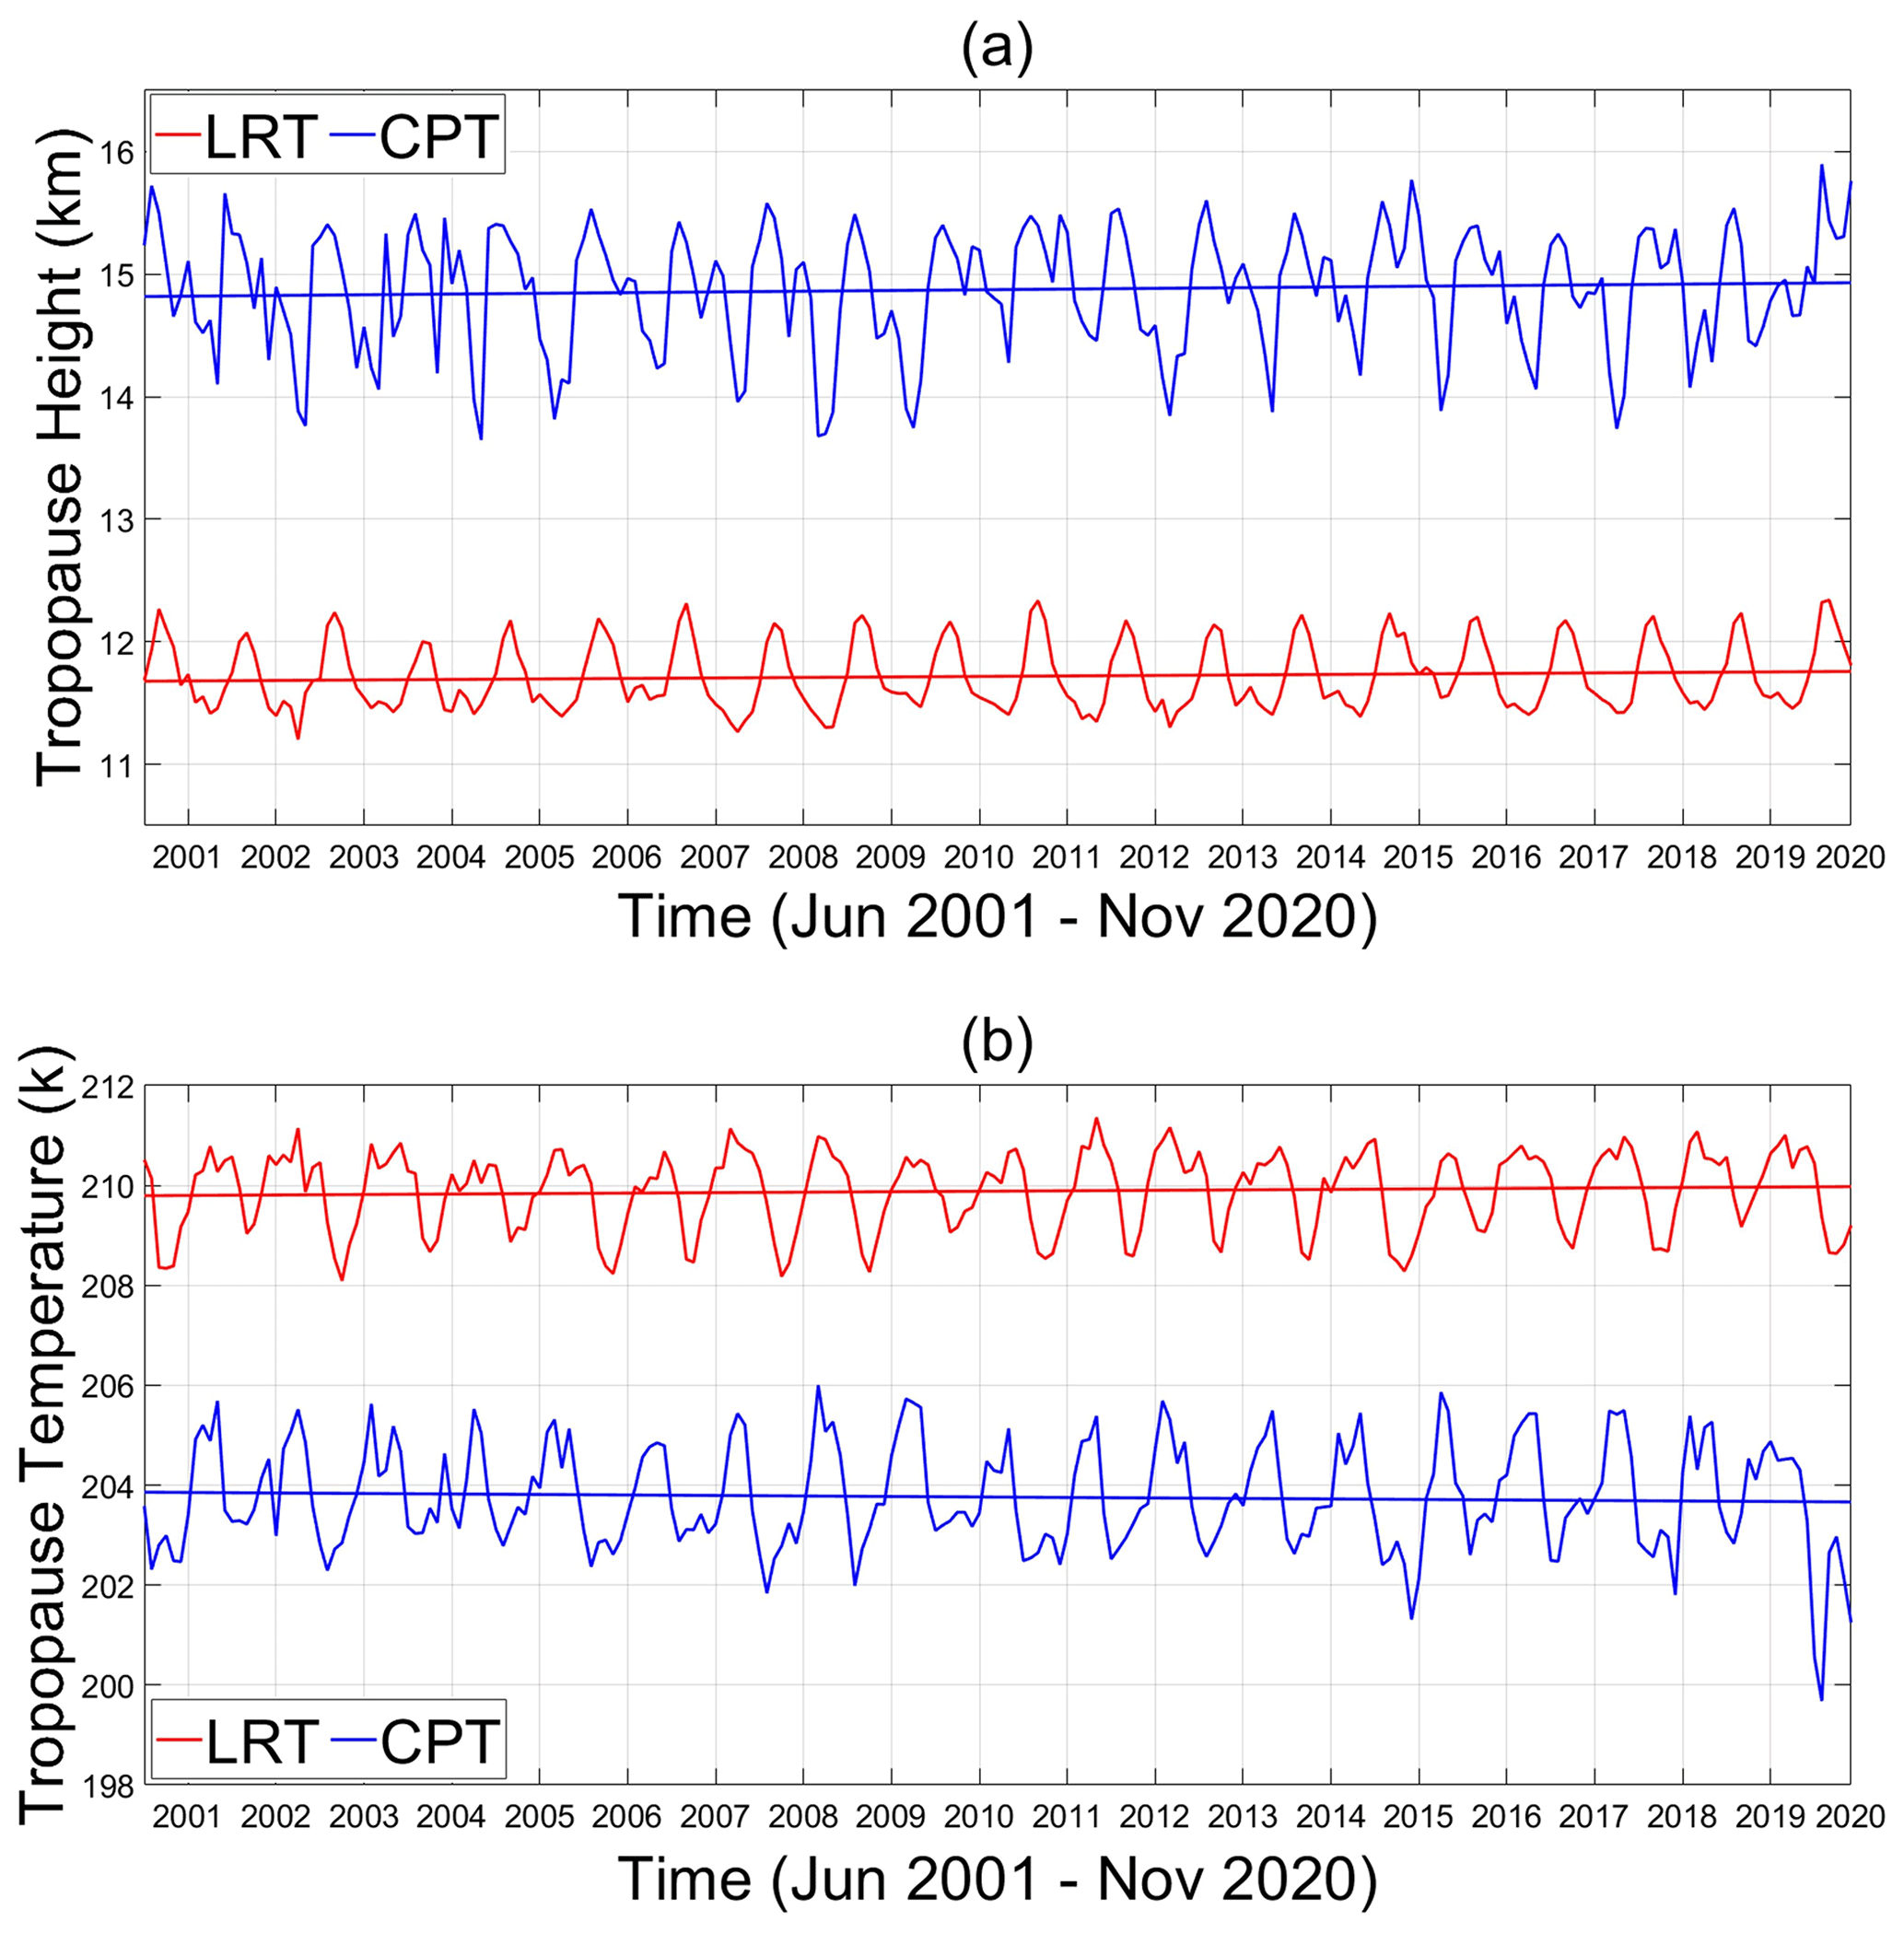
Figure 3 shows the global parameters of GNSS LRT and CPT from June 2001 to November 2020. As is clear in Fig. 3, the CPT height is always higher than that of LRT. The mean difference between them is about 2.62 km, and there is a correlation of about 0.66 between LRT and CPT height. Previous studies have reported that the average of CPT height is between 0.5 and 1 km higher than the LRT height average (Munchak and Pan, 2014). The LRT temperature is higher than that of the CPT. The mean difference between them is about 4.02 K, and the correlation coefficient between them is 0.61. Our results are consistent with previous studies that displayed a global increase in the tropopause height from radiosonde observations (Seidel and Randel, 2006) and reanalysis (Santer et al., 2004).
Our analysis shows a global increasing trend of LRT height of 36 m per decade since 2001, and this has good agreement with that of Schmidt et al. (2008), which showed an upward trend of global LRT height of 39–66 m per decade. The LRT temperature shows an increase of 0.09 K per decade. For the LRT definition, the correlation coefficient between the LRT height and temperature is −0.78. In the case of CPT definition, the global trend of CPT height has increased by 60 m per decade since 2001, but that of CPT temperature has decreased by 0.09 K per decade. The correlation coefficient between the CPT height and temperature is −0.82.
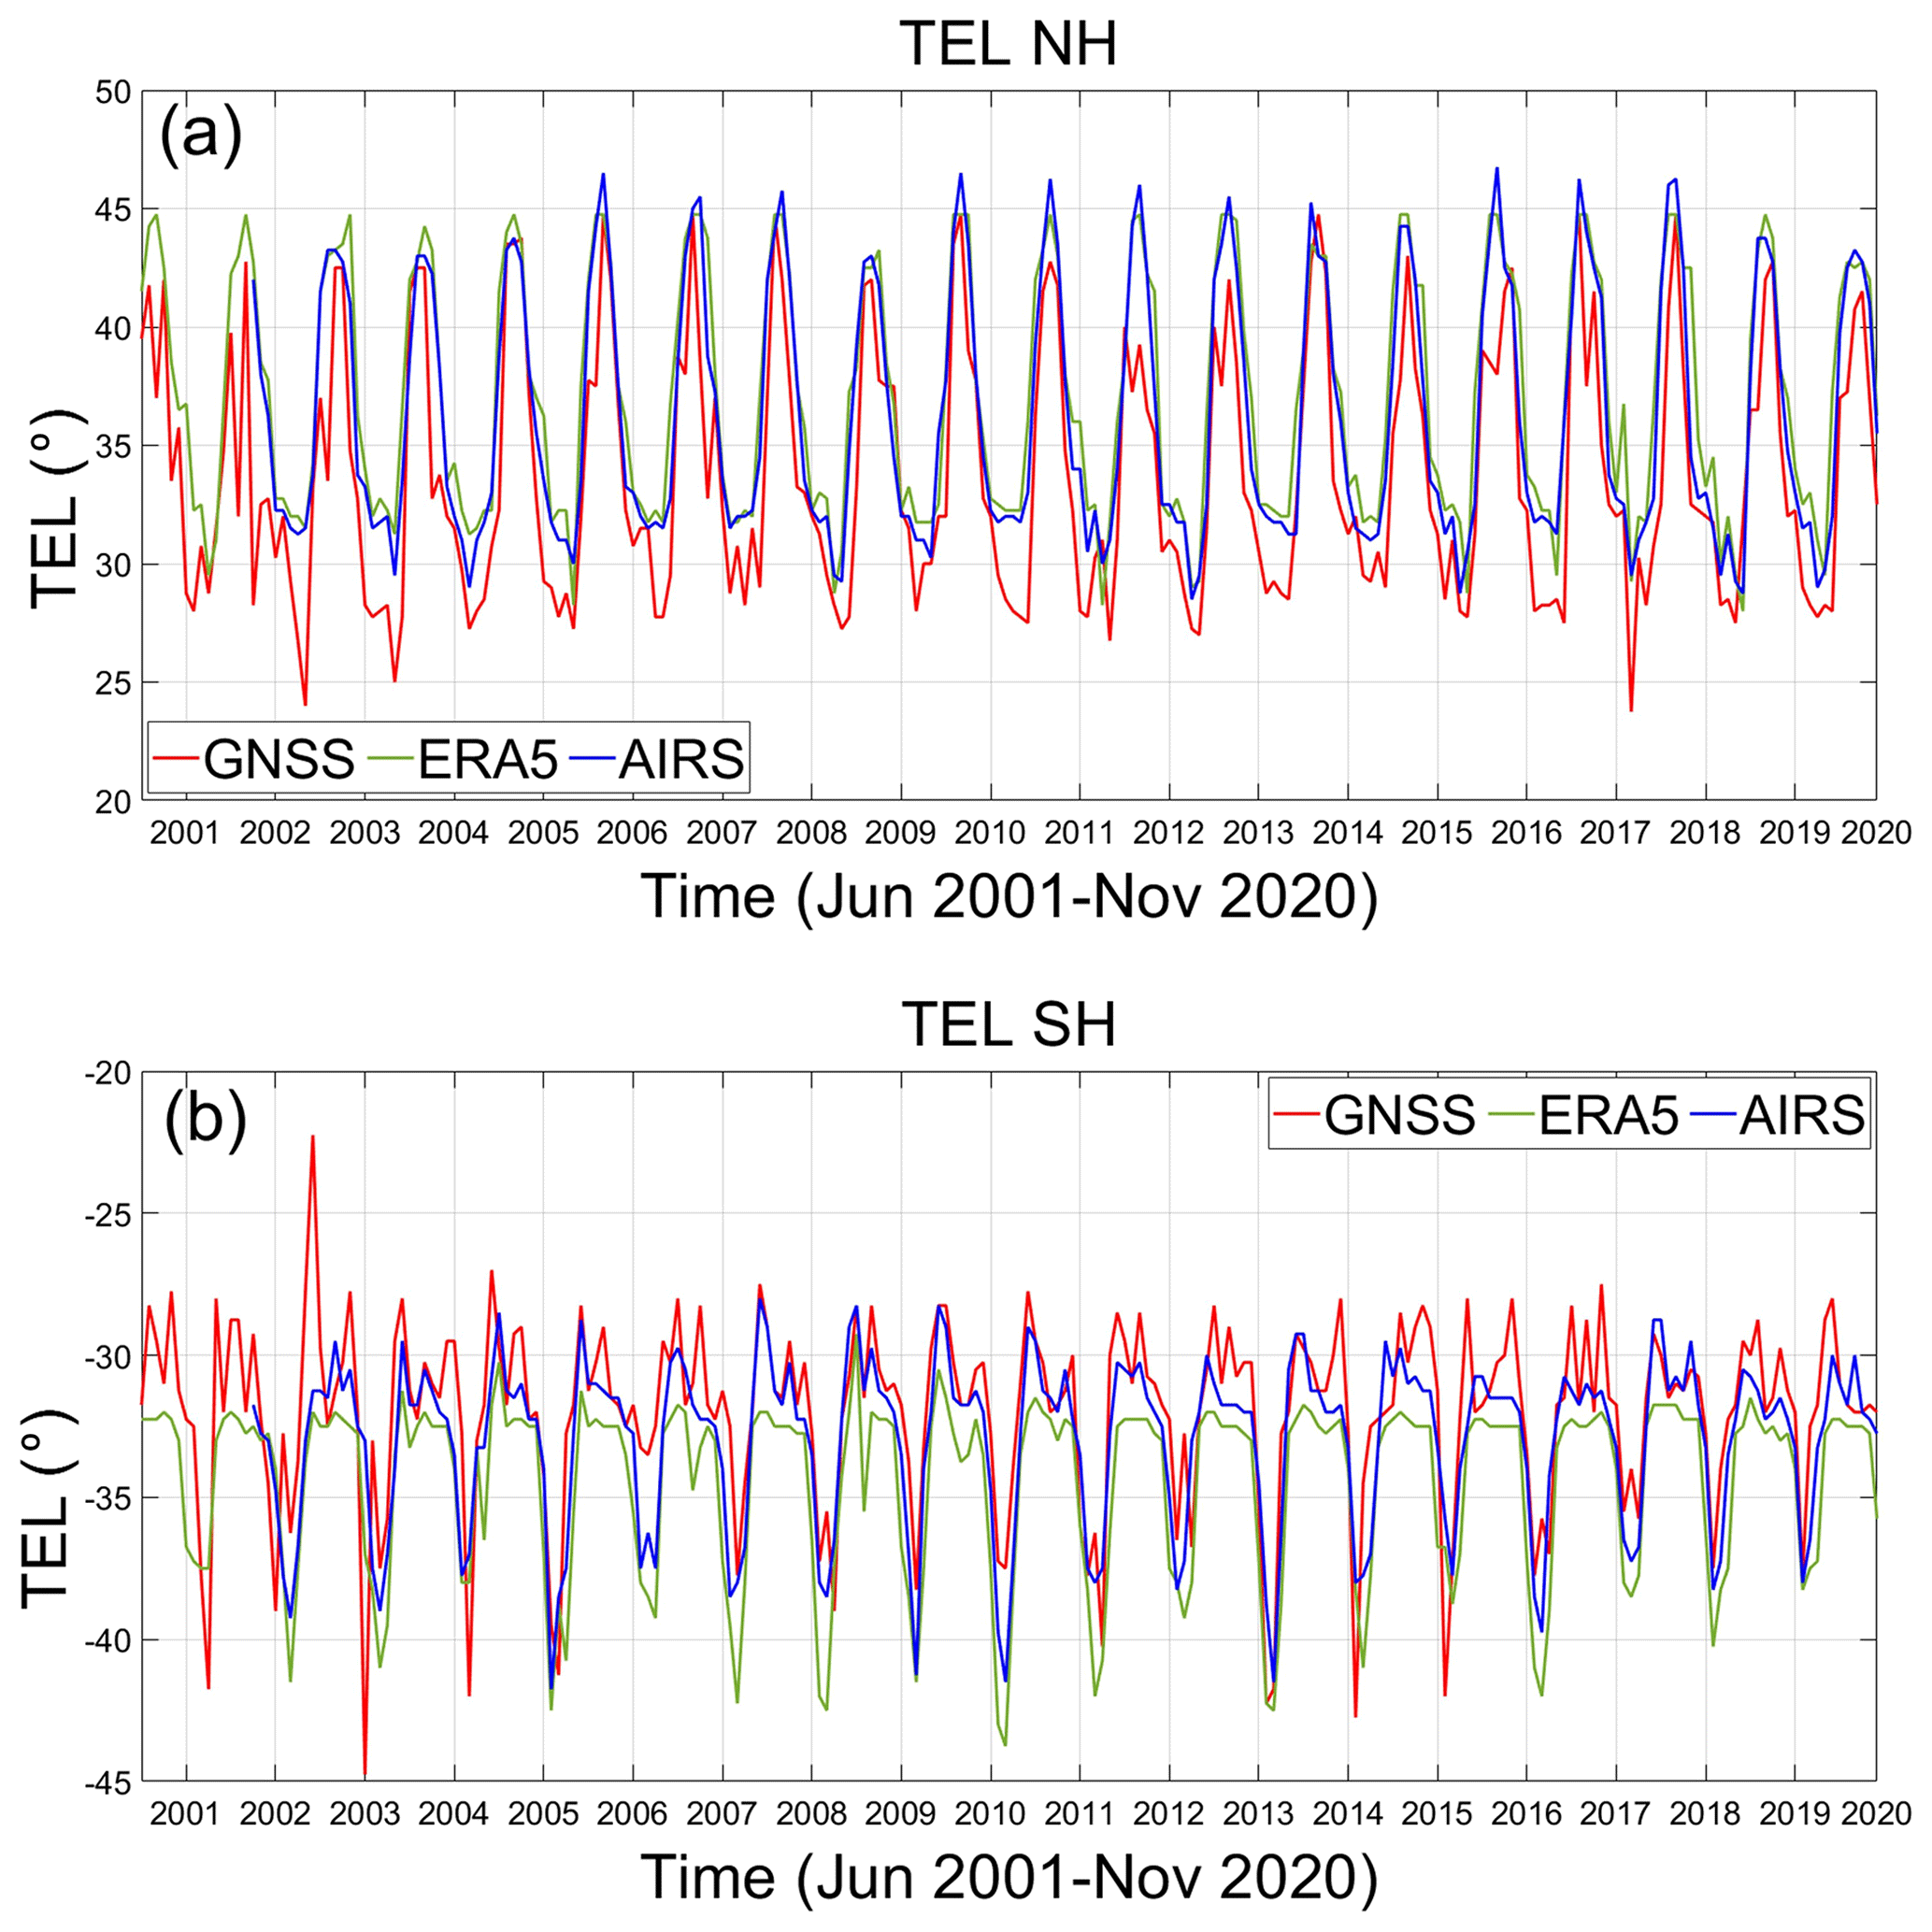
3.3 Comparison between GNSS, ERA5, and AIRS
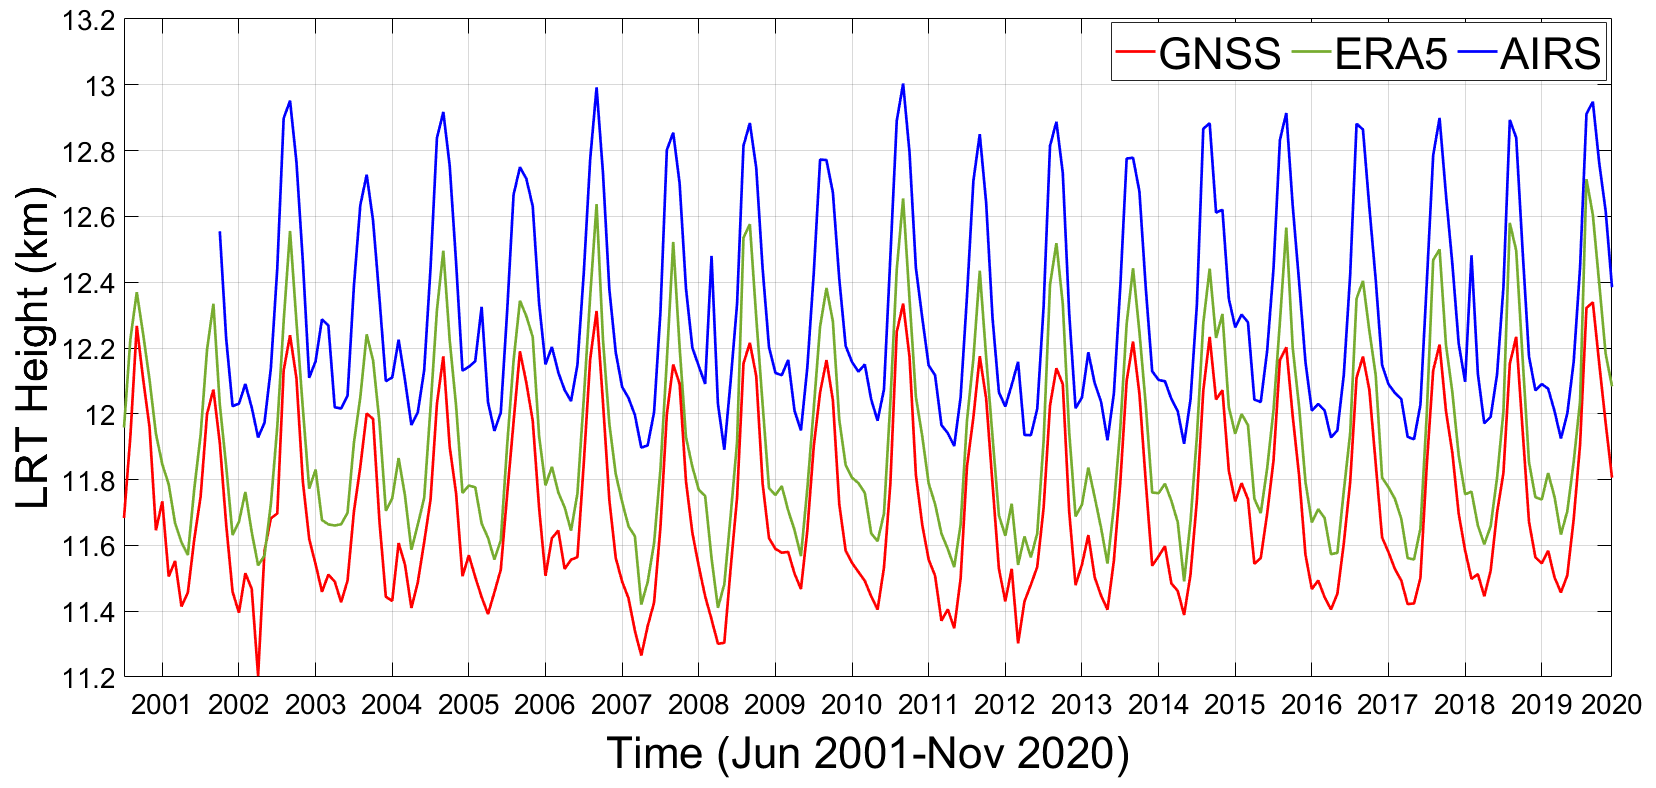
In this study, TEL in each hemisphere is estimated from the monthly zonal average tropopause height retrieved from the LRT definition. This is done because the LRT represents the location of the point of thermal transition between the troposphere and stratosphere. Furthermore, it reacts to both tropospheric and stratospheric temperature changes. Many studies (Seidel and Randel, 2006; Santer et al., 2004) have shown that LRT height is a good climate change indicator. Figure 4 shows the LRT height values derived from GNSS, ERA5, and AIRS. In general, AIRS shows the highest values of LRT height, while GNSS shows the lowest values. The trends show that ERA5 data have the highest increasing rate of LRT height, being 48 m per decade since June 2001. In contrast, AIRS has the lowest rates for LRT height, showing an increase of 12 m per decade since September 2002.
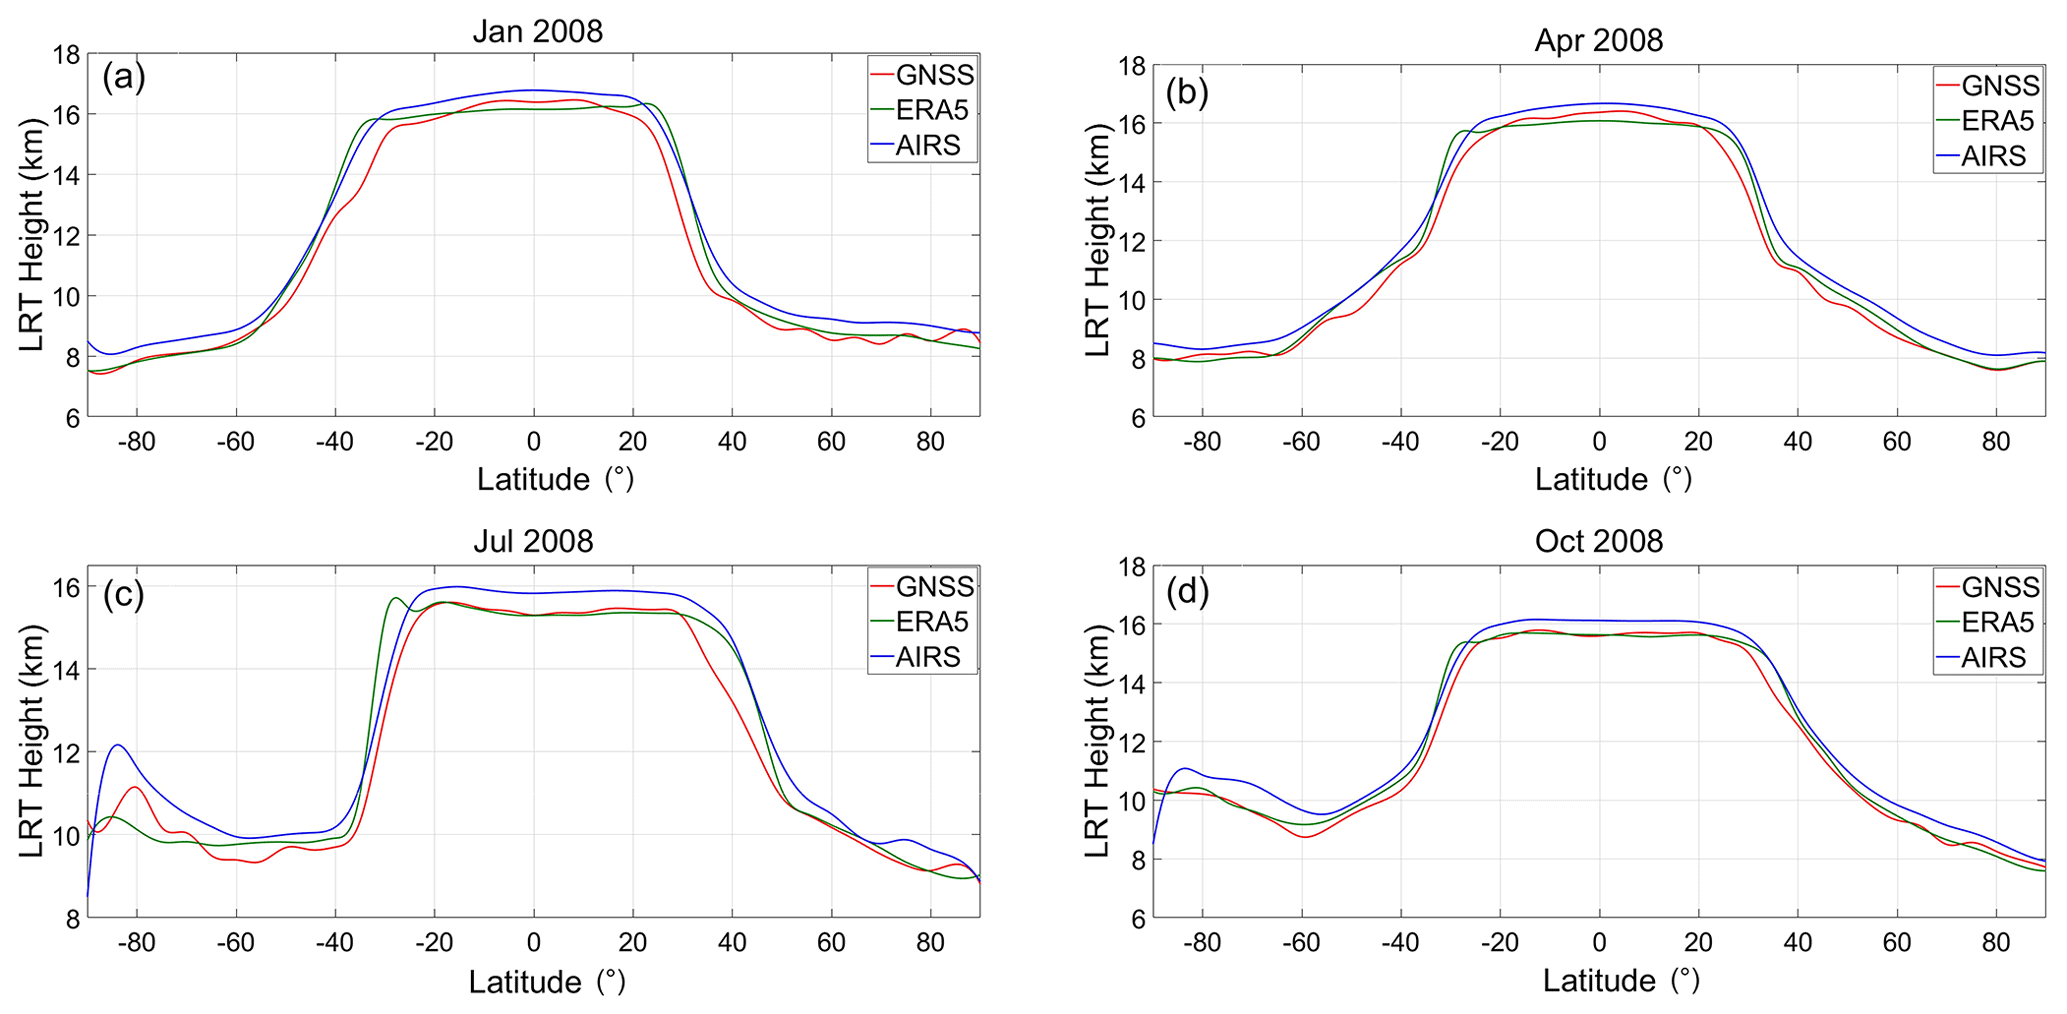
The zonal means of LRT height for the three datasets during January, April, July, and October of 2008 are shown in Fig. 5. In January 2008, the high LRT covered higher latitudes in the SH than in the NH. The opposite occurs in July. In April 2008, the high LRT covered similarly in both hemispheres. In October, the area covered with a high tropopause in the NH is larger than that of the SH but not as wide as the coverage in July. This suggests that the warmer the air, the wider the area covered with a high tropopause. As stated in Sect. 2, the TELs in the NH and SH have been estimated by applying two tropopause height metrics. The results are discussed in detail in the following.
3.3.1 Subjective criterion for TEL
According to the subjective criterion (Davis and Rosenlof, 2012), the TEL in each hemisphere is the latitude at which the tropopause height is 1.5 km under the tropical average tropopause height (15∘ S–15∘ N). As shown in Fig. 6 and Table 2, the tropical belt based on GNSS has expanded by 0.41∘ per decade in the NH and by 0.08∘ per decade in the SH since 2001. Using GNSS-RO data, the tropical belt expansion trends in the NH and SH agree with the results of Ao and Hajj (2013). According to Meng et al. (2021), the highest trend of LRT height covers the latitudinal band from 30 to 40∘ N, and this is possibly caused by the tropical widening and subtropical jet poleward shift over the past 4 decades (Staten et al., 2018), and this corresponds to our study's findings. In the case of ERA5, there is no significant expansion or contraction in both hemispheres, while AIRS has an expansion of about 0.34∘ per decade in the NH and a strong contraction of about −0.48∘ per decade in the SH.
Table 2Tropical belt expansion and contraction rates based on a subjective criterion.

3.3.2 Objective criterion for TEL
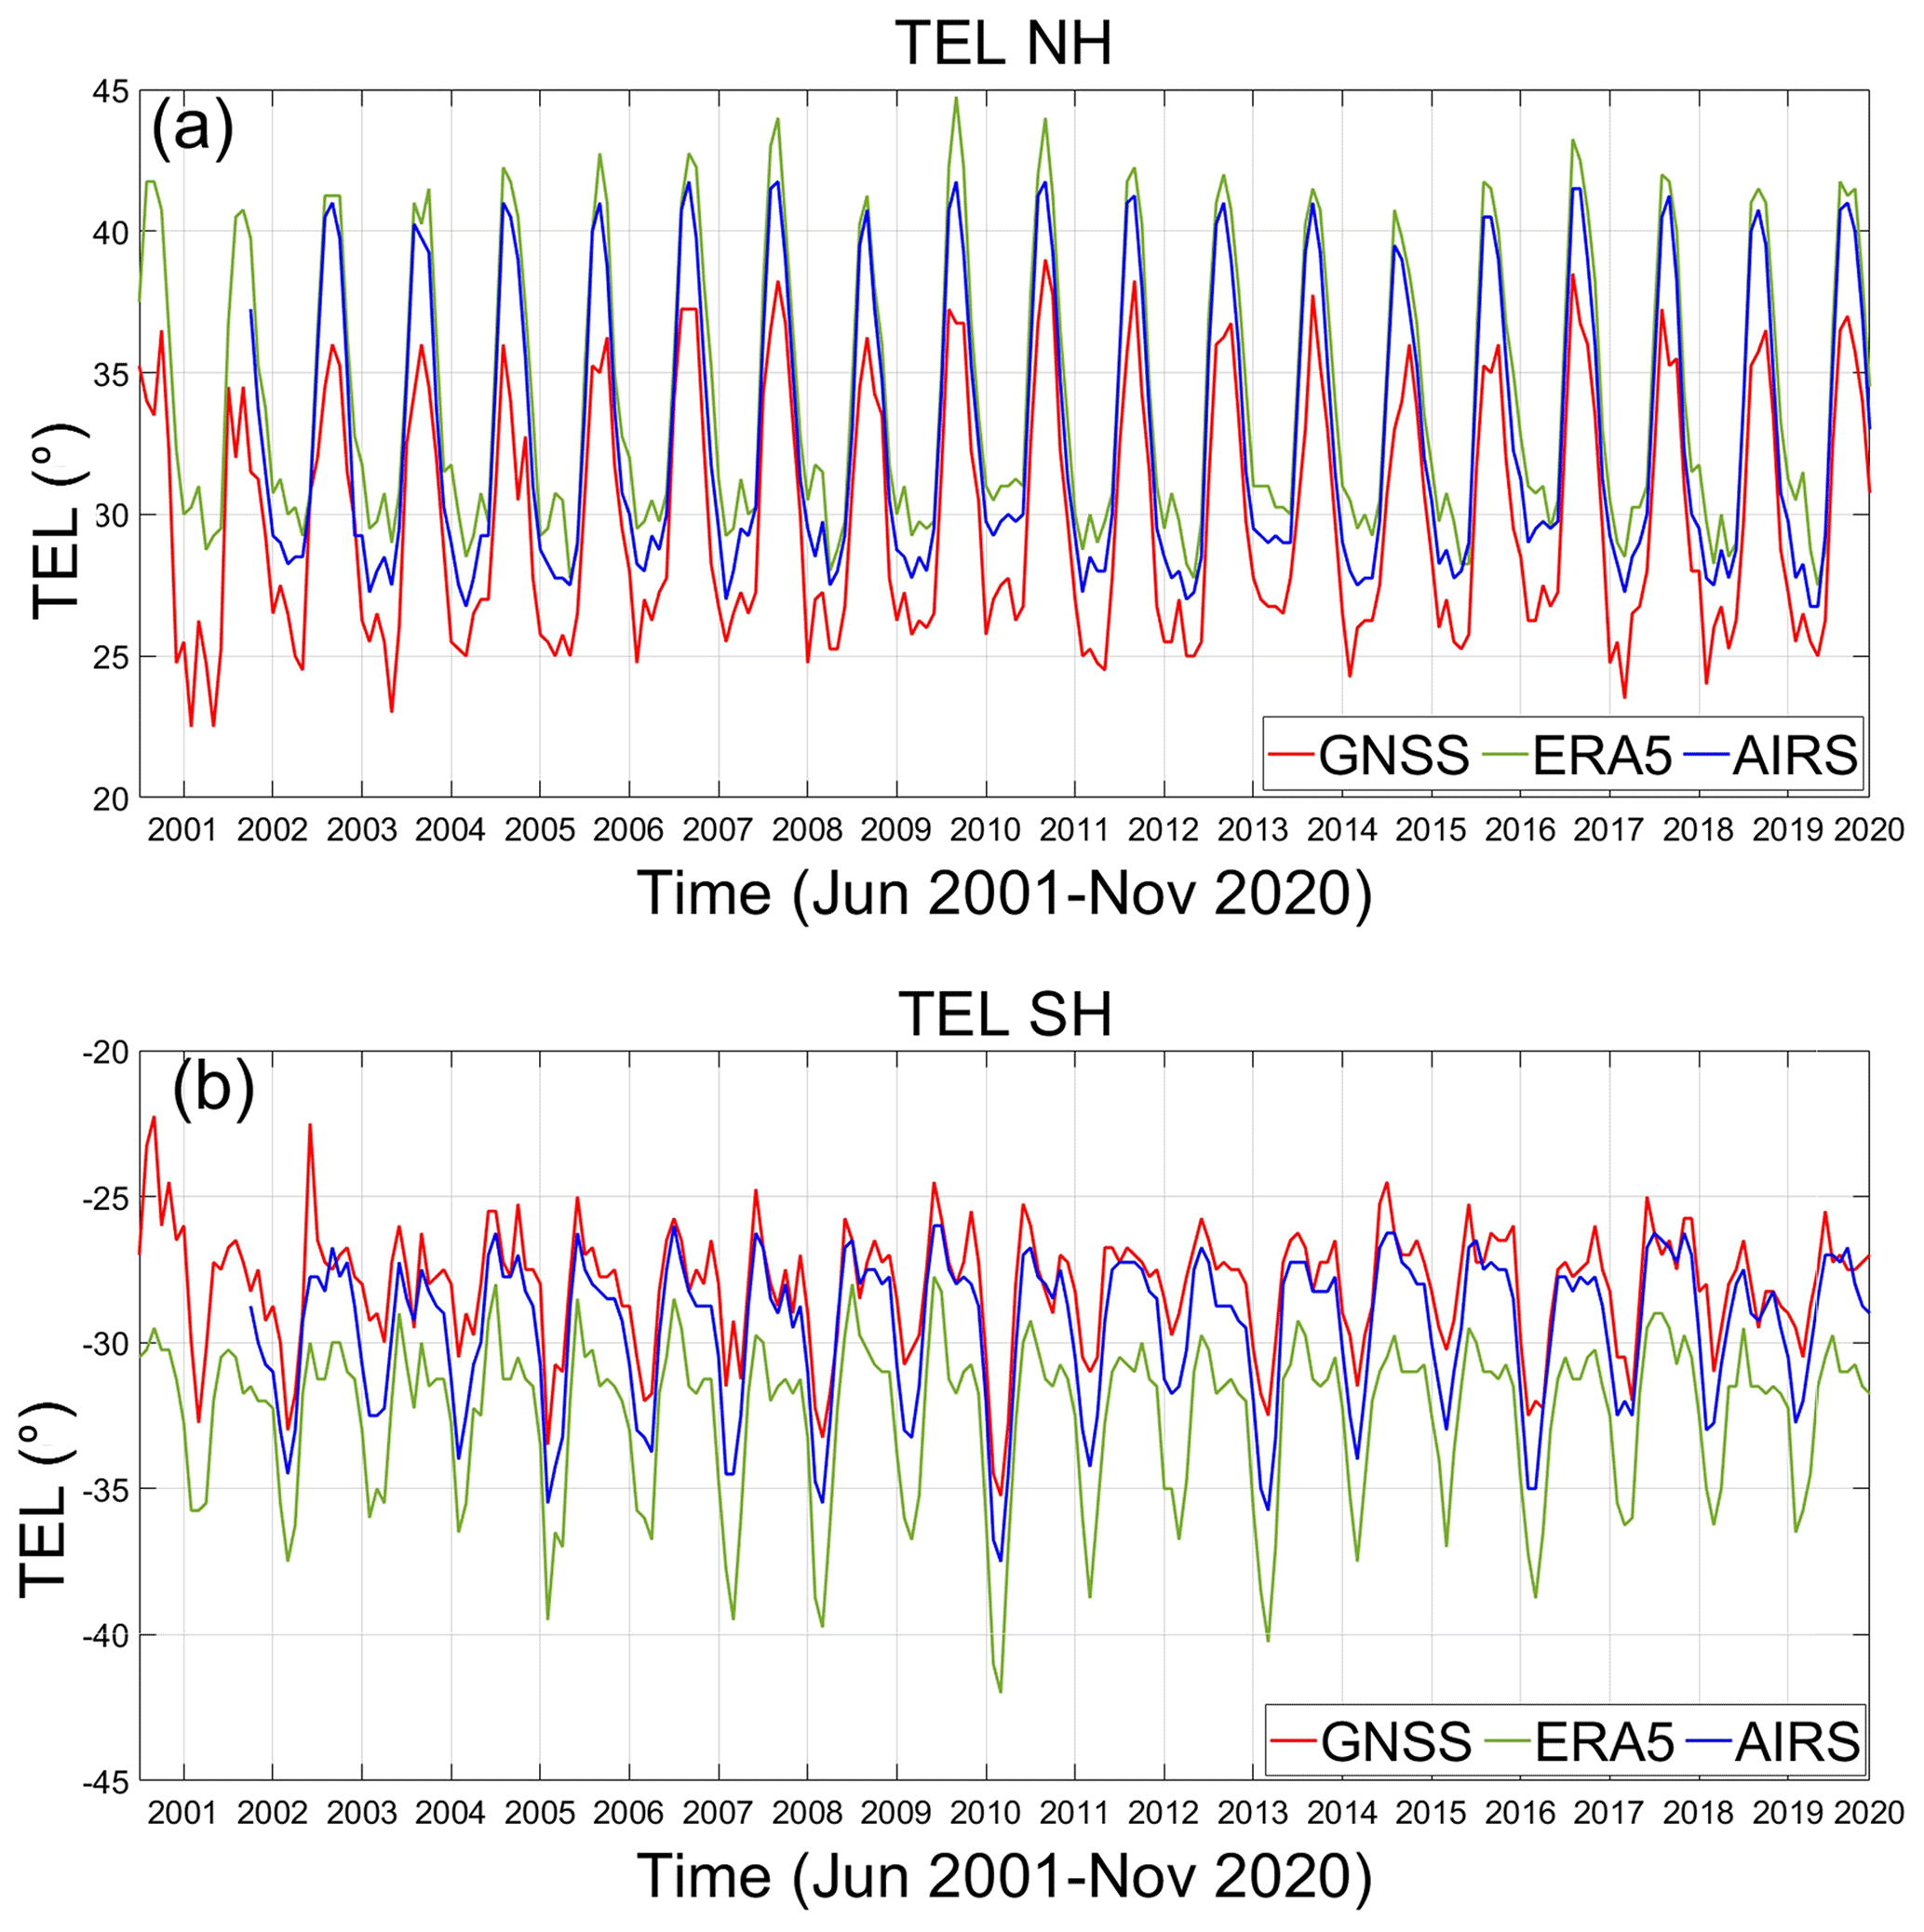
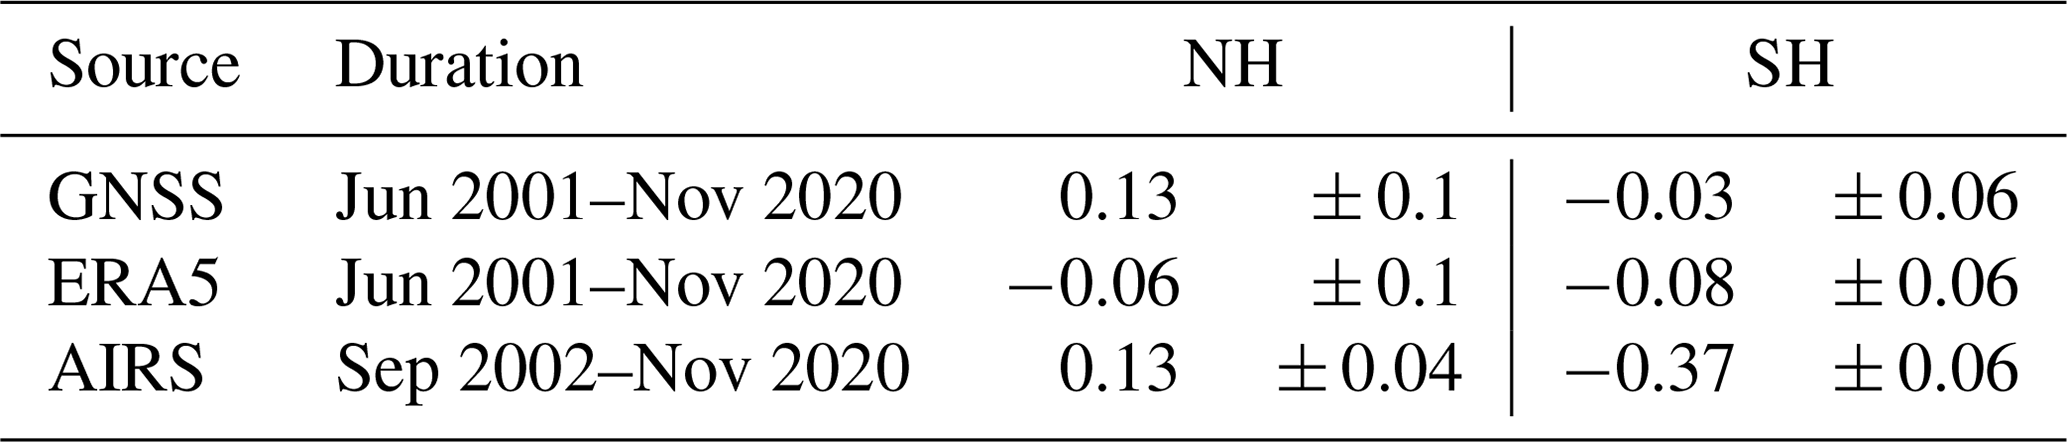
According to the objective criterion (Davis and Rosenlof, 2012), TEL in each hemisphere is the latitude of the maximum poleward gradient of tropopause height. As shown in Fig. 7 and Table 3, the tropical belt based on GNSS has expanded by about 0.13∘ per decade in the NH since 2001, but there is no significant expansion or contraction in the SH. In the case of ERA5, there is no significant trend in the NH, while the SH has a minor contraction of approximately −0.08∘ per decade. AIRS has an expansion of 0.13∘ per decade in the NH and strong contraction in the SH of −0.37∘ per decade. It is clear from these results that the rates of expansion and contraction using the objective criterion are less than that of the subjective criterion, while in the case of the objective method, TELs are located more poleward than that of the subjective method.
Table 3Tropical belt expansion and contraction rates based on an objective criterion.
3.4 Spatial and temporal variability of LRT
In this section, the GNSS LRT height and temperature between 50∘ N and 50∘ S are investigated (Fig. 8). In the NH, the LRT height has increased by about 48 m per decade since 2001, and this is consistent with the results of Meng et al. (2021), which show an increase in LRT height of around 44.4 m per decade over 20 to 80∘ N for the period from 2001 to 2020. In contrast, LRT height in the SH shows a slight decrease of −2.4 m per decade. Regarding LRT temperature, it has increased by about 0.21 K per decade in the NH and by 0.34 K per decade in the SH. Both hemispheres' LRT temperature time series show increasing rates higher than the global one of 0.09 K per decade. Figure 8 also shows the temporal and spatial variability given by the first PCA (PCA1). The temporal variability for LRT height captures 22.79 % of the total variance. For the LRT temperature, PCA1 captures 13.47 % of the total variability. These values are relatively small, showing that the variability spreads along lower-degree PCA modes. We can clearly see the annual forcing. The spatial variability shows similar patterns for LRT height and temperature. The signal in the NH is stronger and wider than that in the SH.
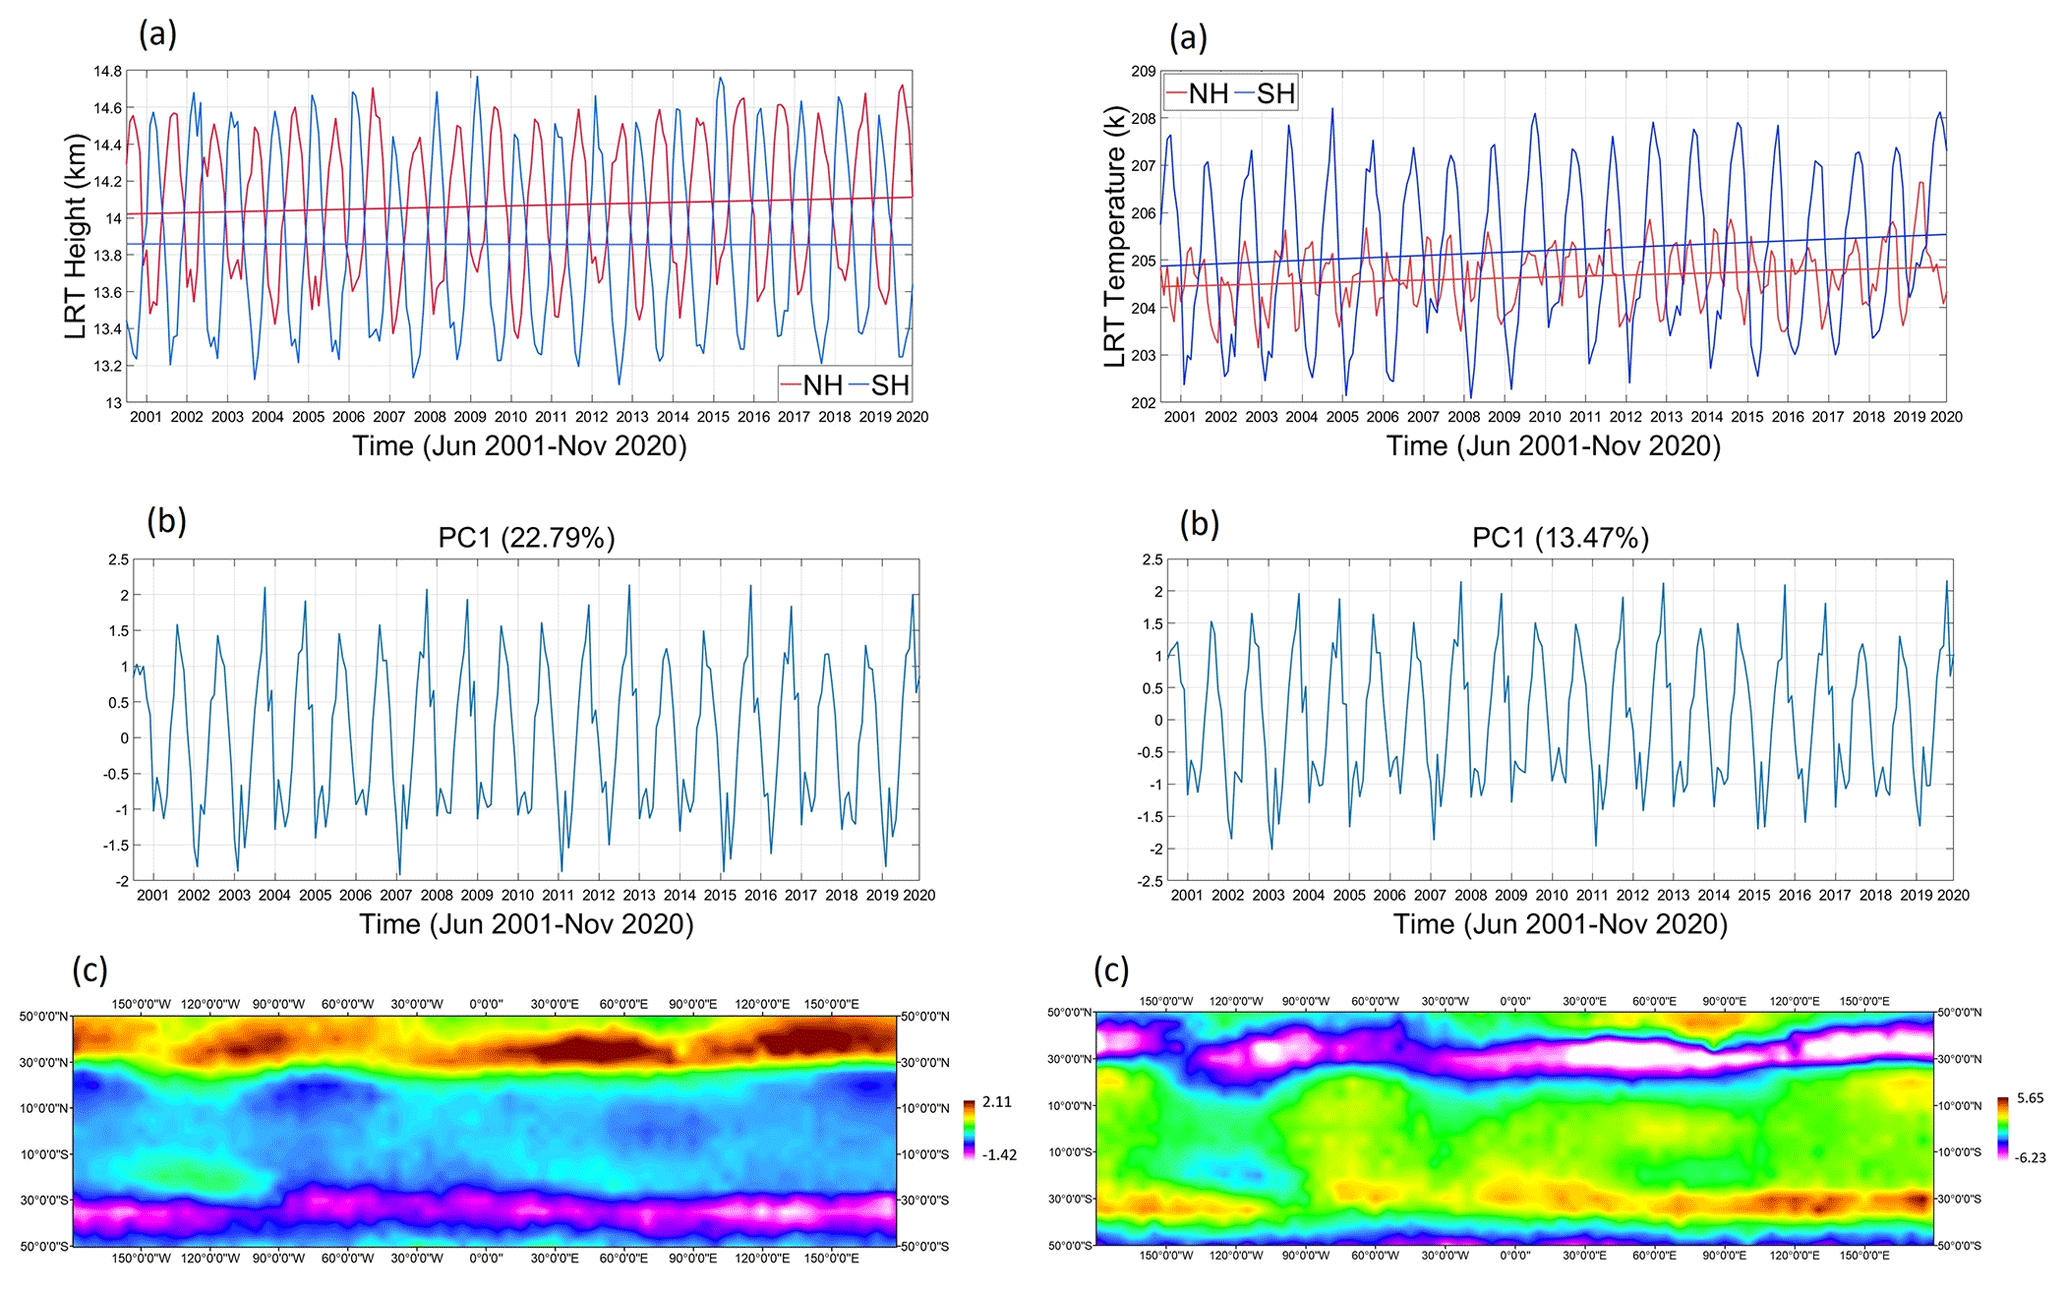
Figure 8GNSS-RO-based LRT height (left) and temperature (right). In (a) temporal time series and (b) temporal variability given by PCA1, and (c) spatial variability map given by PCA1.
3.5 TCO, carbon dioxide (CO2), and methane (CH4)
Figure 9 shows that, since 2001, TCO has had a global increase of 0.7 DU per decade. TCO has a strong negative correlation of −0.64 with the LRT height. This corresponds to the results of previous work which clarified that the TCO pattern is inversely proportional to tropopause height and can give indications about the tropical belt width (Hudson et al., 2003, 2006; Hudson, 2012; Davis et al., 2018). TCO has increased by 0.06 and 1.05 DU per decade in the NH and SH, respectively. Shangguan et al. (2019) reported asymmetric trends of ozone in the midlatitudes of both hemispheres in the middle stratosphere, with considerable ozone decrease in the NH and ozone increase in the SH. In our results, the PCA1 of TCO represents 66.68 % of the total variability. The spatial map of PCA1 shows a stronger signal in the NH than that in the SH. The NH signal is located more poleward than that of the SH. Comparisons with GNSS-RO LRT height spatial and temporal patterns suggest the TCO expansion in the NH and a weak expansion or non-significant contraction in the SH.
Several studies signified an increase in the tropopause height as a result of the tropospheric warming caused by the rise of the GHG concentrations in the atmosphere (Meng et al., 2021; Pisoft et al., 2021). CO2 is the most important GHG, and it is considered a main driver of global warming. The time series of the CO2 is shown in Fig. 9. In this figure, we can see that CO2 has had an increase of 21.38 ppm per decade since 2001. It has a correlation of −0.05 with GNSS LRT height. The CO2 column average in both the NH and SH has the same increasing rate of 21.6 ppm per decade. This is higher than the global rate. The CO2 standard deviation (SD) in the NH is 11.38, which is higher than that of the SH, 10.90. The temporal variability given by PCA1 captures 77.64 % of the total variability. PCA1 shows an increasing trend and large variability with time. The map of PCA1 variability shows a shift toward the North Pole. This seems to be related to the coverage of the tropical belt; i.e., the TEL occurrence in the NH is more poleward than that of the SH.
CH4 is one of the main GHGs, and it is considered a long-term driver of climate change. The global time series of the CH4 column average (Fig. 9a) shows an increasing trend of 39 ppb per decade since 2001. This variable has a correlation of 0.23 with GNSS-RO LRT height. CH4 column averages in both the NH and SH show equal increasing trends of 46.8 ppb per decade. This is higher than the global rate. The CH4 SD in the NH is similar to that in the SH, 25.91. The temporal variability of PCA1 captures 40.65 % of the total variability. It shows a non-significant trend, but its range increases with time. The map of PCA1 shows a more poleward signal in the NH than its equivalent in the SH. The NH signal reaches 30∘ N, while the SH signal does not reach the limit of 30∘ S. This is clearly in line with the GNSS TEL results, showing that the tropical condition in the NH covers a wider area than that in the SH.

Figure 9TCO (top), CO2 (middle), and CH4 (bottom) results. In (a) are global time series against GNSS LRT height; (b) temporal time series in the NH and the SH; (c) temporal variability given by PCA1 and (d) the spatial variability map given by PCA1.

Figure 10Surface temperature (left) and GPCP precipitation (right). (a) Global time series against LRT height; (b) temporal time series in the NH and SH; (c) temporal variability given by PCA1; (d) spatial variability map given by PCA1.
3.6 Surface temperature and GPCP precipitation
Many studies revealed the relationship of the surface temperature with the tropopause height and tropical belt expansion. Thuburn and Craig (1997, 2000) found the simulated tropopause height to be sensitive to the surface temperature. Figure 10 shows that the global surface temperature has increased by 0.3 K per decade since 2001. A clear correlation between the surface temperature and the GNSS-RO LRT height is seen, with a value of 0.81. The surface temperature in both the NH and SH shows increasing trends of 0.23 and 0.18 K per decade, respectively. The surface temperature in the NH has an SD of 3.5, while that of the SH has an SD of 1.5. PCA1 captures 84.41 % of the total variance. PCA1 shows an increasing trend and amplitude with time. The PCA1 map has a signal in the SH weaker than that in the NH. The results of surface temperature agree with that of the GNSS-RO TEL. For instance, the NH shows expansive behavior more than that in the SH, which shows a minor expansion using a subjective criterion and a non-significant contraction applying the objective criterion. Gao et al. (2015) signified that the correlation coefficient between global tropopause height anomalies and the Niño 3.4 sea surface temperature index is 0.53, with a maximum correlation coefficient of 0.8 at a lag of 3 months. Fomichev et al. (2007) also found that an increase in sea surface temperature resulted in a tropopause height increase in a coupled chemistry climate model simulation. Hu and Fu (2007) suggested that an increase in sea surface temperatures in the tropics could result in an increase in the tropopause height and a wider Hadley circulation (tropic width). In addition, our results support surface temperature as a proposed driver for tropic expansion (Allen et al., 2012a; Adam et al., 2014).
The precipitation spatial and temporal variability is investigated to examine the impacts of the TEL variability on the precipitation behavior. The GPCP precipitation has had a global decrease of −0.04 mm per decade since 2001. The precipitation behavior has a strong correlation of 0.61 with the GNSS LRT height. The GPCP precipitation in the NH shows a minor decreasing trend of −0.02 mm per decade; meanwhile, the SH shows a significant decreasing trend of −1.3 mm per decade. The precipitation in the NH has an SD of 15.84, and the SH has an SD of 16.47. PCA1 captures 29.30 % of the total variability. PCA1 has an upward trend and amplitude with time. The PCA1 map shows a pattern in the NH that is stronger and more poleward than that in the SH. The precipitation can be used as an independent metric in signifying the TEL locations. Many studies rely upon surface-based variables to investigate tropical widening, using the GPCP monthly dataset to examine shifts in the positions and boundaries of the subtropical dry zones (Hu et al., 2010; Zhou et al., 2011; Allen et al., 2012b).

Figure 11On the left, SPEI drought index (a) global SPEI time series in comparison with LRT height and (b) SPEI for two latitudinal bands 0–50∘ N and 0–50∘ S. On the right, (a) SPEI drought index in September 2019 and (b) SPEI drought categories in September 2019.
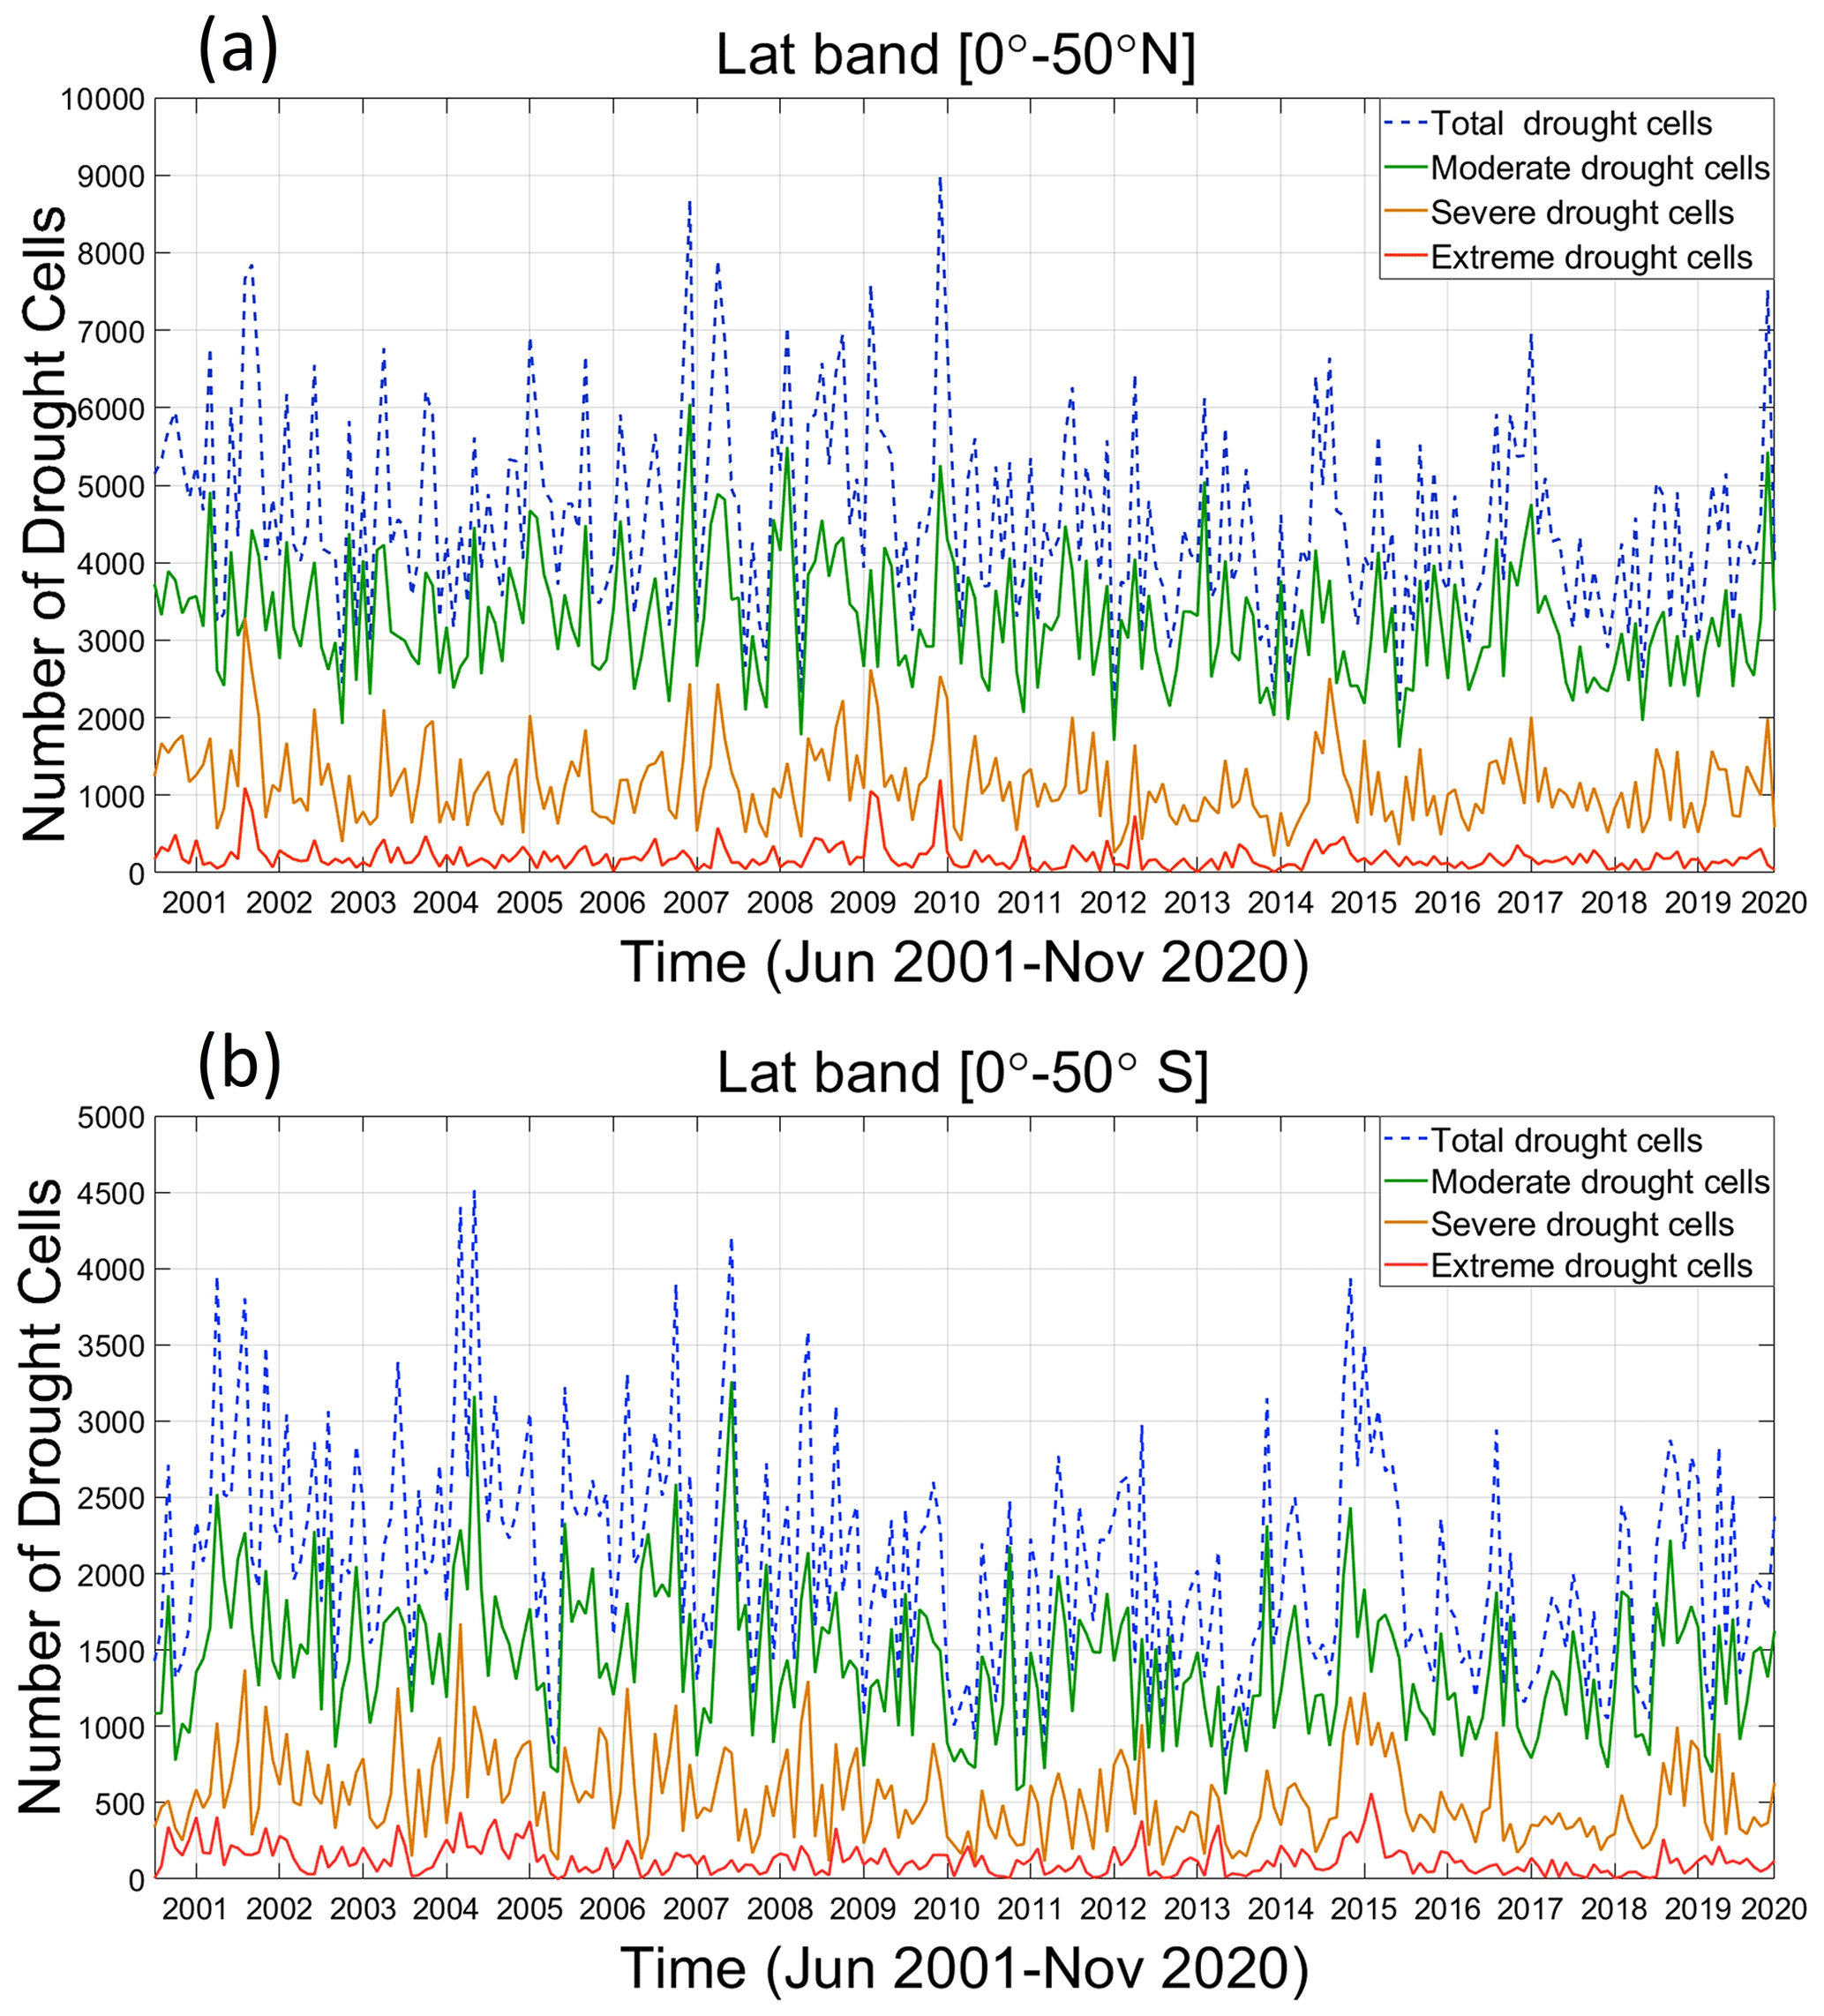
3.7 Standardized precipitation evapotranspiration index (SPEI)
The tropical belt widening would contribute to increasing the midlatitude drought frequency in both hemispheres (Hu and Fu, 2007; Fu et al., 2006; Seidel et al., 2007). The SPEI is usually employed to monitor the meteorological drought status. As is clear in Fig. 11, the SPEI has had a global increase of 0.056 per decade since 2001. The NH shows an increase of 0.035 per decade, and the SH has a decrease of −0.005 per decade. The SPEI has no correlation with GNSS LRT height −0.002. Because the study area is wide and extends through many continents, the SPEI, in our study, only provides information about the dry and wet conditions. Figure 11 shows the spatial pattern of SPEI in September 2019 and the areas by category of no-drought, moderate, severe, and extreme. Figure 12 shows the number of cells covered with drought, and its corresponding classification is from Fig. 11. The total number of cells covered with drought in the NH nearly doubles its value in the SH. Both hemispheres have a decreasing trend of the number of cells covered with drought. The decrease rate is 510 cells per decade in the NH and 373 cells per decade in the SH. The drought does not show any spatial pattern associated with the locations of TELs.
The GNSS-RO is a well-established technique to derive atmospheric temperature structure in the UTLS region. In this study, GNSS-RO data of 12 RO missions are combined together to examine the possible tropical belt expansion. The intercomparison of GNSS-RO profiles of the different utilized RO missions shows a high level of consistency to be employed together in our analysis. GNSS-RO profiles are employed to derive tropopause height and temperature based on LRT and CPT definitions. The tropopause height is a key element in climate change research because its variability has a correlation with the global warming phenomenon (Santer et al., 2003; Sausen and Santer, 2003; Seidel and Randel, 2006; Mohd Zali and Mandeep, 2019). Our analyses show that GNSS LRT and CPT heights have increased by 36 m per decade and 60 m per decade, respectively, since June 2001. There is a high correlation between the tropopause height and temperature, being −0.78 and −0.82 for LRT and CPT, respectively. The LRT height from ERA5 shows an increase of 48 m per decade since June 2001, and that derived from AIRS has had a smaller increasing rate of 12 m per decade since September 2002.
In most of the previous studies, the reported tropical widening rates range from 0.25 to 3.0∘ latitude per decade, and their statistical significance varies by a large amount based on the metrics used to estimate the TEL as well as the datasets utilized for its derivation (Davis and Rosenlof, 2012). In our study, the TEL in each hemisphere is estimated using two tropopause height metrics. Applying the first method, the subjective criterion, there are higher expansion and contraction rates than that from the second method, the objective criterion. While using the objective criterion, the locations of TELs in both hemispheres are more poleward than those from the subjective criterion. Based on the subjective method, tropical width results from GNSS-RO have an expansive behavior in the NH of about 0.41∘ per decade and a minor expansion trend in the SH of 0.08∘ per decade. ERA5 has non-significant contraction in both hemispheres. In the case of the AIRS data, there is a clear expansion behavior in the NH of about 0.34∘ per decade and a strong contraction in the SH of about −0.48∘ per decade. Based on the objective method, GNSS-RO has an expansive behavior in the NH of about 0.13∘ per decade, but there is no significant expansion or contraction in the SH. For ERA5, there is no significant trend for the TEL results in the NH, while there is a minor contraction of about −0.08∘ per decade in the SH. The AIRS data show an expansion in the NH of 0.13∘ per decade and a strong contraction in the SH of −0.37∘ per decade. Results of several studies, based on different datasets and metrics, show an expansive behavior of the tropical belt in the NH higher than that of the SH, and this broadly agrees with our GNSS-RO-based results (Hu and Fu, 2007; Archer and Caldeira, 2008; Hu et al., 2010; Zhou et al., 2011; Allen et al., 2012b). From all the datasets, the TEL is located more poleward in the NH than in the SH. For both the subjective and objective methods, the TELs reach the latitudes of 44.75 and 46.75∘ N, respectively, in the NH. Meanwhile, in the SH the TELs reach the latitudes of 42 and 44.75∘ S for the subjective and objective methods, respectively. In both hemispheres, the variability of tropopause parameters (temperature and height) is maximum around the TEL locations.
The TCO shows increasing rates globally. The rate in the SH is higher than that of the NH. The ozone variability agrees well with the spatial and temporal modes of TELs estimated from GNSS-RO LRT height, and this supports GNSS-RO TEL estimates over those of ERA5 and AIRS. In addition, CO2 and CH4, as the main GHGs responsible for global warming, concentrations increase cause a tropopause height rise (Meng et al., 2021; Pisoft et al., 2021). In our analysis, both CO2 and CH4 show a global increasing rate. Their upward trends in the NH and the SH are nearly the same. The patterns of TCO and CO2 display good agreement with the TEL locations in the NH and SH. They show more poleward occurrence with time, and their variability in the NH is higher than that of the SH. In addition, CH4 has a signal in the NH that occurs more poleward than that in the SH. The surface temperature and precipitation both increase with time and have a strong correlation with LRT height. Both variables show an increasing rate in the NH higher than in the SH. The surface temperature shows a strong spatial variability pattern that broadly agrees with the TEL locations from GNSS-RO. The spatial pattern of precipitation shows a northward orientation. The SPEI meteorological drought index shows an increasing rate globally. It has an upward trend in the NH while having a decreasing trend in the SH. Since the SPEI is multivariate, it has no direct response to the TEL behavior. In both hemispheres, the number of cells covered with drought has decreased since 2001. It can be concluded that the tropical belt widening rates are different from one dataset to another and from one metric to another. In addition, TEL behavior in the NH is different from that of the SH. Furthermore, the variability of meteorological parameters agrees with GNSS TEL results more than with that of other datasets. The study results signify the importance of monitoring the tropopause and TEL parameters, which can accurately indicate the climate variability and climate change globally.
GNSS-RO data used in this paper are available at CDAAC archive (https://cdaac-www.cosmic.ucar.edu/, CDAAC, 2021). ERA5 data are publicly available at climate data store (https://cds.climate.copernicus.eu, last access: 15 May 2021; https://doi.org/10.24381/cds.6860a573, Hersbach et al., 2019a; https://doi.org/10.24381/cds.f17050d7, Hersbach et al., 2019b). In addition, MERRA-2 (https://doi.org/10.5067/5ESKGQTZG7FO, GMAO, 2015) and AIRS (https://doi.org/10.5067/UBENJB9D3T2H, AIRS, 2019a; https://doi.org/10.5067/KUC55JEVO1SR, AIRS, 2019b) datasets were obtained from Goddard Earth Sciences Data and Information Services Center (GES DISC) (https://disc.gsfc.nasa.gov, last access: 17 January 2021). CO2 data were acquired from NOAA Earth System Research Laboratories (ESRL) (https://doi.org/10.25925/20201008, Jacobson et al., 2020). GPCP data were downloaded from https://www.ncei.noaa.gov/access (last access: 15 March 2021; https://doi.org/10.7289/V56971M6, Adler et al., 2016). CRU data are accessed from https://crudata.uea.ac.uk/cru/data/hrg/ (Harris et al., 2020). The package used for SPEI computation is free available at https://cran.r-project.org/web/packages/SPEI (Vicente-Serrano et al., 2010; Beguería et al., 2013).
MD provided the main ideas, developed the methodology, conceived and performed the experiments, and analyzed the results. SG provided supervision, mentorship, and funding support. AC provided manuscript edition and revision tasks. AS helped in manuscript writing and editing.
The contact author has declared that neither they nor their co-authors have any competing interests.
Publisher's note: Copernicus Publications remains neutral with regard to jurisdictional claims in published maps and institutional affiliations.
The authors thank the CDAAC for providing GNSS-RO data, NOAA ESRL for providing CarbonTracker CT2019B, and Copernicus Climate Change Service Information for the MERRA-2 and ERA5 data. We are grateful to the CRU and the GPCP for granting access to datasets. The first author especially thanks the National Research Institute of Astronomy and Geophysics, Egypt, and Nanjing University of Information Science and Technology, China, for granting the scholarship to pursue his PhD.
This research was funded by the National Natural Science Foundation of China (NSFC) (grant no. 12073012), the National Natural Science Foundation of China and the German Science Foundation (NSFC–DFG) (grant no. 41761134092), the China Scholarship Council (CSC), and the Ministry of Higher Education of the Arab Republic of Egypt.
This paper was edited by Petr Pisoft and reviewed by two anonymous referees.
Adam, O., Schneider, T., and Harnik, N.: Role of Changes in Mean Temperatures versus Temperature Gradients in the Recent Widening of the Hadley Circulation, J. Clim., 27, 7450–7461, 2014.
Adam, O., Grise, K. M., Staten, P., Simpson, I. R., Davis, S. M., Davis, N. A., Waugh, D. W., Birner, T., and Ming, A.: The TropD software package (v1): standardized methods for calculating tropical-width diagnostics, Geosci. Model Dev., 11, 4339–4357, https://doi.org/10.5194/gmd-11-4339-2018, 2018.
Adler, R., Wang, J., Sapiano, M., Huffman, G., Chiu, L., Xie, P., Ferraro, R., Schneider, U., Becker, A., Bolvin, D., Nelkin, E., Gu, G., and NOAA CDR Program: Global Precipitation Climatology Project (GPCP) Climate Data Record (CDR), Version 2.3 (Monthly), National Oceanic and Atmospheric Administration (NOAA) National Centers for Environmental Information (NCEI) [data set], https://doi.org/10.7289/V56971M6, 2016.
AIRS project: Aqua/AIRS L3 Monthly Standard Physical Retrieval (AIRS-only) 1∘ × 1∘ V7.0, Greenbelt, MD, USA, Goddard Earth Sciences Data and Information Services Center (GES DISC) [data set], https://doi.org/10.5067/UBENJB9D3T2H, 2019a.
AIRS project: Aqua/AIRS L3 Monthly Standard Physical Retrieval (AIRS+AMSU) 1∘ × 1∘ V7.0, Greenbelt, MD, USA, Goddard Earth Sciences Data and Information Services Center (GES DISC) [data set], https://doi.org/10.5067/KUC55JEVO1SR, 2019b.
Allen, R. J., Sherwood, S. C., Norris, J. R., and Zender, C. S.: The equilibrium response to idealized thermal forcings in a comprehensive GCM: implications for recent tropical expansion, Atmos. Chem. Phys., 12, 4795–4816, https://doi.org/10.5194/acp-12-4795-2012, 2012a.
Allen, R. J., Sherwood, S. C., Norris, J. R., and Zender, C. S.: Recent Northern Hemisphere tropical expansion primarily driven by black carbon and tropospheric ozone, Nature, 485, 350–354, https://doi.org/10.1038/nature11097, 2012b.
Ao, C. O. and Hajj, J. A.: Monitoring the width of the tropical belt with GPS radio occultation measurements, Geophys. Res. Lett., 40, 6236–6241, https://doi.org/10.1002/2013GL058203, 2013.
Archer, C. L. and Caldeira, K.: Historical trends in the jet streams, Geophys. Res. Lett., 35, L08803, https://doi.org/10.1029/2008gl033614, 2008.
Aumann, H., Chahine, M., Gautier, C., Goldberg, M., Kalnay, E., McMillin, L., Revercomb, H., Rosenkranz, P., Smith, W., Staelin, D., Strow, L., and Susskind, J.: AIRS/AMSU/HSB on the aqua mission: design, science objectives, data products, and processing systems, IEEE Trans. Geosci. Remote Sens., 41, 253–264, https://doi.org/10.1109/tgrs.2002.808356, 2003.
Bai, W., Deng, N., Sun, Y., Du, Q., Xia, J., Wang, X., Meng, X., Zhao, D., Liu, C., Tan, G., Liu, Z., and Liu, X.: Applications of GNSS-RO to Numerical Weather Prediction and Tropical Cyclone Forecast, Atmosphere, 11, 1204, https://doi.org/10.3390/atmos11111204, 2020.
Beguería, S., Vicente-Serrano, S. M., Reig, F., and Latorre, B.: Standardized precipitation evapotranspiration index (SPEI) revisited: parameter fitting, evapotranspiration models, tools, datasets and drought monitoring, Int. J. Climatol., 34, 3001–3023, https://doi.org/10.1002/joc.3887, 2013 (data available at: https://cran.r-project.org/web/packages/SPEI, last access: 15 June 2021).
Calabia, A. and Jin, S.: New modes and mechanisms of thermospheric mass density variations from GRACE accelerometers, J. Geophys. Res.-Space, 121, 11191–11212, https://doi.org/10.1002/2016ja022594, 2016.
Calabia, A. and Jin, S.: New Modes and Mechanisms of Long-Term Ionospheric TEC Variations From Global Ionosphere Maps, J. Geophys. Res.-Space, 125, e2019JA027703, https://doi.org/10.1029/2019ja027703, 2020.
CDAAC: COSMIC Data Analysis and Archive Center [data set], https://cdaac-www.cosmic.ucar.edu/, last access: 20 March 2021.
Davis, N. A. and Birner, T.: Seasonal to multidecadal variability of the width of the tropical belt, J. Geophys Res.-Atmos., 118, 7773–7787, https://doi.org/10.1002/jgrd.50610, 2013.
Davis, S. M. and Rosenlof, K. H.: A Multidiagnostic Intercomparison of Tropical-Width Time Series Using Reanalyses and Satellite Observations, J. Clim., 25, 1061–1078, https://doi.org/10.1175/jcli-d-11-00127.1, 2012.
Davis, S. M., Hassler, B., and Rosenlof, K. H.: Revisiting ozone measurements as an indicator of tropical width, Prog. Earth Planet. Sci., 5, 56, https://doi.org/10.1186/s40645-018-0214-5, 2018.
Foelsche, U., Pirscher, B., Borsche, M., Kirchengast, G., and Wickert, J.: Assessing the Climate Monitoring Utility of Radio Occultation Data: From CHAMP to FORMOSAT-3/COSMIC, Terr. Atmos. Ocean. Sci., 20, 155–170, https://doi.org/10.3319/tao.2008.01.14.01(f3c), 2009.
Fomichev, V. I., Johnson, A. I., de Grandpré, J., Beagley, S. R., McLandress, C., Semeniuk, K., and Shepherd, T. G.: Response of the middle atmosphere to CO2 doubling: Results from the Canadian middle atmosphere model, J. Clim., 20, 1121–1144, 2007.
Fu, Q., Johanson, C. M., Wallace, J. M., and Reichler, T.: Enhanced mid-latitude tropospheric warming in satellite measurements, Science, 312, 1179, https://doi.org/10.1126/science.1125566, 2006.
Gao, P., Xu, X., and Zhang, X.: Characteristics of the Trends in the Global Tropopause Estimated From COSMIC Radio Occultation Data, IEEE Trans. Geosci. Remote Sens., 53, 6813–6822, https://doi.org/10.1109/tgrs.2015.2449338, 2015.
GMAO (Global Modeling and Assimilation Office): MERRA-2 instM_2d_asm_Nx: 2d, Monthly mean, Single-Level, Assimilation, Single-Level Diagnostics V5.12.4, Greenbelt, MD, USA, Goddard Earth Sciences Data and Information Services Center (GES DISC) [data set], https://doi.org/10.5067/5ESKGQTZG7FO, 2015.
Gnanadesikan, A. and Stouffer, R. J.: Diagnosing atmosphere-ocean general circulation model errors relevant to the terrestrial biosphere using the Köppen climate classification, Geophys. Res. Lett., 33, L22701, https://doi.org/10.1029/2006gl028098, 2006.
Grise, K. M., Davis, S. M., Simpson, I. R., Waugh, D. W., Fu, Q., Allen, R. J., Rosenlof, K. H., Ummenhofer, C. C., Karnauskas, K. B., Maycock, A. C., Quan, X. W., Birner, T., and Staten, P. W.: Recent Tropical Expansion: Natural Variability or Forced Response?, J. Clim., 32, 1551–1571, https://doi.org/10.1175/jcli-d-18-0444.1, 2019.
Hajj, G. A., Ao, C. O., Iijima, B. A., Kuang, D., Kursinski, E. R., Mannucci, A. J., Meehan, T. K., Romans, L. J., de la Torre Juarez, M., and Yunck, T. P.: CHAMP and SAC-C atmospheric occultation results and intercomparisons, J. Geophys Res.-Atmos., 109, D06109, https://doi.org/10.1029/2003jd003909, 2004.
Harris, I., Osborn, T. J., Jones, P., and Lister, D.: Version 4 of the CRU TS monthly high-resolution gridded multivariate climate dataset, Sci Data, 7, 109, https://doi.org/10.1038/s41597-020-0453-3, 2020 (data available at: https://crudata.uea.ac.uk/cru/data/hrg/, last access: 17 April 2021).
Hersbach, H., Bell, B., Berrisford, P., Biavati, G., Horányi, A., Muñoz Sabater, J., Nicolas, J., Peubey, C., Radu, R., Rozum, I., Schepers, D., Simmons, A., Soci, C., Dee, D., and Thépaut, J.-N.: ERA5 monthly averaged data on pressure levels from 1979 to present, Copernicus Climate Change Service (C3S) Climate Data Store (CDS) [data set], https://doi.org/10.24381/cds.6860a573, 2019a.
Hersbach, H., Bell, B., Berrisford, P., Biavati, G., Horányi, A., Muñoz Sabater, J., Nicolas, J., Peubey, C., Radu, R., Rozum, I., Schepers, D., Simmons, A., Soci, C., Dee, D., and Thépaut, J.-N.: ERA5 monthly averaged data on single levels from 1979 to present, Copernicus Climate Change Service (C3S) Climate Data Store (CDS) [data set], https://doi.org/10.24381/cds.f17050d7, 2019b.
Ho, S. P., Hunt, D., Steiner, A. K., Mannucci, A. J., Kirchengast, G., Gleisner, H., Heise, S., von Engeln, A., Marquardt, C., Sokolovskiy, S., Schreiner, W., Scherllin-Pirscher, B., Ao, C., Wickert, J., Syndergaard, S., Lauritsen, K. B., Leroy, S., Kursinski, E. R., Kuo, Y. H., and Gorbunov, M.: Reproducibility of GPS radio occultation data for climate monitoring: Profile-to-profile inter-comparison of CHAMP climate records 2002 to 2008 from six data centers, J. Geophys Res.-Atmos., 117, D18111, https://doi.org/10.1029/2012jd017665, 2012.
Holton, J. R., Haynes, P. H., McIntyre, M. E., Douglass, A. R., Rood, R. B., and Pfister, L.: Stratosphere-troposphere exchange, Rev. Geophys., 33, 403–439, https://doi.org/10.1029/95RG02097, 1995.
Hu, Y. and Fu, Q.: Observed poleward expansion of the Hadley circulation since 1979, Atmos. Chem. Phys., 7, 5229–5236, https://doi.org/10.5194/acp-7-5229-2007, 2007.
Hu, Y., Zhou, C., and Liu, J.: Observational evidence for poleward expansion of the Hadley circulation, Adv. Atmos. Sci., 28, 33–44, https://doi.org/10.1007/s00376-010-0032-1, 2010.
Hudson, R. D.: Measurements of the movement of the jet streams at mid-latitudes, in the Northern and Southern Hemispheres, 1979 to 2010, Atmos. Chem. Phys., 12, 7797–7808, https://doi.org/10.5194/acp-12-7797-2012, 2012.
Hudson, R. D., Frolov, A. D., Andrade, M. F., and Follette, M. B.: The Total Ozone Field Separated into Meteorological Regimes, Part I: Defining the Regimes, J. Atmos. Sci., 60, 1669–1677, 2003.
Hudson, R. D., Andrade, M. F., Follette, M. B., and Frolov, A. D.: The total ozone field separated into meteorological regimes – Part II: Northern Hemisphere mid-latitude total ozone trends, Atmos. Chem. Phys., 6, 5183–5191, https://doi.org/10.5194/acp-6-5183-2006, 2006.
Jacobson, A. R., Schuldt, K. N., Miller, J. B., Oda, T., Tans, P., Andrews, A., Mund, J., Ott, L., Collatz, G. J., Aalto, T., Afshar, S., Aikin, K., Aoki, S., Apadula, F., Baier, B., Bergamaschi, P., Beyersdorf, A., Biraud, S. C., Bollenbacher, A., Bowling, D., Brailsford, G., Abshire, J. B., Chen, G., Chen, H., Chmura, L., Sites Climadat., Colomb, A., Conil, S., Cox, A., Cristofanelli, P., Cuevas, E., Curcoll, R., Sloop, C. D., Davis, K., Wekker, S. D., Delmotte, M., DiGangi, J. P., Dlugokencky, E., Ehleringer, J., Elkins, J. W., Emmenegger, L., Fischer, M. L., Forster, G., Frumau, A., Galkowski, M., Gatti, L. V., Gloor, E., Griffis, T., Hammer, S., Haszpra, L., Hatakka, J., Heliasz, M., Hensen, A., Hermanssen, O., Hintsa, E., Holst, J., Jaffe, D., Karion, A., Kawa, S. R., Keeling, R., Keronen, P., Kolari, P., Kominkova, K., Kort, E., Krummel, P., Kubistin, D., Labuschagne, C., Langenfelds, R., Laurent, O., Laurila, T., Lauvaux, T., Law, B., Lee, J., Lehner, I., Leuenberger, M., Levin, I., Levula, J., Lin, J., Lindauer, M., Loh, Z., Lopez, M., Luijkx, I. T., Lund Myhre, C., Machida, T., Mammarella, I., Manca, G., Manning, A., Manning, A., Marek, M. V., Marklund, P., Martin, M. Y., Matsueda, H., McKain, K., Meijer, H., Meinhardt, F., Miles, N., Miller, C. E., Molder, M., Montzka, S., Moore, F., Morgui, J.-A., Morimoto, S., Munger, B., Necki, J., Newman, S., Nichol, S., Niwa, Y., ODoherty, S., Ottosson-Lofvenius, M., Paplawsky, B., Peischl, J., Peltola, O., Pichon, J.-M., Piper, S., Plass-Dolmer, C., Ramonet, M., Reyes-Sanchez, E., Richardson, S., Riris, H., Ryerson, T., Saito, K., Sargent, M., Sasakawa, M., Sawa, Y., Say, D., Scheeren, B., Schmidt, M., Schmidt, A., Schumacher, M., Shepson, P., Shook, M., Stanley, K., Steinbacher, M., Stephens, B., Sweeney, C., Thoning, K., Torn, M., Turnbull, J., Tørseth, K., Bulk, P. V. D., Dinther, D. V., Vermeulen, A., Viner, B., Vitkova, G., Walker, S., Weyrauch, D., Wofsy, S., Worthy, D., Young, D., and Zimnoch, M.: CarbonTracker CT2019B, NOAA Global Monitoring Laboratory [data set], https://doi.org/10.25925/20201008, 2020.
Jin, S., Cardellach, E., and Xie, F.: GNSS Remote Sensing: Theory, Methods and Applications by Shuanggen Jin, Estel Cardellach and Feiqin Xie, Remote Sensing and Digital Image Processing, Vol. 19, Springer, 2014; ISSN: 1567-320, ISBN: 978-94-007-7481-0, Pure Appl. Geophys., 172, 599–600, https://doi.org/10.1007/s00024-014-0968-7, 2013.
Jin, S. G. and Park, P.: Strain accumulation in South Korea inferred from GPS measurements, Earth Planet. Space, 58, 529–534, https://doi.org/10.1186/BF03351950, 2006.
Jin, S. G. and Zhang, T.: Terrestrial water storage anomalies associated with drought in Southwestern USA derived from GPS observations, Surv. Geophys., 37, 1139–1156, https://doi.org/10.1007/s10712-016-9385-z, 2016.
Jin, S. G., Han, L., and Cho, J.: Lower atmospheric anomalies following the 2008 Wenchuan Earthquake observed by GPS measurements, J. Atmos. Sol.-Terr. Phys., 73, 810–814, https://doi.org/10.1016/j.jastp.2011.01.023, 2011.
Jin, S. G., Jin, R., and Kutoglu, H.: Positive and negative ionospheric responses to the March 2015 geomagnetic storm from BDS observations, J. Geodesy, 91, 613–626, https://doi.org/10.1007/s00190-016-0988-4, 2017.
Kursinski, E. R., Hajj, A. G., Hardy, R. K., Schofield, T. J., and Linfield, R.: Observing the Earth's atmosphere with radio occultation measurements using the Global Positioning System, J. Geophys. Res., 102, 23429–23465, https://doi.org/10.1029/97JD01569, 1997.
Lee, S. and Kim, H.: The Dynamical Relationship between Subtropical and Eddy-Driven Jets, J. Atmos. Sci., 60, 1490–1503, 2003.
Li, W., Yuan, Y. B., Chai, Y. J., Liou, Y. A., Ou, J. K., and Zhong, S. M.: Characteristics of the global thermal tropopause derived from multiple radio occultation measurements, Atmos. Res., 185, 142–157, https://doi.org/10.1016/j.atmosres.2016.09.013, 2017.
Meng, L., Liu, J., Tarasick, D. W., Randel, W. J., Steiner, A. K., Wilhelmsen, H., Wang, L., and Haimberger, L.: Continuous rise of the tropopause in the Northern Hemisphere over 1980–2020, Sci. Adv., 7, eabi8065, https://doi.org/10.1126/sciadv.abi8065, 2021.
Mohd Zali, R. and Mandeep, J. S.: The tropopause height analysis in equatorial region through the GPS-RO. E3S Web of Conferences, 76, 04002. https://doi.org/10.1051/e3sconf/20197604002, 2019.
Munchak, L. A. and Pan, L. L.: Separation of the lapse rate and the cold point tropopauses in the tropics and the resulting impact on cloud top-tropopause relationships, J. Geophys Res.-Atmos., 119, 7963–7978, https://doi.org/10.1002/2013jd021189, 2014.
Oscar: https://www.wmo-sat.info/oscar/gapanalyses?mission=9, last access: on 15 August, 2020.
Pilch Kedzierski, R., Matthes, K., and Bumke, K.: New insights into Rossby wave packet properties in the extratropical UTLS using GNSS radio occultations, Atmos. Chem. Phys., 20, 11569–11592, https://doi.org/10.5194/acp-20-11569-2020, 2020.
Pisoft, P., Sacha, P., Polvani, L. M., Añel, J. A., de la Torre, L., Eichinger, R., Foelsche, U., Huszar, P., Jacobi, C., Karlicky, J., Kuchar, A., Miksovsky, J., Zak, M., and Rieder, H. E.: Stratospheric contraction caused by increasing greenhouse gases, Environ. Res. Lett., 16, 064038, https://doi.org/10.1088/1748-9326/abfe2b, 2021.
Santer, B. D., Sausen, R., Wigley, T. M. L., Boyle, J. S., AchutaRao, K., Doutriaux, C., Hansen, J. E., Meehl, G. A., Roeckner, E., Ruedy, R., Schmidt, G., and Taylor, K. E.: Behavior of tropopause height and atmospheric temperature in models, reanalyses, and observations: Decadal changes, J. Geophys. Res., 108, D14002, https://doi.org/10.1029/2002JD002258, 2003.
Santer, B. D., Wigley, T. M. L., Simmons, A. J., Kållberg, P. W., Kelly, G. A., Uppala, S. M., Ammann, C., Boyle, J. S., Brüggemann, W., Doutriaux, C., Fiorino, M., Mears, C., Meehl, G. A., Sausen, R., Taylor, K. E., Washington, W. M., Wehner, M. F., and Wentz, F. J.: Identification of anthropogenic climate change using a second-generation reanalysis, J. Geophys Res.-Atmos., 109, D21104, https://doi.org/10.1029/2004jd005075, 2004.
Sausen, R. and Santer, B. D.: Use of changes in tropopause height to detect human influences on climate, Meteorol. Z., 12, 131–136, https://doi.org/10.1127/0941-2948/2003/0012-0131, 2003.
Scherllin-Pirscher, B., Steiner, A. K., Anthes, R. A., Alexander, M. J., Alexander, S. P., Biondi, R., Birner, T., Kim, J., Randel, W. J., Son, S. W., Tsuda, T., and Zeng, Z.: Tropical Temperature Variability in the UTLS: New Insights from GPS Radio Occultation Observations, J. Clim., 34, 2813–2838, https://doi.org/10.1175/jcli-d-20-0385.1, 2021.
Schmidt, T., Wickert, J., Beyerle, G., and Reigber, C.: Tropical tropopause parameters derived from GPS radio occultation measurements with CHAMP, J. Geophys Res.-Atmos., 109, D13105, https://doi.org/10.1029/2004jd004566, 2004.
Schmidt, T., Wickert, J., Beyerle, G., and Heise, S.: Global tropopause height trends estimated from GPS radio occultation data, Geophys. Res. Lett., 35, L11806, https://doi.org/10.1029/2008gl034012, 2008.
Seidel, D. J. and Randel, W. J.: Variability and trends in the global tropopause estimated from radiosonde data, J. Geophys. Res., 111, D21101, https://doi.org/10.1029/2006jd007363, 2006.
Seidel, D. J. and Randel, W. J.: Recent widening of the tropical belt: Evidence from tropopause observations, J. Geophys. Res., 112, D20113, https://doi.org/10.1029/2007jd008861, 2007.
Seidel, D. J., Fu, Q., Randel, W. J., and Reichler, T. J.: Widening of the tropical belt in a changing climate, Nat. Geosci., 1, 21–24, https://doi.org/10.1038/ngeo.2007.38, 2007.
Shangguan, M., Wang, W., and Jin, S.: Variability of temperature and ozone in the upper troposphere and lower stratosphere from multi-satellite observations and reanalysis data, Atmos. Chem. Phys., 19, 6659–6679, https://doi.org/10.5194/acp-19-6659-2019, 2019.
Son, S. W., Tandon, N. F., and Polvani, L. M.: The fine-scale structure of the global tropopause derived from COSMIC GPS radio occultation measurements, J. Geophys. Res., 116, D20113, https://doi.org/10.1029/2011jd016030, 2011.
Staten, P. W., Lu, J., Grise, K. M., Davis, S. M., and Birner, T.: Re-examining tropical expansion, Nat. Clim.Change, 8, 768–775, https://doi.org/10.1038/s41558-018-0246-2, 2018.
Steiner, A. K., Lackner, B. C., Ladstädter, F., Scherllin-Pirscher, B., Foelsche, U., and Kirchengast, G.: GPS radio occultation for climate monitoring and change detection, Radio Sci., 46, RS0D24, https://doi.org/10.1029/2010rs004614, 2011.
Sun, Y., Liu, C., Tian, Y., Liu, C., Li, W., Zhao, D., Li, F., Qiao, H., Wang, X., Du, Q., Bai, W., Xia, J., Cai, Y., Wang, D., Wu, C., and Meng, X.: The Status and Progress of Fengyun-3e GNOS II Mission for GNSS Remote Sensing, IEEE International Geoscience and Remote Sensing Symposium, 5181–5184, https://doi.org/10.1109/IGARSS.2019.8899319, 2019.
Tegtmeier, S., Anstey, J., Davis, S., Dragani, R., Harada, Y., Ivanciu, I., Pilch Kedzierski, R., Krüger, K., Legras, B., Long, C., Wang, J. S., Wargan, K., and Wright, J. S.: Temperature and tropopause characteristics from reanalyses data in the tropical tropopause layer, Atmos. Chem. Phys., 20, 753–770, https://doi.org/10.5194/acp-20-753-2020, 2020.
Thuburn, J. and Craig, G. C.: GCM tests of theories for the height of the tropopause, J. Atmos. Sci., 54, 869– 882, 1997.
Thuburn, J. and Craig, G. C.: Stratospheric influence on tropopause height: The radiative constraint, J. Atmos. Sci., 57, 17–28, 2000.
Vicente-Serrano, S. M., Beguería, S., and López-Moreno, J. I.: A Multiscalar Drought Index Sensitive to Global Warming: The Standardized Precipitation Evapotranspiration Index, J. Climate, 23, 1696–1718, https://doi.org/10.1175/2009jcli2909.1, 2010 (data available at: https://cran.r-project.org/web/packages/SPEI, last access: 15 June 2021).
Waliser, D. E., Shi, Z., Lanzante, J. R., and Oort, A. H.: The Hadley circulation: assessing NCEP/NCAR reanalysis and sparse in-situ estimates, Clim. Dynam., 15, 719–735, https://doi.org/10.1007/s003820050312, 1999.
Watt-Meyer, O., Frierson, D. M. W., and Fu, Q.: Hemispheric Asymmetry of Tropical Expansion Under CO2 Forcing, Geophys. Res. Lett., 46, 9231–9240, https://doi.org/10.1029/2019gl083695, 2019.
Wickert, J., Galas, R., Beyerle, G., König, R., and Reigber, C.: GPS ground station data for CHAMP radio occultation measurements, Phys. Chem. Earth Pt. A, 26, 503–511, https://doi.org/10.1016/s1464-1895(01)00092-8, 2001a.
Wickert, J., Reigber, C., Beyerle, G., König, R., Marquardt, C., Schmidt, T., Grunwaldt, L., Galas, R., Meehan, T. K., Melbourne, W. G., and Hocke, K.: Atmosphere sounding by GPS radio occultation: First results from CHAMP, Geophys. Res. Lett., 28, 3263–3266, https://doi.org/10.1029/2001gl013117, 2001b.
Wickert, J., Schmidt, T., Beyerle, G., König, R., Reigber, C., and Jakowski, N.: The Radio Occultation Experiment aboard CHAMP: Operational Data Analysis and Validation of Vertical Atmospheric Profiles, J. Meteorol. Soc. Jpn. Ser. II, 82, 381–395, https://doi.org/10.2151/jmsj.2004.381, 2004.
Wickert, J., Michalak, G., Schmidt, T., Beyerle, G., Cheng, C. Z., Healy, S. B., Heise, S., Huang, C. Y., Jakowski, N., Köhler, W., Mayer, C., Offiler, D., Ozawa, E., Pavelyev, A. G., Rothacher, M., Tapley, B., and Köhler, C.: GPS Radio Occultation: Results from CHAMP, GRACE and FORMOSAT-3/COSMIC. Terrestrial, Atmos. Ocean. Sci., 20, 35–50, https://doi.org/10.3319/tao.2007.12.26.01(f3c), 2009.
WMO: Meteorology A Three-Dimensional Science: Second Session of the Commission for Aerology, WMO Bulletin IV (4), WMO, Geneva, 134–138, 1957.
Wu, X. R. and Jin, S. G.: GNSS-Reflectometry: Forest canopies polarization scattering properties and modeling, Adv. Space Res., 54, 863–870, https://doi.org/10.1016/j.asr.2014.02.007, 2014.
Xia, P., Ye, S., Jiang, K., and Chen, D.: Estimation and evaluation of COSMIC radio occultation excess phase using undifferenced measurements, Atmos. Meas. Tech., 10, 1813–1821, https://doi.org/10.5194/amt-10-1813-2017, 2017.
Xian, T., Lu, G., Zhang, H., Wang, Y., Xiong, S., Yi, Q., Yang, J., and Lyu, F.: Implications of GNSS-Inferred Tropopause Altitude Associated with Terrestrial Gamma-ray Flashes, Remote Sens., 13, 1939, https://doi.org/10.3390/rs13101939, 2021.
Zhou, Y. P., Xu, K. M., Sud, Y. C., and Betts, A. K.: Recent trends of the tropical hydrological cycle inferred from Global Precipitation Climatology Project and International Satellite Cloud Climatology Project data, J. Geophys. Res., 116, D09101, https://doi.org/10.1029/2010jd015197, 2011.